Abstract
Although it is well-established that urban green infrastructure is essential to improve the population’s wellbeing, in many developed countries, the availability of green spaces is limited or its distribution around the city is uneven. Some minority groups may have less access or are deprived of access to green spaces when compared with the rest of the population. The availability of public green spaces may also be directly related to the geographical location of the city within Europe. In addition, current planning for urban regeneration and the creation of new high-quality recreational public green spaces sometimes results in projects that reinforce the paradox of green gentrification. The aim of this study was to explore the concept of environmental justice in the distribution of the public green spaces in two contrasting cities, Tartu, Estonia; and Faro, Portugal. Quantitative indicators of public green space were calculated in districts in each city. The accessibility of those spaces was measured using the “walkability” distance and grid methods. The results revealed that there was more availability and accessibility to public green spaces in Tartu than in Faro. However, inequalities were observed in Soviet-era housing block districts in Tartu, where most of the Russian minority live, while Roma communities in Faro were located in districts without access to public green space. The availability of public green spaces varied from 1.22 to 31.44 m2/inhabitant in the districts of Faro, and 1.04 to 164.07 m2/inhabitant in the districts of Tartu. In both cities, 45% of the inhabitants had accessible public green spaces within 500 m of their residence. The development of targeted new green infrastructure could increase access to 88% of the population for the city of Faro and 86% for Tartu, delivering environmental justice without provoking green gentrification. The outcome of this study provides advice to urban planners on how to balance green space distribution within city neighbourhoods.
1. Introduction
Urban green infrastructure (UGI), which includes parks, community gardens, forests, and corridors along waterways, provides important connections between communities and nature [1]. Urban green infrastructure planning aims to develop green space networks in limited spaces in compact cities [2]. These areas provide numerous ecosystem services, and have contributed to increasing physical activity, improvement in mental health, and improved socialisation of the community residents [3]. Urban green infrastructure helps cities increase their resilience to climate change and to improve their attractiveness by offering a cleaner and healthier environment [4].
Environmental justice occurs when green infrastructure is equally distributed, without discrimination, within a city. Cities are complex social-ecological systems, and the decisions and processes responsible for today’s UGI availability have occurred over centuries; for this reason, it is difficult to determine all the factors that affect the quality of urban green infrastructure. For example, along with the environmental justice issues, the location of a city, related to morphological and climatic conditions, such as water availability, proves to be another strong characteristic that affects the availability of urban green spaces. Although it is well-established that the relationship between green infrastructure and the urban environment is essential for improving wellbeing and population health [3], in many developed countries, the availability of green space is limited, or its distribution across the city is uneven.
Some authors [5,6] consider that the availability of green spaces in European cities may be directly related to their geographical location, with higher amount of public green spaces found in Northern and Central European countries than in Mediterranean ones. Furthermore, it is also recognised that the distribution of public green space is related to the location of different social classes [7]. This means that socioeconomically deprived sections of society, such as low-income groups or ethnic minorities, often also have less access or are deprived of access to green spaces, compared to the rest of the population [8].
Low accessibility to UGI in some areas of a city or for some demographic groups is, nowadays, a problem of environmental justice. For this reason, projects have been developed with the aim of rehabilitating degraded neighbourhoods and increasing the amount of green space in order to improve wellbeing and environmental justice. The implementation of those projects has been successful when they are integrated into the existing green infrastructure network and designed according to the needs of the inhabitants. Conversely, paradoxical interventions have resulted in the phenomenon of green gentrification.
Green gentrification has been observed when urban regeneration projects attract investment around new, high-quality public green space, and become an attraction for social classes with higher income and greater purchasing power. The demand for accommodation near these new recreational spaces promotes the renovation of dwellings or the construction of new ones and, therefore, the house process, rental values, and living costs increase. Consequently, the original residents are forced to relocate to cheaper areas of the city, but they lose the benefits of the public green spaces that were provided to improve their wellbeing. Green gentrification is, however, a difficult phenomenon to study since it is only visible in the long term [9].
Estonia is one of the greenest countries in Europe [5], but there are green infrastructure differences between the Soviet-era housing districts and the districts developed both before and after that period (1944–1991). Research into the inequalities of post-Soviet Union has focused on the quality of buildings, but ignored the accessibility of public green spaces. Generally, accessibility to public green spaces is lower in Mediterranean cities compared with North European ones [10,11]. Faro is one of the Portuguese cities with the least green space per inhabitant (8 m2) [9,12]. Thus, there are two pertinent reasons for comparing the accessibility of public green space in Tartu, Estonia; and Faro, Portugal. Both cities are similar in terms of population size (small cities) and have similar social and cultural dynamics, however, they are distinct geographically and morphologically.
This article explores the notion of environmental justice in urban green infrastructure and how to avoid green gentrification. The overall aim of the study was to investigate the accessibility of public green spaces in a Nordic/Baltic and a Mediterranean city, and addressed the following research questions: Are there districts with more and less accessibility in Tartu and Faro? Are the minority groups and time of construction related to the accessibility of the public green spaces? The hypothesis of this study was that “there is no environmental justice in the distribution of the public green spaces in both Tartu and Faro”.
2. Literature Review
2.1. Green Infrastructure and Ecosystem Services
There are different perspectives on the definition of green infrastructure components. One model of green infrastructure is a system of hubs, links, and sites [13]. Hubs are considered to be the anchor of the green infrastructure network, since they provide space for native plants and animal communities, habitat for wildlife and people, and are responsible for the ecological processes that move through the system. They are the most ecologically important large natural areas, the habitat of many species, and are sometimes essential to support particular life stages of several species. Links or corridors are linear elements responsible for connecting hubs to allow the flux of animals and plants. They are essential for preventing the extinction of (many) species [14]. Finally, Ahern [15] consider that the Green Infrastructure concept assumes the same mosaic model used in landscape ecology, which categorises three major landscape elements: patches, corridors, and matrix.
In the end of 19th and early 20th century, the landscape architect Frederick Law Olmsted stated that all urban green areas, independent of their characteristics, should provide people with benefits from nature. For this reason, he considered that parks should be connected to each other and to surrounding residential areas [16]. These two ideas were in the origin of the greenway movement that, by the end of the 20th century, would evolve into the term “green infrastructure” [13]. There are two concepts that formed the origin of this idea: (1) connecting all green spaces for the benefit of citizens, (2) preserving and linking natural areas to counter habitat fragmentation and promote biodiversity. These two concepts are very similar to the ideas developed by Olmsted and implemented in the 1880s in the revolutionary Emerald Necklace in Boston [13].
A commonly used definition describes green infrastructure “as a strategically planned network of high-quality natural and semi-natural areas with other environmental features, which is designed and managed to deliver a wide range of ecosystem services and protect biodiversity in both rural and urban settings” [17].
There are four classes of ecosystem services [18,19]: (1) provisioning services (for example, food, wood, fibre); (2) regulating services (for example, air quality regulation, climate regulation, water regulation); (3) cultural services, and (4) supporting services. Cultural services include all the non-material benefits that people obtain from ecosystems, such as spiritual enrichment, cognitive development, reflection, recreation, and aesthetic experiences, together with other important social benefits, like the improvement of mental health [20], stress reduction, and relaxation [21]. Furthermore, urban green infrastructure can act as a meeting place in a neighbourhood and positively influence the interactions between different communities [22]. Finally, the supporting services include soil formation, photosynthesis, nutrient cycling, and water cycling. These include all the services that are necessary for the production of all other ecosystem services [23].
2.2. Environmental Justice
Although there is agreement on the importance of urban green infrastructure and that this should be based on the three pillars of sustainability—ecology, economy, and society—many studies [24,25] reveal that the societal variables are least respected, or even ignored, in the process of project development. The exclusion of one sustainability variable can results in an unequal distribution of green infrastructure through the city. This uneven distribution is often stratified based on socioeconomic or ethno-racial characteristics, including age, gender, disability, education and wealth of the residents, and has been recognised in the literature as an environmental justice issue [26,27]. A definition of environmental justice is the right of the entire population to be protected against environmental pollution and to live in a clean and healthful environment [28].
Traditionally, the environmental justice movement has focused on pollution issues affecting the health of low-income and minority individuals who lived in close proximity to polluting sites [29,30]. The movement appeared in the beginning of the 1980s in the United States, where low-income ethnic communities, including African-Americans and Hispanics, were living in the most polluted neighbourhoods, compared to the white majority communities who, conversely, were living in neighbourhoods of high environmental quality [31,32,33]. More recently, environmental justice research has focused on the distribution of environmental hazards and amenities, including green spaces, through different social groups [34,35,36,37,38].
Gould and Lewis [28] refer the importance of analysing the full spectrum of distribution, meaning that research should also consider who gets access to the environmental amenities, such as parks, water clean-up, and access to public transport, by studying all social groups, instead of only those that bear the environmental burdens of society, such as toxic waste, hazardous facilities, and poor air quality, which has been the focus up to now.
One of the most common ways to measure inequality among the population is through the Gini index, which is used in economics. However, a single index to measure environmental inequality does not yet exist [39]. Thus, in making cities more resilient, equitable, and sustainable, it is necessary to be aware of environmental justice problems, and to emphasise the questions of access to urban green spaces [24].
2.3. Accessibility to Public Green Spaces
Public urban green space is defined as public parks and other green spaces that are accessible to the general public and managed by the local government [40]. Lindholst et al. [41] define three main characteristics to evaluate the quality of urban green spaces: (1) structure and general aspects, such as size, character, location, and accessibility; (2) functionality and experience, for example, the recreational and social aspects, culture and history, nature and biodiversity, landscape and aesthetics, and environment and climate; and (3) management and organisation, including management, maintenance, and communication and information.
There are inequalities in the distribution of green infrastructure in most cities: the different groups of society have more or less access to green infrastructure, depending on their socioeconomic status (SES). In order to study the inequalities of access to UGI and to provide solutions, it is necessary to measure it. Most research on accessibility has focused primarily on two aspects: (1) distance to green spaces and (2) the area available at that distance, providing threshold values of urban green space per habitant. However, in some cases, accessibility has been estimated using only one of these factors [42]. The European Environment Agency (EEA) recommends that people should live within 15 min walking distance of their place of residence [43], but does not specify the available area of green space per resident. Also, Wolch et al. [35] defined 400 m, a five-minute trip, as the standard distance between a public park and people’s house. In other studies, both aspects have been combined. Coles and Bussey [44] considered that green spaces should be a 5- to 10-min walk from the residence area, and have a minimum area of 2 ha. Van Herzele and Wiedemann [45] suggested a 5-min walk, equivalent to 400 m, to the closest 1–10 ha green space. The UK government agency, English Nature, recommends, in the Accessible Natural Greenspace Standards, that at least 2 ha of accessible natural green space should be provided per 1000 population, with a minimum distance of 300 m from the place of residence [46,47]. Magalhães [48] considers a minimum distance for children and elderly people of 100 m, and also considers 400 m2 as the minimum area for a public green space in Portugal. The World Health Organization [49] assumes a minimum of 9 m2 green space per person, and the ideal minimum area of green space should be 50 m2.
According to Maroko et al. [50], accessibility to public urban green spaces can be measured with the container approach, the walkability distance method, and the Kernel density estimation. The container approach measures the accessibility using a particular geographic unit of aggregation, such as zip code, neighbourhood, or census unit, to determinate the location of a park or recreational facility, instead of using a proximity measure. In this method, the number of parks per areal unit can be estimated for the unit of aggregation used, and related to specific populations characteristics, for example, SES [51,52]. The walkability distance method considers a standard walking distance (5–10 min walk, 400 m or 800 m) to parks as a proxy for access. Nevertheless, in this method, the actual street network was not considered, only Euclidean distance. Meanwhile, the relationship between distance and willingness to walk is a continuous curve without sharp breaks, thus, the Kernel density estimation used by Moore et al. [53] may estimate, more accurately, the accessibility for every point of a study area, because it uses blocks of areas, instead of giving a binary answer of accessible or not in just a few metres of distance.
According to Fan et al. [40], five variables should be included when evaluating access to public urban green spaces: (1) a citizen-based opinion, reflecting the quality of a green space where residents live; (2) multiple functional levels, including a quantitative evaluation of the green space from neighbourhood to city level according to their functional scales; (3) preconditions for users, for example, accessibility and safety; (4) a quality measure that assesses the variety of suitability of green spaces to accommodate different activities; and (5) multiple uses according to the diverse conditions [45]. Meanwhile, Dai [54] argues that a common descriptive approach is based on the availability of green spaces per inhabitant, calculating the rate of the supply vs the demand within a predefined region. However, it is not completely always predictable that people go to the closest green space for various reasons, such as its size, fear of dogs, or fear of crime and racial attacks.
2.4. Gentrification and Green Gentrification
Gentrification is defined by Smith [55] as “the process by which working class residential neighbourhoods are rehabilitated by middle class homebuyers, landlords, and professional developers”; moreover, this process emerged as a sporadic and local anomaly in the housing markets of some large cities. Most recently, Smith [56] assume that this process is currently generalised as an urban approach and a neoliberal urban policy, and gives the example of the working-class quarters in London that, gradually, were replaced by expensive residences. This process of gentrification, once installed completely, changed the original social character and expanded rapidly to other districts with similar characteristics. According to [56], in Western Europe and the United States, there were three historical waves in the gentrification process, beginning in the 1950s as sporadic gentrification in small neighbourhoods; the second wave, during the 1970s and 1980s, related to urban and economic restructuring processes; and the third wave, which emerged in the 1990s, defined as the recessional pause and subsequent expansion.
Gould and Lewis [57] describe green gentrification as the process of displacement or exclusion of the economically most-vulnerable classes of society, which is enabled by the creation or renovation of an environmental amenity [58]. Currently, urban regeneration projects in degraded areas have been promoted as improving the wellbeing of residents and solving environmental injustice problems. However, such environmental improvements in ethnic communities and/or low-income households can create an urban green space paradox, as already noted [35]. The creation of new, high-quality green spaces can increase attractiveness, making these neighbourhood more desirable. By contrast, the cost of housing can rise, and residents may not be able to afford the rent. This results in the exclusion or displacement of the poor neighbourhood’s residents, who were intended to benefit from the ecosystem services provided by the new green space. In turn, the residents may only be able to afford to live in a similar degraded neighbourhood to the one they left, with low access to green infrastructure [59]. Such a phenomenon has been variously termed as ecological gentrification [58], eco-gentrification, green gentrification [57], or environmental gentrification [60].
One of the most famous examples of an intervention in an obsolete infrastructure that resulted in green gentrification is The High Line, in New York, designed by James Corner. The High Line is a linear park constructed on an abandoned elevated railway that was originally designed to facilitate access to factories and other businesses. This project has now become one of the most popular parks in New York City, attracting millions of visitors each year. Nevertheless, what appeared to be a successful project resulted in a case of green gentrification. The older and typically low-income industrial houses were rehabilitated, making them more liveable and attractive. This caused the displacement and exclusion of the residents who were unable to pay the rent on the rehabilitated properties, which led to their being rehoused in other degraded neighbourhoods [35].
Another much earlier example of green gentrification was Prospect Park in Brooklyn, designed by Frederick Law Olmsted and Calvert Vaux. Alongside the park, there was a clear difference between the ethnicities that occupied the richest neighbourhoods and the poorest ones. Over the years, the greening of the richest neighbourhood increased the value of houses and the opposite affected the degraded neighbourhood, so “the richest neighbourhood became richer, the poorest neighbourhood became poorer” [57]. Recently, with the restoration of Prospect Park, the rents of all neighbouring houses increased, resulting in the displacement of the poorest residents of the Prospect Park neighbourhood, and, consequently, in a renewed phenomenon of green gentrification [57].
However, sometimes the study of green gentrification can be hampered because this phenomenon could take a long period of time to appear—as parks take time to mature—and because the green gentrification phenomenon is directly related with the social inequalities, for this it can be difficult to study in cities that avoid to deal with the problem of social justice [61].
To control the effects caused by green gentrification, Curran and Hamilton [26] suggest a “just green enough” strategy, which consists of securing the public health benefits of enhanced access to urban green infrastructure while avoiding the urban green space paradox by promoting small-scale interventions in scattered sites. For example, Wolch et al. [35] promote urban allotments instead, big-scale projects that radically change the dynamics of these communities. Vancouver, British Columbia, and Michigan, USA, have significant and growing urban agriculture movements that adopt urban agriculture as a sustainability fix [62]. Another example is the grassroots movements for urban agriculture that has become popular in Detroit among the declining heavy industry, abandoned buildings, and shrinking population [63]. Another solution to control green gentrification is to involve minorities in the decision-making and planning for green spaces, to include their ethnic and cultural customs and perceptions [64].
2.5. The Socialist City
The socialist city was defined by Demko and Regulska [65] as the one that “No social or occupational group would have better or more favourably located residential sites. Similarly, public services of all kinds, including transportation, should be of equal quality, availability, and accessibility. Such amenities as a high-quality physical environment, including recreational environment, would be equally accessible to all. All such urban conditions would be similarly equitably arranged and available” (p. 290). In short, the socialist city had, as its main principle, an egalitarian society with equitable distribution and accessibility of amenities. However, the spatial patterns of inequality in both under capitalism and socialism periods have distinct interpretations and, for that reason, it is not appropriate to make strong comparisons [66].
The residential districts or microregions found in Soviet-era cities, providing mass-housing with basic consumer services, were known as the mikrorajon, and represented the “basic building block of the Soviet city” [66] (p. 75). These are very common in Estonian cities, for example, in Tartu, the second biggest city of Estonia. Constructed from the late 1950s through to the 1980s, most of the new housing consisted of Soviet-type brick or concrete panel dwellings [67]. In Estonian cities, it is possible to identify a trend in housing occupancy related to the different ethnic groups [68]. In general, Estonians live in single-family houses, while Russians (or Russian speakers—they may also have Belorussian or Ukrainian, etc., origins) occupy the high-density flats built during the Soviet Union (Figure 1). However, Kulu [69] admits that, for example, in late-Soviet Tartu, in spite of the fact that Estonians generally had more living space than non-Estonians, in the case of facilities, the situation was the opposite—non-Estonians had more facilities, even when housing ownership was controlled. These differences were due to the differences in preference for housing between ethnic groups, and also by the Soviet policy for social housing [68]. However, Kährik and Tammaru [70] admit that these neighbourhoods have still a “strong social mix, and do not reveal clear signs of decline” (p. 215).
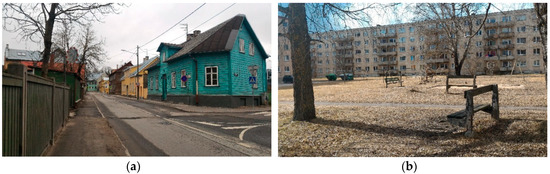
Figure 1.
Single-family houses in the Supilinn district (a) and Soviet-era housing blocks in Annelinn district (b) in Tartu, C. Silva photo—all rights reserved.
2.6. Landscape Urbanism and Smart Growth
In order to deal with the environmental justice issues, new planning and development solutions should be adopted. Amongst the landscape architecture community, it is commonly accepted that the needs and perceptions of the people who use cities must be included in urban design in a co-creation process [71]. New urbanism, landscape urbanism, and smart growth are recent approaches, with a sustainability base that focuses on a human-scaled urban design.
New urbanism is a planning and development model based on the principles of walkability, housing, and shopping being in close proximity, and accessible public spaces. This aims to offer alternatives to the sprawling, single-use, low-density patterns, which have been shown to inflict negative economic, health, and environmental impacts on communities [72]. New urbanism replaces the large-scaled planning based on automobile circulation, and can be applied to diverse scales of development, for example, suburban areas, urban neighbourhoods, dense city centres, or even a single street. The field of the projects include new development, urban infill, and revitalisation or preservation design. From the late 1990s, the phrase “landscape urbanism” started to be used by landscape architects in the United States to refer to the redevelopment concepts for declining post-industrial cities [73]. Landscape urbanism is a mode of urban planning arguing that the best way to organise a city is through the design of its landscape, rather than the design of its buildings [74].
At the same time, the smart growth model is a development approach that encourages a mix of building types and uses, diverse housing and transportation options, development within an existing neighbourhood, and community engagement [75,76]. Smart Growth [77] define ten principles as supportive of the smart growth approach: (1) mixed land uses; (2) compact design; (3) range of housing choices; (4) walkable neighbourhoods; (5) communities with a strong sense of place; (6) preservation of open space, farmland, natural beauty, and critical environmental areas; (7) direct development towards existing communities; (8) providing a variety of transportation choices; (9) making fair and cost-effective development decisions; and (10) encouraging community and stakeholder collaboration in development decisions.
3. Materials and Methods
3.1. Study Area
The data used in this paper were gathered from Tartu City, Estonia; and Faro, Portugal (Figure 2). Estonia is a Northern European country located on the eastern coast of the Baltic Sea. It is a small country of approximately 45,227 km2 in area, and around 1.3 million habitants, and is one of the most forested countries in the Europe Union [37]. During the Soviet period, between 1944 to 1991, the majority of the Estonia’s cities, including Tallinn and Tartu, developed according to the principles of the socialist city, as discussed above. The urban planning and construction system during the Soviet period favoured the development of large homogeneous areas, composed of extensive areas of multi-storey housing blocks [67].
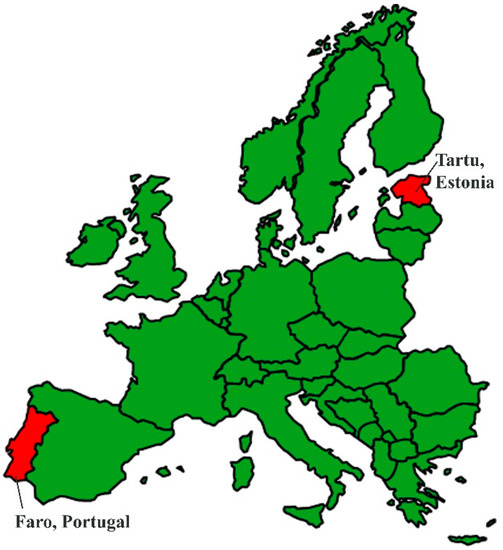
Figure 2.
Location of Tartu, Estonia; and Faro, Portugal.
Tartu is the second biggest city of Estonia, with 38.58 km2 of total area (3858 ha urban area). According to the 2011 census, Tartu city has some 97,600 inhabitants, including 81.7% Estonians, 14.7% Russians, and 3.6% of other national origins, for example Ukrainians, Belarussians, or Finns. For this reason, Tartu is considered a socially mixed city [70]. It is known as a historic university city, while the industrial and military investments during the Soviet Union made it an important migrant destination [78]. Tartu is organised into 17 districts, and has twenty public green spaces with at least one hectare being of high quality. The most popular public green spaces in Tartu are Keskpark, Botaanikaaed (Botanic Garden)—with a wide variety of exotic species, Holmi park, Anne Kanali park (located along the Emajõgi River), and Toomemägi (Figure 3).
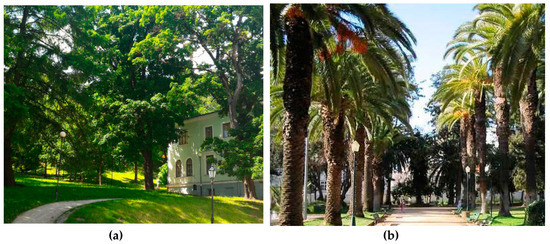
Figure 3.
Toomemägi in Tartu (a) and Alameda garden in Faro (b). Image from field survey by authors.
Faro is a southern Portuguese municipality and the capital of the Algarve region, with around 65,000 habitants (around 47,000 living in the city area). The city is about 711 ha and is bounded by the “Ria Formosa” Natural Park, which offers a picturesque landscape setting to the city. To increase the complexity of the analyses and to allow comparison of Faro with Tartu, eight districts were defined: Old Town; Urban centre; Alto Rodes; São Luís; Bom João and Industrial area; Alto de Santo António; and Penha and Figuras, based on the morphological characteristics of the city, the road network, time of construction, and the sections defined by the National Institute of Statistics. The Roma minority is located mainly in the districts of Penha, Industrial area, Figuras, and the urban periphery.
There are four public green spaces in Faro of at least 1 ha in area. Alameda garden is the oldest public green space of the city (Figure 3), with several facilities, including a playground, a miniature golf course, and senior citizen outdoor fitness equipment. Mata do Liceu is a public park used mainly for the practice of physical exercise. Parque Ribeirinho establishes a visual connection with Ria Formosa and, with about 16 ha, is the biggest and most recent public green space in the city. Parque Lazer is a small and flexible green used mainly for sports practice and to host small events or fairs. Arranged in a minimalistic way with a large (0.85 ha) central open field, the rest of the space is arranged peripherally with places of activity which continue to be developed with the help of some recurring local initiatives [9].
3.2. Indicators of Availability and Accessibility to Urban Green Infrastructure
Following Dai [54], the area of public green spaces (PGS) was measured in each district using a geographic information system (GIS). The availability of PGS per inhabitant of each city district was calculated using data from the 2011 census. The relation, PGS per inhabitant, resulted in two social sustainability indicators that allowed us to compare them to other cities’ values, and to clarify the degree of environmental justice in the distribution of green infrastructure through the city’s districts. In Tartu, it was especially pertinent to compare the area of PGS per inhabitant in districts developed during the Soviet period with the newer ones.
The accessibility of PGS was measured using the walkability distance method, with buffers around the green spaces and within the administrative boundaries of 300 m (4-min walking distance) and 500 m (approximately 7-min walking distance). There are several variations in the literature regarding the minimum distance that a public green space should be from the place of residence [35,45,48]. For that reason, we considered it appropriate to use the two buffer distances and make a comparison of the results.
In order to compare the accessibility results in Tartu and Faro, we included public green spaces with of least 1 ha area, even if similar studies only consider the spaces of more than 2 ha [6]. This was because public green spaces in Mediterranean cities tend to be smaller than the North European ones.
The Estonian Land Board, Green Map System, Tartu Linn open data, and Google Earth were the sources of data to identify the current public green spaces of high quality. The proposal for future public green spaces in Tartu was identified from the “Tartu Linna Üldplaneering”, a general plan covering the period up to 2030. The public green spaces from Faro city were defined using a map provided by the municipal authority. For both cities, the individual and total area of public green spaces was measured using QGIS 2.16.3 (Geographic Information System. Open Source Geospatial Foundation Project).
To relate the population density and accessibility to the public green spaces of Tartu and Faro, we used a method based on that of Kabisch et al. [6]. The walkability distance method maps were developed using a buffer of 300 m and 500 m, and then intersected with a 1 ha grid within the city borders. In each grid unit, the area of public green spaces per inhabitant was calculated. For each district, a different value of population density corresponding to the division between the total number of inhabitants and the total area of each district was used. Using different population densities allowed results to get closer to the reality of each district [53]. Finally, a five-level scale to classify the accessible area for public green spaces, in square metres per inhabitant, using the two different distance buffers, was developed.
In order to analyse the evolution of land use in Tartu city, statistical data, from between 1998 and 2017, was used. This information was important because it allowed us to make a deeper characterisation of the city, and revealed the evolution of the public parks and green areas in the city that can reflect the importance given to this use. In order to evaluate the access to the pubic green spaces based on the ethnic differences of the society, data was collected from the 2011 Estonian census about the number of ethnic nationalities per district of Tartu. In Faro, the 2011 census and our own observations were used to estimate the population of each district and the location of the Roma minority.
4. Results
The PGS per inhabitant was calculated in each district for both cities. Table 1 presents the area of gardens, buildings, trees, and grassland per district of Tartu to characterise the relative relation of green space and urbanised area in each district. There were two main types of buildings in Tartu city that are directly related to the area of yards. For example, the districts of Tammelinn, Ihaste, and Karlova have a higher proportion of yards, and the majority of the buildings in these districts were single-family houses.

Table 1.
Area of land use per district of Tartu, Source: Estonian Land Board.
Table 2 presents the location of ethnic minorities in the city, and compares this with the distribution of public green spaces in the city. The districts with higher numbers of ethnic minorities, mainly Russians, were Jaamamõisa (53% of Estonians, 39% of Russians, and 8% of other nationalities), Annelinn (67% of Estonians, 28% of Russians, and 5% of other nationalities), and Ropka tööstusrajoon (80.1% of Estonians, 16.4% of Russians, and 3.4% of other nationalities). On the other side, the districts with fewer ethnic minorities were Variku, Tähtvere, Tammelinn, and Karlova.
Table 2.
Residents per ethnic nationality in Tartu districts. Source: Census, 2011.
Table 3 presents the number of inhabitants and area of each district of Faro. The number of immigrants has been decreasing over the years. There were 11.2%, in 2010, and 9.9% by 2016. However, there is no available data relating ethnic nationality with place of residence. Despite this, it was possible to identify the Roma minority of Faro as being located in four main neighbourhoods: in Penha, in industrial area, and in the periphery. They live in social housing estate neighbourhoods, or in prefabricated houses and containers, built in areas far from the city centre and with difficult access to services, which seems to reinforce the segregation of the communities [79]. Furthermore, the area of the dwellings was very small, without adequate conditions for people with disabilities or elderly people, and without common or leisure spaces. These neighbourhoods have small entrances, and the composition forms a labyrinth, which makes it appear that the neighbourhood is “closed” to the rest of the city space [80]. There are still other Roma clusters of small dimensions, in Faro, that live in miserable conditions in abandoned old houses or containers.
Table 3.
Area of districts in Faro and population, Source: Census 2011 and own calculations.
Table 4 for Tartu and Table 5 for Faro show the results of availability and accessibility to PGS of at least 1 ha in these cities. In Tartu, Tähtvere was the district with the greatest area of PGS per inhabitant, around 146 m2 per habitant. The districts of Maarjamõisa and Supilinn also had a significant area of PGS per inhabitant, 126 m2/inhabitant and 79 m2/inhabitant, respectively. Conversely, Karlova was the district with the lowest area of PGS per habitant, about 1 m2/inhabitant. Also, the districts of Ihaste, Jaamamõisa, Ropka, Ränilinn, Tammelinn Vaksali, Variku, and Veeriku had less than 10 m2 per inhabitant. In Faro (Table 5), the majority of districts had less than 10 m2 of PGS per inhabitant. The exception was district 8, “Figuras and Urban Periphery”, with about 31 m2/inhabitant.
Table 4.
Availability and accessibility of public green spaces (PGS) in Tartu.
Table 5.
Availability and accessibility of public green spaces (PGS) in Faro.
Figure 4 shows the map of accessibility to PGS from each residence, using the walkability method, for the city of Tartu, which was quantified in Table 4. It can be seen that using the 300 m and 500 m distance, and two different sources of data, 45% of the city residents have access to PGS within a seven-minute walk. Meanwhile, the same percentage (45%) was observed also for the city of Faro in the buffer of 500 m (Figure 5 and Table 5). This result shows that even though the South European city had much less available PGS per inhabitant, the accessibility was the same as in the very green, but more spread out, city of Northern Europe.
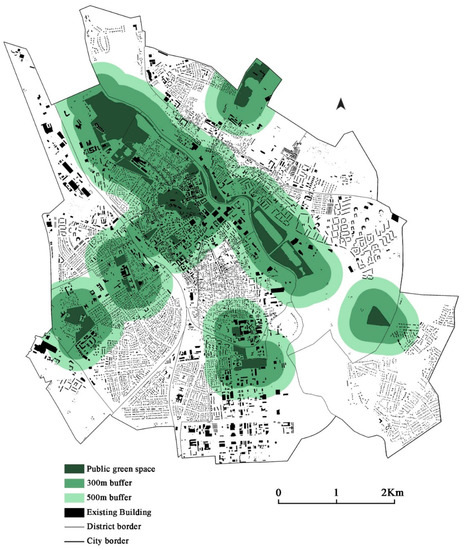
Figure 4.
Accessibility of pubic green spaces (PGS) in Tartu, using the “walkability” distance method (300 and 500 m buffers).
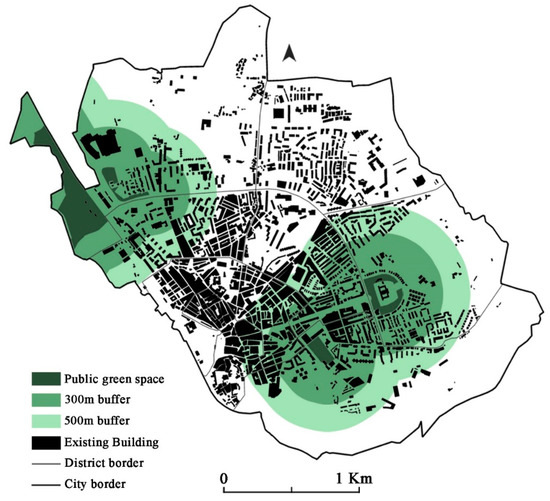
Figure 5.
Accessibility of pubic green spaces (PGS) in Faro, using the “walkability” distance method (300 and 500 m buffer).
According to Table 4, it is possible to see that the districts with greater proportions of accessible area were Supilinn, where the accessible area covers the district’s total area, for both distance buffers; Kesklinn (83%, using 300 m buffer and 96% using 500m buffer); Maarjamõisa (78% and 99%, respectively), and Tähtvere (72% and 93%, respectively). The districts with lower proportions of accessible area to PGS were Jaamamõisa and Variku, without accessible areas in either district; Ränilinn with only 2% considering a 300 m buffer and 16% considering a 500 m buffer; Veeriku with 6% and 16% respectively; and Ihaste with 4% and 11%, respectively. It is important to look at the percentage of each district, rather than the total accessible area of PGS, because it considers the total area of each district.
Figure 5 shows the map of accessibility to PGS from each residence using the walkability method for the city of Faro, which was quantified in Table 5. It was revealed that the districts with higher proportions of accessible public green spaces were district 6 (Alto de Santo António) with 39%, using the 300 m buffer; and 70%, using the 500 m buffer; and district 8 (Figuras) with 35% and 51%, respectively, of the district’s total area. On the other hand, the districts with lower proportions of accessible area were district 1 (Old Town and Historic centre) with only 23% using the 500 m buffer and district 7 (Penha) without any residence accessible within a 7-min walk to the PGS.
According to the grid method using the 300 m and 500 m buffers, the Tartu districts of Annelinn and Karlova had between 101 and 250 m2 of accessible PGS per inhabitant, and the remaining districts had over 251 m2 accessible PGS per inhabitant. Using the same method in Faro, it was revealed that, for the 300 m buffer, the districts 5 and 8 had more than 251 m2 of accessible PGS per inhabitant, the districts 2 and 6 had between 101 and 250 m2 per inhabitant, and the districts 3 and 4 had between 31 and 100 m2 per inhabitant. The Old Town historic centre and Penha districts had no PGS. Considering the area of 500 m buffer, the districts 6 and 8 had more than 251 m2 of accessible PGS, the districts 1, 2, 3, and 6 had between 101 and 250 m2 of accessible PGS per inhabitant, and district 4 had 31–100 m2 per inhabitant of accessible PGS. Penha was the only district without any accessible PGS, even within 500 m walking distance.
5. Discussion and Proposal for New Green Infrastructure
According to the evolution of the land use and occupation, it was confirmed that there was a significant increase in the public parks and green areas of Tartu, between 1998 and 2000. During the following years, since 2000 until 2017, the total area of public parks and green areas ranged between approximately 330 and 400 ha of total area, with their maximum value in 2016. In 2017, the total area of public parks and green areas (389 ha) corresponded to 10% of the city’s total area. The total area of high-quality PGS was 202 ha. Meanwhile, in the present study, we considered only the high-quality PGS with more than 1 ha.
Analysing the data on ethnic minorities, it could be seen that the districts with the highest percent of ethnic minority residents (Annelinn, Jaamamoisa, and Ropka tööstusrajoon, with 28%, 39%, and 16.4% of Russians, respectively) were developed mostly during the Soviet era and, for that reason, the predominant typology of buildings were multi-storeyed panel housing blocks. Nowadays, those housing blocks are of poorer quality compared to the single-family house, as described in the literature review, confirming that the majority of ethnic minorities in Tartu, mainly Russians, live in the districts with a declining quality of life.
The World Health Organization (WHO) recommends that there should exist at least 9 m2 of green space per person, but it recommends 15 m2 of accessible green space while, the ideal amount, according to the same organisation, would be 50 m2 [49]. Also, in Brazil, the index of 15 m2/inhabitant is recommended to promote a good quality of life [81]. The United Nations sustainable development goal 11, regarding sustainable cities, defines, as an indicator, the “adequate open public space in cities”, and has as a target, by 2030, to provide universal access to safe, inclusive, and accessible green and public spaces, in particular, for women and children, older persons, and persons with disabilities [82].
Comparing the UN reference point with the values in the Table 4 for Tartu, it is possible to determine that the districts of Ihaste, Jaamamõisa, Karlova, Ropka, Ränilinn, Tammelinn, Vaksali, and Veeriku had a lower area of PGS per inhabitant than that suggested by the World Health Organization. Compared with the same source, only Maarjamõisa, Supilinn, and Tähtvere had over the ideal value of PGS per habitant. However, in this analysis, it was important to note that most districts with low value also had high areas of private gardens, as shown in Table 1.
In Faro, the majority of districts had less than the amount recommended by the World Health Organization [49], such as Figuras district, which had 31.44m2 per habitant, below the ideal area of 50 m2. According to Barreira et al. [83], some of the reasons for residential satisfaction and city attractiveness were the availability of green areas and opportunities for leisure activities in open-air public space. Green space availability can be related to people’s perceived happiness and general health, while having green space nearby appears to reduce the incidence of heart disease, obesity, and depression [84,85]. Moreover, green infrastructure may enhance city resilience to climate change by means of ecosystem services’ improvement [20], and assist in climate change adaptation, which is one of the factors for future city growth [86]. According to Panagopoulos [87], city climate change adaptation is a major issue in environmental justice for vulnerable urban populations, like the elderly, minorities, and people of low socioeconomic status, while health benefits and resilience to climate change appear to be stronger for vulnerable groups.
Regarding the accessibility to PGS in Tartu, the results revealed that the districts with less accessible areas of PGS were Jaamamõisa, Variku, Ränilinn, Ihaste, and Veeriku. However, it would be expected that Annelinn and Ropka tööstusrajoon would be also included in the districts with less accessibility of PGS since, according to a survey [88], the inhabitants consider them to be districts with a lower quality living environment, as well as Jaamamõisa and Ränilinn. Still, when critically observing the map in Figure 4, it could be verified that, in Annelinn, which shows a high percentage of accessible area of PGS (52% for the 500 m buffer), a significant part of this area included only few dwellings, while the grid method showed that Annelinn, due to its high population density, had less accessible area of PGS per inhabitant.
While Tartu had a greater area of public green spaces, in total, than Faro, the percentage of accessible area to the PGS was similar in both cities (45%). However, when considering the 300 m distance buffer, Tartu had better access to PGS than Faro (30% instead of 25%). Furthermore, the grid method showed that the accessible area per habitant was higher and more uniform in Tartu than in Faro. The greater accessibility in Tartu could be accounted for by the geographic location and cultural differences. As noted in many studies [5,6], there is a tendency for northern European countries to have greater availability of green spaces, due to a favourable climate compared with Mediterranean countries. Nonetheless, the culture also influences the use of public spaces. For example, Thompson [89] notes that, in Mediterranean countries, there was a long tradition of strolling in the street, while, in Nordic countries, the urban park is the main element of public space, and it plays an important role in social relations. The importance and the use given to PGS can influence the availability of those spaces in the city. However, even if in Mediterranean countries the PGS was less widely used than in the Nordic countries, it was still important to note that the presence and associated ecosystem services of such spaces in the city are essential to securing a high level of quality in urban living.
5.1. Tartu Masterplan (Linna Üldplaneering)
Table 6 summarises the results presented in Table 4 and Table 5, and considers the plans for Tartu 2030 and Faro up to 2030. In Tartu, a significant increase in public green space area, around 160 ha, was verified. Consequently, an increase in the accessible area to these spaces is expected. This plan predicts that the total accessible area in Tartu will increase from 30% to 68%, and from 45% to 86%, using a 300 m and 500 m distance buffer, respectively.
Table 6.
Comparison between the current accessibility to the public green spaces (PGS) and after implementing Tartu Masterplan and Faro new green infrastructure proposal.
On the implementation of the Tartu Masterplan by 2030, the districts with a high proportion of accessible area to PGS will be Supilinn, Jaamamõisa, Kesklinn, and Ränilinn, while the districts with a lower proportion will be Tammelinn, Veeriku, and Ropka tööstusrajoon, for both distance buffers.
Nevertheless, the data per district shows that the increase in the PGS and, consequently, in the percentage of accessible area, would result primarily from two transformations in the landscape of the city: (1) an empty area, without any existing function, could be transformed into a PGS of high quality, or (2) an existing PGS of low quality could be transformed into a new one of high quality.
Variku and Ihaste are examples of those planned transformations (Figure 6). In Ihaste, the area of PGS should increase by 46 ha; however, this area represents existing green spaces of low quality and without mobility conditions. In turn, the PGS area of Variku should increase by 10 ha, which would be occupied by a new park in an area that currently does not have any function. According to Tartu Masterplan, this new public space will include a dog walking area and recreational, sports, and cultural facilities.
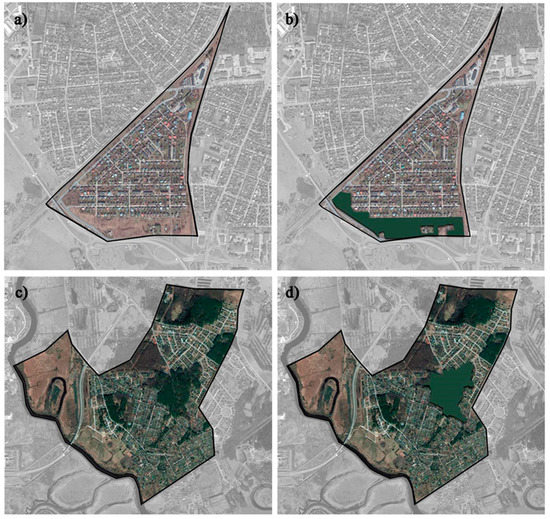
Figure 6.
Proposal for new green infrastructure using the “Tartu Linna Üldplaneering”, a general plan for 2030. (a) Variku before; (b) Variku after; (c) Ihaste before; (d) Ihaste after. (Source: Satellite image from Google Earth).
5.2. Proposal for Faro
The results of the present study revealed that some districts in Faro were without accessibility to PGS, which allows us to confirm that there was an unequal distribution of PGS in this city. This fact justifies the necessity of suggesting some strategies for increasing the amount of PGS and, consequently, promoting the equal distribution of these areas across all Faro’s districts. The following map (Figure 7) identifies the location of the main problem areas in the city, and proposes solutions for those issues.
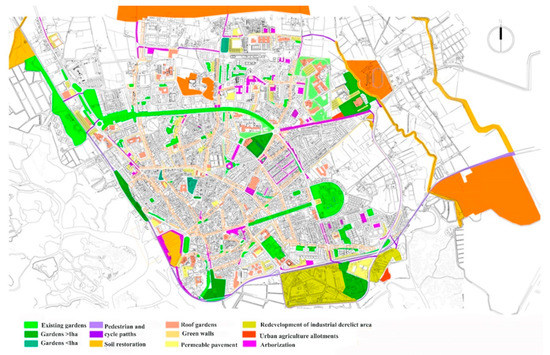
Figure 7.
Proposals for new green infrastructure in Faro.
The most important intervention is the development of an urban park in Penha and the redevelopment of the industrial area, to promote the connection between inhabitants and the Ria Formosa. For the most compact districts—1, 2, and 3—without space to develop new green areas, construction of green roofs and green walls on public buildings, together with the planting of trees along streets, was proposed to promote the connection of existing green areas and the continuity of ecological flows. For disaster risk reduction and climate change adaptation, soil restoration and substitution of the pavement with permeable materials, in stream margins with risk of flash flooding, was proposed.
In the Old Town area, included in district 1, the rehabilitation of private abandoned yards and urban agriculture allotments was proposed, to establish a connection between these areas with the existing PGS enhancing the city resilience [90]. Those abandoned private yards, being located in a historic district and close to the “Ria Formosa”, have a high ecological and recreational potential, especially for the inhabitants of the old city that are mostly elderly. It was also proposed to convert the current railway line to a bike path and green corridor. These proposals must integrate the ideas, expectations, and suggestions of the inhabitants [91] and of the visitors [92], which will be part of future research.
5.3. Green Gentrification
Taking the definition of green gentrification, as discussed earlier in the paper, into account, and comparing the Tartu and Faro cases, in our view, this phenomenon is more likely to occur in Faro than in Tartu, since the need to develop new green spaces is greater in Faro than in Tartu. In addition, Tartu presents, for the most part, a typology of buildings that allows for the presence of private gardens as an alternative to the need for PGS by the residents of these single-family houses.
In Faro, the abandoned industrial area, included in district 5, has been set aside for an urban redevelopment project, as it has direct contact with the Ria Formosa landscape, is close to the city centre and the airport, and forms an extensive area. Municipal plans refer to the implementation of a future project to include a marina and a tourist-residential area with extensive PGS, that will occupy 29 ha. The municipal authority believes that this project will not compromise the operation of the current commercial port and the high environmental qualities that characterise that landscape, meanwhile estimating that this project has a total potential value of 300 million euros for the city [93]. Meanwhile, this highly polluted area, with residents mostly of Roma ethnicity living in state housing, represents a case of social exclusion in the city, with problems of poverty, crime, and lack of security. It is expected that the implementation of a large urban regeneration project in this residential district, inserted in this old industrial area since 1970, will directly affect the life of the residents of the state housing, since they would be forced to be relocated to another part of the city. Thus, this area has a high likelihood of green gentrification.
In the case of the Tartu, it is thought that the neighbourhoods built during the Soviet period are where the phenomenon of eco-gentrification may exist since, as stated in the literature, they present poorer conditions than others [94]. However, the fact that there are a wide variety of areas suitable for the construction of new public green spaces, and because Tartu is considered a fairly balanced city, the likelihood of green gentrification occurring is reduced.
A limitation of this study is the fact that gentrification might be a result, as well as a cause, of green space development. As our data do not allow the assessment of causal relationships over time between gentrification and new green space development, it remains difficult to elaborate further on the situation. It was not possible to evaluate the existence of green gentrification, in part, due to lack of data about the income of households, over time, per district, for both cities. Also, in Faro, although an area with risk of gentrification was identified, it was not possible to develop a method of calculating this phenomenon. For future research, to evaluate the green gentrification phenomenon, we suggested that additional socioeconomic data should be obtained and applied in a Markov Model of Urban Change in time and space, as was done by Royall and Wortmann [95].
6. Conclusions
Urban PGS perform important functions that directly affect the quality of life and wellbeing of urban inhabitants. They are considered key elements in improving the quality of life and creating an appropriate framework for sustainable cities [96]. For this reason, such public spaces should be equitably distributed throughout the city, in order to provide ecosystem services to the entire population. Accessibility and availability of PGS can be valuable indicators of environmental injustice in neighbourhoods within a city, information which may help to promote future urban regeneration projects in areas with the highest needs. The quantitative indicators used to estimate availability and assess urban green infrastructure can be applied widely in comparisons of any city, or of districts within city [97]. Meanwhile, one limitation of the study was the inability to consider the quality of green space, as a result of lack of data.
Based on the analysis of urban growth and indicators related to the distribution of PGS, it was found that, in both cities, there was a relationship to the ethnicity of the inhabitants. Moreover, the study between Tartu and Faro showed that the geographical location within Europe can influence the urban space availability with 6.2 m2/inhabitant in Faro and 20.8 m2/inhabitant in Tartu. Meanwhile, the accessibility to PGS was 45% of residences in both cities, because Tartu is low density and Faro is a compact city.
Tartu ethnic minorities, mainly Russians that live in areas developed during the Soviet period (Jaamamõisa, Ropka tööstusrajoon, and Annelinn), were those who live in districts classified as having lower quality of the living environment [88]. Meanwhile, the walkability distance method revealed that districts Variku, Ränilinn, and Veeriku also had low accessibility while, for Annelinn, all indicators were close to the city average (14 m2/inhabitant, 32% accessibility within 300 m, and 52% within 500 m). From the above, it is concluded that there is a strong relationship between the ethnicity, type of urbanisation, and the quality of the living environment, that includes the availability and accessibility to PGS, but is not confirmed in every district. Despite this, the degree of environmental injustice in Tartu was lower than Faro.
The minorities of Faro, in particular, the Roma communities, were located in districts without (Penha 1.22 m2/inhabitant) or with low access to public green spaces (Bom João 4.76 m2/inhabitant). Furthermore, those neighbourhoods may suffer gentrification processes in the future, due to the implementation of large-scale urban regeneration projects aiming to satisfy the tourist demands of the region. Meanwhile, it was not possible to evaluate the green gentrification phenomenon, because this is a long process, beyond the period of this research, and it was not clear if gentrification might be a result, as well as a cause, of green space development.
In Faro, Figuras, which is the most recently developed district and with inhabitants of higher socioeconomic status, showed greater availability and accessibility to green areas (31.44 m2/inhabitant, 35% accessibility within 300 m, and 51% within 500 m). This district includes both of the new PGS established in Faro in recent decades (Parque Ribeirinho and the Parque de Lazer). In Faro, being one of the Portuguese cities with the least green space per inhabitant, it is an urgent task to focus on planning new green infrastructure, integrating the needs and opinions of residents into proposals, in order to increase the accessibility to PGS and secure environmental justice in the city.
The comparison between Tartu and Faro suggests that the geographical location influenced the availability and quality of green areas in the city, as well as social cohesion itself. In addition, it is expected that the implementation of “Tartu Linna Üldplaneering”, which reflects a scenario for the city’s public green spaces by 2030, will considerably improve the city’s environmental justice. The proposal for new green infrastructure in Faro may decrease the verified environmental injustice.
Accessibility to PGS in cities, and the identification of the most problematic areas, should be integrated into sustainable urban planning proposals. The outcome of this study could provide good advice for balancing green space distribution within city neighbourhoods in similar cities of other countries. In addition, future actions should be conducted with the aim of monitoring the long-term ecosystem services provided by green spaces, and for early identification of green gentrification risks.
Author Contributions
Conceptualization, C.d.S.S. and T.P.; Methodology, C.d.S.S.; Validation, C.d.S.S., T.P. and S.B.; Formal Analysis, C.d.S.S.; Investigation, C.d.S.S. and I.V.; Writing—Original Draft Preparation, C.d.S.S. and T.P.; Writing—Review & Editing, T.P. and S.B.; Supervision, T.P. and S.B.
Funding
This research was funded by the Foundation for Science and Technology grant number PTDC/GES-URB/31928/2017 and co-funded by the Erasmus+ programme of the European Union.
Acknowledgments
This paper was financed by the FCT-Foundation for Science and Technology through project PTDC/GES-URB/31928/2017 “Improving life in a changing urban environment through Biophilic Design”. We also thank Gloria Niin, Janar Racet and Sille Tiitsmaa for providing data.
Conflicts of Interest
The authors declare no conflict of interest. The founding sponsors had no role in the design of the study; in the collection, analyses, or interpretation of data; in the writing of the manuscript, and in the decision to publish the results.
References
- Artmann, M.; Kohler, M.; Meinel, G.; Gan, J.; Ioja, I.C. How smart growth and green infrastructure can mutually support each other—A conceptual framework for compact and green cities. Ecol. Indic. 2017. [Google Scholar] [CrossRef]
- Hansen, R.; Olafsson, A.S.; van der Jagt, A.P.N.; Rall, E.; Pauleit, S. Planning multifunctional green infrastructure for compact cities: What is the state of practice? Ecol. Indic. 2017. [Google Scholar] [CrossRef]
- Zwierzchowska, I.; Hof, A.; Iojă, I.C.; Mueller, C.; Poniży, L.; Breuste, J.; Mizgajski, A. Multi-scale assessment of cultural ecosystem services of parks in Central European cities. Urban For. Urban Green. 2018, 30, 84–97. [Google Scholar] [CrossRef]
- Iojă, I.C.; Osaci-Costache, G.; Breuste, J.; Hossu, C.A.; Grădinaru, S.R.; Onose, D.A.; Nită, M.R.; Skokanová, H. Integrating urban blue and green areas based on historical evidence. Urban For. Urban Green. 2018, 3, 217–225. [Google Scholar] [CrossRef]
- Fuller, R.A.; Gaston, K.J. The scaling of green space coverage in European cities. Boil. Lett. 2009, 5. [Google Scholar] [CrossRef] [PubMed]
- Kabisch, N.; Strohbach, M.; Haase, D.; Kronenberg, J. Urban green space availability in European cities. Ecol. Indic. 2016, 70, 586–596. [Google Scholar] [CrossRef]
- Park, Y.M.; Kwan, M.P. Multi-contextual segregation and environmental justice research: Toward fine-scale spatiotemporal approaches. Int. J. Environ. Res. Public Health 2017, 14, 1205. [Google Scholar] [CrossRef] [PubMed]
- Hoffimann, E.; Barros, H.; Ribeiro, A.I. Socioeconomic inequalities in green space quality and accessibility-evidence from a Southern European City. Int. J. Environ. Res. Public Health 2017, 14, 916. [Google Scholar] [CrossRef] [PubMed]
- Herman, K.; Sbarcea, M.; Panagopoulos, T. Creating green space sustainability through low-budget and upcycling strategies. Sustainability 2018, 10, 1857. [Google Scholar] [CrossRef]
- Terkenli, S.T.; Zivojinovic, I.; Tomićević-Dubljević, J.; Panagopoulos, T.; Straupe, I.; Toskovic, O.; Kristianova, K.; Straigyte, L.; O’Brien, L.; Bell, S. Recreational Use of Urban Green Infrastructure: The Tourist’s Perspective. In The Urban Forest; Pearlmutter, D., Calfapietra, C., Samson, R., O’Brien, L., Krajter Ostoić, S., Sanesi, G., Alonso del Amo, R., Eds.; Springer: Cham, Switzerland, 2017; pp. 191–216. [Google Scholar]
- Madureira, H.; Nunes, F.; Oliveira, J.V.; Cormier, L.; Madureira, T. Urban residents’ beliefs concerning green space benefits in four cities in France and Portugal. Urban For. Urban Green. 2015, 14, 56–64. [Google Scholar] [CrossRef]
- Revez, I. A Cidade de Faro Está ‘Doente’, Asfixiada Pela Falta de Áreas Verdes Para a População. Available online: https://www.publico.pt/2011/11/21/jornal/a-cidade-de-faro-esta-doente-asfixiada-pela-falta-de-areas-verdes-para-a-populacao-23462408 (accessed on 24 January 2018).
- Benedict, M.A.; McMahon, E.T. Green infrastructure: Smart conservation for the 21st century. Renew. Resour. J. 2002, 20, 12–17. [Google Scholar]
- Weber, T.; Wolf, J. Maryland’s green infrastructure—Using landscape assessment tools to identify a regional conservation strategy. Environ. Monit. Assess. 2000, 63, 265–277. [Google Scholar] [CrossRef]
- Ahern, J. Green infrastructure for cities: The spatial dimension. In Cities of the Future: Towards Integrated Sustainable Water and Landscape Management; IWA Publishing: London, UK, 2007. [Google Scholar]
- Little, C.E. Greenways for America; JHU Press: Baltimore, MD, USA, 2007. [Google Scholar]
- European Commission. Building a Green Infrastructure for Europe; European Commission: Luxemburg, 2013. [Google Scholar]
- Berte, E.; Panagopoulos, T. Enhancing city resilience to climate change by means of ecosystem services improvement: A SWOT analysis for the city of Faro, Portugal. Int. J. Urban Sustain. Dev. 2014, 6, 241–253. [Google Scholar] [CrossRef]
- Millennium Ecosystem Assessment. Ecosystems and Human Well-Being: Synthesis; Island Press: Washington, DC, USA, 2005. [Google Scholar]
- Maas, J.; Verheij, R.A.; Groenewegen, P.P.; Vries, S.; Spreeuwenberg, P. Green space, urbanity, and health: How strong is the relation? J. Epidemiol. Community Health 2006, 60, 587–592. [Google Scholar] [CrossRef] [PubMed]
- Panagopoulos, T. Linking forestry, sustainability and aesthetics. Ecol. Econ. 2009, 68, 2485–2489. [Google Scholar] [CrossRef]
- Kabisch, N.; Haase, D. Green spaces of European cities revisited for 1990–2006. Landsc. Urban Plan. 2013, 110, 113–122. [Google Scholar] [CrossRef]
- Costanza, R.; d’Arge, R.; de Groot, R.; Farber, S.; Grasso, M.; Hannon, B.; Limburg, K.; Naeem, S.; ONeil, R.V.; Paruelo, J.; et al. The value of the world’s ecosystem services and natural capital. Nature 1997, 387, 253–260. [Google Scholar] [CrossRef]
- Kabisch, N.; Haase, D. Green justice or just green? Provision of urban green spaces in Berlin, Germany. Landsc. Urban Plan. 2014, 122, 129–139. [Google Scholar] [CrossRef]
- Quastel, N. Political ecologies of gentrification. Urban Geogr. 2009, 30, 694–725. [Google Scholar] [CrossRef]
- Curran, W.; Hamilton, T. Just green enough: Contesting environmental gentrification in Greenpoint, Brooklyn. Local Environ. 2012, 17, 1027–1042. [Google Scholar] [CrossRef]
- Byrne, J.; Wolch, J.; Zhang, J. Planning for environmental justice in an urban national park. J. Environ. Plan. Manag. 2009, 52, 365–392. [Google Scholar] [CrossRef]
- Gould, K.A.; Lewis, T.L. Green Gentrification. Urban Sustainability and the Struggle for Environmental Justice; Routledge: New York, NY, USA, 2017. [Google Scholar]
- Taylor, W.C.; Poston, C.; Jones, L.; Kraft, M.K. Environmental justice: Obesity, physical activity, and healthy eating. J. Phys. Act. Health 2006, 3, 30–54. [Google Scholar] [CrossRef] [PubMed]
- Downey, L.; Hawkins, B. Race, income, and environmental inequality in the United States. Sociol. Perspect. 2008, 51, 759–781. [Google Scholar] [CrossRef] [PubMed]
- Rigolon, A. Parks and young people: An environmental justice study of park proximity, acreage, and quality in Denver, Colorado. Landsc. Urban Plan. 2017, 165, 73–83. [Google Scholar] [CrossRef]
- Laurent, E. Environmental Justice and Environmental Inequalities: A European Perspective. Available online: http://inis.iaea.org/Search/search.aspx?orig_q=RN:47006484 (accessed on 12 May 2018).
- Schlosberg, D. Reconceiving environmental justice: Global movements and political theories. Environ. Politics 2004, 13, 517–540. [Google Scholar] [CrossRef]
- Shen, Y.; Sun, F.; Che, Y. Public green spaces and human wellbeing: Mapping the spatial inequity and mismatching status of public green space in the Central City of Shanghai. Urban For. Urban Green. 2017, 27, 59–68. [Google Scholar] [CrossRef]
- Wolch, J.; Byrneb, J.; Newell, J.P. Urban green space, public health, and environmental justice: The challenge of making cities ‘just green enough’. Landsc. Urban Plan. 2014, 125, 234–244. [Google Scholar] [CrossRef]
- Wüstemann, H.; Kalisch, D.; Kolbe, J. Access to urban green space and environmental inequalities in Germany. Landsc. Urban Plan. 2017, 164, 124–131. [Google Scholar] [CrossRef]
- Raudsepp, M.; Heidmets, M.; Kruusvall, J. Environmental Justice and Sustainability in Post-Soviet Estonia. In Environmental Justice and Sustainability in the Former Soviet Union; Agyeman, J., Ogneva-Himmelberger, Y., Eds.; The MIT Press: London, UK, 2009. [Google Scholar]
- Steger, T. Making the Case of Environmental Justice in Central & Eastern Europe; Center for Environmental Policy and Law: Budapest, Hungary, 2007. [Google Scholar]
- Boyce, J.K.; Zwickl, K.; Ash, M. Measuring environmental inequality. Ecol. Econ. 2016, 124, 114–123. [Google Scholar] [CrossRef]
- Fan, P.; Xu, L.; Yue, W.; Chen, J. Accessibility of public urban green space in an urban periphery: The case of Shanghai. Landsc. Urban Plan. 2017, 165, 177–192. [Google Scholar] [CrossRef]
- Lindholst, A.C.; Konijnendijk, C.C.; Kjøller, C.P.; Sullivan, S.; Kristoffersson, A.; Fors, H.; Nilsson, K. Urban green space qualities reframed toward a public value management paradigm: The case of the Nordic Green Space Award. Urban For. Urban Green. 2016, 17, 166–176. [Google Scholar] [CrossRef]
- Rojas, C.; Páez, A.; Barbosa, O.; Carrasco, J. Accessibility to urban green spaces in Chilean cities using adaptive thresholds. J. Transp. Geogr. 2016, 57, 227–240. [Google Scholar] [CrossRef]
- Chiesura, A. The role of urban parks for the sustainable city. Landsc. Urban Plan. 2004, 68, 129–138. [Google Scholar] [CrossRef]
- Coles, R.W.; Bussey, S.C. Urban forest landscapes in the UK—Progressing the social agenda. Landsc. Urban Plan. 2000, 52, 181–188. [Google Scholar] [CrossRef]
- Van Herzele, A.; Wiedemann, T. A monitoring tool for the provision of accessible and attractive urban green spaces. Landsc. Urban Plan. 2003, 63, 109–126. [Google Scholar] [CrossRef]
- Comber, A.; Brunsdon, C.; Green, E. Using a GIS-based network analysis to determine urban greenspace accessibility for different ethnic and religious groups. Landsc. Urban Plan. 2008, 86, 103–114. [Google Scholar] [CrossRef]
- Handley, J.; Pauleit, S.; Slinn, P.; Barber, A.; Baker, M.; Jones, C. Accessible Natural Green Space Standards in Towns and Cities: A Review and Toolkit for Their Implementation; English Nature: Peterborough, UK, 2003. [Google Scholar]
- Magalhães, M.R. Espaços Verdes Urbanos; Direcção-Geral do Ordenamento do Território: Lisbon, Portugal, 1992. [Google Scholar]
- World Health Organization. Urban Planning, Environment and Health: From Evidence to Policy Action. Available online: http://www.euro.who.int/__data/assets/pdf_file/0004/114448/E93987.pdf?ua=1 (accessed on 22 April 2018).
- Maroko, A.R.; Maantay, J.A.; Sohler, N.L.; Grady, K.L.; Arno, P.S. The complexities of measuring access to parks and physical activity sites in New York City: A quantitative and qualitative approach. Int. J. Health Geogr. 2009, 8, 34. [Google Scholar] [CrossRef] [PubMed]
- Talen, E.; Anselin, L. Assessing spatial equity: An evaluation of measures of accessibility to public playgrounds. Environ. Plan. A 1998, 30, 595–613. [Google Scholar] [CrossRef]
- Timperio, A.; Ball, K.; Salmon, J.; Roberts, R.; Crawford, D. Is availability of public open space equitable across areas? Health Place 2007, 13, 335–340. [Google Scholar] [CrossRef] [PubMed]
- Moore, L.V.; Diez Roux, A.V.; Evenson, K.R.; McGinn, A.P.; Brines, S.J. Availability of recreational resources in minority and low socioeconomic status areas. Am. J. Prev. Med. 2008, 34, 16–22. [Google Scholar] [CrossRef] [PubMed]
- Dai, D. Racial/ethnic and socioeconomic disparities in urban green space accessibility: Where to intervene? Landsc. Urban Plan. 2011, 102, 234–244. [Google Scholar] [CrossRef]
- Smith, N. Gentrification and uneven development. Econ. Geogr. 1982, 58, 139–155. [Google Scholar] [CrossRef]
- Smith, N. New globalism, new urbanism: Gentrification as global urban strategy. Antipode 2002, 34, 427–450. [Google Scholar] [CrossRef]
- Gould, K.; Lewis, T. The Environmental Injustice of Green Gentrification: The Case of Brooklyn’s Prospect Park. In The World in Brooklyn: Gentrification, Immigration, and Ethnic Politics in a Global City; DeSena, J., Shortell, T., Eds.; Lexington Books: Lanham, MD, USA, 2012; pp. 113–146. [Google Scholar]
- Dooling, S. Ecological gentrification: A research agenda exploring justice in the city. Int. J. Urban Reg. Res. 2009, 33, 621–639. [Google Scholar] [CrossRef]
- Bentley, R.; Baker, E.; Mason, K. Cumulative exposure to poor housing affordability and its association with mental health in men and women. J. Epidemiol. Community Health 2012, 66, 761–766. [Google Scholar] [CrossRef] [PubMed]
- Checker, M. Wiped out by the ‘greenwave’: Environmental gentrification and the paradoxical politics of urban sustainability. City Soc. 2011, 23, 210–229. [Google Scholar] [CrossRef]
- O’Brien, L.; De Vreese, R.; Atmis, E.; Olafsson, A.S.; Sievänen, T.; Brennan, M.; Sánchez, S.; Panagopoulos, T.; de Vries, S.; Kern, M.; et al. Social and Environmental Justice: Diversity in Access to and Benefits from Urban Green Infrastructure—Examples from Europe. In The Urban Forest; Pearlmutter, D., Calfapietra, C., Samson, R., O’Brien, L., Krajter Ostoić, S., Sanesi, G., Alonso del Amo, R., Eds.; Springer: Cham, Switzerland, 2017; pp. 153–190. [Google Scholar]
- Walker, S. Urban agriculture and the sustainability fix in Vancouver and Detroit. Urban Geogr. 2016, 37, 163–182. [Google Scholar] [CrossRef]
- Colasanti, K.J.A.; Hamm, M.W.; Litjens, C.M. The city as an ‘agricultural powerhouse’? Perspectives on expanding urban agriculture from Detroit, Michigan. Urban Geogr. 2012, 33, 348–369. [Google Scholar] [CrossRef]
- Kloek, M.E.; Buijs, A.E.; Boersema, J.J.; Schouten, M.G.C. ‘Nature lovers’, ‘Social animals’, ‘Quiet seekers’ and ‘Activity lovers’: Participation of young adult immigrants and non-immigrants in outdoor recreation in the Netherlands. J. Outdoor Recreat. Tour. 2015, 12, 47–58. [Google Scholar] [CrossRef]
- Demko, G.J.; Regulska, J. Socialism and Its Impact on Urban Processes and the City. Urban Geogr. 1987, 8, 289–292. [Google Scholar] [CrossRef]
- Smith, D.M. The Socialist City. In Cities after Socialism; Andrusz, G., Harloe, M., Szelenyi, I., Eds.; Wiley-Blackwell: Oxford, UK, 1996. [Google Scholar]
- Andrusz, G.; Harloe, M.; Szelenyi, I. Cities After Socialism: Urban and Regional Change and Conflict in Post-Socialist Societies; Blackwell: Oxford, UK, 1996. [Google Scholar]
- Vetik, R.; Helemäe, J. The Russian Second Generation in Tallinn and Kohtla-Järve: The TIES Study in Estonia; Amsterdam University Press: Amsterdam, The Netherlands, 2011. [Google Scholar]
- Kulu, H. Housing differences in the late Soviet city: The case of Tartu, Estonia. Int. J. Urban Reg. Res. 2003, 27, 897–911. [Google Scholar] [CrossRef]
- Kährik, A.; Tammaru, T. Soviet prefabricated panel housing estates: Areas of continued social mix or decline? The case of Tallinn. Hous. Stud. 2010, 25, 201–219. [Google Scholar] [CrossRef]
- Gehl, J. Cities for People; Island Press: Copenhagen, Denmark, 2010. [Google Scholar]
- Congress for the New Urbanism. What is New Urbanism? Available online: https://www.cnu.org/resources/what-new-urbanism (accessed on 15 May 2017).
- Steiner, F.R. Landscape ecological urbanism: Origins and trajectories. Landsc. Urban Plan. 2011, 100, 333–337. [Google Scholar] [CrossRef]
- Thompson, I. Ten tenets and six questions for landscape urbanism. Landsc. Res. 2012, 37, 7–26. [Google Scholar] [CrossRef]
- Sousa Silva, C.; Lackóová, L.; Panagopoulos, T. Applying sustainability techniques in eco-industrial parks. WIT Trans. Ecol. Environ. 2017, 210, 135–145. [Google Scholar] [CrossRef]
- Karanikola, P.; Panagopoulos, T.; Tampakis, S.; Tsantopoulos, G. Cycling as a smart and green mode of transport in small touristic cities. Sustainability 2018, 10, 268. [Google Scholar] [CrossRef]
- Smart Growth Network. Available online: http://smartgrowth.org/what-is-smart-growth/ (accessed on 8 June 2018).
- Hess, D.B.; Tammaru, T.; Leetmaa, K. Ethnic differences in housing in post-Soviet Tartu, Estonia. Cities 2012, 29, 327–333. [Google Scholar] [CrossRef]
- Santos, S.R.; Marques, J.F. O Rendimento Social de Inserção e os beneficiários ciganos: O caso do concelho de Faro. Sociologia 2014, 4, 37–56. [Google Scholar]
- Santos, S.A. Tenho a Noite e o Dia e Não Tenho Nada: O Rendimento Social de Inserção e os Beneficiários Ciganos: O Caso Do Concelho de Faro. Available online: https://sapientia.ualg.pt/handle/10400.1/35312013 (accessed on 13 May 2018).
- Harder, I.C.F.; Ribeiro, R.C.S.; Tavares, A.R. Green area and vegetation cover indexes for commons in the city of Vinhedo, SP. Arvore 2006, 30, 277–282. [Google Scholar] [CrossRef]
- United Nations. Available online: http://www.undp.org/content/undp/en/home/sustainable-development-goals/goal-11-sustainable-cities-and-communities/targets.html (accessed on 13 March 2018).
- Barreira, AP.; Nunes, L.C.; Guimaraes, M.H.; Panagopoulos, T. Satisfied but thinking about leaving: The reasons behind residential satisfaction and residential attractiveness in shrinking Portuguese cities. Int. J. Urban Sci. 2018. [Google Scholar] [CrossRef]
- Saw, L.E.; Lim, F.K.S.; Carrasco, L.R. The relationship between natural park usage and happiness does not hold in a tropical city-state. PLoS ONE 2015, 10, e0133781. [Google Scholar] [CrossRef] [PubMed]
- Hillsdon, M.; Panter, J.; Foster, C.; Jones, A. The Relationship between access and quality of urban green space with population physical activity. Public Health 2006, 120, 1127–1132. [Google Scholar] [CrossRef] [PubMed]
- Barreira, A.P.; Ramalho, J.J.S.; Panagopoulos, T.; Guimarães, M.E. Factors driving the population growth and decline of Portuguese cities. Growth Chang. 2017, 48, 853–868. [Google Scholar] [CrossRef]
- Panagopoulos, T. Urban adaptation to climate change: The role of the Landscape Architecture. In Natural and Man-Made Hazard Impact on Urban Areas; Dan, M.B., Anghelache, M.A., Eds.; Editura Universitară Ion Mincu: Bucurest, Romania, 2017; pp. 13–17. [Google Scholar]
- Küsitlusuuring Tartu Ja Tartlased 2013. Available online: https://www.tartu.ee/et/uurimused/kusitlusuuring-tartu-ja-tartlased-2013 (accessed on 17 January 2018).
- Thompson, C.W. Urban open space in the 21st century. Landsc. Urban Plan. 2002, 60, 59–72. [Google Scholar] [CrossRef]
- Panagopoulos, T.; Jankovska, I.; Dan, M.B. Urban Green Infrastructure: The Role of Urban Agriculture in City Resilience. Urban. Arhit. Constr. 2018, 9, 55–70. [Google Scholar]
- Karanikola, P.; Panagopoulos, T.; Tampakis, S.; Karipidou-Kanari, A. A perceptual study of users’ expectations of urban green infrastructure in Kalamaria, municipality of Greece. Manag. Environ. Qual. Int. J. 2016, 27, 568–584. [Google Scholar] [CrossRef]
- Karanikola, P.; Panagopoulos, T.; Tampakis, S. Weekend visitors’ views and perceptions at an urban national forest park of Cyprus during summertime. J. Outdoor Recreat. Tour. 2017, 17, 112–121. [Google Scholar] [CrossRef]
- Claro, R. Marina Na Zona da Horta da Areia Pode Garantir Requalificação. Available online: http://www.postal.pt/2016/04/marina-na-zona-da-horta-da-areia-pode-garantir-requalificacao/ (accessed on 8 December 2017).
- Kährik, A. Housing privatisation in the transformation of the housing system—The case of Tartu, Estonia. Nor. J. Geogr. 2000, 54, 2–11. [Google Scholar] [CrossRef]
- Royall, E.; Wortmann, T. Finding the State Space of Urban Regeneration: Modeling Gentrification as a Probabilistic Process using k-Means Clustering and Markov Models. In Proceedings of the 2015 14th International Conference on Computers in Urban Planning and Urban Management (CUPUM), Cambridge, MA, USA, 7–10 July 2015; p. 275. [Google Scholar]
- Panagopoulos, T.; González Duque, J.A.; Bostenaru Dan, M. Urban planning with respect to environmental quality and human well-being. Environ. Pollut. 2016, 208, 137–144. [Google Scholar] [CrossRef] [PubMed]
- Badiu, D.L.; Ioja, C.I.; Patroescu, M.; Breuste, J.; Artmann, M.; Nita, M.; Gradinaru, S.; Hossu, C.; Onose, D.A. Is urban green space per capita a valuable target to achieve cities’ sustainability goals? Romania as a case study. Ecol. Indic. 2016, 70, 53–66. [Google Scholar] [CrossRef]


© 2018 by the authors. Licensee MDPI, Basel, Switzerland. This article is an open access article distributed under the terms and conditions of the Creative Commons Attribution (CC BY) license (http://creativecommons.org/licenses/by/4.0/).