Article

Assessing the Extent of Historical, Current, and Future Land Use Systems in Uganda

1
Department of Geography, Geo-Informatics and Climatic Sciences, Makerere University P.O. Box 7062, Kampala 256, Uganda
2
Department of Geography and Social Studies, Kyambogo University P.O. Box 1, Kyambogo 256, Uganda
3
Department of Agricultural and Biosystems Engineering, Makerere University P.O. Box 7062, Kampala 256, Uganda
4
International Union for Conservation of Nature–Uganda P.O. Box 10950, Kampala 256, Uganda
5
National Forestry Authority, Ministry of Water and Environment P.O. Box 70863, Kampala 256, Uganda
6
Makerere Institute of Social Research, Makerere P.O. Box 7062, Kampala 256, Uganda
*
Author to whom correspondence should be addressed.
Land 2018, 7(4), 132; https://doi.org/10.3390/land7040132
Submission received: 25 September 2018 / Revised: 25 October 2018 / Accepted: 27 October 2018 / Published: 8 November 2018

Abstract

:
Sustainable land use systems planning and management requires a wider understanding of the spatial extent and detailed human-ecosystem interactions astride any landscape. This study assessed the extent of historical, current, and future land use systems in Uganda. The specific objectives were to (i) characterize and assess the extent of historical and current land use systems, and (ii) project future land use systems. The land use systems were defined and classified using spatially explicit land use/cover layers for the years 1990 and 2015, while the future prediction (for the year 2040) was determined using land use systems datasets for both years through a Markov chain model. This study reveals a total of 29 classes of land use systems that can be broadly categorized as follows: three of the land use systems are agricultural, five are under bushland, four under forest, five under grasslands, two under impediments, three under wetlands, five under woodland, one under open water and urban settlement respectively. The highest gains in the land amongst the land use systems were experienced in subsistence agricultural land and grasslands protected, while the highest losses were seen in grasslands unprotected and woodland/forest with low livestock densities. By 2040, subsistence agricultural land is likely to increase by about 1% while tropical high forest with livestock activities is expected to decrease by 0.2%, and woodland/forest unprotected by 0.07%. High demand for agricultural and settlement land are mainly responsible for land use systems patchiness. This study envisages more land degradation and disasters such as landslides, floods, droughts, and so forth to occur in the country, causing more deaths and loss of property, if the rate at which land use systems are expanding is not closely monitored and regulated in the near future.

1. Introduction

Human activities, especially the conversion and degradation of habitats, are causing global biodiversity declines [1]. The notable activities include the cutting down of trees, charcoal burning and poor farming methods, among others, which undermine the functionality of ecosystems [2]. The rapid conversion of natural vegetation, for example, to farmlands, could be attributed to farming techniques and agronomic approaches that aim at modern agricultural intensification [3]. For instance, in the Equateur province of the Democratic Republic of Congo, the agricultural expansion through shifting cultivation is the main proximate cause of deforestation [4]. In the northern portion of the Brazilian Atlantic Forest, generally 76% of the households use fuelwood regularly and consume on average 686 kg/person/year of tree biomass; poorer people, however, consume 961 kg/person/year [5,6].
Anthropogenic land use activities (such as management of croplands, forests, grasslands, and wetlands) and changes in land use/cover (such as conversion of forest lands and grasslands to cropland and pasture, afforestation), cause changes superimposed on natural fluxes [7]. Tower, ground-based, and satellite observations indicate that tropical deforestation results in warmer, drier conditions at the local scale [8]. These conditions lower agricultural productivity, with reduced soil moisture content and pasture, and lead to human migration, resource conflicts, and loss of biodiversity, among others [9,10,11,12]. In the Kenyan Eastern Mau Forest Reserve, forest-to-cropland conversions are undermining the ecosystem’s capacity for carbon sequestration [13]. In the Ngerengere River in Tanzania, changing land use affects surface runoff and increases floods in the mountainous areas [14].
Geographical information systems and remote sensing (GIS and RS) techniques can be used to explore the temporal and spatial characteristics of land use/cover changes [15]. For example, in Uganda, GIS and RS were applied to assess the impacts of land use/cover change on terrestrial carbon stocks [16]. The information about land use is often stored in geospatial databases, typically acquired and maintained by national mapping agencies. Such databases consist of objects represented by polygons that are assigned class labels indicating the objects’ land use [17]. Therefore, land use/cover information can be directly interpreted from appropriate remote sensing images [18].
Presently, the diversity of conversions of natural ecosystems to land use systems is a critical challenge in Uganda. This is driven by the need to meet the livelihoods of smallholders, high demand for forest products, urban expansions, and infrastructural developments (such as the construction of highways, hydropower dams, and industrial parks, among others). As a result, the country has witnessed massive losses of natural vegetation and intensification of human activities. This condition is worsened by the overexploitation of resources, use of unsustainable harvesting and agronomic practices, and changes in climate. Some of the threatened ecosystems include Mt Elgon in Eastern Uganda, the Mabira Central Forest Reserve, the Lubigi wetland system, and Lake Victoria, among others [19,20,21,22]. As a result, the country is faced with a number of environmental problems such as frequent occurrences of landslides and floods that cause deaths and loss of property, loss of biodiversity, low agricultural output, and reduced forest and wetland goods and services, among others [23,24,25]. This study takes note of a number of studies that have been conducted in the country to quantify changes in land use/cover [26,27,28]. However, there is no study that has redefined and reclassified land use systems and estimated their future scenario at a country level using a Markov chain model [29]. With high population increase causing increased demand for arable and settlement land, fragile ecosystem goods and services are under enormous pressure to meet the needs of the people. This case is evident with a number of fragmented patches of arable land across the country. Therefore, with this patchiness of the landscape, reclassifying land use systems is pertinent for land cover conservation and land use systems management.
The overarching aim of this paper was to critically assess the extent of historical, current, and future land use systems in Uganda. The specific objectives of this study were to (i) characterize and assess the extent of historical and current land use systems, and (ii) project future land use systems. This study identifies areas where conservation is needed because of increasing human activities. This information is also conceptualized within the framework of Uganda Vision 2040 and Second National Development Plan that calls for the protection of fragile ecosystems which support the economy, for example, through tourism, and attainment of sustainable development goals.

2. Materials and Methods

2.1. Study Area

Uganda, a former British colony, is located along the equator in East Africa. The landlocked country occupies about 241,550.7 km2, of which 41,027.4 km2 is open water and swamps while 200,523.5 km2 is land (Figure 1). Uganda is bordered by Kenya in the East, Tanzania and Rwanda in the south, the Democratic Republic of Congo in the west, and South Sudan in the North. The country is highly engaged in agriculture as the main source of livelihood. Cropland is the largest land cover, followed by grasslands, open water, forests, bushlands, wetlands, and built-up area [30]. The land use/cover utilization types are highly influenced by the amounts of rainfall received. Uganda’s climate is considerably modified by elevation above sea level, local water bodies, and local relief. The country experiences both bimodal and unimodal rainfall patterns. Rainfall is evenly distributed throughout the country, except in the northeastern corner. Much of the country receives between 1000–1500 mm of rain per annum, increasing with altitude, but this is variable. In most areas of Uganda, there are wetter and drier seasons. The Central, Western, and Eastern regions have two rainy seasons, from March to May for the first rains, and the second rains from September to November. The Northern region receives one rainy season from April to October, and the period from November to March has minimal rain. Most of the areas in the country receive between 750 mm and 2100 mm of rain annually. The reliability of rainfall generally declines northwards. Amidst the changes being experienced in climate, Uganda’s population has also continued to grow rapidly from 9.5 million in 1969 to 34.6 million in 2014 [30]. However, rapid population growth and environmental degradation pose a growing challenge to the continued productivity of the land resources.

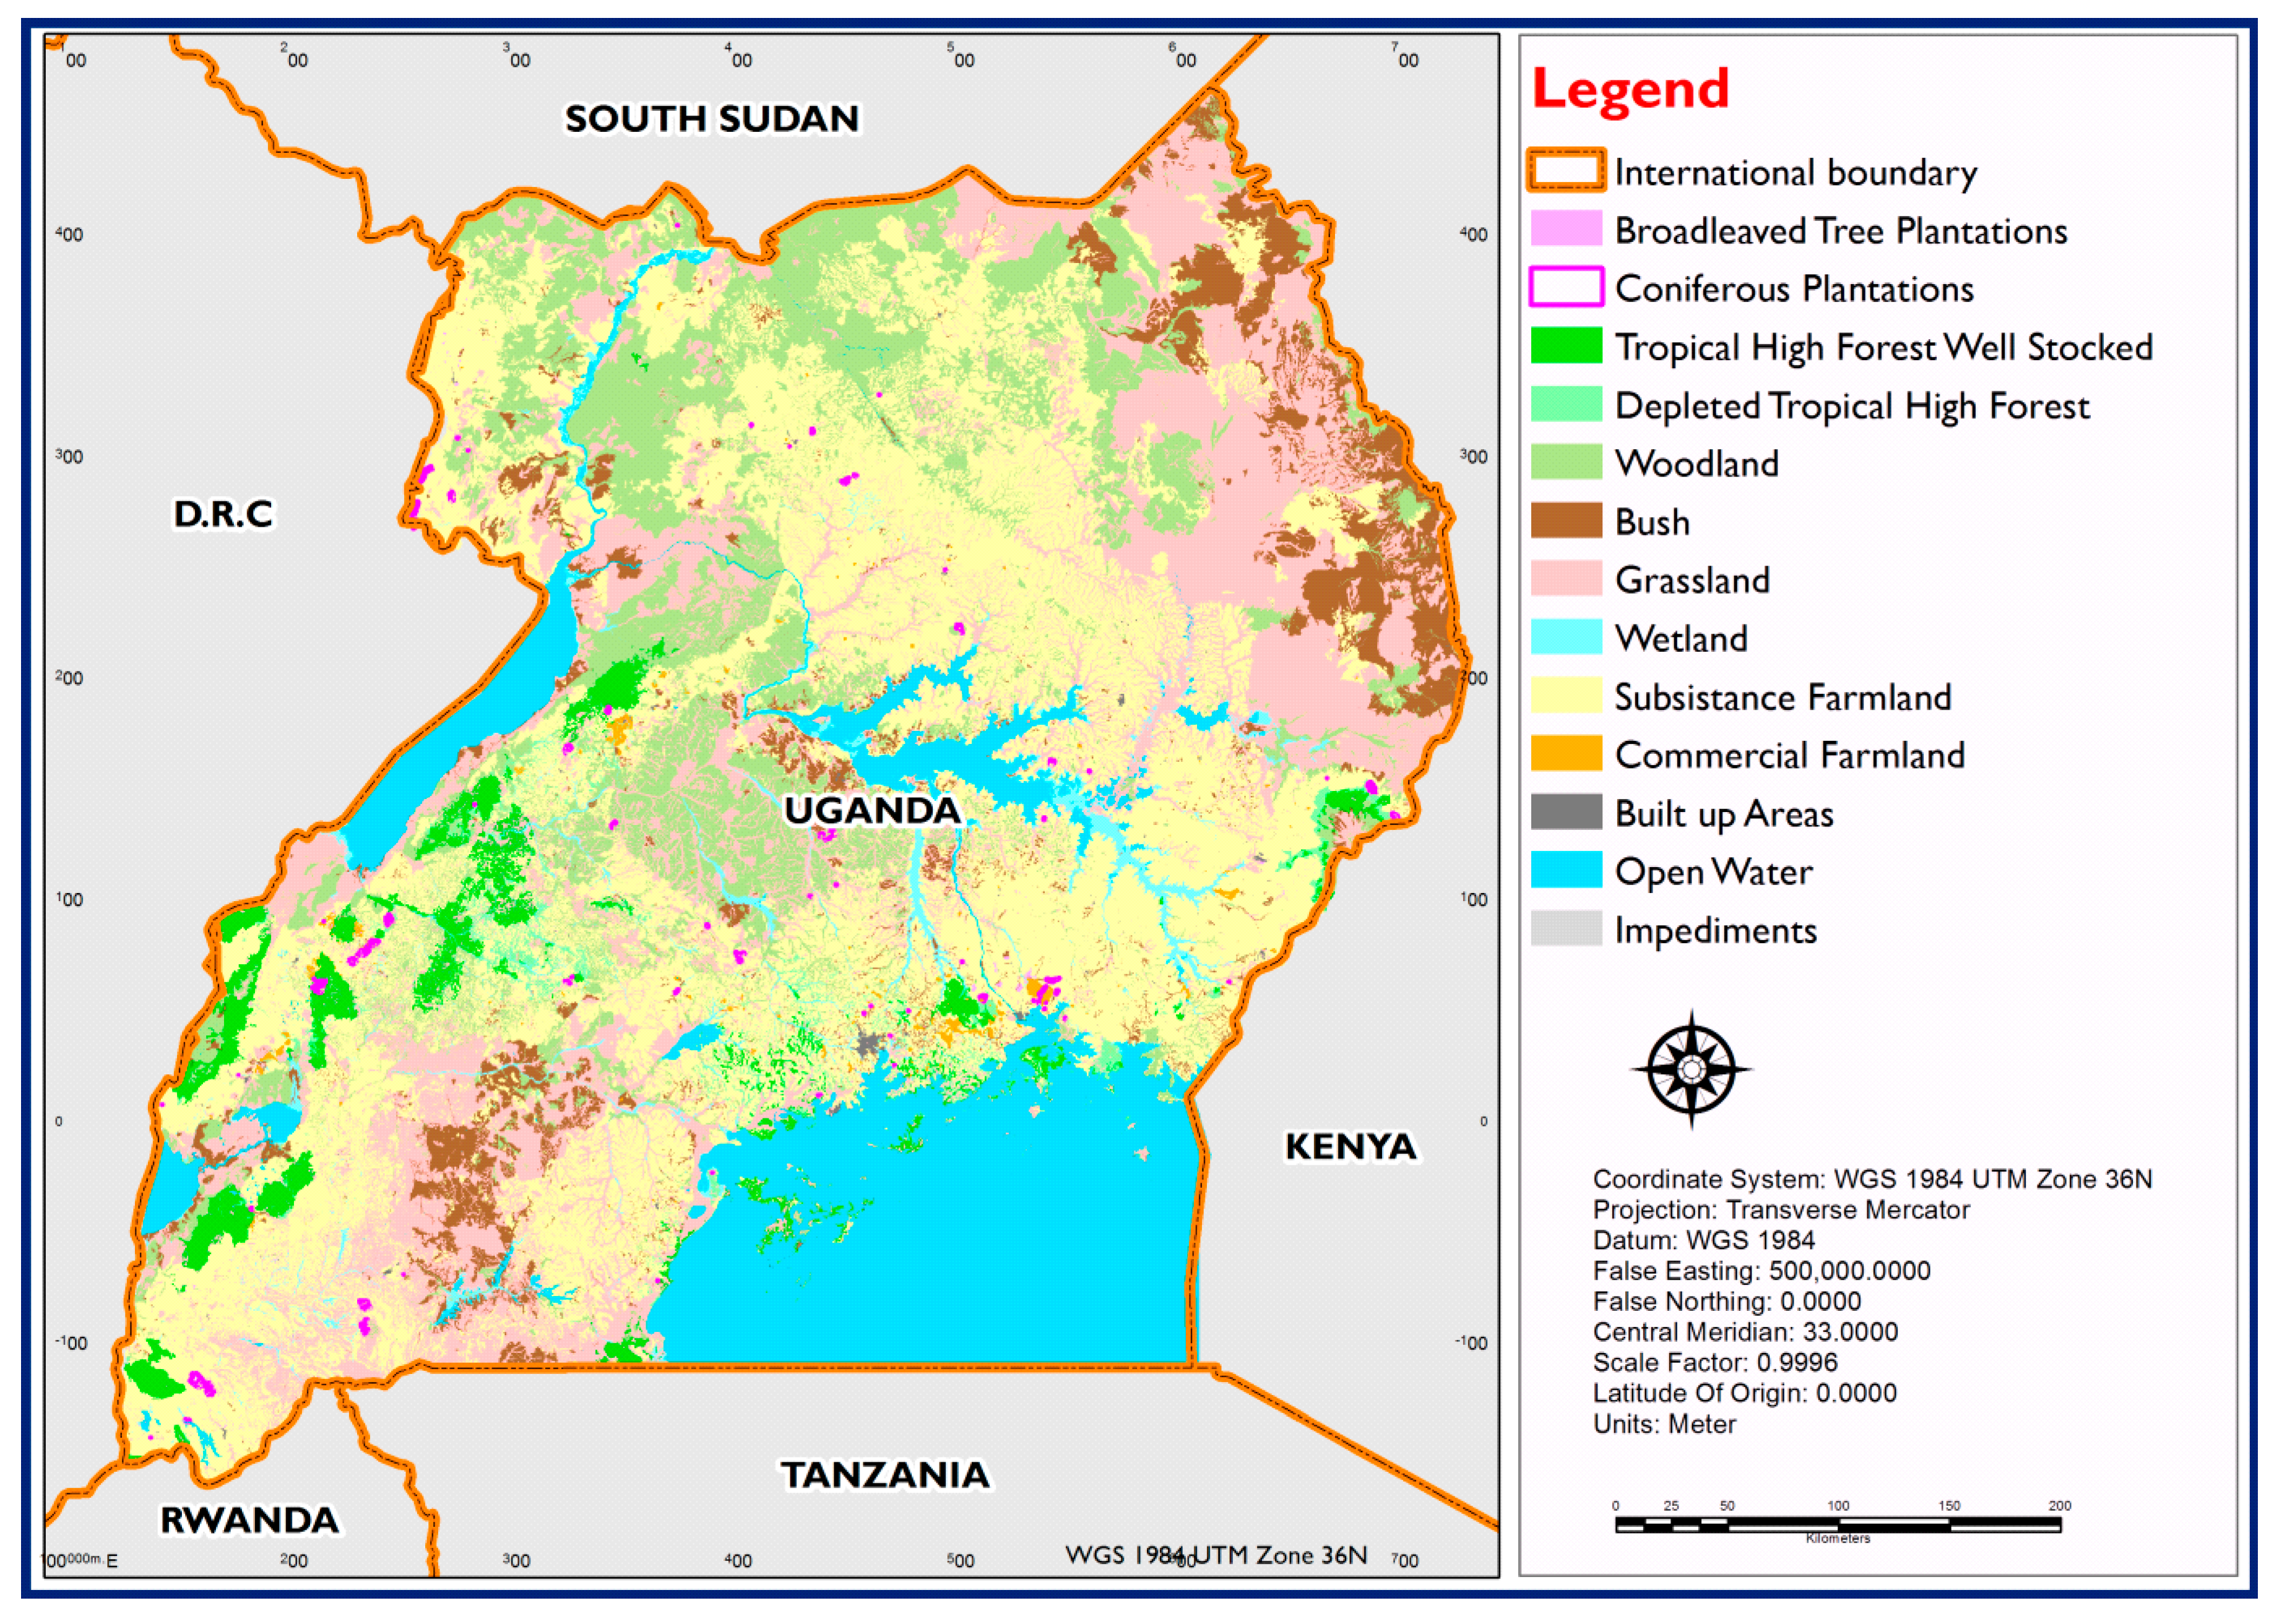
2.2. Acquisition of Land Use/Cover Data

This study obtained the spatial land use/cover datasets from the National Forestry Authority for the years 1990 and 2015 and processed them to produce land use systems for Uganda. The authority is the mandated institution required to frequently monitor land use/cover changes in Uganda. This period (1990–2015) was selected because the land use codes and description of land use/cover classes had been defined and classified in detail.

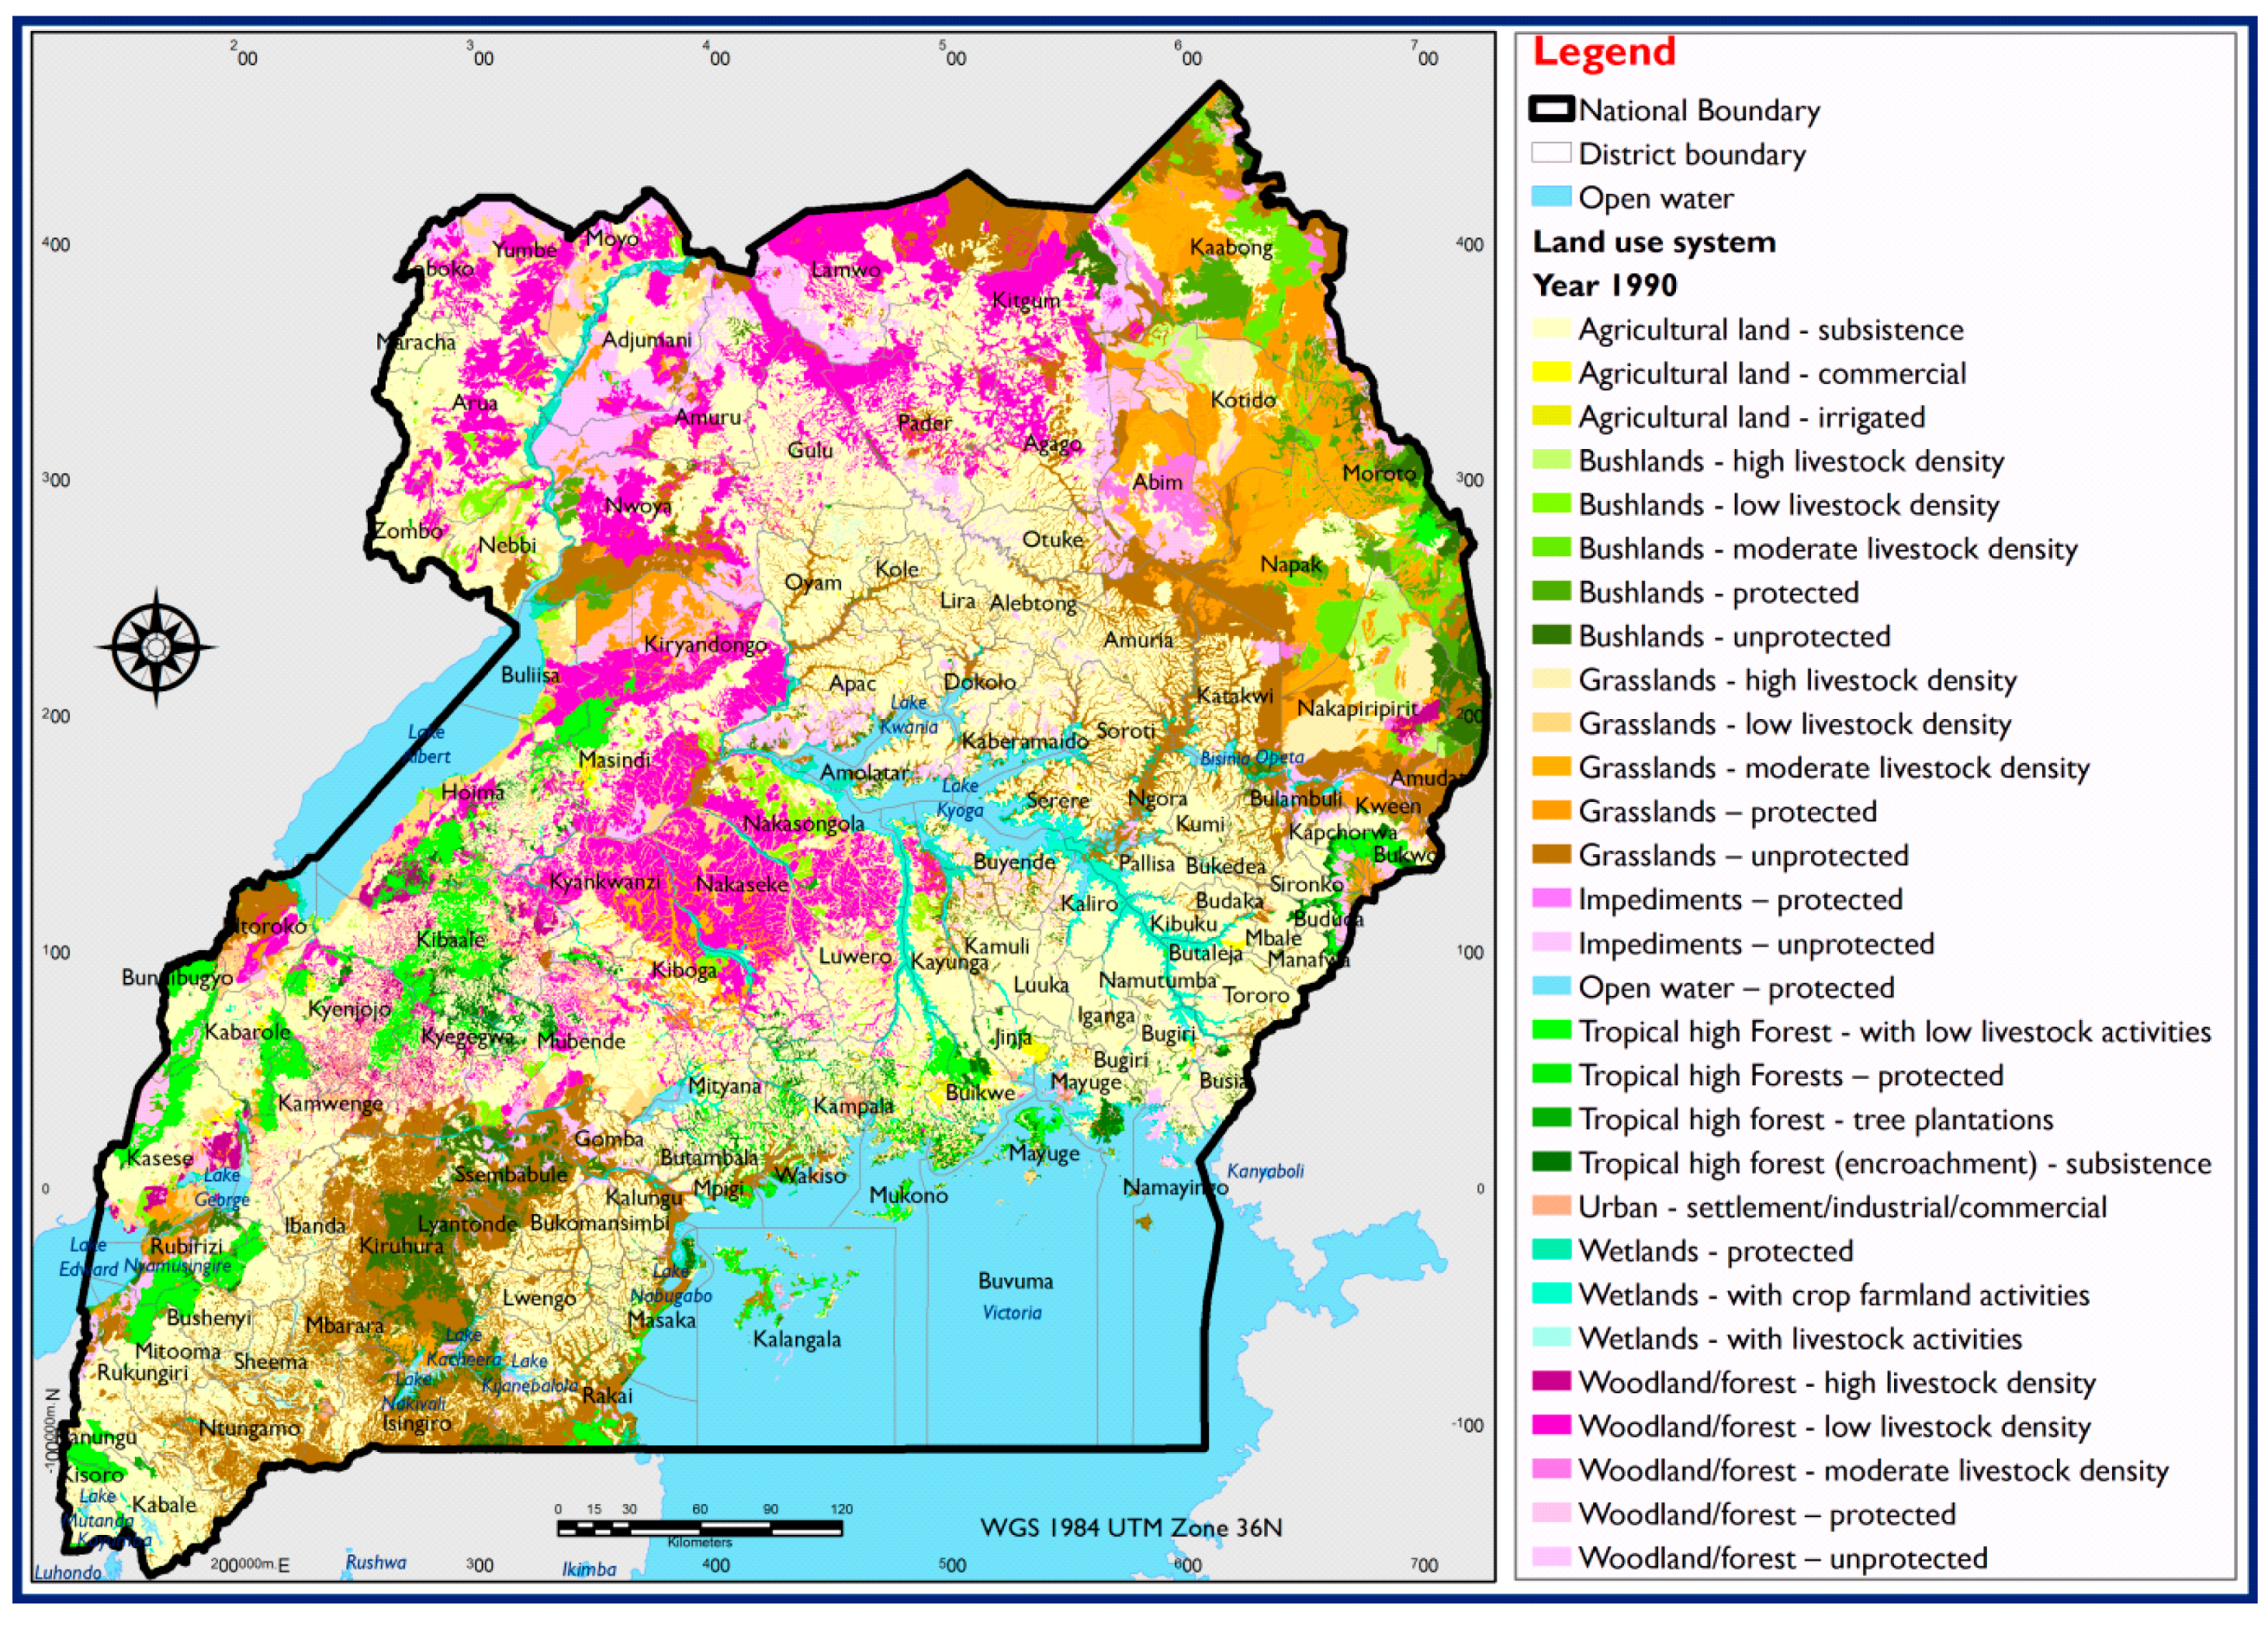
2.2.1. Processing of 1990 Land Use/Cover Data

In 1995, the National Biomass Study (NBS) by the National Forestry Authority generated a national land use/cover map for the year 1990 (Figure 2).
The NBS generated this layer based on SPOT multispectral (XS): SPOT II satellites’ high-resolution images purchased from National Centre for Space Studies (CNES) in France (band swatch 60 × 60 km; covering the 1988–1992 period). The paper hard copies were trimmed to fit the 1:50,000 toposheets of Uganda’s Y733 series. The Panchromatic aerial photos were used to fill data gaps identified in the SPOT imagery. The georeferenced images were later manually digitized on a tablet using PC ArcInfo software to characterize the land use/cover types. The captured classes were verified throughout the year and spanned 2 years. The land use/cover types are described in Table 1.

2.2.2. Processing of 2015 Land Use/Cover Data

This layer was generated based on Landsat 8 images (operational land imager) downloaded from United Stated Geological Survey (USGS) through the Global Visualization Viewer (GLOVIS) portal (covering 180 × 185 km). The dry season images with no clouds were downloaded to a local workstation and analyzed. The images were rectified, coregistered, and atmospherically corrected Top of Atmosphere (TOA) to remove atmospheric errors. The majority filtering method was used to enhance the images for better visualization.
The images were analyzed using a Quantum GIS (QGIS)-based semiautomatic image classification plugin for a hybrid of supervised and unsupervised image classification procedures. The spectral classes extracted, however, were not well represented, and therefore a mean shift segmentation algorithm was adopted and used to segment the land use/cover classes (Figure 3). The parametric supervised segmentation was implemented to refine initial classes following the National Biomass Study (2003) classification system [31]. A field verification exercise was undertaken to validate the classified landscape land use/cover types.

2.3. Characterization of Land Use Systems

2.3.1. Definition of Land Use System

A land use system is a combination of one land unit and one land utilization type (with one set of land use requirements). According to [32] a single-land-use system is the configuration whose performance is analyzed in the assessment of land suitability. However, the generation of land use systems based on the above definition has proved to be too complex and does not result in readily recognizable land use units. Much simpler schemes have been proposed and applied at a global scale to characterize land use systems and ecosystem attributes. The obtained land use/cover datasets of the years 1990 and 2015 were preprocessed and reclassified in a Geographical Information Systems environment (ArcGIS software version 10.1) in the definition of land use systems for Uganda.

2.3.2. Criteria for the Definition of Land Use Systems

The land use systems were defined based on the following three criterions:
  • Similarity in the broad land cover classes;
  • Similarity in terms of protection status;
  • Presence and density of livestock activities.

2.3.3. Steps of Characterizing Land Use Systems

The 1990 and 2015 land use/cover classes were reclassified into finer land use systems based on their uses. These land use/cover datasets were analyzed into land use systems using the following procedures:
  • Step 1: The detailed land use/cover classes were aggregated into 8 classes (forests, grasslands, shrubs, crops and crop mosaics (agricultural land), wetlands, shrubs and bushlands, bare land areas, and open water).
  • Step 2: Irrigated land was identified and overlaid with the map generated in step 1 to create a subclass of irrigated agricultural land. Irrigated land is land equipped with infrastructure for irrigation and this was identified from the 2015 irrigation map for Uganda.
  • Step 3: The protected area layer was overlaid with the layer generated under step 2 for protected land cover (such as protected forest or grassland). Protected areas are areas gazetted for wildlife conservation and they were identified from the protected areas 2014 map for Uganda.
  • Step 4: Livestock intensity was estimated using the Tropical Livestock Unit based on the Ministry of Agriculture, Animal Industry and Fisheries (MAAIF) Uganda Census of Agriculture data (2008/2009) and overlaid with the layer generated under step 3 to define grassland, shrubs, and sparse shrub and herbaceous subclasses based on the livestock intensity.
  • Step 5: For forests, wetlands, and agricultural lands, if the overlay with livestock indicated a moderate or high livestock density, the land use system was considered as a combination of forestry, wetlands, and crops mixed with grazing, respectively.
  • Step 6: In addition to livestock presence, population presence was used to define other forest and wetland subclasses, including unprotected and protected classes for wetlands and forests with agricultural activities and virgin forest.

2.4. Validation of Land Use Systems

The identified land use systems were validated in the field and consultative workshops for classification accuracies. Two validation workshops were held in Kampala that were attended by key experts in land use systems-related work. The experts were pooled from Makerere University and other institutions of higher learning in Uganda; the Ministry of Agriculture, Animal Industry and Fisheries (MAAIF); Ministry of Water and Environment (MWE); Ministry of Lands, Housing and Urban Development (MLHUD); National Forestry Authority (NFA); National Environmental Management Authority (NEMA); Ministry of Local Government (MoLG); local urban authorities; and civil society organizations such as Wildlife Conservation Society and the Albertine Rift Program Kampala.
The land use systems were also validated in the field in representative Afromontane (Bulambuli District) and Western mid-altitude landscapes (Hoima district). These landscapes exhibited a wider range of landscape components such as soil, altitude, and population that were harmonized prior to stratification. The landscapes were identified based on a number of factors, such as agroecosystems, biophysical, geographical, socioeconomic, and cultural factors. Other landscapes included Lake Victoria Crescent, Northern Moist farmland, the Southeast Lake Kyoga floodplain, and Southwestern rangeland. The validations were conducted using 3 focus group discussions in each district in addition to field visits to confirm the 2015 land use systems map.

2.5. Projection of Land Use Systems

2.5.1. Description of Land Change Modeler

The prediction of land use systems was carried out in TerrSet Geospatial Monitoring and Modelling Software using the land change modeler (LCM) platform to generate future land use systems for Uganda.
The principle behind the land change modeler is to evaluate the trend of change from one land use system category to another. The influencing factors included the digital terrain model (DEM) and road network to predict the future land use system pattern based on the previous change trend. The Shuttle Radar Topography Mission (SRTM) digital elevation model of 30 m obtained, pre-processed by filling voids and applied in the LCM modeler. The national roads layer was acquired from the Uganda National Roads Authority (2010), verified for completeness, accuracy and incorporated into the model to facilitate the change prediction processes. The location accuracy of the road network was validated using Google Earth Pro (Geoeye image for 2015).
LCM is more accurate because the neural network outputs are able to express the simultaneous change potential to various land use systems more adequately than individual probabilities obtained through the weights of evidence method [33].

2.5.2. Transition Potential

The LCM computes the Cramer’s coefficient, which indicates the degree to which each explanatory variable is associated with the distributions of land use system categories. The variables were selected provided they significantly contributed to the explanation of the spatial distribution of the land use systems of interest.
The selected variables were modelled using a multilayer perceptron (MLP). The MLP consists of a set of input units (the input layer), one or more sets of computation nodes (the hidden layers), and one set of computation/output nodes (the output layer). The nodes are linked by a web of connections which are applied as a set of weights. The network is trained by the backpropagation algorithm, which involves spreading the errors from the output layer to the input layers iteratively in order to correct the values of the weights [33].
The MLP is normally organized around transition submodels. A transition submodel consists of a single land use system transition or a group of transitions that are thought to have the same contributing factors (Table 2). The advantage of using MLP is that it is capable of modelling complex relationships between variables.
Based on the relationship between the transitions and explanatory variables, the maps of change potential are produced for each transition. For example, assuming that a location is more vulnerable if it is prone to several transitions at the same time, the operator ‘OR’ is used to combine the transition potential in order to produce an overall change potential map.

2.5.3. Future Prediction

The land use systems layers for year 1990 and 2015 were prepared (i.e., ensured they had the same number of classes for land use systems, pixel size, projection among others) and thereafter added to the model to perform the prediction of future land use systems for the year 2040. The period coincides with Uganda Vision 2040, which is conceptualized around strengthening the fundamentals of the economy to harness the abundant opportunities in the country. In the change prediction, the dynamic road development of stochastic highest transition potential was selected with the highest transition potential route. The prediction for future land use systems was based on the Markov chain model [29].
The trend of land use systems was also determined. The trend is hereby referred to as a shift over time among the relationships between the factors that shape the changing nature of human–environment relations. The trend was determined through aggregation of land use systems for the assessed periods (1990–2015; 2015–2040).

3. Results

3.1. Identificaiton and Characterization of Land Use Systems in Uganda

A description of the different land use systems in Uganda is presented in the next section. A total of 29 land use systems were identified and characterized in the country. These land use systems fall into eight broad land use/cover classes, including agricultural land, bushlands, forest, woodland, grasslands, impediments, open water, built-up areas, and wetlands.

3.1.1. Forest Land Use Systems

Four land use systems were identified under forests in Uganda. These include forests consisting of tree plantations, forests with subsistence farming activities, forests with livestock activities, and protected forests. A forest is defined as an ecosystems that is dominated by trees (defined as perennial woody plants taller than 5 m at maturity), where the tree crown cover (or equivalent stocking level) exceeds 10% and the area is larger than 0.5 hectares.
Tree plantation forests are areas of systematically planted, man-managed, primarily exotic tree species (including hybrids). This category includes both young and mature plantations that have been established for commercial timber production, seedling trials, and woodlot/windbreaks of substantial size to be identifiable on satellite imagery. All non-timber-based plantations, such as tea, sisal, and orchards, are excluded. Forest areas with partial or permanent livestock activities and those with farming activities were classified as forest with livestock activities and forest with subsistence activities, respectively. Protected forests included those found in national parks, forest reserves, bird sanctuaries, botanical gardens, and other conservation areas detectable at a mapping scale.

3.1.2. Agricultural Land Use Systems

Three major land use systems were identified under agricultural land, namely subsistence agricultural land, commercial agricultural land without irrigation, and irrigated commercial agricultural land. Agricultural lands are arable and regularly tilled for the production of crops, with or without irrigation. Commercial agricultural lands are characterized by large, uniform, well-managed field units, often mechanized, and more than 10 ha in size [34], with the aim of supplying both regional and national and export markets. Some use supplementary irrigation and others are rain-fed. Subsistence farmlands are generally smaller in size, i.e., less than 10 ha in size (about 2 ha on average) [34]. Subsistence farmlands are generally rain-fed.

3.1.3. Open Water Land Use System

This land use system consists of permanently open water (man-made or natural); static or flowing; salty, brackish, or fresh. This land use system includes lakes, lagoons, ponds, and big reservoirs (big dams).

3.1.4. Grassland Land Use System

Grasslands are defined as those areas where herbaceous plants dominate the vegetation and where woody plants and shrub cover less than 10% of the area. There are five land use systems under grassland areas, three of which involve livestock (grassland with high livestock density, grassland with medium livestock density, and grassland with low livestock density). Other land use systems include grassland protected and grassland unprotected.

3.1.5. Built-Up Areas Land Use System

This land use system essentially comprises of all formal built-up areas, in which people reside on a permanent or near-permanent basis, identifiable by the high density of residential and associated infrastructure. It includes cities, towns, municipalities and rural clusters (trading centres).

3.1.6. Impediments Land Use System

This system comprises land covered by bare bedrock, rocky land, and cobble fields and which has less than 10% vegetated cover during any time of the year. Two land use systems were identified on this type of land, including protected impediments and unprotected impediments.

3.1.7. Wetlands Land Use System

Wetlands are areas of land with a permanent mosaic of water and herbaceous or woody vegetation that covers extensive areas. The vegetation can be present in either salt, brackish, or fresh water, the depth of which does not exceed six meters. Three land use systems were identified under wetlands, including wetlands with livestock activities, wetlands with crop farmland activities, and protected wetlands.

3.1.8. Bushlands Land Use System

Bushlands represent dense, woody, semisucculent, and thorny vegetation types of an average height of 2–3 m which are relatively impenetrable in an unaltered condition. Bushlands are used for grazing and are found in or outside protected areas. Five land use systems, of which three were associated with livestock presence and two were associated with their protection status, were identified.

3.2. The Extent of Historical and Present Land Use Systems

The extent of historical and present land use systems is presented in Table 3. For both periods, a total of 29 classes of land use systems were identified and defined; namely, three (3) of the land use systems are agricultural, five (5) are under bushland, four (4) under forest, five (5) under grasslands, two (2) under impediments, three (3) under wetlands, five (5) under woodland, and one under open water and urban settlement respectively. In 1990, the agricultural land use system was the most dominant (35.06%), followed by grassland (21.17%), woodland (16.45%), and open water (15.28%). The other land use systems include open water—protected, urban—settlement, impediments, and forest- and bushland-related land use systems.
In 2015, agricultural, grassland, and wetland-related land use systems remained the most dominant. Between the two periods, agricultural and woodland-related land use systems experienced the most significant changes in terms of gains or losses. Agriculture-related land use systems increased by 8.56%, while those related to woodland reduced by 11.86% compared to their original values. Figure 4 and Figure 5 show the spatial distribution of the different land use systems across the country for the years 1990 and 2015, respectively.
Despite an increment in commercial agricultural land, subsistence agricultural land remains the most dominant land use system across the country. It also worthwhile to note that the areas under bushland with moderate livestock activities, unprotected bushland, grassland with low livestock activities, grassland with moderate livestock activities, encroached tropical forest, and woodland which is unprotected or with livestock activities declined by 2015.

3.3. Projection of Land Use Systems

Table 4 below shows the projected land use systems for Uganda (Figure 6). By 2040, most of the land use systems’ acreages are likely to change in terms gains or losses. Minimum gains or losses of land are likely to be recorded in tropical high forest with livestock activities, woodland/forest with livestock activities, and woodland/forest unprotected. Subsistence agricultural land use is likely to increase by about 1%, tropical high forest with livestock activities is likely to decrease by 0.2%, and woodland/forest unprotected by 0.07%.
Subsistence agricultural land is projected to increase in Western mid-altitude farmland, in the Zombo Afromontane region, in the Southwestern rangeland, in the Lake Victoria crescent, and in the southeast Lake Kyoga floodplains. Figure 6 shows the predicted distribution of land use systems in 2040. Patches of woodlands are likely to emerge in the highlands of Kabale and around the Western arm of the East African Rift Valley system. Patches of tropical forest and tree plantations are also likely to emerge in the Northern moist farmland.
There are normally ambiguities in the acceptability of the results of land use/cover predictions, especially at a large scale and when the result predicts a future scenario based on disturbed variables. The prediction of land use systems model was built on an MLP built module at 1000 iterations. A fairly good model prediction accuracy (53%) was obtained for the conversions of current land use systems to the future.

4. Discussion

Agricultural land use systems dominate land use changes over the study period (between 1990 and 2015), even in the projection for the year 2040. This result was expected and it is consistent with several other studies that have been conducted for Uganda (for an example, see [35]). Using global land use change models, this is also a consistent observation that has been registered across several parts of the world; for example, by the authors of [36], who showed that extensions of the agricultural frontier were a dominant phenomenon observed across the sub-Saharan region. This result, along with previous studies, reaffirms the dominance of agriculture in the livelihoods of a larger population across the African continent and many developing countries. It is not surprising that several attempts to establish woodlots across the region would increase their dominance next to agricultural land use systems.
At a rate of population growth of 3.4% over the region, agricultural land uses are likely to increase by about 1% and this would severely affect the tropical high forest; an observation that has consistently been observed across many parts of the country by scholars, such as in [37]. At this rate of change, the amount of forest cover available in the future will diminish tremendously and therefore is not likely to support the livelihoods of people unless remedial and deterrent measures are put in place. The study revealed that most conversions of land use were directed into agricultural lands, followed by grasslands and bushlands. This suggests that these changes are the results of natural and human-related factors. This is in line with the Millennium Ecosystem Assessment (2005) and a previous report [38], which categorize the contributing factors of ecosystem change into natural or human-induced factors.
These factors are associated with population increase and its associated demands for land resources, inadequate enforcement of environmental laws, the economic values of major crops, culture, low education level for the majority of the people, land tenure, the small size of household land holdings, and political interventions. The contributing factors must, however, be understood and interpreted carefully given the multiple spatial and temporal scales, and social and methodological perspectives in which related studies have been conducted. There is indeed a clear distinction between contributing factors across scales. Moreover, interactions between contributing factors add to the complexity of land use change processes. For example, microlevel studies [35,38] have observed that land use change was occasioned by the prevailing governance shortfalls (policy–institutional dysfunctionality), demographic pressures, the unmonitored influx of immigrant settlers, and the erosion of institutional controls.
The projected unregulated increase in agricultural land is expected to be made at the expense of tropical high forest and unprotected woodland/forest. This was also observed by the authors of [39], who concluded that over 90% of private forests near Budongo Forest Reserve were affected by sugarcane growing. Because of the rising rural populations and high population density hotspots in Uganda [40], the need for agricultural land has increased across the country and this creates multiple threats for ecosystems in general and land use systems in particular. In fact, areas of high population densities in Uganda are typically agricultural production zones. With a national annual population growth rate that is estimated at 3.4%, the need for agricultural land among smallholder farmers should be expected to rise substantially. The growing importance attached to land for commercial agriculture and other large-scale land developments have increased the competition for land and stimulated market-based transactions. These interplays are responsible for large-scale land use changes across the country. The discovery of oil and proposals by sugar companies for large-scale land acquisition may further exacerbate the land use changes; the authors of [41] observed the same across the Albertine subregion, Northern Uganda, and the Busoga subregion. Although this was not explored in greater detail, we can also speculate that the increases in agricultural systems projected by the year 2040 may arise out of the need to satisfy the demands of the growing urban population. Indeed, the authors of [42] reported that the remaining forest is under increasing pressure from the rising urban demand for wood products.
The importance of the institutional and policy environment cannot be underestimated across the whole country. There is a myriad of policies and institutional frameworks which influence land uses across the country; a comprehensive Land Sector Strategic Plan in 2001 and a National Land Use Policy in 2013 followed the Land Act. More broadly, land and land uses are central to macro-scale policy frameworks, including the Uganda Vision 2040 and the National Development Plan II (2015/16–2019/20). However, their influence on land use change can only be speculative. Some studies (for example, see [43] have observed that land cover/use change and the systematic tenfold increase expansion of cropland is attributable to policy changes and interventions by the Government of Uganda and development partners to promote food security in the Afromontane subregion. On the other hand, evidence reported by [44] from the case studies in Kalangala and Amuru Districts demonstrates the incapacity of existing land governance institutions to cope with the scale of change, particularly in areas with existing or proposed commercial land investments. Similar challenges are evident in other areas with large-scale land acquisitions, even when they are not agribusiness-related. In the Albertine Rift, for example, the rush for land stimulated by oil development is overstretching the capacity of local institutions to cope and therefore increasing tenure insecurity.
This study also takes note of the fact that Uganda is prone to natural disasters such as landslides, floods, droughts, hailstorms and so forth that have devastated property and life, resulting in adverse effects such as loss of revenue, migration, and loss of household incomes [45,46]. These are primarily triggered by natural and human activities that have destabilized the natural systems, such as erratic rainfall, unsustainable farming practices, and unplanned settlements, among others. Therefore, this study envisages more disasters to occur in the country, meaning that more deaths and loss of property will occur if the rate at which land use systems are expanding is not monitored and controlled/regulated in the near future.

5. Conclusions

This study reveals a total of 29 classes of land use systems, categorized as follows: three (3) of the land use systems are agricultural, five (5) are under bushland, four (4) under forest, five (5) under grasslands, two (2) under impediments, three (3) under wetlands, five (5) under woodland, and one each under open water and urban settlement. The highest gains in the land among the land use systems were experienced in agricultural land—subsistence and grasslands—protected, while the highest losses were seen in the grasslands—unprotected, woodland/forest—low livestock density, and woodland/forest—unprotected. The grassland areas are highly prone to human encroachments with the aim to establish smallholder farms. By 2040, most of the land use systems’ acreages are likely to change in terms gains or losses. Minimum gains or losses of land are likely to be recorded in only tropical high forest with livestock activities, woodland/forest with livestock activities, and woodland/forest unprotected. This is given the assumption that the current state of affairs stays the same. The changes in land use systems are highly driven by population pressure, weak enforcement of environmental laws, and the high economic value of major cash crops. This study will inform the local and national stakeholders on the state of natural resources and their problems and driving forces so that conservation efforts are incorporated in the subnational development plans before they diminish. However, this study takes note of the spatial resolution limitations of the data and inadequate validation of land use systems in all of the seven landscapes in Uganda.
The classification of land systems and their contributing factors clearly brings forward the major causes of land cover conversion to the decision-makers so that adequate plans can be made, especially in terms of allocating more funds towards conservation-related programs and also to enact effective environmental laws. These are fundamental in the national and subnational development planning of the country. This study, therefore, recommends a holistic involvement of all stakeholders and the increment of conservation and land use planning awareness programs throughout the country if the projected detrimental land use systems are to be controlled.
This study recommends that a detailed study to analyze and characterize the extent of influence of the perceived contributing factors of changes in land use systems in Uganda be conducted.

Author Contributions

The land use system idea was conceptualized and supported by K.S. and N.C.; the methodologies, validation, and analysis were performed by M.G.J.M., B.B., M.I.P., and W.J. The spatial data was provided by D.J. and S.E.; N.B. (Nakangu Barbara) and N.B. (Nakileza Bob) reviewed the manuscript.

Funding

This study was funded by the United Nations Environment Programme (UN Environment) as part of the Uganda UNREDD National Programme.

Acknowledgments

The International Union for Conservation of Nature (IUCN), which took lead in the study, acknowledges the tremendous support received from the REDD+ secretariat, the UNREDD team, and the national stakeholders that provided input during the consultative workshops (at Protea Hotel and Hotel Africana in Kampala), as well as the Mt. Elgon and the Western - mid altitude landscapes stakeholders. Special recognition goes to the National Forestry Authority, Uganda Bureau of Statistics, Makerere University, National Agricultural Research Laboratory Kawanda, and MAAIF for providing the data that was used during this study. Finally, appreciation goes to Daniel Pouakouyou (Regional Technical Advisor for Africa—UN Environment) for the overall oversight of the UN Environment component of the Uganda UNREDD National Program.

Conflicts of Interest

The authors declare no conflicts of interest in the publication of this manuscript.

References

  1. Newbold, T.; Hudson, L.N.; Hill, S.L.; Contu, S.; Lysenko, I.; Senior, R.A.; Börger, L.; Bennett, D.J.; Choimes, A.; Collen, B.; et al. Global effects of land use on local terrestrial biodiversity. Nature 2015, 520, 45. [Google Scholar] [CrossRef] [PubMed] [Green Version]
  2. Popp, A.; Calvin, K.; Fujimori, S.; Havlik, P.; Humpenöder, F.; Stehfest, E.; Stehfest, E.; Bodirsky, B.L.; Dietrich, J.P.; Doelmann, J.C.; et al. Land-use futures in the shared socio-economic pathways. Glob. Environ. Chang. 2017, 42, 331–345. [Google Scholar] [CrossRef]
  3. Sambou, S.; Lykke, A.M.; Sambou, H.; Guiro, I.; Sambou, B.; Mbow, C. Land use-land cover change and drivers of deforestation in the Patako protected area (Center-West of Senegal). Am. J. Environ. Prot. 2015, 4, 306–317. [Google Scholar] [CrossRef]
  4. Samndong, R.A.; Bush, G.; Vatn, A.; Chapman, M. Institutional analysis of causes of deforestation in REDD+ pilot sites in the Equateur province: Implication for REDD+ in the Democratic Republic of Congo. Land Use Policy 2018, 76, 664–674. [Google Scholar] [CrossRef]
  5. Godar, J.; Gardner, T.A.; Tizado, E.J.; Pacheco, P. Actor-specific contributions to the deforestation slowdown in the Brazilian Amazon. Proc. Natl. Acad. Sci. USA 2014, 111, 15591–15596. [Google Scholar] [CrossRef] [PubMed] [Green Version]
  6. Specht, M.J.; Pinto, S.R.R.; Albuquerque, U.P.; Tabarelli, M.; Melo, F.P. Burning biodiversity: Fuelwood harvesting causes forest degradation in human-dominated tropical landscapes. Glob. Ecol. Conserv. 2015, 3, 200–209. [Google Scholar] [CrossRef]
  7. Smith, P.; Clark, H.; Dong, H.; Elsiddig, E.A.; Haberl, H.; Harper, R.; House, J.; Jafari, M.; Masera, O.; Mbow, C.; et al. Agriculture, forestry and other land use (AFOLU). In Climate Change 2014: Mitigation of Climate Change. IPCC Working Group III Contribution to AR5; Cambridge University Press: Cambridge, UK, 2014. [Google Scholar]
  8. Lawrence, D.; Vandecar, K. Effects of tropical deforestation on climate and agriculture. Nat. Clim. Chang. 2015, 5, 27. [Google Scholar] [CrossRef]
  9. Lapola, D.M.; Martinelli, L.A.; Peres, C.A.; Ometto, J.P.; Ferreira, M.E.; Nobre, C.A.; Aguiar, A.P.D.; Bustamante, M.M.; Cardoso, M.F.; Costa, M.H.; et al. Pervasive transition of the Brazilian land-use system. Nat. Clim. Chang. 2014, 4, 27. [Google Scholar] [CrossRef]
  10. Barni, P.E.; Fearnside, P.M.; de Alencastro Graça, P.M.L. Simulating deforestation and carbon loss in Amazonia: Impacts in Brazil’s Roraima state from reconstructing Highway BR-319 (Manaus-Porto Velho). Environ. Manag. 2015, 55, 259–278. [Google Scholar] [CrossRef] [PubMed]
  11. Alkama, R.; Cescatti, A. Biophysical climate impacts of recent changes in global forest cover. Science 2016, 351, 600–604. [Google Scholar] [CrossRef] [PubMed] [Green Version]
  12. Kweka, E.J.; Kimaro, E.E.; Munga, S. Effect of deforestation and land use changes on mosquito productivity and development in western Kenya highlands: Implication for malaria risk. Front. Public Health 2016, 4, 238. [Google Scholar] [CrossRef] [PubMed]
  13. Were, K.O.; Singh, B.R.; Dick, Ø.B. Effects of land cover changes on soil organic carbon and total nitrogen stocks in the Eastern Mau Forest Reserve, Kenya. In Sustainable Intensification to Advance Food Security and Enhance Climate Resilience in Africa; Springer: Cham, Switzerland, 2015; pp. 113–133. [Google Scholar]
  14. Natkhin, M.; Dietrich, O.; Schäfer, M.P.; Lischeid, G. The effects of climate and changing land use on the discharge regime of a small catchment in Tanzania. Reg. Environ. Chang. 2015, 15, 1269–1280. [Google Scholar] [CrossRef]
  15. Rawat, J.S.; Kumar, M. Monitoring land use/cover change using remote sensing and GIS techniques: A case study of Hawalbagh block, district Almora, Uttarakhand, India. Egypt. J. Remote Sens. Space Sci. 2015, 18, 77–84. [Google Scholar] [CrossRef]
  16. Zhang, F.; Zhan, J.; Zhang, Q.; Yao, L.; Liu, W. Impacts of land use/cover change on terrestrial carbon stocks in Uganda. Phys. Chem. Earth Parts A/B/C 2017, 101, 195–203. [Google Scholar] [CrossRef]
  17. Yang, C.; Rottensteiner, F.; Heipke, C. Classification of land cover and land use based on convolutional neural networks. ISPRS Ann. Photogramm. Remote Sens. Spat. Inf. Sci. 2018, 4, 251–258. [Google Scholar] [CrossRef]
  18. Lillesand, T.; Kiefer, R.W.; Chipman, J. Remote Sensing and Image Interpretation; John Wiley & Sons: Hoboken, NJ, USA, 2014. [Google Scholar]
  19. Masette, M.; Isabirye-Basuta, G.; Baranga, D.; Chemurot, M. Levels of tannins in fruit diet of grey-cheeked mangabeys (Lophocebus ugandae, Groves) in Lake Victoria Basin forest reserves. J. Ecol. Nat. Environ. 2015, 7, 146–157. [Google Scholar]
  20. Shaban, K.S.; Okumu, J.O.; Paul, O.; Joseph, O. Assessing community-based organizations’ influence on trees and grass planting for forest, soil and water management around Mt. Elgon National Park in Uganda. For. Trees Livelihoods 2016, 25, 161–172. [Google Scholar] [CrossRef]
  21. Arinaitwe, K.; Rose, N.L.; Muir, D.C.; Kiremire, B.T.; Balirwa, J.S.; Teixeira, C. Historical deposition of persistent organic pollutants in Lake Victoria and two alpine equatorial lakes from East Africa: Insights into atmospheric deposition from sedimentation profiles. Chemosphere 2016, 144, 1815–1822. [Google Scholar] [CrossRef] [PubMed]
  22. Kayima, J.K.; Mayo, A.W.; Nobert, J. Ecological Characteristics and Morphological Features of the Lubigi Wetland in Uganda. Environ. Ecol. Res. 2018, 6, 218–228. [Google Scholar] [CrossRef]
  23. Gabiri, G.; Obando, J.A.; Tenywa, M.M.; Majaliwa, J.G.; Kizza, C.L.; Zizinga, A.; Buruchara, R. Soil and nutrient losses under cultivated bush and climbing beans on terraced humid highland slopes of Southwestern Uganda. J. Sci. Res. Rep. 2015, 8, 1–16. [Google Scholar] [CrossRef]
  24. Musau, J.; Sang, J.; Gathenya, J.; Luedeling, E. Hydrological responses to climate change in Mt. Elgon watersheds. J. Hydrol. Reg. Stud. 2015, 3, 233–246. [Google Scholar] [CrossRef]
  25. Nakileza, B.R.; Majaliwa, M.J.; Wandera, A.; Nantumbwe, C.M. Enhancing resilience to landslide disaster risks through rehabilitation of slide scars by local communities in Mt. Elgon, Uganda. Jàmbá J. Disaster Risk Stud. 2017, 9, 1–11. [Google Scholar]
  26. Nakalembe, C.; Dempewolf, J.; Justice, C. Agricultural land use change in Karamoja region, Uganda. Land Use Policy 2017, 62, 2–12. [Google Scholar] [CrossRef]
  27. Li, J.; Oyana, T.J.; Mukwaya, P.I. An examination of historical and future land use changes in Uganda using change detection methods and agent-based modelling. Afr. Geogr. Rev. 2016, 35, 247–271. [Google Scholar] [CrossRef]
  28. Solberg, S.; May, J.; Bogren, W.; Breidenbach, J.; Torp, T.; Gizachew, B. Interferometric SAR DEMs for Forest Change in Uganda 2000–2012. Remote Sens. 2018, 10, 228. [Google Scholar] [CrossRef]
  29. Halmy, M.W.A.; Gessler, P.E.; Hicke, J.A.; Salem, B.B. Land use/land cover change detection and prediction in the north-western coastal desert of Egypt using Markov-CA. Appl. Geogr. 2015, 63, 101–112. [Google Scholar] [CrossRef]
  30. Uganda Bureau of Statistics. The National Population and Housing Census 2014–Main Report; Uganda Bureau of Statistics: Kampala, Uganda, 2016. [Google Scholar]
  31. Mwanjalolo, M.G.J.; Bernard, B.; Paul, M.I.; Joshua, W.; Sophie, K.; Cotilda, N.; Bob, N.; John, D.; Edward, S.; Barbara, N. Assessing the Extent of Historical, Current, and Future Land Use Systems in Uganda. Land 2018, 7, 132. [Google Scholar]
  32. Driessen, P.M.; Konijn, N.T. Land-Use Systems Analysis; WAU and Interdisciplinary Research (INRES): Malang, Indonesia, 1992. [Google Scholar]
  33. Pérez-Vega, A.; Mas, J.F.; Ligmann-Zielinska, A. Comparing two approaches to land use/cover change modeling and their implications for the assessment of biodiversity loss in a deciduous tropical forest. Environ. Model. Softw. 2012, 29, 11–23. [Google Scholar] [CrossRef]
  34. Dixon, J.; Tanyeri-Abur, A.; Wattenbach, H. Context and Framework for Approaches to Assessing the Impact of Globalization on Smallholders. In Approaches to Assessing the Impact of Globalization on African Smallholders: Household and Village Economy Modeling, Proceedings of Working Session Globalization and the African Smallholder Study; Dixon, J., Taniguchi, K., Wattenbach, H., Eds.; FAO and World Bank: Rome, Italy, 2003. [Google Scholar]
  35. Rukundo, B. Implications of Land Governance on Natural Resources Management: The Case of Land-Use and Forest-Cover Change in Kibaale District, Uganda. Ph.D. Thesis, Technische Universität München, München, Germany, 2013. [Google Scholar]
  36. Brink, A.B.; Eva, H.D. Monitoring 25 years of land cover change dynamics in Africa: A sample based remote sensing approach. Appl. Geogr. 2009, 29, 501–512. [Google Scholar] [CrossRef] [Green Version]
  37. Améztegui, A.; Brotons, L.; Coll, L. Land-use changes as major drivers of mountain pine (Pinus uncinata Ram.) expansion in the Pyrenees. Glob. Ecol. Biogeogr. 2010, 19, 632–641. [Google Scholar] [CrossRef]
  38. Ebanyat, P.; Ridder, N.; Jager, A.; Delve, R.J.; Bekunda, M.A.; Giller, K.E. Drivers of land use change and household determinants of sustainability in smallholder farming systems of Eastern Uganda. Popul. Environ. 2010, 31, 474–506. [Google Scholar] [CrossRef] [PubMed] [Green Version]
  39. Mwavu, E.N.; Witkowski, E.T.F. Land-use and cover changes (1988–2002) around Budongo forest reserve, NW Uganda: Implications for forest and woodland sustainability. Land Degrad. Dev. 2008, 19, 606–622. [Google Scholar] [CrossRef]
  40. Obua, J.; Harding, D.M. Visitor characteristics and attitudes towards Kibale National Park, Uganda. Tour. Manag. 1996, 17, 495–505. [Google Scholar] [CrossRef]
  41. Van Alstine, J.; Manyindo, J.; Smith, L.; Dixon, J.; AmanigaRuhanga, I. Resource governance dynamics: The challenge of ‘new oil’ in Uganda. Resour. Policy 2014, 40, 48–58. [Google Scholar] [CrossRef]
  42. Obua, J.; Agea, J.G. Forests and Forestry in Uganda. Degraded Forests in Eastern Africa: Management and Restoration; Bongers, F., Tennigkeit, T., Eds.; Earthscan Ltd.: London, UK, 2010; pp. 65–88. [Google Scholar]
  43. Egeru, A.; Wasonga, O.; Kyagulanyi, J.; Majaliwa, G.M.; MacOpiyo, L.; Mburu, J. Spatio-temporal dynamics of forage and land cover changes in Karamoja sub-region, Uganda. Pastoralism 2014, 4, 6. [Google Scholar] [CrossRef] [Green Version]
  44. Deininger, K.; Castagnini, R. Incidence and impact of land conflict in Uganda. J. Econ. Behav. Organ. 2006, 60, 321–345. [Google Scholar] [CrossRef]
  45. Bwambale, B.; Bagampadde, U.; Gidudu, A.; Martini, F. Seismic Hazard Analysis for the Albertine Region, Uganda—A Probabilistic Approach. S. Afr. J. Geol. 2015, 118, 411–424. [Google Scholar] [CrossRef]
  46. Jacobs, L.; Dewitte, O.; Poesen, J.; Maes, J.; Mertens, K.; Sekajugo, J.; Kervyn, M. Landslide characteristics and spatial distribution in the Rwenzori Mountains, Uganda. J. Afr. Earth Sci. 2017, 134, 917–930. [Google Scholar] [CrossRef]
Figure 1. Location of the study area in Africa.
Land 07 00132 g001
Figure 2. Land use/cover for Uganda for the year 1990.
Land 07 00132 g002
Figure 3. Land use/cover for Uganda for the year 2015.
Land 07 00132 g003
Figure 4. Historical land use systems of Uganda in 1990.
Land 07 00132 g004
Figure 5. Current land use systems for Uganda, as of 2015.
Land 07 00132 g005
Figure 6. Projected land use systems of Uganda for the year 2040.
Land 07 00132 g006
Table 1. Description of the National Biomass Study’s land use/cover classes (1990).
No.Land Use/Cover ClassesDescription
1Built-up areaUrban and rural built areas
2BushlandsBush, thickets, scrub (average height <4 m)
3Commercial farmlandMonocropped, nonseasonal farming, usually with no trees
4GrasslandRangeland, pasture land, savannah—may include scattered tree shrubs, thickets, scrub
5Hardwood plantationHard and softwood
6ImpedimentsBare rocks and land
7Open waterLakes, rivers, and ponds
8Small-scale farmlandMixed farmland, smallholding with or without scattered trees
9Tropical high forest (well stocked)Normally stocked
10Tropical high forest (low stocked)Degraded/depleted/encroached
11WetlandWetland vegetation, swamps, papyrus, and other sedges
12WoodlandTrees and shrubs (average height >4 m)
13SoftwoodScattered woodlots
Table 2. Transitions and submodels (LCM).
Transitions From–ToSubmodel Name
Woodland–unprotected to agricultural landWoodland_to_agriculture
Grassland–unprotected to agricultural landGrassland_to_agriculture
Bushland–unprotected to agricultural landBushland_to_agriculture
Table 3. Changes in the extent of land use systems coverage between 1990 and 2015.
No.Land Use Systems19902015
Area (km2)% Area (km2)Area (km2)% Area (km2)
1Agricultural land—commercial517.320.2092587.711.06
2Agricultural land—irrigated28.80.01246.080.02
3Agricultural land—subsistence98,073.3639.683107,426.644.16
4Bushlands—high livestock density1389.290.5621360.660.56
5Bushlands—low livestock density111.070.045452.540.19
6Bushlands—moderate livestock density2111.070.8542642.541.09
7Bushlands—protected5206.782.1077410.413.05
8Bushlands—unprotected5459.022.2094236.811.74
9Grasslands—high livestock density3240.071.3116588.382.71
10Grasslands—low livestock density7398.232.9935350.852.20
11Grasslands—moderate livestock density6131.72.4816534.762.69
12Grasslands—protected6648.122.69027,146.211.16
13Grasslands—unprotected26,402.3310.6836118.322.52
14Impediments—protected9.70.00434.560.01
15Impediments—unprotected11.520.00551.90.02
16Open water—protected37,130.6915.02436,980.7715.20
17Tropical high forest (encroachment)—subsistence2186.910.885872.060.36
18Tropical high forest—tree plantations218.10.0882420.61.00
19Tropical high forest—with livestock activities6765.052.737942.690.39
20Tropical high forest—protected2715.461.0993199.141.32
21Urban—settlement362.10.1471340.090.55
22Wetlands—protected1963.580.7956028.292.48
23Wetlands—with crop farmland activities217.430.088347.640.14
24Wetlands—with livestock activities528.30.214487.720.20
25Woodland/forest—high livestock density1851.10.749685.190.28
26Woodland/forest—low livestock density5481.562.2181246.910.51
27Woodland/forest—protected4092.061.6566822.212.80
28Woodland/forest—unprotected9612.573.889867.250.36
29Woodland/forest —moderate livestock density11,281.564.5653024.911.24
Table 4. Projected land use systems of Uganda for the year 2040.
No.Land Use Systems2040
Area (km2)% Area (km2)
1Agricultural land—commercial2875.971.191
2Agricultural land—irrigated96.080.040
3Agricultural land—subsistence109,713.845.452
4Bushlands—high livestock density1333.40.552
5Bushlands—moderate livestock density1273.40.528
6Bushlands—low livestock density1079.980.447
7Bushlands—protected7363.733.051
8Bushlands—unprotected4219.811.748
9Grasslands—high livestock density6578.742.725
10Grasslands—low livestock density5339.82.212
11Grasslands—moderate livestock density6529.632.705
12Grasslands—protected27,089.8611.223
13Grasslands—unprotected5966.882.472
14Impediments—protected28.80.012
15Impediments—unprotected51.90.022
16Open water—protected36,984.2915.322
17Tropical high forest (encroachment)—subsistence869.870.360
18Tropical high forest—tree plantations2407.540.997
19Tropical high forest—with livestock activities421.690.175
20Tropical high forest—protected3207.351.329
21Urban—settlement1432.260.593
22Wetlands—protected6013.492.491
23Wetlands—with crop farmland activities647.640.268
24Wetlands—with livestock activities487.980.202
25Woodland/forest—high livestock density235.590.098
26Woodland/forest—low livestock density1953.950.809
27Woodland/forest—protected6788.462.812
28Woodland/forest—unprotected287.270.119
29Woodland/forest—moderate livestock density102.50.042

