Communication

Characterizing the Spatial and Temporal Availability of Very High Resolution Satellite Imagery in Google Earth and Microsoft Bing Maps as a Source of Reference Data

Ecosystems Services and Management Program, International Institute for Applied Systems Analysis (IIASA), A-2361 Laxenburg, Austria
*
Author to whom correspondence should be addressed.
Land 2018, 7(4), 118; https://doi.org/10.3390/land7040118
Submission received: 20 August 2018 / Revised: 8 October 2018 / Accepted: 10 October 2018 / Published: 11 October 2018

Abstract

:
Very high resolution (VHR) satellite imagery from Google Earth and Microsoft Bing Maps is increasingly being used in a variety of applications from computer sciences to arts and humanities. In the field of remote sensing, one use of this imagery is to create reference data sets through visual interpretation, e.g., to complement existing training data or to aid in the validation of land-cover products. Through new applications such as Collect Earth, this imagery is also being used for monitoring purposes in the form of statistical surveys obtained through visual interpretation. However, little is known about where VHR satellite imagery exists globally or the dates of the imagery. Here we present a global overview of the spatial and temporal distribution of VHR satellite imagery in Google Earth and Microsoft Bing Maps. The results show an uneven availability globally, with biases in certain areas such as the USA, Europe and India, and with clear discontinuities at political borders. We also show that the availability of VHR imagery is currently not adequate for monitoring protected areas and deforestation, but is better suited for monitoring changes in cropland or urban areas using visual interpretation.

1. Introduction

Google Earth and Microsoft Bing Maps provide visual access to very high resolution (VHR) satellite imagery, defined here as imagery with a spatial resolution finer than 5 m. We have started to see this imagery being used across many different disciplines with increasing frequency. For example, using the search terms “Google Earth” or “Bing Imagery” in Scopus, which is a database of scientific abstracts and citations, reveals a steady increase from 2005 to 2016 in the number of papers that mention or use such imagery (Figure S1), both across general domains (Figure S2) and more specifically in remote sensing (Figure S3). The imagery is used for different purposes but in remote sensing, mapping is the most frequent thematic area (Figure S4) and map validation is the most commonly found application, i.e., producing an accuracy assessment of a map (Figures S5 and S6). As many detailed features and objects can be seen from VHR imagery, e.g., buildings, roads and individual trees, reference data sets for map validation are increasingly being augmented with visual interpretation of Google Earth imagery, and producers and consumers of land-cover maps are using Google Earth to collect reference data for the validation of these products [1,2,3,4,5]. At the same time, applications such as Geo-Wiki are using crowdsourcing to gather reference data sets for hybrid land cover map development and validation tasks based on visual interpretation of Google Earth and Microsoft Bing Maps [6,7,8,9,10,11], while the Collect Earth tool uses Google Earth imagery to gather data for forest inventories [12,13].
VHR imagery is also extremely useful for a range of different environmental monitoring applications, from detecting deforestation to monitoring cropland expansion or abandonment. Here we do not refer to the use of the imagery directly in classification, either the use of spectral information from VHR imagery that has been purchased or the red-green-blue (RGB) images themselves. Instead we refer to applications such as Collect Earth, which can be used to undertake monitoring activities through statistical surveys with visual interpretation [12,13]. Unlike Microsoft Bing Maps, Google Earth provides access to historical imagery, archiving the images as they are added to their system. This historical imagery represents a valuable source of information for monitoring changes in the landscape over time. However, since Google Earth and Microsoft Bing Maps present the satellite imagery in a seamless fashion, this may lead to the perception that the satellite data are continuous and homogeneous in nature, both in time and space. Yet in reality, the information is actually a mosaic of many images from different time periods, different spatial resolutions (15 m to 10 cm) and multiple image providers (from Landsat satellites operated by National Aeronautics and Space Administration (NASA) and United States Geological Survey (USGS) to commercial providers such as Digital Globe); see e.g., [14]. Moreover, important to note is that Google Earth and Microsoft Bing Maps do not include all of the available VHR imagery from all providers but only a subset of images that have been negotiated through agreements. Hence the satellite image landscape is actually fractured, with much of the globe still covered by Landsat resolution imagery, i.e., 15 m panchromatic. Although the Sentinel-2 of the European Space Agency (ESA) is now freely available and may slowly replace the base Landsat imagery in Google Earth, a 10 m spatial resolution is still not sufficient for visual interpretation of many landscape features. Moreover, for users of Google Earth and Microsoft Bing Maps, little is known about the spatial availability of the VHR imagery or how much historical imagery exists in Google Earth and where it can be found, which can limit the use of this resource for environmental monitoring applications.
In this paper we provide an overview of the availability of VHR imagery globally by creating a systematic sample at each latitude/longitude intersection and extracting the type of imagery and the dates available for both Google Earth and Microsoft Bing Maps. As mentioned above, we define VHR imagery as any imagery that has a spatial resolution finer than 5 m. Although the term ‘VHR imagery’ is often used to denote imagery at a resolution measured in centimeters, there are also other types of imagery available such as SPOT (1.5 to 5 m resolution), which can be useful in recognizing certain landscape features. This is the first time that metadata on the availability of VHR imagery in space and time has been made available for Google Earth and Microsoft Bing Maps. The information can be used, for example, in the design of reference databases for remote sensing, particularly in applications that involve change detection. The overview provided here corresponds to the first week of January 2017, after which Google deprecated the Google Earth application programming interface (API)/plugin and it was no longer possible to obtain the image dates from this source. With a focus on specific geographical areas, we then examine the availability of VHR imagery and its potential impact on monitoring world protected areas, deforestation, cropland and urban expansion using visual interpretation.

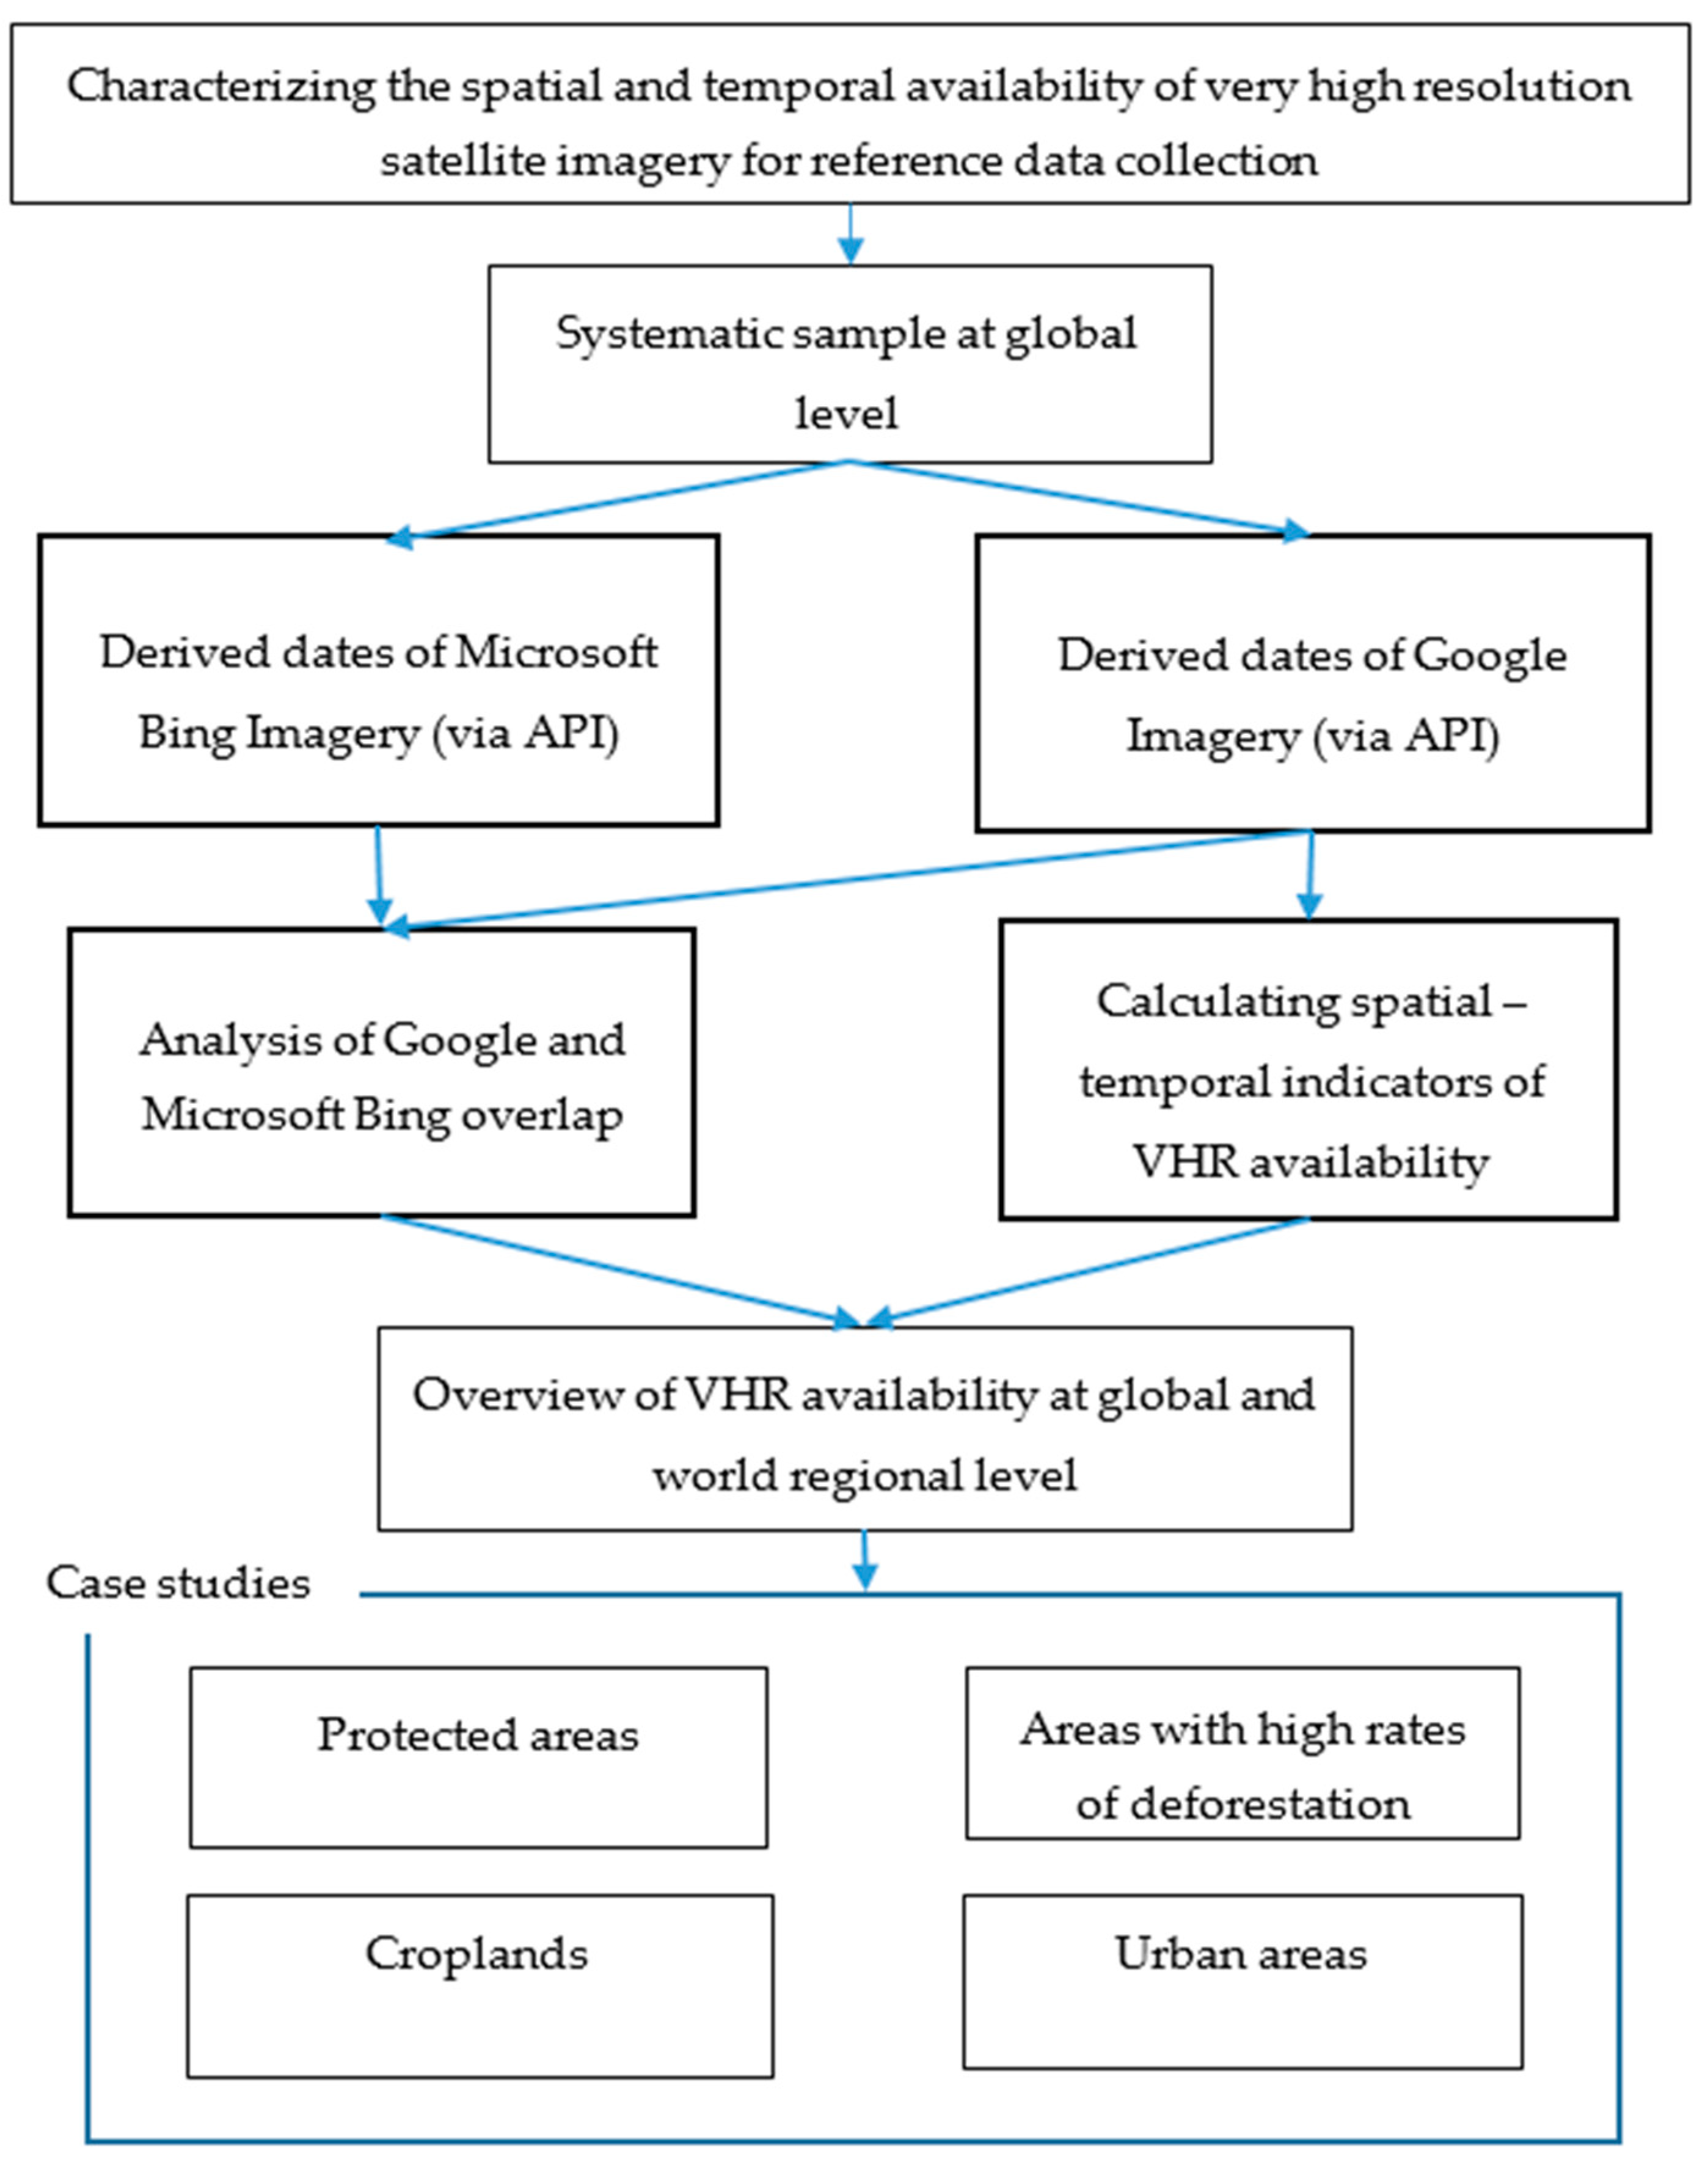
2. Materials and Methods

The methodology used in this paper is summarized in Figure 1. Starting with a systematic sample, the dates are extracted from Google Earth and Microsoft Bing Maps as described in Section 2.1. This data set is then analyzed for overlap, and a variety of spatial and temporal indicators of VHR availability are calculated (as described in Section 2.2) in order to provide a global and world regional overview. Finally, a series of case studies have been selected, where the data extraction and processing is described in Section 2.3, Section 2.4, Section 2.5 and Section 2.6.

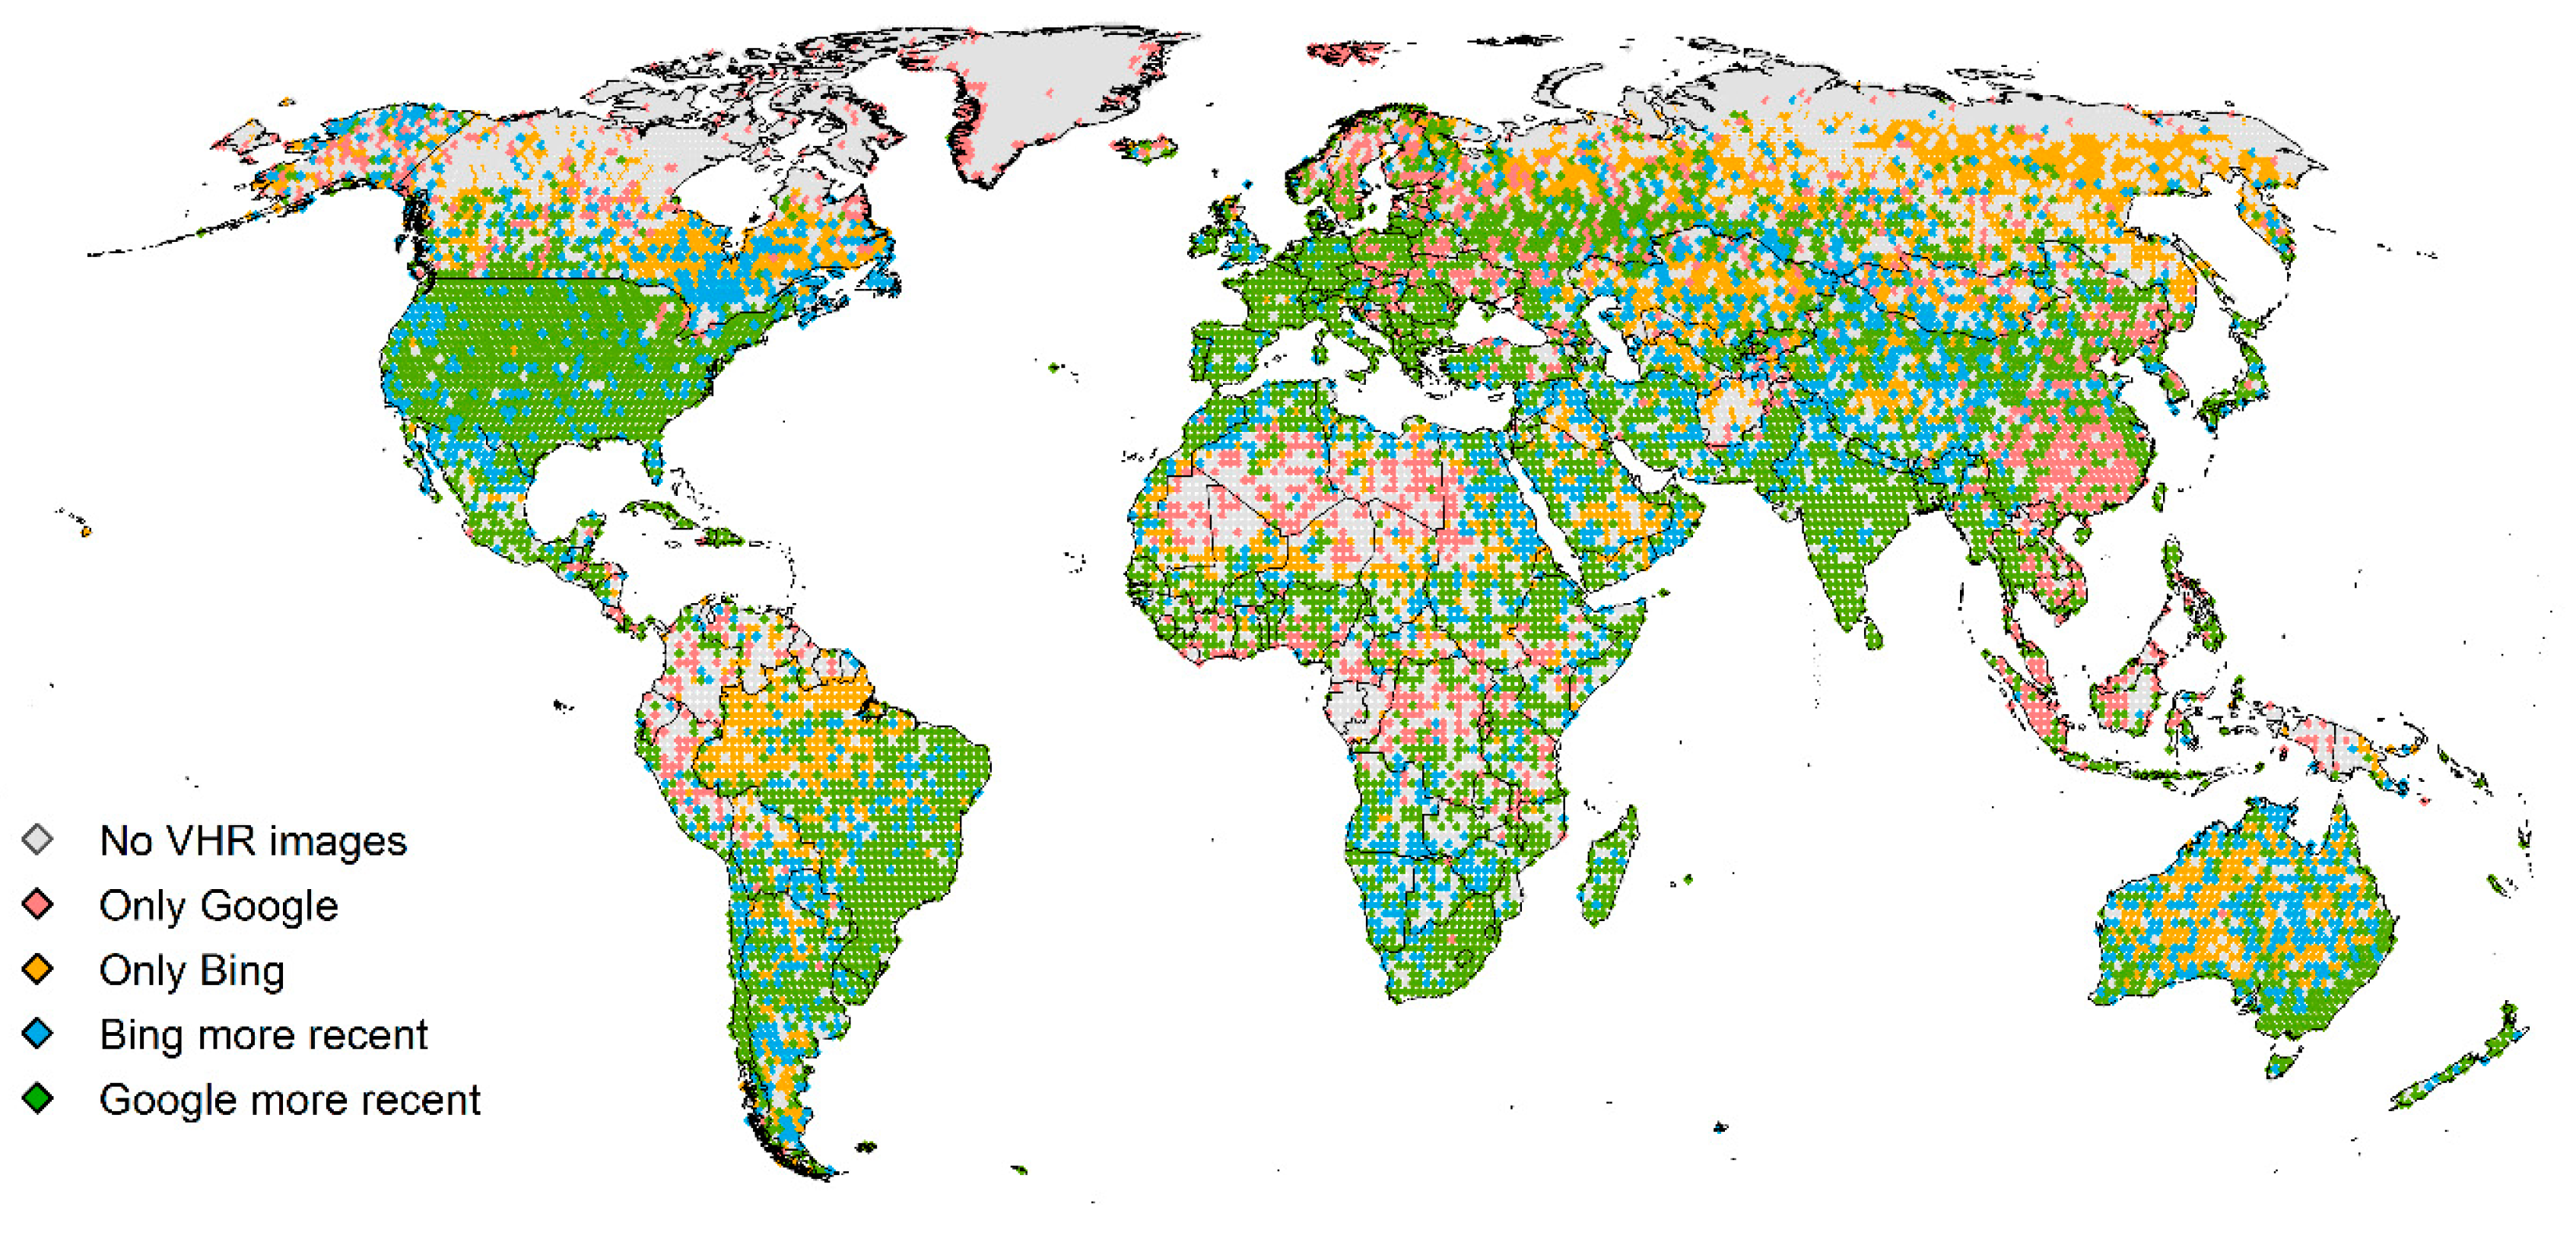
2.1. Data Extraction from Google Earth and Microsoft Bing Maps

The dates of the images were extracted from Google Earth and Microsoft Bing Maps using the API provided by each application on a systematic grid with a spacing of 1 degree or circa 100 km at the equator placed over land surface areas of the Earth. The Google Earth API was deprecated on 11 January 2017 so the Google Earth historical imagery dates were extracted just prior to this deprecation. The Microsoft Bing Maps dates were extracted at the same time. For Microsoft Bing Maps, only one satellite image is available at each location while Google Earth has historical imagery so the dates of all historical imagery were recorded at each grid point.

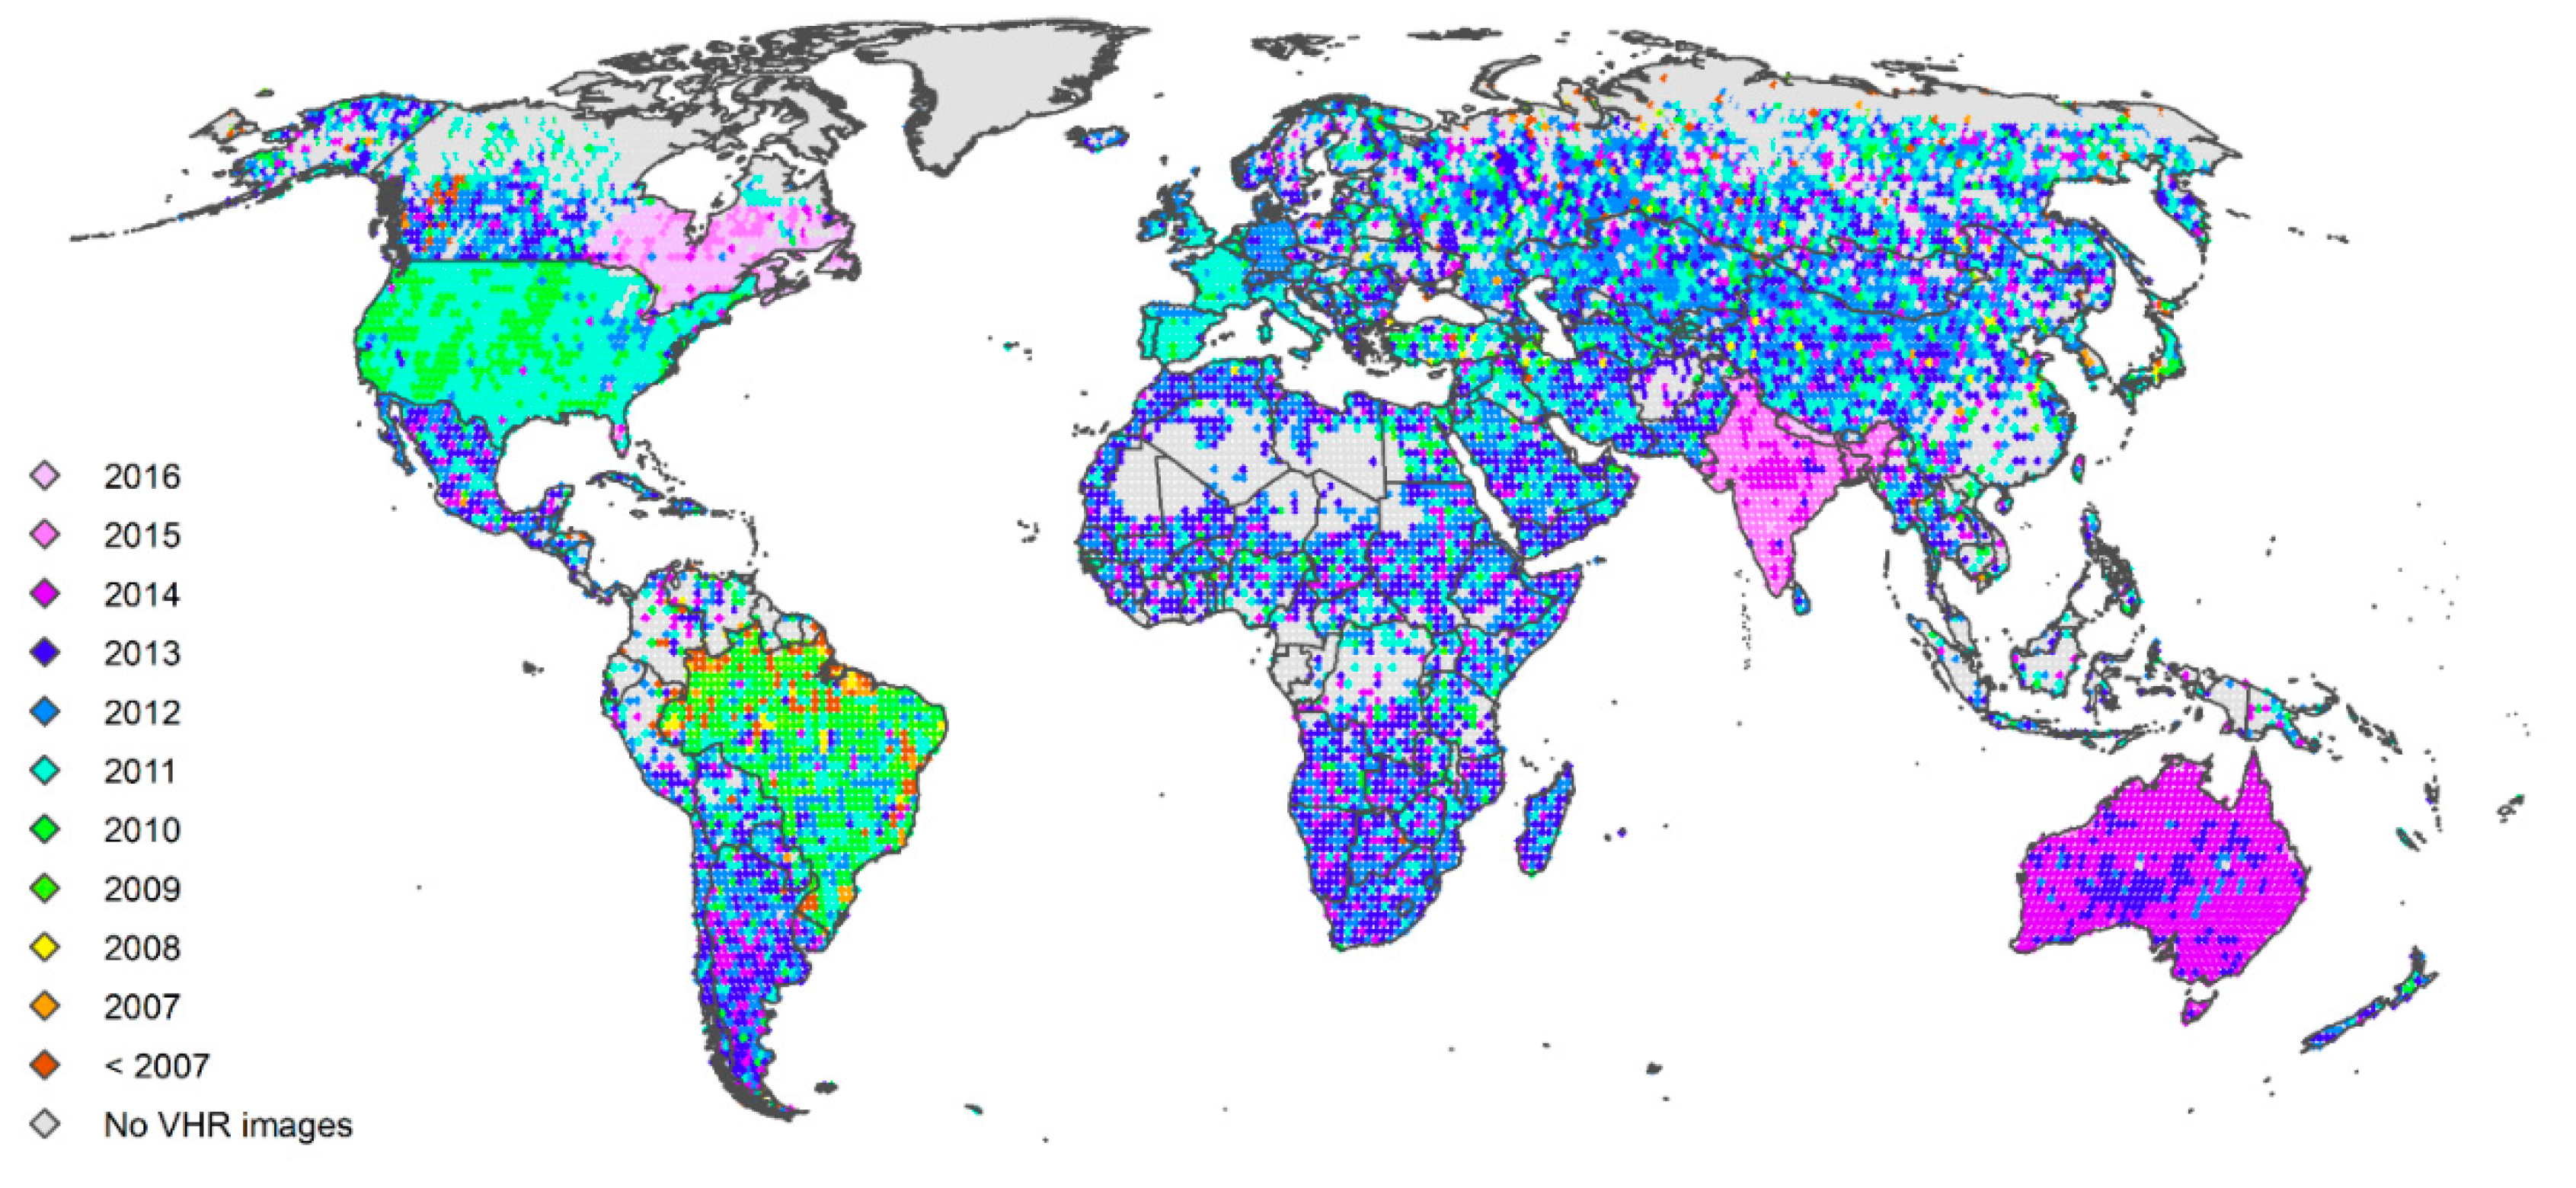
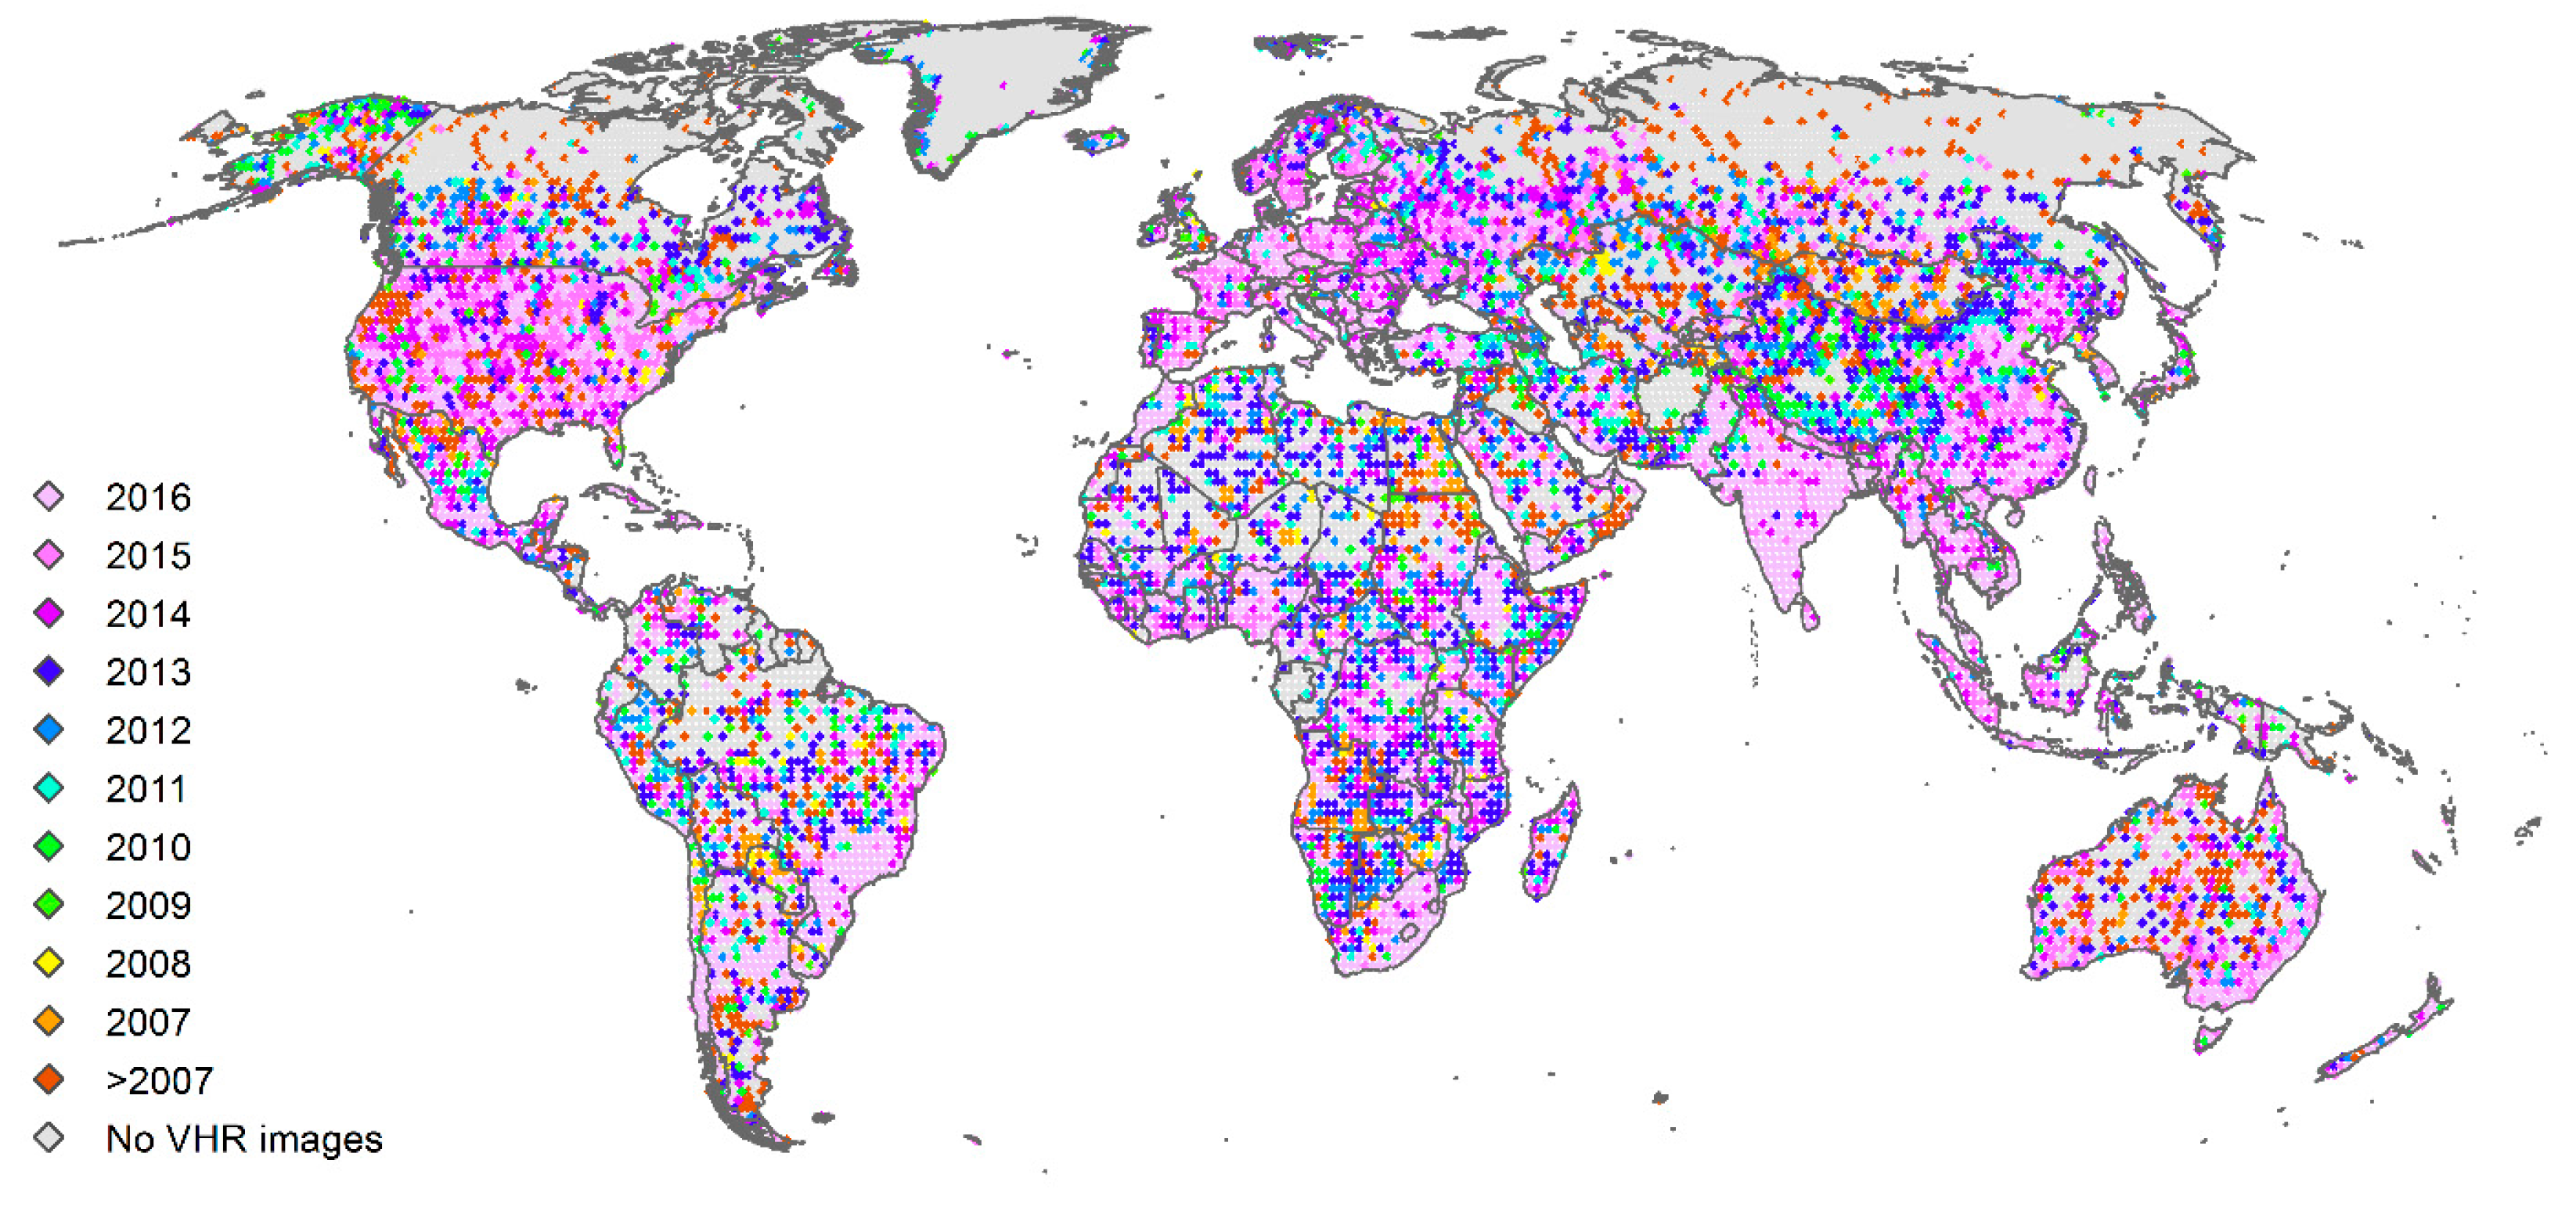
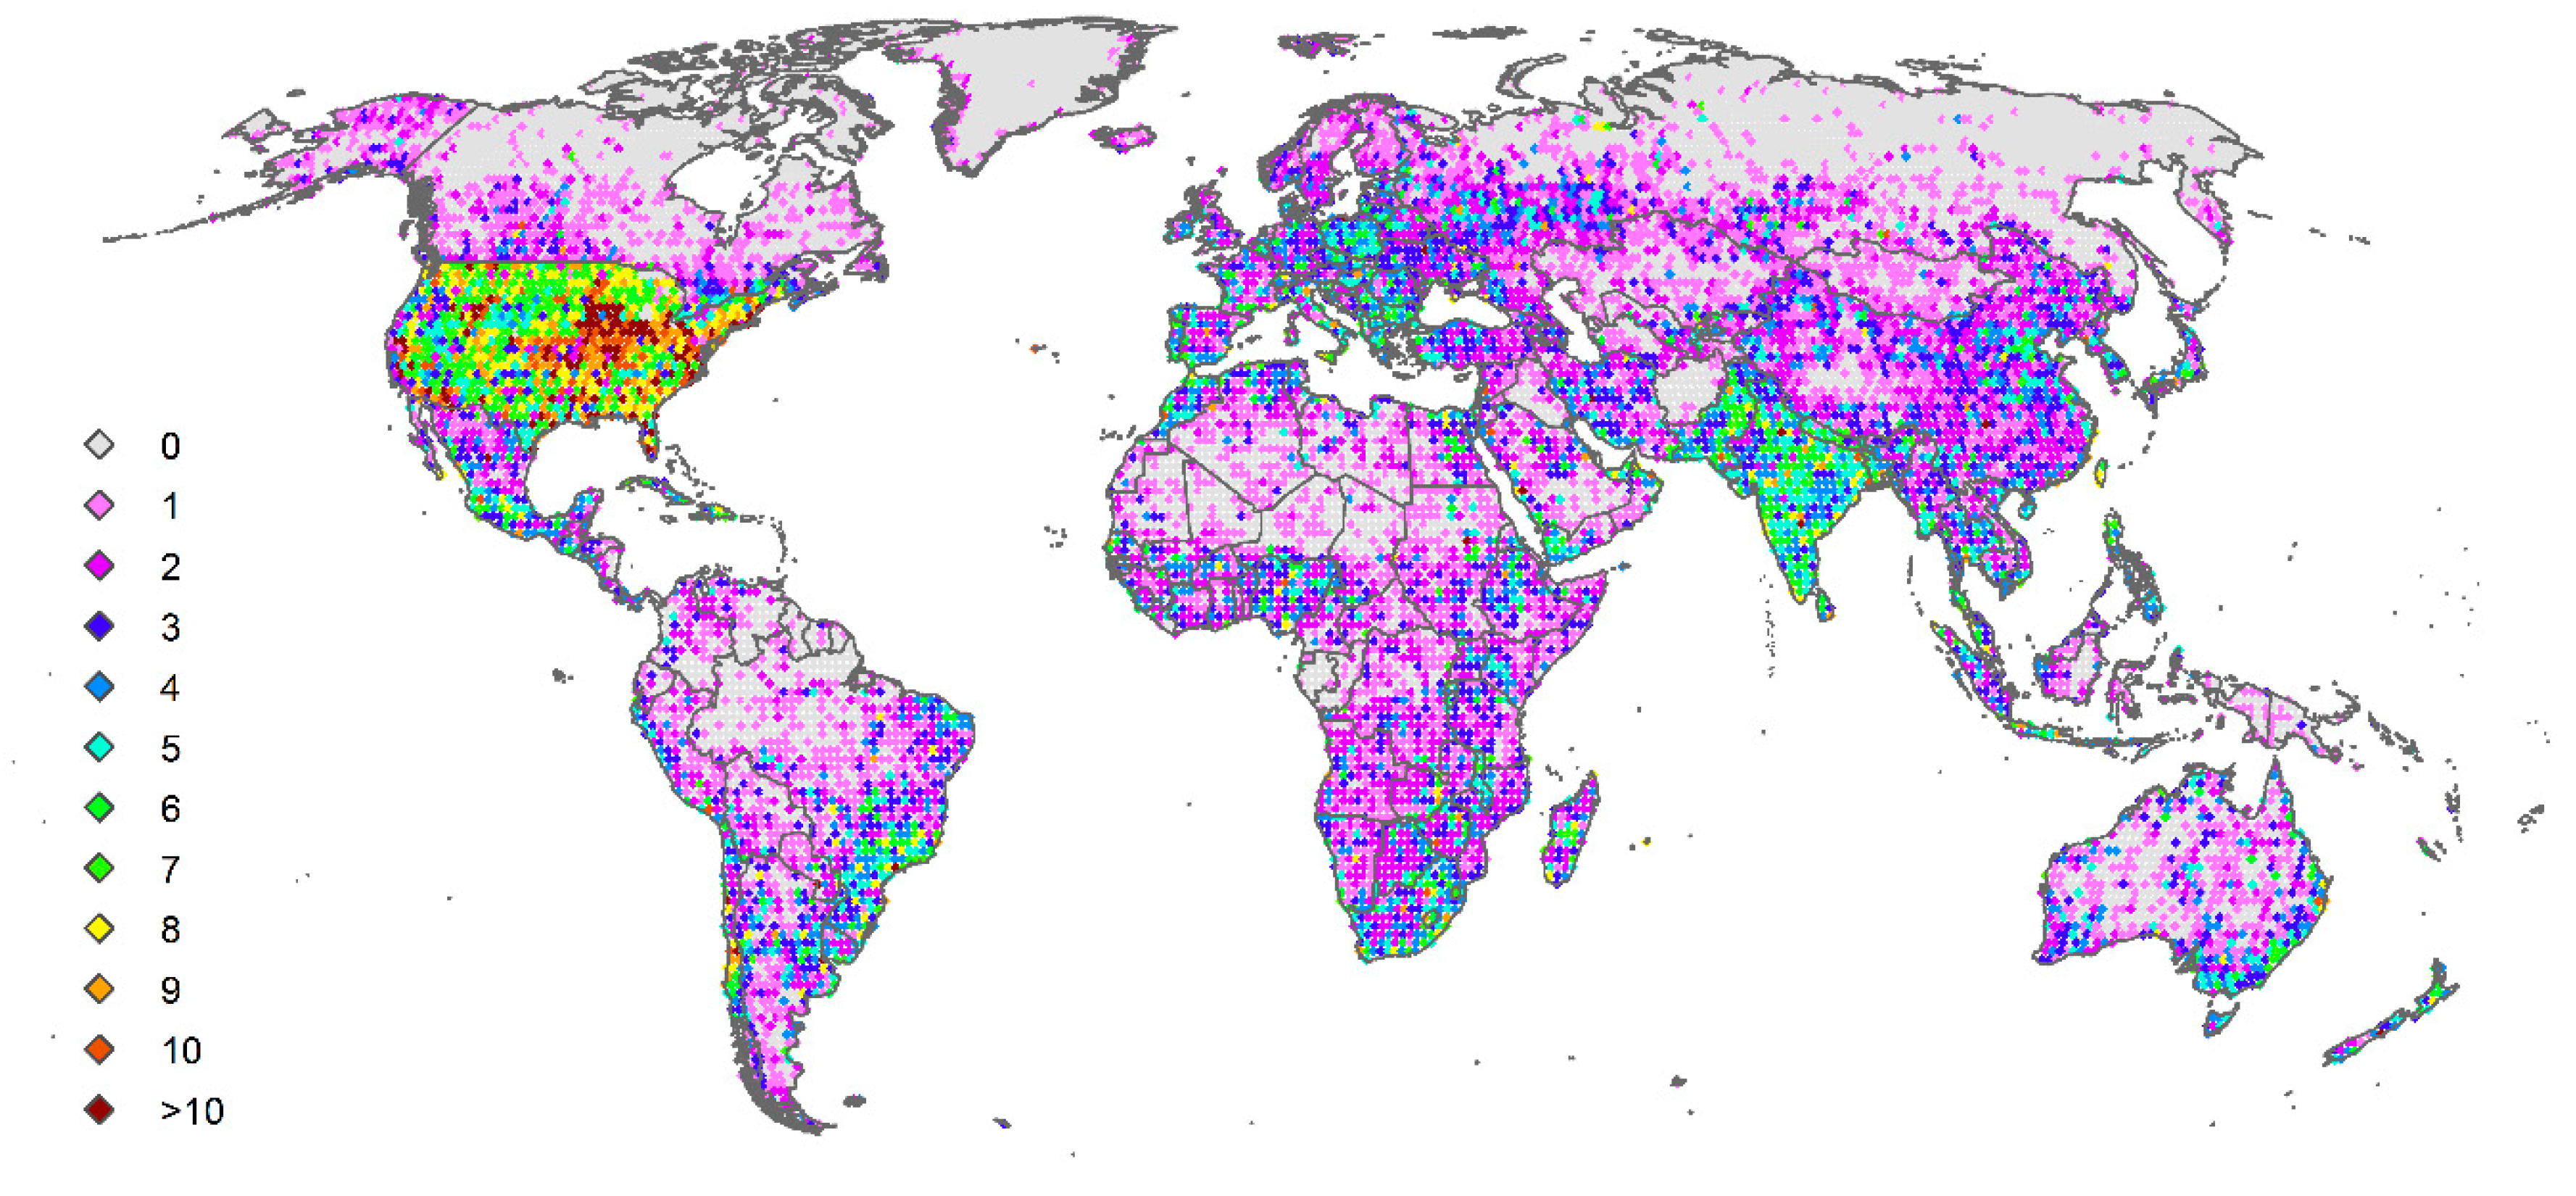
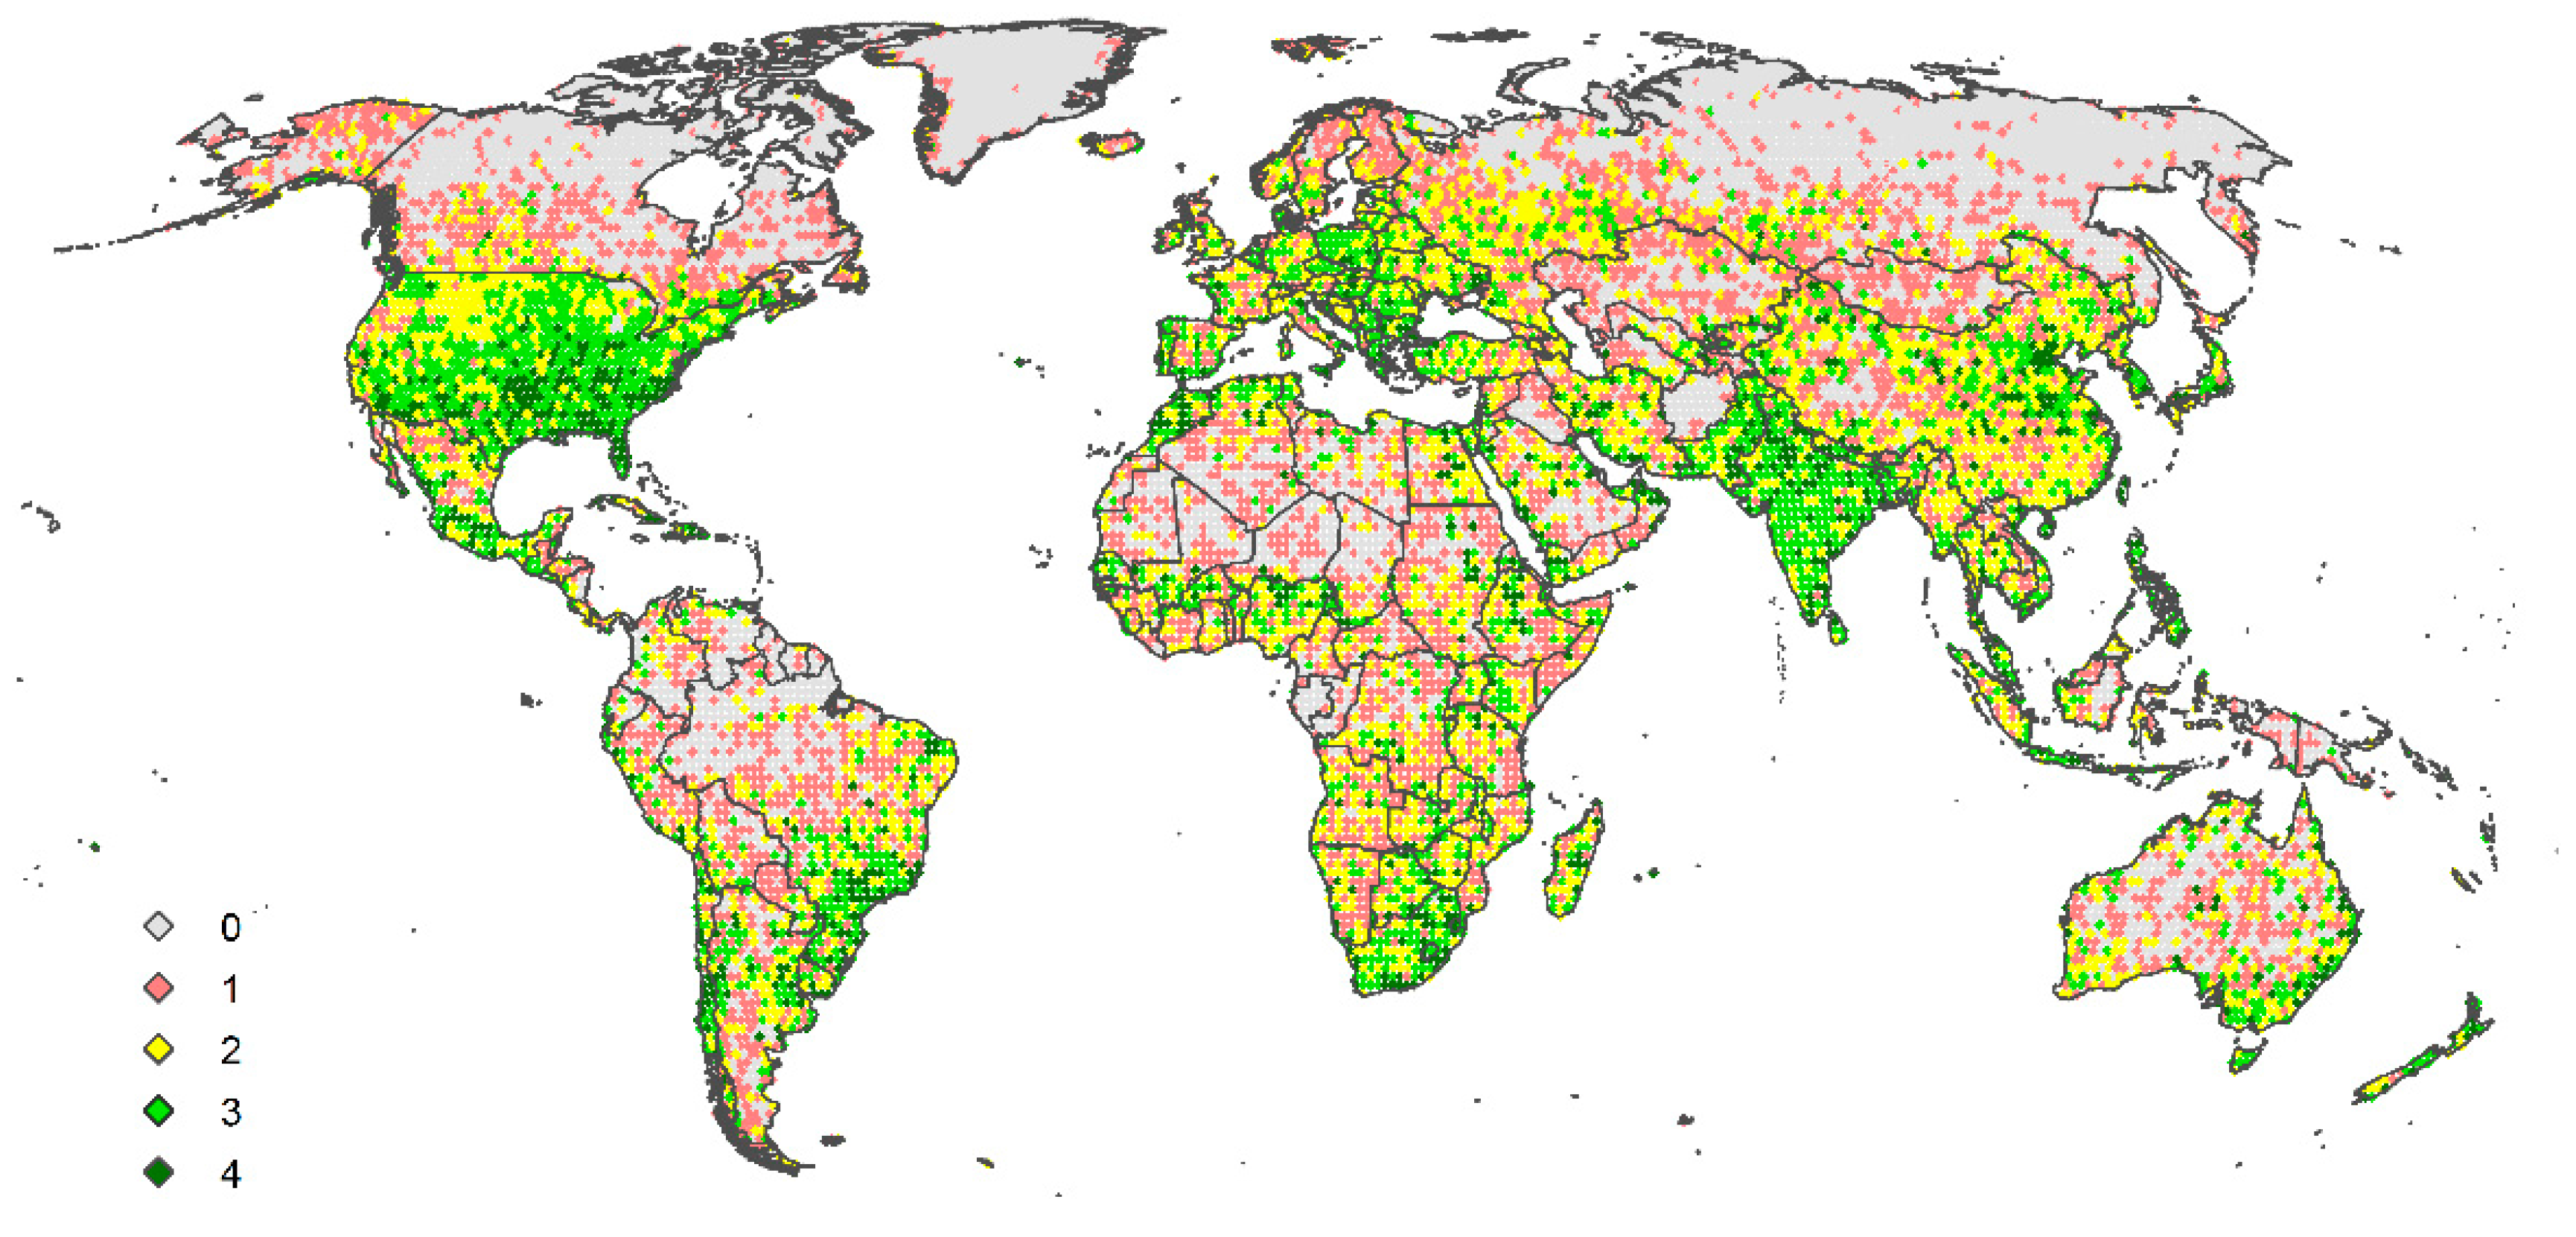
2.2. Spatial-Temporal Patterns of the Image Dates

The spatial distribution of the image dates from Microsoft Bing Maps and Google Earth was plotted globally. For Microsoft Bing Maps, this corresponds to the imagery available as of 11 January 2017 while for Google Earth, this was the most recent date at each location. A comparison between Microsoft Bing Maps and Google Earth was then made showing different attributes including: (i) the locations where there is no difference in the image dates between Microsoft Bing Maps and Google Earth; (ii) the locations where either Microsoft Bing Maps or Google Earth has the most recent imagery; and (iii) the locations where only Microsoft Bing Maps or Google Earth are available.
A number of additional maps were plotted for Google Earth imagery because of the availability of the historical imagery. The first is the number of historical images available in Google Earth, which shows those regions with abundant time series and those with a lack of historical information. The vector of imagery dates at each location was then queried to extract a set of indicators, as outlined in Table 1.
The image dates were then summarized by region, i.e., at the sub-continental level (Figure S7), to calculate the percentage of grid points containing VHR imagery and the recent date occurring most frequently in these regions. For Google Earth, additional indicators were calculated including the average number of images per grid point, the average number of unique years per grid point and the average difference between the oldest and the most recent date (Table 1).
Finally, the Pearson correlation coefficients between the number of images available in Google Earth and population density (as a proxy for urban areas) was calculated (Table S1) where the number of images in each 250 m2 grid cell was extracted. Population density was obtained from the Global Human Settlement Population Grid for the year 2015 and has been produced by the Joint Research Centre of the European Commission [15]. The idea was to determine if there is a bias in the amount of VHR imagery in urban areas.

2.3. Availability of Very High Resolution (VHR) Images in Protected Areas

The World Protected Areas data set from the United Nations Environment Programme World Conservation Monitoring Centre (UNEP-WCMC) [16] contains the boundaries of protected areas globally. This layer was used to extract those sample points that fell within protected areas of all categories (from most to least protected), which were then disaggregated by major world region. The percentage of sample points with VHR imagery in Google Earth and Microsoft Bing Maps was then calculated along with the median of the date of the imagery in Microsoft Bing Maps and the most recent and oldest dates in Google Earth (Table 1). The average number of images in Google Earth was then calculated by region along with the number of unique years and the average number of seasons per location.

2.4. Availability of VHR Images in Areas with High Rates of Deforestation

To examine the availability of VHR images in areas with high deforestation, we selected regions that have the highest forest cover change according to the UN Food and Agriculture Organization’s (FAO) Global Forest Resources Assessment in 2015 [17]. In particular, we chose:
  • Regions where crop expansion is the main driver of forest loss, i.e., the Amazon, the Congo basin, Indonesia and Malaysia; and
  • Developed countries with intensive forest management: i.e., Sweden and Finland.
The sample points falling in the regions listed above were then extracted from the full data set. A forest mask [18] was used to determine the number of sample points that fall within forest areas. We then calculated the percentage of VHR images in Google Earth and Microsoft Bing Maps by region in forest areas along with the most frequent year of the imagery for Microsoft Bing Maps, the most frequent oldest and most recent imagery in Google Earth as well as the average and unique number of images in Google Earth (Table 1).

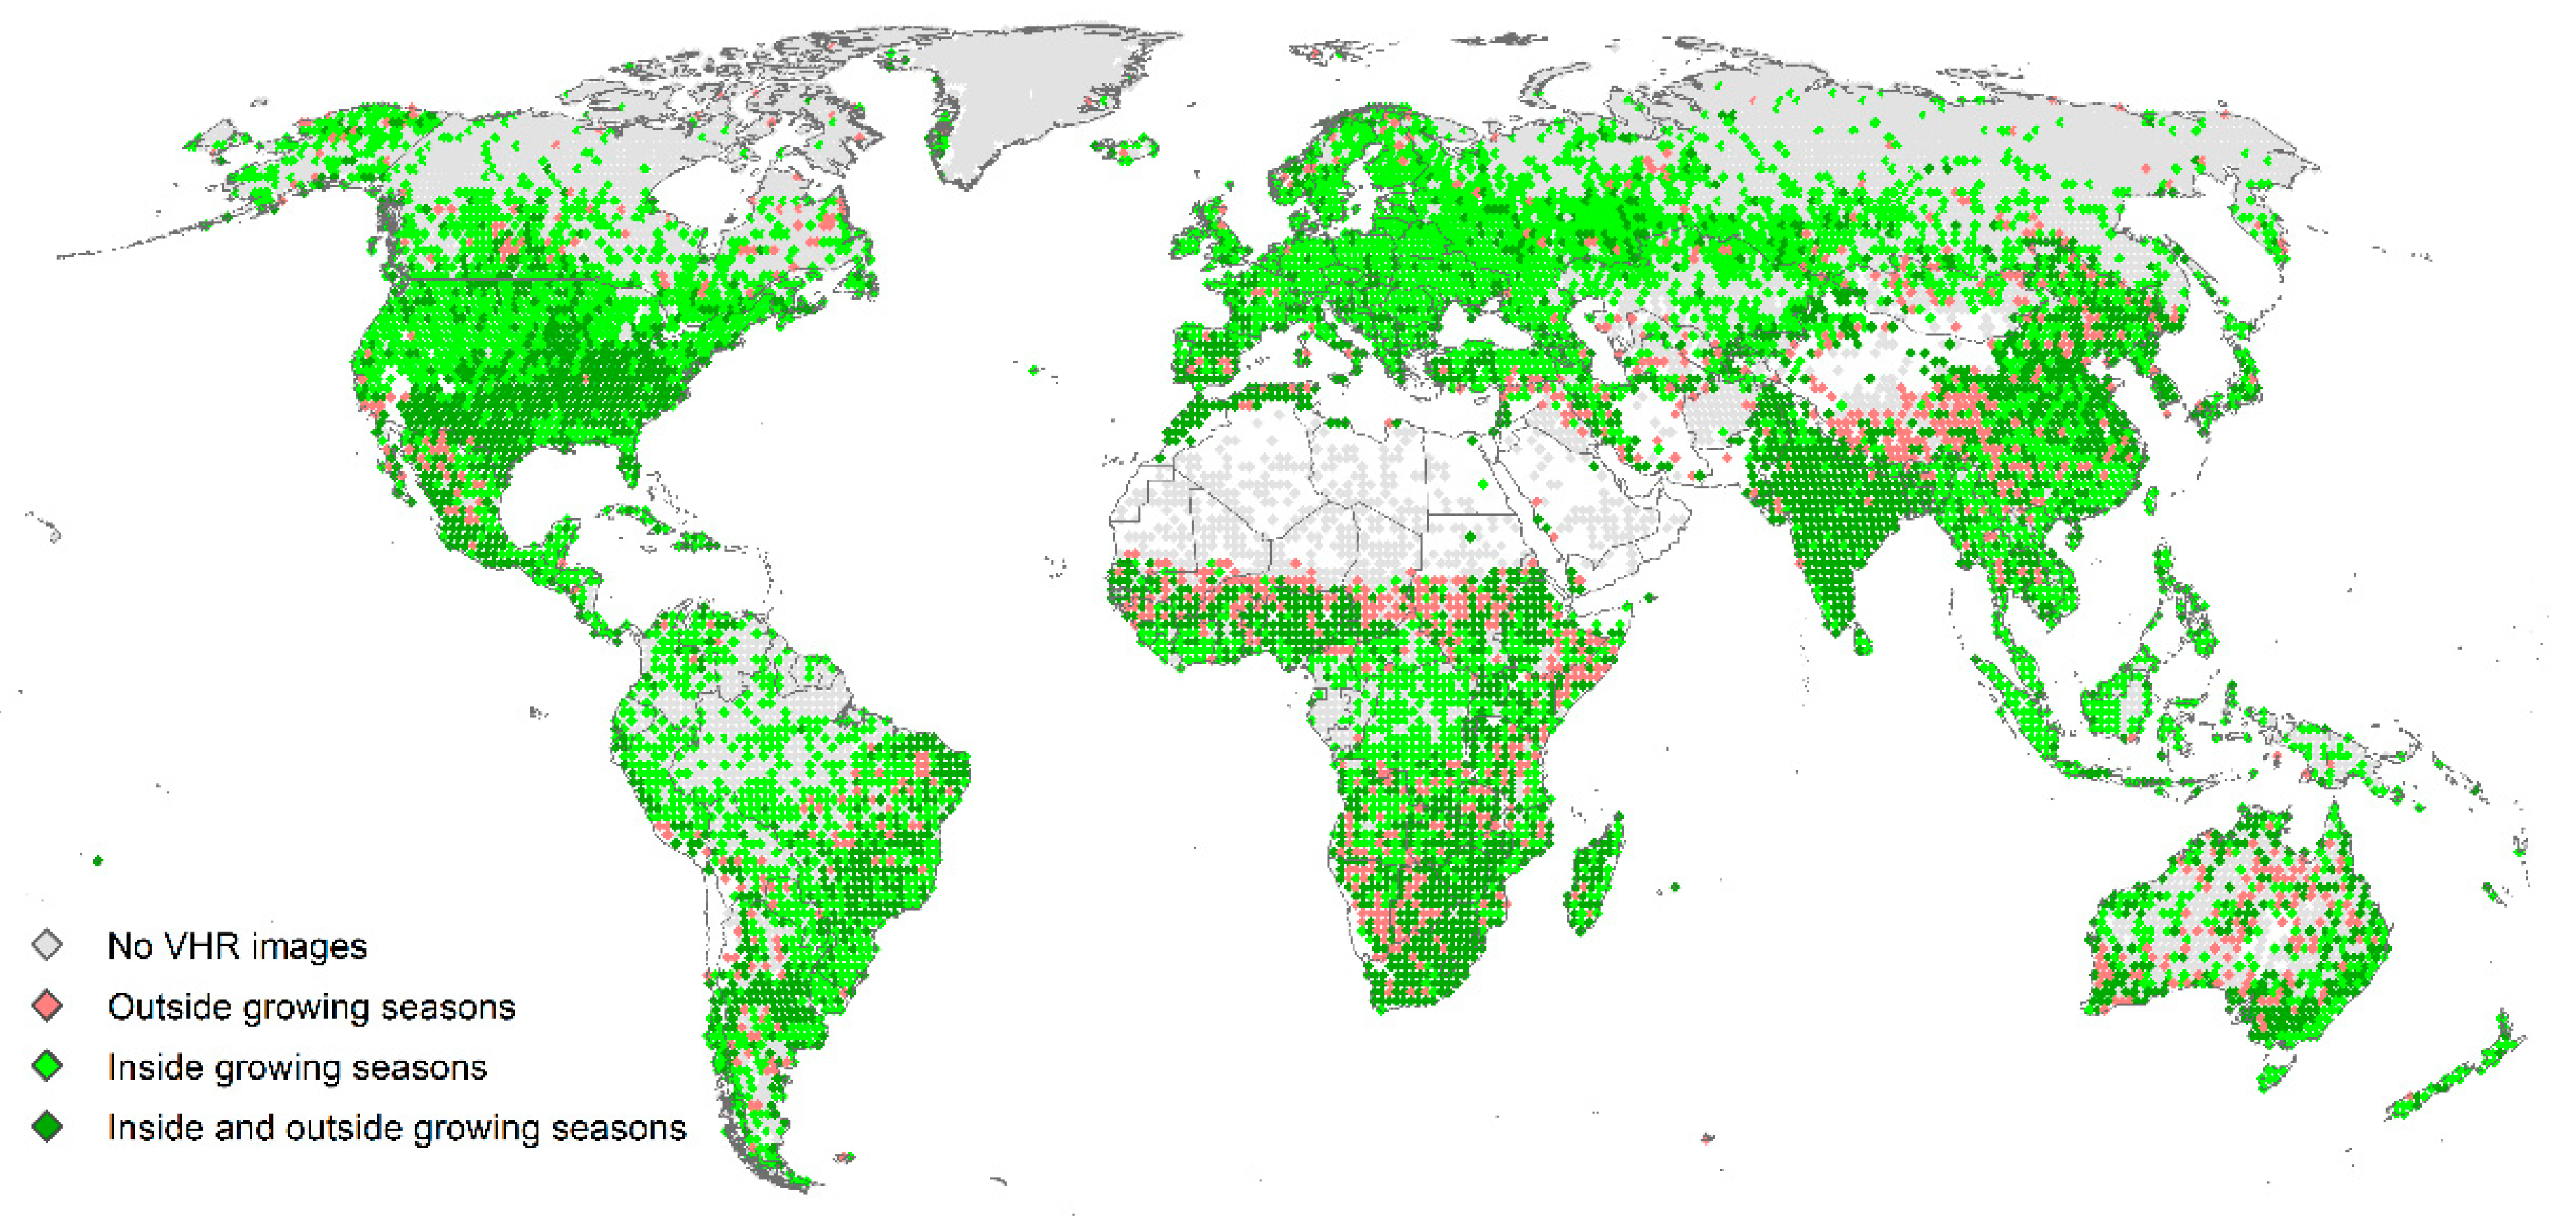
2.5. Availability of VHR Images in Areas with Cropland

Visual interpretation of VHR imagery in the context of cropland can differ based on whether the image falls inside or outside of a growing season. We used the MEaSUREs (the NASA Making Earth System Data Records for Use in Research Environments) Vegetation Index and Phenology (VIP) Global Data Set, produced by NASA [19], which contains information for a range of different phenological metrics at a 0.05 degree resolution. The relevant measures extracted from this product at the sample locations included the number of growing seasons and their start and end dates. We then compared the dates of the imagery with the growing season dates to determine if the imagery at a sample location falls in or outside of a growing season or whether imagery is available for both cases. This information is relevant for applications related to cropland monitoring, where image interpretation would benefit from having scenes both inside and outside of a growing season.
We then selected a list of countries to examine the availability of VHR images in cropland areas in more detail. The criteria used for selection were the following:
  • Countries with poor cropland monitoring systems, identified as countries with the highest food security risks [20], i.e., Angola, Chad, Ethiopia, Mongolia, Mozambique and Namibia;
  • Countries with a large cropland expansion or cropland loss since 2000, i.e., Nigeria, Indonesia, Brazil, Argentina, Tanzania, Australia, India and Sudan based on FAO statistics and a recent study on risks to biodiversity due to cropland expansion and intensification [21];
  • The USA, which was chosen because it has the best coverage of VHR imagery.
The sample points falling in the countries listed above were then extracted from the full data set and divided into two subsets based on whether the points fall inside or outside of a cropland area. The Unified Cropland Layer produced for global agricultural monitoring at a resolution of 250 m [22] was used as a cropland mask to differentiate between areas of cropland presence or absence. The number of locations with VHR images was then calculated along with the most frequent year in both Google Earth and Microsoft Bing Maps, as well as the total and unique number of images in Google Earth (see Table 1).

2.6. Availability of VHR Images in Urban Areas

Using the layer of urban and rural areas developed by the Joint Research Center (JRC) at a 1 km2 resolution [23], the number of locations with VHR images falling in these two classes was calculated, along with the average number of unique years in Google Earth, the most frequent oldest and most recent images in Google Earth and the most frequent year in Microsoft Bing Maps.

2.7. Software Used

All of the analysis in the paper has been done using the R statistical package and all the figures were prepared using ESRI’s ArcMap v.10.1 GIS software.

3. Results

3.1. Spatial-Temporal Distribution of VHR Satellite Images

Figure 2 and Figure 3 show the spatial distribution of the most recent dates of VHR satellite imagery available in Microsoft Bing Maps and Google Earth, respectively, while Figure 4 provides a comparison of the two. Interestingly, one can observe discontinuities at political borders in Microsoft Bing Maps, in particular, at the boundaries between the US and Canada and the US and Mexico, Brazil with all neighboring countries, India with all neighboring countries, western Europe with Central Europe, and Australia separated by the oceans (Figure 2). In Canada, two provinces, Ontario and Quebec, are covered with more recent imagery than the rest of the territory (Figure 2). In general, the most recent imagery in Microsoft Bing Maps (Figure 2) from 2016 can be found in eastern Canada, some cities in Australia, India, Nepal and Bangladesh. Imagery from 2014 and 2015 is predominantly found in Australia and India while there is a reasonable coverage of the rest of the world with images from 2009 to 2013. Microsoft Bing Maps are not available in much of Indonesia and Papua New Guinea, eastern China, some of the Congo Basin and at northern latitudes. Some older imagery (2002 to 2008) can be found in parts of Brazil and neighboring countries.
In contrast, imagery from Google Earth is generally more recent than Bing imagery. In Google Earth (Figure 3), continuous areas of very recent imagery (2016) can be found in India, parts of South America and some African countries. There is a noticeable lack of VHR imagery in the northern latitudes, parts of the Amazon and desert areas. This is particularly evident for Australia, where Microsoft Bing Maps is either the only source of VHR imagery or contains the most recent imagery (Figure 4). The coverage of the Amazon is also much better in Microsoft Bing Maps than it is in Google Earth.
A regional analysis of the availability of VHR imagery in both Google Earth and Microsoft Bing Maps is provided in Table 2. The coverage of VHR imagery is very high for both Google Earth and Microsoft Bing Maps for Central America, southern and western Europe, and eastern and southern Africa but as observed previously from Figure 2 and Figure 3, Google Earth tends to be more recent than Microsoft Bing Maps, i.e., 2016 for Google Earth versus 2011/2013 for Microsoft Bing Maps. Similar high coverage can be found in eastern and southern Asia for both, but the dates of Google Earth and Microsoft Bing Maps are similar.
The results also confirm the previous findings that VHR imagery is available for almost all of Australia and New Zealand when considering Microsoft Bing Maps while the coverage is lower (70%) for Google Earth; the dates are also similar although slightly more recent for Google Earth. Microsoft Bing Maps coverage is also better than Google Earth for South America, and western and Central Asia.
The worst coverage can be found in North America, where only half the area is covered by VHR imagery in both Google Earth and Microsoft Bing Maps, and eastern Europe, where Google Earth has only 39% VHR imagery and Microsoft Bing Maps has 58%. This is probably due to the fact that these regions cover high northern latitudes, where there is lower availability of VHR imagery (Figure 4). In contrast, Google Earth has better coverage in northern European, south-eastern Asia and middle Africa compared to Microsoft Bing Maps.
Overall, Google imagery is more recent than Microsoft Bing Maps but Microsoft Bing Maps provide spatial complementarity to Google in South America, Australia, New Zealand and the northern part of eastern Europe. North America, southern Europe, southern Africa, and southern and south-eastern Asia have the richest archive of images, while eastern and northern Europe, Central Asia, northern and Central Africa have mostly only one or two images per location.
As some of the historical images are from the same year, Figure 5 shows the number of unique years for which VHR imagery is available in Google Earth. The areas with the most imagery available are the USA, India, parts of Eastern Europe and Indonesia, and some of the more populated regions across all the continents, e.g., the southern part of Brazil, the eastern coast of Australia and the south-eastern part of South Africa. Overall, the majority of the world is covered by only 1 to 3 images per location, which may explain why there is only a medium correlation between population density and the number of images in the regions of northern Africa (r = 0.46, p-values < 0.001), South America (r = 0.40, p-values < 0.001), Western Asia (r = 0.38, p-values < 0.001), and eastern Europe (r = 0.29, p-values < 0.001) (Table S1) and low or no correlations in the rest of the world. Similar spatial patterns were found when plotting the total number of VHR images available in Google Earth (Figure S8).
Seasonal patterns are also evident in the historical archive of Google Earth. Figure 6 shows the availability of VHR imagery according to the number of seasons represented. Very few places have imagery from all 4 seasons (winter, spring, summer and autumn) while 3 seasons are available in majority of the USA, India and eastern Europe, mirroring the pattern found for the number of images.
We now examine the availability of VHR imagery in relation to four domains where such imagery has value for environmental monitoring, i.e., monitoring of protected areas; monitoring of areas that have high rates of deforestation; monitoring areas with cropland, where the latter application has relevance for food security; and monitoring urban areas.

3.2. Availability of VHR Images for Monitoring Protected Areas

Table 3 summarizes the availability of VHR images inside protected areas [16] by major world region. Greenland has been excluded from this analysis due to the absence of VHR images in this area. The coverage of protected areas in Microsoft Bing Maps is better than Google Earth for most regions except for Africa and western, southern and northern Europe, where it is only slightly lower. The comprehensive coverage by Microsoft Bing Maps in Australia and New Zealand is again evident when compared to Google Earth while coverage in South America and eastern Europe are considerably lower in Google Earth compared to Microsoft Bing Maps. Google Earth images are generally more up-to-date than Microsoft Bing Maps, have an average of at least 3 images per location, and cover at least 2 different seasons.

3.3. Availability of VHR Images for Monitoring Deforestation

Table 4 illustrates the availability of VHR imagery within selected regions that have the highest forest cover change based on the FAO’s Global Forest Resources Assessment 2015 [17]. There is good spatial coverage by Microsoft Bing Maps in the Amazon and the Congo basin although temporally, there is only one image available on average at these locations. Moreover, the most recent, frequent year found is 4 to 6 years old. In contrast, Google Earth has relatively poor coverage in the Amazon and only 1 image available on average with similar years. For the Congo basin, the coverage is better but still poorer than Microsoft Bing Maps and only 1 unique image is available on average. For the other regions, the availability of Google Earth VHR imagery is quite good although only 2 unique years are available on average and the images are more recent than Microsoft Bing Maps.

3.4. Availability of VHR Imagery in Cropland Areas

To monitor cropland, particularly the presence of annual crops that can appear quite differently on satellite imagery depending on the growing season, it is useful to know the availability of VHR imagery both inside and outside of a growing season, which is shown in Figure 7. The distribution shows that most of the images are either taken during the growing season or there is imagery available both inside and outside of this period. Areas with imagery available only outside of the growing season can be found in the transition zones between desert and agricultural areas in the Sahel, and in the desert areas of Australia and western China, where there is less agriculture.
For the countries selected as having either poor cropland monitoring or large expansion or loss of cropland since 2000, the availability of VHR imagery is shown in Table 5. The USA is also added as a contrast since it has large areas of cropland and good availability of VHR imagery (Figure 7). The results show that the cropland areas in these countries are covered by more than 90% VHR imagery in Google Earth. The only country for which no VHR imagery is available is Mongolia, which is unsurprising given its location in the high northern latitudes where minimal VHR imagery tends to be available. Table S2 also shows that in some countries such as Ethiopia, Namibia, Nigeria, Indonesia, Tanzania and Australia, there are more images available in cropland versus non-cropland areas.
Microsoft Bing Maps are generally older than Google Earth’s most recent imagery but all countries have 2 or more historical images available in Google Earth; some countries even have 5 or more images available, which span more than one season in a given year. Both the USA and India have the most images available in cropland areas although images from more unique years are available for the USA.

3.5. Availability of VHR Imagery for Monitoring Urban Areas

Table 6 presents the distribution of sample locations that fall within urban and rural areas [23]; the majority of sample points fall outside of these two classes in unpopulated areas and are not shown here. Of those falling in urban areas, coverage is 100% in Google Earth and still high in Microsoft Bing Maps (87%). In rural areas the coverage is lower but nevertheless good at around 80% for both Google Earth and Microsoft Bing Maps. For urban areas, the number of unique years is 6, with a broad range of older and more recent imagery in Google Earth. Hence it is possible to use the imagery for some change detection in urban areas using visual interpretation or for validation of remotely-sensed urban products. Microsoft Bing Maps tend to be older than the most recent Google Earth imagery but may add additional information for change detection or validation purposes.

4. Discussion

The results have shown that there is clearly unequal spatial and temporal coverage by VHR imagery across the globe. There are parts of the world that have no VHR imagery, i.e., high northern latitudes, countries in the north-western part of South America, e.g., Afghanistan, Ecuador and Colombia, parts of the Saharan Desert, parts of the Congo Basin and Indonesia/Papua New Guinea. Hence it is difficult to do any monitoring in these areas since there is only Landsat panchromatic (15 m resolution) base imagery available. In the rest of the world there is some spatial complementarity between Google Earth and Microsoft Bing Maps, e.g., there are only Microsoft Bing Maps present in parts of Canada, the Amazon, former Soviet Union countries and parts of Australia where Google Earth has no coverage. In contrast, Google Earth imagery adds very little additional spatial coverage but tends to be more recent than Microsoft Bing Maps and has the benefit of a historical archive, which adds potential value for change detection and monitoring purposes using visual interpretation. However, the reality is that for applications where a time series of images would greatly benefit monitoring, the amount of historical imagery is actually quite small.
We then focused on four applications where the use of VHR satellite imagery would greatly benefit monitoring and change detection, i.e., protected, forested, cropland and urban areas. Due to increased competition for land [24], protected land areas are threatened, impacting biodiversity and natural resources [16,25]; hence monitoring is vital. The availability of VHR imagery in protected areas was surprisingly poor in North America, eastern Europe and South America, particularly in Google Earth within the latter two regions. On average there are only 2 to 3 historical images in different years; hence monitoring is possible in some parts of the world but it is limited.
For deforestation, the picture is worse, particularly in a region such as the Amazon. Although coverage by Microsoft Bing Maps is relatively good, less than 50% of the points falling in the Amazon biome were covered by VHR imagery in Google Earth, with on average only 1 year of imagery. Thus, there is a clear lack of information in the historical archive for monitoring change. The spatial-temporal coverage is better for Indonesia and Malaysia where there are three images on average in different years in Google Earth while most of the other regions have 2 years on average. Although new tools and products for monitoring deforestation have appeared recently, e.g., through Global Forest Watch, the basis of change detection is Landsat imagery, which still requires validation with VHR imagery.
For studies in crop expansion or abandonment and urbanization, the availability of suitable VHR imagery is much better. The coverage by VHR imagery in countries with poor crop-monitoring systems, i.e., those currently subject to cropland expansion and losses, and those areas classified as urban is extremely high. There are time series of images available, and for cropland, images from more than one season. Hence there is quite some potential for using this resource for change detection in cropland and urban areas and the validation of remotely-sensed products.
From the Scopus search and the breakdown by discipline (Figures S1 and S2), the increasing value of Google Earth and Microsoft Bing Maps is evident. Figures S1 and S5 confirm the increasing use of imagery from Google Earth and for validation tasks in remote sensing, respectively, while new crowdsourced reference data sets based on Google Earth and Microsoft Bing Maps are appearing [8,26]. The collection of in situ data is resource intensive, both in terms of time and money, e.g., the LUCAS (Land Use Cover Area frame Survey) data set represents the only source of in situ data for European Union (EU) member countries where ca 300 K points are surveyed on the ground every 3 years [27]. The implementation in 2018 alone will cost more than 12 million euros [28]. Hence the visual interpretation of VHR imagery (via Google Earth and Microsoft Bing Maps) has become a more cost-effective approach for building reference data sets for the validation of land cover and land-use maps, as well as inputs to the training algorithms that create these products. Hence from an environmental and research perspective, it is important that access to these data sources continues and that gaps in VHR imagery are filled where possible. The costs of purchasing data from providers such as Digital Globe are high although it should be noted that the Digital Globe Foundation does provide data grants for academic purposes. Moreover, we are increasingly moving away from the development of static products of land cover and land use and are interested in detecting change over time, e.g., forest loss and gain over time [29] or monitoring the change in water bodies over a 32 year period [30]. Figure S6 shows that the majority of papers are using imagery from different time periods, which reflects this trend. As new land-cover products appear, e.g., the recent ESA CCI (European Space Agency Climate Change Initiative) land cover time series from 1992–2012, access to VHR imagery for validation of land cover change is vital, particularly if users want to independently validate the product for their own user needs. The spatial-temporal metadata on the image dates and the availability of VHR imagery presented here can be used to guide sample design for validation of land-cover time series. However, this is only an overview in time so having a new API for accessing the dates of imagery in Google Earth as well as other meta-information about the satellite imagery would be extremely useful for a range of applications. Unfortunately, at present, users can only collect such metadata manually with the help of open access tools such as Collect Earth or LACO-Wiki. We acknowledge this as a current limitation but as this field is changing rapidly, this situation may improve in the future. A very good example are the tools provided by Copernicus and the company Sinergise, which were developed to collect and analyze satellite imagery, in particular the open access Sentinel images at 10 m resolution [31,32].
At the same time, there are encouraging initiatives to improve the availability and accessibility of VHR imagery in the private sector, e.g., the satellite company Planet has 149 of their small dove satellites orbiting the Earth, which together provide daily coverage of the Earth’s land surface at a 3 to 3.5 m resolution. Free access to 10,000 km2 of VHR imagery per month is available for non-commercial purposes [33]. The Radiant Earth initiative from the Bill and Melinda Gates Foundation and the Omidyar Network is making a considerable amount of satellite imagery free for humanitarian and environmental causes [34]. Moreover, as mentioned previously, Digital Globe provides grants for academic access. Most of the value in VHR satellite imagery is in the up-to-date nature of the information. Commercial image providers should be encouraged to unlock their historical archives, where the information has much less commercial value, and share the imagery via applications such as Google Earth. Not only does this benefit research, it can aid environmental monitoring by many different stakeholders in the public sector as well as non-governmental organizations and charities. New applications can be built to mobilize citizens to aid in change detection, which can help tackle many pressing environmental problems. The value of VHR satellite imagery available through Google Earth and Microsoft Bing Maps should not be underestimated but it has the potential to be so much more.

Supplementary Materials

The following are available online at https://www.mdpi.com/2073-445X/7/4/118/s1, Figure S1: The number of scientific documents that mention the search terms “Google Earth” or “Microsoft Bing imagery” in Scopus® (n = 5756) from 2005 to 2016. Figure S2: The distribution of documents by subject area that appear in Scopus® from the period 2005 to 2016 containing the search terms “Google Earth” or “Microsoft Bing imagery”. Figure S3: The number of scientific documents found in Scopus® that mention the search terms “Google Earth” or “Microsoft Bing imagery” and additionally contain the search terms “Validation”, ”Visualization” or “Calibration” in the abstract (n = 372) from 2006 to 2016 to focus in on paper in the field of remote sensing. Figure S4: Documents using Google Earth imagery for remote sensing purposes broken down by purpose or thematic area (n = 102). Figure S5: Documents using Google Earth imagery for remote-sensing purposes broken down by different remote sensing activities (n = 96). Figure S6: Range of images reported as employed in studies using Google Earth imagery for remote sensing (n = 80). Figure S7: World regions from FAO. The Global Administrative Unit Layers (GAUL, FAO Global Administrative Unit Layers (GAUL). Figure S8: The number of VHR historical satellite images (<5 m resolution) available in Google Earth. Table S1: Correlation (Pearson correlation coefficient) between the number of images at a location and the population density, reported by FAO world region ranked in ascending order by positive correlation. Table S2: Availability of VHR imagery inside and outside of cropland areas for selected countries. The shaded countries indicate those locations where more imagery is available in areas of cropland compared to those falling outside.

Author Contributions

M.L. conceived the original idea and did the analysis in the paper. L.S. wrote the manuscript with contribution from all authors. L.S., J.C.L.B., D.S. and S.F. provided suggestions for different analyses and wrote the paper with M.L. J.C.L.B. undertook the Scopus search and subsequent analysis. T.S. and M.K. programmed the data collection from Google Earth and Microsoft Bing Maps. I.M. (Inian Moorthy) and I.M. (Ian McCallum) provided recommendations for improvements to the paper and additional editing.

Funding

This research has been supported by the FP7-funded ERC project CrowdLand (No. 617754) and the EU Horizon2020 project LandSense (No. 689812).

Conflicts of Interest

The authors declare no conflict of interest. The funders had no role in the design of the study; in the collection, analyses, or interpretation of the data; in the writing of the manuscript, or in the decision to publish the results.

References

  1. Biradar, C.M.; Thenkabail, P.S.; Noojipady, P.; Li, Y.; Dheeravath, V.; Turral, H.; Velpuri, M.; Gumma, M.K.; Gangalakunta, O.R.P.; Cai, X.L.; et al. A global map of rainfed cropland areas (GMRCA) at the end of last millennium using remote sensing. Int. J. Appl. Earth Obs. Geoinf. 2009, 11, 114–129. [Google Scholar] [CrossRef]
  2. Bontemps, S.; Defourny, P.; van Bogaert, E.; Arino, O.; Kalogirou, V.; Perez, J.R. GLOBCOVER 2009: Products Description and Validation Report 2011; Medias France: Paris, France, 2011. [Google Scholar]
  3. Tsendbazar, N.; Herold, M.; Lesiv, M.; Fritz, S. Validation Report of Moderate Dynamic Land Cover, Collection 100M, Version 1; Wageningen University and Research: Wageningen, The Netherlands, 2017; p. 67. [Google Scholar]
  4. Lesiv, M.; Fritz, S.; McCallum, I.; Tsendbazar, N.; Herold, M.; Pekel, J.-F.; Buchhorn, M.; Smets, B.; Van Der Kerchove, R. Evaluation of ESA CCI Prototype Land Cover Map at 20 m; International Institute for Applied Systems Analysis: Laxenburg, Austria, 2017. [Google Scholar]
  5. Esch, T.; Bachofer, F.; Heldens, W.; Hirner, A.; Marconcini, M.; Palacios-Lopez, D.; Roth, A.; Üreyen, S.; Zeidler, J.; Dech, S.; et al. Where we live—A summary of the achievements and planned evolution of the global urban footprint. Remote Sens. 2018, 10, 895. [Google Scholar] [CrossRef]
  6. Fritz, S.; McCallum, I.; Schill, C.; Perger, C.; See, L.; Schepaschenko, D.; van der Velde, M.; Kraxner, F.; Obersteiner, M. Geo-Wiki: An online platform for improving global land cover. Environ. Model. Softw. 2012, 31, 110–123. [Google Scholar] [CrossRef]
  7. See, L.; Fritz, S.; Perger, C.; Schill, C.; McCallum, I.; Schepaschenko, D.; Duerauer, M.; Sturn, T.; Karner, M.; Kraxner, F.; et al. Harnessing the power of volunteers, the internet and Google Earth to collect and validate global spatial information using Geo-Wiki. Technol. Forecast. Soc. Chang. 2015, 98, 324–335. [Google Scholar] [CrossRef] [Green Version]
  8. Fritz, S.; See, L.; Perger, C.; McCallum, I.; Schill, C.; Schepaschenko, D.; Duerauer, M.; Karner, M.; Dresel, C.; Laso-Bayas, J.-C.; et al. A global dataset of crowdsourced land cover and land use reference data. Sci. Data 2017, 4, 170075. [Google Scholar] [CrossRef] [PubMed] [Green Version]
  9. Schepaschenko, D.G.; Shvidenko, A.Z.; Lesiv, M.Y.; Ontikov, P.V.; Shchepashchenko, M.V.; Kraxner, F. Estimation of forest area and its dynamics in Russia based on synthesis of remote sensing products. Contemp. Probl. Ecol. 2015, 8, 811–817. [Google Scholar] [CrossRef] [Green Version]
  10. Schepaschenko, D.; Fritz, S.; See, L.; Laso Bayas, J.C.; Lesiv, M.; Kraxner, F.; Obersteiner, M. Comment on “The extent of forest in dryland biomes”. Science 2017, 358, eaao0166. [Google Scholar] [CrossRef] [PubMed] [Green Version]
  11. See, L.; Fritz, S.; Perger, C.; Schill, C.; Albrecht, F.; McCallum, I.; Schepaschenko, D.; Van der Velde, M.; Kraxner, F.; Baruah, U.D.; et al. Mapping human impact using crowdsourcing. In Mapping Wilderness; Carver, S.J., Fritz, S., Eds.; Springer: Dordrecht, The Netherlands, 2016; pp. 89–101. ISBN 978-94-017-7397-3. [Google Scholar]
  12. Bey, A.; Sánchez-Paus Díaz, A.; Maniatis, D.; Marchi, G.; Mollicone, D.; Ricci, S.; Bastin, J.-F.; Moore, R.; Federici, S.; Rezende, M.; et al. Collect earth: Land use and land cover assessment through augmented visual interpretation. Remote Sens. 2016, 8, 807. [Google Scholar] [CrossRef]
  13. Bastin, J.-F.; Berrahmouni, N.; Grainger, A.; Maniatis, D.; Mollicone, D.; Moore, R.; Patriarca, C.; Picard, N.; Sparrow, B.; Abraham, E.M.; et al. The extent of forest in dryland biomes. Science 2017, 356, 635–638. [Google Scholar] [CrossRef] [PubMed] [Green Version]
  14. Microsoft about Bing Data Suppliers. 2017. Available online: https://support.microsoft.com/en-us/help/17831/about-bing-data-suppliers (accessed on 11 October 2018).
  15. JRC GHS Population Grid (LDS). 2015. Available online: http://ghsl.jrc.ec.europa.eu/ghs_pop.php (accessed on 11 October 2018).
  16. Juffe-Bignoli, D.; Burgess, N.D.; Bingham, H.; Belle, E.M.S.; de Lima, M.G.; Deguignet, M.; Bertzky, B.; Milam, A.N.; Martinez-Lopez, J.; Lewis, E.; et al. Protected Planet Report 2014; UNEP-World Conservation Monitoring Centre: Cambridge, UK, 2014. [Google Scholar]
  17. FAO Global Forest Resources Assessment 2015. How Are the World’s Forests Changing? 2nd ed.; Food and Agriculutre Organization of the United Nations: Rome, Italy, 2016; Available online: http://www.fao.org/3/a-i4793e.pdf (accessed on 11 October 2018).
  18. Schepaschenko, D.; See, L.; Lesiv, M.; Fritz, S.; McCallum, I.; Perger, C.; Shvidenko, A.; Kraxner, F. Global hybrid forest mask: Synergy of remote sensing, crowd sourcing and statistics. In Proceedings of the AGU Fall Meeting, San Francisco, CA, USA, 9–13 December 2013. [Google Scholar]
  19. Didan, K.; Barreto, A. NASA MEaSUREs Vegetation Index and Phenology (VIP) Phenology NDVI Yearly Global 0.05Deg CMG. 2016. Available online: https://lpdaac.usgs.gov/dataset_discovery/measures/measures_products_table/vipphen_ndvi_v004 (accessed on 11 October 2018).
  20. See, L.; Fritz, S.; You, L.; Ramankutty, N.; Herrero, M.; Justice, C.; Becker-Reshef, I.; Thornton, P.; Erb, K.; Gong, P.; et al. Improved global cropland data as an essential ingredient for food security. Glob. Food Secur. 2015, 4, 37–45. [Google Scholar] [CrossRef] [Green Version]
  21. Kehoe, L.; Romero-Muñoz, A.; Polaina, E.; Estes, L.; Kreft, H.; Kuemmerle, T. Biodiversity at risk under future cropland expansion and intensification. Nat. Ecol. Evol. 2017, 1, 1129–1135. [Google Scholar] [CrossRef] [PubMed]
  22. Waldner, F.; Fritz, S.; Di Gregorio, A.; Plotnikov, D.; Bartalev, S.; Kussul, N.; Gong, P.; Thenkabail, P.; Hazeu, G.; Klein, I.; et al. A unified cropland layer at 250 m for global agriculture monitoring. Data 2016, 1, 3. [Google Scholar] [CrossRef] [Green Version]
  23. JRC GHS Settlement Grid (LDS). GHS_SMOD_POP_GLOBE_R2016A. 2016. Available online: http://ghsl.jrc.ec.europa.eu/ghs_smod.php (accessed on 11 October 2018).
  24. UNCCD. Global Land Outlook, 1st ed.; United Nations Convention to Combat Desertification: Bonn, Germany, 2017. [Google Scholar]
  25. Costanza, R.; de Groot, R.; Sutton, P.; van der Ploeg, S.; Anderson, S.J.; Kubiszewski, I.; Farber, S.; Turner, R.K. Changes in the global value of ecosystem services. Glob. Environ. Chang. 2014, 26, 152–158. [Google Scholar] [CrossRef]
  26. Laso Bayas, J.C.; Lesiv, M.; Waldner, F.; Schucknecht, A.; Duerauer, M.; See, L.; Fritz, S.; Fraisl, D.; Moorthy, I.; McCallum, I.; et al. A global reference database of crowdsourced cropland data collected using the Geo-Wiki platform. Sci. Data 2017, 4, 170136. [Google Scholar] [CrossRef] [PubMed] [Green Version]
  27. Gallego, F.J. Validation of GIS layers in the EU: Getting adapted to available reference data. Int. J. Digit. Earth 2011, 4, 42–57. [Google Scholar] [CrossRef]
  28. Eiselt, B. Personal Communication Based on 2018 Tender Documents for LUCAS Implementation. Available online: https://etendering.ted.europa.eu/cft/cft-document.html?docId=27618 (accessed on 6 October 2017).
  29. Hansen, M.C.; Potapov, P.V.; Moore, R.; Hancher, M.; Turubanova, S.A.; Tyukavina, A.; Thau, D.; Stehman, S.V.; Goetz, S.J.; Loveland, T.R.; et al. High-resolution global maps of 21st-century forest cover change. Science 2013, 342, 850–853. [Google Scholar] [CrossRef] [PubMed]
  30. Pekel, J.-F.; Cottam, A.; Gorelick, N.; Belward, A.S. High-resolution mapping of global surface water and its long-term changes. Nature 2016, 540, 418–422. [Google Scholar] [CrossRef] [PubMed]
  31. Copernicus Open Access Hub. Available online: https://scihub.copernicus.eu/ (accessed on 11 October 2018).
  32. Sentinel Hub by Sinergize. Available online: https://www.sentinel-hub.com/ (accessed on 11 October 2018).
  33. Planet. Available online: https://www.planet.com (accessed on 11 October 2018).
  34. Radiant Earth Foundation. Available online: https://www.radiant.earth (accessed on 11 October 2018).
Figure 1. A summary of the methodology for the collection and analysis of imagery from Google Earth and Microsoft Bing Maps.
Land 07 00118 g001
Figure 2. The dates of the most recent VHR satellite imagery (<5 m resolution) available in Microsoft Bing Maps as of January 2017 (Software: Esri®ArcMap™ 10.1).
Land 07 00118 g002
Figure 3. The dates of the most recent VHR satellite imagery (<5 m resolution) available in Google Earth as of January 2017 (Software: Esri®ArcMap™ 10.1).
Land 07 00118 g003
Figure 4. Comparison of the most recent VHR satellite imagery (<5 m resolution) available in Microsoft Bing Maps and Google Earth as of January 2017 (Software: Esri®ArcMap™ 10.1).
Land 07 00118 g004
Figure 5. The number of unique years of VHR satellite images (<5 m resolution) available in Google Earth (Software: Esri®ArcMap™ 10.1).
Land 07 00118 g005
Figure 6. The availability of VHR imagery (<5 m) in Google Earth based on the number of seasons represented by the dates (Software: Esri®ArcMap™ 10.1).
Land 07 00118 g006
Figure 7. The distribution of VHR imagery (<5 m) in Google Earth based on the availability in and outside of a growing season. Areas in white, e.g., in the Sahara desert, were excluded since there is no data available due to absence of cropland (Software: Esri®ArcMap™ 10.1).
Land 07 00118 g007
Table 1. Indicators calculated from the data extracted from Google Earth and Microsoft Bing Maps.
Spatial-Temporal Patterns of the Image DatesIndicatorDescription
(1) Calculated per grid pointNumber of imagesTotal number of images available in a certain location
Number of unique yearsSome of the historical imagery in Google Earth is concentrated in the same year so this indicator shows how many unique years are contained within the Google Earth archive, which is relevant information for monitoring change over time
An index of gaps in the time seriesThe number of unique images at a location was divided by the difference in years between the oldest and most recent image. Values of 1 indicate no time gaps in the time series; as the index decreases, the gap in the time series increases. This indicator was calculated for the USA and India as both countries have high numbers of images and high numbers of unique images.
Number of seasonsThe dates were grouped by the four seasons of winter (December, January, February), spring (March, April, May), summer (June, July, August) and autumn (September, October, November); this indicator shows the number of historical images that fall in each of the four seasons, which is a relevant indicator for landscapes that change seasonally.
(2) Calculated per stratum (region)Coverage with very high resolution (VHR) imagery (%)Percentage of sample points with VHR imagery in Google Earth and Microsoft Bing Maps.
Average number of images per grid pointTotal sum of all numbers of images per grid points in a certain stratum divided by the total number of grid points in this stratum.
Average number of unique years per grid pointTotal sum of all numbers of unique years per grid points in a certain stratum divided by the total number of grid points in this stratum.
Average difference between the oldest and the most recent date (years)Total sum of all numbers of unique years per grid points in a certain stratum divided by the total number of grid points in this stratum.
Most recent year, calculated as the medianAt each grid point, we selected the year of the most recent image. Then from a subset of grid points in a certain stratum, we calculated the median of the most recent year.
Oldest year, calculated as the medianAt each grid point, we selected the year of the oldest image. Then from a subset of grid points in a certain stratum, we calculated the median of the oldest years.
Average number of different seasons per locationTotal sum of all numbers of different seasons per grid point in a certain stratum divided by the total number of grid points in this stratum.
Table 2. The availability of VHR satellite imagery (<5 m resolution) from Google Earth and Microsoft Bing Maps by region.
RegionTotal Number of Grid PointsGoogle EarthMicrosoft Bing Maps
Coverage with VHR Imagery (%)Average Number of Images per Grid PointAverage Number of Unique Years per Grid PointAverage Difference between the Oldest and the Most Recent Date (Years)Most Recent Year, Calculated as the MedianCoverage with VHR Imagery (%)Most Recent Year, Calculated as Median
North America342147%5510201651%2011
Central America21995%436201694%2013
Most South America153472%435201688%2010
Northern Europe31890%323201564%2012
Southern Europe14299%548201696%2011
Western Europe13699%4372016100%2012
Eastern Europe312939%324201658%2012
Northern Africa74073%324201367%2013
Western Africa50970%334201667%2013
Middle Africa53675%223201365%2013
Eastern Africa53096%435201690%2013
Southern Africa243100%537201699%2013
Eastern Asia121289%334201382%2012
Western Asia41579%435201693%2013
Southern Asia58391%748201692%2015
Southeastern Asia37289%536201658%2013
Table 3. Availability of VHR imagery (<5 m) inside protected areas grouped by regions.
RegionsTotal Number of Points Inside Protected AreasGoogle EarthMicrosoft Bing Maps
Coverage with VHR Imagery (%)Most Recent Year, Calculated as the MedianOldest Year, Calculated as the MedianAverage Number of Images per LocationAverage Number of Unique Years Per LocationAverage Number of Different Seasons per LocationCoverage with VHR Imagery (%)Most Recent Year, Calculated as the Median
Northern America and Central America (excl. Greenland)36154%2013200643259%2011
South America32248%2013200922284%2010
Australia and New Zealand11763%20142006332100%2014
Asia (Southern, Eastern, Southern-Eastern, Central and Western)33772%2013200932287%2012
Africa32484%2013200933279%2013
Western, Southern and Northern Europe11690%2014201033283%2012
Eastern Europe34935%2014200933258%2012
Table 4. Availability of VHR imagery (<5 m) in areas with the highest forest cover change.
RegionNumber of PointsNumber of Points Classed as ‘Forest’Google EarthMicrosoft Bing Maps
Coverage by VHR Imagery (%)Oldest Year, Calculated as the MedianMost Recent Year, Calculated as the MedianAverage Number of ImagesAverage Number of Unique YearsCoverage by VHR Imagery (%)Most Frequent Year, Calculated as the Median
Amazon biome69460148%201020121193%2010
Congo basin43927774%201220132192%2012
Indonesia and Malaysia18217182%201120153247%2012
Sweden and Finland14212385%201220142267%2012
Table 5. Availability of VHR imagery (<5 m) inside cropland areas for selected countries.
Selected CountriesTotal Number of PointsNumber of Points Classed as ‘Cropland’Google EarthMicrosoft Bing Maps
Coverage with VHR Imagery (%)Oldest Year, Calculated as the MedianMost Recent Year, Calculated as the MedianNumber of ImagesAverage Number of Unique YearsAverage Number of Different Seasons per LocationCoverage with VHR Imagery (%)Most Frequent Year, Calculated as the Median
Top countries with highest priority to map croplandsAngola10213100%200720132292%20122
Chad1051292%2010201322100%20131 (non-growing season)
Ethiopia913394%201220166394%20122
Mongolia18300--00 0--
Mozambique684100%2010201322100%20122
Namibia753100%2005201653100%20122
Top countries with cropland expansion, 2000–2014Nigeria7453100%200720166487%20122
Indonesia1532396%200720167474%20121 (growing season)
Brazil7055292%2005201443100%20112
Argentina2846093%2004201643100%20132
Tanzania7726100%200820154396%20122
Top countries with cropland area loss, 2000–2014Australia6994598%2010201543100%20142
India274170100%2004201695100%20152
Sudan2092998%2009201532100%20122
USA110817299%199420151092100%2011
Table 6. Availability of VHR imagery (<5 m) in urban and rural areas.
Number of PointsGoogle EarthMicrosoft Bing Maps
Coverage by VHR Imagery (%)Average Number of Unique YearsOldest Year, Calculated as the MedianMost Recent Year, Calculated as the Median ImageCoverage by VHR Imagery (%)Most Frequent Year, Calculated as the Median
Urban areas219100%62004201687%2012
Rural areas279079%42005201482%2011

