Article

Macroclimatic Drivers and Multi-Pool Carbon Allocation Across Global Forests: A Bitemporal (1990–2025) Comparison Using FAO Global Forest Resources Assessment Data


by
Maria Isabel Delgado-Moreira
1,
Joyce Melanie Solórzano Moreira
2,
Garry Cafe Marapao
3,4 and
Lizardo Reyna-Bowen
5,6,*
1
Department of Ecology and Silviculture, Faculty of Forestry, University of Agriculture in Kraków, 29 Listopada 46, 31-425 Kraków, Poland
2
Estación Experimental del Zaidín (EEZ), Consejo Superior de Investigaciones Científicas (CSIC), C. Prof. Albareda 1, 18008 Granada, Spain
3
Department of Forest Resources Management, Faculty of Forestry, University of Agriculture in Kraków, 29 Listopada 46, 31-425 Kraków, Poland
4
Department of Forest Sciences, College of Environment and Life Sciences, Mindanao State University at Naawan, Naawan 9023, Philippines
5
Laboratory of Forest Hydrology, Faculty of Forestry, University of Agriculture in Kraków, 29 Listopada 46, 31-425 Kraków, Poland
6
Carrera de Ingeniria Agricola, Escuela Superior Politecnica Agropecuaria de Manabi Manuel Felix Lopez, Campus Politecnico El Limon, Calceta 130250, Ecuador
*
Author to whom correspondence should be addressed.
Land 2026, 15(9), 1742; https://doi.org/10.3390/land15091742 (registering DOI)
Submission received: 11 August 2026 / Revised: 12 September 2026 / Accepted: 16 September 2026 / Published: 18 September 2026
(This article belongs to the Special Issue Forest Land Change and Carbon Stock Dynamics Under Climate Change)

Abstract

Forest ecosystems store atmospheric CO2 across five IPCC-defined carbon reservoirs: aboveground biomass (CAGB), belowground biomass (CBGB), coarse dead wood (CDW), litter carbon (CLIT), and soil organic carbon (SOC). Although these pools are dynamic and influenced by macroclimatic conditions, global assessments often examine them separately, leaving their joint climatic sensitivity under-quantified. We evaluated the distribution and interrelationships of the five forest carbon pools, assessed their associations with macroclimatic drivers, and tested whether the climatic sensitivity of SOC differed between 1990 and 2025. We analyzed standardized national inventory data from the FAO Global Forest Resources Assessment 2025 for 53 countries (106 country-year observations) together with ERA5 mean annual temperature and precipitation. Kruskal–Wallis tests followed by Dunn’s post hoc comparisons evaluated regional differences, Spearman rank correlations assessed bivariate relationships, and generalized additive models (GAMs) quantified the unique and shared contributions of precipitation and litter carbon to SOC. Standardized climatic effect sizes (β) on SOC were compared between 1990 and 2025 using a paired-difference bootstrap test (Δβ). SOC density differed significantly among regions (p = 0.0058), with Europe showing the highest values, whereas CAGB did not differ significantly (p = 0.52). CAGB and CBGB were strongly correlated (p < 0.001), while SOC showed only weak bivariate associations with living biomass pools. In the multivariate analysis, precipitation and CLIT together explained 35.9% of the spatial variation in SOC, but their contributions were almost entirely independent (unique precipitation, 17.4%; unique CLIT, 18.2%; shared fraction, 0.3%). This near-zero shared fraction indicates that precipitation and litter carbon contributed largely distinct information to national-scale SOC variation rather than acting through a strongly coupled pathway. Paired-difference testing indicated no detectable change in either temperature or precipitation effect sizes on SOC between 1990 and 2025 because the 95% confidence intervals for Δβ overlapped zero. Forest carbon pools are governed by pool-specific and only partly overlapping climatic and biological controls rather than by a single common driver. At the national scale, precipitation and litter carbon jointly contribute to variation in SOC density, while the estimated climatic sensitivity of SOC remained statistically stable between 1990 and 2025. These findings support multi-pool, climate-explicit approaches to long-term forest carbon monitoring.

1. Introduction

Forest ecosystems play a decisive role in the global carbon cycle by sequestering atmospheric carbon dioxide (CO2) and buffering climate change [1,2,3,4]. Global forest carbon is partitioned among five primary reservoirs recognized by the Intergovernmental Panel on Climate Change (IPCC): aboveground biomass (CAGB), belowground biomass (CBGB), coarse dead wood (CDW), litter carbon (CLIT), and soil organic carbon (SOC) [5]. Together with macroclimatic regimes, these pools determine the storage, transfer, and persistence of organic carbon across forest biomes [6,7]. Among them, SOC is the largest terrestrial organic carbon reservoir, storing approximately 2400 Gt C in the upper two metres of soil, an amount exceeding the combined carbon content of the atmosphere and living vegetation [8,9,10]. SOC also supports soil health, nutrient cycling, biodiversity conservation, and food security [11,12,13].
The balance and turnover of these carbon pools are highly dynamic and operate over contrasting spatial and temporal scales [14,15]. Carbon can remain stored in woody tissues and organo-mineral soil associations for decades to millennia, whereas ecosystem disturbance, land-use conversion, and warming can accelerate carbon losses as CO2 or CH4 and strengthen positive climate feedbacks [16,17,18]. Changes in carbon inputs through net primary productivity (NPP), litterfall, and deadwood accumulation, together with changes in outputs through heterotrophic respiration and microbial decomposition, directly alter carbon-pool dynamics [19,20,21]. For example, forest degradation and conversion to agricultural land can substantially reduce topsoil SOC stocks, with reported losses varying by climate zone, soil depth, and physicochemical properties [22,23], while also reducing living biomass carbon [13,24]. Temperature and precipitation further regulate these processes: warming generally accelerates microbial activity and organic-matter decomposition [25,26], whereas precipitation influences plant water relations, productivity, and litter inputs to soil [10,27,28].
Protecting terrestrial carbon sinks has therefore become a central objective of international climate and land-management policy [29,30]. The “4 per 1000” initiative launched at COP21 promotes increases in soil organic carbon through improved agricultural and forestry management [31,32]. The United Nations 2030 Agenda similarly addresses ecosystem restoration and land degradation through SDGs 2, 13, and 15 [33,34,35]. The Food and Agriculture Organization (FAO), through the Global Soil Partnership and RECSOIL initiative, promotes sustainable soil management to limit carbon losses and strengthen climate resilience [36,37]. Under the Paris Agreement, robust National Greenhouse Gas Inventories (NGHGIs) and Land Use, Land-Use Change and Forestry (LULUCF) reporting also require transparent estimates of relevant carbon pools [38,39].
Despite these policy priorities and advances in inventory and remote-sensing methods, important empirical gaps remain in understanding how the five forest carbon pools co-vary and how their relationships are associated with macroclimate [40,41]. Many global syntheses focus on individual reservoirs, particularly aboveground biomass or SOC, rather than evaluating cross-pool dependencies within a common analytical framework [42,43]. Consequently, the extent to which living biomass, dead organic matter, and soil carbon co-vary across broad geographic regions remains insufficiently quantified, as does the question of whether the estimated climatic sensitivity of SOC differs between widely separated reporting years [44,45]. Living biomass is also sometimes used as an indicator of ecosystem carbon storage, although its correspondence with long-term belowground carbon persistence remains uncertain at macro-regional scales [7].
Accordingly, this study evaluated the regional distribution, interrelationships, and macroclimatic associations of five IPCC forest carbon pools (CAGB, CBGB, CDW, CLIT, and SOC) using standardized FAO Global Forest Resources Assessment (FRA) data for 1990 and 2025. We tested three hypotheses: H1, SOC density differs among global geographic regions; H2, the strength and direction of associations among carbon pools and climatic drivers differ among pools; and H3, precipitation and litter carbon provide complementary, potentially independent contributions to national-scale SOC variation.

2. Materials and Methods

2.1. Data Sources and Spatial Framework

The forest carbon data analyzed in this study were retrieved from the Global Forest Resources Assessment (FRA) 2025 [46], coordinated by the Food and Agriculture Organization of the United Nations (FAO). The FRA dataset compiles standardized national information representing a global forest cover of approximately 4.14 billion hectares (≈32% of the global land area). All carbon pool values were expressed as mean carbon density per unit area (t C ha−1) to enable standardized cross-regional comparisons. For spatial analytical purposes, reporting countries and territories were grouped into five official geographic regions: Africa, the Americas (consolidating North, Central, and South America), Asia, Europe, and Oceania. To ensure analytical consistency across multivariate modeling and variance partitioning, the study focused exclusively on selecting all nations that presented complete and simultaneous historical reporting for all five carbon pools (CAGB, CBGB, CDW, CLIT, and SOC). Applying these criteria yielded a bitemporal panel of N = 53 countries with full longitudinal records for both benchmark years (1990 and 2025), distributed regionally as follows: Europe (n = 18), Americas (n = 14), Africa (n = 9), Asia (n = 8), and Oceania (n = 4).

2.2. Hydroclimatic Data Integration

High-resolution climatic covariates were obtained from the Copernicus Climate Change Service (C3S) ERA5 Monthly Averaged Reanalysis Dataset on Single Levels, produced by the European Centre for Medium-Range Weather Forecasts (ECMWF). Gridded data were retrieved at 0.25° × 0.25° spatial resolution (approximately 27–31 km, depending on latitude) in the WGS 84 geographic coordinate system. For each benchmark year, monthly 2 m air temperature and total precipitation fields were aggregated over the corresponding January–December period to derive country-level mean annual temperature (°C) and annual total precipitation (mm). The 1990 ERA5 climate summaries were paired with the 1990 FRA carbon observations, and the 2025 ERA5 climate summaries were paired with the 2025 FRA carbon observations. Country-level extraction and matching were performed using the same spatial procedure for both benchmark years.

2.3. Among Carbon Pools and Climatic Drivers

Differences in median SOC and CAGB density among the five global regions were evaluated using Kruskal–Wallis tests because the regional carbon-density data were non-normally distributed. When the global test was significant, pairwise comparisons were performed using Dunn’s test with Bonferroni correction (α = 0.05). Regional SOC densities were additionally contextualized using total forest area (Mha) from FRA 2025, allowing density-based patterns to be interpreted alongside the spatial extent of forest cover. CAGB and SOC were emphasized in the regional comparison because they represent contrasting living aboveground and long-term belowground carbon compartments.
To evaluate co-variation among ecosystem carbon pools (CAGB, CBGB, CDW, CLIT, and SOC) and macroclimatic drivers (mean annual temperature and precipitation), we calculated a Spearman rank-order correlation matrix (ρ). Statistical significance was assessed using two-tailed tests and indicated on the matrix (* p < 0.05, ** p < 0.01, *** p < 0.001). Analyses were conducted in Python v3.10 [47] using SciPy v1.11.4 [48] and Matplotlib v3.7.5 [49]. The additive B-spline regressions described below were fitted by ordinary least squares using the statsmodels Python package; the exact installed statsmodels version should be verified from the analysis environment before final submission.

2.4. Contribution of Climatic and Biological Drivers to SOC

To reduce positive skewness and accommodate non-linear scaling across national carbon pools, SOC and CLIT were transformed using log(1 + x) before modelling. Non-linear associations with SOC were evaluated using an additive B-spline regression framework fitted by ordinary least squares. This model is GAM-like in its additive spline representation but is not a penalized generalized additive model in the strict sense. Cubic B-spline basis functions were used for mean annual precipitation and CLIT, with degrees of freedom fixed a priori at df = 3 for each smooth term to constrain model flexibility and reduce overfitting at n = 53. The full model can be written as log(1 + SOC) = α + B1(precipitation) + B2[log(1 + CLIT)] + ε, where B1 and B2 denote the cubic B-spline basis expansions.
l n ( S O C I + 1 ) = β 0 + B 1 ( M A P i ,   d f = 3 ) + B 2 ( l n ( C L I T + 1 ) ,   d f = 3 ) + ϵ i
The spline degrees of freedom were fixed before model fitting and were not selected by data-driven smoothing or penalization.
To quantify the independent and shared contributions of macroclimate and biological inputs to SOC, variance partitioning was based on three nested models: a full model containing both predictor terms (Mfull), a precipitation-only model (Mprecip), and a litter carbon-only model (MCLIT). The explained variance of the full model (R2full) was partitioned into unique precipitation (a = max [0, R2full − R2CLIT]), unique litter carbon (b = max [0, R2full − R2precip]), shared (c = R2full − a − b), and unexplained (d = 1 − R2full) fractions. Adjusted R2 was also reported to account for model degrees of freedom. Standardized climatic effect sizes on SOC were estimated separately for 1990 and 2025, and temporal differences were evaluated directly using paired bootstrap differences (Δβ); a change was considered detectable when the 95% bootstrap confidence interval for Δβ excluded zero.

3. Results

3.1. Variation in Forest Carbon Pools: Reagional Vision

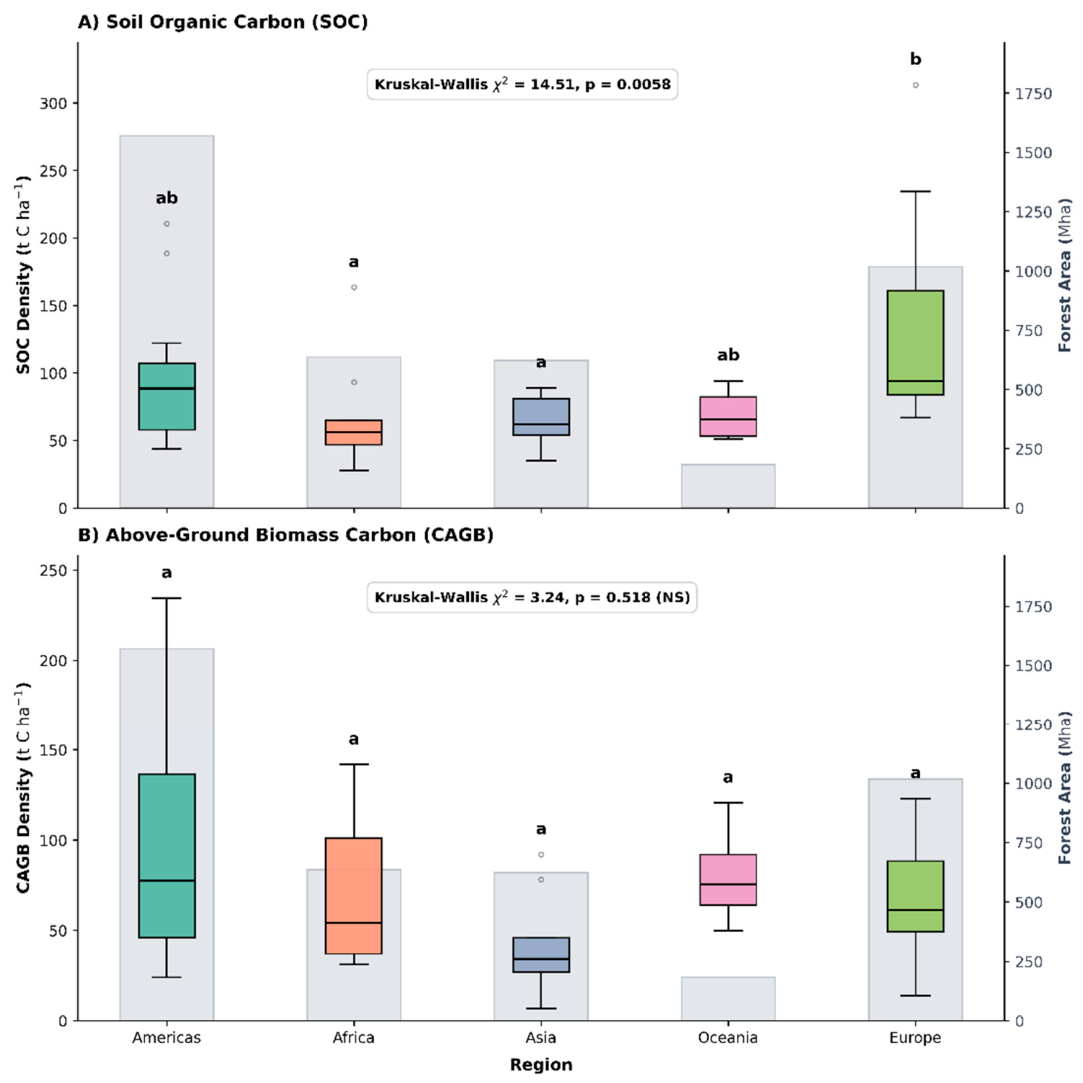
In 2025, SOC density varied significantly among global regions, whereas CAGB density did not. The Kruskal–Wallis test for CAGB was non-significant (p = 0.5185), while SOC differed among regions (p = 0.0058). Dunn’s post hoc comparisons placed Europe in the higher SOC group (b), Africa and Asia in the lower group (a), and the Americas and Oceania in the intermediate group (ab) (Figure 1). These density patterns should be interpreted separately from total forest area, which is also shown in Figure 1 for regional context.

3.2. Relationships Among Carbon Pools and Climatic Drivers

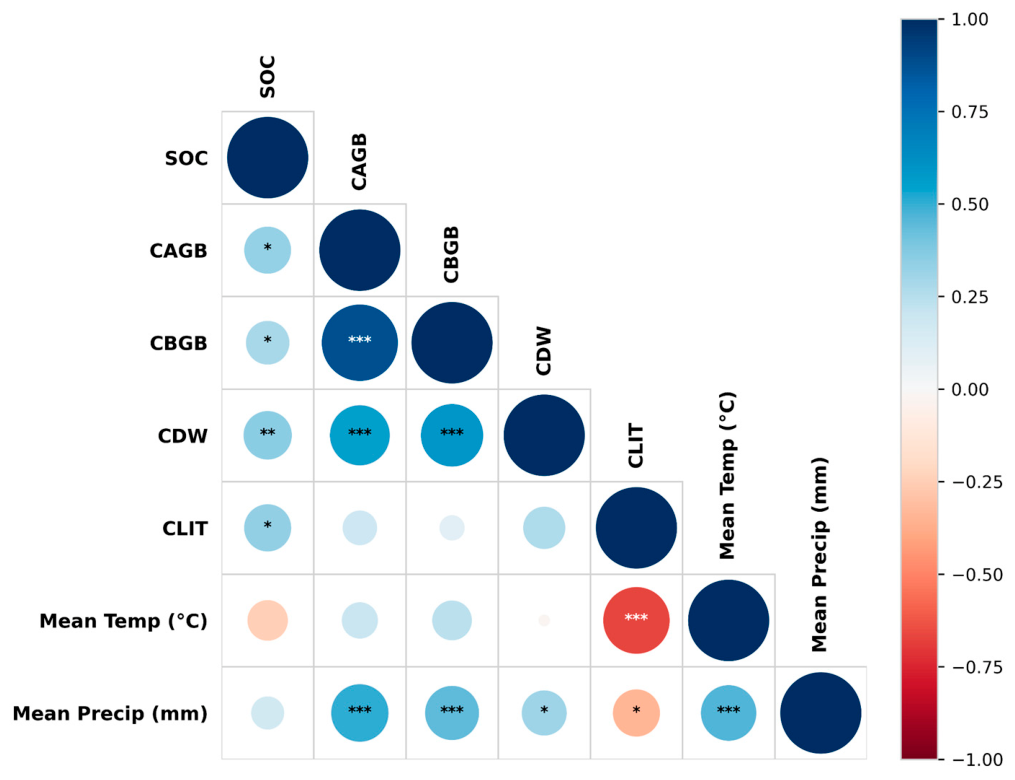
SOC showed a weak negative bivariate association with mean annual temperature and a negligible, non-significant association with precipitation (Figure 2). The strongest correlation among carbon pools occurred between CAGB and CBGB (p < 0.001). Both living biomass pools were also positively associated with CDW and mean annual precipitation (p < 0.001), but were not significantly associated with mean annual temperature or CLIT. CLIT was negatively correlated with mean annual temperature (p < 0.001) and precipitation (p < 0.05). CDW was positively associated with precipitation (p < 0.05) but not with temperature. Mean annual temperature and precipitation were themselves significantly positively correlated (p < 0.001).

3.3. Relative Contribution of Climatic and CLIT to SOC

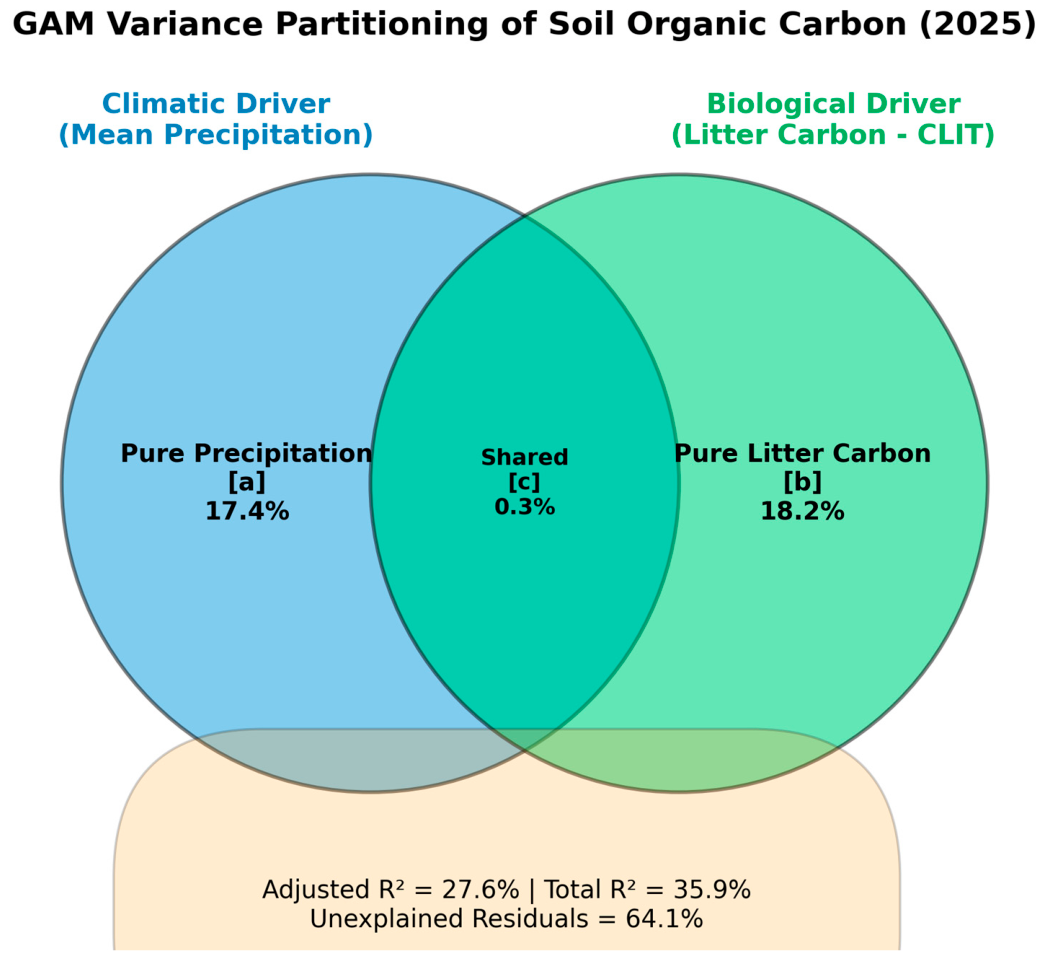
The additive B-spline variance partitioning indicated that mean annual precipitation and litter carbon (CLIT) together explained 35.9% of the spatial variation in SOC density (R2 = 0.359). Their contributions were almost entirely unique: precipitation explained 17.4% and CLIT explained 18.2%, whereas the shared fraction was only 0.3% (Figure 3). Thus, at the scale of this analysis, precipitation and CLIT contributed largely independent information to SOC variation rather than evidence of strong coupling between the two predictors. The remaining 64.1% of variance was unexplained by these predictors and is consistent with the likely importance of unmeasured edaphic, geological, structural, and management factors.
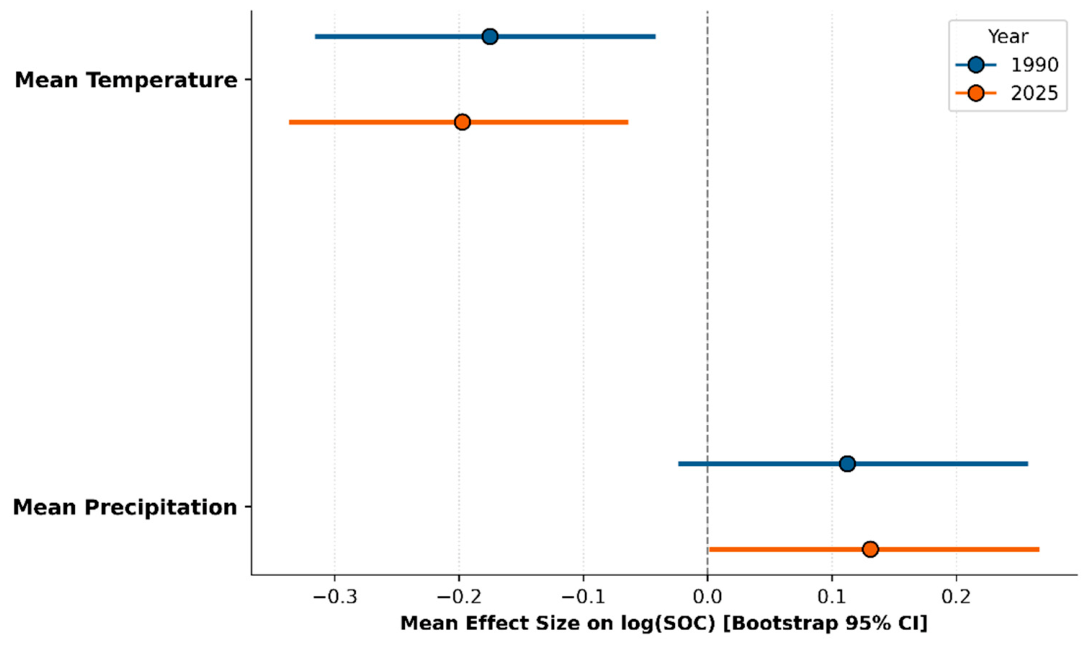
Standardized effect-size estimates indicated a negative temperature association with SOC in both benchmark years (β1990 = −0.175; β2025 = −0.197). The paired-difference test showed no detectable temporal change in temperature sensitivity (ΔβTEMP = −0.022, 95% CI: −0.158 to 0.114). The precipitation effect was positive in both years (β1990 = 0.112; β2025 = 0.131). Although the 2025 bootstrap interval marginally excluded zero, whereas the 1990 interval did not, the direct paired-difference test showed no detectable change between years (ΔβPRECIP = 0.019, 95% CI: −0.125 to 0.162). Thus, the data do not support a temporal shift in the estimated climatic sensitivity of SOC between 1990 and 2025 (Figure 4).

4. Discussion

4.1. Regional Variation in Forest Carbon Pools

CAGB showed no significant regional differences, whereas SOC density varied significantly among regions, with Europe occupying the highest post hoc group. This contrast supports the view that aboveground biomass and soil carbon respond to partly distinct controls. Global syntheses likewise show that mineral-soil carbon is strongly influenced by climatic and edaphic conditions, while plant productivity alone explains only part of its spatial variation [6,50].
Across continental gradients, SOC storage and persistence reflect interacting climatic, vegetation, and edaphic controls rather than a single universal geographic regulator [6,7,50]. This broader climatic and biogeochemical context is consistent with the strong regional differences observed here. In the Russian forest domain, for example, living biomass carbon stocks follow a marked north–south zonal gradient, increasing from sub-tundra woodlands to taiga and mixed broadleaved forests before declining toward southern semi-desert systems [51]. Similar regional-scale carbon accumulation occurs in Mediterranean Europe; for example, total aboveground forest carbon stock in Italy surpassed 566 million tons in 2018 [52]. At the global scale, temperate forests in Europe and North America remain important carbon sinks, although their future sink strength is threatened by forest aging, deforestation, and intensified disturbance regimes [4,53].
Across continental gradients, latitude operates as a primary overarching regulator of soil carbon persistence over mean annual precipitation or localized elevation [54]. This latitudinal control is clearly exemplified in the Russian forest domain, where living biomass carbon stocks follow a distinct north–south zonal gradient—increasing from sub-tundra woodlands (14.3 ± 1.6 t C ha−1) to taiga ecosystems, peaking in mixed broadleaved forests (84.6 ± 1.4 t C ha−1) and the North Caucasus Mountains (119.2 ± 4.5 t C ha−1), before declining in southern semi-deserts [51]. Similar regional-scale carbon accumulation occurs in Mediterranean Europe; for example, the total aboveground forest carbon stock in Italy surpassed 566 million tons in 2018 [52]. On a global scale, while temperate forests in Europe and North America act as persistent long-term carbon sinks, synthesis studies warn that despite the global forest sink remaining undiminished over the last three decades, its long-term sink strength is increasingly threatened by forest aging, ongoing deforestation, and intensified natural disturbance regimes [4,53].
In addition to broad geographical gradients, forest functional types and community composition significantly modulate belowground carbon density and fraction stability. While aboveground and belowground biomass carbon densities remain comparable across forest functional types, SOC density exhibits a clear hierarchy: broadleaf forests (≈18.38 Mg C ha−1) > needle-leaf forests (11.29 Mg C ha−1) > mixed forests (10.33 Mg C ha−1) [55]. This biome-specific behavior is further evidenced in regional mountain ecosystems, such as the eastern Himalayas, where SOC stock reaches its maximum in temperate and Quercus forests, respectively, highlighting the critical role of specific genera like Quercus in driving long-term soil carbon sequestration [56].
Furthermore, regional carbon pool dynamics are also influenced by land-use transitions and anthropogenic management across both tropical and temperate systems. In tropical regions such as India, land-use conversion drastically alters soil carbon storage and the relative proportion of active versus recalcitrant pools [57], an effect that requires extended timeframes to stabilize, as demonstrated in Brazilian tropical soils where SOC takes more than 20 years to reach a new steady-state following disturbance [58]. Conversely, in managed temperate forests—such as those supplying the wood pellet industry in North America and Europe—there is robust evidence that despite localized trade-offs among individual carbon pools, sustainable forestry management can meet the overall conditions required for net forest carbon neutrality [59]. Concurrently, large-scale afforestation and conservation programs in Asia have driven substantial biomass carbon gains; over the last two decades, China’s total forest biomass carbon pool expanded at a rate of 114.5 ± 16.3 Tg C yr−1 (≈ 1.1% yr−1), with the most pronounced stock gains concentrated in southeastern forests, the southern Loess Plateau, and the Qinling Mountains [60,61].
Integrated analyses of all five IPCC forest carbon pools remain comparatively uncommon because global and regional studies often focus on SOC or biomass in relation to selected environmental variables [41]. Evaluating the complete correlation structure within a common dataset therefore provides a useful macro-scale baseline. Importantly, the observed associations should be interpreted as co-variation rather than as direct causal links, because the national-scale dataset does not resolve the underlying transfer processes among pools.

4.2. Bivariate Coupling, Biogeochemical Pathways, and Bitemporal Stability

The correlation analysis showed that CAGB and CBGB had the strongest positive coupling, consistent with biome-level biomass allocation relationships [62]. Both living biomass pools were positively associated with CDW and mean annual precipitation, whereas their associations with mean annual temperature and CLIT were non-significant. SOC showed only weak positive correlations with living biomass pools and non-significant bivariate correlations with temperature and precipitation. This pattern illustrates that strong coupling among living biomass compartments does not necessarily translate into equally strong coupling with soil carbon. Comparable ecosystem-scale studies have likewise identified SOC as a dominant carbon reservoir whose controls differ from those of tree biomass [63].
SOC persistence reflects interacting carbon-input and carbon-stabilization pathways [9]. Climate can influence productivity, decomposition, and water availability, whereas litter carbon represents a biological input pathway and soil properties regulate decomposition, mineral association, and microbial processing [64]. In our additive B-spline analysis, precipitation and CLIT together explained 35.9% of national-scale SOC variation; however, the shared fraction was only 0.3%, compared with unique contributions of 17.4% for precipitation and 18.2% for CLIT. The key result is therefore not strong precipitation–litter coupling, but the largely independent information contributed by these two predictors. This interpretation is also compatible with the negative bivariate precipitation–CLIT correlation in Figure 2 and avoids assigning a mechanistic pathway that cannot be resolved from national aggregate data. Microbial carbon-use efficiency remains a plausible process linking climate, litter processing, and stable SOC formation [65], but it was not measured directly in this study.
Environmental and anthropogenic drivers also exhibit strong altitudinal and biotic stratification: at low elevations, SOC stocks are highly susceptible to grazing, precipitation variability, and land-use conversions, whereas high-elevation montane forests and permafrost sinks are regulated by warming, plant succession, and wildfire regimes [66]. Long-term forest conversions and management practices fundamentally alter these SOC formation and stabilization processes [67].
On a biotic level, climate change induces significant losses in functional soil pools; global soil microbial biomass carbon declined by 3.4 ± 3.0% between 1992 and 2013 (≈ 149 Mtn C lost), with high-latitude northern regions experiencing the most severe temperature-driven reductions [16,68]. Belowground carbon stability is further mediated by soil biodiversity: fungal communities exert a stronger regulatory control on SOC pools and stability than bacterial communities through hyphal networks and recalcitrant chitin formation [69,70]. Although increasing plant species diversity positively correlates with microbial necromass carbon content, it does not necessarily increase its proportional contribution to the total SOC pool [71,72].
Standardized effect sizes were negative for temperature and positive for precipitation in both benchmark years, but the paired-difference bootstrap tests did not detect a change in either effect between 1990 and 2025. This distinction is important: a confidence interval that crosses zero in one year but not another does not by itself demonstrate that the two yearly effects differ [73]. Our results therefore support temporal stability of the estimated national-scale climate–SOC associations over the two benchmark years, rather than evidence of a structural shift [20].

4.3. Relative Contribution of Climatic and Biological Drivers to SOC

The 35.9% of SOC variation explained by precipitation and CLIT represents a substantial but incomplete fraction of national-scale variability. It is lower than estimates from studies that incorporate broader combinations of climatic, edaphic, topographic, and vegetation predictors [50,64], which is expected because the present partitioning intentionally focuses on only two predictor domains. Importantly, almost all explained variation was partitioned into unique precipitation (17.4%) and unique CLIT (18.2%) fractions, with only 0.3% shared. The model therefore supports complementary rather than strongly coupled climatic and litter carbon contributions.
The remaining 64.1% of unexplained variance likely reflects factors not represented in the present models, including soil texture and mineralogy, parent material, drainage, stand structure, disturbance history, and management [74]. Accordingly, the variance partitioning should be interpreted as a focused assessment of two predictors rather than a complete attribution of SOC controls.
Local edaphic and biological factors can substantially modify macroclimatic controls. Soil texture, mineralogy, drainage, and soil fauna influence SOC formation and persistence [75], while nitrogen and phosphorus availability can constrain SOC storage in drylands [76,77]. Particulate organic carbon (POC) and mineral-associated organic carbon (MAOC) are also governed by partly distinct environmental controls, emphasizing the value of separating functional SOC fractions when forecasting responses to global change [78,79].
Climatic and biological controls also vary with soil depth. Climate influences SOC throughout the profile, but the relative importance of root inputs, mineral interactions, and microbial processing can increase in subsoil horizons [64,80,81]. Deep SOC pools may remain below saturation and can respond differently from surface pools, as reported for Larix gmelinii forests [82]. These depth-dependent processes cannot be resolved by national aggregate values and represent an important target for future multi-pool assessments.
Biological controls, structural attributes, and management regimes strongly mediate belowground carbon sequestration. Tree species diversity, stand density, and age-group thresholds significantly promote carbon accumulation in both biomass carbon and SOC in planted forests [23,82]. In restored forests, soil clay content and stand age are the dominant factors regulating SOC recovery, with surface SOC failing to fully reach reference forest levels even after 1 to 200 years of recovery [83]. However, functional diversity accelerates this process: tree polycultures achieve SOC recovery plateaus roughly twice as fast (≈10 years) as monocultures (≈20 years) [83]. Consequently, implementing trait-based restoration strategies in tropical forests by combining short-lived acquisitive species with long-lived conservative species enhances functional diversity, accelerating healthy soil recovery and long-term carbon sequestration for climate mitigation [84]. Forest structural integrity and maturity are equally vital; for example, primeval European beech forests store 15% more SOC (+1.8 kg C m2) than managed stands, with the most significant carbon surpluses occurring in the subsoil [85]. At the regional scale, long-term environmental trends and disturbance regimes induce major shifts in SOC balances. In Northeast China, mean annual temperature and elevation governed the spatial variation in SOC stocks across Cambosols, Gleyosols, and Isohumosols (accounting for >95% of total SOC), driving a net regional gain of 471 Tg C over 25 years (1990–2015) [86]. On a seasonal level, soil microbial biomass carbon correlates strongly with SOC stocks and soil basal respiration, where optimal soil moisture, temperature, and litter quality boost nitrogen mineralization/immobilization and enhance microbial biomass carbon and SOC storage [87].
Extreme climatic events and forest degradation can further alter terrestrial carbon balances. In the Amazon, non-deforestation disturbances such as fire, edge effects, timber extraction, and severe drought affect large forest areas and generate carbon losses comparable in magnitude to those associated with deforestation [88]. Such disturbance processes are not resolved by the two-endpoint national-scale design used here.

4.4. Study Limitations and Future Directions

Several limitations qualify interpretation of these findings. First, country-level observations may be spatially non-independent and differ greatly in forest area, whereas the present exploratory analyses treat countries as unweighted analytical units. Spatial-autocorrelation diagnostics (e.g., Moran’s I on model residuals) and area-weighted or spatial-regression sensitivity analyses would strengthen future assessments. Second, FRA national reports can include IPCC Tier 1 default factors as well as country-specific measurements or higher-tier estimates. Because a harmonized measured-versus-default breakdown was not available for the present dataset, potential circularity between default SOC factors and climate cannot be quantified here; this is acknowledged as a source of uncertainty rather than treated as an independently tested effect. Third, national aggregation smooths local variation in soil properties, microclimate, forest composition, disturbance history, and management. Finally, a two-endpoint comparison (1990 and 2025) can evaluate broad bitemporal stability but cannot resolve interannual dynamics or attribute changes to individual drought, fire, or disturbance events. These constraints mean that the results should be interpreted as national-scale associations rather than causal estimates of process-level carbon responses. Future work should combine repeated FRA observations with direct soil measurements, explicit Tier metadata, high-resolution environmental covariates, remote sensing, and spatially explicit models.

5. Conclusions

In conclusion, the five forest carbon pools examined here exhibited distinct patterns of regional variation and cross-pool association. Aboveground and belowground biomass were strongly correlated, whereas SOC showed only weak bivariate relationships with living biomass. SOC density differed significantly among global regions, while CAGB did not. In the 2025 multivariate analysis, precipitation and litter carbon together explained 35.9% of national-scale SOC variation, but their shared fraction was only 0.3%; the two predictors therefore contributed largely independent information rather than evidence of strong precipitation–litter coupling. Paired-difference bootstrap tests further indicated no detectable change in the estimated temperature or precipitation effects on SOC between 1990 and 2025.
These results indicate that aboveground biomass alone is insufficient to characterize national- and regional-scale variation in soil carbon. Carbon accounting and forest-monitoring frameworks can therefore benefit from multi-pool approaches that distinguish living biomass, dead organic matter, litter, and SOC while explicitly considering macroclimate. Interpretation remains constrained by the two-endpoint design, possible use of Tier 1 default SOC factors in some national reports, national-scale aggregation, and the absence of spatial weighting and explicit spatial-autocorrelation modelling. Future research should combine repeated inventory observations with transparent Tier metadata, direct soil measurements, high-resolution environmental data, and spatially explicit models to test whether the relationships identified here persist across finer temporal and spatial scales.

Author Contributions

Conceptualization, M.I.D.-M., J.M.S.M., L.R.-B. and G.C.M.; methodology, M.I.D.-M., J.M.S.M., L.R.-B. and G.C.M.; software, M.I.D.-M.; validation, L.R.-B. and G.C.M.; formal analysis, M.I.D.-M. and J.M.S.M.; investigation, M.I.D.-M., J.M.S.M., L.R.-B. and G.C.M.; data curation, M.I.D.-M. and G.C.M.; writing—original draft preparation, M.I.D.-M. and J.M.S.M.; writing—review and editing, M.I.D.-M. and G.C.M.; visualization, M.I.D.-M.; supervision, L.R.-B. All authors have read and agreed to the published version of the manuscript.

Funding

This research received no external funding.

Data Availability Statement

The Global Forest Resources Assessment 2025 (FRA 2025) data are publicly available through the Food and Agriculture Organization (FAO) platform at https://fra-data.fao.org/assessments/fra/2025 (accessed on 3 June 2026). Climatic data from ERA5 can be accessed via the Copernicus Climate Data Store (CDS) at https://cds.climate.copernicus.eu/datasets/ (accessed on 3 June 2026). Processed codes and derived datasets are available from the corresponding author upon reasonable request.

Acknowledgments

The authors would like to thank Viliam Pichler for his suggestions.

Conflicts of Interest

The authors declare no conflicts of interest.

Abbreviations

The following abbreviations are used in this manuscript:
CAGBCarbon Above-Ground Biomass
CBGBCarbon Below-Ground Biomass
CDWCarbon in Deadwood
CLITCarbon in Litter
FRAFood and Agriculture Organization—Global Forest Resources Assessment
GAMsGeneralized Additive Models
SOCSoil Organic Carbon
NPPForest net primary productivity
IPCCIntergovernmental Panel on Climate Change

References

  1. Pan, Y.; Birdsey, R.A.; Fang, J.; Houghton, R.; Kauppi, P.E.; Kurz, W.A.; Phillips, O.L.; Shvidenko, A.; Lewis, S.L.; Canadell, J.G.; et al. A Large and Persistent Carbon Sink in the World’s Forests. Science 2011, 333, 988–993. [Google Scholar] [CrossRef] [Scilit] [PubMed]
  2. Zhao, J.; Liu, D.; Zhu, Y.; Peng, H.; Xie, H. A Review of Forest Carbon Cycle Models on Spatiotemporal Scales. J. Clean. Prod. 2022, 339, 130692. [Google Scholar] [CrossRef] [Scilit]
  3. Wang, B.; Hao, S.; Zhang, Q. Protection Mechanisms and Influencing Factors of Soil Organic Carbon Pools in the Larix Gmelinii Forests. Ecol. Indic. 2023, 150, 110242. [Google Scholar] [CrossRef] [Scilit]
  4. Friedlingstein, P.; O’Sullivan, M.; Jones, M.W.; Andrew, R.M.; Bakker, D.C.E.; Hauck, J.; Landschützer, P.; Le Quéré, C.; Luijkx, I.T.; Peters, G.P.; et al. Global Carbon Budget 2023. Earth Syst. Sci. Data 2023, 15, 5301–5369. [Google Scholar] [CrossRef] [Scilit]
  5. Sarun, H.; Kimsreang, T.; Panha, N. Forest Carbon Pools: Concepts, Distribution and Measurement. J. Agric. Environ. 2026, 3, 1–13. [Google Scholar]
  6. Jobbágy, E.G.; Jackson, R.B. The Vertical Distribution of Soil Organic Carbon and Its Relation to Climate and Vegetation. Ecol. Appl. 2000, 10, 423–436. [Google Scholar] [CrossRef]
  7. Doetterl, S.; Stevens, A.; Six, J.; Merckx, R.; Van Oost, K.; Casanova Pinto, M.; Casanova-Katny, A.; Muñoz, C.; Boudin, M.; Zagal Venegas, E.; et al. Soil Carbon Storage Controlled by Interactions between Geochemistry and Climate. Nat. Geosci. 2015, 8, 780–783. [Google Scholar] [CrossRef] [Scilit]
  8. Scharlemann, J.P.; Tanner, E.V.; Hiederer, R.; Kapos, V. Global Soil Carbon: Understanding and Managing the Largest Terrestrial Carbon Pool. Carbon Manag. 2014, 5, 81–91. [Google Scholar] [CrossRef] [Scilit]
  9. Jackson, R.B.; Lajtha, K.; Crow, S.E.; Hugelius, G.; Kramer, M.G.; Piñeiro, G. The Ecology of Soil Carbon: Pools, Vulnerabilities, and Biotic and Abiotic Controls. Annu. Rev. Ecol. Evol. Syst. 2017, 48, 419–445. [Google Scholar] [CrossRef] [Scilit]
  10. Beillouin, D.; Corbeels, M.; Demenois, J.; Berre, D.; Boyer, A.; Fallot, A.; Feder, F.; Cardinael, R. A Global Meta-Analysis of Soil Organic Carbon in the Anthropocene. Nat. Commun. 2023, 14, 3700. [Google Scholar] [CrossRef] [Scilit] [PubMed]
  11. Lal, R. Soil Carbon Sequestration Impacts on Global Climate Change and Food Security. Science 2004, 304, 1623–1627. [Google Scholar] [CrossRef] [Scilit] [PubMed]
  12. Lehmann, J.; Kleber, M. The Contentious Nature of Soil Organic Matter. Nature 2015, 528, 60–68. [Google Scholar] [CrossRef] [Scilit] [PubMed]
  13. Kopittke, P.M.; Berhe, A.A.; Carrillo, Y.; Cavagnaro, T.R.; Chen, D.; Chen, Q.-L.; Román Dobarco, M.; Dijkstra, F.A.; Field, D.J.; Grundy, M.J.; et al. Ensuring Planetary Survival: The Centrality of Organic Carbon in Balancing the Multifunctional Nature of Soils. Crit. Rev. Environ. Sci. Technol. 2022, 52, 4308–4324. [Google Scholar] [CrossRef] [Scilit]
  14. Schmidt, M.W.I.; Torn, M.S.; Abiven, S.; Dittmar, T.; Guggenberger, G.; Janssens, I.A.; Kleber, M.; Kögel-Knabner, I.; Lehmann, J.; Manning, D.A.C.; et al. Persistence of Soil Organic Matter as an Ecosystem Property. Nature 2011, 478, 49–56. [Google Scholar] [CrossRef] [Scilit] [PubMed]
  15. Crowther, T.W.; van den Hoogen, J.; Wan, J.; Mayes, M.A.; Keiser, A.D.; Mo, L.; Averill, C.; Maynard, D.S. The Global Soil Community and Its Influence on Biogeochemistry. Science 2019, 365, eaav0550. [Google Scholar] [CrossRef] [Scilit] [PubMed]
  16. Bond-Lamberty, B.; Thomson, A. Temperature-Associated Increases in the Global Soil Respiration Record. Nature 2010, 464, 579–582. [Google Scholar] [CrossRef] [Scilit] [PubMed]
  17. Maqbool, Z.; Farooq, M.S.; Rafiq, A.; Uzair, M.; Hussain, Q. Utilisation of Climate-Smart Conservation Agriculture Practices for Improved Soil Carbon Sequestration, Greenhouse Gas Mitigation and Sustainable Crop Productivity. Soil Use Manag. 2025, 41, e70103. [Google Scholar] [CrossRef] [Scilit]
  18. Bai, L.; Duan, J.; Shi, P.; Xiao, J.; Li, Z.; Li, P. Erosion-Deposition Processes Drive Soil Organic Carbon Mineralization through Aggregate Breakdown and Buildup. CATENA 2025, 260, 109432. [Google Scholar] [CrossRef] [Scilit]
  19. Prescott, C.E. Litter Decomposition: What Controls It and How Can We Alter It to Sequester More Carbon in Forest Soils? Biogeochemistry 2010, 101, 133–149. [Google Scholar] [CrossRef] [Scilit]
  20. Carvalhais, N.; Forkel, M.; Khomik, M.; Bellarby, J.; Jung, M.; Migliavacca, M.; Μu, M.; Saatchi, S.; Santoro, M.; Thurner, M.; et al. Global Covariation of Carbon Turnover Times with Climate in Terrestrial Ecosystems. Nature 2014, 514, 213–217. [Google Scholar] [CrossRef] [Scilit] [PubMed]
  21. Daigneault, A.; Baker, J.S.; Guo, J.; Lauri, P.; Favero, A.; Forsell, N.; Johnston, C.; Ohrel, S.B.; Sohngen, B. How the Future of the Global Forest Sink Depends on Timber Demand, Forest Management, and Carbon Policies. Glob. Environ. Change 2022, 76, 102582. [Google Scholar] [CrossRef] [Scilit] [PubMed]
  22. Guo, L.B.; Gifford, R.M. Soil Carbon Stocks and Land Use Change: A Meta Analysis. Glob. Change Biol. 2002, 8, 345–360. [Google Scholar] [CrossRef] [Scilit]
  23. Huang, X.; Ibrahim, M.M.; Luo, Y.; Jiang, L.; Chen, J.; Hou, E. Land Use Change Alters Soil Organic Carbon: Constrained Global Patterns and Predictors. Earth’s Future 2024, 12, e2023EF004254. [Google Scholar] [CrossRef] [Scilit]
  24. Erb, K.-H.; Kastner, T.; Plutzar, C.; Bais, A.L.S.; Carvalhais, N.; Fetzel, T.; Gingrich, S.; Haberl, H.; Lauk, C.; Niedertscheider, M.; et al. Unexpectedly Large Impact of Forest Management and Grazing on Global Vegetation Biomass. Nature 2018, 553, 73–76. [Google Scholar] [CrossRef] [Scilit] [PubMed]
  25. Kirschbaum, M.U.F. The Temperature Dependence of Soil Organic Matter Decomposition, and the Effect of Global Warming on Soil Organic C Storage. Soil Biol. Biochem. 1995, 27, 753–760. [Google Scholar] [CrossRef] [Scilit]
  26. Davidson, E.A.; Janssens, I.A. Temperature Sensitivity of Soil Carbon Decomposition and Feedbacks to Climate Change. Nature 2006, 440, 165–173. [Google Scholar] [CrossRef] [Scilit] [PubMed]
  27. Austin, A.T.; Vitousek, P.M. Nutrient Dynamics on a Precipitation Gradient in Hawai’i. Oecologia 1998, 113, 519–529. [Google Scholar] [CrossRef] [Scilit] [PubMed]
  28. Bian, Z.; Pan, S.; Sun, G.; McNulty, S.G.; Tony Wang, X.; Huang, C.; Tian, H. Extreme Precipitation Reshapes Nutrient Flows and Balance in North America’s Largest River Basin. Sci. Adv. 2026, 12, eaea3260. [Google Scholar] [CrossRef] [Scilit] [PubMed]
  29. UNFCCC. Adoption of the Paris Agreement; FCCC/CP/2015/L.9/Rev.1; UNFCCC: Bonn, Germany, 2015. [Google Scholar]
  30. Yang, T.; Pan, H.; Zhang, X. The Transition towards Carbon Neutrality: Land Use Policy, Resource and Energy Management Modes, and Spatial Planning Options. Land Use Policy 2025, 154, 107563. [Google Scholar] [CrossRef] [Scilit]
  31. Minasny, B.; Malone, B.P.; McBratney, A.B.; Angers, D.A.; Arrouays, D.; Chambers, A.; Chaplot, V.; Chen, Z.-S.; Cheng, K.; Das, B.S.; et al. Soil Carbon 4 per Mille. Geoderma 2017, 292, 59–86. [Google Scholar] [CrossRef] [Scilit]
  32. P1000 The International “4 per 1000” Initiative Soils for Food Security and Climate. Available online: https://4p1000.org/?lang=en/ (accessed on 31 July 2026).
  33. United Nations THE 17 GOALS | Sustainable Development. Available online: https://sdgs.un.org/goals (accessed on 31 July 2026).
  34. UNCCD. The Global Land Outlook; United Nations Convention to Combat Desertification: Bonn, Germany, 2022. [Google Scholar]
  35. Swan, T.; McBratney, A.; Field, D. Linkages between Soil Security and One Health: Implications for the 2030 Sustainable Development Goals. Front. Public Health 2024, 12, 1447663. [Google Scholar] [CrossRef] [Scilit] [PubMed]
  36. Food and Agriculture Organization of the United Nations RECSOIL |Global Soil Partnership|. Available online: https://www.fao.org/global-soil-partnership/en (accessed on 31 July 2026).
  37. FAO RECSOIL: Recarbonizing Global Soils—A Tool for Climate Change Mitigation. Available online: https://www.fao.org/global-soil-partnership/programmes/recsoil/en (accessed on 31 July 2026).
  38. Winiwarter, W.; Rypdal, K. Assessing the Uncertainty Associated with National Greenhouse Gas Emission Inventories: A Case Study for Austria. Atmos. Environ. 2001, 35, 5425–5440. [Google Scholar] [CrossRef] [Scilit]
  39. Ogle, S.M.; Domke, G.; Kurz, W.A.; Rocha, M.T.; Huffman, T.; Swan, A.; Smith, J.E.; Woodall, C.; Krug, T. Delineating Managed Land for Reporting National Greenhouse Gas Emissions and Removals to the United Nations Framework Convention on Climate Change. Carbon Balance Manag. 2018, 13, 9. [Google Scholar] [CrossRef] [Scilit] [PubMed]
  40. Crowther, T.W.; Todd-Brown, K.E.O.; Rowe, C.W.; Wieder, W.R.; Carey, J.C.; Machmuller, M.B.; Snoek, B.L.; Fang, S.; Zhou, G.; Allison, S.D.; et al. Quantifying Global Soil Carbon Losses in Response to Warming. Nature 2016, 540, 104–108. [Google Scholar] [CrossRef] [Scilit] [PubMed]
  41. Sothe, C.; Gonsamo, A.; Arabian, J.; Snider, J. Large Scale Mapping of Soil Organic Carbon Concentration with 3D Machine Learning and Satellite Observations. Geoderma 2022, 405, 115402. [Google Scholar] [CrossRef] [Scilit]
  42. Thurner, M.; Beer, C.; Santoro, M.; Carvalhais, N.; Wutzler, T.; Schepaschenko, D.; Shvidenko, A.; Kompter, E.; Ahrens, B.; Levick, S.R.; et al. Carbon Stock and Density of Northern Boreal and Temperate Forests. Glob. Ecol. Biogeogr. 2014, 23, 297–310. [Google Scholar] [CrossRef] [Scilit]
  43. Stephenson, N.L.; Das, A.J.; Condit, R.; Russo, S.E.; Baker, P.J.; Beckman, N.G.; Coomes, D.A.; Lines, E.R.; Morris, W.K.; Rüger, N.; et al. Rate of Tree Carbon Accumulation Increases Continuously with Tree Size. Nature 2014, 507, 90–93. [Google Scholar] [CrossRef] [Scilit] [PubMed]
  44. Poeplau, C.; Don, A. Carbon Sequestration in Agricultural Soils via Cultivation of Cover Crops—A Meta-Analysis. Agric. Ecosyst. Environ. 2015, 200, 33–41. [Google Scholar] [CrossRef] [Scilit]
  45. Zhang, J.; Yu, Z.; Gao, Y.; Li, Y.; Hu, X.; Gu, H.; Tang, C.; Liu, J.; Liu, J.; Zhang, S.; et al. Warming-Induced Unstable Microbial Community Metabolically Lowers Straw-Carbon Sequestration in Paddy Soils. J. Adv. Res. 2026, 82, 33–44. [Google Scholar] [CrossRef] [Scilit] [PubMed]
  46. FAO. Assessment of Global Forest Resources 2025; FAO: Rome, Italy, 2025. [Google Scholar]
  47. Python Software Foundation. Python 2021; Python Software Foundation: Beaverton, OR, USA, 2021. [Google Scholar]
  48. Virtanen, P.; Gommers, R.; Oliphant, T.E.; Haberland, M.; Reddy, T.; Cournapeau, D.; Burovski, E.; Peterson, P.; Weckesser, W.; Bright, J.; et al. SciPy 1.0: Fundamental Algorithms for Scientific Computing in Python. Nat. Methods 2020, 17, 261–272. [Google Scholar] [CrossRef] [Scilit] [PubMed]
  49. Hunter, J.D. Matplotlib: A 2D Graphics Environment. Comput. Sci. Eng. 2007, 9, 90–95. [Google Scholar] [CrossRef] [Scilit]
  50. Zhang, Y.; Guo, X.; Chen, L.; Kuzyakov, Y.; Wang, R.; Zhang, H.; Han, X.; Jiang, Y.; Sun, O.J. Global Pattern of Organic Carbon Pools in Forest Soils. Glob. Change Biol. 2024, 30, e17386. [Google Scholar] [CrossRef] [Scilit] [PubMed]
  51. Filipchuk, A.; Malysheva, N.; Zolina, T.; Seleznev, A. Carbon Stock in Living Biomass of Russian Forests: New Quantification Based on Data from the First Cycle of the State Forest Inventory. Cent. Eur. For. J. 2023, 69, 248–261. [Google Scholar] [CrossRef] [Scilit]
  52. Vangi, E.; D’Amico, G.; Francini, S.; Borghi, C.; Giannetti, F.; Corona, P.; Marchetti, M.; Travaglini, D.; Pellis, G.; Vitullo, M.; et al. Large-Scale High-Resolution Yearly Modeling of Forest Growing Stock Volume and above-Ground Carbon Pool. Environ. Model. Softw. 2023, 159, 105580. [Google Scholar] [CrossRef] [Scilit]
  53. Pan, Y.; Birdsey, R.A.; Phillips, O.L.; Houghton, R.A.; Fang, J.; Kauppi, P.E.; Keith, H.; Kurz, W.A.; Ito, A.; Lewis, S.L.; et al. The Enduring World Forest Carbon Sink. Nature 2024, 631, 563–569. [Google Scholar] [CrossRef] [Scilit] [PubMed]
  54. Cheng, Y.; Luo, P.; Yang, H.; Li, H.; Luo, C.; Jia, H.; Huang, Y. Fire Effects on Soil Carbon Cycling Pools in Forest Ecosystems: A Global Meta-Analysis. Sci. Total Environ. 2023, 895, 165001. [Google Scholar] [CrossRef] [Scilit] [PubMed]
  55. Wang, B.; Xu, G.; Li, Z.; Cheng, Y.; Gu, F.; Xu, M.; Zhang, Y. Carbon Pools in Forest Systems and New Estimation Based on an Investigation of Carbon Sequestration. J. Environ. Manag. 2024, 360, 121124. [Google Scholar] [CrossRef] [Scilit] [PubMed]
  56. Ahirwal, J.; Gogoi, A.; Sahoo, U.K. Stability of Soil Organic Carbon Pools Affected by Land Use and Land Cover Changes in Forests of Eastern Himalayan Region, India. CATENA 2022, 215, 106308. [Google Scholar] [CrossRef] [Scilit]
  57. Sahu, C.; Mishra, R.; Basti, S. Land-Use Change Affects Carbon Storage and Lability in Tropical Soil of India. Geoderma Reg. 2023, 32, e00621. [Google Scholar] [CrossRef] [Scilit]
  58. Medeiros, A.d.S.; Cesário, F.V.; dos Santos, T.C.; Ferreira Maia, S.M. Differences in the Storage of Soil Organic Carbon in Brazil’s Agricultural Land: A Meta-Analysis. CATENA 2025, 249, 108680. [Google Scholar] [CrossRef] [Scilit]
  59. Aguilar, F.X.; Sudekum, H.; McGarvey, R.; Knapp, B.; Domke, G.; Brandeis, C. Impacts of the US Southeast Wood Pellet Industry on Local Forest Carbon Stocks. Sci. Rep. 2022, 12, 19449. [Google Scholar] [CrossRef] [Scilit] [PubMed]
  60. Lu, F.; Hu, H.; Sun, W.; Zhu, J.; Liu, G.; Zhou, W.; Zhang, Q.; Shi, P.; Liu, X.; Wu, X.; et al. Effects of National Ecological Restoration Projects on Carbon Sequestration in China from 2001 to 2010. Proc. Natl. Acad. Sci. USA 2018, 115, 4039–4044. [Google Scholar] [CrossRef] [Scilit] [PubMed]
  61. Chen, Y.; Feng, X.; Fu, B.; Ma, H.; Zohner, C.; Crowther, T.; Huang, Y.; Wu, X.; Wei, F. Maps with 1 Km Resolution Reveal Increases in Above-and Belowground Forest Biomass Carbon Pools in China over the Past 20 Years. Earth Syst. Sci. Data 2023, 15, 897–910. [Google Scholar] [CrossRef] [Scilit]
  62. Cairns, M.A.; Brown, S.; Helmer, E.H.; Baumgardner, G.A. Root Biomass Allocation in the World’s Upland Forests. Oecologia 1997, 111, 1–11. [Google Scholar] [CrossRef] [Scilit] [PubMed]
  63. Sione, S.M.J.; Wilson, M.G.; Ledesma, S.G.; Gabioud, E.A.; Oszust, J.D.; Rosenberger, L.J. Driving Factors of Tree Biomass and Soil Carbon Pool in Xerophytic Forests of Northeastern Argentina. Ecol. Process 2023, 12, 64. [Google Scholar] [CrossRef] [Scilit]
  64. Li, H.; Wu, Y.; Liu, S.; Xiao, J.; Zhao, W.; Chen, J.; Alexandrov, G.; Cao, Y. Decipher Soil Organic Carbon Dynamics and Driving Forces across China Using Machine Learning. Glob. Change Biol. 2022, 28, 3394–3410. [Google Scholar] [CrossRef] [Scilit] [PubMed]
  65. Tao, F.; Huang, Y.; Hungate, B.A.; Manzoni, S.; Frey, S.D.; Schmidt, M.W.I.; Reichstein, M.; Carvalhais, N.; Ciais, P.; Jiang, L.; et al. Microbial Carbon Use Efficiency Promotes Global Soil Carbon Storage. Nature 2023, 618, 981–985. [Google Scholar] [CrossRef] [Scilit] [PubMed]
  66. Zhang, Y.; An, C.; Zhang, W.; Zheng, L.; Zhang, Y.; Lu, C.; Liu, L. Drivers of Mountain Soil Organic Carbon Stock Dynamics: A Review. J. Soils Sediments 2023, 23, 64–76. [Google Scholar] [CrossRef] [Scilit]
  67. Li, T.; Cheng, H.; Li, Y.; Mou, Z.; Zhu, X.; Wu, W.; Zhang, J.; Kuang, L.; Wang, J.; Hui, D.; et al. Divergent Accumulation of Amino Sugars and Lignins Mediated by Soil Functional Carbon Pools under Tropical Forest Conversion. Sci. Total Environ. 2023, 881, 163204. [Google Scholar] [CrossRef] [Scilit] [PubMed]
  68. Patoine, G.; Eisenhauer, N.; Cesarz, S.; Phillips, H.R.P.; Xu, X.; Zhang, L.; Guerra, C.A. Drivers and Trends of Global Soil Microbial Carbon over Two Decades. Nat. Commun. 2022, 13, 4195. [Google Scholar] [CrossRef] [Scilit] [PubMed]
  69. Clemmensen, K.E.; Bahr, A.; Ovaskainen, O.; Dahlberg, A.; Ekblad, A.; Wallander, H.; Stenlid, J.; Finlay, R.D.; Wardle, D.A.; Lindahl, B.D. Roots and Associated Fungi Drive Long-Term Carbon Sequestration in Boreal Forest. Science 2013, 339, 1615–1618. [Google Scholar] [CrossRef] [Scilit] [PubMed]
  70. Wan, P.; Zhao, X.; Ou, Z.; He, R.; Wang, P.; Cao, A. Forest Management Practices Change Topsoil Carbon Pools and Their Stability. Sci. Total Environ. 2023, 902, 166093. [Google Scholar] [CrossRef] [Scilit] [PubMed]
  71. Lange, M.; Eisenhauer, N.; Sierra, C.A.; Bessler, H.; Engels, C.; Griffiths, R.I.; Mellado-Vázquez, P.G.; Malik, A.A.; Roy, J.; Scheu, S.; et al. Plant Diversity Increases Soil Microbial Activity and Soil Carbon Storage. Nat. Commun. 2015, 6, 6707. [Google Scholar] [CrossRef] [Scilit] [PubMed]
  72. Qian, Z.; Li, Y.; Du, H.; Wang, K.; Li, D. Increasing Plant Species Diversity Enhances Microbial Necromass Carbon Content but Does Not Alter Its Contribution to Soil Organic Carbon Pool in a Subtropical Forest. Soil Biol. Biochem. 2023, 187, 109183. [Google Scholar] [CrossRef] [Scilit]
  73. Gelman, A.; Stern, H. The Difference Between “Significant” and “Not Significant” Is Not Itself Statistically Significant. Am. Stat. 2006, 60, 328–331. [Google Scholar] [CrossRef] [Scilit]
  74. Doetterl, S.; Berhe, A.A.; Heckman, K.; Lawrence, C.; Schnecker, J.; Vargas, R.; Vogel, C.; Wagai, R. A Landscape-Scale View of Soil Organic Matter Dynamics. Nat. Rev. Earth Environ. 2025, 6, 67–81. [Google Scholar] [CrossRef] [Scilit]
  75. Lavelle, P.; Decaëns, T.; Aubert, M.; Barot, S.; Blouin, M.; Bureau, F.; Margerie, P.; Mora, P.; Rossi, J.-P. Soil Invertebrates and Ecosystem Services. Eur. J. Soil Biol. 2006, 42, S3–S15. [Google Scholar] [CrossRef] [Scilit]
  76. Delgado-Baquerizo, M.; Maestre, F.T.; Gallardo, A.; Bowker, M.A.; Wallenstein, M.D.; Quero, J.L.; Ochoa, V.; Gozalo, B.; García-Gómez, M.; Soliveres, S.; et al. Decoupling of Soil Nutrient Cycles as a Function of Aridity in Global Drylands. Nature 2013, 502, 672–676. [Google Scholar] [CrossRef] [Scilit] [PubMed]
  77. Xu, H.; Zhang, Y.; Shao, X.; Liu, N. Soil Nitrogen and Climate Drive the Positive Effect of Biological Soil Crusts on Soil Organic Carbon Sequestration in Drylands: A Meta-Analysis. Sci. Total Environ. 2022, 803, 150030. [Google Scholar] [CrossRef] [Scilit] [PubMed]
  78. Cotrufo, M.F.; Ranalli, M.G.; Haddix, M.L.; Six, J.; Lugato, E. Soil Carbon Storage Informed by Particulate and Mineral-Associated Organic Matter. Nat. Geosci. 2019, 12, 989–994. [Google Scholar] [CrossRef] [Scilit]
  79. Hansen, P.M.; Even, R.; King, A.E.; Lavallee, J.; Schipanski, M.; Cotrufo, M.F. Distinct, Direct and Climate-Mediated Environmental Controls on Global Particulate and Mineral-Associated Organic Carbon Storage. Glob. Change Biol. 2024, 30, e17080. [Google Scholar] [CrossRef] [Scilit] [PubMed]
  80. Ren, Y.; Mao, D.; Wang, Z.; Yu, Z.; Xu, X.; Huang, Y.; Xi, Y.; Luo, L.; Jia, M.; Song, K.; et al. China’s Wetland Soil Organic Carbon Pool: New Estimation on Pool Size, Change, and Trajectory. Glob. Change Biol. 2023, 29, 6139–6156. [Google Scholar] [CrossRef] [Scilit] [PubMed]
  81. Rumpel, C.; Kögel-Knabner, I. Deep Soil Organic Matter—A Key but Poorly Understood Component of Terrestrial C Cycle. Plant Soil 2011, 338, 143–158. [Google Scholar] [CrossRef] [Scilit]
  82. Wang, T.; Dong, L.; Liu, Z. Factors Driving Carbon Accumulation in Forest Biomass and Soil Organic Carbon across Natural Forests and Planted Forests in China. Front. For. Glob. Change 2024, 6, 1333868. [Google Scholar] [CrossRef] [Scilit]
  83. Xu, S.; Eisenhauer, N.; Zeng, Z.; Mo, X.; Ding, Y.; Lai, D.Y.F.; Wang, J. Drivers of Soil Organic Carbon Recovery under Forest Restoration: A Global Meta-Analysis. Carbon Res. 2024, 3, 80. [Google Scholar] [CrossRef] [Scilit]
  84. Satdichanh, M.; Dossa, G.G.O.; Yan, K.; Tomlinson, K.W.; Barton, K.E.; Crow, S.E.; Winowiecki, L.; Vågen, T.-G.; Xu, J.; Harrison, R.D. Drivers of Soil Organic Carbon Stock during Tropical Forest Succession. J. Ecol. 2023, 111, 1722–1734. [Google Scholar] [CrossRef] [Scilit]
  85. Leuschner, C.; Feldmann, E.; Pichler, V.; Glatthorn, J.; Hertel, D. Forest Management Impact on Soil Organic Carbon: A Paired-Plot Study in Primeval and Managed European Beech Forests. For. Ecol. Manag. 2022, 512, 120163. [Google Scholar] [CrossRef] [Scilit]
  86. Wang, S.; Roland, B.; Adhikari, K.; Zhuang, Q.; Jin, X.; Han, C.; Qian, F. Spatial-Temporal Variations and Driving Factors of Soil Organic Carbon in Forest Ecosystems of Northeast China. For. Ecosyst. 2023, 10, 100101. [Google Scholar] [CrossRef] [Scilit]
  87. Das, S.; Deb, S.; Sahoo, S.S.; Sahoo, U.K. Soil Microbial Biomass Carbon Stock and Its Relation with Climatic and Other Environmental Factors in Forest Ecosystems: A Review. Acta Ecol. Sin. 2023, 43, 933–945. [Google Scholar] [CrossRef] [Scilit]
  88. Lapola, D.M.; Pinho, P.; Barlow, J.; Aragão, L.E.O.C.; Berenguer, E.; Carmenta, R.; Liddy, H.M.; Seixas, H.; Silva, C.V.J.; Silva-Junior, C.H.L.; et al. The Drivers and Impacts of Amazon Forest Degradation. Science 2023, 379, eabp8622. [Google Scholar] [CrossRef] [Scilit] [PubMed]
Figure 1. Regional variation in (A) SOC and (B) CAGB density (t C ha−1), together with total forest area (Mha), across global regions in 2025. Boxplots show medians and interquartile ranges. Letters indicate Dunn’s post hoc groups following Bonferroni correction (p < 0.05); regions sharing a letter are not significantly different. Shaded bars show total forest area based on FRA 2025.
Land 15 01742 g001
Figure 2. Spearman correlation matrix showing pairwise relationships between ecosystem carbon pools (SOC, CAGB, CBGB, CDW, CLIT) and macroclimatic drivers (mean annual temperature and precipitation). Note: Circle size and color intensity are proportional to Spearman’s rank correlation coefficient (ρ). Significance levels: * p < 0.05, ** p < 0.01, *** p < 0.001.
Land 15 01742 g002
Figure 3. Variance partitioning of SOC density in 2025 using additive B-spline regressions. The diagram shows the unique contributions of mean annual precipitation and litter carbon (CLIT), their shared contribution, and the proportion of variation not explained by these predictors. [a] represents the unique (pure) fraction explained by mean precipitation (17.4%); [b] represents the unique (pure) fraction explained by litter carbon (18.2%); and [c] represents the shared fraction jointly attributable to mean precipitation and litter carbon (0.3%).
Land 15 01742 g003
Figure 4. Standardized effect sizes of macroclimatic drivers on SOC density in 1990 and 2025. Dots represent mean standardized effect sizes, and horizontal error bars denote 95% percentile confidence intervals.
Land 15 01742 g004
Disclaimer/Publisher’s Note: The statements, opinions and data contained in all publications are solely those of the individual author(s) and contributor(s) and not of MDPI and/or the editor(s). MDPI and/or the editor(s) disclaim responsibility for any injury to people or property resulting from any ideas, methods, instructions or products referred to in the content.