1. Introduction
Historic cities are not static containers of heritage, but built environments that continuously evolve through long-term use, functional adjustment, and construction activity [
1]. Contemporary urban regeneration therefore needs to reconcile current functional demands with the need to maintain inherited spatial structures and historical continuity [
2,
3]. Urban morphology provides a theoretical basis for understanding this evolving condition. It considers streets, plots, buildings, and blocks as interrelated components whose present configuration has developed through processes of formation and transformation over time [
4,
5,
6]. Synchronic analysis distinguishes morphological differences among spatial units at the same point in time, whereas diachronic analysis traces the formation and transformation of the same space over time [
7].
Although urban morphological assessment has become increasingly effective in describing and comparing the physical and spatial characteristics of existing urban form, synchronic descriptions alone cannot explain how observed configurations have developed over time [
8,
9]. A process-based perspective is therefore needed to interpret urban form not only as a present condition, but also as the accumulated outcome of long-term continuity and transformation. From this perspective, morphological change is neither spatially uniform nor necessarily synchronous. Continuity and change may operate simultaneously at different spatial scales, while local modifications can accumulate to alter the morphological character of larger spatial units [
10,
11]. Recent developments in urban morphology have further emphasized a shift from descriptive and classificatory analysis toward quantitative representation and the investigation of morphological evolution and transformation processes, linking morphological description, measurement, and process interpretation [
12]. Together, these perspectives provide a conceptual basis for relating fine-scale morphological change to the composition and transformation of larger spatial units.
The development of GIS, 3D building data, and quantitative morphological methods has increased the reproducibility and comparability of urban-form analysis [
13,
14]. Building coverage, floor area ratio, height, street configuration, and related morphometric indicators can describe development intensity and spatial organization, while morphological tessellation, grid-based analysis, and data-driven classification provide relatively consistent spatial units for quantitative comparison [
15,
16]. Recent methodological reviews nevertheless indicate substantial variation in the terminology and operational definitions of quantitative urban-morphology measures, suggesting that methodological consistency and comparability remain important concerns [
17]. Alongside these developments, diachronic research has increasingly used historical maps and longitudinal spatial data to reconstruct urban fabric and examine physical change over time [
18,
19,
20]. Long-term studies also show that continuity and change are related to morphological conditions and may operate across different spatial scales [
11,
21]. Multilevel frameworks have further extended such analysis across buildings, grids, and larger spatial units [
22]. However, integrating temporal and multiscale analysis remains limited, particularly in explaining how different transformation histories accumulate within contemporary blocks.
Old Beijing city provides a representative case for investigating these issues. As a historic core area integrating cultural heritage, everyday life, and diverse urban functions, it has long faced tensions between inherited spatial structures and contemporary development needs [
3,
23,
24]. Its basic street network and some structural relationships retain identifiable continuity [
25,
26], while building scales and local fabric have undergone substantial transformations since the latter half of the 20th century, with marked temporal and spatial differences [
27]. Recent research further indicates that successive transformations have diversified block form and parcel structure in Beijing rather than producing uniform replacement [
23,
28]. Consequently, old Beijing city is neither a static historical relic nor an urban area entirely replaced by modern development, but a layered built environment shaped by long-term continuity and localized reconstruction.
Against this background, this study uses building data from five time slices, namely 1949, 1978, 2000, 2008, and 2024, selected according to explicit criteria concerning historical relevance and data consistency, to develop a process-based multiscale framework linking morphological trajectories with contemporary block diagnosis. The framework examines not only where different forms of change occur, but also how different processes of continuity and change accumulate and are spatially organized within blocks.
A hybrid block is defined as a block in which a relatively persistent morphological base coexists with spatial units characterized by different transformation trajectories and timing of change, producing a layered morphology. The study attempts to answer: First, what major morphological trajectories emerged in old Beijing city from 1949 to 2024, and how are they spatially distributed? Second, how do different trajectories combine within blocks to form distinct block morphological types? Third, what temporal layering and internal spatial organization characterize hybrid blocks, and what implications do these characteristics have for differentiated regeneration in historic urban areas?
2. Materials and Methods
2.1. Research Framework
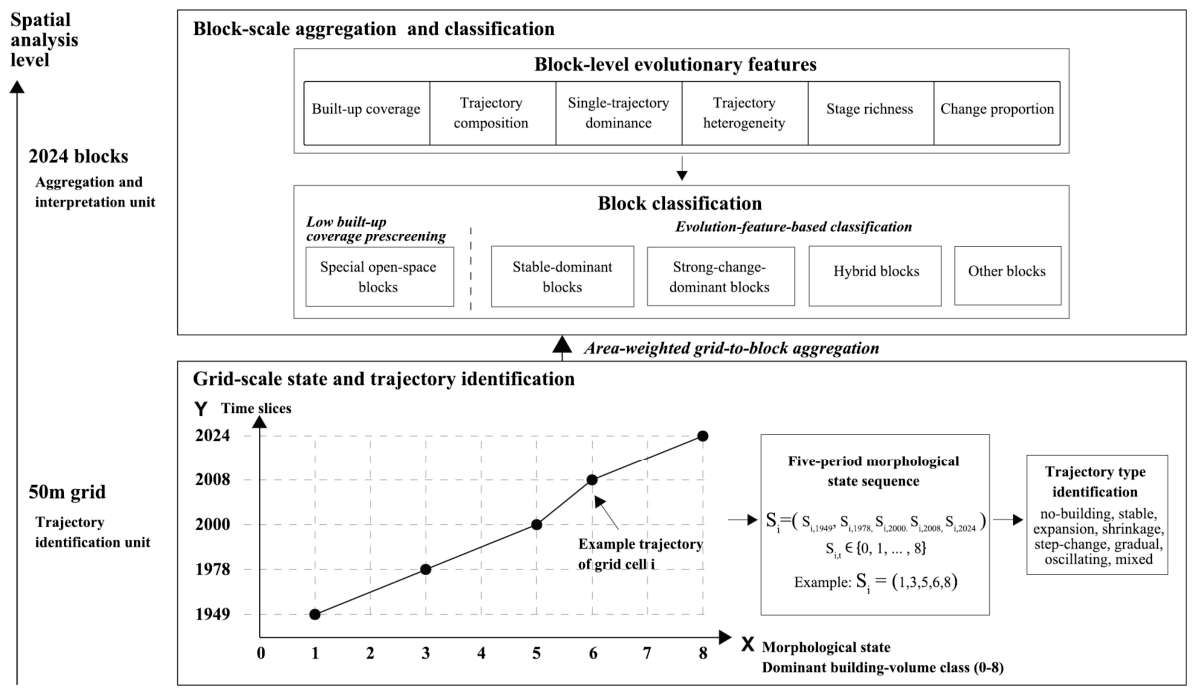
This study constructs a multiscale analytical framework of “grid trajectory identification and block classification” (
Figure 1). Regular grids, as spatially consistent measurement units across time, are used to identify local morphological states and their evolutionary trajectories; blocks, as morphological units with actual spatial boundaries, are used to explain combinations of different trajectories in the contemporary urban fabric.
The research process is as follows: First, multi-period building data are used to identify dominant volume states and classify grid-level morphological trajectories. Second, grid trajectories are aggregated to the 2024 blocks using intersection-area weights to calculate block-level trajectory composition and classify blocks into special open-space, stable-dominant, strong-change-dominant, hybrid, and other blocks. Third, built-form indicators and representative cases are used to compare block characteristics and interpret how different trajectories are spatially organized within blocks.
2.2. Study Area and Temporal Framework
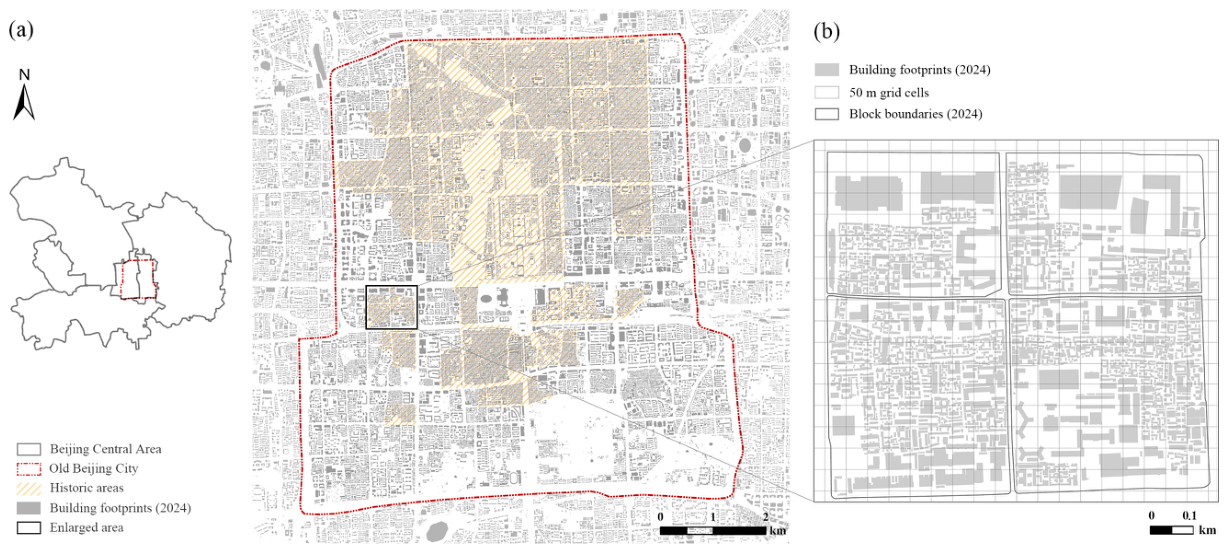
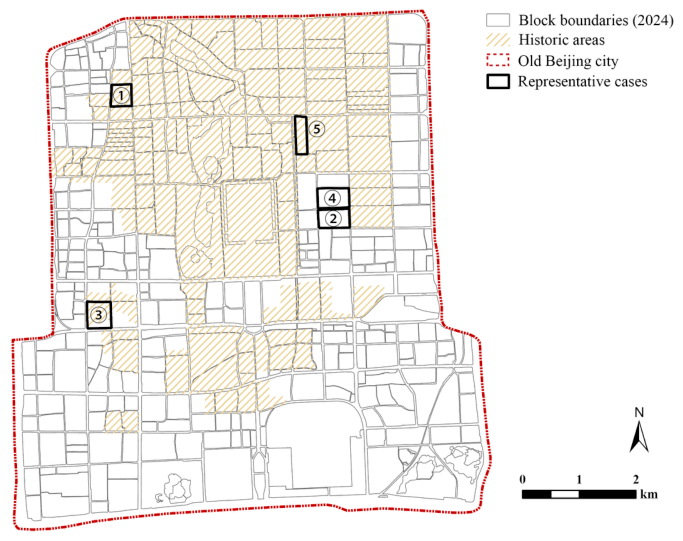
The study area is old Beijing city, defined as the area within and including the Ming-Qing moat and its surviving traces, which roughly corresponds to the area within the current Second Ring Road (
Figure 2a). Water bodies are excluded from the effective analysis area because they do not constitute built-up morphological units. The study area is partitioned into 50 m grid cells for grid-level morphological analysis. Based on the 2024 street network and block boundaries, 428 blocks are delineated as the spatial units for aggregating grid trajectories and interpreting contemporary block morphology (
Figure 2b).
The study uses five time slices: 1949, 1978, 2000, 2008, and 2024 (
Table 1). These years are selected as historically meaningful morphological snapshots rather than as equally spaced temporal samples. They represent, respectively, the early post-1949 morphological state, the eve of reform and opening up, the phase of accelerated redevelopment and marketization around 2000, the Olympic-era construction phase, and the contemporary built environment.
Because the observation intervals are unequal, interval-level changes were additionally normalized by interval length for comparison. The 2000–2008 interval showed the highest annualized changed-grid proportion, large-jump proportion, and mean absolute state change, indicating a concentrated phase of morphological transformation. The 2008 snapshot was therefore retained to improve temporal resolution during this period. These annualized comparisons do not indicate the exact timing or rate of individual changes within each interval.
2.3. Construction and Quality Control of the Multi-Temporal Building Datasets
All five datasets contain building footprints and storey information. As summarized in
Table 1, the multi-temporal database was constructed using the building CAD dataset representing conditions around 2000 as a common geometric reference. The 2000 geometry was not directly transferred to other periods; earlier and later datasets were reconstructed or updated through manual interpretation of historical imagery and supporting spatial materials.
Building footprints were manually digitized in ArcGIS Pro 3.5 based on visible building edges and their spatial relationships with streets, alleys, courtyards, and adjacent buildings. Ambiguous boundaries were cross-checked against temporally adjacent imagery and available historical materials. Historical raster sources requiring geometric correction were georeferenced to the Beijing 1954 3 Degree GK CM 117E projected coordinate system. Historic landmarks, major road intersections, and identifiable features of the Forbidden City were used as ground control points, and a second-order polynomial transformation was applied.
Storey information was reconstructed from available documentary and visual sources and, where necessary, shadow-based height estimates using a standardized floor height of 3 m. Data quality control was conducted iteratively by cross-checking building presence, footprints, and storey information against available historical evidence and correcting identified inconsistencies.
The datasets remain subject to temporal uncertainty associated with differences between image dates and target years, positional uncertainty related to image resolution, geometric rectification, and manual digitization, and attribute uncertainty in reconstructed storey information. These uncertainties are greater for the earlier periods. Accordingly, the datasets are intended for morphological comparison at the 50 m grid and block scales rather than cadastral-level reconstruction of individual buildings.
2.4. Grid-Based Morphological State and Trajectory Identification
2.4.1. Grid Construction and Building Volume State
Two nested grids, 50 m × 50 m and 100 m × 100 m, are used in this study. The 50 m grid serves as the primary unit for identifying grid-level morphological states and trajectories, while the 100 m grid is used to calculate GSI and FSI for characterizing building coverage and development intensity. The two grids form a 2 × 2 nested spatial relationship. The 50 m cell size is not regarded as a uniquely correct historical morphological scale, but as an operational resolution selected to retain fine-grained morphological variation while remaining compatible with the subsequent 100 m structural analysis.
The former inner and outer city walls are excluded from the volume-state and trajectory analyses because they largely disappeared during the study period and do not constitute comparable building-volume units across the five time slices. Persistent enclosing structures, such as the Forbidden City walls, are retained.
The distribution of building volumes in old Beijing city is strongly right-skewed and spans a wide range across periods. Volumes are log10-transformed, and a unified global log-volume range is divided into eight equal-width intervals, with the same class boundaries applied to all five periods to ensure temporal comparability. The corresponding volume ranges and general scale interpretations are reported in
Table 2.
For each grid cell and time slice, the total building volume within each of the eight volume classes is calculated. The class contributing the largest volume is defined as the dominant state of the grid cell:
where
represents the state of grid cell
at time
,
is the global volume class of building
, and
is the indicator function. Grid cells without buildings are assigned a value of 0.
The dominant-state representation necessarily simplifies within-cell volume composition by suppressing information on secondary volume classes and is therefore used as a reduced state representation for temporal trajectory analysis rather than as a complete description of within-cell morphology.
2.4.2. Classification of Grid-Level Morphological Trajectories
For each grid cell
, a five-period state sequence is constructed:
The state difference between adjacent time slices is calculated as:
The maximum absolute jump within the state sequence is defined as:
Trajectory types are assigned according to a fixed, hierarchical, and mutually exclusive set of rules. Special operational conditions and morphological interpretations are shown in
Table 3. The trajectory categories represent distinct temporal sequence patterns rather than equal intervals along a single continuous measure.
2.5. Area-Weighted Aggregation and Block Classification
Grid trajectories are aggregated to blocks by intersecting the grid with the 2024 block boundaries and weighting each trajectory by its intersection area.
where
is the effective intersection area between grid cell
and block
,
is the trajectory type of grid cell
, and
indicates whether the grid cell belongs to type
.
The final block classification uses seven features (
Table 4). The block-level indicators describe different conceptual dimensions—including built-up condition, dominance of a single trajectory, stable-base proportion, change intensity, trajectory heterogeneity, and temporal richness—and therefore do not share a common numerical threshold. Thresholds are specified according to the empirical distribution and morphological interpretation of each indicator and are subsequently evaluated through neighboring-threshold sensitivity tests. They are operational criteria calibrated to this dataset rather than universal thresholds.
Block types are assigned using a sequential, mutually exclusive hierarchy; once a block meets the criteria for a prior type, it is no longer considered for subsequent categories (
Table 5). Blocks not identified as special open-space and not meeting the full criteria for stable-dominant, strong-change-dominant, or hybrid blocks were retained as other. This residual category was intentionally preserved to avoid forced classification of heterogeneous threshold-boundary cases.
2.6. Robustness, Sensitivity, and Morphological Consistency Assessment
The robustness of the classification framework was assessed through tests of temporal sampling, building volume discretization, spatial resolution, and classification thresholds (
Table 6).
To evaluate the effect of temporal sampling, the trajectory analysis was repeated without the 2008 observation. The resulting classification remained highly consistent with the five-snapshot baseline, with only limited redistribution among trajectory categories. This indicates that the 2008 snapshot improves temporal resolution without materially altering the principal trajectory pattern.
Building volume discretization was examined using alternative schemes with six and ten classes based on the same global log volume range. Both alternatives showed substantial agreement with the baseline eight-class classification, indicating that the main trajectory patterns are broadly robust to reasonable changes in volume class resolution.
Spatial resolution was assessed by repeating the trajectory and block classification procedures using a 100 m grid and comparing the results with the baseline 50 m analysis. Final block classifications agreed for 72.90% of blocks, indicating moderate cross-scale consistency. Block-level trajectory proportions remained comparatively stable, whereas within-block heterogeneity, dominance, and temporal richness were more sensitive to spatial aggregation. Although the overall numbers of hybrid blocks were similar at the two scales (55 and 53), only 28 of the 55 baseline hybrid blocks remained hybrid at 100 m. Hybrid identification is therefore more scale-sensitive than the overall block-type distribution, supporting the 50 m grid as the baseline for resolving finer differences within blocks.
Classification threshold robustness was evaluated using 23 one-at-a-time perturbation scenarios, in which one threshold was varied while the others were held at their baseline values. Agreement with the baseline classification ranged from 92.52% to 100% and exceeded 97% in 20 scenarios. Of the 428 blocks, 317 retained the same classification in all scenarios, and 400 changed in no more than one scenario. Hybrid identification was comparatively more sensitive to and , indicating that multi-stage change and within-block trajectory heterogeneity form the principal boundary conditions for this category. The thresholds are therefore treated as operational typological criteria rather than universal cutoffs.
To quantify temporal asynchrony at the block level and assess whether hybrid blocks exhibit temporal characteristics beyond trajectory heterogeneity and multi-stage change, an additional post-classification measure based on the timing of principal grid-cell change was calculated. For each changed 50 m grid cell, the absolute change in building-volume state was calculated over four consecutive observation intervals (1949–1978, 1978–2000, 2000–2008, and 2008–2024). The interval with the largest absolute state change was identified as the cell’s principal change interval. When two or more intervals shared the maximum, the cell was assigned fractionally and equally to the tied intervals rather than forced into a single interval.
Within each block,
denotes the proportion of the total changed grid-cell area in block b assigned to observation interval k, with
. Temporal asynchrony was quantified using normalized change-timing entropy:
The normalized change-timing entropy ranges from 0 to 1, with higher values indicating greater dispersion of principal change timing across observation intervals. Unlike , which measures heterogeneity in trajectory types, characterizes the temporal dispersion of principal morphological change within a block. It was calculated only after block classification and was not included in any classification criterion. Spearman’s rank correlation was then used to examine its associations with and .
GSI and FSI were additionally used to examine morphological consistency between trajectory or block types and contemporary building coverage and development intensity. Because these indicators were derived from the same underlying building data, they are interpreted as an internal morphological consistency check rather than as independent validation.
Ground space index (GSI) and floor space index (FSI) at the 100 m scale are calculated as follows:
where
denotes the building footprint area assigned to analysis unit
;
denotes the number of storeys; and
denotes the effective area of the analysis unit.
3. Results
3.1. Grid-Level Morphological Trajectories, 1949–2024
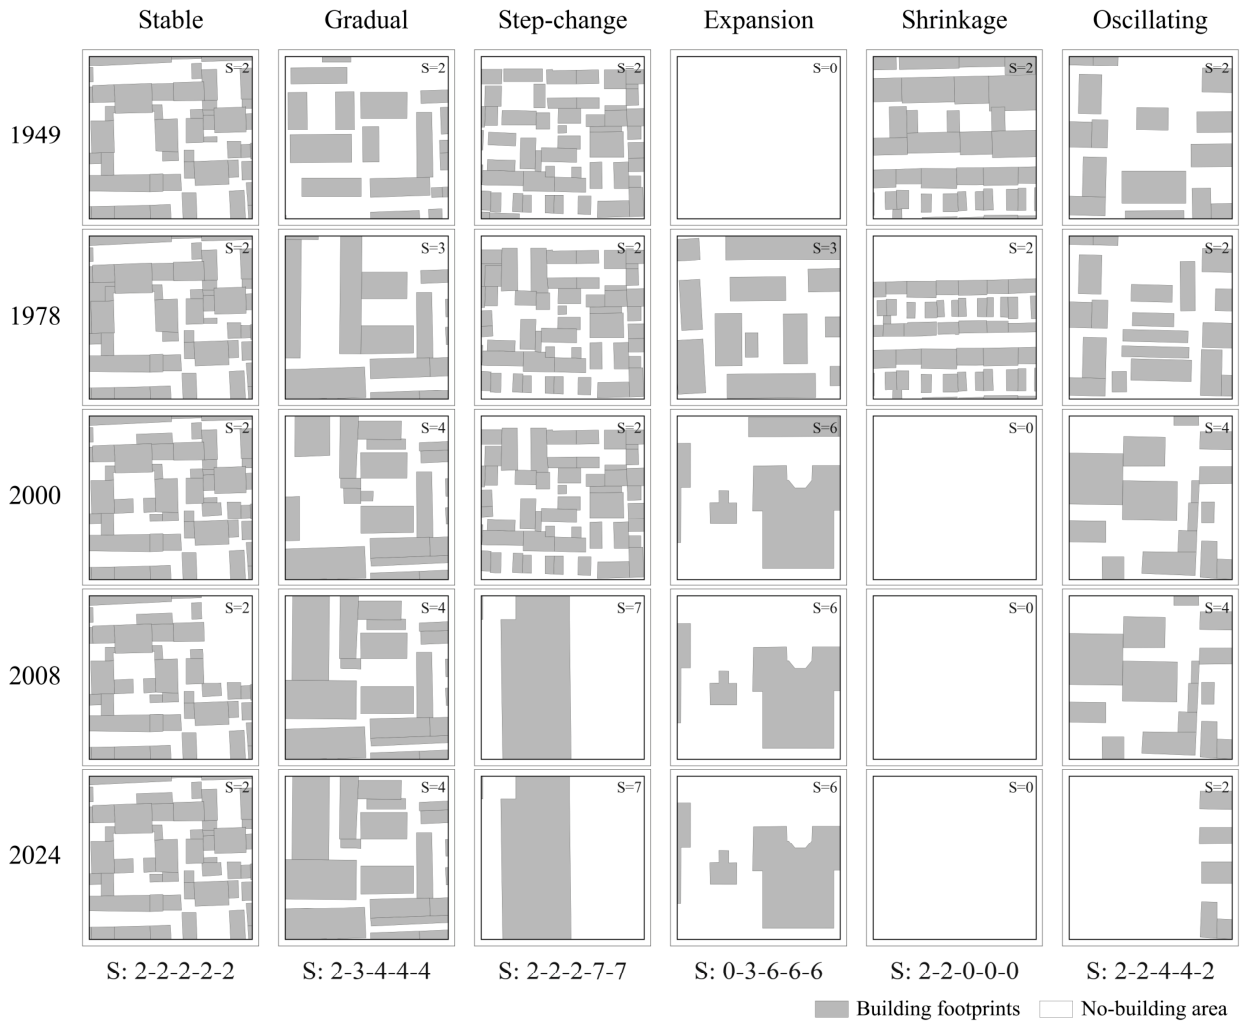
For each grid cell, building-volume states in 1949, 1978, 2000, 2008, and 2024 are encoded as a state sequence ranging from 0 to 8. These sequences are classified into eight mutually exclusive trajectory types: no-building, stable, expansion, shrinkage, gradual, step-change, oscillating, and mixed. Selected trajectory examples are illustrated in
Figure 3.
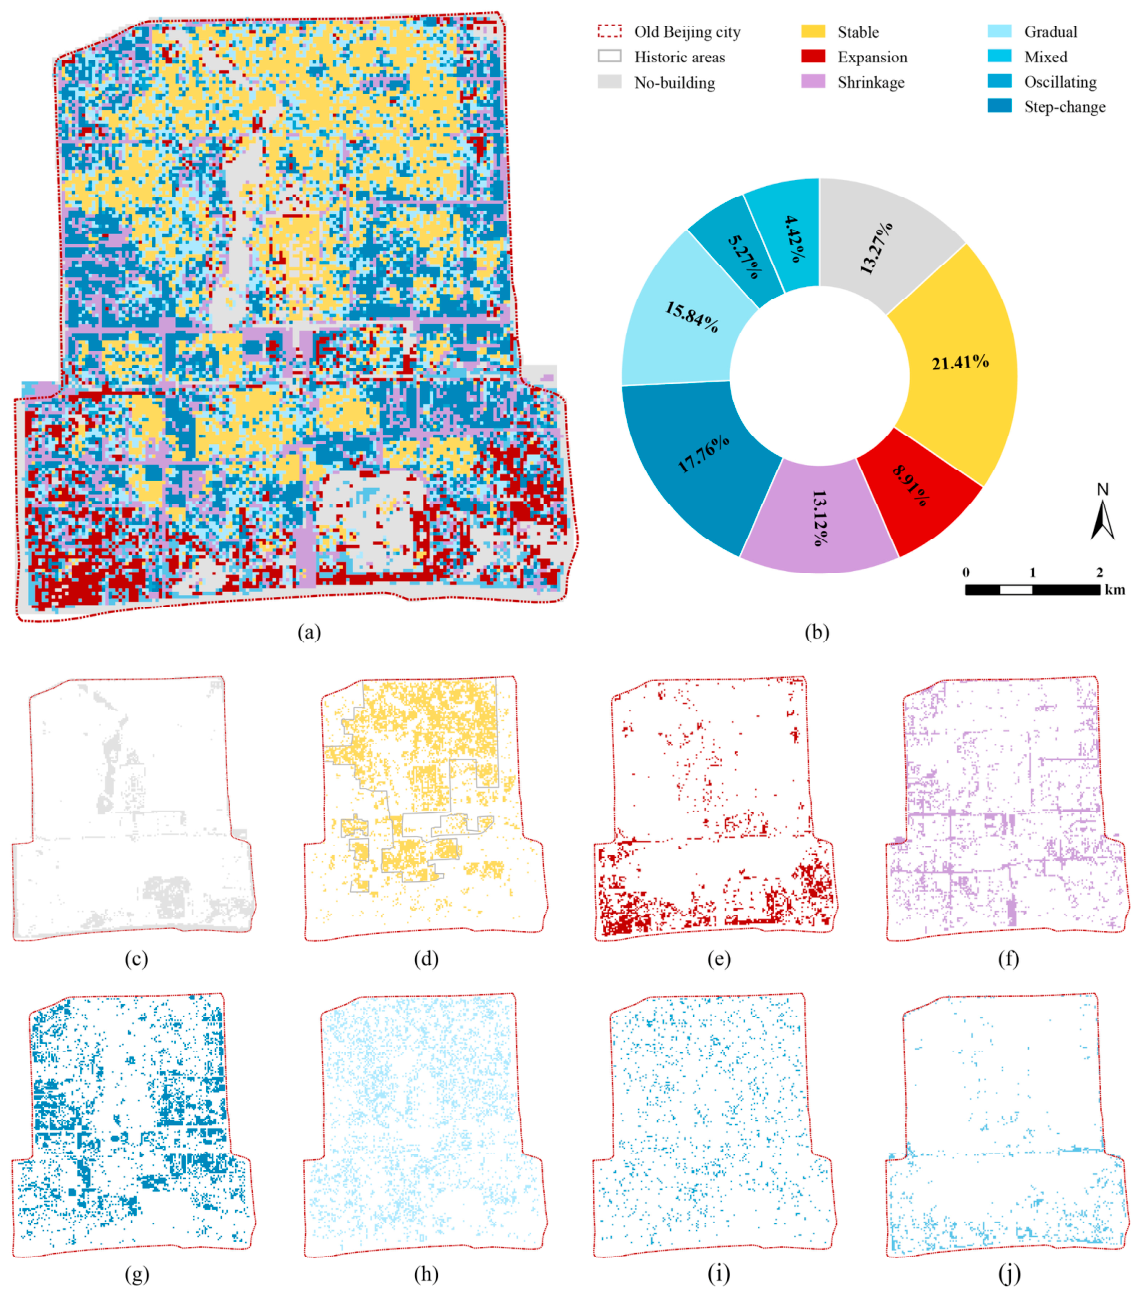
Grid-level trajectories (
Figure 4a) reveal that old Beijing city does not undergo a single, unified renewal pathway between 1949 and 2024. In terms of area composition, stable, step-change, and gradual trajectories account for the three largest area shares (
Figure 4b). This indicates that the long-term morphological changes in old Beijing city do not proceed synchronously across the entire area but are instead shaped by localized processes differing in magnitude, direction, and temporal sequences.
In terms of spatial distribution, stable trajectories are not uniformly distributed but are concentrated in areas largely corresponding to Beijing’s historic areas and to relatively continuous traditional street and alley networks and courtyard fabric (
Figure 4d). A footprint-persistence check of all 5505 stable cells showed substantial spatial continuity: mean retention across adjacent periods ranged from 90.84% to 96.18%, and 77.09% retained at least 70% of their 1949 footprint through 2024. These grids typically maintain high building coverage, but development intensity and building scale are relatively limited, reflecting the constraining effect of the historical fabric on subsequent renewal. In contrast, step-change trajectories occur more frequently along the edges of the old city, major thoroughfares, key nodes, and localized project-led renewal areas, and are associated with localized morphological restructuring and large differences in building volume and scale between successive observations (
Figure 4g). Gradual trajectories are often located between stable fabric and step-change areas and show relatively continuous morphological transitions in building volume and scale across successive observations (
Figure 4h).
3.2. Spatial Selectivity of Stable and Changing Trajectories
To determine whether different trajectories indicate specific spatial structural patterns, this study further conducts a coupled analysis of trajectory types and the spatial structure of GSI–FSI morphological patterns. Compared with building height or building density alone, the GSI–FSI framework more clearly distinguishes low-rise, high-coverage historical fabric; high-rise, low-coverage modern development areas; high-coverage, high-intensity renewal areas; and low-coverage, low-intensity open spaces or sparsely built areas.
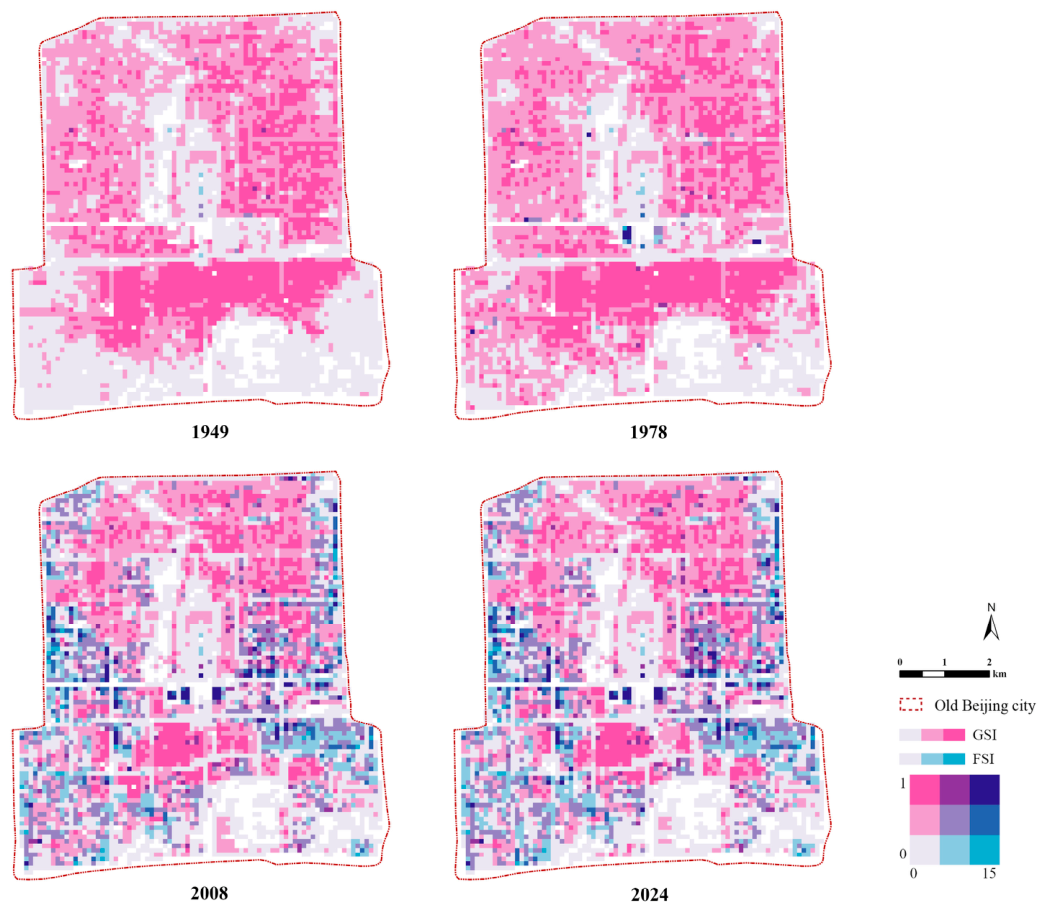
Multi-period GSI–FSI results show that the built form of old Beijing city exhibits an overall trend of shifting from a low-intensity state to a higher development intensity state over the long term; however, this shift is not a simple linear increase (
Figure 5). Some areas have remained in the high-coverage, low-intensity range for an extended period, forming the morphological foundation for the continuation of traditional patterns; other areas rapidly entered the high-coverage, high-intensity range during specific phases, creating high-intensity nodes of localized modern development.
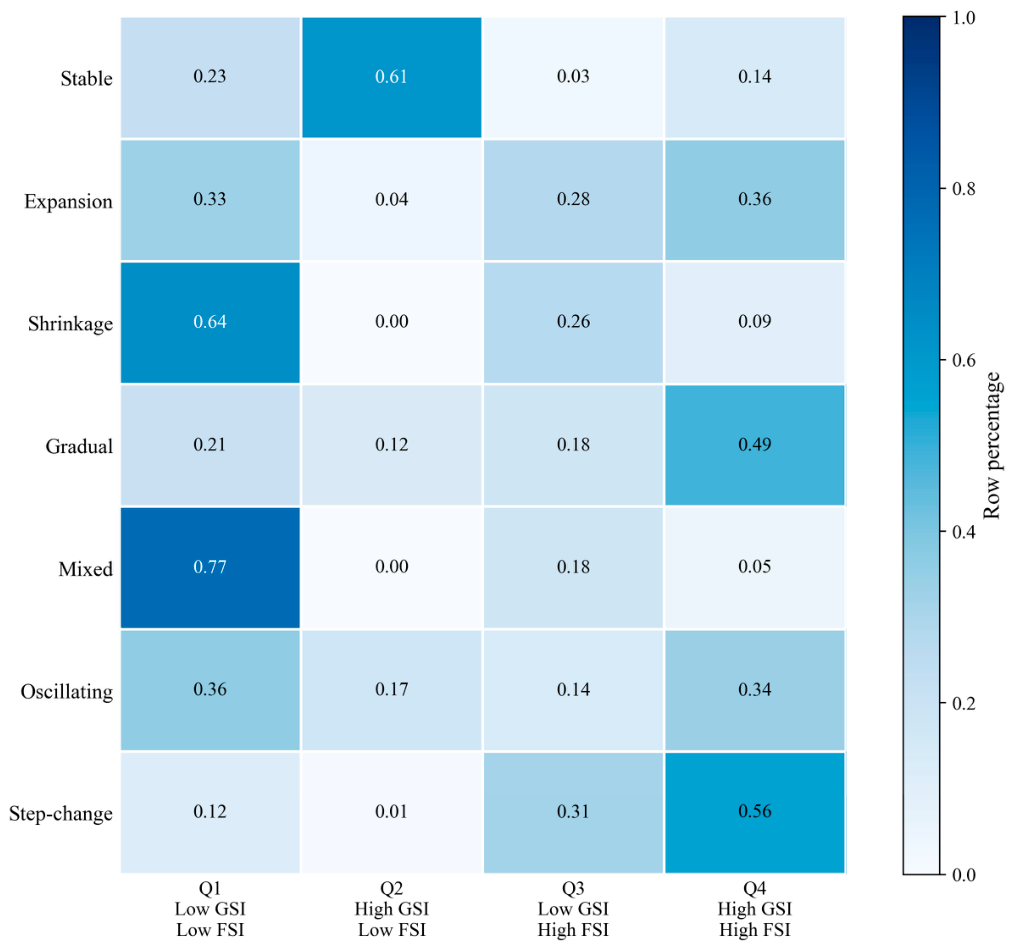
Different morphological trajectories show distinct associations with the 2024 GSI–FSI structural states (
Figure 6). Stable trajectories are primarily concentrated in Q2 (high GSI, low FSI; 61%). Step-change trajectories are concentrated in the high-FSI quadrants, particularly Q4 (56%) and Q3 (31%). Gradual trajectories are more broadly distributed, although their largest share occurs in Q4 (49%), while expansion trajectories are relatively evenly distributed across Q1, Q3, and Q4. By contrast, shrinkage and mixed trajectories are concentrated mainly in Q1, accounting for approximately 64% and 77%, respectively. Oscillating trajectories are distributed across several quadrants, particularly Q1 (36%) and Q4 (34%), indicating a weaker correspondence with any single contemporary structural state. These patterns indicate that stable and strong-change processes are associated with contrasting contemporary structural conditions, while other trajectory types exhibit more varied GSI–FSI configurations.
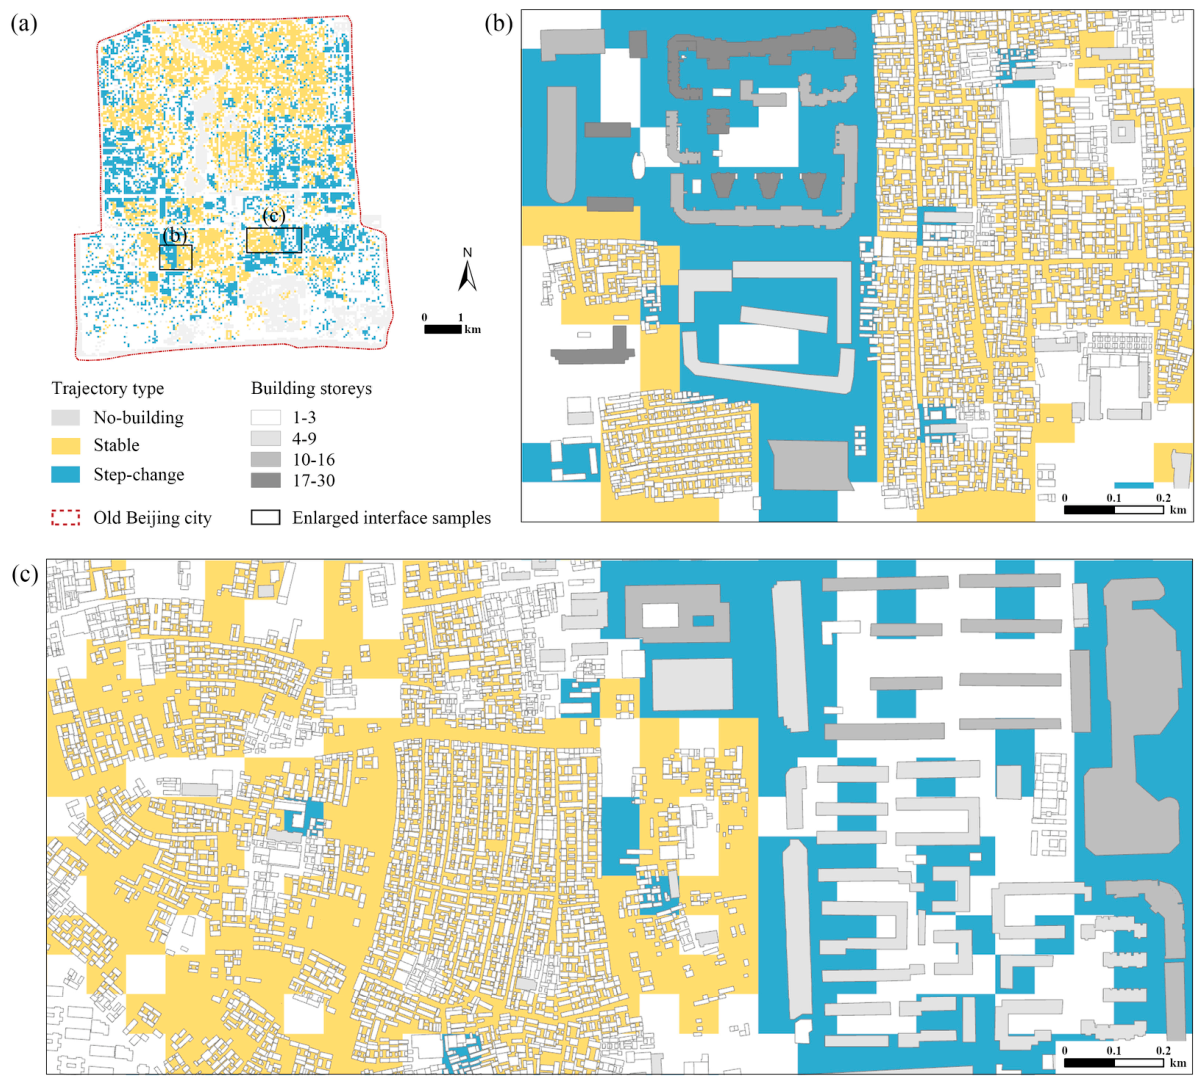
From a spatial distribution perspective, stable trajectories primarily correspond to continuously preserved traditional building fabric, while step-change trajectories are more concentrated along road corridors, at the edges of the old city, at functional nodes, and around project-based renewal units. Enlarged samples further reveal clear morphological interfaces between the two trajectories: one side retains a continuous and dense low-rise organization, while the other consists of larger and more regular redevelopment units. Although the samples cover different extents, both demonstrate the selective intervention of step-change redevelopment in particular spatial units and its juxtaposition, insertion, or discontinuity relative to the surrounding stable fabric (
Figure 7).
Therefore, the morphological renewal of old Beijing city is not an area-wide, synchronous replacement process but a selective process of insertion shaped by the existing historic fabric, modern development needs, and spatial control boundaries. Stable trajectories preserve the continuity of the historic urban fabric, while step-change reconstruction alters development intensity and building scale in specific areas through localized, project-based interventions. Together, these constitute a spatial pattern in which the continuous fabric of old Beijing city coexists with localized reconstruction.
3.3. From Grid Trajectories to Block-Level Morphological Types
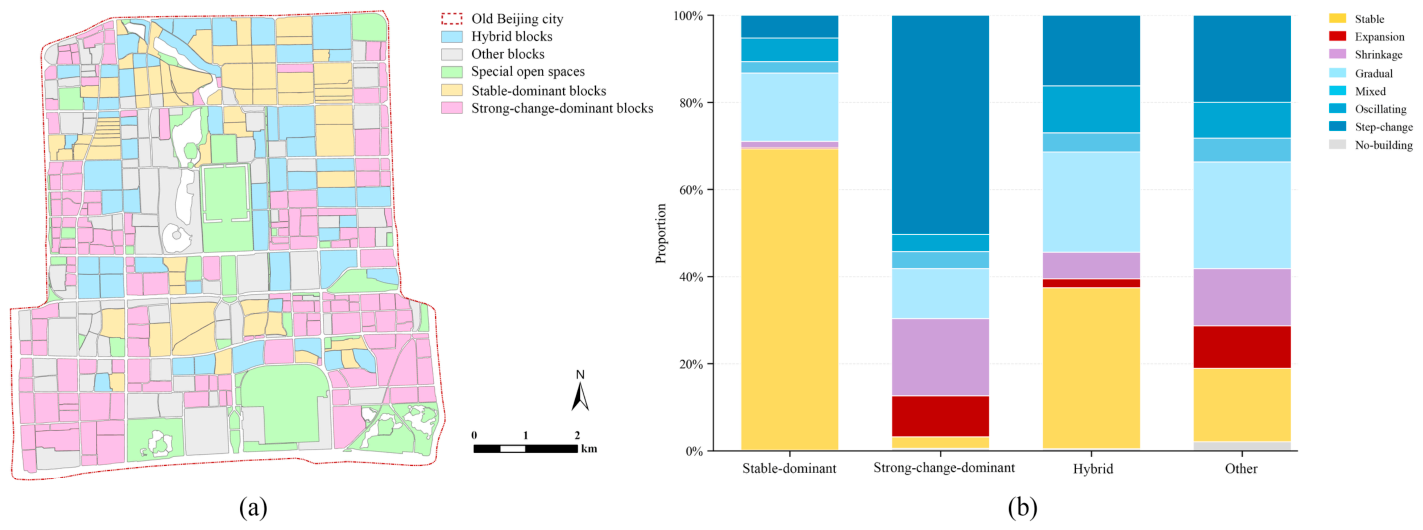
Grid-level trajectories are further aggregated to the 2024 blocks using area weights, revealing distinct block types across old Beijing city (
Figure 8a). Among the 428 blocks, this study identifies 62 special open-space blocks, 67 stable-dominant blocks, 163 strong-change-dominant blocks, 55 hybrid blocks, and 81 other blocks. These block types are spatially interspersed rather than forming completely separated zones.
The process composition of different block types further supports the above classification (
Figure 8b). Stable-dominant and strong-change-dominant blocks are characterized primarily by stable and step-change trajectories, respectively. In contrast, the process composition of hybrid blocks is more dispersed, with multiple trajectories coexisting within the blocks, indicating that their morphology reflects the superposition of distinct transformation processes rather than a single dominant evolutionary process.
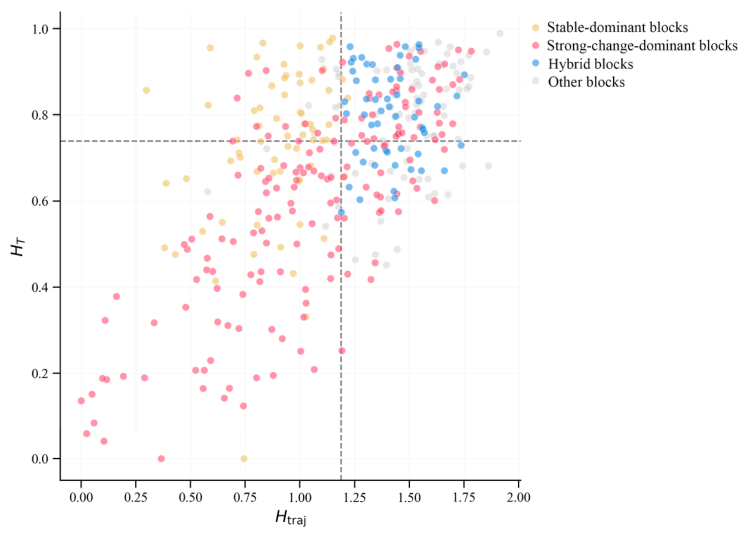
A post-classification change-timing entropy is further used to test whether trajectory heterogeneity also corresponds to temporal asynchrony (
Figure 9). Hybrid blocks show a higher median
than strong-change-dominant blocks (0.809 versus 0.632), indicating greater dispersion in the timing of principal morphological change.
is moderately correlated with
(Spearman’s ρ = 0.573) and more weakly correlated with
(ρ = 0.383). These relationships indicate that temporal asynchrony is associated with, but not equivalent to, trajectory heterogeneity or multi-stage change.
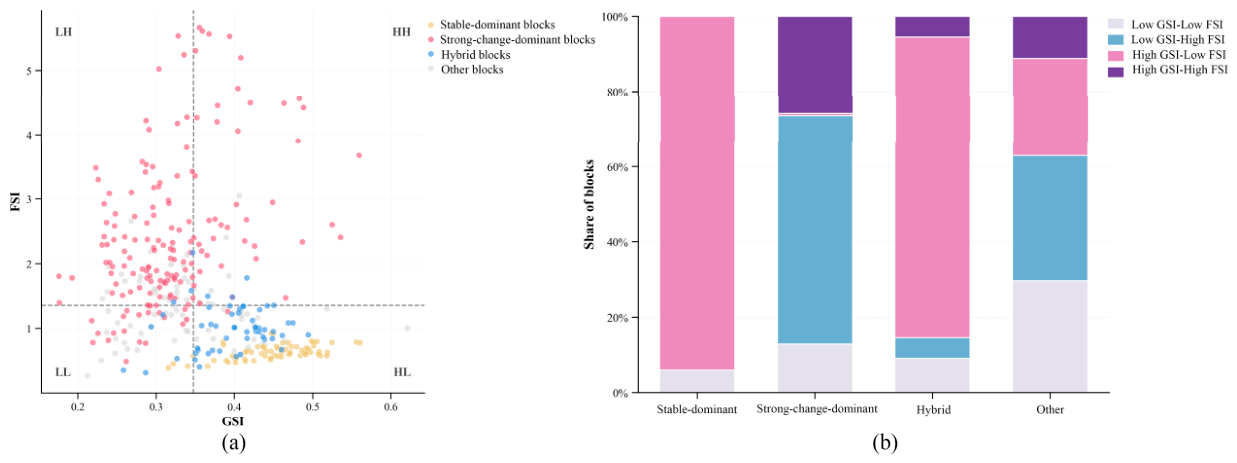
The 2024 GSI–FSI structure provides a complementary static perspective (
Figure 10). Most stable-dominant blocks occupy the high-GSI, low-FSI quadrant (HL), and hybrid blocks show a broadly similar tendency, although some extend into the other quadrants. By contrast, strong-change-dominant blocks are more widely distributed toward the low-GSI, high-FSI quadrant (LH) and other higher-intensity conditions. Hybrid blocks therefore do not constitute a simple intermediate category in current coverage or development intensity. Their distinctiveness lies primarily in the diachronic coexistence of a relatively stable morphological component with subsequent transformation processes rather than in an intermediate position within static GSI–FSI space.
The 81 other blocks are retained as a residual category rather than being forced into one of the three principal morphological types. Although many exhibit temporally rich and heterogeneous transformation, with a median of 3.0 and a median of 1.515, they most commonly fall outside the hybrid category because the overall change proportion exceeds the prescribed upper limit and/or the stable component falls below the minimum requirement. Gradual and step-change trajectories are the most common dominant processes. Spatially, other blocks are distributed across different parts of old Beijing city and are interspersed with the three principal block types rather than forming a single coherent cluster. Other blocks therefore represent diverse threshold-boundary conditions rather than an additional coherent morphological type.
3.4. Representative Hybrid Blocks and Morphological Interpretation
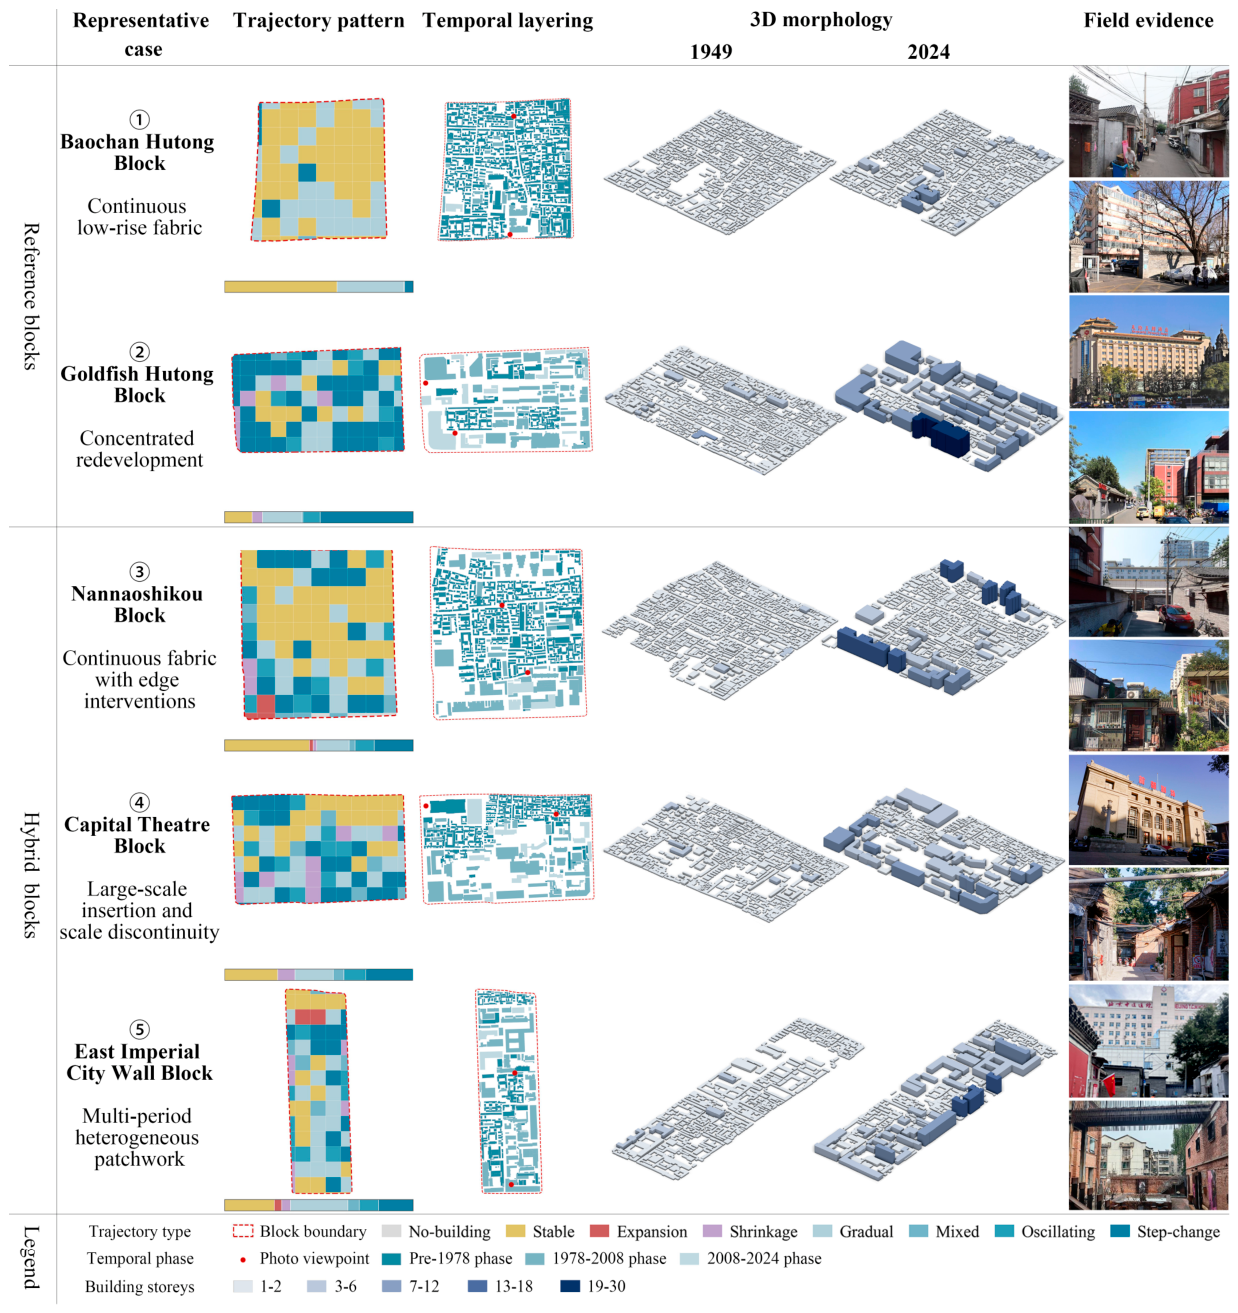
Based on the above 50 m trajectory identification and block classification, this study selects five representative blocks to analyze further how different trajectory combinations translate into block morphology (
Figure 11). The cases were selected from the classification results rather than for their locational prominence or specific functions. First, two comparative baselines are established: morphological continuity and concentrated reconstruction. Baochan Hutong Block and Goldfish Hutong Block respectively represent stable-dominant and strong-change-dominant blocks. Three representative configurations with distinct internal spatial organization patterns are then selected from the hybrid blocks: Nannaoshikou Block, Capital Theatre Block, and East Imperial City Wall Block represent the continuous fabric type with edge interventions, the scale-discontinuity type, and the multi-period heterogeneous patchwork type, respectively. These case studies are intended to deepen the spatial interpretation of the formation processes of different types, rather than to replace the above statistical analysis (
Figure 12).
The two reference blocks reveal two basic morphological outcomes that emerge when internal evolutionary processes are relatively consistent. Baochan Hutong Block is characterized by stable trajectories that form a continuous internal distribution. The building fabric established in earlier periods has been preserved over a relatively large area, and the continuous interface between the hutongs and low-rise buildings has been maintained; subsequent changes have primarily taken the form of scattered, localized additions and replacements. In contrast, the Goldfish Hutong Block exhibits a concentrated pattern of change: earlier fine-grained buildings are reorganized through concentrated redevelopment and increased building volumes, creating a marked contrast between large commercial and public buildings and the remaining low-rise fabric.
The differences among hybrid blocks depend not only on the greater variety of trajectories but also on the spatial organization of stable and changing units. In Nannaoshikou Block, stable trajectories still form a continuous internal base, with changes primarily concentrated at the block’s edges and in localized areas. The early low-rise fabric is generally preserved, while later large-scale buildings were inserted in localized areas, creating edge interventions within the continuous fabric base. In Capital Theatre Block, the stable fabric and large-scale renewal units form a relatively distinct spatial division. Large buildings such as the Capital Theatre are embedded within the existing low-rise, fine-grained environment, creating a striking contrast in building height, footprint scale, and street interface, resulting in a scale discontinuity caused by the insertion of large-scale units. East Imperial City Wall Block contains multiple intertwined trajectories. Building units from different historical periods interlock with one another, presenting a diverse juxtaposition of varying heights, volumes, and architectural forms, and creating a heterogeneous morphological collage resulting from interventions across multiple periods.
Comparison of the cases shows that blocks in old Beijing city do not generally undergo synchronous, comprehensive renewal. Different spatial units within the same block often follow distinct temporal trajectories, resulting in the juxtaposition of preserved historical fabric, gradual adjustments, and concentrated reconstruction. The uniqueness of hybrid blocks lies not only in the diversity of trajectory types but also in the asynchronous layering and spatial organization of processes operating across different periods and scales.
4. Discussion
Urban morphological transformation is spatially selective, with persistence and change shaped by the relational structure of streets, plots, and built form [
11,
21]. The coexistence of stable trajectories, gradual adjustments, and localized step-change in old Beijing city reflects this differentiated process, with relatively persistent trajectories concentrated in continuous traditional fabric and step-change trajectories occurring more frequently along corridors and around redevelopment nodes. This study extends this interpretation temporally by showing that these different forms of transformation may accumulate within the same block through different historical periods.
Contemporary block differences also relate to the long-term interaction between block structure and internal transformation [
23]. This analysis further shows that blocks with comparable overall trajectory compositions may nevertheless differ in the timing of change across their constituent parts, with principal transformations occurring in different observation intervals. Block heterogeneity therefore cannot be fully interpreted from aggregate composition alone, but must also be understood in relation to this temporal differentiation. The case studies further demonstrate that such differentiation is expressed through different internal spatial organizations, depending on the location, adjacency, and scale relationships among persistent and transformed components.
Multilevel change analysis has already connected building-scale observations with grid-scale morphology and block-scale landscape characteristics [
22]. Building on this multilevel logic, this framework integrates a five-period morphological database of building footprints and storey information with trajectory identification on a regular grid and aggregation to contemporary blocks. The regular grid provides spatially consistent observation units across historical periods, while the block scale reveals how localized processes of continuity and change coexist and accumulate within the urban fabric. By linking sequences of dominant building-volume states to internal block differentiation, the framework extends single-period indicators and pairwise historical comparisons by integrating them into multi-period transformation sequences and block-level interpretation.
From this perspective, contemporary block heterogeneity is understood not only through morphological characteristics, but also through the sequences and timing of transformations that shaped it. Stable persistence, gradual adjustment, and concentrated redevelopment can be interpreted as components of an accumulated transformation process rather than simply as contrasting morphological conditions observed at a single point in time. This shifts the interpretation of block heterogeneity from a static description of present form toward an account of the differentiated processes underlying its formation. The observed temporal dispersion further indicates that this differentiation involves not only the variety of trajectories, but also differences in when principal changes occurred. The selected time slices collectively reconstruct longer-term morphological sequences, revealing how components within the same block may have undergone principal changes in different observation intervals. This process-based interpretation also provides a morphological basis for examining how temporally differentiated transformations may relate to changes in land use, population, tenure, urban functions, and institutional conditions. Such relationships require additional evidence and cannot be inferred directly from morphological trajectories alone.
Moving from morphological description to design requires evidence connecting spatial form, urban performance, and the processes that generate change [
12]. The framework contributes historical and spatial evidence to this assessment, but the block categories should be understood as diagnoses of pre-renewal conditions rather than as fixed planning prescriptions. Hybridity alone does not indicate heritage value, spatial quality, or regeneration potential, and morphological classification should therefore be combined with evidence on building condition, current use, ownership, resident needs, and environmental performance before intervention decisions are made. In stable-dominant blocks, intervention may prioritize continuity among streets, alleys, courtyards, and buildings, while addressing functional and physical deficiencies through incremental improvement. In strong-change-dominant blocks, greater attention may be required at interfaces and scale transitions between larger development units and surrounding fine-grained fabric. In hybrid blocks, reconstruction of the transformation process can help distinguish persistent morphological structure from later interventions and clarify their spatial relationships before elements are considered for preservation, repair, adaptation, or localized restructuring. Differentiated regeneration therefore requires attention to internal transformation processes and spatial organization rather than reliance on block-wide average conditions alone.
These interpretive and practical implications should nevertheless be considered within several limitations. Historical reconstruction and state representation affect the interpretation of the findings. Differences in source accuracy, completeness, and reconstructed storey information introduce uncertainty into building-volume states. Historical cross-checking and footprint-persistence analysis provide supporting evidence, but independent reference data remain incomplete across periods. The dominant-state representation also suppresses minority volume classes and some changes in building layout. Morphological trajectories record changes in building-volume states; they do not correspond directly to specific architectural types or independently explain the effects of policy, markets, property rights, governance, or project implementation.
Temporal and spatial aggregation impose further constraints. Unequal observation intervals can conceal intermediate changes; HT describes dispersion across these intervals and cannot locate events precisely within them. Classification also depends on spatial resolution and operational thresholds, and hybrid blocks are particularly sensitive to how internal heterogeneity is represented. Fixed 2024 block boundaries provide a consistent contemporary reference but do not reconstruct the historical evolution of the blocks themselves. The framework should therefore be regarded as a transferable analytical logic rather than a universal parameter set: grid size, building-volume classes, trajectory rules, and classification thresholds require recalibration according to local building scales, spatial structure, temporal coverage, and data quality. Denser historical observations, changing parcel and block boundaries, redevelopment records, and socioeconomic data would support closer examination of formation mechanisms, while cross-city comparisons and analyses of connectivity, accessibility, and urban performance could further test the transferability and broader explanatory value of the framework.
5. Conclusions
This study linked building-volume trajectories across five snapshots from 1949 to 2024 with contemporary block morphology in old Beijing city. The findings reveal asynchronous morphological transformation across the city, with spatially selective trajectories and changes occurring in different periods. Stable, step-change, and gradual trajectories accounted for the largest area shares. Stable trajectories were concentrated in traditional fabric, whereas step-change trajectories clustered along corridors and redevelopment nodes. Among 428 blocks, 55 hybrid blocks combined a relatively persistent morphological base with changes from different periods. Representative configurations included continuous fabric with edge intervention, scale discontinuity from large-unit insertion, and heterogeneous patchwork.
The framework connects long-term transformation sequences with block diagnosis through trajectory composition, change timing, and spatial organization. It complements single-period indicators and supports differentiated regeneration by identifying persistent structures, later interventions, and their interfaces.
Findings remain constrained by historical-data uncertainty, simplified volume states, temporal sampling, and fixed contemporary boundaries. Hybrid identification is sensitive to spatial resolution and operational thresholds. Future research should integrate denser historical observations, evolving spatial boundaries, and redevelopment and socioeconomic records to examine formation mechanisms, while cross-city comparisons can test transferability and inform local calibration.