1. Introduction
Central-city parks are increasingly expected to function within everyday urban systems rather than as isolated green destinations. Usable access matters because it shapes opportunities for park contact, yet estimates of nearby green space change with the accessibility metric selected [
1]. Spatial access should therefore be treated as a planning condition rather than as direct evidence of exposure, wellbeing, health, or park use. In mature mixed-use districts, selective renewal is often more practical than large-scale land replacement. Such renewal distributes costs and benefits unevenly, which makes evidence-based intervention important [
2]. The park boundary is central to this task because it connects surrounding activities to public entrances, internal paths, and destinations. The relevant question is therefore not only whether green space is nearby, but whether a credible pedestrian route leads into a usable place within it.
Conventional accessibility analyses represent demand through residences, population grids, service areas, or distance to a park edge. These approaches remain valuable for evaluating provision and equity, but they can omit visits associated with work and other activities and can stop the route at the boundary. Network-based measures show why usable pedestrian connections matter [
3]. For a central-city park, access depends on the alignment among the approach route, public entrance, internal path, and visitor destination. Entrance configuration therefore raises a more specific planning question: which boundary links should be added when complete access routes and different everyday activity contexts are considered?
To address this problem, this study develops Park-BIND (Park Boundary-Opening Identification and Network-Based Decision Model). It links activity-chain evidence to site-specific boundary decisions while keeping observed activity, simulated accessibility, implementation judgment, and network effects separate. We tested Park-BIND in two contrasting central-city parks in Shanghai. Both have dense mixed-use surroundings, but they differ in boundary layout, existing access, and internal–external network structure. The comparison asks whether selective connectivity can reconcile route benefit, different everyday activity contexts, feasibility, and potential through-movement without presuming that complete permeability or higher Choice is desirable.
Park-BIND does not introduce a new shortest-path or space-syntax algorithm. Its contribution is to connect steps that are usually analyzed separately. Activity contexts show where connections are needed, the park boundary links outside streets with internal paths, and space syntax assesses the network after openings are selected. Park-BIND traces complete routes, tests exact opening sets, and compares route benefit, activity-chain balance, and network change without combining them into one score. This behavior–boundary–network sequence shifts the question from entrance quantity alone to which links should be added, whom they serve, and how they change the network. The following sections establish the research gap, specify the workflow, report the empirical results, and discuss their planning significance and limits.
3. Materials and Methods
3.1. Research Design and Workflow
The research used a comparative, route-based scenario design. We applied the same sequence to both parks. We first audited the current network and constructed visit-level access-space units. We then generated connected boundary candidates, obtained planner feasibility classifications, calculated route costs, and optimized candidate subsets. Finally, we reconstructed selected networks and compared their accessibility and network effects. This sequence links observed behavior to spatial interventions while keeping observed inputs, simulated scenarios, and planning judgments separate.
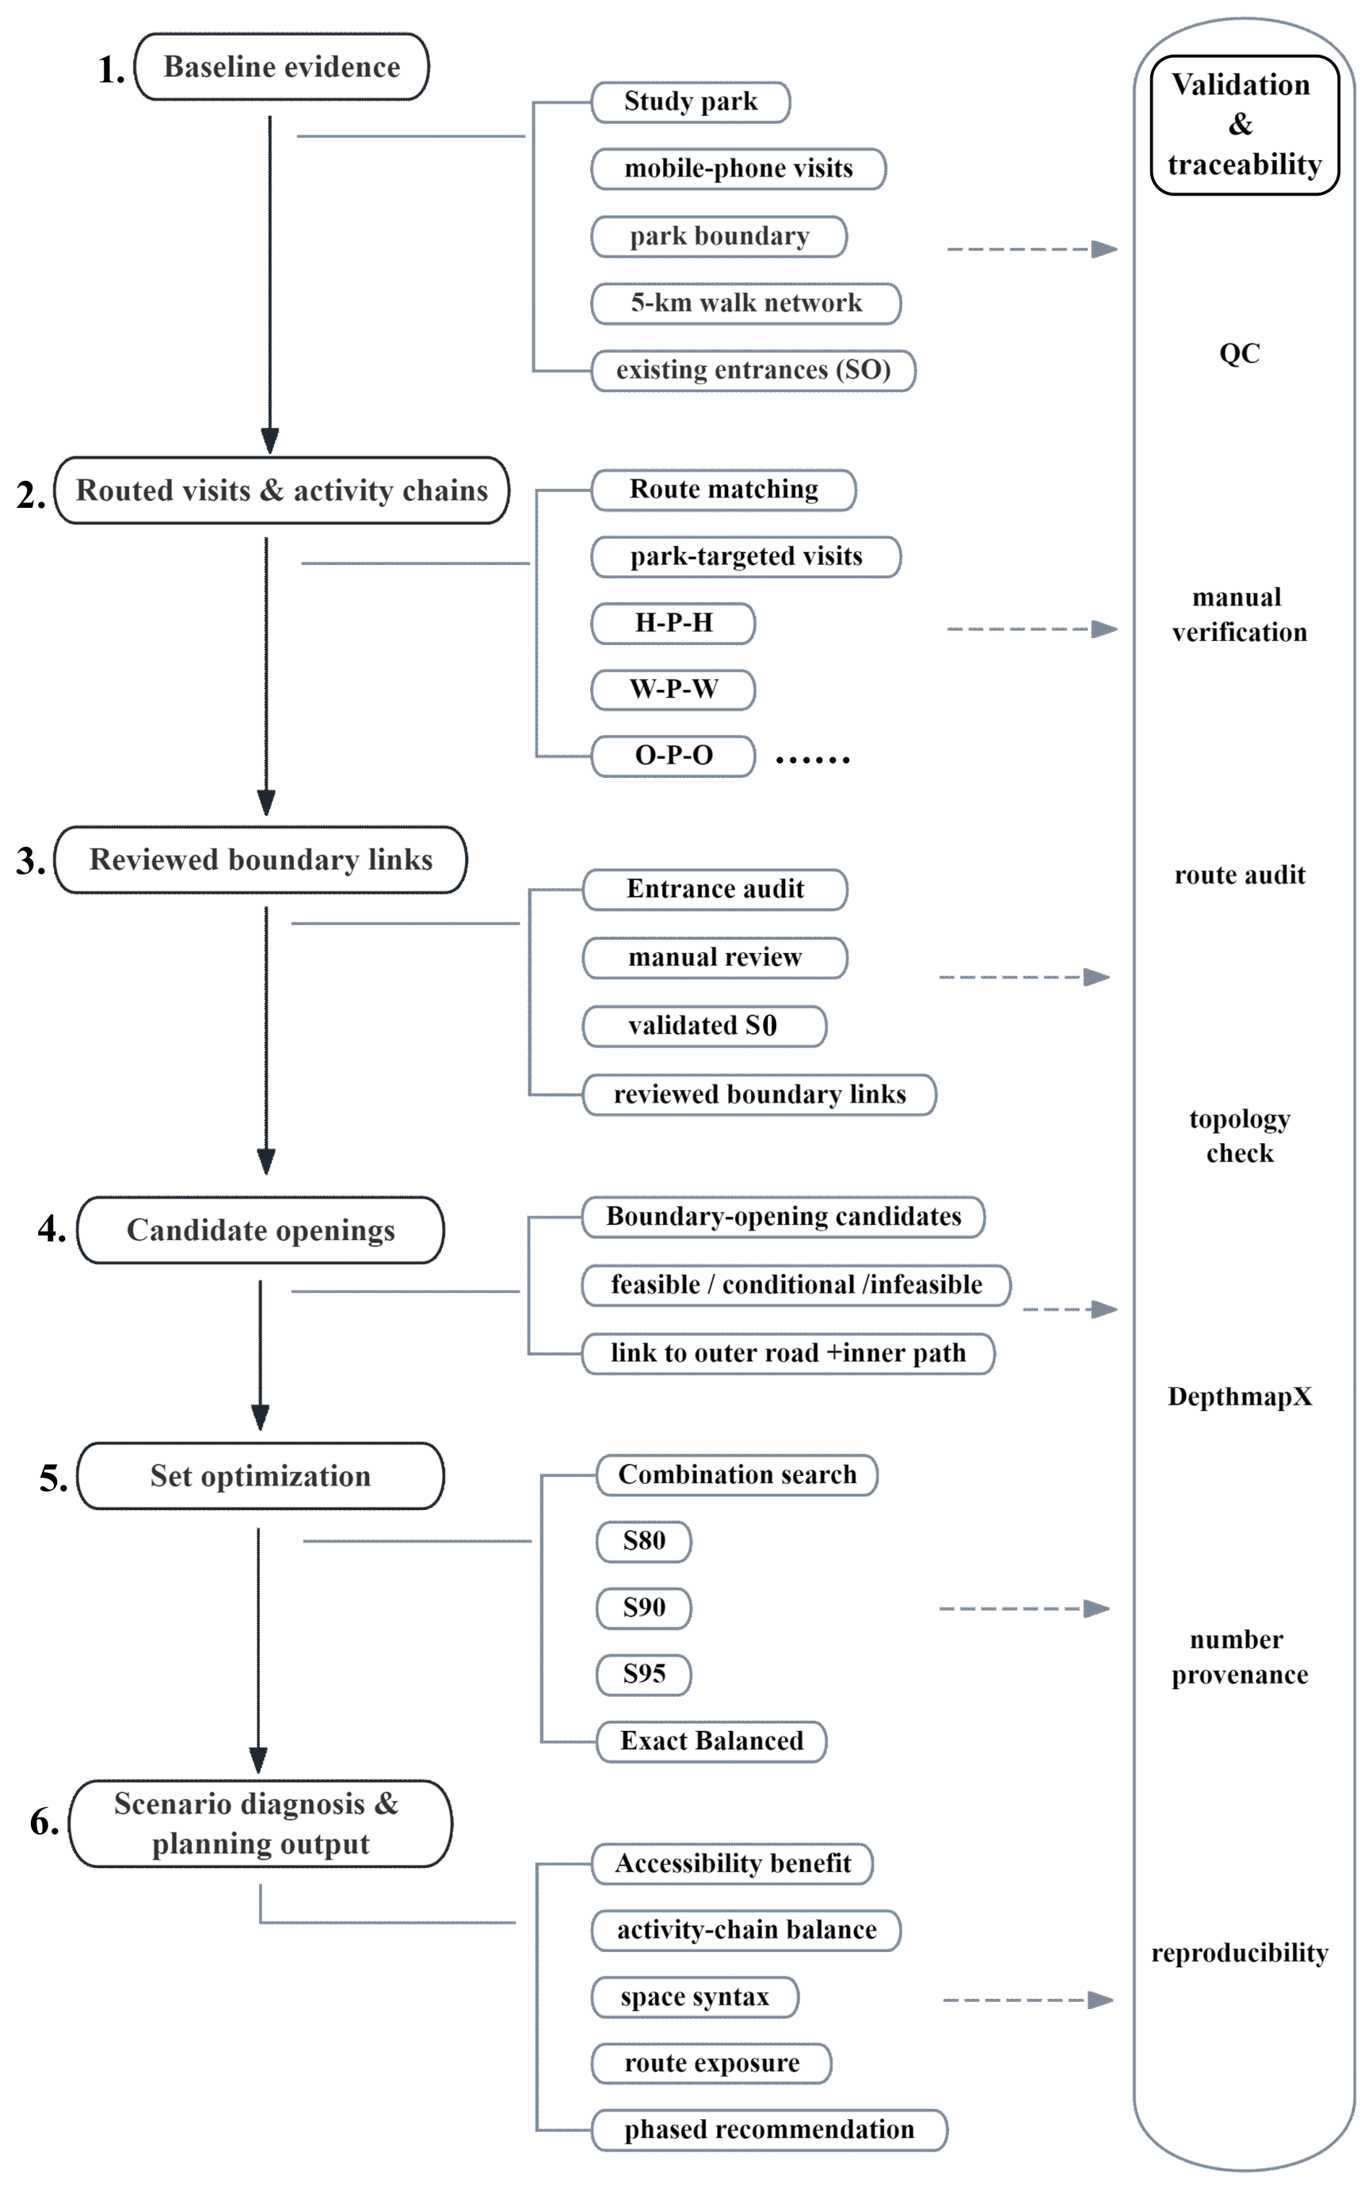
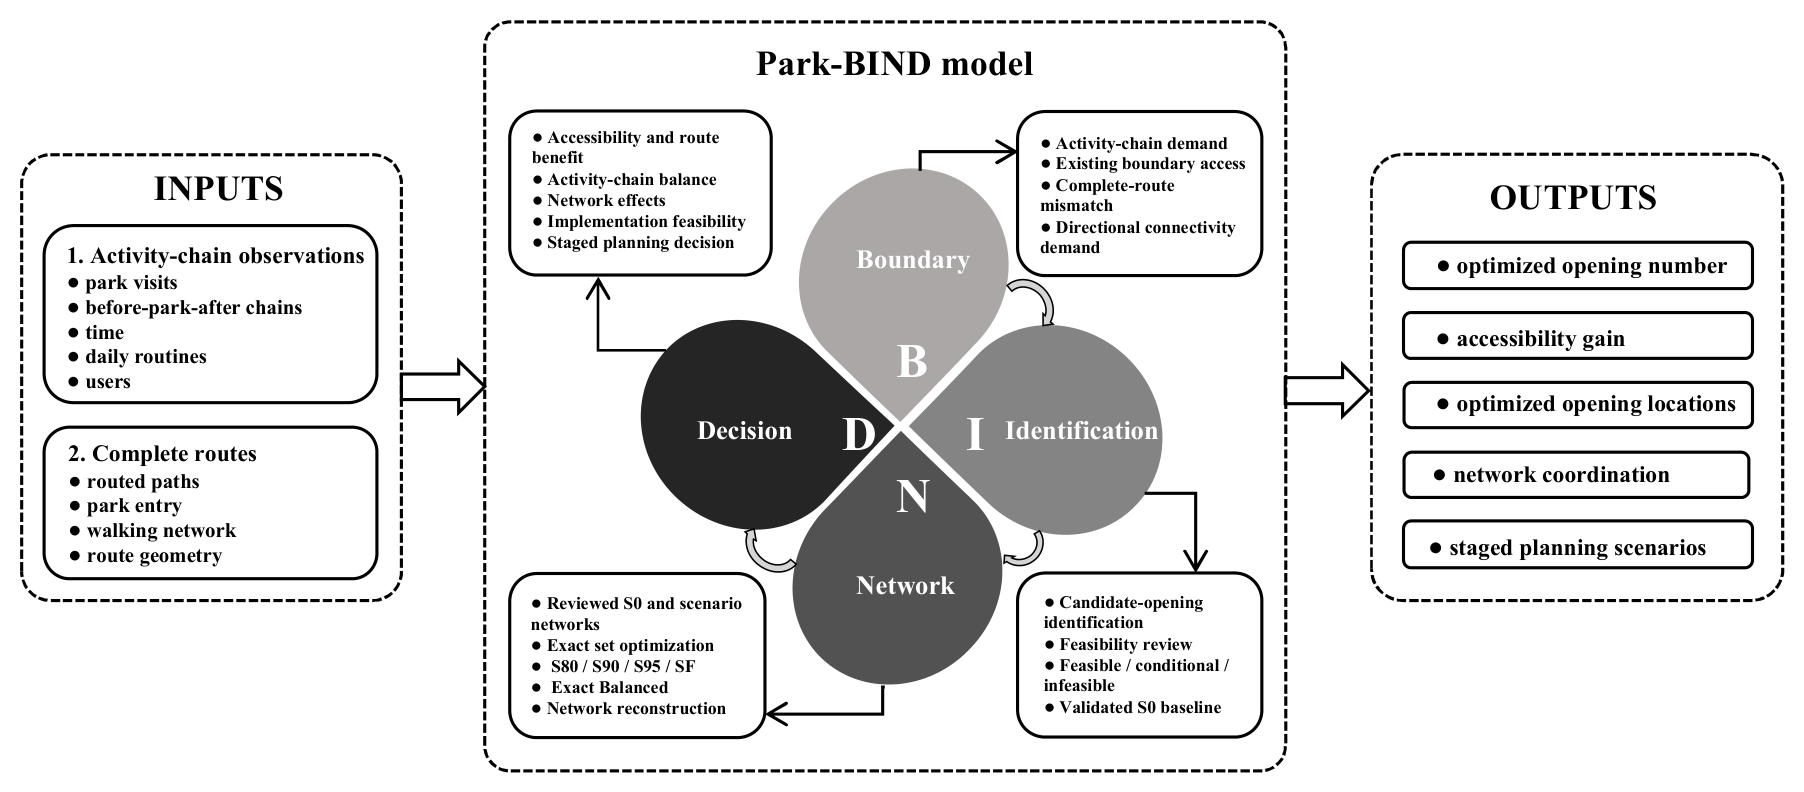
As summarized in
Figure 1, optimization and configurational diagnosis were separated because route benefit could be evaluated for every candidate subset, whereas space syntax was applied only to selected scenarios. All comparisons used the verified current network, and no internal park roads were redrawn.
3.2. Study Areas and Datasets
Xujiahui Park and Xiangyang Park were selected as contrasting central-city cases, not as a statistically representative sample of urban parks. Both are in dense, mixed-use areas of central Shanghai and are surrounded by residential, employment, commercial, public-service, and pedestrian networks. This shared setting allows us to compare how park access fits into different everyday activity chains.
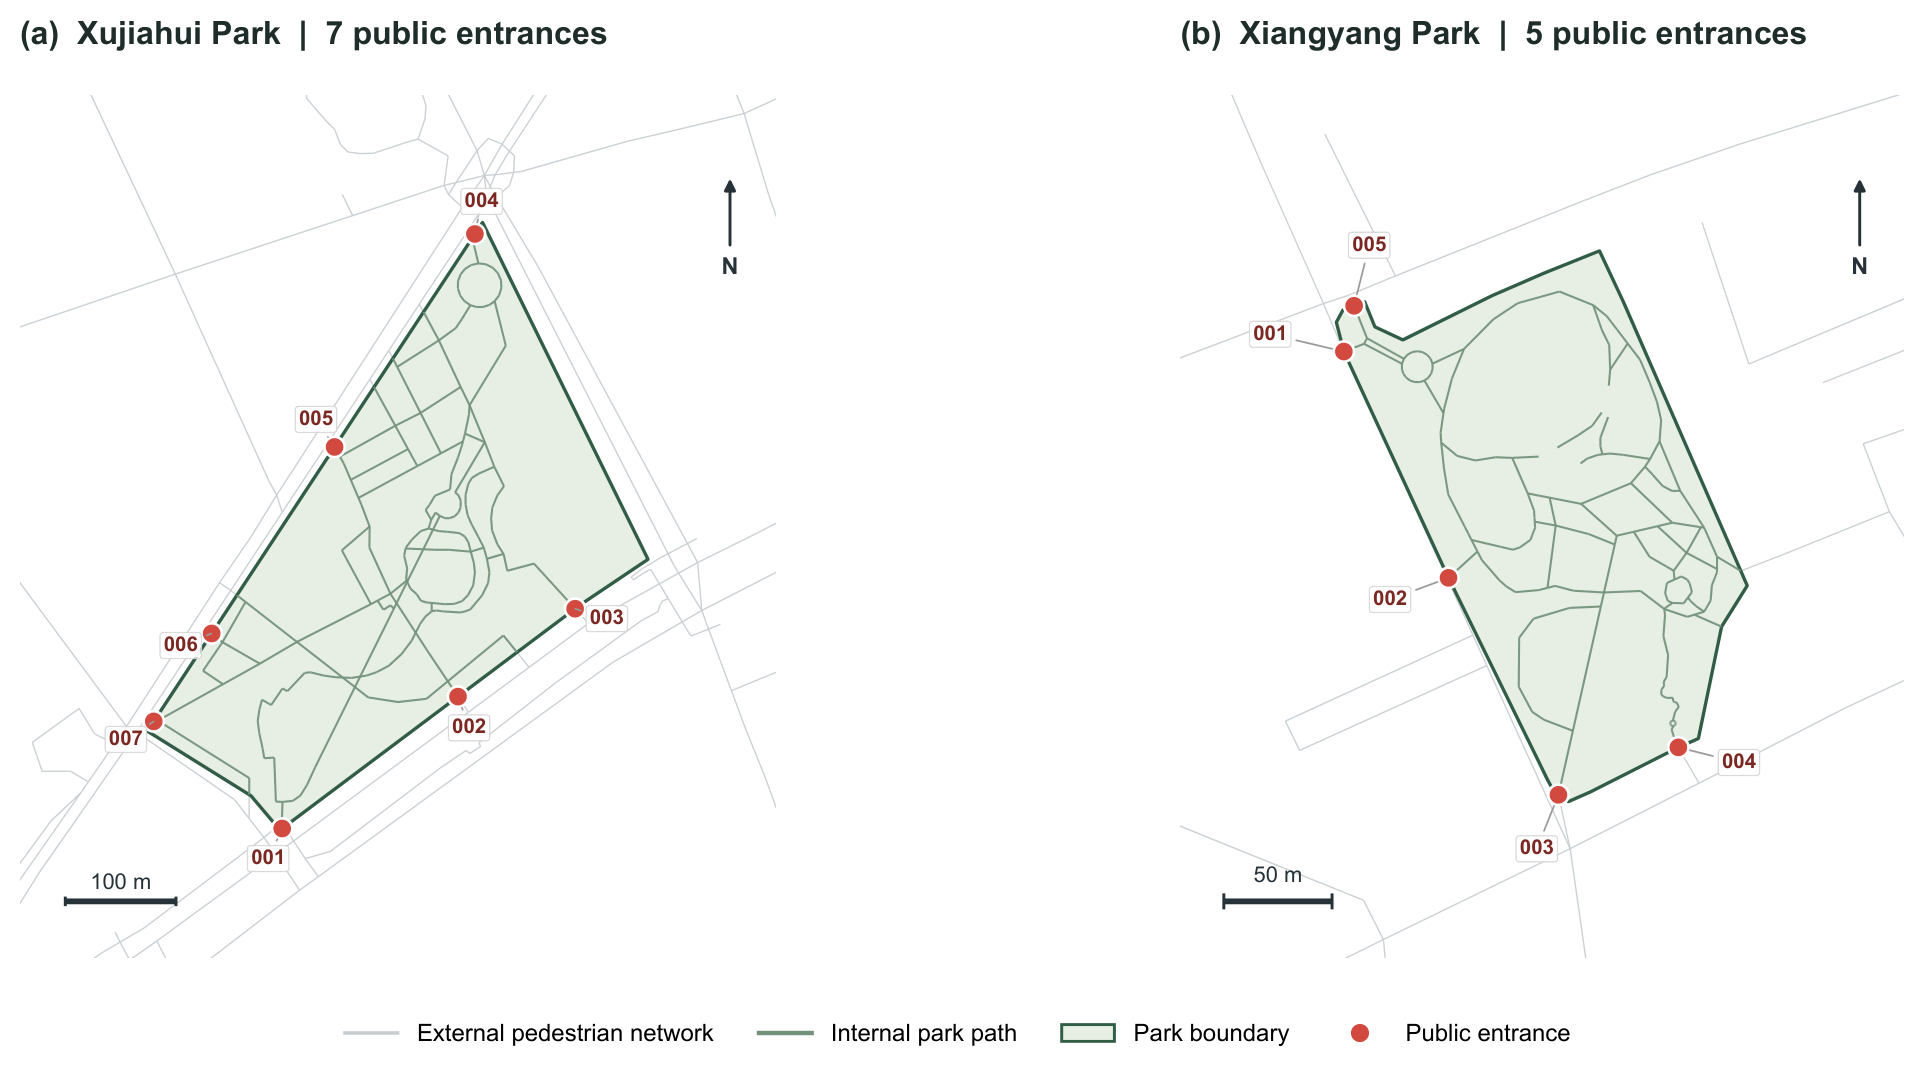
The parks differ in scale, boundary layout, existing access, internal paths, surrounding pedestrian networks, routed visits, and feasible opening opportunities. Multi-source validation retained seven public entrances in the Xujiahui S0 network and five in the Xiangyang S0 network. The final candidate system comprised 15 feasible openings in Xujiahui. Xiangyang had five feasible openings and one conditional opening (XI_C008). These differences allow us to test the same Park-BIND procedure under different boundary and network conditions. The cases support comparison and method testing, not statistical generalization to all central-city parks.
Figure 2 shows the two baseline park networks and their public entrances.
The mobility observation period was 15–28 October 2020. Access-space records were screened for origin snapping, internal-destination snapping, entrance correspondence, and complete network routing. A fixed effective set was used for every S0–scenario comparison: 789 visits by 598 users in Xujiahui and 130 visits by 97 users in Xiangyang. Holding the visit set constant within each park prevents sample membership from being mistaken for scenario benefit. The corresponding 5-km S0 networks contained 23,829 segments and seven public entrances in Xujiahui and 46,868 segments and five public entrances in Xiangyang. Each network combined external streets, entrance connectors, and existing internal park paths; internal paths were not redrawn, and all spatial data were processed in EPSG:3857.
Table 1 summarizes the location and official area of the two case-study parks and provides an illustrative view of their Integration patterns.
Road-centerline intersections with the park boundary were used only as locations for checking, not as entrances by geometry alone. Public entrances were identified by cross-checking 2020 maps and park guides, mapped entrance labels, trajectory boundary-crossing clusters, connection to the external public pedestrian network, continuity with internal park paths, and manual spatial review. Only portals supported by this evidence and connected to both the external and internal networks entered S0. Publicly reported nominal gate totals were not substituted for routing entrances.
The datasets comprised (1) mobility trajectories and park-visit context; (2) park boundaries, current entrances, internal paths, and stable internal targets; (3) surrounding pedestrian networks; and (4) buildings, water features, and planner-reviewed constraints relevant to candidate feasibility. The analytical trajectory dataset used pseudonymous user identifiers and contained no names, contact details, or other direct personal identifiers. The research team did not recruit, contact, or intervene with individuals, and all reported results are aggregated. Observed trajectories can reveal use patterns that are not recoverable from residential proximity alone [
13]. At the same time, trajectory-derived classifications remain observational and sample-dependent. We therefore use them to construct empirical demand and simulated routes, not to claim population-wide causal effects.
We used ArcGIS Pro 3.1.7 (Esri) to prepare and inspect spatial data, review topology, and validate public entrances manually. Python 3.12.10 was used to process activity chains, construct complete routes, generate candidate openings, optimize opening sets, run sensitivity tests, analyze route redistribution, and process results. The reproducibility audit lists the Python packages. We ran Angular Segment Analysis in DepthmapX 0.8.0 with T1024 and metric radii R500, R1000, and R3000 for every registered network scenario.
3.3. Operationalizing Park-Related Activity Chains
Daily activity records can form long and varied sequences. In the source data, park-related chains reached about 30 activity nodes and included many combinations of home, work, park, and other POI categories. We did not reduce each complete daily sequence to three nodes. Instead, we selected a three-node window around each park visit: the stable activity immediately before the visit, the park episode, and the stable activity immediately after it. The two anchors were classified as Home (H), Work (W), or Other (O). Other activities in the daily sequence were not separate optimization dimensions. Visits with the same anchor class on both sides formed H-P-H, W-P-W, and O-P-O. We used these as the main residential-, work-, and other-activity contexts because they were common and had sufficient observations. Before route-eligibility filtering, they represented 2567 of 3659 valid classifications in Xujiahui Park (70.16%) and 943 of 1282 in Xiangyang Park (73.56%). They do not cover all park-related mobility. The remaining H-P-W, H-P-O, W-P-H, W-P-O, O-P-H, and O-P-W observations entered a separate nine-context robustness analysis. A repeated letter denotes the same contextual class, not identical before-and-after coordinates. Each access-space unit retained the user and visit identifiers, date, pattern, previous stable activity point, public entrance, and first stable internal activity point.
Table 2 summarizes the operational definitions and their literature basis.
Each activity context retained spatial, temporal, and route information. Location described the approach direction and internal destination, while the before–after order placed the park visit within its activity sequence. Date, weekday/weekend status, entry time, and broad time-of-day periods characterized temporal rhythms; these variables were descriptive and were not optimization weights. Network routing measured the travel burden of each visit. H, W, and O identified empirical contexts rather than visitor motivations.
The three patterns need not contribute equally to cumulative benefit. Their sample sizes, approach directions, and removable detours differ. We therefore report both total route benefit and attainment relative to each pattern’s own feasible upper bound; neither measure alone is treated as a complete account of demand.
For visit
i, the complete baseline route used to calculate
was defined as
The origin was therefore not reduced to the closest boundary point, and the park entrance was not treated as the final destination. Origins were snapped to the external graph, internal destinations to the internal graph, and observed crossings were associated with validated current entrances. Shortest paths were calculated through the selected entrance. The route geometry and distance retained external, entrance-connector, and internal components.
This construction makes boundary mismatch observable. Two activity origins equally distant from the park polygon may face different travel costs because the available entrances are located in different directions. Likewise, an opening close to the origin may have limited value if it connects poorly to the internal destination. The complete route captures both conditions. Shortest paths provide a consistent comparison across all opening sets, but they are a modeling assumption rather than a statement that every visitor followed or preferred the computed line.
3.4. BIND Model
Park-BIND has four linked modules (
Figure 3). B—Boundary translates complete access routes into directional boundary-connectivity demand. I—Identification generates geometrically connected boundary-opening candidates and subjects them to planner-led feasibility review. N—Network evaluates candidate sets, identifies minimum-cardinality benefit-attainment solutions, and reconstructs the street–boundary–internal-path network for key scenarios. D—Decision compares accessibility benefit, activity-chain balance, configurational change, and feasibility treatment without forcing unlike indicators into one score. Park-BIND is a decision-support procedure that combines existing routing, finite-set optimization, and network analysis. It does not replace these methods.
Inputs include observed visits, adjacent activity locations, stable internal destinations, public entrances, park boundaries, pedestrian networks, obstacles, and feasibility attributes. Outputs include complete routes, reviewed candidate links, benefit curves, globally validated opening sets, selected scenario networks, and staged planning roles.
Boundary demand was inferred from the relation among activity-source direction, S0 detour, current entrance, and stable internal destination. For each visit, Park-BIND recorded the approach direction and the route required by existing entrances. Locations where several visits approached a closed edge or traveled around the park to reach a useful internal path indicated potential connectivity deficits. This demand measure is route-based; it is not a stated-preference request for a new gate.
Pattern-specific aggregation then identified whether a potential connection mainly served home-, work-, or other-activity-linked chains. The method does not assume that one pattern should receive the same absolute benefit as another. It preserves observed sample composition while later adding normalized group-specific upper-bound ratios for balance. This combination allows RQ2 to be examined through both empirical total benefit and relative service to each activity-chain context.
Candidate points had to connect the external public pedestrian network to an internal path, remain separate from current entrances and other candidates, meet the connector-length limit, and avoid visible building or water obstacles. Candidate generation used thresholds for boundary sampling, network connection, connector length, entrance exclusion, and candidate separation.
Table 3 reports the Strict, Baseline, and Permissive settings. Baseline was used for the main analysis, while Strict and Permissive measured parameter sensitivity; obstacle clearance remained fixed at 0.75 m. A point was not accepted simply because an external street approached the boundary.
Each accepted point received a unique identifier and a connector with external and internal legs. The ArcGIS review package displayed each candidate point, its connector, external and internal connections, barrier type, ecological or management constraints, and review notes.
Planner review provided a second screen after candidate generation. “Feasible” means that the available evidence showed no clear spatial or planning obstruction and that a continuous external–boundary–internal link could be formed. “Conditional” means that a potentially useful location requires local design, engineering, management, or site adjustment. “Redundant” means that a point is too close to, or duplicates, a public entrance. “Infeasible” means that a clear spatial, access, or physical conflict exists. Only feasible candidates entered the primary optimization. Conditional candidates were tested separately, and the conditional-excluded and conditional-included problems used their own denominators. Redundant and infeasible candidates were excluded. Park-BIND covers candidate generation and planning-level screening; detailed planning and engineering review comes later. These labels are not construction approvals.
Manual review was retained because ownership, management, ecological constraints, level differences, and detailed entrance design cannot be resolved by geometric screening alone. Evidence from planning-support applications likewise shows that digital tools depend on usable interfaces and their integration into stakeholder processes [
28].
For each visit, the Network module compared the complete shortest-path cost under
with the cost after adding a candidate subset
S. It summarized visit- and user-level coverage, total and pattern-specific distance benefit, marginal benefit, and benefit attained relative to the feasible upper-bound set
. The indicator definitions are given in
Section 3.5. The
scenario contains every geometrically and planner-available candidate in a park/treatment problem; it is not the continuous removal of the park boundary. S80, S90, and S95 denote minimum-cardinality sets attaining 0.80, 0.90, and 0.95 of this upper bound. These values are comparable performance levels rather than natural thresholds of park openness.
A greedy marginal-benefit sequence first added the point with the largest additional distance reduction at each step. Complete validation then enumerated all Xujiahui feasible sets, all Xiangyang conditional-excluded sets, and all conditional-included sets. The latter comprises XI_C001–XI_C005 plus conditional XI_C008. XI_C006 was excluded as redundant near an existing entrance, and infeasible XI_C007 entered no scenario. For every attainment level, enumeration tested whether the reported set (a) reached the target, (b) used the globally fewest openings, and (c) achieved the maximum benefit among sets of the same size. Context-specific optima were also extracted separately for H-P-H, W-P-W, and O-P-O.
Activity-chain balance was tested against each pattern’s own benefit. The Exact Balanced solution is the globally minimum-cardinality subset whose weakest H-P-H, W-P-W, or O-P-O attainment ratio reaches 0.90. Exhaustive enumeration established this status. The weakest-context condition differs from stopping an aggregate-benefit sequence when its overall attainment reaches 0.90.
After optimization, key opening sets were inserted into the network as external-road–boundary–internal-path connectors. Existing internal paths were not redesigned. The new connections can nevertheless change topology and the relationship of park paths to the surrounding street system. This process is termed spatial-network reconfiguration. Space syntax was applied only to selected S80, S90, S95, SF, and Balanced networks, not to every enumerated subset.
For the key S80 and Exact Balanced comparisons, route redistribution was examined by holding each visit’s activity source and internal park destination constant and changing only the available entrance set and its network connections. The complete access route was then recalculated through the external pedestrian network, a public or scenario opening, and the internal park paths to the same destination. Entrance selection, route geometry, segment-level route use, and route distance were compared with the reviewed baseline. Segment use denotes the number of modeled access routes traversing a segment; it is not observed pedestrian volume, and the analysis does not represent complete recreational touring trajectories within the park.
Decision output was structured around six roles. A minimum-effective intervention captures the main feasible benefit with few openings. An accessibility-enhancement scheme increases coverage and benefit beyond that minimum. An activity-chain-balanced scheme reduces disparity among H, W, and O ratios. A near-saturation scheme approaches SF while avoiding all remaining low-marginal-gain links. A conditional engineering scheme shows the added value and network consequence of points requiring local works. SF is retained as a feasible upper-bound comparison.
For each key scheme, the decision matrix retains the measures required to distinguish path efficiency, activity-chain balance, network effects, and implementation status. Cross-park comparison uses normalized change relative to each S0 rather than raw Integration or Choice, because the baseline networks differ in size and configuration.
3.5. Evaluation Indicators and Interpretation
The evaluation retained five non-substitutable dimensions: (1) accessibility benefit, (2) marginal efficiency, (3) activity-chain balance, (4) spatial-network configuration, and (5) implementation feasibility. Each dimension was assessed separately so that a strong result in one could not cancel a weakness in another. Let denote the public entrances, S a subset of candidate openings added to , and the complete shortest-path distance for visit i. The objective measures route-distance reduction, not a combined time–distance utility. Time weighting would require calibrated data on travel-time value, schedule flexibility, and time-specific access. These data were unavailable, so time weights were not used.
Accessibility benefit. The single-visit and total distance reductions are
A visit was classified as benefited when m, and a user was benefited when at least one of that user’s visits met this condition. Cumulative reduction was reported together with mean and median visit reduction, reduced detour, and the numbers of benefited visits and users.
Marginal efficiency. For each park/treatment problem, benefit attainment relative to the feasible upper-bound set is
For the
kth opening in an ordered solution, marginal and per-opening efficiencies are
Together, , , , and the benefit curve describe attainment, incremental gain, and saturation.
Activity-chain balance. For activity pattern
, attainment relative to that pattern’s own feasible upper bound is
The mean context attainment and weakest-context ratio are
The Exact Balanced criterion was defined by , rather than by aggregate benefit alone.
Spatial-network configuration. Network reconfiguration was evaluated in DepthmapX 0.8.0 using T1024 Angular Segment Analysis at metric radii R500, R1000, and R3000. The 17 networks comprised two S0 baselines and 15 selected scenario networks. Integration, Choice, Connectivity, and Node Count were retained under identical settings. For each radius, mean Integration was calculated across the segments classified as PARK_INTERNAL, and scenario change was expressed relative to the corresponding S0 mean. Choice Gini was calculated over the fixed PARK_AND_BOUNDARY segment set; the unweighted coefficient was used in the primary comparison, while a segment-length-weighted coefficient served as a robustness check. Fixed-baseline high-Choice exposure was defined as the proportion of visits whose modeled route contained at least one segment with scenario Choice greater than or equal to the park- and radius-specific S0 90th-percentile threshold. The same S0 threshold and fixed visit set were applied to every scenario within a park.
These measures have strict interpretation limits. Integration is not observed park use. Choice is not actual pedestrian flow, congestion, or conflict, and an increase is not automatically an improvement. Higher high-Choice exposure means that a larger proportion of modeled visits encounter at least one segment with high structural through-route potential under the fixed baseline criterion. Field observation is required to determine whether that potential becomes actual through-movement or affects recreation.
Route benefit refers to the reduction in complete shortest-path distance relative to the baseline entrance configuration ; it does not directly represent increased visitation. Activity-chain balance describes the distribution of route benefit across the defined activity contexts and is not a measure of demographic or social equity.
Implementation feasibility. Candidates remained classified as feasible, conditional, or infeasible. Infeasible candidates were excluded; conditional candidates were tested in separate included and excluded treatments. Park-BIND did not combine categorical feasibility and continuous performance measures through subjective weights. Pareto-efficient alternatives and distinct planning roles were retained so that minimum-effective, balanced, higher-attainment, conditional, and feasible-upper-bound scenarios could coexist.
3.6. Validation and Reproducibility
Three validation gates were specified. First, a visit-specific portal graph represented internal and external networks and allowed multiple boundary crossings. We compared explicit shortest paths for every single candidate and sampled subset with the vectorized minimum-cost calculation (VECTORIZED_MIN) using a 0.01 m tolerance. We also reproduced the treatment-specific totals independently on the fixed visit sets.
Second, complete enumeration tested whether each threshold solution reached its target, used the globally fewest openings, and maximized benefit among sets of the same size. Third, scenario DepthmapX segments were matched provenance-first and then by segment mapping, geometry, endpoints, and direction at 0.01 m tolerance. Row counts, original-segment and original-length recovery, internal-length recovery, and visit-route matching were audited. No syntax value was imputed, and any unmatched connector was retained as an explicit warning.
Within each park, all scenarios used the same reviewed , visit sample, route-cost definition, and network-analysis parameters. Differences therefore came from the opening sets, not from the sample or processing settings.
All 17 DepthmapX exports matched their registered scenarios and passed the filename, row-count, field, and mapping checks. Endpoint matching at 0.01 m tolerance produced one mapping row for every segment in every network (17/17 at 100%), regardless of direction, and no syntax value was imputed. All fixed visits—789 in Xujiahui and 130 in Xiangyang—were routed successfully. Recomputed path benefits matched the locked optimization results, with a maximum absolute difference of
m.
Table 4 reports the individual runs; the associated manifests and provenance records document the full process.
4. Results
4.1. Everyday Activity-Chain Integration of the Two Parks (RQ1)
Both parks appeared in H-P-H, W-P-W, and O-P-O chains. The fixed Xujiahui sample contained 207 H-P-H, 75 W-P-W, and 507 O-P-O visits; Xiangyang contained 50, 18, and 62, respectively. These observations place each park within residential routines, work-related episodes, and multi-purpose sequences involving shopping, services, social activity, and other destinations. The parks therefore functioned as more than residential amenities. Before route-eligibility filtering, the three symmetric contexts accounted for 70.16% of valid park-adjacent before–after classifications in Xujiahui and 73.56% in Xiangyang. The remaining 29.84% and 26.44%, respectively, comprised the six asymmetric contexts examined in the robustness analysis.
O-P-O produced the largest cumulative feasible route benefit in both parks. This dominance reflects sample composition, approach direction, internal destinations, and removable detours. The smaller W-P-W total does not imply that work-linked access is unimportant; its demand is more spatially concentrated and can be hidden by an aggregate objective.
Benefit depended on the complete relation among the preceding activity, external street, public entrance, internal path, and stable park destination. It was not determined by distance to the park polygon. Activity-chain types approaching the same boundary could therefore assign different values to the same opening.
4.2. Activity-Chain-Specific Boundary-Connectivity Requirements (RQ2)
The three activity-chain types required different boundary connections. H-P-H emphasized direct links from nearby residential areas. O-P-O benefited from connections in several urban directions, whereas W-P-W depended on fewer, location-specific openings. High aggregate distance benefit therefore did not guarantee adequate service across all contexts.
The primary scenarios used only candidates that passed the current planning-level feasibility screen. All 15 Xujiahui candidates passed this screen. Xiangyang’s main feasible set comprised XI_C001–XI_C005, while XI_C008 remained conditional and was evaluated only in the conditional-included treatment. XI_C006 was redundant because it lay near and functionally duplicated a public entrance, and XI_C007 was infeasible; neither entered the main candidate set. These classifications indicate eligibility for strategic comparison rather than confirmed constructability.
Candidate availability changed across the Strict, Baseline, and Permissive settings. Xujiahui generated 17, 21, and 37 candidates, of which 10, 15, and 15 were eligible for optimization. Xiangyang generated 3, 9, and 19 candidates, of which 2, 5, and 5 were eligible.
4.3. Boundary-Opening Optimization and Spatial-Network Reconfiguration (RQ3)
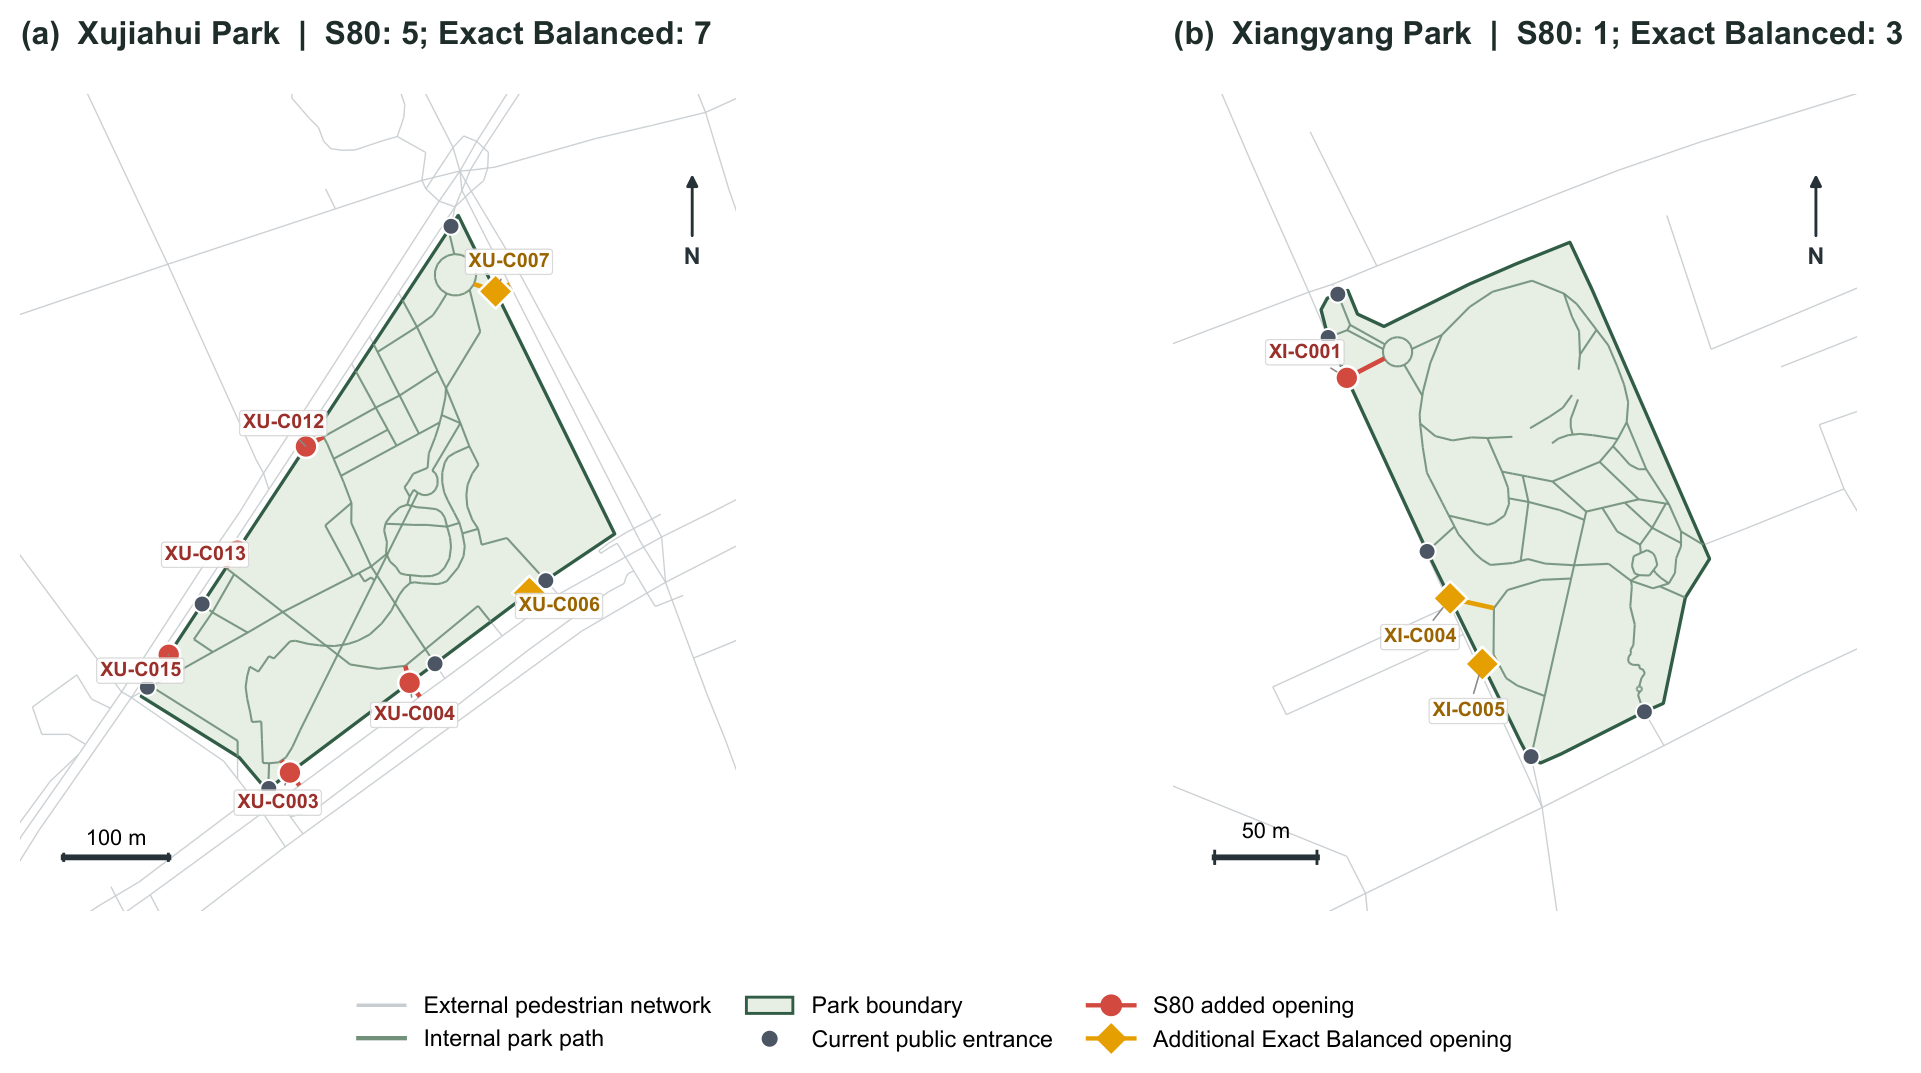
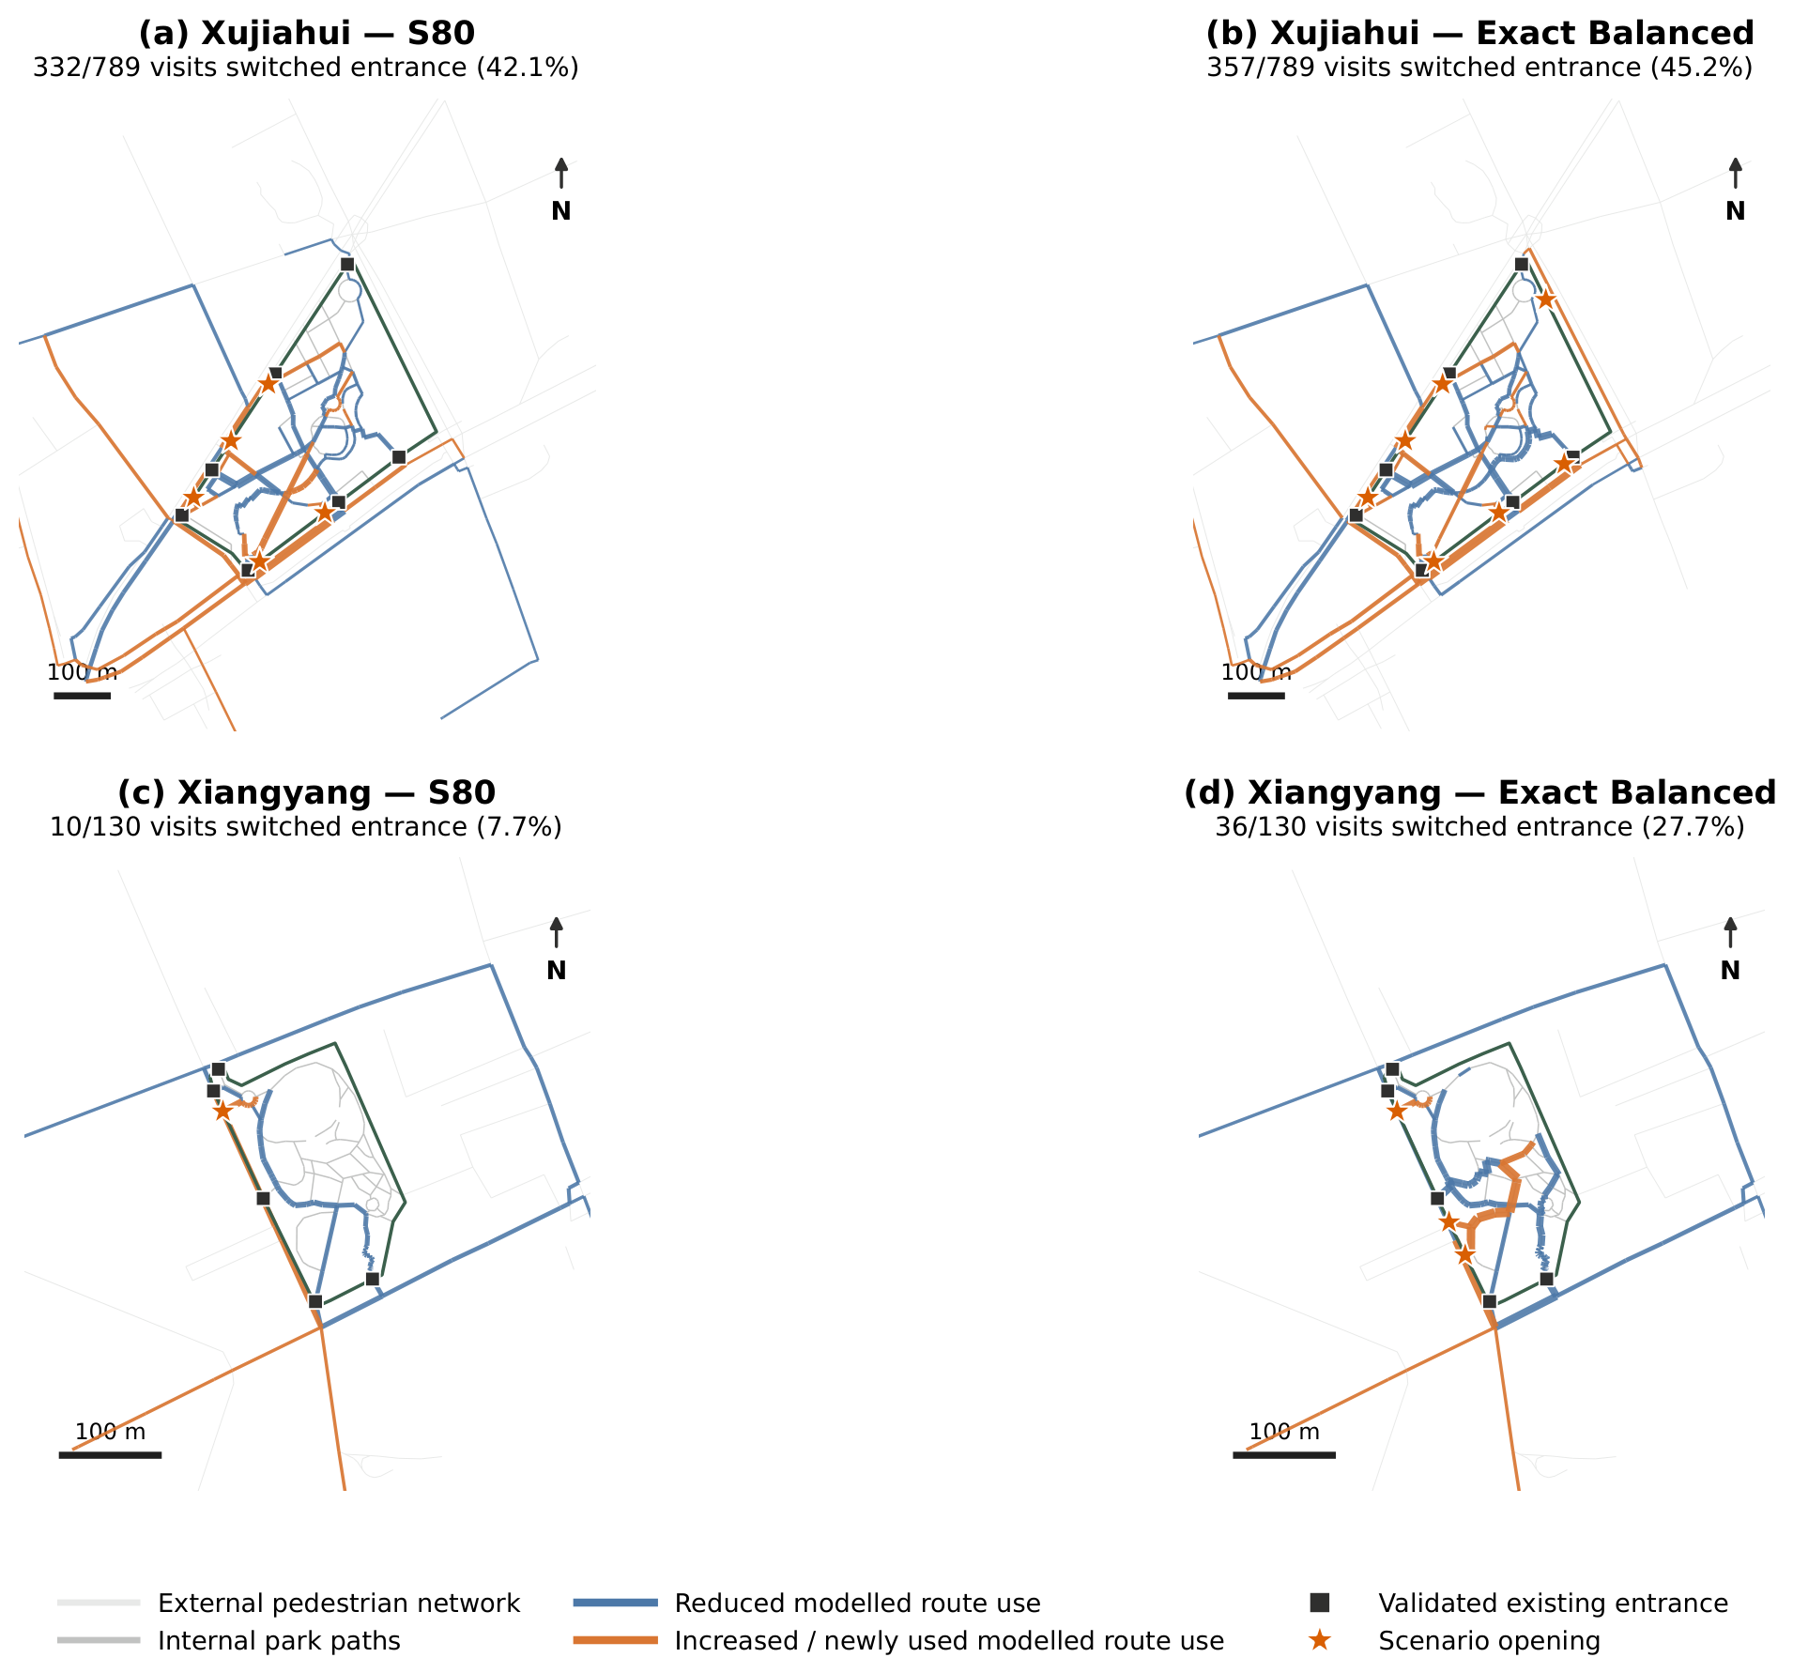
Figure 4 shows the S80 interventions and the additional openings in the Exact Balanced solutions.
Candidate-generation settings also produced different optimized sets (
Table 5).
The selected S80 and Exact Balanced scenarios differed in overall attainment and activity-chain balance.
Table 6 reports the activity-chain-specific ratios, while
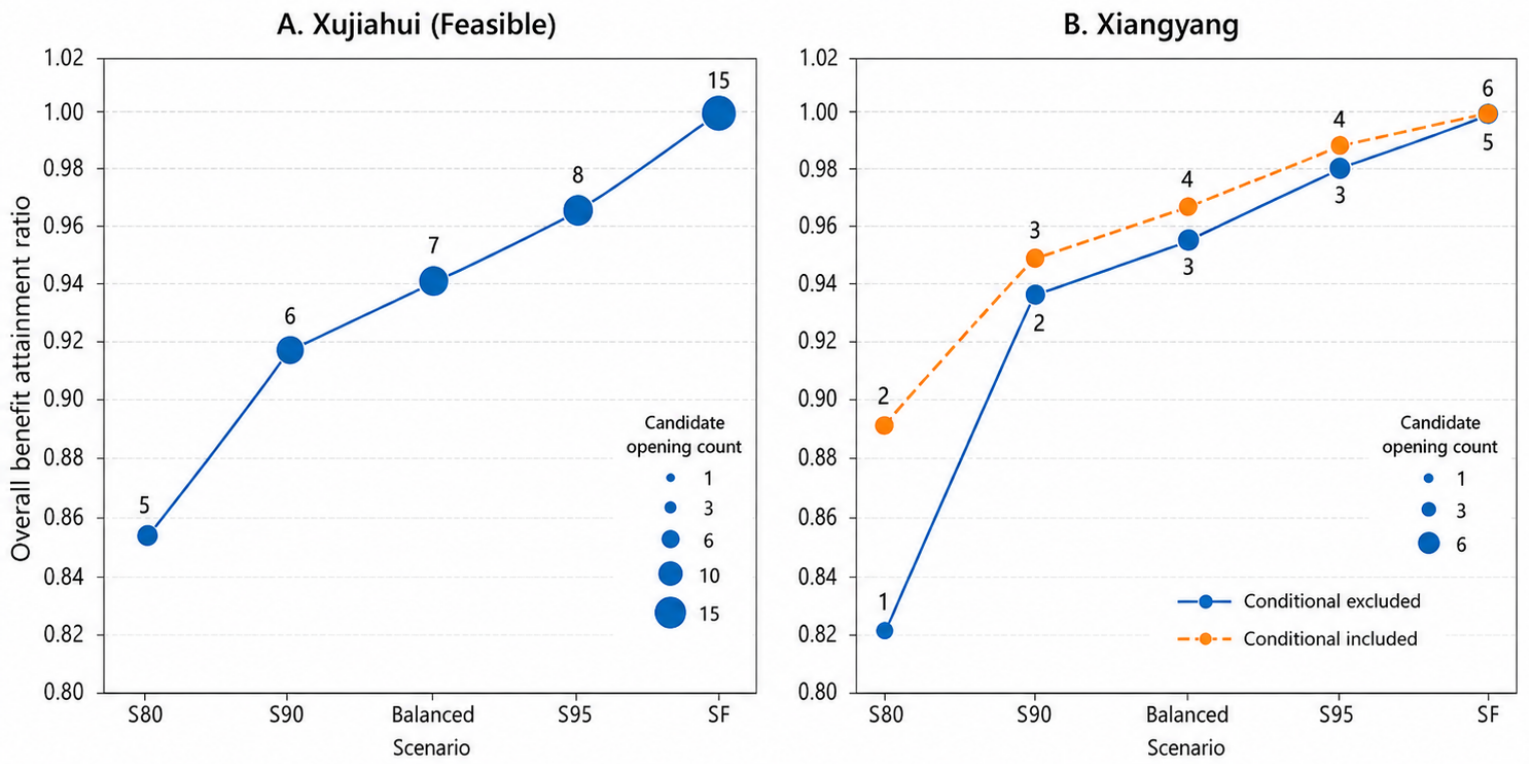
Figure 5 shows overall benefit attainment and opening counts across the principal scenarios.
4.3.1. Benefit Attainment and Diminishing Marginal Gains
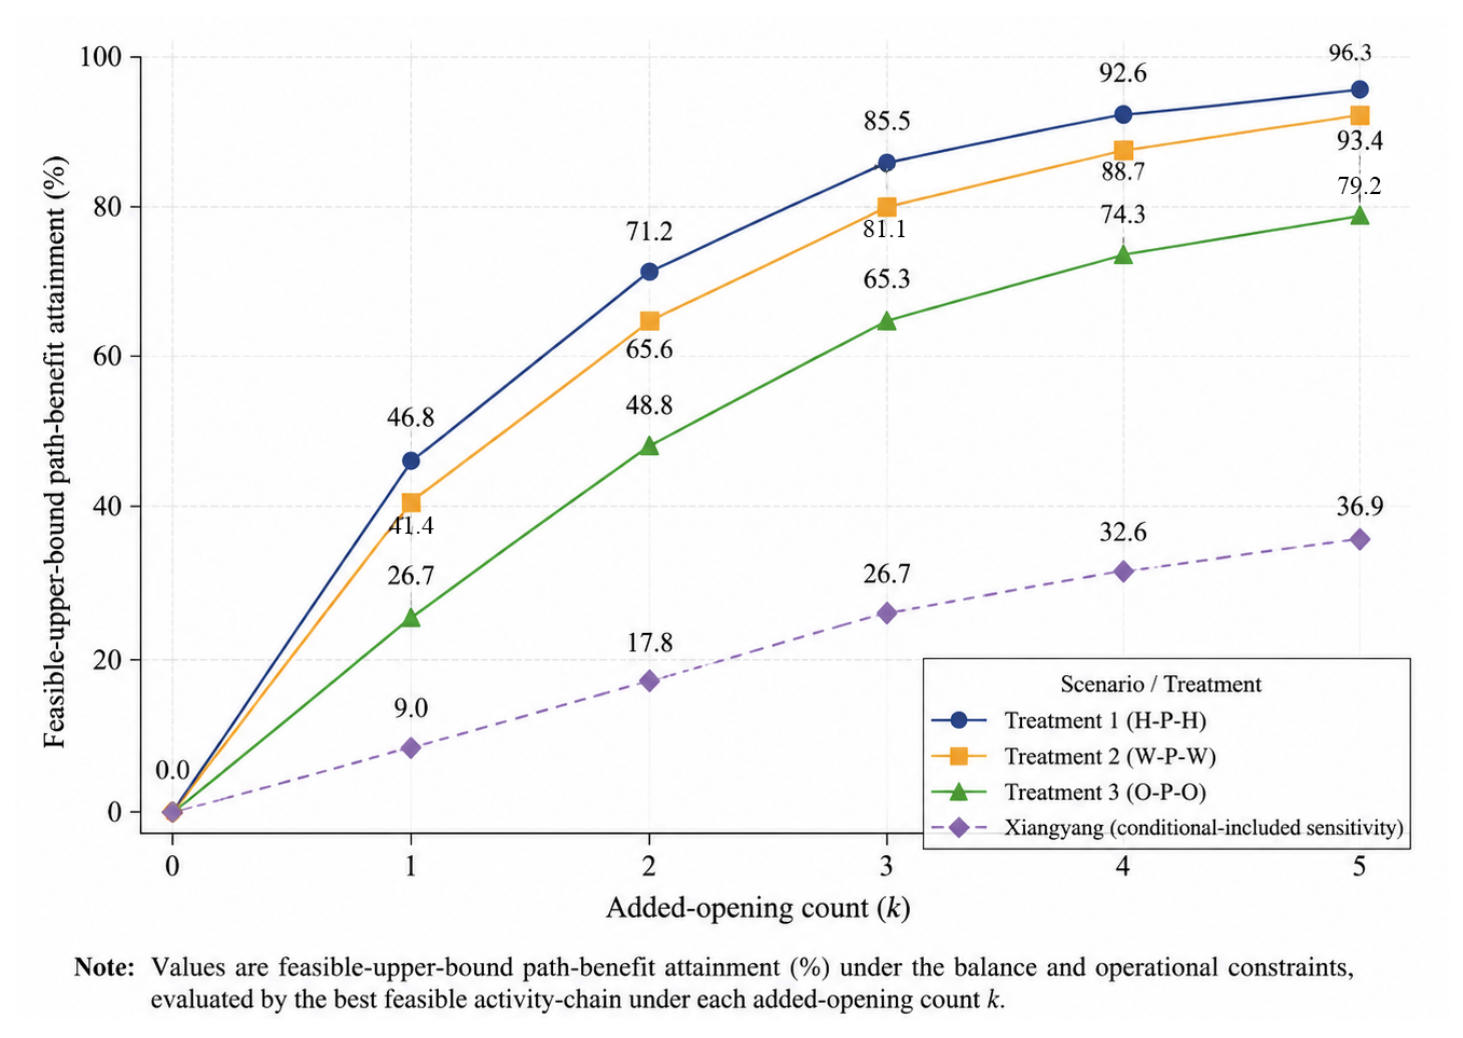
Exhaustive search confirmed the minimum-cardinality S80, S90, and S95 sets and showed rapid initial gains followed by diminishing returns (
Table 7;
Figure 6). In Xujiahui, five openings attained 85.40% of SF, while eight reached 96.29%. In Xiangyang’s primary feasible treatment, XI_C001 alone attained 82.42%; adding XI_C005 raised attainment to 93.95%, and a third opening raised it to 98.19%.
The meaning of a “limited set” was park-specific. Both S80 schemes captured most feasible benefit without using every candidate, but Xujiahui required a distributed five-opening set whereas Xiangyang’s aggregate gain was concentrated at one location.
4.3.2. Activity-Chain-Balanced Solutions
Overall benefit and activity-chain balance produced different intervention requirements.
Figure 5 shows overall attainment and opening counts, while
Table 6 reports the context-specific ratios. In Xujiahui, the seven-opening set XU_C003, XU_C004, XU_C006, XU_C007, XU_C012, XU_C013, and XU_C015 attained 93.87% of SF overall. Its H-P-H, W-P-W, and O-P-O ratios reached 91.12%, 92.10%, and 95.12%. In Xiangyang’s primary feasible treatment, XI_C001, XI_C004, and XI_C005 attained 95.75% overall and group ratios of 93.38%, 100.00%, and 95.96%. Xiangyang’s one-opening S80 captured most total benefit but provided almost no H-P-H or W-P-W gain; XI_C004 and XI_C005 were needed for a balanced response.
The conditional-included Exact Balanced solution comprised XI_C001, XI_C004, XI_C005, and XI_C008. It attained 96.46% of its own conditional SF and a weakest-context ratio of 96.18%. Because XI_C008 requires additional implementation review, this scheme remains a conditional engineering option. It does not replace the three-opening primary feasible balanced solution.
Xujiahui’s key openings were distributed across several boundary positions. Xiangyang’s aggregate benefit was concentrated at XI_C001, while XI_C004 and XI_C005 extended the balanced solution along the southwestern edge. The spatial contrast shows why activity-chain demand must be translated into locations rather than only an opening count.
The nine-context robustness analysis added six asymmetric contexts to the three symmetric contexts without replacing the main analysis. Of the six park–threshold solutions, 3 of 6 (50.00%) changed in opening count and 5 of 6 (83.33%) changed in exact candidate composition. Mean Jaccard similarity was 0.7050, ranging from 0.4286 for Xujiahui S80 to 1.0000 for Xiangyang S90. In Xujiahui, the S80/S90/S95 counts changed from 5/6/8 to 5/7/8 and attained 82.79%/93.69%/96.22% of the nine-context SF benefit. In Xiangyang, the counts changed from 1/2/3 to 2/2/2. XI_C001 and XI_C005 together attained 97.22% at all three thresholds. Using nine contexts changed the exact opening sets, but the main park-level pattern remained: Xujiahui required several distributed openings, while Xiangyang remained concentrated around a few high-value links. Selective subsets still captured most feasible benefit in both parks.
A separate test examined sensitivity to candidate-generation parameters (
Table 5). In Xujiahui, the Strict, Baseline, and Permissive S80/S90/S95 counts were 3/4/5, 5/6/8, and 5/6/8. Every non-baseline set changed in composition, with Jaccard similarity to Baseline ranging from 0.25 to 0.78, but key boundary sectors remained stable with a minimum overlap of 0.80. Xujiahui was therefore sensitive to parameter settings at the configuration level. In Xiangyang, the counts were 1/1/2, 1/2/3, and 1/2/3, and non-baseline Jaccard values ranged from 0.00 to 0.50. The minimum sector overlap was 0.125, indicating that the key boundary sectors also changed substantially. In Xiangyang, parameter changes therefore altered the recommended opening scheme.
4.3.3. Internal Spatial-Network Reconfiguration
The optimized openings redistributed modeled access routes across external streets, park entrances, and internal paths (
Figure 7). In Xujiahui, 332 of 789 visits (42.1%) changed entrance under S80 and 357 (45.2%) under Exact Balanced. In Xiangyang, 10 of 130 visits (7.7%) changed entrance under S80 and 36 visits (27.7%) under Exact Balanced. Both Xujiahui schemes redistributed routes across several approach directions. Xiangyang S80 affected only a small set of approach paths, while adding XI_C004 and XI_C005 extended the redistribution to more directions.
The route comparison shows where modeled access paths changed. The space-syntax analysis then shows how the new boundary connections changed the internal and surrounding network.
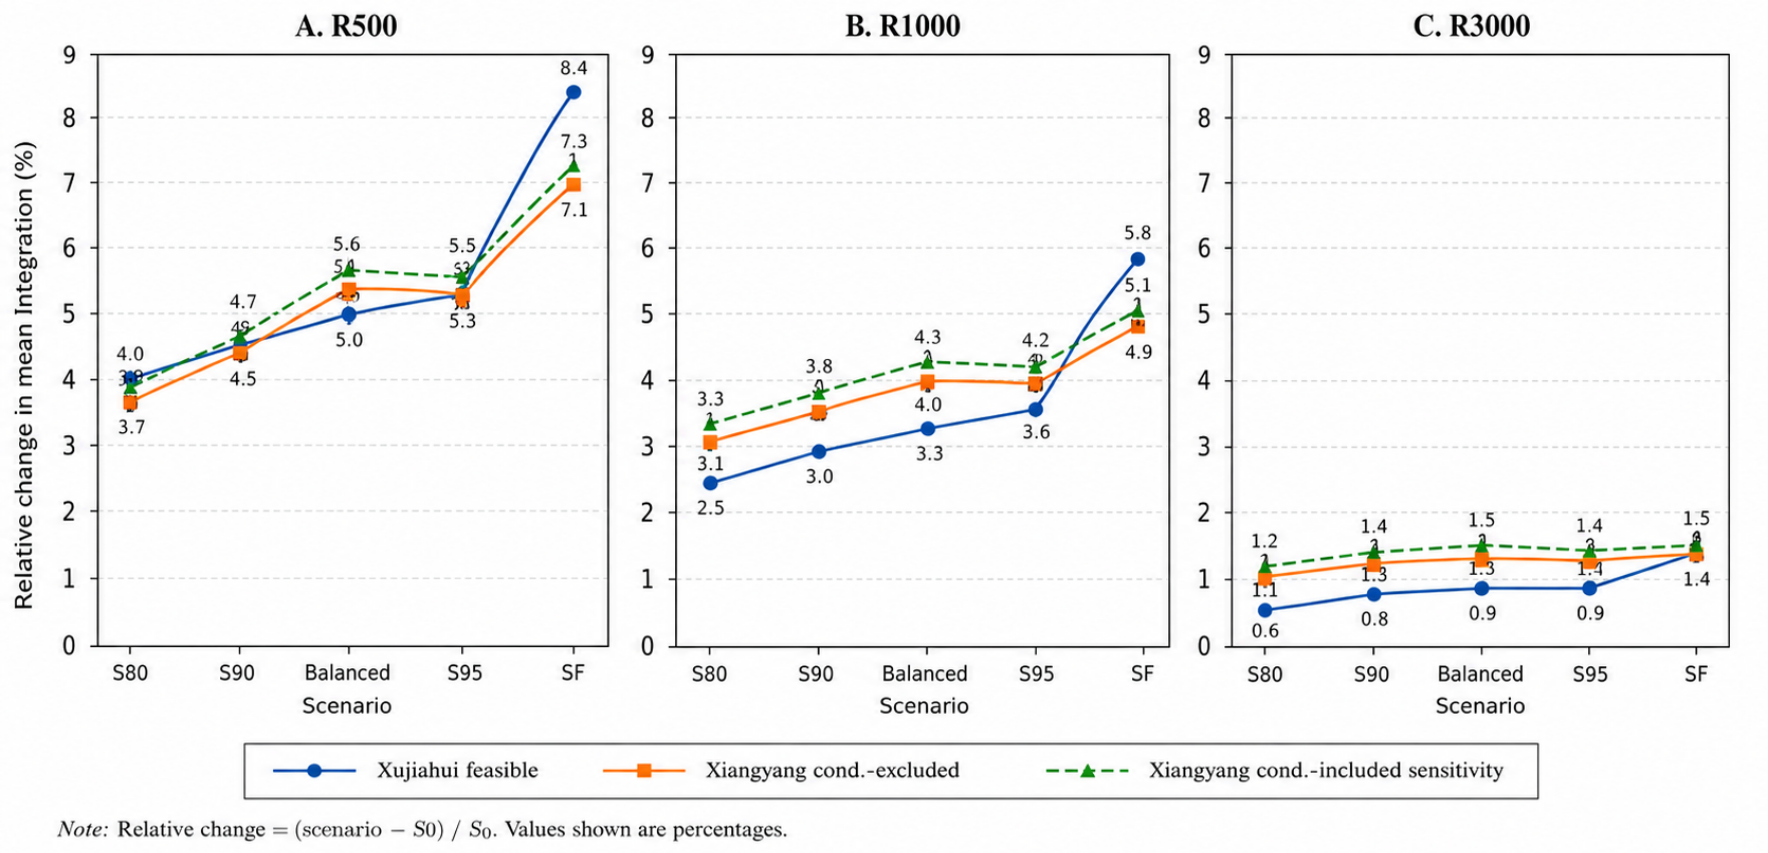
The DepthmapX results showed a scale-dependent network response. Both S80 schemes increased mean internal Integration at R500, by 4.04% in Xujiahui and 3.73% in Xiangyang (
Table 8;
Figure 8). The effect weakened toward R3000, indicating that the connectors influenced local internal accessibility more strongly than broader-scale integration.
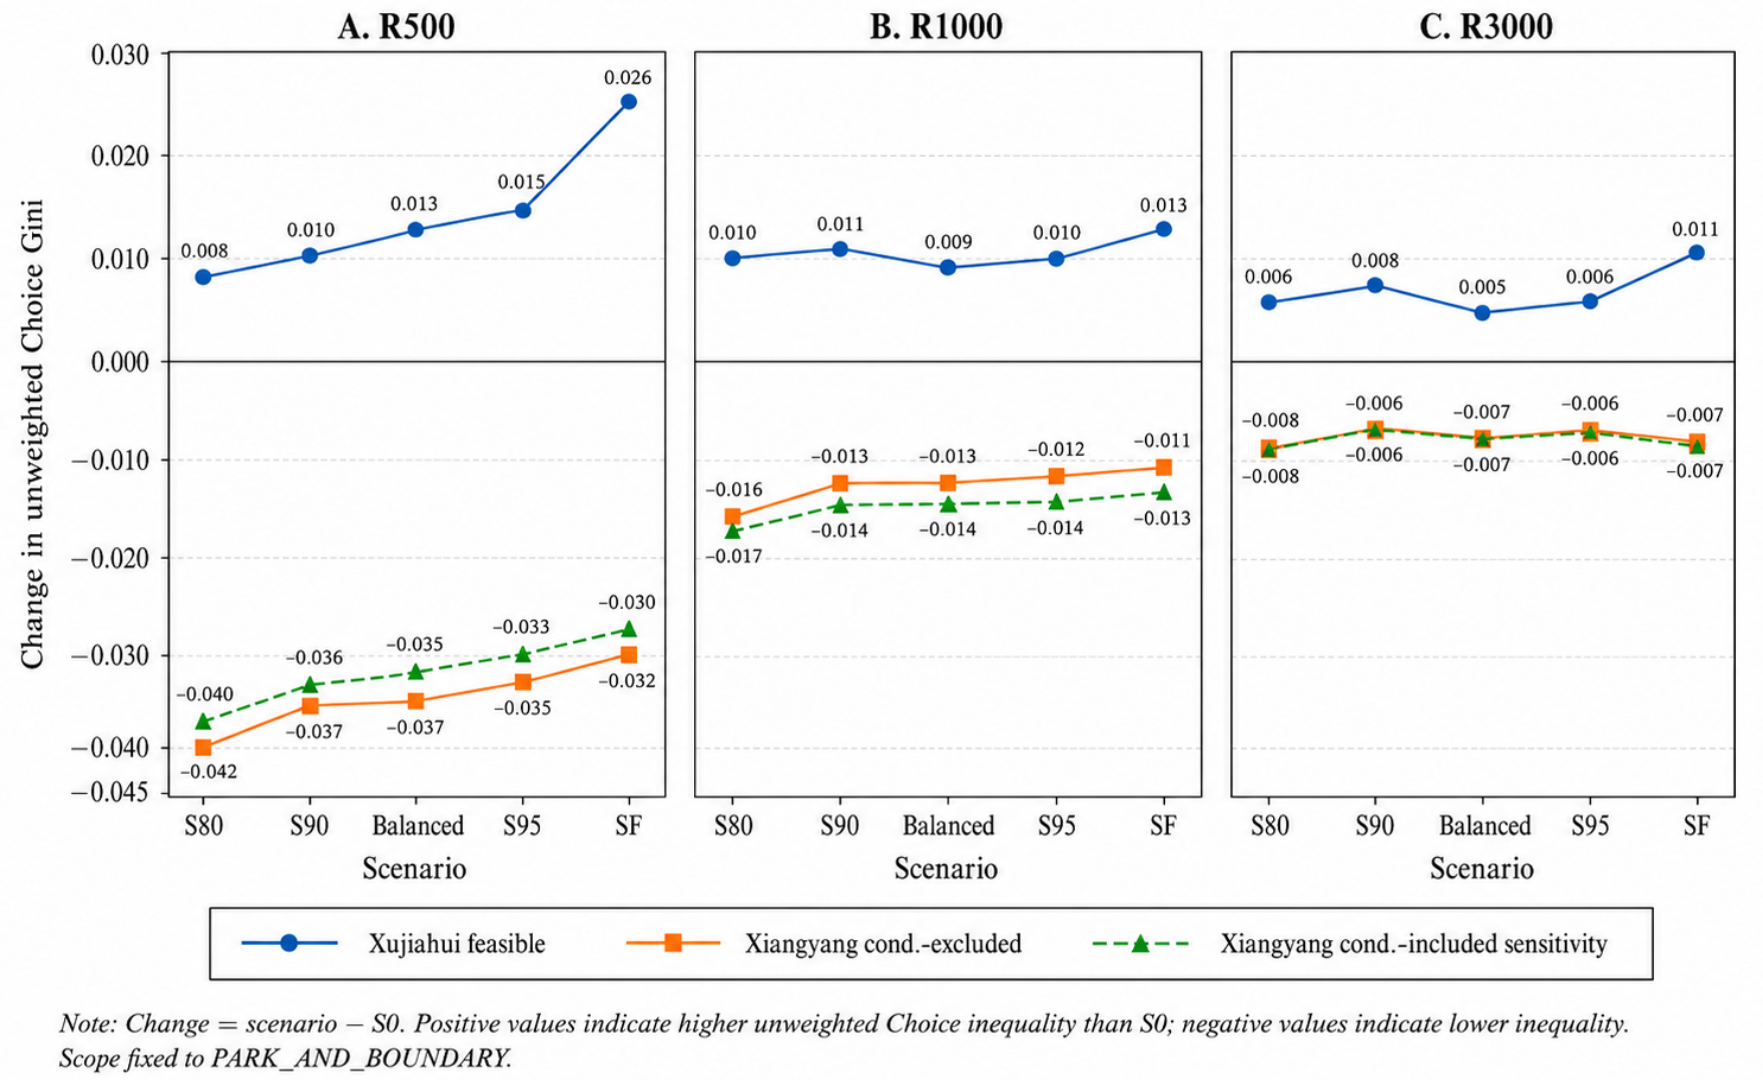
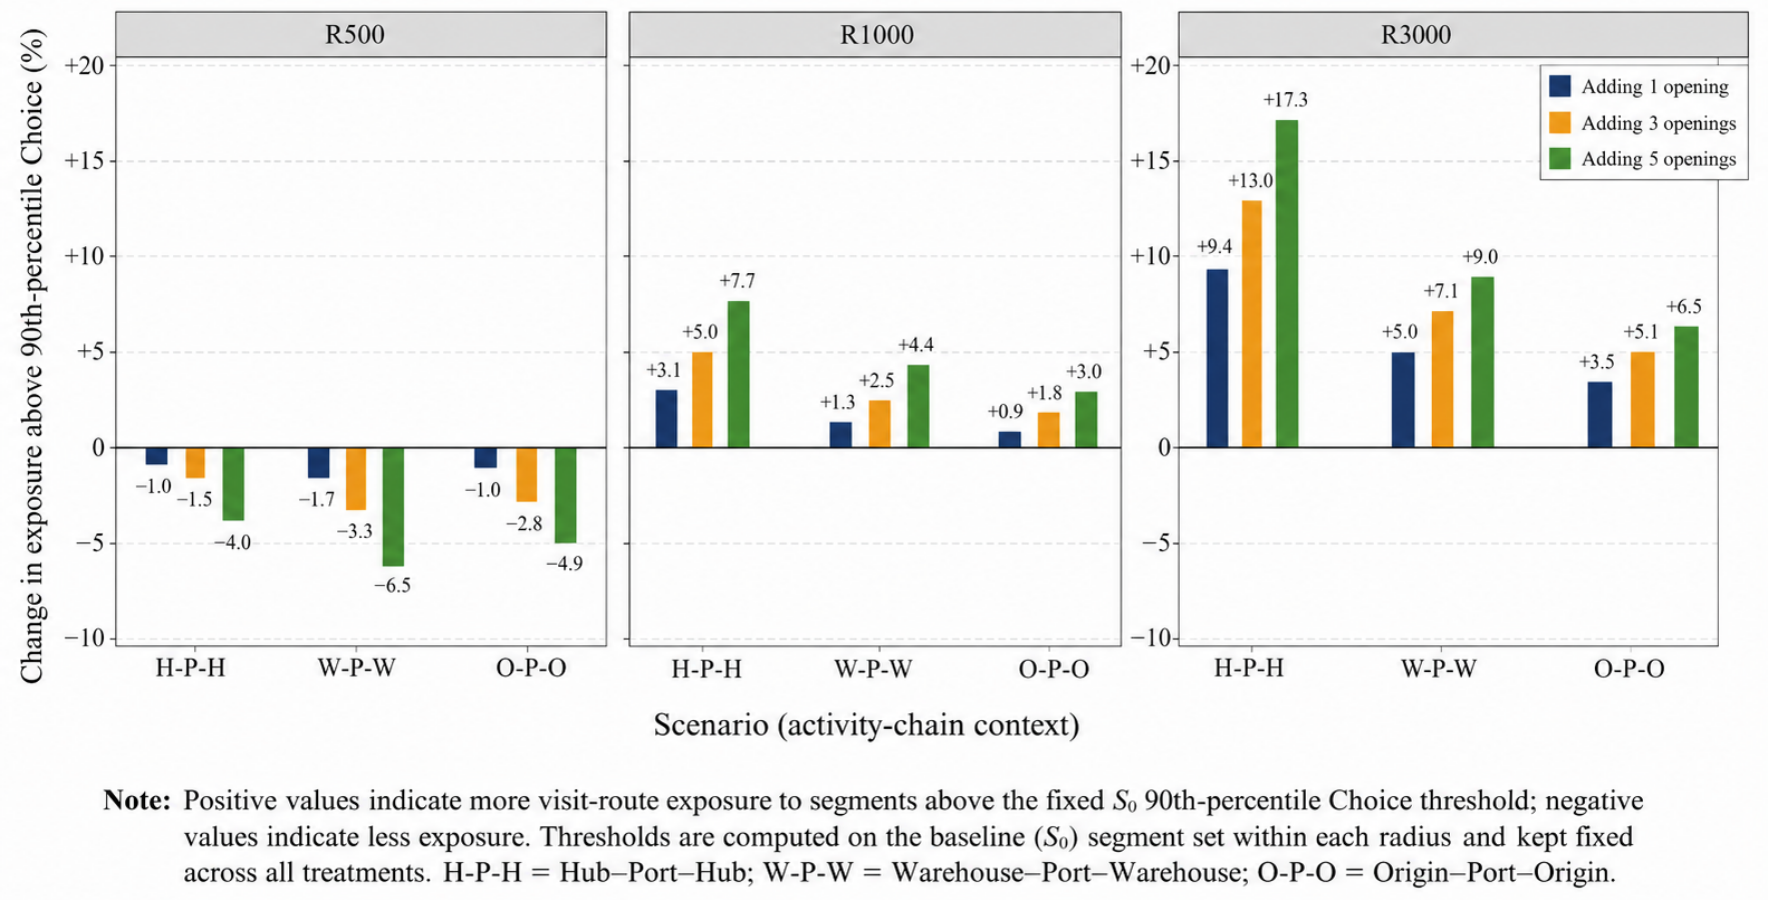
Choice concentration and high-Choice route exposure did not move in a common direction (
Table 9;
Figure 9 and
Figure 10). Xujiahui S80 increased Choice Gini at all radii, while its exposure decreased at R500 but increased at R1000. Xiangyang S80 reduced both R500 measures, whereas its balanced scenario slightly increased exposure at broader radii. Boundary links therefore reorganized potential through-movement differently across parks and spatial scales.
Choice and high-Choice exposure are structural indicators and should not be interpreted as observed pedestrian flow or congestion; neither direction has an automatic positive meaning, and both require interpretation with route benefit, recreational function, and field evidence.
4.3.4. Staged Planning Decisions
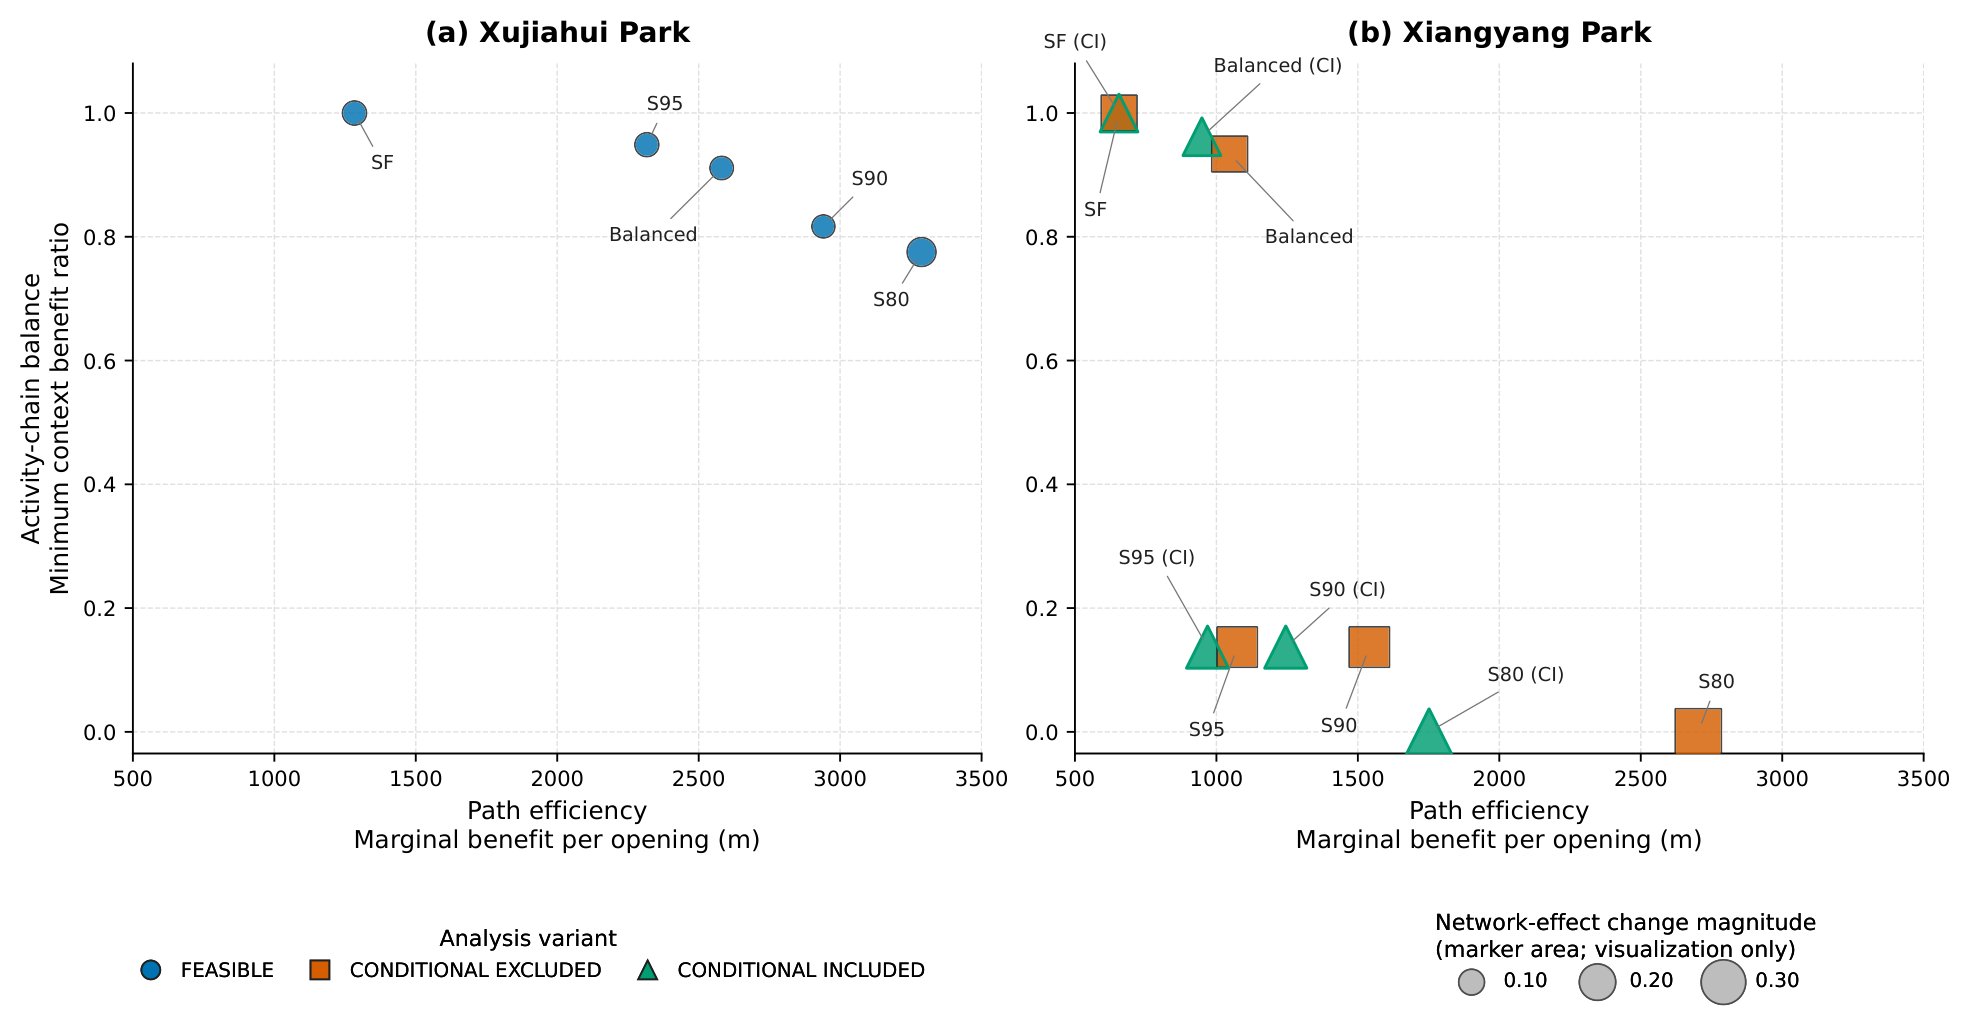
Table 10 summarizes the planning role of each scenario, and
Figure 11 compares path efficiency, activity-chain balance, and network impact.
Xujiahui required a progression from five openings for S80 to seven for the balanced solution. In Xiangyang, XI_C001 captured most aggregate benefit, but three openings were needed for balanced coverage across activity contexts; XI_C008 remained a conditional engineering option.
5. Discussion and Conclusions
5.1. Activity-Chain Context, Access Efficiency, and Balance
Representing a visit through its before–park–after context changes what counts as an accessibility problem. Residential proximity remains important, but it cannot describe a visit approached from work, shopping, services, or another activity. The three-node window retains the park’s immediate role within an ordered day without turning each long daily sequence into a separate class. This distinction matters because home-based and mobility-based measures can produce different accounts of green-space exposure [
16].
Total route benefit and activity-chain balance answer different planning questions. Aggregate distance reduction favors contexts with more observations or larger removable detours. Pattern-specific attainment instead asks how much of the feasible improvement available to each context is delivered. The Exact Balanced criterion identifies the weakest-served context without assuming that all three patterns have equal population importance. Efficiency and balance are therefore complementary diagnostics. The value of the same distance saving may also vary by time of day, as discussed further in
Section 5.4.
Access therefore depends on both the approach route and the connection from the entrance to the internal destination. Selective boundary work can improve this relation without redesigning the whole street or park-path network. Shorter access routes may make access easier, but the model does not predict whether they lead to more visits or different route choices.
Park-BIND compares total benefit with pattern-specific attainment, so differences among activity contexts affect planning. The exact opening sets depend on how these contexts are defined, but the main park-level pattern remained: Xujiahui needed several distributed links, while Xiangyang concentrated benefit around a few high-value links. This contrast shows why location matters more than entrance count. Similar benefit targets produced different schemes because activity demand and local networks differed.
5.2. Selective Connectivity and Internal Network Consequences
The main planning implication is that park boundaries should be opened selectively rather than according to a universal number or spacing rule. International practice already treats entrances and edges as part of the surrounding urban network. New York City’s Parks Without Borders and Tokyo’s Hibiya Park regeneration use entrance and edge redesign to strengthen park–city connections [
29,
30]. Quantitative studies in Shenzhen and Tokyo likewise show that entrance location and number can affect accessibility and produce diminishing returns [
21,
22]. Together, this evidence supports selective boundary redesign while showing that no single opening rule applies everywhere.
Park-BIND turns this planning problem into a comparison of opening sets that considers activity contexts and network consequences. Similar benefit targets can require different numbers and locations of openings. The two sensitivity tests examine different sources of uncertainty: one tests the activity-chain definition, while the other tests candidate-generation settings. Because exact sets can vary with these choices, the transferable element is the Park-BIND procedure rather than its parameters or entrance locations. Applications elsewhere should calibrate parameters to local conditions and report sensitivity before interpreting exact opening sets.
The locations identified by Park-BIND are intended for strategic screening rather than direct construction. Detailed design must still consider site constraints, safety, universal access, landscape quality, management, and perceptual factors such as visibility, legibility, shade, lighting, and path quality. Ownership, topography, facilities, and engineering feasibility also require site-specific review supported by field observation and stakeholder input.
Boundary connections should also be assessed together with internal paths because a new opening can redistribute access routes and alter network structure. Internal paths have been linked to park walking [
23], but modeled accessibility and network changes do not by themselves show observed flow, use, or congestion. This distinction matters because park availability has been associated with wellbeing [
31], while health effects arise through several pathways [
32] and wider outcomes depend on implementation and experience [
33]. Park-BIND addresses spatial access and network structure; it cannot establish these later effects or realized equity.
With these limits in mind, planning should proceed in stages: begin with a minimum efficient set, add openings when activity contexts remain poorly served, and consider higher benefit or conditional options only when their added value justifies the implementation and network effects. SF remains an analytical upper bound, not a construction target.
5.3. Conclusions
This study supports four conclusions:
- (1)
Central-city park access should be evaluated as a complete activity-linked route. Residential proximity alone cannot represent visits connected to work or other urban activities, nor can distance to the park boundary show whether an approach route connects to a public entrance, internal path, and usable destination.
- (2)
Boundary intervention is site-specific rather than a matter of applying a universal entrance number or spacing rule. Xujiahui required a distributed set of links, whereas Xiangyang had one dominant opening that captured most aggregate benefit and additional locations needed to serve other activity contexts.
- (3)
Aggregate efficiency and activity-chain balance are distinct planning objectives. A minimum efficient set can recover most feasible route benefit, but a balanced priority set may be necessary when home-, work-, or other-activity-related visits remain weakly served.
- (4)
More entrances are not an end in themselves. Boundary renewal should proceed from minimum efficient intervention to balanced priority intervention, with higher-attainment and conditional schemes considered only when their added benefit justifies their implementation and internal-network consequences. Park-BIND supports this staged choice without collapsing accessibility, balance, feasibility, and potential through-movement into one score.
5.4. Limitations and Future Research
The two parks and two-week observation period cannot establish universal response functions, and mobility-derived activity chains are not a population census. Device coverage, privacy preprocessing, observation frequency, stable-point rules, and the restriction to symmetric before–park–after contexts affect which visits enter the fixed samples. The three symmetric contexts omit some mixed-purpose visits and intermediate activities in longer daily schedules. The nine-context test confirmed that this simplification can change detailed opening solutions, so candidate IDs should not be treated as independent of the activity-chain definition. The symmetric contexts remain suitable for the main comparison because they are common and well supported, but they do not cover all park-related mobility. The analysis estimates potential shortest-path savings; changes in visitation, pedestrian flow, or social equity require behavioral or post-intervention validation.
Shortest network distance provides a consistent scenario comparison, but actual route choice may respond to temporal, perceptual, safety, and design conditions. The route-cost function does not weight distance by time of day or schedule rigidity and does not include perceptual or aesthetic measures. Observed routes can differ from theoretical shortest paths [
17], while opening hours and time-dependent availability can change green-space access [
8]. Choice and high-Choice exposure remain structural indicators until tested against observed pedestrian movement.
The feasibility classification is a planning-level screen rather than engineering approval. This study did not assess detailed topographic, facility, landscape, operational, cost, structural, utility, or construction conditions.
Future studies should test Park-BIND across parks with different sizes, boundary forms, and street networks, using richer and more time-sensitive activity chains. Candidate-generation parameters should be calibrated locally to park size, boundary form, street density, existing entrances, and field evidence, and then tested for sensitivity. Future route-choice and post-intervention studies should add temporal, perceptual, safety, and design factors and test whether predicted accessibility changes appear in observed behavior.