Analysis of Drivers of Urban Land-Use Types in Mining Areas Based on Remote Sensing Imagery and Projections of Future Scenarios: A Case Study of Jungar Banner
Abstract
1. Introduction
2. Materials and Methods
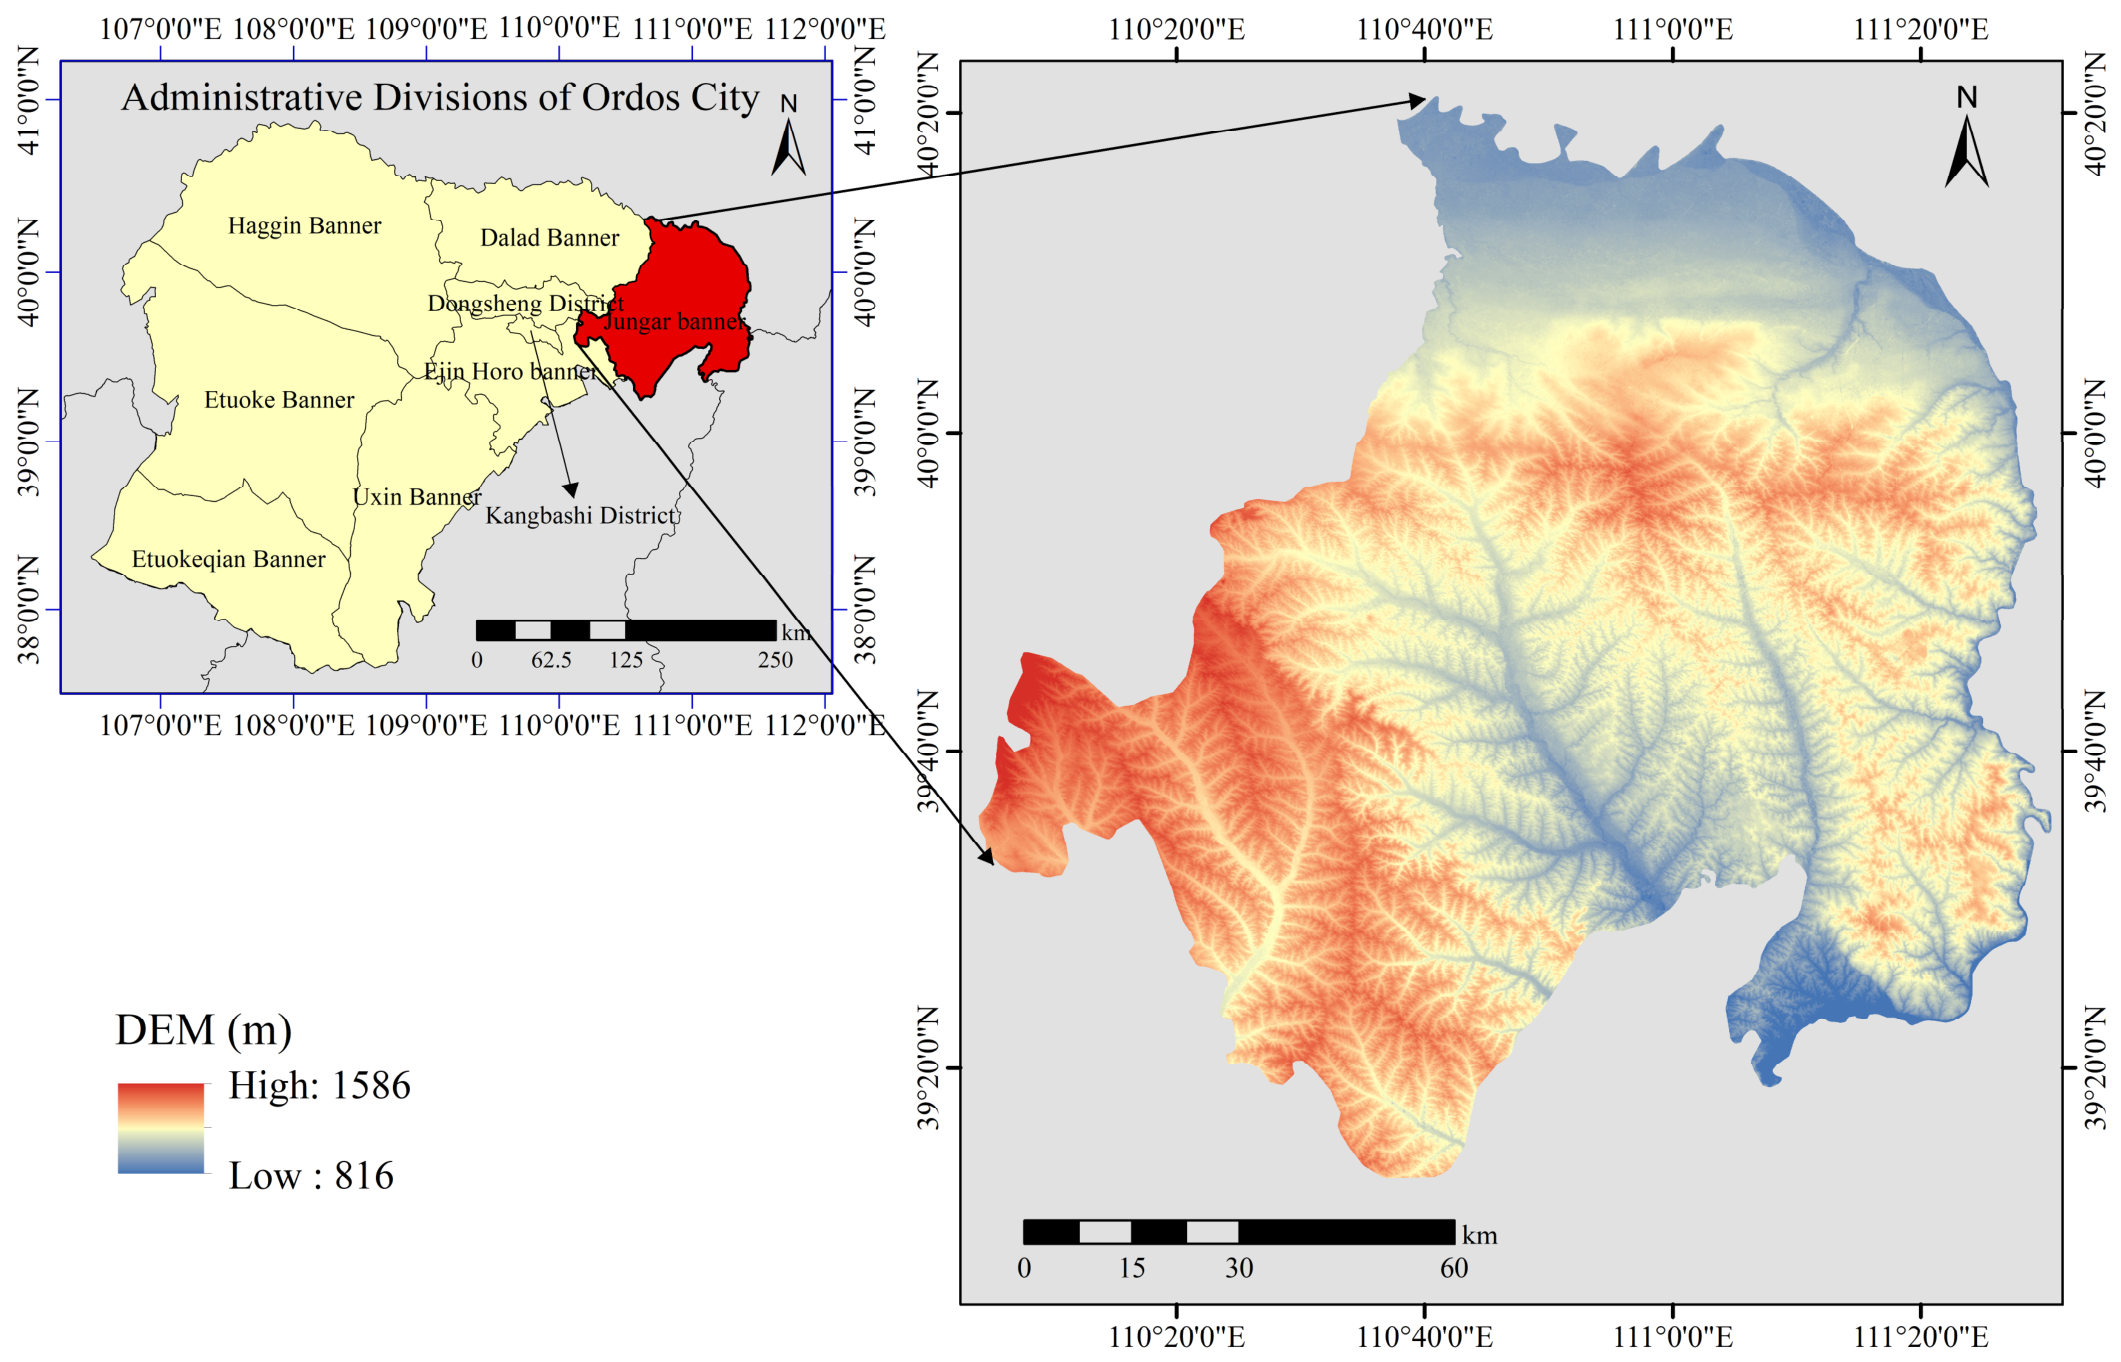
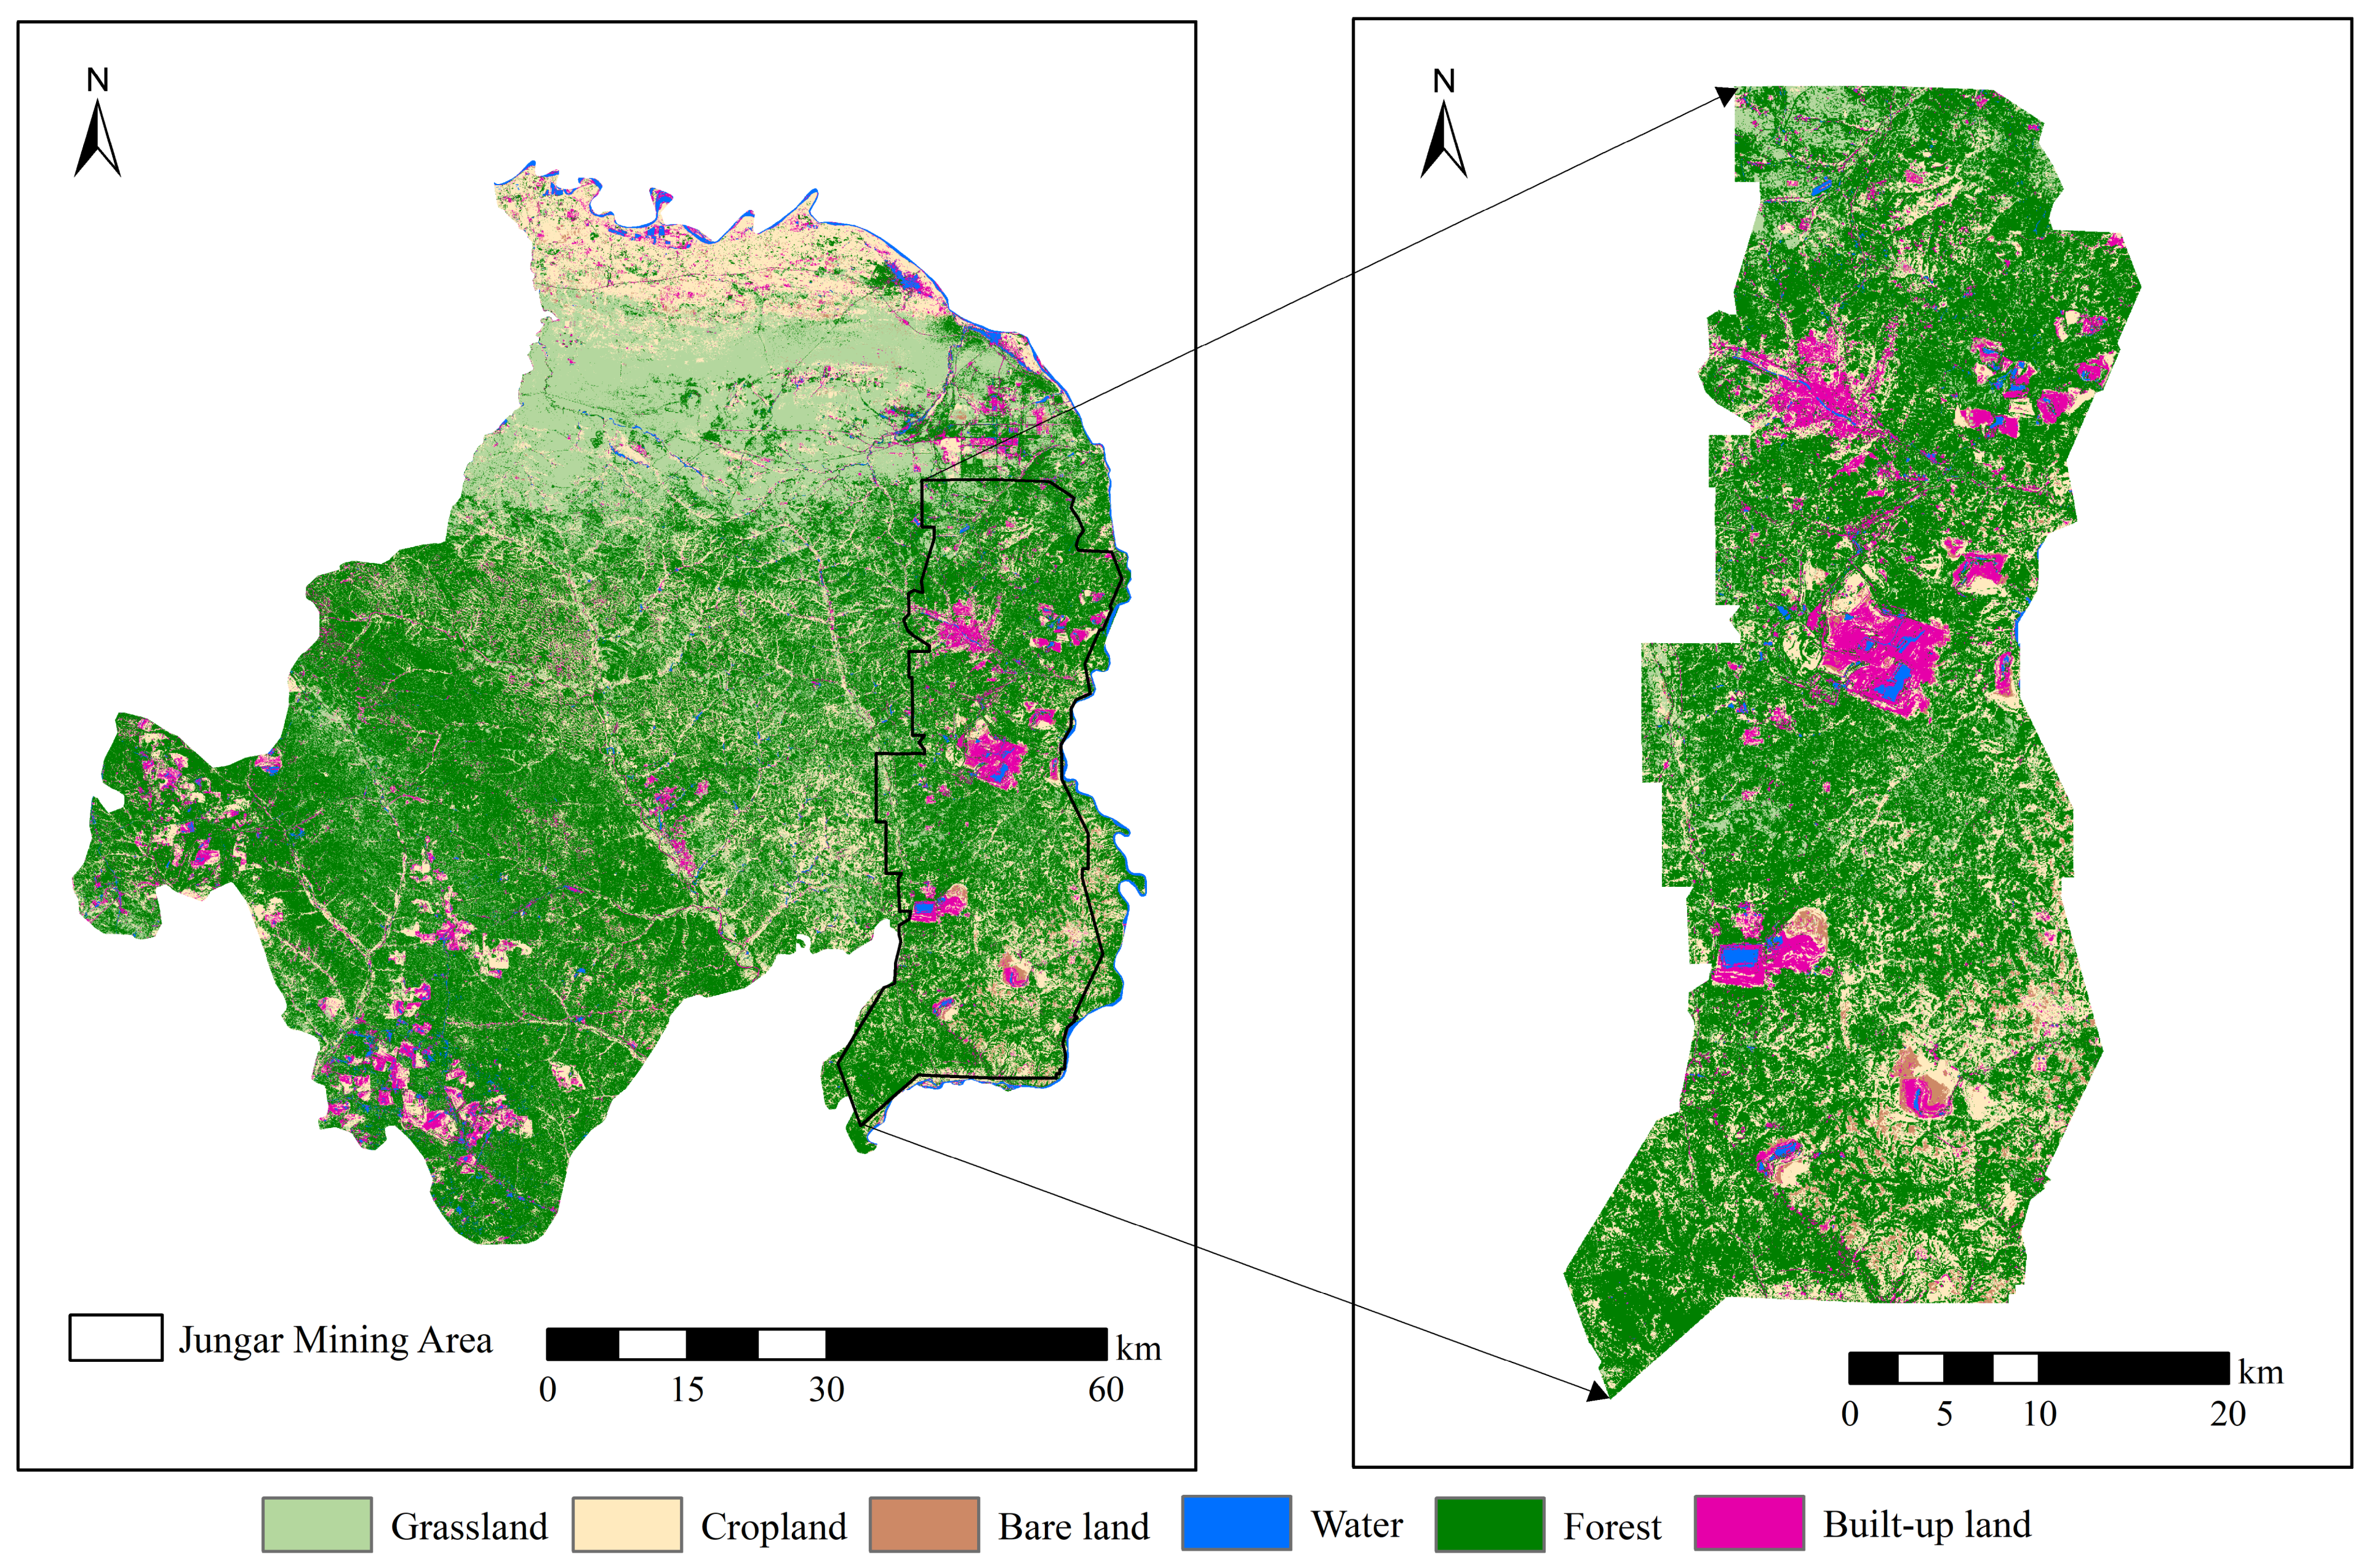
2.1. Study Area
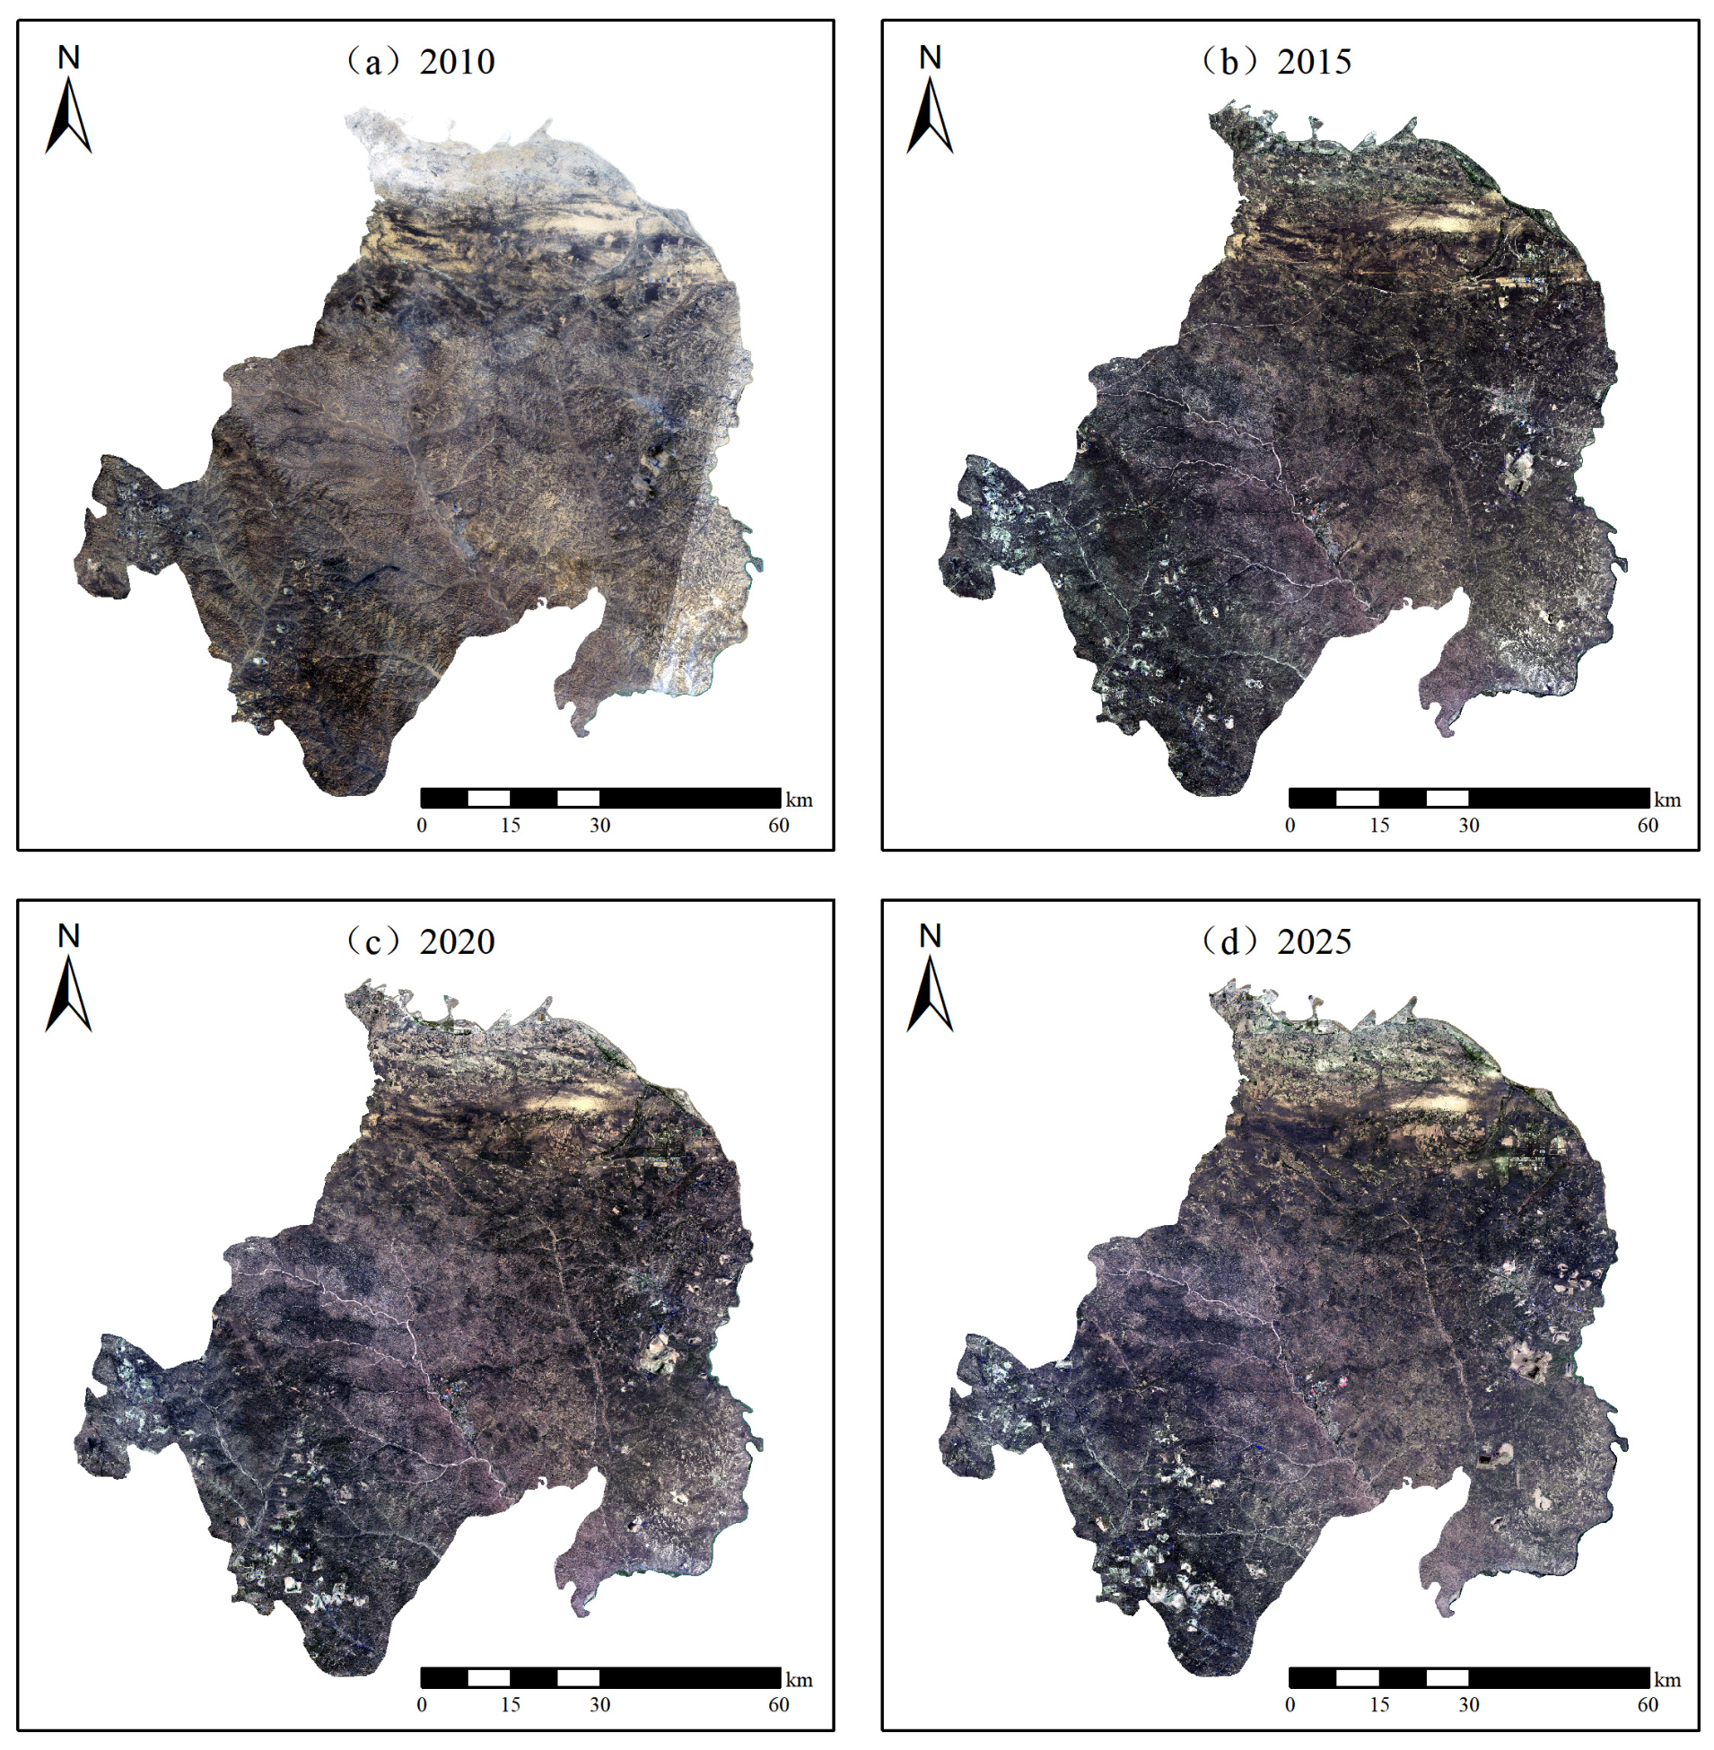
2.2. Data Sources
2.3. Analysis of Land-Use Type Conversion Rates
2.4. Analysis of Spatial Scale Effects of Driving Factors
2.5. The NEGM-MOP Model
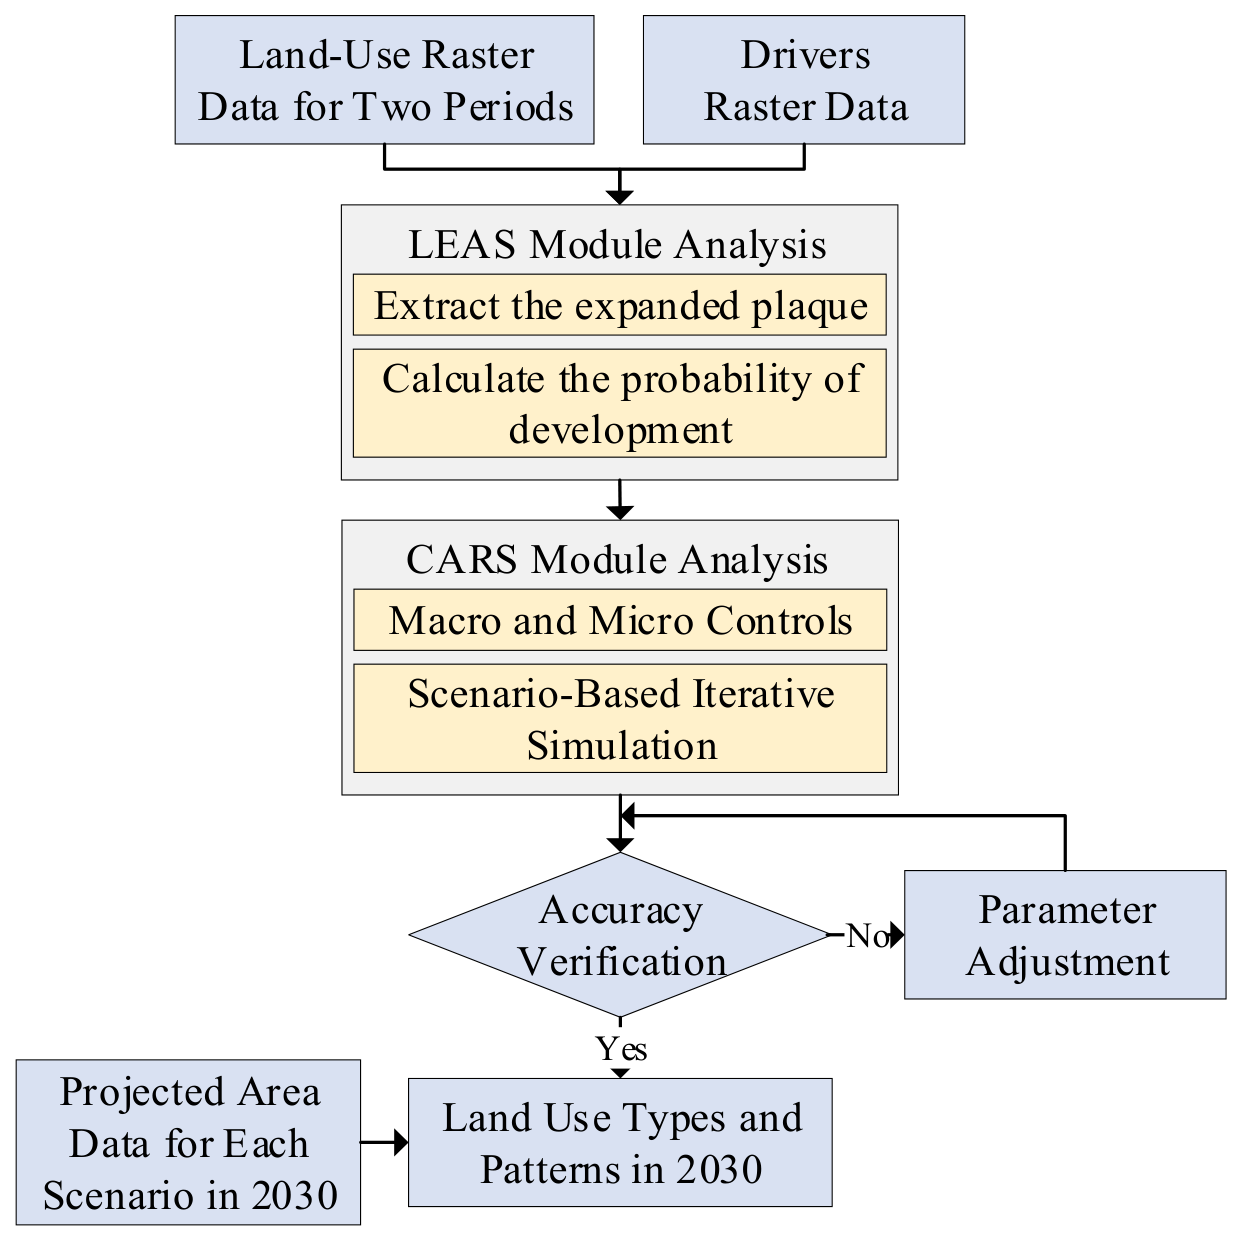
2.6. PLUS Model
3. Results
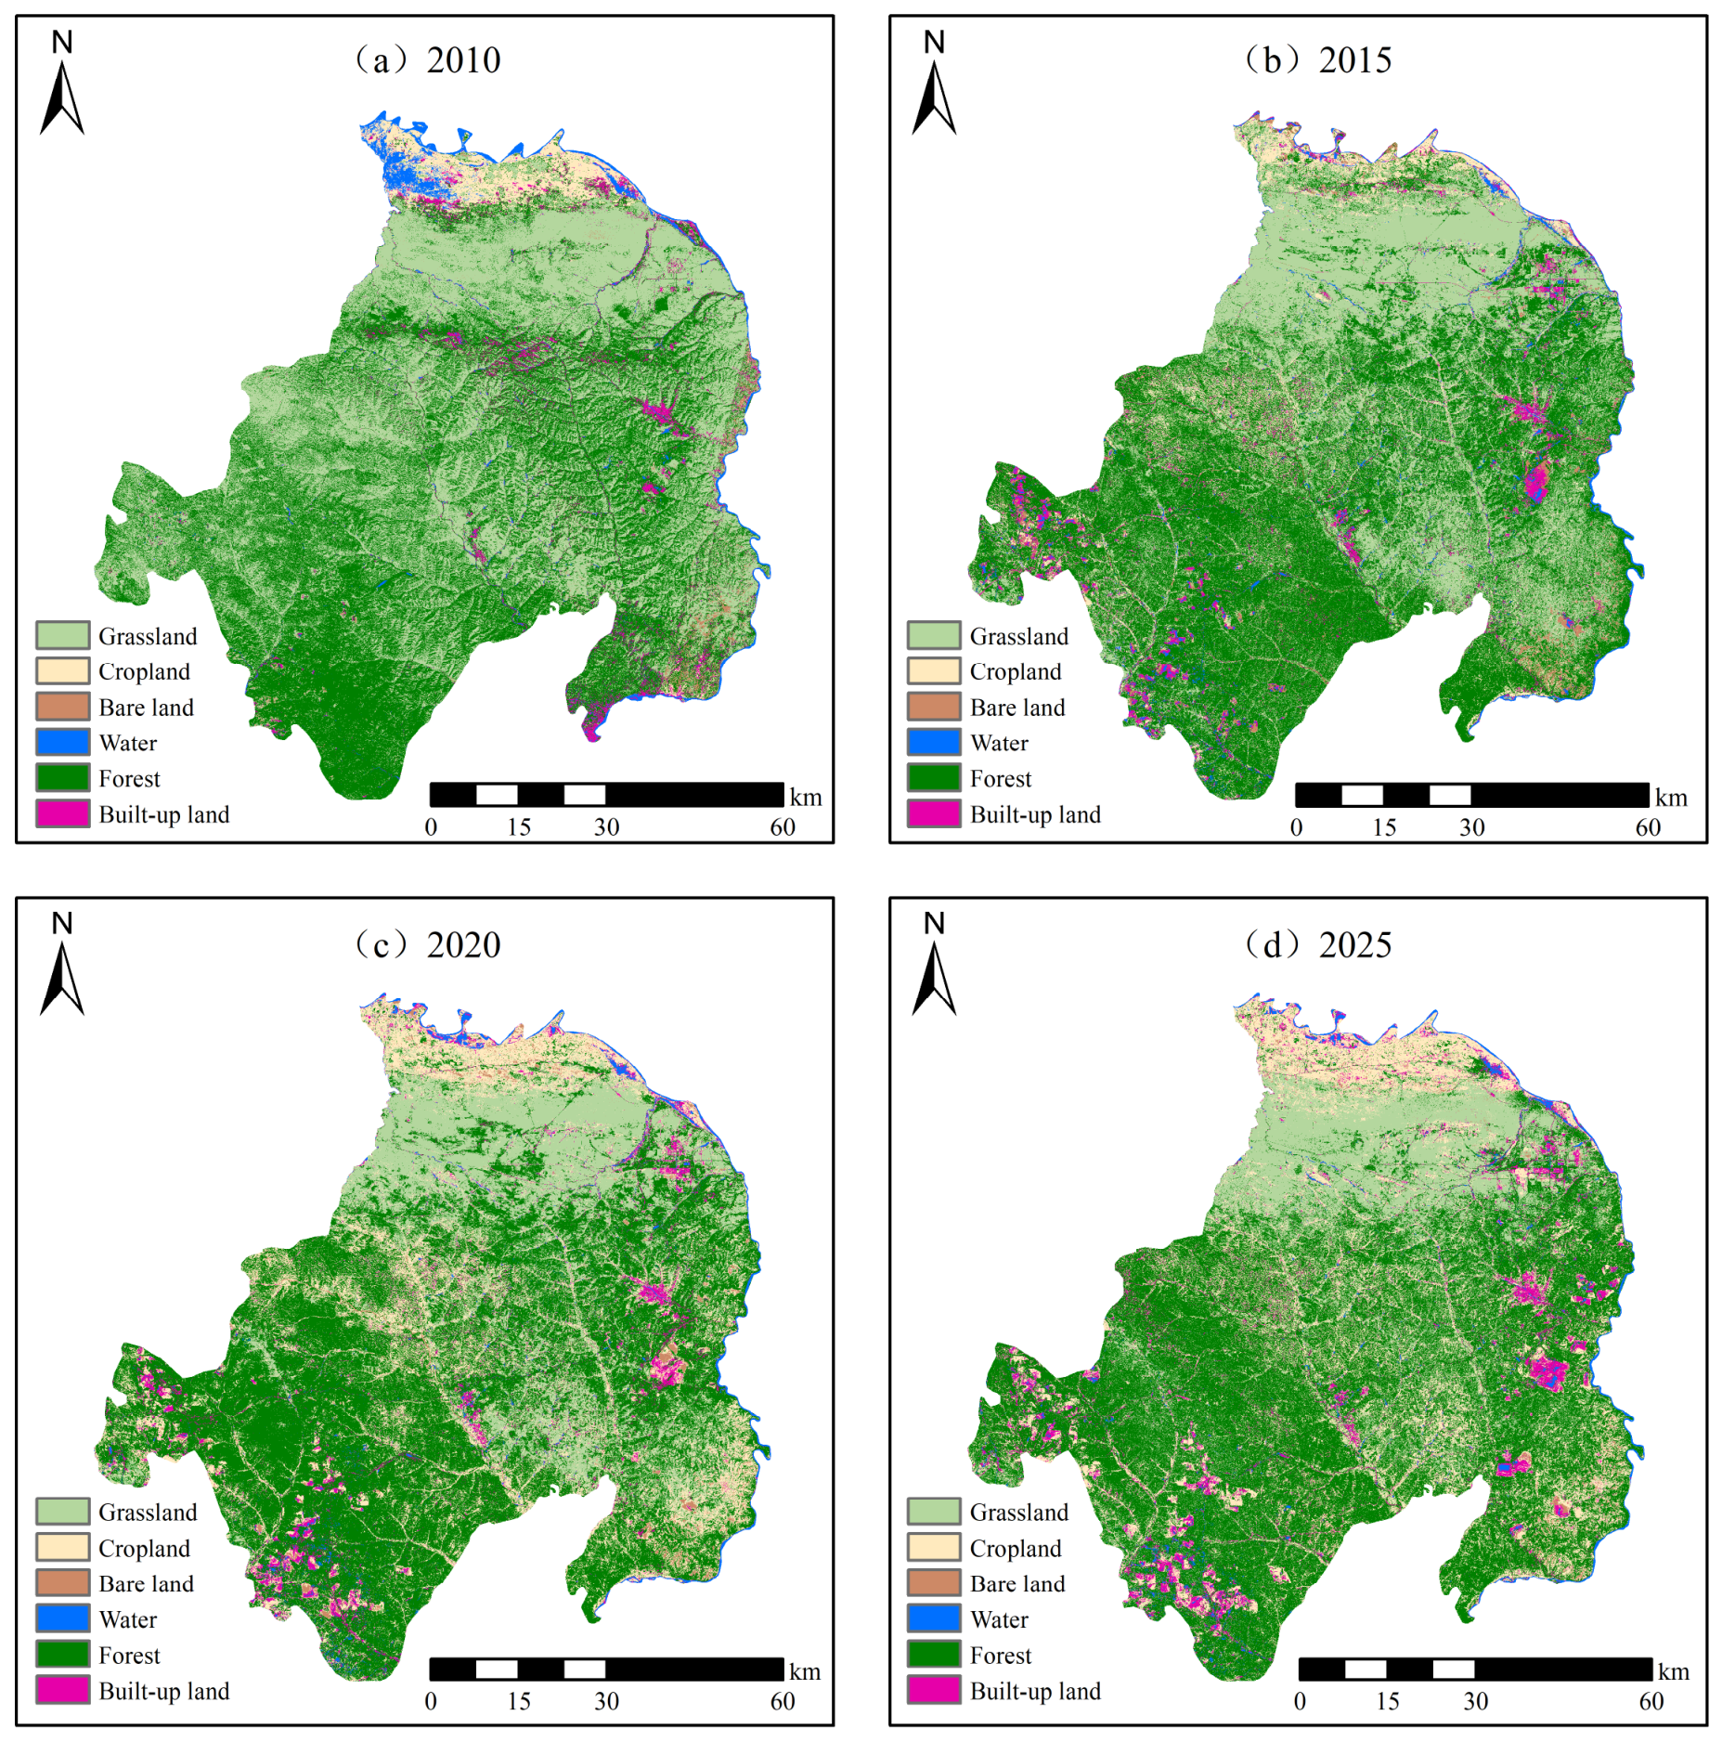
3.1. Analysis of Land-Use Type Evolution
3.2. Analysis of Driving Factors of Land-Use Types
3.3. Analysis of Land-Use Types Under Multiple Scenarios
4. Discussion
- (1)
- Delineate expansion thresholds and spatial access redlines for built-up land. This study specifies a net increase of 113.17 km2 for built-up land under the CDS, which should serve as a rigid redline for newly added built-up land by 2030. Spatially, new development projects must be confined to existing built-up areas and the eastern industrial park fringe to foster industrial clustering. Meanwhile, construction and mining activities should be strictly prohibited from expanding into the northwestern agro-pastoral zone and the core ecological conservation area, thereby ensuring both the security of coal supply and the development of heavy chemical industries while safeguarding ecological bottom lines.
- (2)
- Implement mining area restoration based on land-use conversion risk. Given that high-intensity mining around mining area peripheries may trigger soil erosion and cropland degradation, priority conversion zones for cropland to forest should be designated around mining areas. Policy design should integrate local livelihoods and ecological compensation mechanisms to advance mine-pit restoration and cropland-to-forest conversion. Converting low-productivity and degraded slope cropland, along with damaged farmland near mining areas, to forest can not only effectively curb soil erosion but also substantially enhance regional ESV.
- (3)
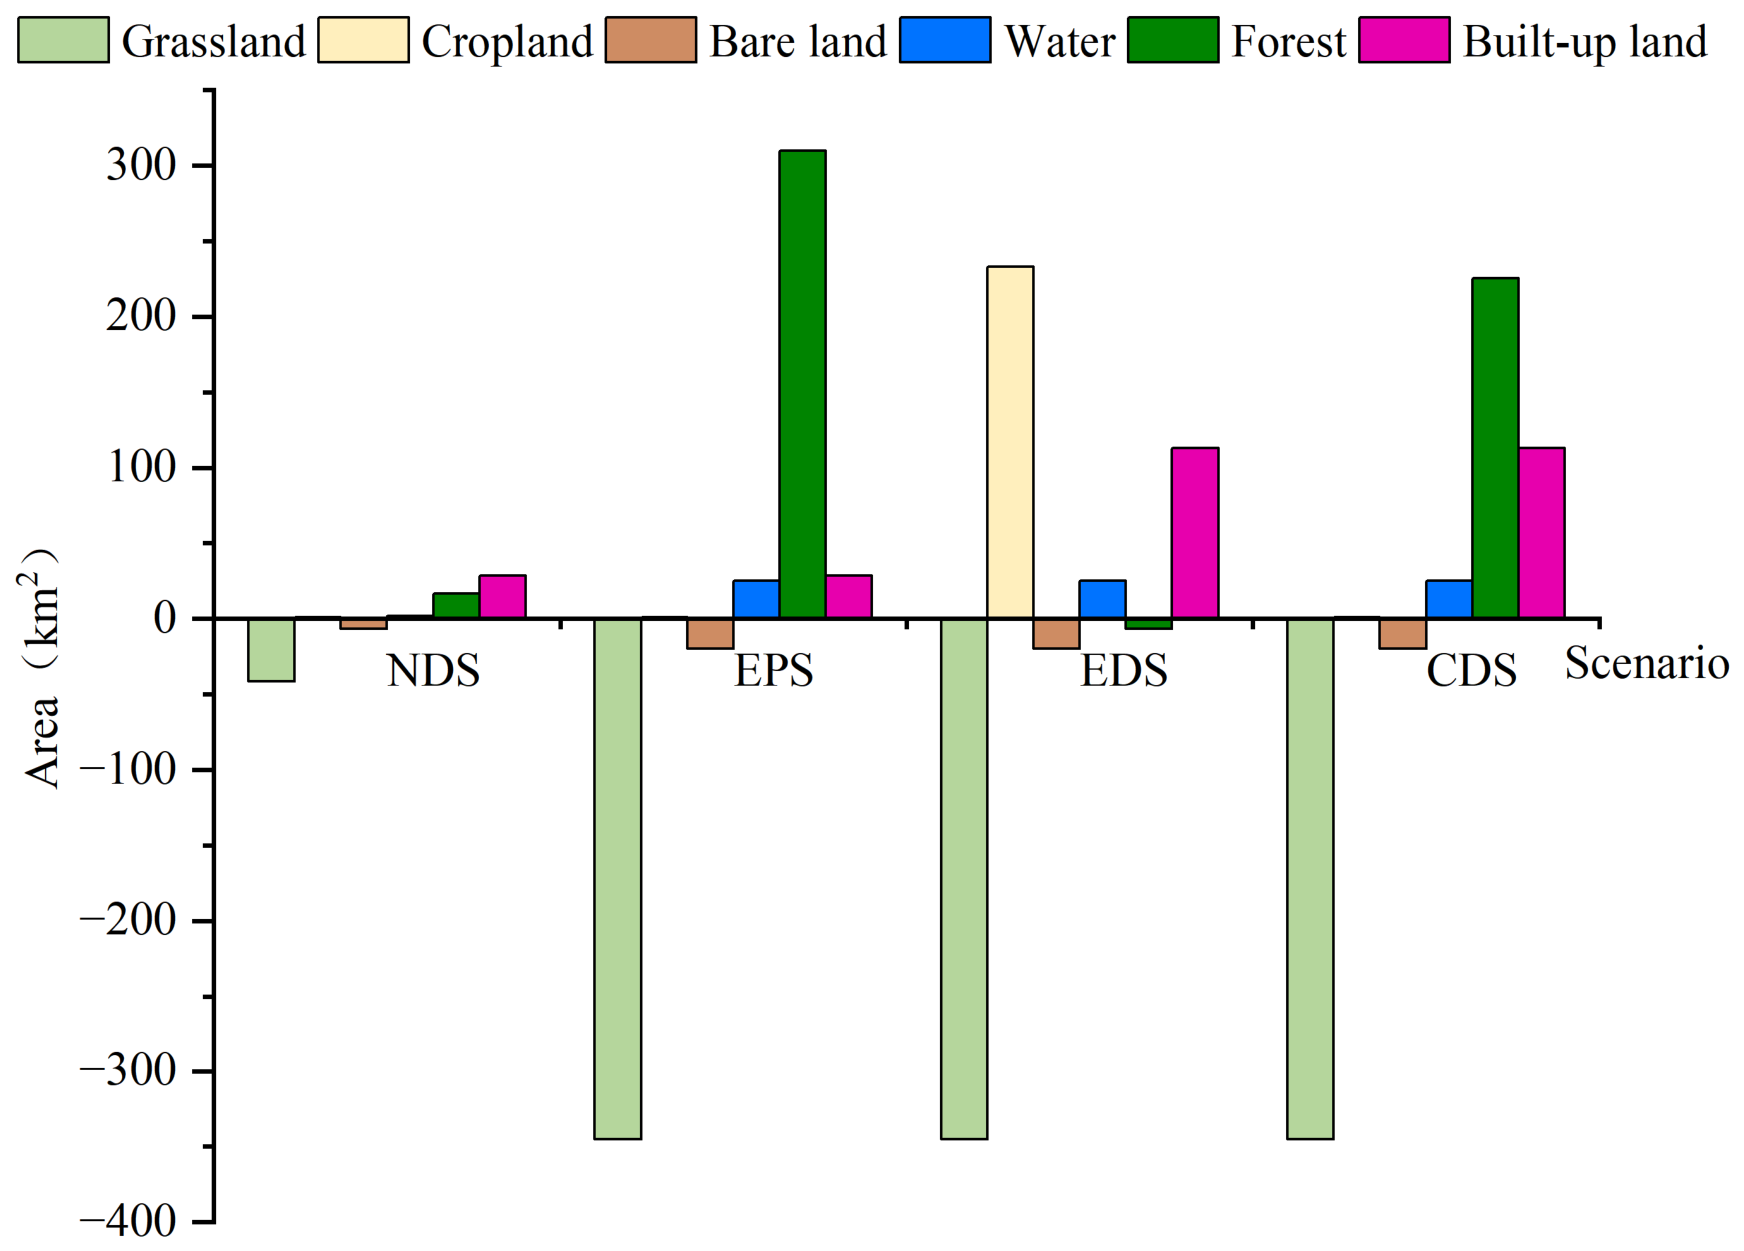
- Establish cross-regional grassland ecological compensation and off-site restoration mechanisms. Under the CDS by 2030, despite achieving the best comprehensive outcomes, grassland still faces a net loss of 345 km2—a pragmatic compromise to accommodate necessary economic development and forest restoration. To ensure that grassland loss does not lead to degradation of overall ecological functions, a spatial compensation mechanism based on “off-site balance” should be established. Policy efforts should focus on the targeted restoration and rehabilitation of degraded grassland in non-mining areas in the northern part of the banner. By enhancing the quality and per-unit ESV of grassland in the north, it is possible to offset the grassland loss caused by mining development in the central–southern and central–eastern parts of the banner, thereby achieving a dynamic balance of total ecological value at the county scale.
5. Conclusions
- (1)
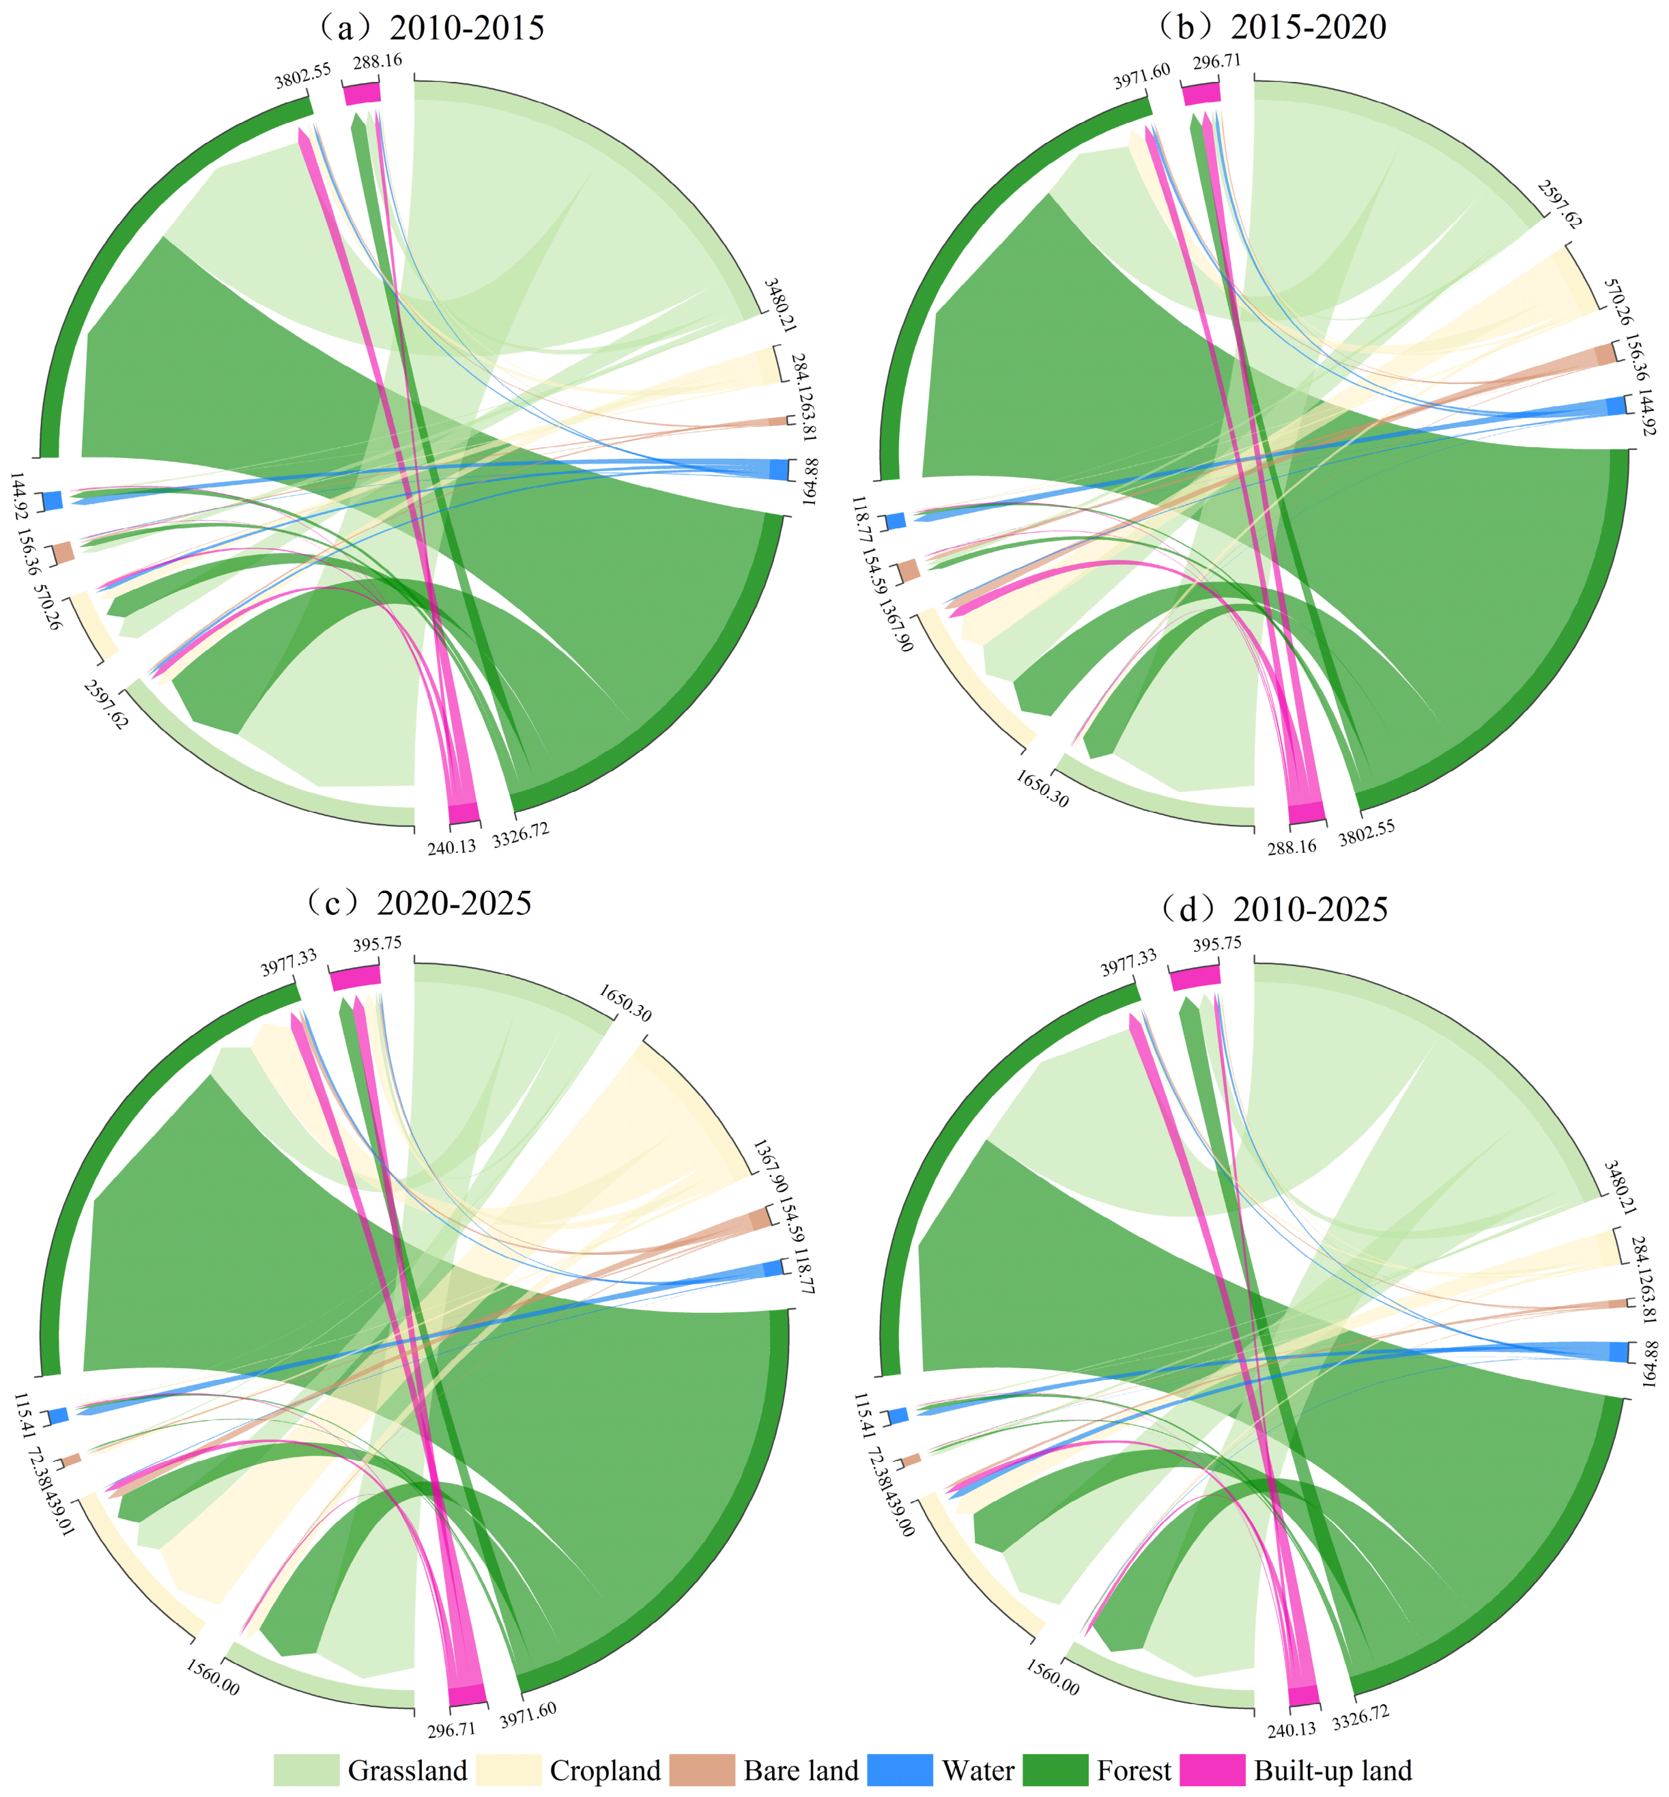
- Land use in Jungar Banner is dominated by grassland and forest, but the pattern has undergone significant changes in recent years. During the study period, cropland and built-up land continued to expand, with built-up land reaching 395.75 km2 by 2025, while grassland decreased markedly and forest exhibited a growing trend.
- (2)
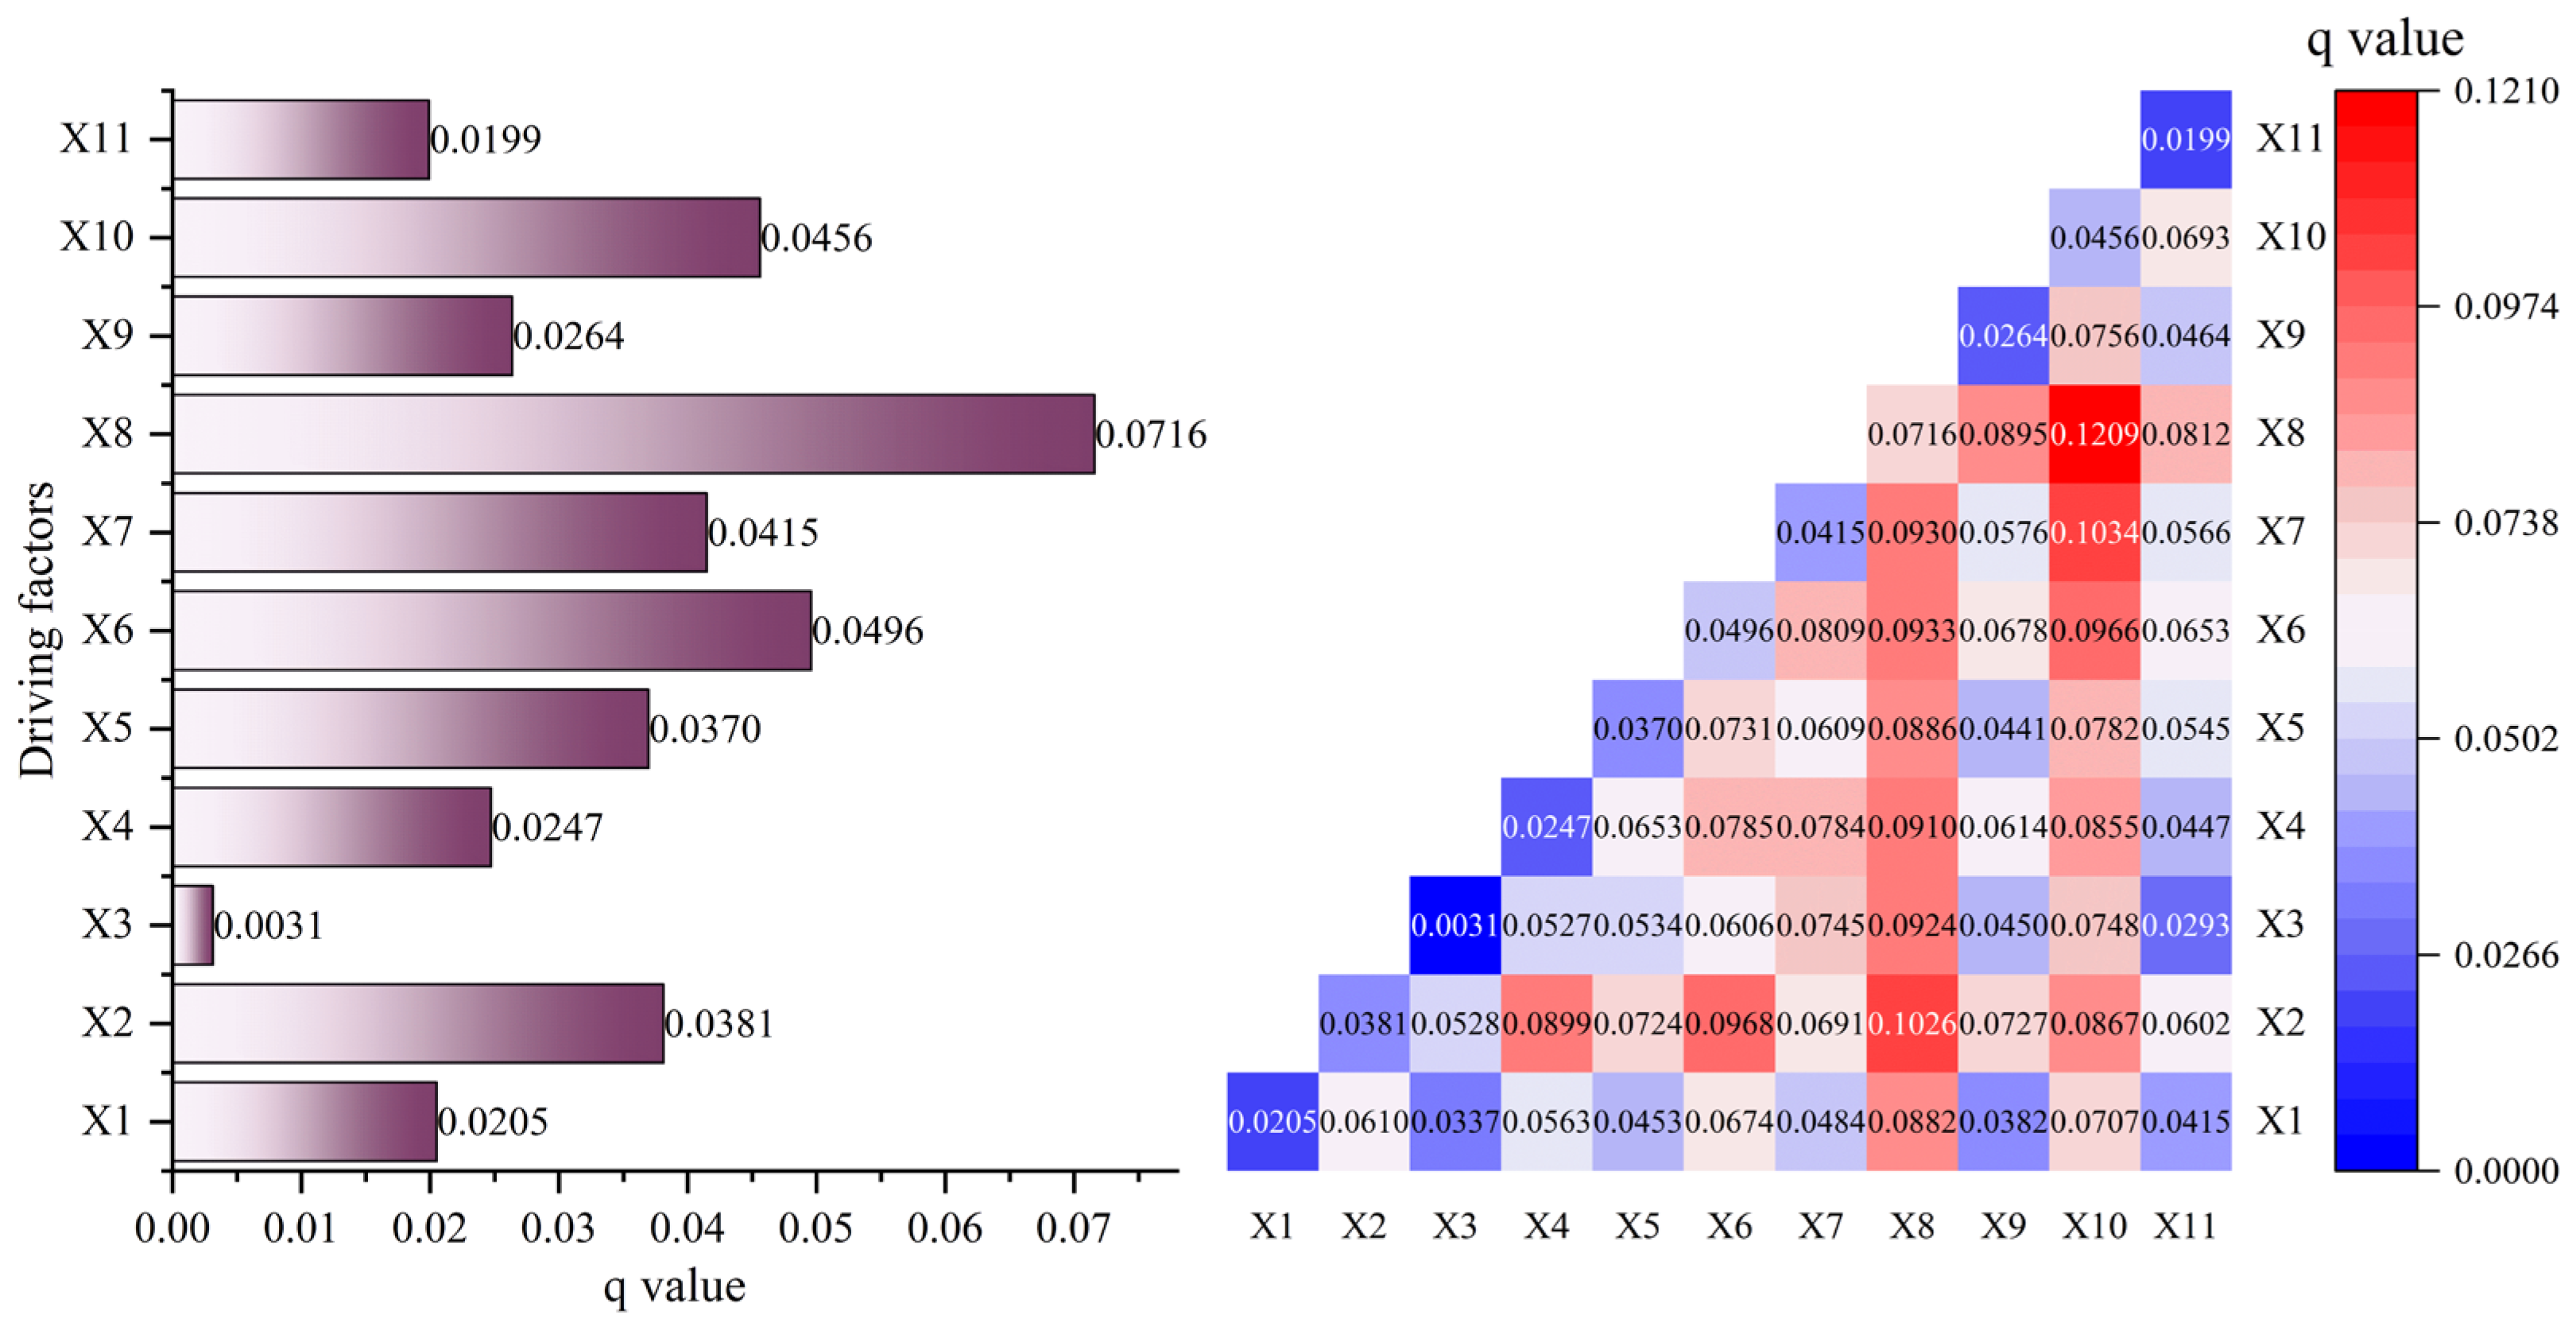
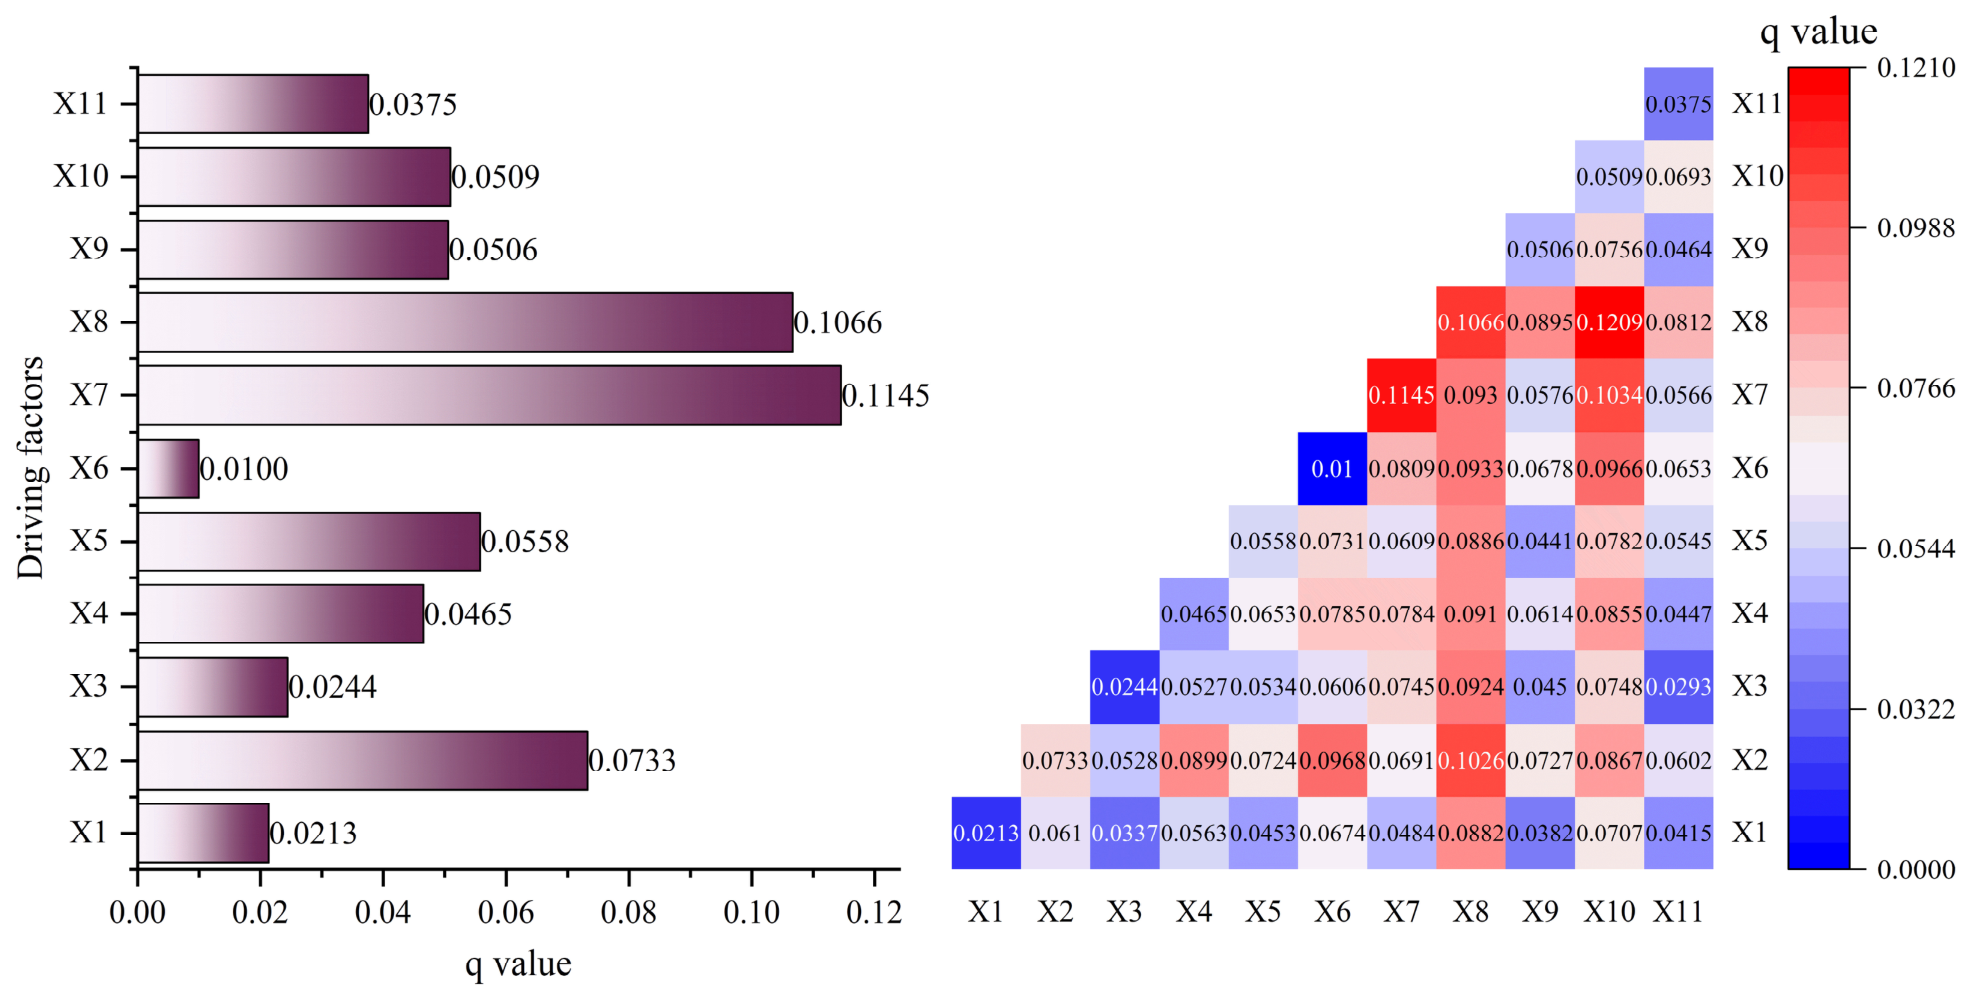
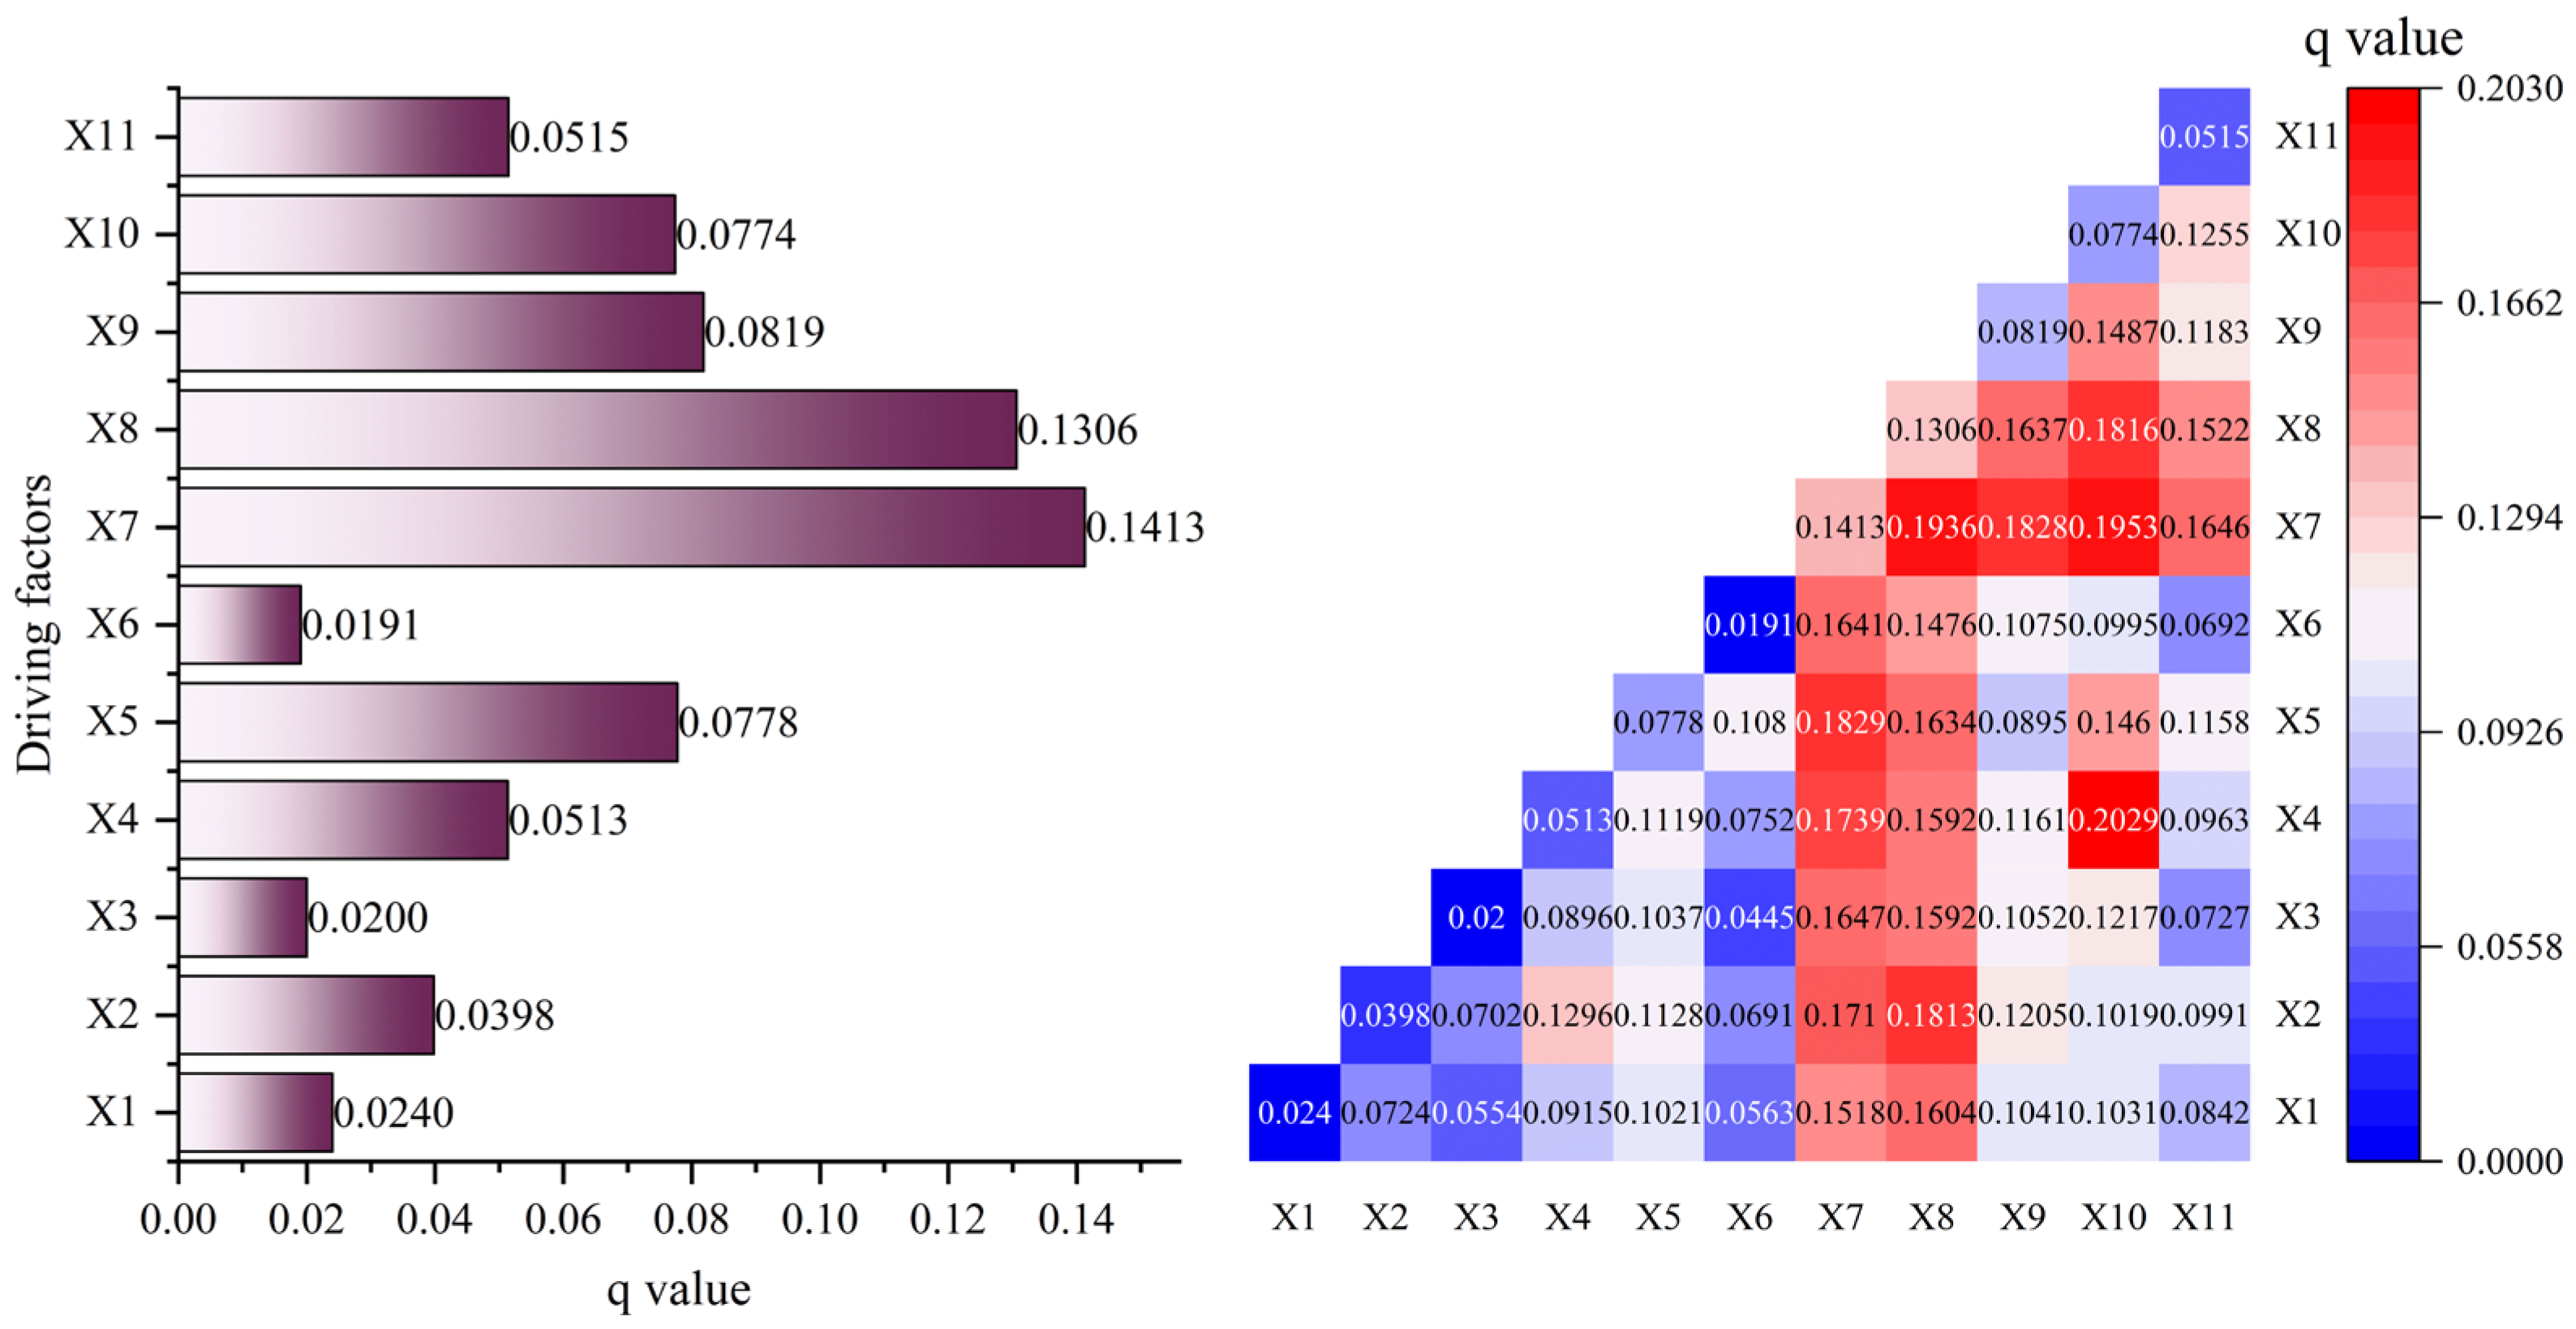
- The driving mechanism of land-use change in Jungar Banner has shifted markedly from “natural constraints” to “anthropogenic influences.” In 2010, natural factors dominated; by 2015, mining impacts had taken the lead; and by 2020, a dual-core driving structure of “mining–precipitation” had taken shape.
- (3)
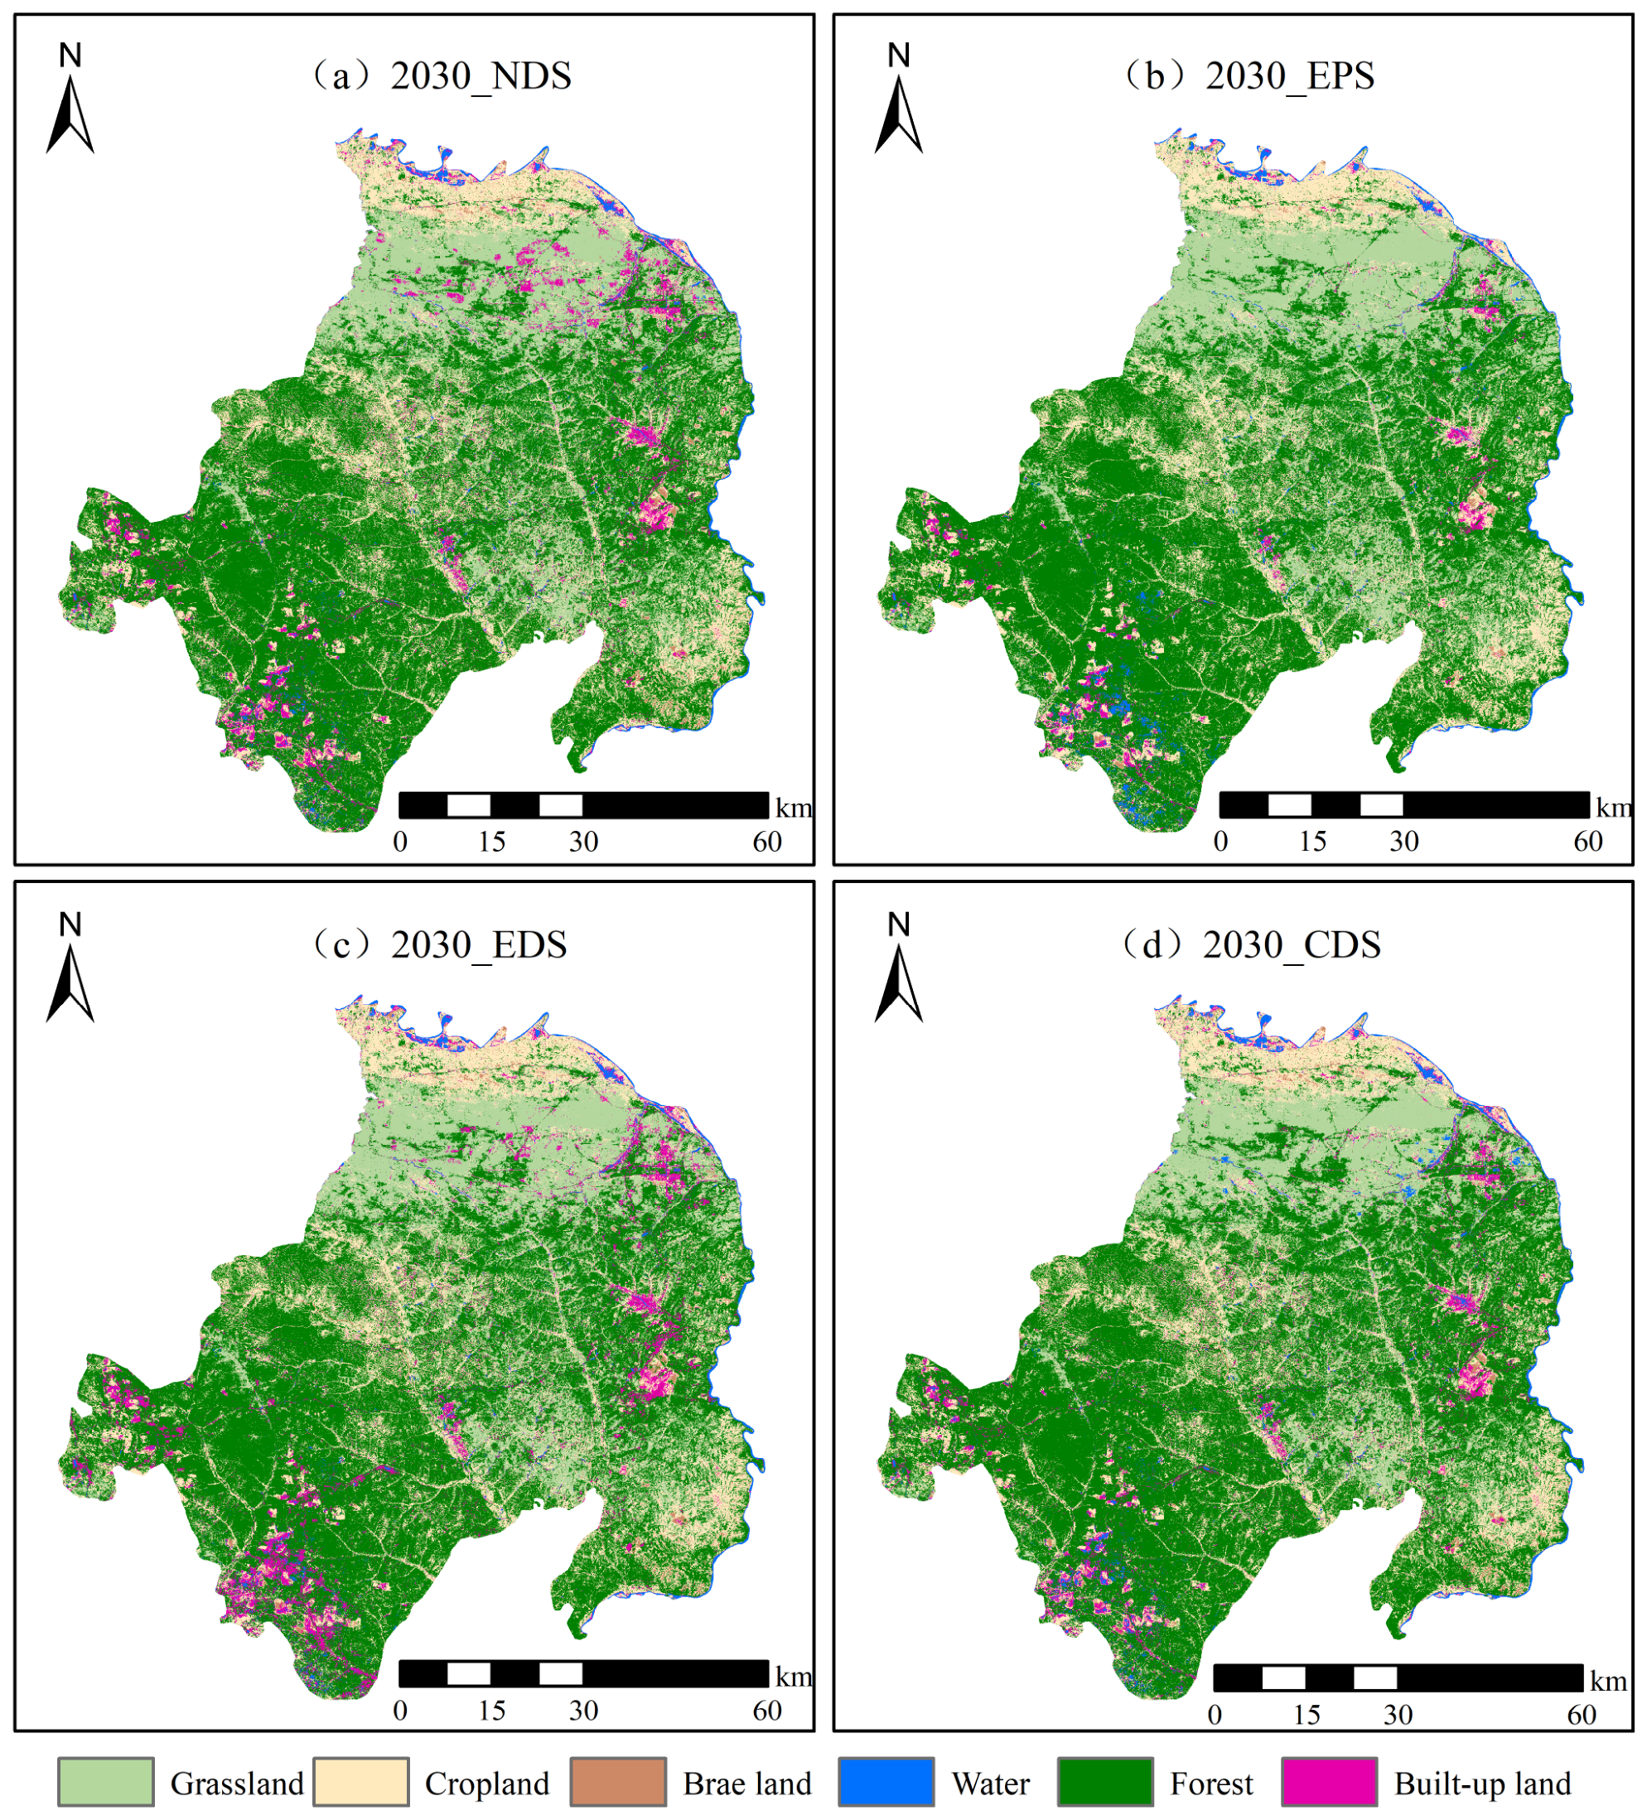
- By 2030, compared with other scenarios, the CDS scenario, which balances both economic and ecological growth, represents the optimal spatial planning orientation. Future efforts should be based on this scenario, with the following regional planning recommendations aligned with government policies:
- Establish a built-up land expansion threshold, taking the net increase of 113.17 km2 under the CDS scenario as the redline for newly added built-up land by 2030. New development projects must be confined to existing built-up areas and the eastern industrial park fringe, with strict prohibition of expansion into the northwestern agro-pastoral zone and ecological core areas.
- Delineate priority conversion zones for cropland and forest. Given that soil erosion around mining areas may lead to cropland degradation, ecological restoration of mine pits and conversion of cropland to forest should be implemented in peripheral mining areas.
- In response to the net loss of 345 km2 of grassland under the CDS scenario by 2030, targeted restoration and rehabilitation of degraded grassland should be promoted in non-mining areas in the northern part of the banner, ensuring that overall ecological functions are not degraded despite grassland reduction.
Author Contributions
Funding
Data Availability Statement
Acknowledgments
Conflicts of Interest
Abbreviations
| NDS | Natural development scenario |
| EPS | Ecological protection scenario |
| EDS | Economic development scenario |
| CDS | Coordinated development of ecological economy scenario |
References
- Gao, F.F.; Zhou, J.S.; Jia, R.; Yang, R.D.; Guo, C.Y.; Ren, M.J.; Liu, M. Unraveling the causal cascade from atmospheric disturbances to ecosystem service degradation in open-pit mining areas. Environ. Res. 2026, 302, 124498. [Google Scholar] [CrossRef] [Scilit]
- Peng, S.P.; Bi, Y.L. Properties of ecological environment damage and their mechanism of restoration in arid and semi-arid coal mining area of western China. J. China Coal Soc. 2024, 49, 57–64. [Google Scholar] [CrossRef]
- Li, J.; Peng, C.Y.; Zhang, C.Y.; Li, Q.S.; Zhang, K.; Liu, J.Q.; Ma, X.S. General statistical rules of vegetation disturbance range by open-pit mining based on a large sample: A case study of Shendong coal base. J. China Coal Soc. 2023, 48, 975–985. [Google Scholar] [CrossRef]
- Mi, J.; Yang, Y.; Hou, H.; Zhang, S.; Ding, Z.; Hua, Y. Impacts of Ground Fissures on Soil Properties in an Underground Mining Area on the Loess Plateau, China. Land 2022, 11, 162. [Google Scholar] [CrossRef] [Scilit]
- Chen, F.; Zhu, Y.F.; Ma, J.; Dong, W.X.; You, Y.N.; Yang, Y.J. Mechanism, potential and regulation of carbon sequestration and sink enhancement in ecological restoration of mining areas in the Loess Plateau. Coal Sci. Technol. 2023, 51, 502–513. [Google Scholar] [CrossRef]
- Li, S.; Wang, H.; Ao, H.; Yuan, X. Ecological Stability Status and Zoning Prediction of the Ordos Plateau: Coupling Analysis of Landscape Ecological Risk and Ecosystem Service Value. Land 2026, 15, 292. [Google Scholar] [CrossRef] [Scilit]
- Wei, Z.Y.; Liu, T.; Liang, H.X.; Zhang, Z.; Wang, C.H.; Lv, Y.D.; Sun, J.Z.; Wang, Q. Uncovering the impacts of LUCC on ecological connectivity in suburban open-pit mining concentration areas: A pattern collection of changing relationships between ecological resistance and ecological network elements. Ecol. Model. 2024, 496, 110815. [Google Scholar] [CrossRef] [Scilit]
- Lei, S.G.; Xia, J.N.; Bian, Z.F.; Cheng, W. Near-natural ecological restoration in open-pit mine area. J. China Coal Soc. 2024, 49, 2021–2030. [Google Scholar] [CrossRef]
- Lei, S.G.; Zhang, J.Y.; Liu, C.; Wang, L.; Jia, Z.W. Collaborative governance model for spoil disposal and gully infill land creation near open-pit coal mines. Coal Sci. Technol. 2025, 53, 374–381. [Google Scholar]
- Wang, S.; Zhuang, Y.; Cao, Y.; Yang, K. Ecosystem Service Assessment and Sensitivity Analysis of a Typical Mine–Agriculture–Urban Compound Area in North Shanxi, China. Land 2022, 11, 1378. [Google Scholar] [CrossRef] [Scilit]
- Mensah, E.; Liu, X.Y.; Zhang, Z.Y.; Campbell, G. A big data ensemble machine learning framework for robust land use/land cover classification with landsat time-series. Remote Sens. Appl. Soc. Environ. 2026, 42, 102095. [Google Scholar] [CrossRef] [Scilit]
- Ma, Z.J.; Li, Y.Y.; Wu, J.; Ouyang, Z.Q.; Wang, M.W.; Qiu, T.X.; Xu, Z.H. Coal fire identification through satellite remote sensing considering the landscapes. Coal Sci. Technol. 2023, 51, 92–103. [Google Scholar] [CrossRef]
- Liu, J.Q.; Li, J.; Wang, X.J.; Zhang, C.Y.; Du, M.H.; Ran, W.Y.; Wang, J.Y.; Hu, J.Y. Design and implementation of quantitative remote sensing monitoring and intelligent analysis system for mine ecological environment. Coal Sci. Technol. 2024, 52, 346–358. [Google Scholar] [CrossRef]
- Bi, Y.L.; Liu, T. Time series analysis of multi-source data of coordinated evolution of vegetation in open-pit mining area: Taking Jungar Mining Area as an example. Coal Sci. Technol. 2022, 50, 293–302. [Google Scholar]
- Lei, S.G.; Chen, H.; Gong, C.G.; Zhang, Z.A.; Wu, Z.H.; Bian, Z.F. Landscape ecology restoration strategies for the coal-electricity base in steppe of China. J. China Coal Soc. 2019, 44, 3662–3669. [Google Scholar] [CrossRef]
- Qu, S.J.; Han, L.; Li, L.Z. A Comprehensive Comparative Analysis of Land Use Change Prediction Models Based on Land Types. Environ. Sci. 2026, 47, 1792–1804. [Google Scholar] [CrossRef] [Scilit]
- Jiao, Y.H.; Wang, Y.H.; Tu, C.H.; Hou, X.N.; Lyu, C.J.; Fan, X.; Xia, L. Spatiotemporal Evolution and Future of Carbon Storage in Resource-Based Chinese Province: A Case Study from Shanxi Using PLUS-InVEST Model Prediction. Sustainability 2024, 16, 4461. [Google Scholar] [CrossRef] [Scilit]
- Xu, L.; Liu, X.; Tong, D.; Liu, Z.; Yin, L.; Zheng, W. Forecasting Urban Land Use Change Based on Cellular Automata and the PLUS Model. Land 2022, 11, 652. [Google Scholar] [CrossRef] [Scilit]
- Zhang, Q.; Han, L.; Li, L.Z. Land Use Change and Biodiversity Change in Shaanxi Province Under Multi-Scenario Simulation. Environ. Sci. 2026, 47, 5468–5481. [Google Scholar] [CrossRef]
- Zhong, A.Y.; Xu, X.L.; Hu, Z.Q.; Zhou, J.H. Research on carbon stock response and regulation in high groundwater table coal-grain complex area under land use change. Coal Sci. Technol. 2026, 571, 148829. [Google Scholar]
- Darius, P.S.H.; Radhakrishnan, G.; Sowjanya, K.K.; Ashok, K. Cellular Automata for Urban Growth Predictions: Review, Simulation, and Prospects. In Sixth Congress on Intelligent Systems, CIS 2025; Lecture Notes in Networks and Systems; Springer: Cham, Switzerland, 2026; Volume 1826, pp. 35–46. [Google Scholar] [CrossRef] [Scilit]
- Zhang, Y.; Liao, X.; Sun, D. A Coupled InVEST-PLUS Model for the Spatiotemporal Evolution of Ecosystem Carbon Storage and Multi-Scenario Prediction Analysis. Land 2024, 13, 509. [Google Scholar] [CrossRef] [Scilit]
- Zhang, Z.R.; Li, X.M.; Liu, X.Y.; Zhao, K.X. Dynamic simulation and projection of land use change using system dynamics model in the Chinese Tianshan mountainous region, central Asia. Ecol. Model. 2023, 487, 110564. [Google Scholar] [CrossRef] [Scilit]
- Lin, Y.; Wang, B.J.; Zhao, L.Y. Land Use Structure Evolution in Resource-Based Cities: Drivers and Multi-Scenario Forecasting-Evidence from China’s Huaihai Economic Zone. Land 2026, 15, 555. [Google Scholar] [CrossRef] [Scilit]
- Wu, J.D.; Xie, H.M.; Wu, Q.J.; Zhang, T.; Xian, Y.Y.; Xie, L.H.; Fan, W.; Shu, Y.; Liu, Z.Z. SBAS-InSAR-Based Spa-tiotemporal Characteristics, Driving Factors, and Land Use Conflict Detection of Land Subsidence: A Case Study of Huainan City. Remote Sens. 2026, 18, 837. [Google Scholar] [CrossRef] [Scilit]
- Ji, J.Z.; Wang, X.W.; Xue, X.L.; Li, H.B.; Li, G.P.; Cao, Q. Spatio-temporal changes and attribution of vegetation and its influencing factors during 2010 to 2022 in Jungar Banner of Inner Mongolia, China. Ecol. Front. 2025, 45, 1107–1121. [Google Scholar] [CrossRef] [Scilit]
- Wang, J.F.; Li, X.H.; Christakos, G.; Liao, Y.L.; Zhang, T.; Gu, X.; Zheng, X.Y. Geographical Detectors-Based Health Risk Assessment and its Application in the Neural Tube Defects Study of the Heshun Region, China. Int. J. Geogr. Inf. Sci. 2010, 24, 107–127. [Google Scholar] [CrossRef] [Scilit]
- Song, Y.Z.; Wang, J.F.; Ge, Y.; Xu, C.D. An optimal parameters-based geographical detector model enhances geographic characteristics of explanatory variables for spatial heterogeneity analysis: Cases with different types of spatial data. GISci. Remote Sens. 2020, 57, 593–610. [Google Scholar] [CrossRef] [Scilit]
- Ma, B.G.; Liu, X.M. Causal forecasting method and its application based on NEGM(1,1) model. Math. Pract. Theory 2010, 40, 91–95. [Google Scholar]
- Li, T.; Mao, Y.; Han, T.; Li, C.K.; Cong, Z. Coupling MOP-RSEI-PLUS Model for Ecological Security Pattern Construction in Resource-Based City. Environ. Sci. Technol. 2026, 49, 235–247. [Google Scholar] [CrossRef]
- Lei, Y.H.; Fu, M.C.; Wang, L.; Huang, N.; Guo, Y.Q.; Luo, M. Evolution of Landscape Pattern and Response of Eco-system Service Value in Mining Area. Environ. Pollut. Control 2020, 42, 1123–1127+1131. [Google Scholar] [CrossRef]
- Pontius, R.G., Jr.; Boersma, W.; Castella, J.-C.; Clarke, K.; de Nijs, T.; Dietzel, C.; Duan, Z.; Fotsing, E.; Goldstein, N.; Kok, K.; et al. Comparing the Input, Output, and Validation Maps for Several Models of Land Change. Ann. Reg. Sci. 2008, 42, 11–37. [Google Scholar] [CrossRef] [Scilit]
- Xie, G.D.; Zhen, L.; Lu, C.X.; Xiao, Y.; Chen, C. Expert Knowledge Based Valuation Method of Ecosystem Services in China. J. Nat. Resour. 2008, 23, 911–919. [Google Scholar]
- Yu, Z.L.; Zhao, M.S.; Gao, Y.F.; Wang, T.; Zhao, Z.D.; Wang, S.H. Spatio-temporal Evolution and Prediction of Carbon Storage in Huaibei City Based on InVEST-PLUS Model. Environ. Sci. 2024, 45, 3270–3283. [Google Scholar] [CrossRef] [Scilit]
- Chen, Y.; Chang, J.; Li, Z.; Ming, L.; Li, C.; Li, C. Coupling Coordination and Spatiotemporal Analysis of Urban Compactness and Land-Use Efficiency in Resource-Based Areas: A Case Study of Shanxi Province, China. Land 2023, 12, 1658. [Google Scholar] [CrossRef] [Scilit]
- Wu, Z.H.; Lu, Q.Q.; Lei, S.G.; Yan, Q.W. Study on Landscape Ecological Classification and Landscape Types Evolution: A Case Study of a Mining City in Semi Arid Steppe. Sustainability 2021, 13, 9541. [Google Scholar] [CrossRef] [Scilit]
- Pericak, A.A.; Thomas, C.J.; Kroodsma, D.A.; Wasson, M.F.; Ross, M.R.V.; Clinton, N.E.; Campagna, D.J.; Frank-lin, Y.; Bernhardt, E.S.; Amos, J.F. Mapping the Yearly Extent of Surface Coal Mining in Central Appalachia Using Landsat and Google Earth Engine. PLoS ONE 2018, 13, e0197758. [Google Scholar] [CrossRef] [Scilit]



| Data Types | Data Name | Data Sources |
|---|---|---|
| Raster Data | Digital Products from Remote Sensing Satellite Imagery | https://earthengine.google.com/ (accessed on 21 March 2026) |
| ASTER GDEM 30 m Resolution Digital Elevation Data | https://www.gscloud.cn/ (accessed on 21 March 2026) | |
| Slope of the Study Area | Based on DEM data | |
| GDP | https://www.resdc.cn/ (accessed on 10 April 2026) | |
| Population Density | https://www.resdc.cn/ (accessed on 10 April 2026) | |
| Annual Average Precipitation in China at 1 km Resolution | https://www.geodata.cn/ (accessed on 12 April 2026) | |
| Annual Average Temperature in China at 1 km Resolution | https://www.geodata.cn/ (accessed on 12 April 2026) | |
| Nighttime Lighting Data | https://www.resdc.cn/ (accessed on 10 April 2026) | |
| NDVI | https://www.resdc.cn/ (accessed on 10 April 2026) | |
| Vector Data | Administrative Divisions of the Banners and Districts of Ordos City | https://www.tianditu.gov.cn/ (accessed on 12 October 2025) |
| Global Coal Mine Regional Data | https://zenodo.org/records/17085099 (accessed on 14 April 2026) | |
| Boundaries of Coal Mines in the Jungar Mining Area | Source (Environmental Impact Assessment for the Jungar Mining Area) | |
| Water Area Data for Jungar Banner | https://www.openstreetmap.org/ (accessed on 10 April 2026) | |
| Traffic and Road Data | https://www.openstreetmap.org/ (accessed on 10 April 2026) | |
| Text Data | Ordos City Statistical Yearbook | Ordos Bureau of Statistics |
| Statistical Bulletin on National Economic and Social Development in Jungar Banner | Official Website of the Jungar People’s Government | |
| Geographic Data for Jungar Banner and the Current Status of Selected Coal Mines | Source (Environmental Impact Assessment for the Jungar Mining Area) |
| Criterion | Interaction Type |
|---|---|
| Nonlinear weakening | |
| Univariate nonlinear weakening | |
| Bivariate enhancement | |
| Nonlinear enhancement | |
| X1 and X2 are independent |
| Land-Use Type | 2010 | 2015 | 2020 | 2025 | ||||
|---|---|---|---|---|---|---|---|---|
| PA (%) | UA (%) | PA (%) | UA (%) | PA (%) | UA (%) | PA (%) | UA (%) | |
| Grassland | 96.05 | 92.86 | 97.97 | 98.39 | 96.66 | 99.35 | 90.01 | 99.32 |
| Cropland | 59.75 | 91.26 | 75.11 | 86.72 | 84.45 | 72.85 | 85.84 | 65.84 |
| Bare land | 49.2 | 61.94 | 93.01 | 96.44 | 79.62 | 80.68 | 66.56 | 85.84 |
| Water | 72.99 | 93.56 | 98.19 | 99.74 | 85.81 | 99.85 | 52.45 | 91.66 |
| Forest | 90.1 | 86.46 | 97.04 | 89.12 | 92.09 | 83.75 | 97.48 | 86.85 |
| Built-up land | 50.89 | 79.73 | 77.08 | 70.92 | 86.82 | 94.53 | 94.54 | 92.99 |
| OA (%) | 90.36 | 95.47 | 93.73 | 89.01 | ||||
| Kappa | 0.8101 | 0.9069 | 0.8786 | 0.8184 | ||||
| Land-Use Types | 2010 | 2015 | 2020 | 2025 |
|---|---|---|---|---|
| Grassland | 3280.21 | 2597.62 | 1650.31 | 1560 |
| Cropland | 284.12 | 570.27 | 1367.9 | 1439.01 |
| Bare land | 63.81 | 156.36 | 154.59 | 72.38 |
| Water | 164.88 | 144.92 | 118.77 | 115.41 |
| Forest | 3326.73 | 3802.55 | 3971.6 | 3977.33 |
| Built-up land | 240.13 | 288.16 | 296.71 | 395.75 |
| Total | 7559.88 | 7559.88 | 7559.88 | 7559.88 |
| Land-Use Type | 2010–2015 | 2015–2020 | 2020–2025 | 2010–2025 |
|---|---|---|---|---|
| Grassland | −5.07% | −7.29% | −1.09% | −3.68% |
| Cropland | 20.14% | 27.97% | 1.04% | 27.10% |
| Bare land | 29.01% | −0.23% | −10.64% | 0.90% |
| Water | −2.42% | −3.61% | −0.57% | −2.00% |
| Forest | 2.86% | 0.89% | 0.03% | 1.30% |
| Built-up land | 4.00% | 0.59% | 6.68% | 4.32% |
| Year | 2010–2015 | 2015–2020 | 2020–2025 | 2010–2025 |
|---|---|---|---|---|
| Comprehensive Dynamic degree | 4.73% | 3.83% | 3.68% | 1.80% |
| Year | NP (Number) | PD (Number/hm2) | LPI (%) | CONTAG (%) | SPLIT | SHDI | SHEI | AI (%) |
|---|---|---|---|---|---|---|---|---|
| 2010 | 56,359 | 0.4300 | 38.793 | 48.7694 | 5.7063 | 1.0634 | 0.5935 | 71.7845 |
| 2015 | 74,372 | 0.5675 | 30.3696 | 43.6086 | 7.6586 | 1.1638 | 0.6495 | 69.4231 |
| 2020 | 71,227 | 0.5435 | 48.272 | 42.9049 | 4.2763 | 1.2124 | 0.6766 | 72.2263 |
| 2025 | 79,532 | 0.6068 | 58.4545 | 45.4213 | 2.9208 | 1.1527 | 0.6433 | 73.0769 |
| Variables | VIF |
|---|---|
| X1 | 1.513003 |
| X2 | 2.136592 |
| X3 | 1.294514 |
| X4 | 4.028806 |
| X5 | 6.583929 |
| X6 | 1.217958 |
| X7 | 2.934925 |
| X8 | 3.209842 |
| X9 | 6.934200 |
| X10 | 4.342076 |
| X11 | 1.130185 |
| Scenario | Grassland | Cropland | Bare Land | Water | Forest | Built-Up Land |
|---|---|---|---|---|---|---|
| NDS | 1518.75 | 1440.04 | 65.55 | 117.28 | 3994.16 | 424.10 |
| Land-Use Type | Grassland | Cropland | Bare Land | Water | Forest | Built-Up Land |
|---|---|---|---|---|---|---|
| Ecological Value Coefficient | 69.00 | 54.57 | 2.72 | 1709.39 | 207.12 | 0.00 |
| Economic Value Coefficient | 128.10 | 206.48 | 0.00 | 68.39 | 10.68 | 51,225.38 |
| Scenario | Grassland | Cropland | Bare Land | Water | Forest | Built-Up Land |
|---|---|---|---|---|---|---|
| EPS | 1215.00 | 1440.04 | 52.44 | 140.74 | 4287.28 | 424.38 |
| EDS | 1215.00 | 1672.08 | 52.44 | 140.74 | 3970.70 | 508.92 |
| CDS | 1215.00 | 1440.04 | 52.44 | 140.74 | 4202.74 | 508.92 |
| Scenario | Grassland | Cropland | Bare Land | Water | Forest | Built-Up Land |
|---|---|---|---|---|---|---|
| NDS | −41.25 | 1.03 | −6.83 | 1.87 | 16.83 | 28.35 |
| EPS | −345 | 1.03 | −19.94 | 25.33 | 309.95 | 28.63 |
| EDS | −345 | 233.07 | −19.94 | 25.33 | −6.63 | 113.17 |
| CDS | −345 | 1.03 | −19.94 | 25.33 | 225.41 | 113.17 |
Disclaimer/Publisher’s Note: The statements, opinions and data contained in all publications are solely those of the individual author(s) and contributor(s) and not of MDPI and/or the editor(s). MDPI and/or the editor(s) disclaim responsibility for any injury to people or property resulting from any ideas, methods, instructions or products referred to in the content. |
© 2026 by the authors. Licensee MDPI, Basel, Switzerland. This article is an open access article distributed under the terms and conditions of the Creative Commons Attribution (CC BY) license.
Share and Cite
Liu, S.; Chen, L. Analysis of Drivers of Urban Land-Use Types in Mining Areas Based on Remote Sensing Imagery and Projections of Future Scenarios: A Case Study of Jungar Banner. Land 2026, 15, 1563. https://doi.org/10.3390/land15091563
Liu S, Chen L. Analysis of Drivers of Urban Land-Use Types in Mining Areas Based on Remote Sensing Imagery and Projections of Future Scenarios: A Case Study of Jungar Banner. Land. 2026; 15(9):1563. https://doi.org/10.3390/land15091563
Chicago/Turabian StyleLiu, Shuo, and Lei Chen. 2026. "Analysis of Drivers of Urban Land-Use Types in Mining Areas Based on Remote Sensing Imagery and Projections of Future Scenarios: A Case Study of Jungar Banner" Land 15, no. 9: 1563. https://doi.org/10.3390/land15091563
APA StyleLiu, S., & Chen, L. (2026). Analysis of Drivers of Urban Land-Use Types in Mining Areas Based on Remote Sensing Imagery and Projections of Future Scenarios: A Case Study of Jungar Banner. Land, 15(9), 1563. https://doi.org/10.3390/land15091563