Article

Analysis of Drivers of Urban Land-Use Types in Mining Areas Based on Remote Sensing Imagery and Projections of Future Scenarios: A Case Study of Jungar Banner
School of Energy and Mining Engineering, China University of Mining & Technology, Beijing 100083, China
*
Author to whom correspondence should be addressed.
Land 2026, 15(9), 1563; https://doi.org/10.3390/land15091563
Submission received: 19 July 2026 / Revised: 12 August 2026 / Accepted: 21 August 2026 / Published: 26 August 2026
(This article belongs to the Section Land Use, Impact Assessment and Sustainability)

Abstract

The evolution of land-use types in mining cities is critical for balancing resource exploitation and ecological sustainability. Taking Jungar Banner as a case study, this study uses remote sensing imagery and auxiliary data (2010–2025) to examine spatiotemporal land-use changes, applies the OPGD model to detect driving factors, and integrates a Markov chain with an optimized NEGM-MOP-PLUS model to project 2030 land-use patterns under multiple scenarios. Results show that grassland shrank markedly, while cropland and built-up land expanded—the latter reaching 395.75 km2 by 2025. After 2020, core mining areas became more contiguous, while peripheral zones showed increased fragmentation, with built-up land expansion becoming the dominant trend. Driving forces shifted from natural constraints to anthropogenic dominance: natural factors prevailed in 2010, mining impacts took the lead by 2015, and a mining–precipitation dual-core structure emerged by 2020. Future projections indicate continued grassland and bare land reduction, alongside water and built-up land expansion across all scenarios. Among them, the CDS, which balances economic and ecological objectives, is identified as the optimal spatial planning direction based on ecosystem service value (ESV) assessment. These findings offer practical guidance for managing land-use transitions in arid and semi-arid resource-based mining regions.

1. Introduction

Open-pit mining is considered one of the most destructive forms of mining for surface ecosystems [1]; this activity can lead to land degradation [2], soil erosion, destruction of vegetation, and loss of regional biodiversity [3]. The Loess Plateau is a critical ecological barrier in China and is also one of the regions with the most severe soil erosion and the most fragile ecological environment in the world [4,5]. Ordos City in the Inner Mongolia Autonomous Region is a “Nationally Important Energy and Chemical Industry Base”, possessing one-sixth of the country’s coal reserves. It features a typical Loess Plateau landscape and is classified as an ecologically fragile area [6]. The landforms within the Jungar Mining Area are particularly distinctive; with coal seams buried beneath loess layers, it is a typical area suitable for large-scale open-pit mining. However, large-scale mining activities have led to soil erosion and ecological degradation in the region, posing a serious threat to the balanced development of economic growth and ecological conservation. Therefore, research on the ecological security of mining cities and the planning of future land-use types are of great importance [7].
The Jungar Mining Area in Ordos City is one of China’s four largest open-pit coal mines and a typical energy-rich region on the Loess Plateau. Large-scale mining has severely altered the local topography, vegetation, and land use, making ecological restoration in these mining cities an urgent priority [8,9,10]. In response, this study takes Jungar Banner as a case, using remote sensing imagery to examine the spatiotemporal evolution of land-use types, identify the driving factors behind land-use changes, and project future land-use patterns under different scenarios—all aimed at balancing resource development with ecological sustainability in mining cities.
Scholars both domestically and internationally have conducted extensive research on the spatiotemporal evolution of land-use types in mining areas and associated ecological security concerns. Existing studies have contributed substantial findings on land-use dynamics in mining regions, where remote sensing technology has been extensively applied in environmental monitoring and change in land-use type [11]. By leveraging time-series data from sources such as Landsat, combined with machine learning algorithms like SVM, researchers have achieved accurate identification and dynamic projection of land cover anomalies in mining areas [12]. As ecological monitoring in mining regions transitions toward intelligent and quantitative approaches, several studies have developed multi-source remote sensing monitoring systems capable of capturing multiple environmental elements—including vegetation, soil, water, and air—at a fine scale. Such advances provide a robust data foundation for deepening the analysis of driving mechanisms behind land-use evolution and for conducting future scenario simulations in mining areas [13]. Bi Yinli et al. [14] used long-term Landsat and MODIS remote sensing data to confirm that land reclamation at the spoil dump of the Jungar open-pit coal mine not only enhanced vegetation cover within the site but also contributed to overall ecological improvement in adjacent undisturbed areas through synergistic effects. Lei Shaogang et al. [15] proposed landscape ecological restoration strategies for grassland coal–electricity bases, based on multi-source remote sensing detection and numerical simulation. Land-use type analysis plays a critical role in research on ecological security in mining areas. Drawing on historical and current land-use data, various projection methods—including the CA-Markov model, the PLUS model [16,17,18], and the FLUS-Biodiversity model [19]—have been employed to forecast the area and spatial configuration of land-use types in the coming years. Zhong Anya et al. [20] developed a coupled GMOP-PLUS-MSPS-InVEST framework to examine carbon stock dynamics under different scenarios in high-groundwater-table mining areas subject to land-use change. Darius et al. [21] employed a PLUS model integrated with rule mining and parameter optimization to simulate and project land-use changes and ecosystem service values (ESV), emphasizing that incorporating heterogeneous mining-area data and driving factors can improve prediction accuracy of spatial evolution under mining disturbances. Collectively, these studies demonstrate that both the PLUS model and its coupled variants can reliably project land-use patterns across diverse scenarios [22,23]. Factors influencing land-use change are referred to as driving factors, and the appropriate selection of such factors critically enhances the accuracy of land-use type analyses. Lin Yan et al. [24] found that the driving mechanisms of land-use evolution in resource-based cities are distinctive. Beyond the conventional natural and economic factors, mining activities impose unique spatial constraints, resulting in significantly slower expansion of land use in core mining areas. In essence, this reflects the synergy and trade-offs among the multidimensional spaces of “mining–urban–rural–ecology.” Wu Jiadong et al. [25] employed SBAS-InSAR and GeoDetector techniques to reveal that mining activities, soil type, and precipitation are the core driving factors of ground subsidence in mining areas, with significant synergistic enhancement among multiple factors, providing a scientific basis for assessing subsidence risk and land-use conflicts.
Against the above research background, this study focuses on Jungar Banner as the study area. Multitemporal remote sensing imagery is interpreted to derive land-use type data, which, together with driving-factor analysis and an optimized multi-objective model, supports multi-scenario projections. The study aims to reveal the spatiotemporal evolution patterns of land-use types in the Jungar Mining Area, and to quantitatively characterize the areal changes and spatial conversion features of various land-use types across different periods. It further investigates the driving mechanisms underlying land-use evolution, drawing on socio-economic and ecological data from the mining area to differentiate the influences of natural factors and human activities and to assess their combined effects. By integrating a Markov chain with the optimized NEGM-MOP-PLUS coupled model, and building upon historical change trajectories and identified driving factors, the study establishes four scenarios—natural development, ecological conservation, economic priority, and balanced development—to simulate and project land-use patterns for Jungar Banner by 2030. Finally, the ecological implications of the projection results are discussed. Based on the simulation outcomes, potential ecological effects and risks associated with future land-use changes are examined, and corresponding spatial regulation measures and scenario-oriented development strategies are proposed.

2. Materials and Methods

2.1. Study Area

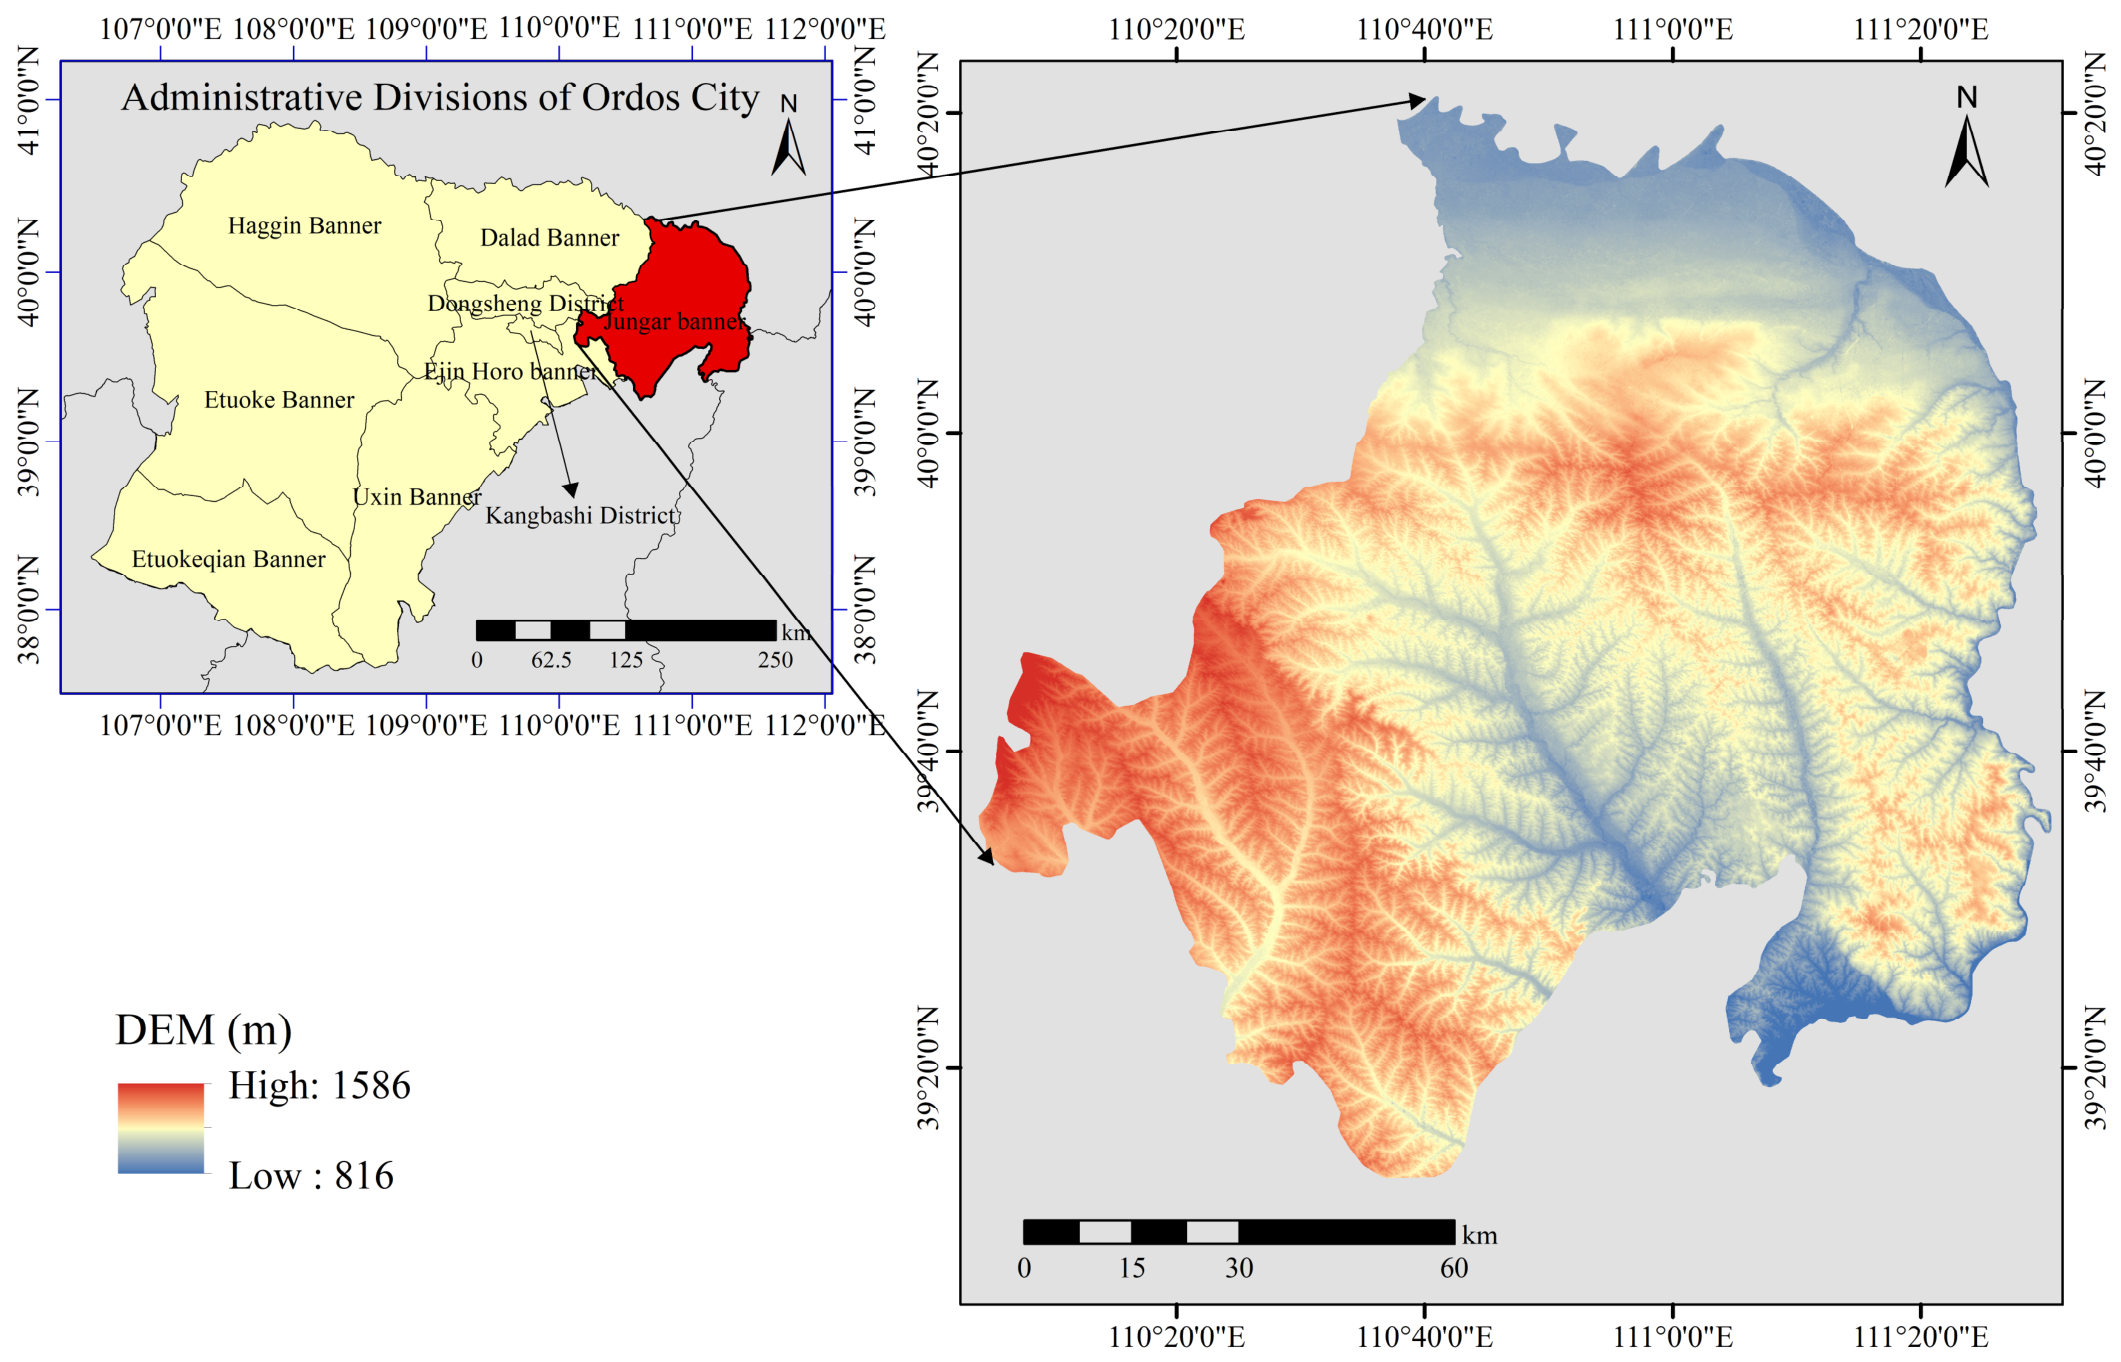
Jungar Banner is located in the eastern part of Ordos City, the Inner Mongolia Autonomous Region, on the southeastern edge of the Kubuqi Desert. Covering a total area of 7551 km2, the banner occupies a unique geographical position of considerable ecological and strategic significance. Situated at the junction of multiple provinces and regions, the area exhibits pronounced transitional geographical features, serving as a typical representative of the interlaced zone between the Loess Plateau and the desert, the agro-pastoral ecotone, and an energy-rich region. As one of China’s key coal production bases, the ecological environment of Jungar Banner exerts a significant influence on the eco-environment of the middle reaches of the Yellow River [26]. Its specific geographical location is illustrated in Figure 1 (all data in this study were referenced to the same projected coordinate system, WGS_1984_UTM_Zone_49N; the spatial resolution of all raster data is 30 m × 30 m).

2.2. Data Sources

The data used in this study primarily consist of spatial and statistical data, including raster, vector, and text data. The main datasets and their sources are shown in Table 1. The remote sensing data were derived from Landsat satellite imagery via the Google Earth Engine platform. To minimize the interference of cloud cover on surface information extraction, Landsat TM/OLI images from 2010, 2015, 2020, and 2025—which had relatively low cloud cover—were selected as the remote sensing data sources, providing a reliable data foundation for the subsequent time-series analysis in this study.
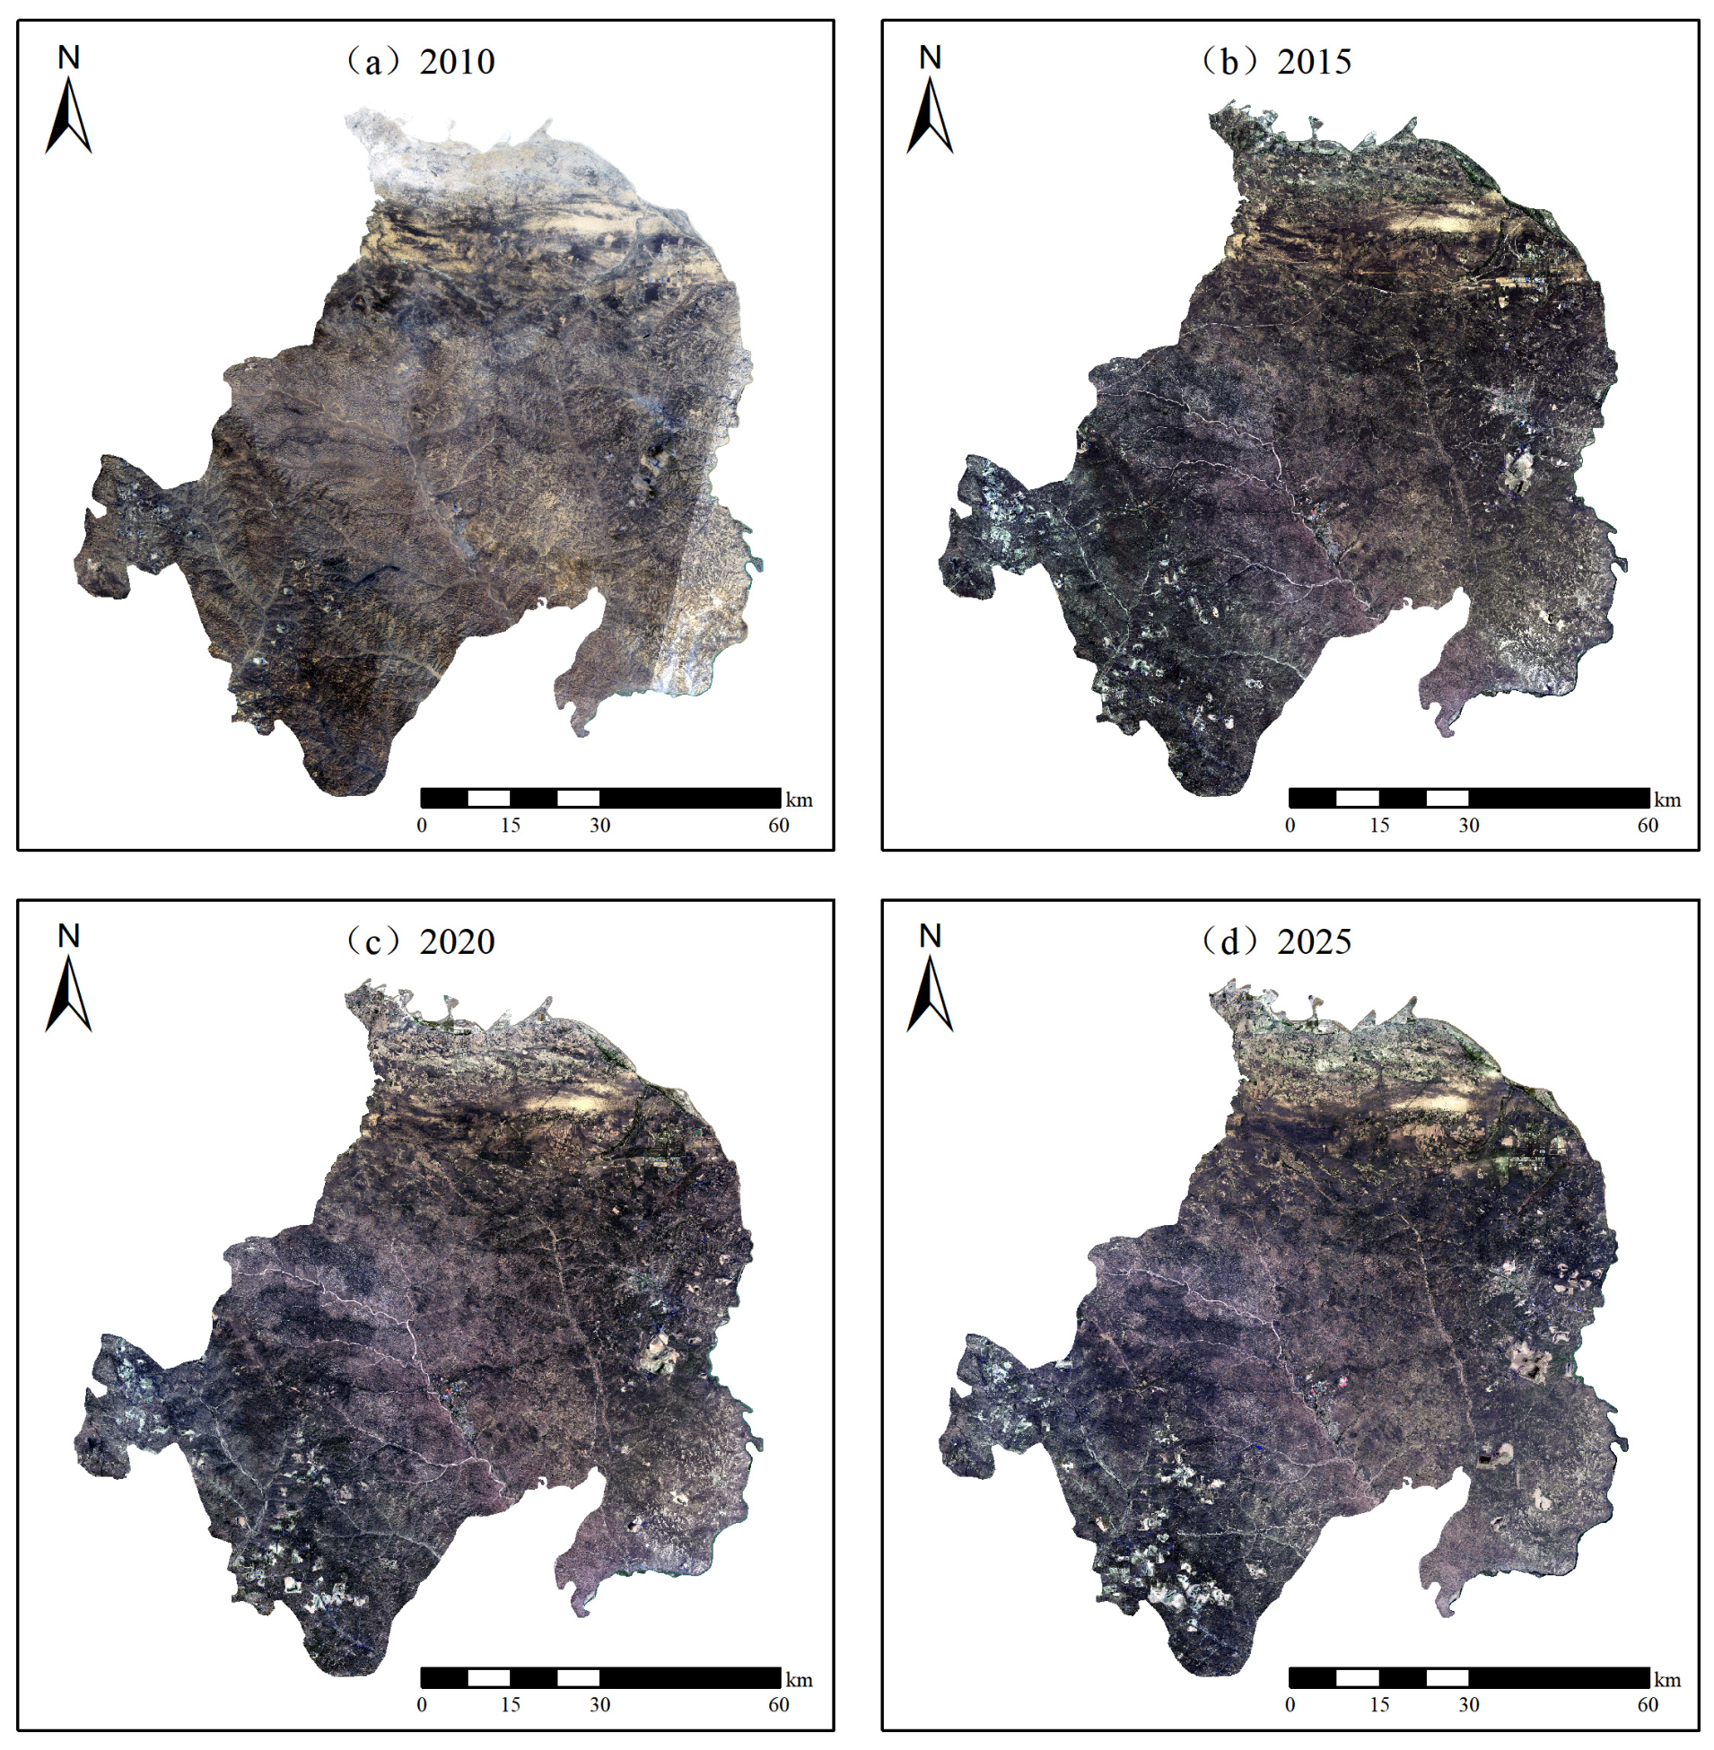
This study used ENVI 5.3 (Environment for Visualizing Images) software to analyze satellite imagery of the Jungar Banner for the years 2010, 2015, 2020, and 2025. First, the acquired imagery was radiometrically calibrated, followed by atmospheric correction using the FLAASH atmospheric correction tool. The imagery was then fused and mosaicked, and, finally, the images were cropped using the study area’s vector boundaries to obtain the remote sensing image data for the Jungar Banner, as shown in Figure 2 (due to errors in image acquisition and data processing); the final area of the banner’s imagery is 7559.88 km2, which shows a slight deviation from the published figure of 7551 km2 (this minor difference of 8.88 km2 (0.12%) stems mainly from boundary pixel processing during coordinate transformation and image cropping, and it has no material effect on the overall spatial patterns, quantitative analysis, or key conclusions of this study). Due to the spatial resolution limitations of the remote sensing imagery used in this study, the identification of land-use changes at small-scale mining sites is subject to certain constraints. With a minimum mapping unit of 8.1 km2 (3 × 3 pixels), features smaller than this threshold (e.g., small mine pits, spoil corridors, rural roads) may be missed or merged into larger patches during resampling and smoothing.

2.3. Analysis of Land-Use Type Conversion Rates

Land-use dynamics refer to the extent of changes in land-use types within a study area over a specific time period. This concept includes both single-land-use dynamics and comprehensive land-use dynamics, and is used to measure the rate of change in land-use types over a given time interval.
The single-land-use dynamics index (K) reflects the rate of change in a particular land-use type within the study area over a specific time period and can indicate changes in the land-use structure of that type. It is calculated using the following formula:
K = U b U a U a × 1 T × 100 %
In the equation: Ua represents the area of a particular land-use type at the beginning of the study period; Ub represents the area of that land-use type at the end of the study period; and T denotes the length of the study period. If K > 0, it indicates that the land-use type is expanding; if K < 0, it indicates that the land-use type is contracting; the larger the value of |K|, the more dramatic the conversion of that land-use type.
The comprehensive land-use dynamics index (LC) reflects the rate of change for all land-use types across the entire study area and provides an overall assessment of the intensity of land-use change in the region. It is calculated using the following formula:
L C = [ ( i = 1 n Δ U i j ) / ( 2 i = 1 n U i ) ] × 1 T × 100 %
In the formula: n represents the number of land-use categories; Uij represents the area converted from land-use category i to category j; Ui represents the area of a given land-use category at the beginning of the study period; and T represents the study period.

2.4. Analysis of Spatial Scale Effects of Driving Factors

The Optimal Parameters-based Geographical Detector (OPGD) model was used to investigate the relative influence of driving factors on land-use type evolution in Jungar Banner. Wang Jinfeng [27] proposed the predecessor to the OPGD model—the Geographical Detector (GD) model—in 2010; this model can be used to explain and analyze the driving factors behind spatial heterogeneity. Compared with the traditional GD model, the OPGD model can determine the spatial discretization scheme best suited for this study in terms of spatial scale and discretization algorithms (such as natural breaks, quantiles, and equal intervals) [28]. In this study, the Factor Detector was selected to identify the impact of individual factors on the spatial pattern of land use, and the Interaction Detector was used to assess the combined effects of multiple factors on land-use types.
Single-factor exploration reveals the explanatory power of a given factor X on the dependent variable Y. The extent to which factor X influences the spatial variation in the dependent variable Y is represented by the q-value. The larger the q-value, the stronger the explanatory power of factor X on the dependent variable Y. The formula for calculating the q-value is:
q = 1 h = 1 L N h σ h 2 N σ 2
In the formula: h represents the stratification of the variable Y or factor X, where h = 1, …; σh2 and σ2 are the variances of the Y values in stratum h and the entire population, respectively; and Nh and N are the number of units in stratum h and the entire population, respectively.
Interaction analysis primarily reveals the interactions among different factors X. It is used to assess whether the explanatory power of the dependent variable Y is enhanced or weakened under the combined effect of factors X1 and X2. By comparing the value of q (X1∩X2) with those of q (X1) and q (X2), the different patterns of interaction are shown in Table 2.
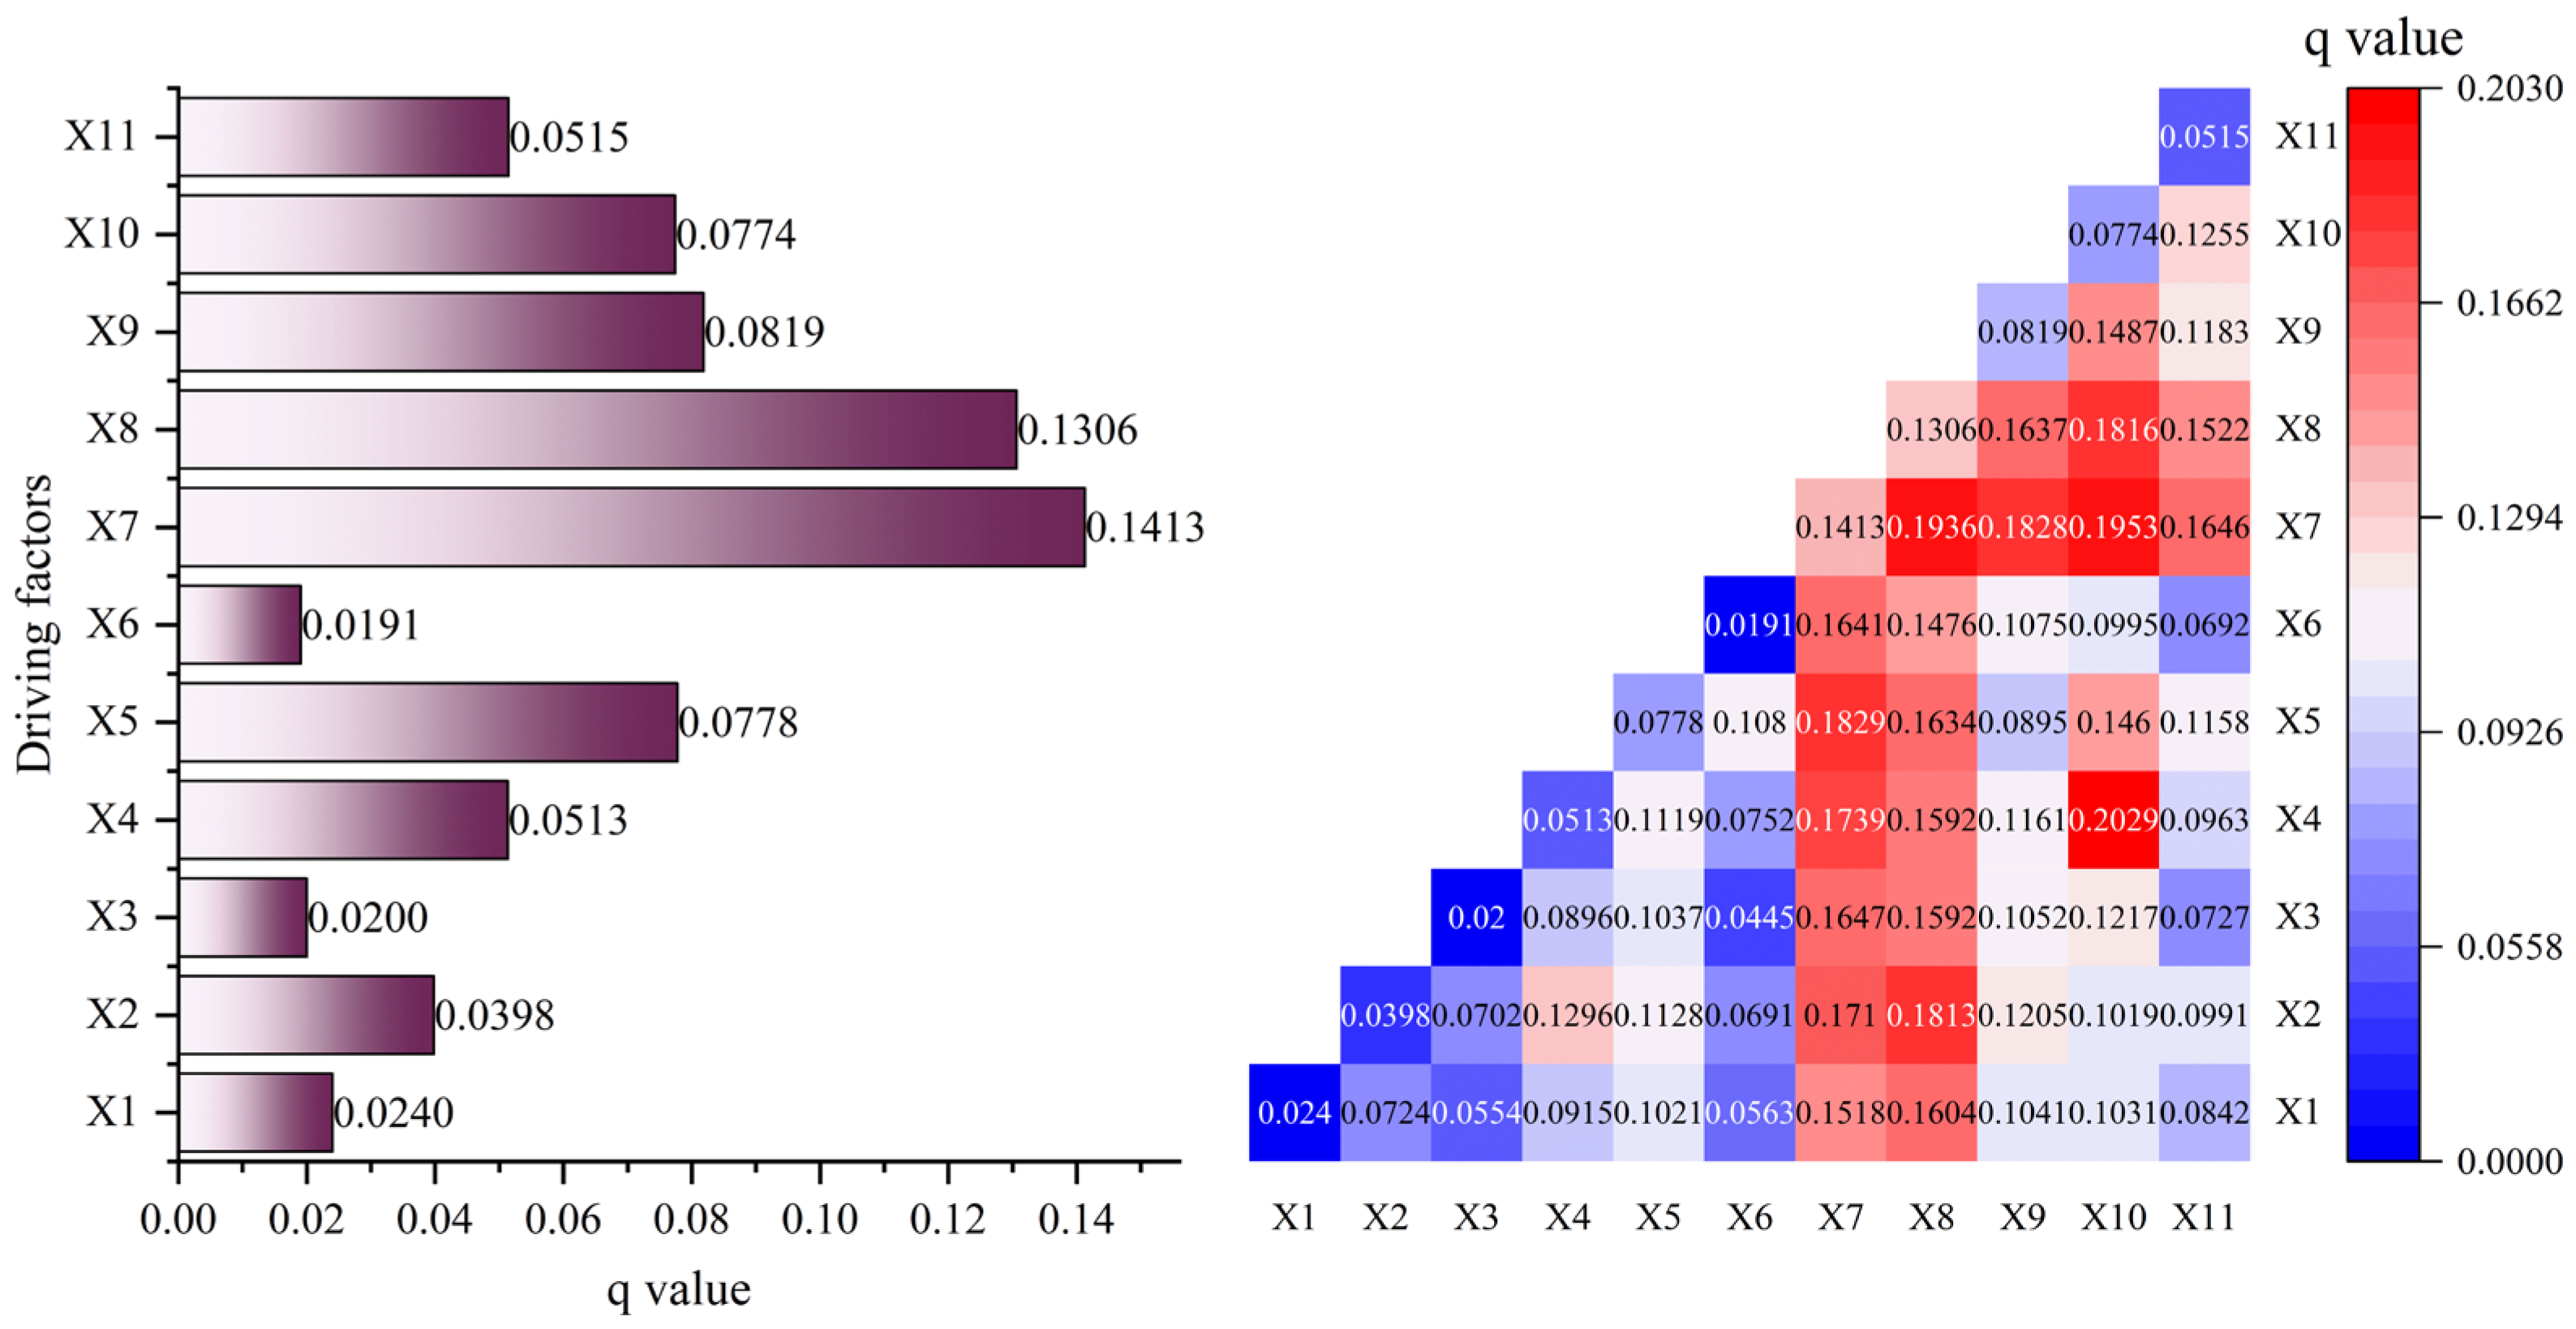
Based on the characteristics of Jungar Banner, this paper selected a total of 11 driving factors for analysis, considering both natural environmental and human-induced influences. The driving factors are: X1—nighttime light, X2—distance to water, X3—distance to major roads (provincial highways, national highways, and railways), X4—air temperature, X5—population density, X6—NDVI, X7—distance from mining areas, X8—precipitation, X9—GDP, X10—DEM, and X11—slope. Among these, X2, X4, X6, X8, X10, and X11 are natural environmental factors, while X1, X3, X5, X7, and X9 are anthropogenic factors.

2.5. The NEGM-MOP Model

To scientifically project the spatial pattern of land use in the study area by 2030, this study draws on the Shared Socio-economic Pathways (SSPs) framework from the Coupled Model Intercomparison Projects (CMIPs, specifically CMIP6). It employs SSP-RCP scenarios—combinations of different SSPs and Representative Concentration Pathways (RCPs)—and calibrates them based on actual policies in the study area.
Referring to the SSP-RCP scenarios and based on the Ordos City Territorial Spatial Master Plan (2021–2035), the Jungar Banner Territorial Spatial Master Plan (2020–2035), the Ordos City 14th Five-Year Plan for Ecological and Environmental Protection, as well as potential future developments in land-use classification, this study establishes planning and restrictions for Jungar Banner. Based on the “Three Zones and Three Lines”—the ecological conservation redline, the permanent basic farmland protection redline, and the urban development boundary—coordinately delineated by government departments, this study constructs four development scenarios for Jungar Banner: NDS (Natural Development Scenario), EPS (Ecological Protection Scenario), EDS (Economic Development Scenario), and CDS (Coordinated Development of ecological economy Scenario).
The NDS represents historical trends in land-use change, referring to a state of natural development in which the study area’s socio-economic conditions, population growth, natural environment, and resource consumption do not undergo drastic changes.
The EPS prioritizes ecological protection, embodying the macro-regulatory philosophy of “ecology first.” Under this scenario, regional development transitions toward a green, low-carbon model, strictly controlling the conversion of forest, grassland, and water into other land types, and strictly limiting the expansion of built-up land.
The EDS prioritizes economic development, emphasizing efficiency and industry-driven growth, and gives priority to the development of built-up land to meet the demands of new-type urbanization.
The CDS represents a balanced development of economic and ecological benefits, meeting current sustainable development requirements, and lies between the EPS and EDS.
The GM (1,1) model in gray prediction theory is an equal-interval time-series forecasting model. The non-equidistant gray model (NEGM) is a specialized model derived from the GM (1,1) model, designed to address the problem of fitting and forecasting time series with unequal time intervals [29]. The extension of the gray prediction model from equal-interval to non-equal-interval applications involves modifying the definition of the Accumulated Generating Operation (AGO) to accommodate situations where time intervals are inconsistent.
Let the original non-equidistant sequence be denoted as:
X ( 0 ) = x ( 0 ) ( t 1 ) , x ( 0 ) ( t 2 ) , , x ( 0 ) ( t n )
where the time intervals are given by: Δ k =   t k t k 1   (where k = 2, 3, …, n). In the non-equidistant gray model, a simple accumulation is not adopted. Instead, a weighted accumulation is performed based on the time intervals to construct the AGO sequence X(1):
x 1 t k = i = 1 k x 0 t i Δ i
The whitening differential equation of the non-equidistant GM (1,1) model is established as: d x 1 d t + a x 1 t = b where the parameters a and b are estimated using the ordinary least squares method: a ^ = ( B T B ) 1 B T Y yielding the time response function:
x ^ 1 t = x 0 t 1 b a e a t t 1 + b a
By applying the inverse accumulation, the final predicted outputs at each time point are obtained as follows:
x ^ 0 t k = x ^ 1 t k x ^ 1 t k 1 t k t k 1 k = 2 , 3 , , n
The EPS, EDS, and CDS are land-use type optimization scenarios subject to constraints. To determine the optimal land-use areas under these scenarios, the MOP model was used to define the objective function and constraints, thereby yielding the land-use areas for each scenario. The calculations were performed using Lingo 18.0 software.
In the Ecological Protection Scenario (EPS), the primary goal is ecological conservation. The target is to maximize the total ecological value (FEPS), which is formulated as follows:
m a x   F E P S x = i = 1 6 a i x i
In the Economic Development Scenario (EDS), priority is given to economic development. The objective is to maximize the total economic value (FEDS), formulated as:
m a x   F E D S x = i = 1 6 b i x i
The objective of the CDS is to balance economic and ecological development to maximize overall benefits. Its objective function is:
M a x   F C D S x = ω 1 F E P S ( x ) Q 1 + ω 2 F E D S ( x ) Q 2
In Equations (8)–(10): i = 1, …, 6; ai and bi represent the ecological value coefficient and economic value coefficient (104 yuan/km2), respectively, for a given land-use type; xi is the area of a given land-use type (km2); ω1 and ω2 are weight coefficients; and Q1 and Q2 are dimensionless reference values used to eliminate the order-of-magnitude difference between economic and ecological benefits, ensuring that the two objectives are compared on the same scale. In this study, Q1 and Q2 represent the reference totals of ecological and economic values, respectively, under the Natural Development Scenario (NDS) for 2030. They were derived by summing the products of the projected NDS land-use areas and their corresponding value coefficients. To simplify the multi-objective programming computation, the raw total values were scaled down by a factor of 106, yielding the adopted dimensionless reference values of Q1 = 1.2113 and Q2 = 22.2473. To verify the robustness of the ecological and economic weight coefficients (ω1 and ω2) assigned to the CDS scenario in the MOP model, sensitivity testing was conducted with five weight combinations: (ω1, ω2) = (0.1, 0.9), (0.3, 0.7), (0.5, 0.5), (0.7, 0.3), and (0.9, 0.1).
This study uses the ecological and economic value coefficients of Jungar Banner to establish constraints on land-use types under different scenarios. In consideration of the distinctive features of each scenario and the scarcity of quantitative policy data, the upper and lower bounds of land-use areas were established by referencing published thresholds from analogous studies, which serve as the constraints for the scenario simulations [30]; the MOP model is used to set the following constraints for predicting land-use areas under each scenario:
i = 1 6 a i x i i = 1 6 a i n i
Equation (11) indicates that the ecological value of the EPS is greater than that of the NDS.
i = 1 6 b i x i i = 1 6 b i n i
Equation (12) indicates that the economic value of the EDS is greater than the ecological value of the NDS.
i = 1 6 x i = 7559.88
Equation (13) shows that the total area of each land-use type in the EPS, EDS, and CDS is equal to the total area of the study region.
x 2 1440.04
Equation (14) indicates that, under the arable land redline, the arable land areas in the EPS, EDS, and CDS are no less than that in the NDS.
x 4 + x 5 4111.44
Equation (15) indicates that, among land categories with higher ecological value, the sum of forested land and water areas under the EPS and CDS should be greater than the sum of forested land and water areas under the NDS.
0.8   n i x i 1.2   n i
Equation (16) represents the constraints on future changes in land-use types, specifically that fluctuations from the land-use area under the NDS should not exceed ±20%. In land-use simulation, ±20% is a common empirical threshold, reflecting a reasonable short- to medium-term flexibility range under existing development inertia. In this section, the meanings of ai, bi, and xi are the same as those defined above, where x1, x2, x3, x4, x5, and x6 denote grassland, cropland, bare land, water, forest, and built-up land, respectively; ni represents the area (km2) of each land-use type under the NDS.

2.6. PLUS Model

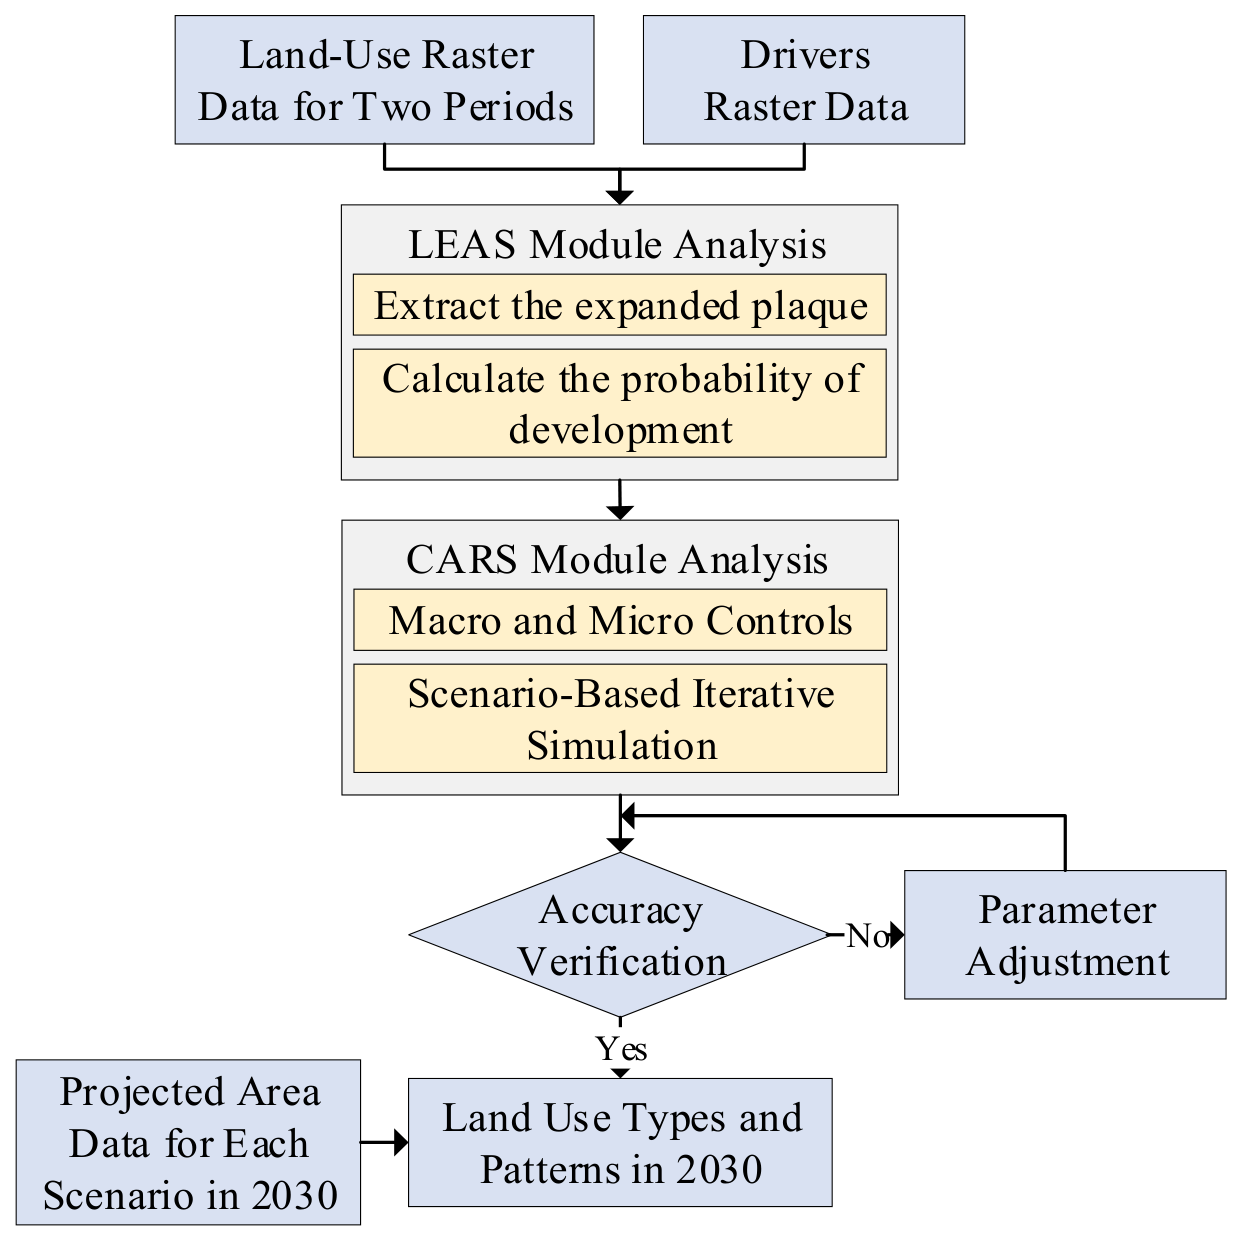
The PLUS model primarily consists of two modules: the LEAS (Land Expansion Analysis Strategy) module and the CARS (CA based on Multiple Random Seeds) module. The LEAS module focuses on analyzing “expansion patches” of various land-use types between two time periods. It uses raster data on land-use changes as samples and combines them with driving factors such as slope, elevation, distance to water, GDP, and population density. By applying the random forest algorithm, it calculates the probability of change for each land-use type at specific grid cells and determines the contribution of each driving factor. The CARS module refines the distribution of land-use types by integrating macro-level forecasting requirements with micro-level local changes. Based on the macro-level total area forecast and the micro-level multi-class random seed patch mechanism, it automatically generates new land-use patches, driven by the change probabilities associated with each driving factor. Ultimately, it predicts the spatial distribution of land-use types in the study area for 2030. The flowchart of the PLUS model is shown in Figure 3.

3. Results

3.1. Analysis of Land-Use Type Evolution

Support vector machine (SVM) supervised classification was used to classify remote sensing images, and the accuracy of the results was evaluated based on an error matrix (also known as a confusion matrix), with classification accuracy calculated from the error matrix. This study used Overall Accuracy (OA), User’s Accuracy (UA), Producer’s Accuracy (PA) and the Kappa coefficient to evaluate the land-use classification results for Jungar Banner in 2010, 2015, 2020, and 2025, as shown in Table 3.
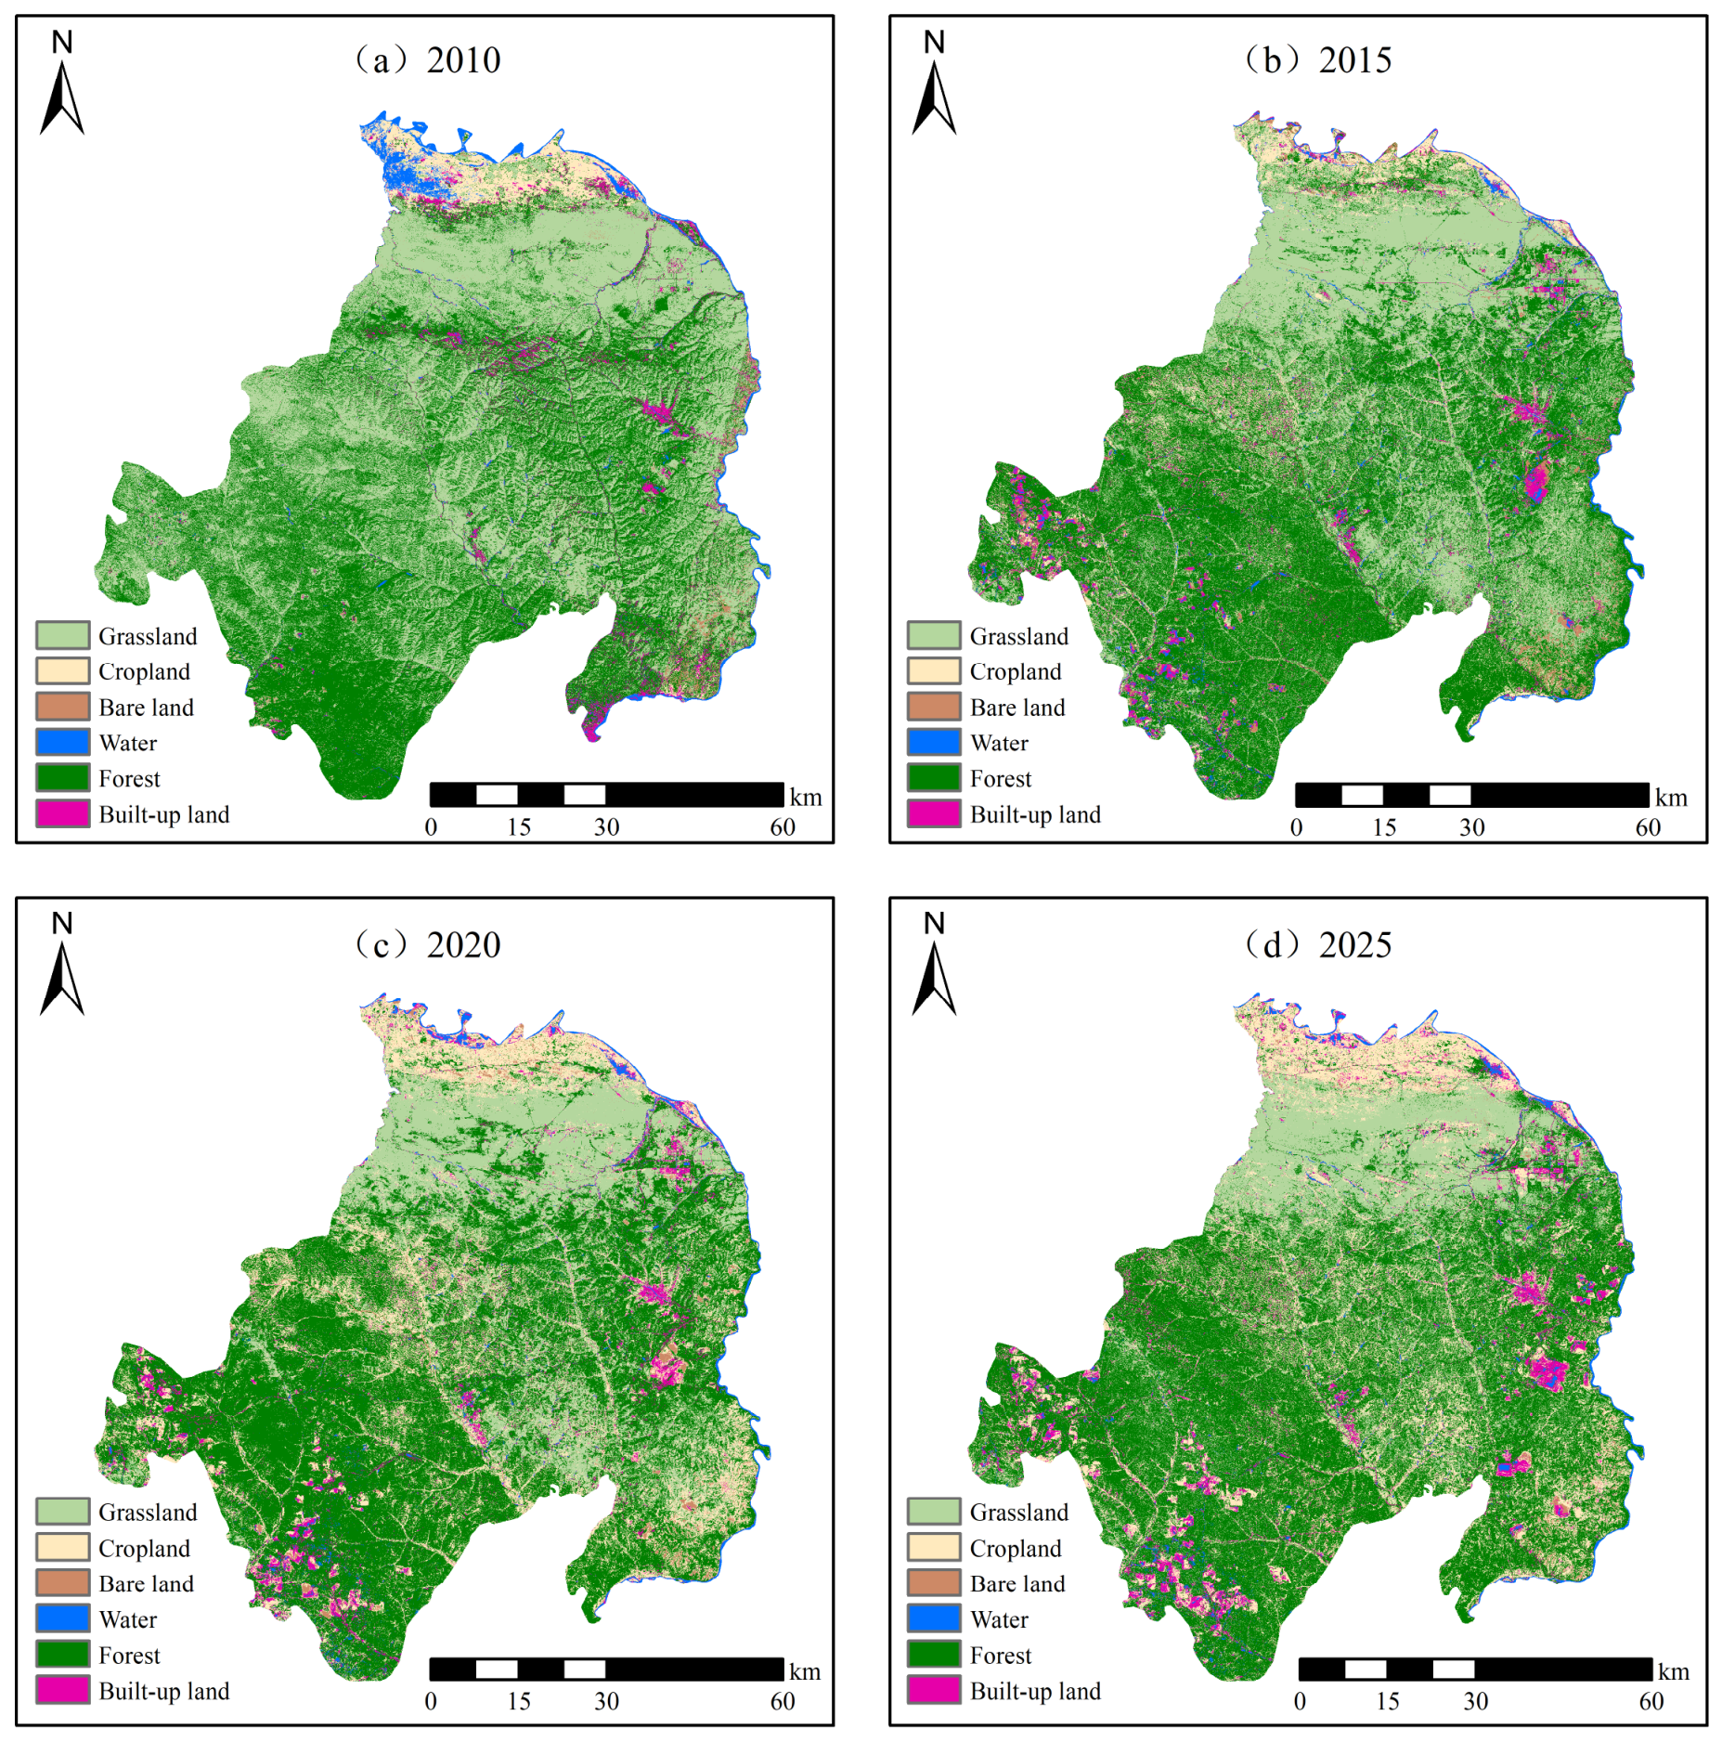
As shown in Table 3, the OA and Kappa coefficients for the land-use classification results in Jungar Banner from 2010 to 2025 ranged from 89.01% to 95.47% and from 0.8101 to 0.9069. This indicates a high degree of consistency between the overall classification results and the actual land-use types, meaning that the classification accuracy is high and the results can be used for subsequent basic research. The distribution patterns are shown in Figure 4.
According to the classification results, Jungar Banner underwent a structural reorganization of land-use types between 2010 and 2025, primarily characterized by a significant increase in forest and cropland, and a decrease in grassland. Table 4 shows the areas occupied by specific land-use types in the banner.
Between 2010 and 2025, driven by both mining development and ecological restoration, the land-use pattern in Jungar Banner underwent significant changes. Specifically, grassland area decreased by more than half, while cropland and built-up land expanded substantially, and forest area increased steadily. This evolution exhibits distinct phased characteristics: it shifted gradually from the initial period (2010–2020), marked by drastic changes resulting from high-intensity development, to the later period (2020–2025), a stable phase governed by macro-level policies such as the ecological redline, with the region’s land-use structure now tending toward a stable equilibrium.
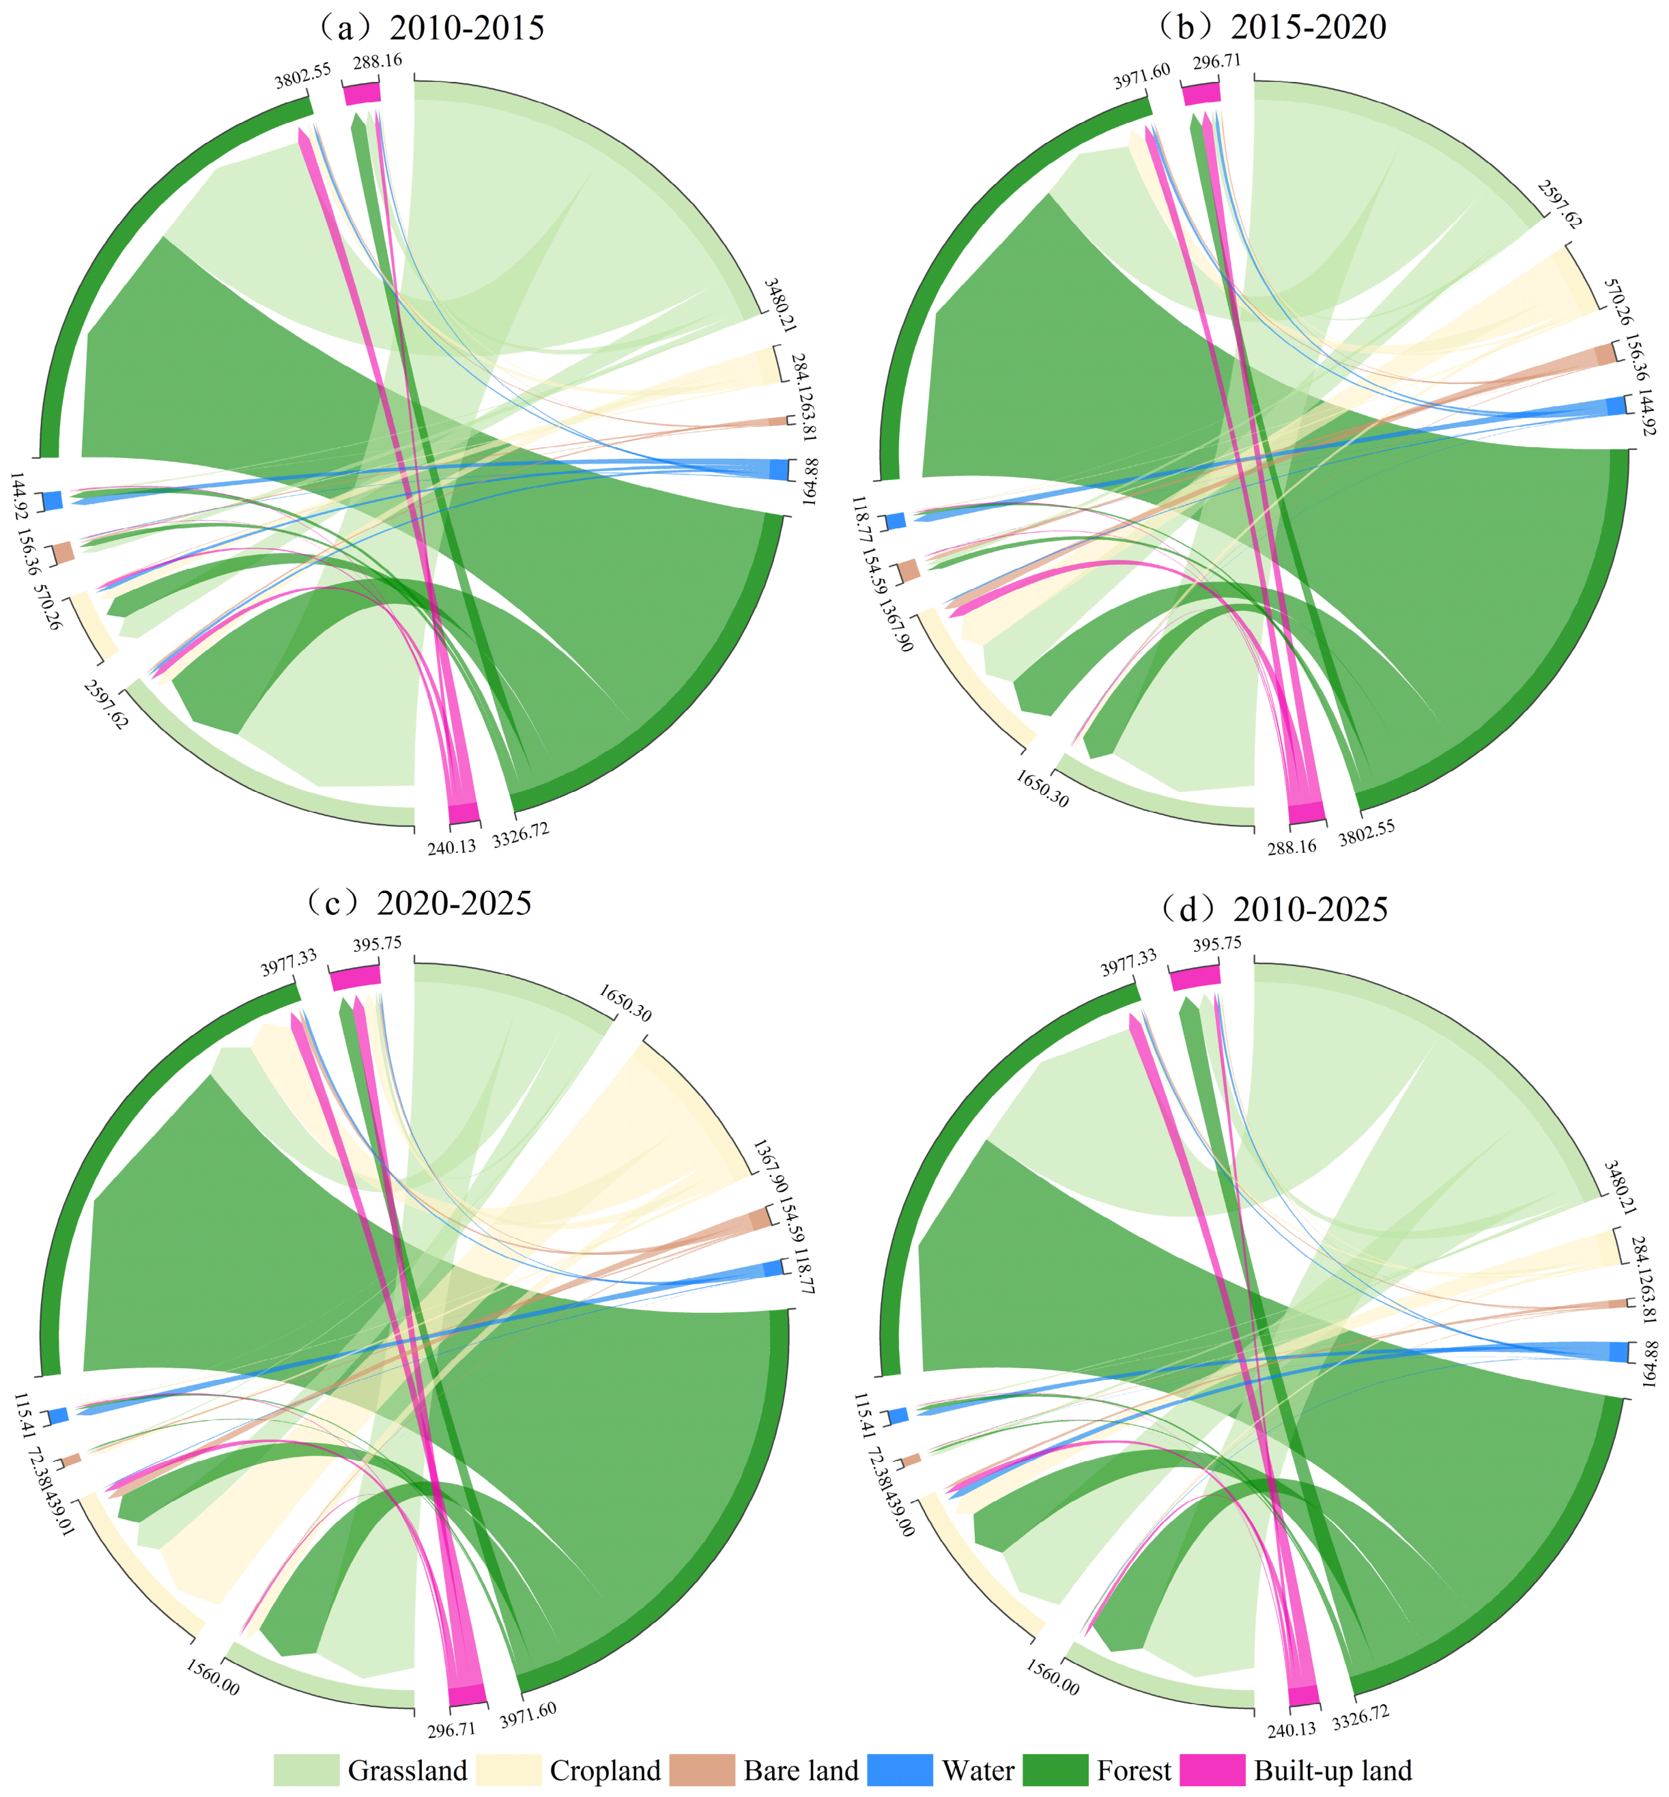
The land-use transition matrices for the periods 2010–2015, 2015–2020, and 2020–2025 were also calculated, and these transition matrices were visualized as land-use transition chord diagrams, as shown in Figure 5.
Based on the transition matrices and chord diagrams, the following trends are observed. During 2010–2015, grassland was primarily converted to forest and cropland, with 1459.26 km2 and 215.90 km2 transferred, respectively; 195.13 km2 of forest was converted to cropland; and the increase in built-up land mainly came from forest and grassland, contributing 132.92 km2 and 85.01 km2, respectively. From 2015 to 2020, cropland was the primary land-use category experiencing growth during this phase, with 450.72 km2 of forest and 417.61 km2 of grassland converted to cropland. Grassland continued to decline significantly during this period, falling to 1650.30 km2, and the primary land-use type shifted to forest. Between 2020 and 2025, built-up land showed an expanding trend, increasing from 296.71 km2 to 395.75 km2, primarily converted from cropland and forest, with conversion areas of 101.50 km2 and 125.50 km2, respectively. Forest and grassland underwent mutual conversion, while cropland also showed steady growth, rising to 1439.01 km2. A comparative analysis of the land-use patterns in Jungar Banner over the 15-year period reveals that cropland and built-up land both showed an upward trend, while grassland experienced the greatest loss. Forest remained in a state of dynamic equilibrium, and both water and bare land saw slight decreases.
The single-land-use dynamic degrees for Jungar Banner over the period 2010–2025 are presented in Table 5. As shown in the table, cropland and built-up land exhibited relatively pronounced increases in single dynamic degree during 2010–2025. Among these, cropland showed the most substantial growth during 2010–2020, with its expansion rate moderating in the subsequent period (2020–2025). Built-up land, by contrast, experienced a notable expansion of 6.68%·a−1 between 2020 and 2025. Grassland and water both showed declining trends across all stages, with single dynamic degrees of −3.68%·a−1 and −2.00%·a−1, respectively. Bare land underwent dramatic fluctuations, characterized by a sharp increase followed by a rapid decrease. Forest, meanwhile, maintained a steady but slow positive expansion throughout the study period. The earlier phase (2010–2020) was marked by drastic land-use changes driven by mining and agricultural expansion, while the latter phase (2020–2025) was characterized by the concurrent acceleration of built-up land expansion and a significant reduction in bare land, reflecting the phased nature of land-use change in Jungar Banner.
The comprehensive land-use dynamic degree for Jungar Banner over the period 2010–2025 is presented in Table 6. As shown in the table, the comprehensive dynamic degree in the study area exhibited a phased deceleration trend over the study period, declining gradually from 4.73%·a−1 during 2010–2015 to 3.68%·a−1 during 2020–2025. This indicates that the land-use pattern has transitioned from a phase of rapid expansion to a relatively stable stage characterized by structural optimization.
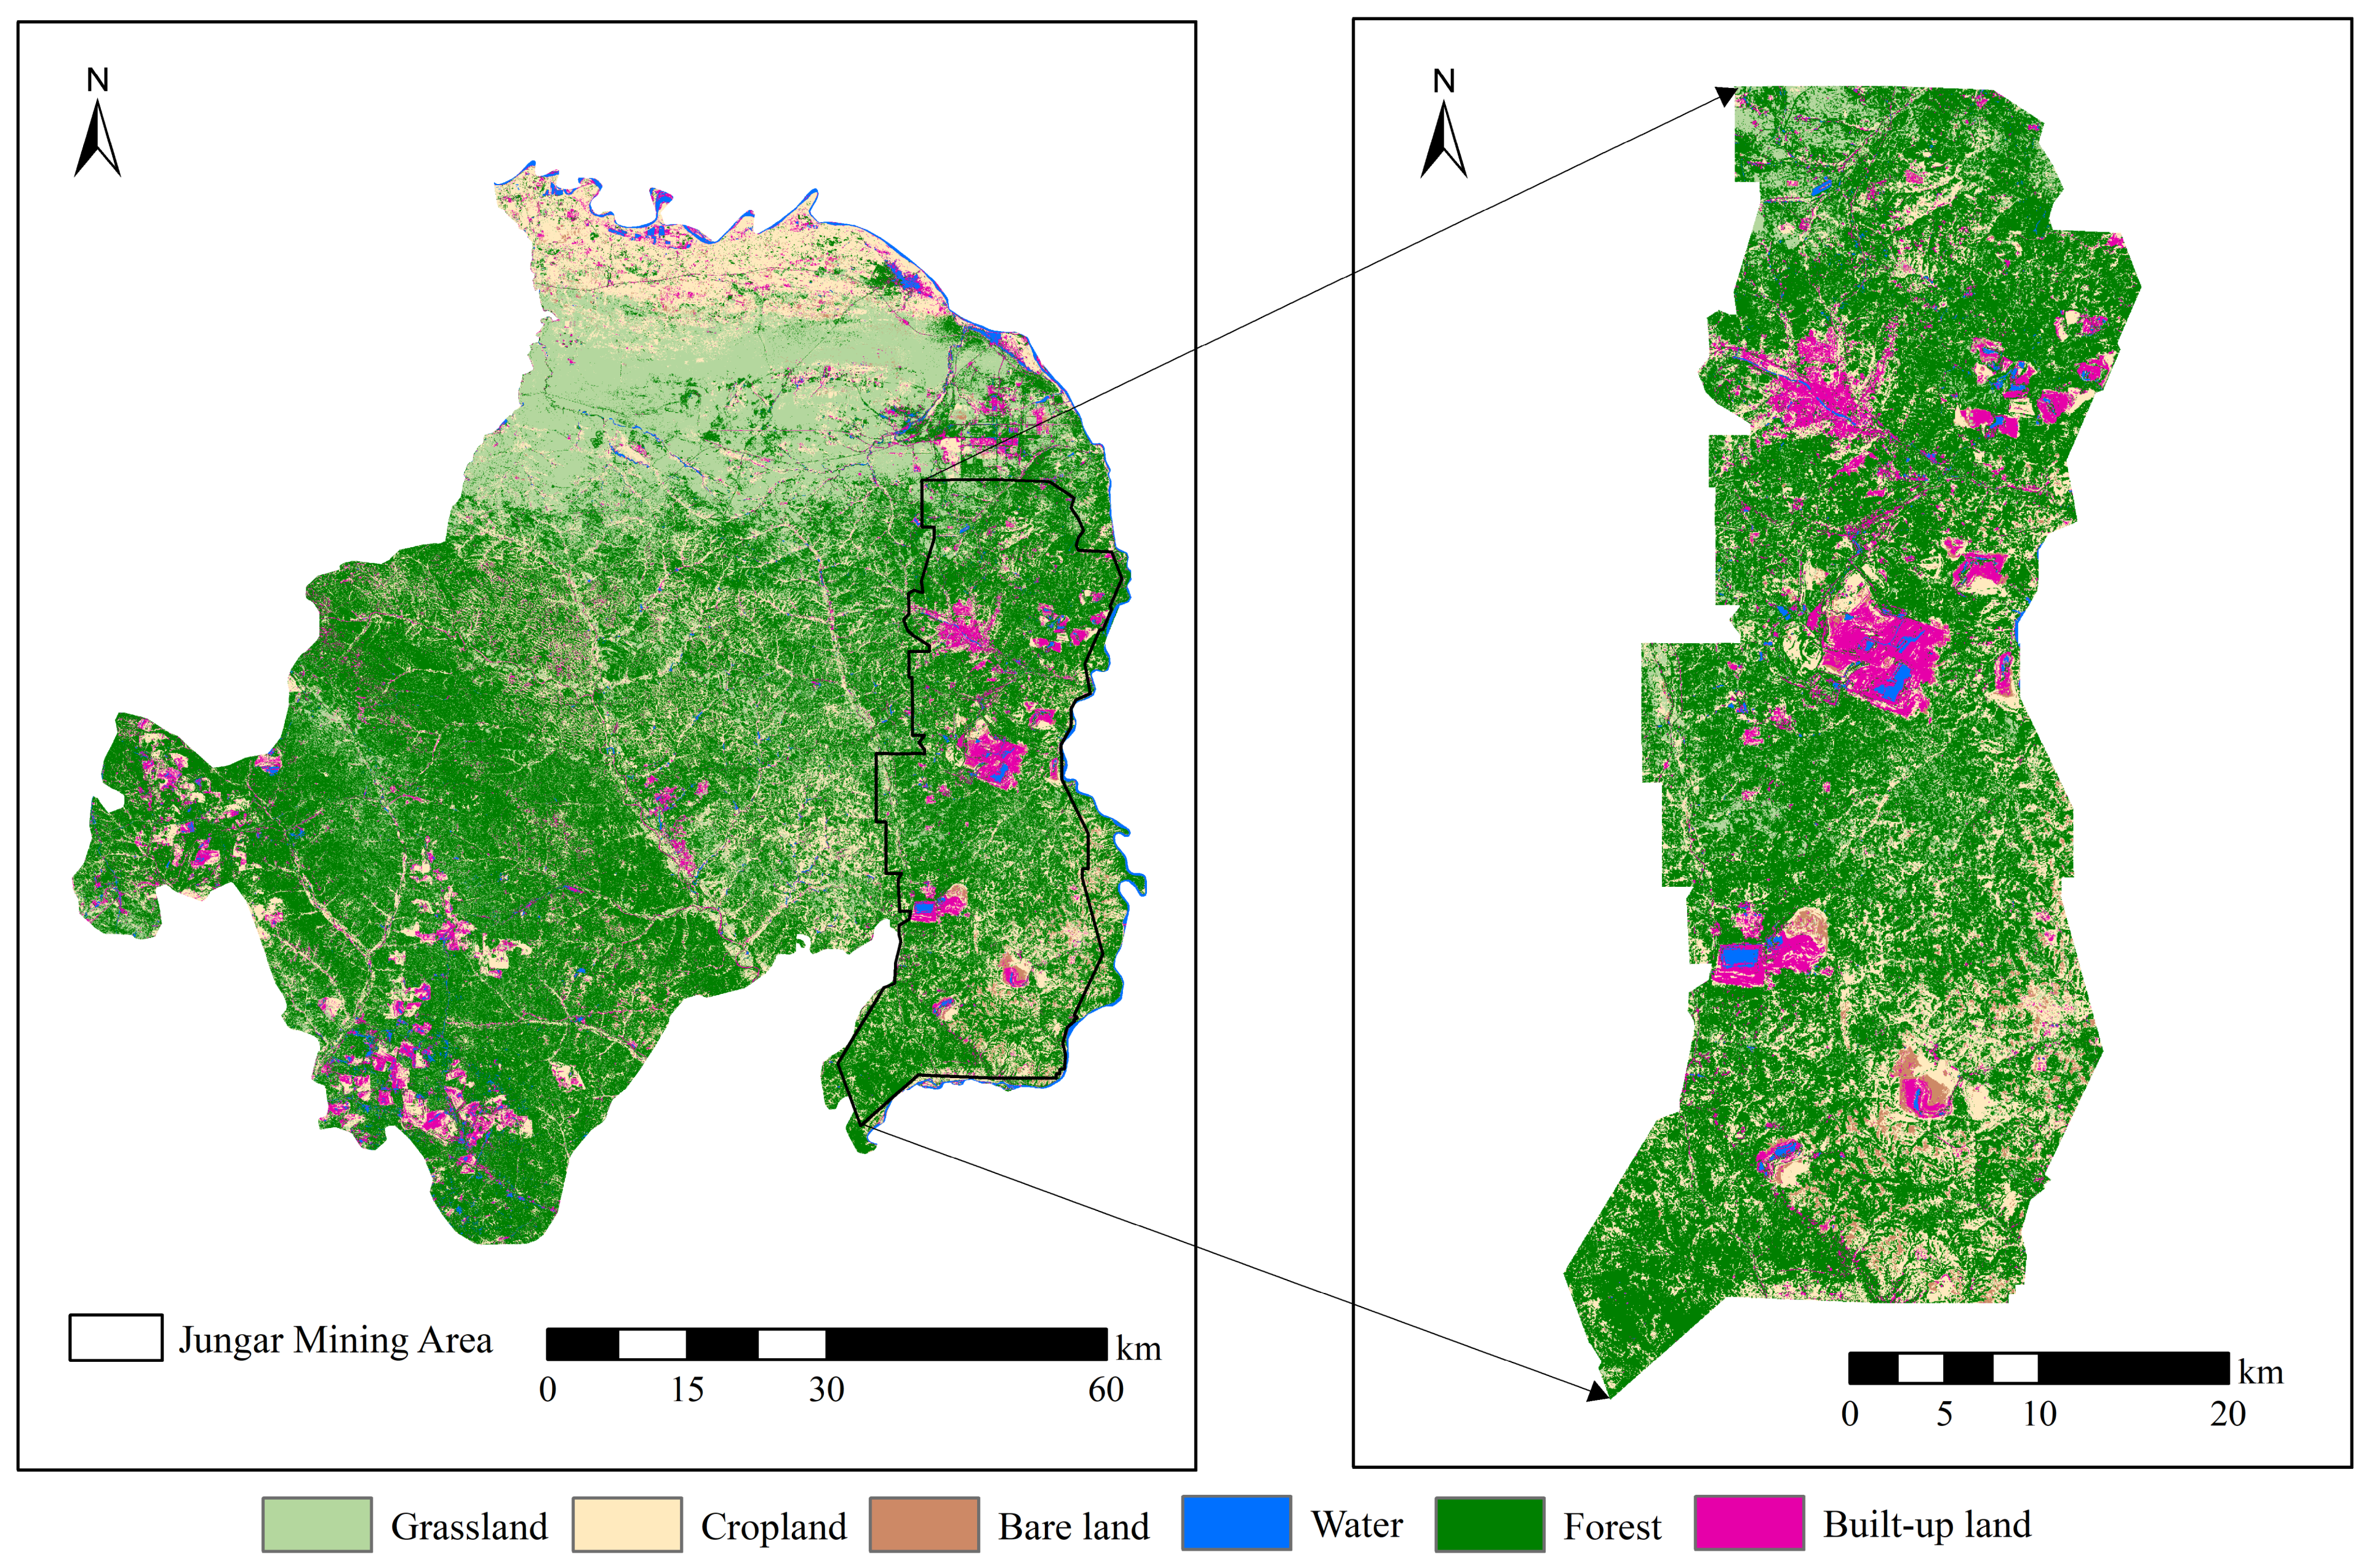
The analysis of land-use changes between 2010 and 2025 elucidates the spatiotemporal evolution of land-use structure in Jungar Banner. The spatial heterogeneity evolution is not merely a transformation of surface land-use types, but also a reorganization of landscape patches in terms of their spatial arrangement, aggregation, and fragmentation. Particularly in a resource-based region such as Jungar Banner, where open-pit coal mining predominates, intensive human activities—including mining, overburden dumping, and subsequent mining area consolidation—are the decisive factors reshaping the local landscape pattern. To address the limitation of conventional land-use analysis in capturing the degree of patch fragmentation, this study further delineates the core disturbance zone of the mining area based on data from the data, with the spatial extent of the zone illustrated in Figure 6 (using 2025 as an example). By calculating the landscape fragmentation and aggregation indices for this area, the study quantitatively analyzes the specific effects of mining area expansion and consolidation on spatial pattern heterogeneity.
Based on the literature [31], a set of landscape metrics was selected at both the class and landscape levels, including the number of patches (NP), patch density (PD), largest patch index (LPI), contagion index (CONTAG), splitting index (SPLIT), Shannon’s diversity index (SHDI), Shannon’s evenness index (SHEI), and aggregation index (AI). These metrics were computed using Fragstats (v4.2) software to quantitatively analyze the degree of fragmentation within the core disturbance zone of the mining area. The results are presented in Table 7.
As shown in Table 7, open-pit mining and mining area consolidation exerted pronounced stage-specific effects on local landscape heterogeneity. During 2010–2015, a phase of mining expansion and intensifying fragmentation, driven by open-pit excavation and the construction of spoil disposal areas, NP and PD increased significantly, while CONTAG declined markedly. The SPLIT rose from 5.7063 to 7.6586, indicating that large-scale mining in the early stage led to increased patch fragmentation. From 2015 to 2025, the region entered a phase of mining consolidation and pattern reorganization. The SPLIT showed a sustained decline from 7.6586 to 2.9208, while LPI increased from 30.3696% to 58.4545% and AI rose to 73.0769%, suggesting that concentrated mining operations and integrated arrangement of spoil disposal areas substantially reduced landscape fragmentation. Between 2020 and 2025, NP and PD rebounded, revealing a dual effect of mining consolidation: while it promoted high aggregation in core extraction zones—as indicated by increased LPI and AI and decreased SPLIT—it also led to localized fragmentation in peripheral areas interspersed with engineering disturbances and land reclamation transition zones.

3.2. Analysis of Driving Factors of Land-Use Types

Data from 2010, 2015, and 2020 were selected for factor detection analysis of land-use drivers. When conducting single-factor detection using the OPGD model, among the 11 driving factors selected for this study, only X3—distance from major roads (provincial highways, national highways, and railways)—showed relatively low significance in 2010 (p > 0.001); all driving factors were significant in 2015 and 2020.
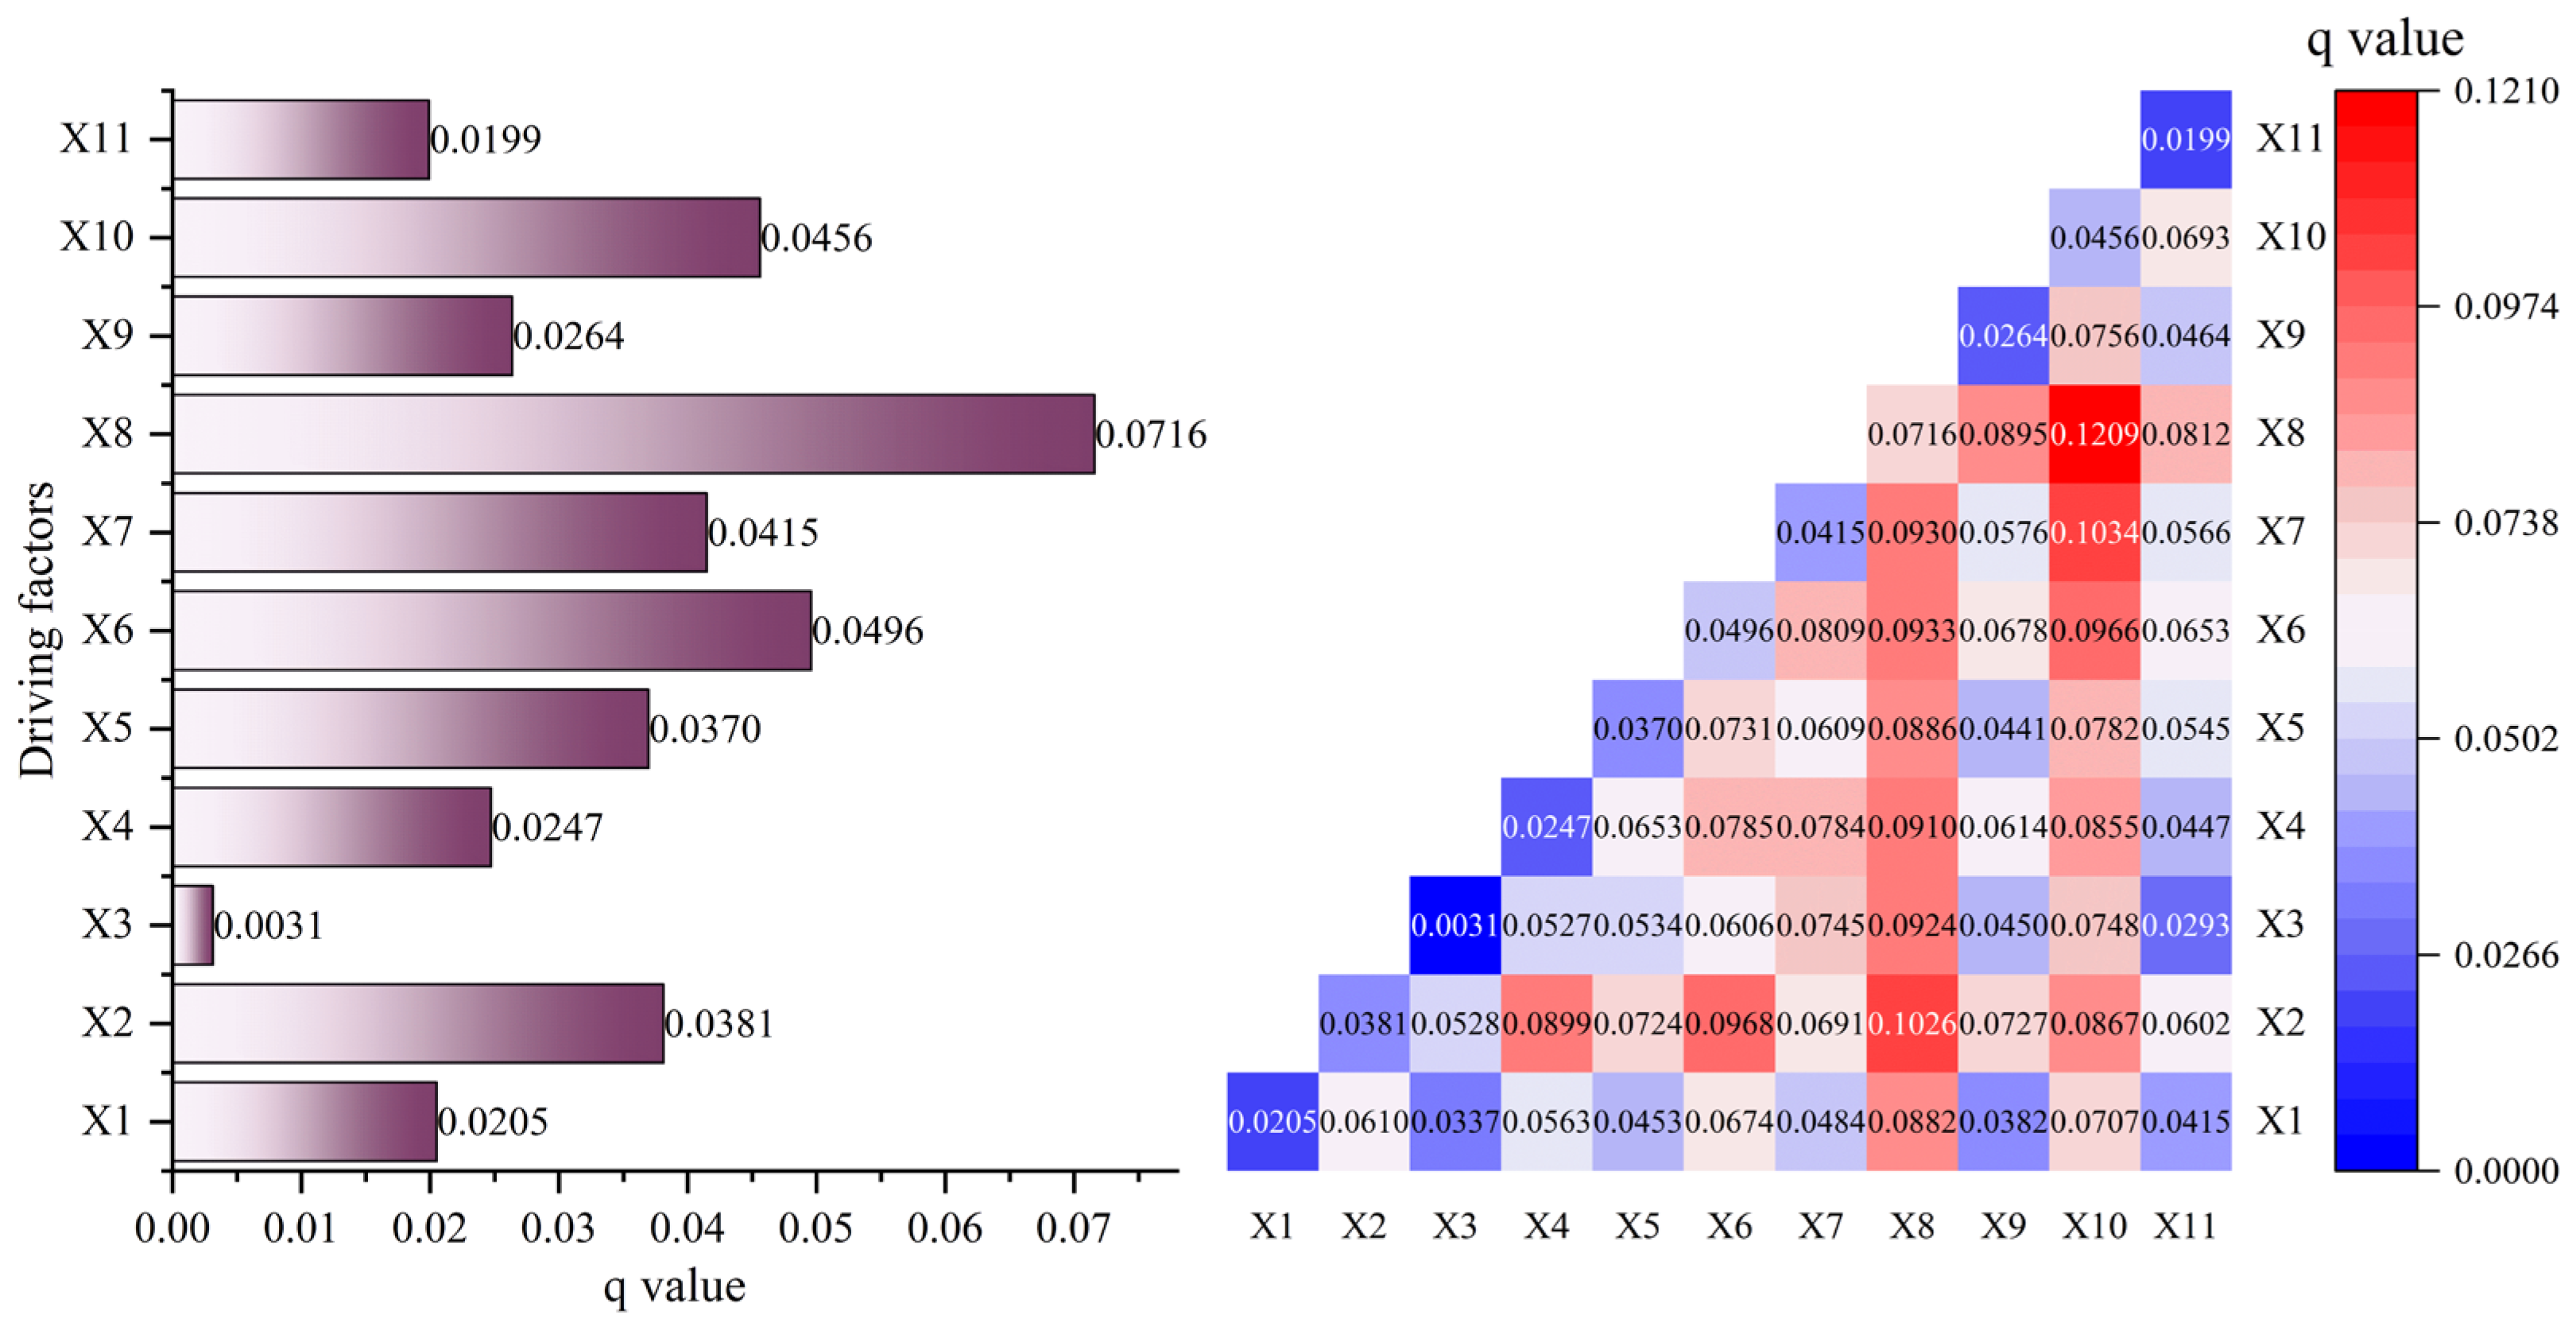
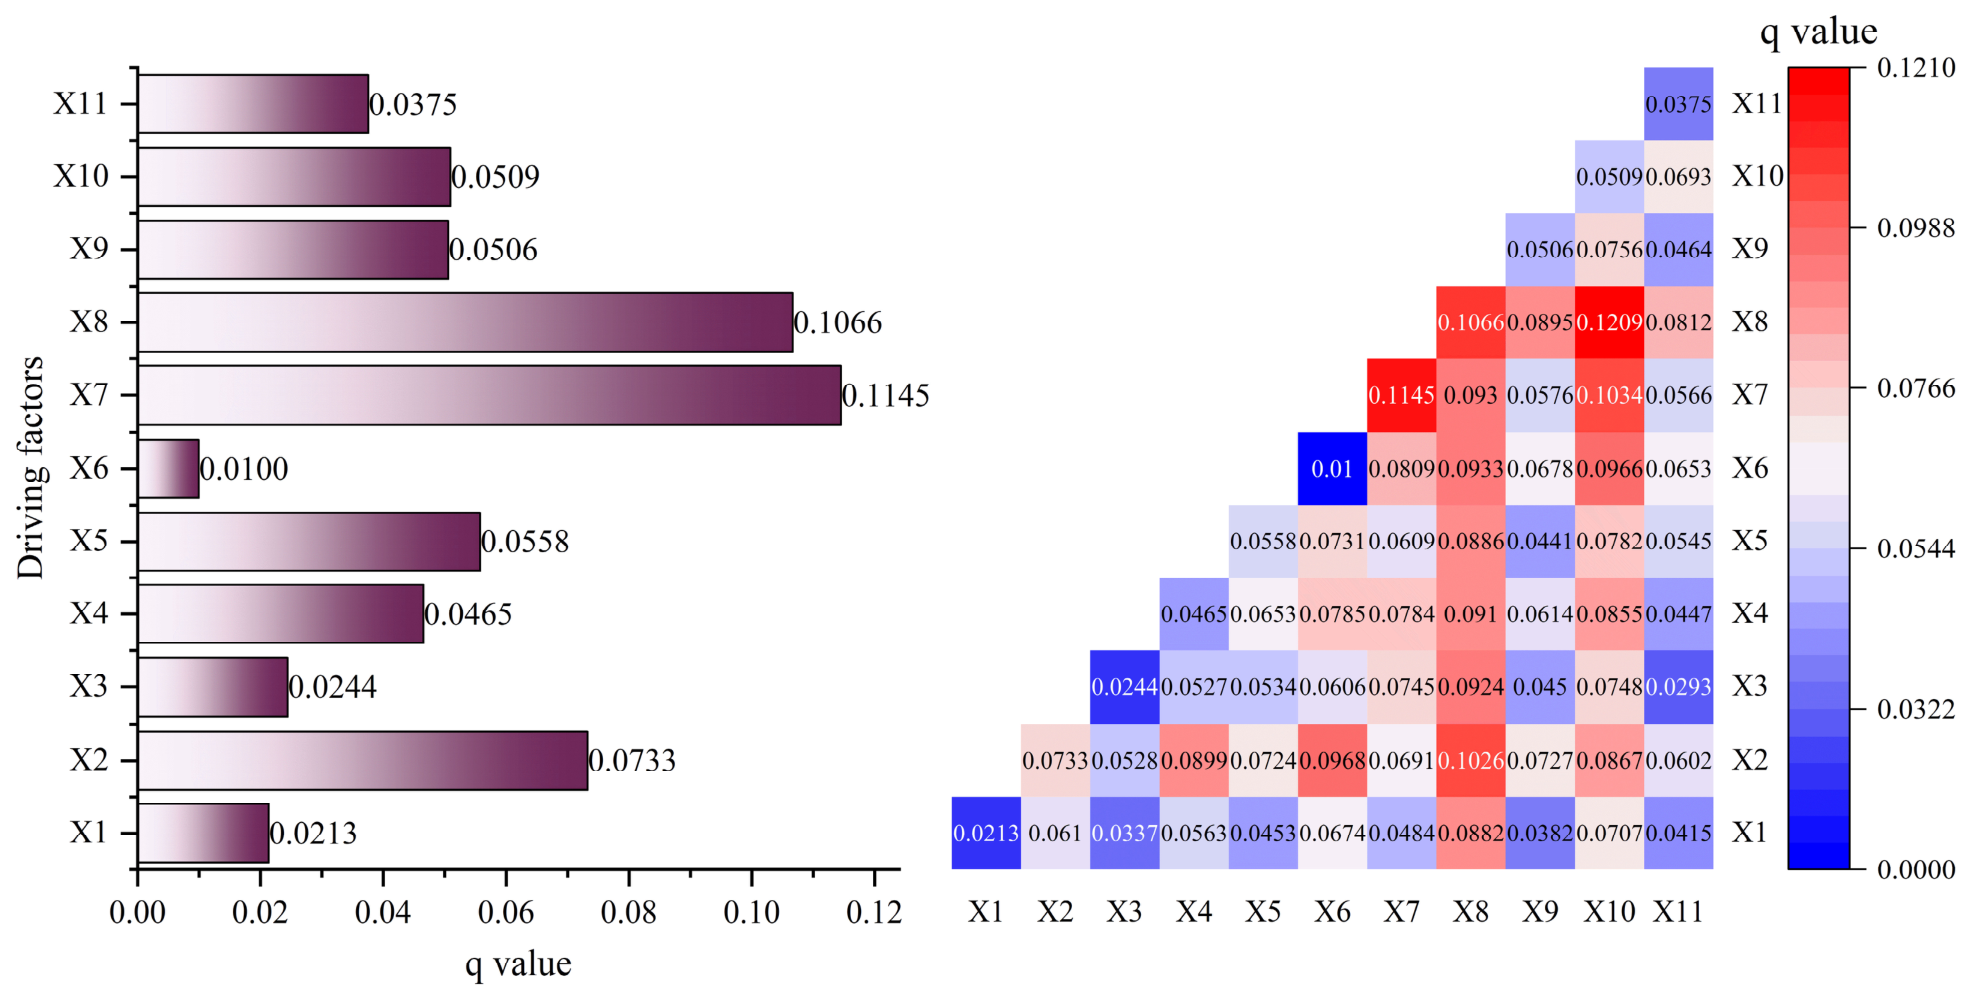
In 2010, the primary drivers of the land-use pattern in Jungar Banner were X8 (precipitation, q = 0.0716), X6 (NDVI, q = 0.0496), and X10 (DEM, q = 0.0456), with precipitation being the dominant factor explaining spatial variation. The specific effects of these driving factors are illustrated in Figure 7. The year 2015 marked a turning point in the evolution of land-use types in Jungar, with the influence of socio-economic factors increasing considerably. The specific effects of these driving factors are shown in Figure 8. By 2020, Jungar Banner had entered a phase of high-intensity anthropogenic driving forces. The specific effects of these driving factors are presented in Figure 9.
The drivers of land-use types during the study period exhibited strong phase-specific characteristics, shifting from natural factors to anthropogenic factors (with industrial and mining disturbances having the strongest impact). The structure of drivers shaping the land-use pattern in Jungar Banner underwent a transition from “constraints imposed by the natural geographic environment” to “the impact of resource development and human activities”. The interactions among driving factors continued to intensify, particularly the combined effect of distance from mining areas and natural factors, indicating that the expansion of built-up land is influenced not only by resource constraints but also by geographic and climatic conditions.
To avoid the interference of multicollinearity among the driving factors on subsequent models, this study used ordinary least squares (OLS) to diagnose multicollinearity among the 11 driving factors for 2020. Using the “Ordinary Least Squares” tool in ArcGIS (v10.8.1), a regression analysis was conducted on the relationship between the 2020 land-use type data and the 11 driving factors; the results are shown in Table 8. The variance inflation factors for all variables were less than 7.5, indicating that there is no multicollinearity among the 11 driving factors.

3.3. Analysis of Land-Use Types Under Multiple Scenarios

In the PLUS model, the 2010 data were used to predict the spatial distribution of land-use types in 2020, and the FoM value was introduced to verify the accuracy. The FoM value was 0.1388, Using the expansion patterns calibrated from this period, 2025 land-use types were projected from the 2020 baseline to test the model’s temporal independence, yielding an FoM of 0.1181, which falls within the range generally accepted in the literature as indicative of reliable land-use change simulation [32]. indicating that this model can be used to project the spatial distribution of land-use types in 2030.
The study established four scenarios: NDS, EPS, EDS, and CDS. Among these, the NDS was projected using a traditional Markov model. The transition probability matrix was derived using the 2020–2025 land-use transition matrix, and the resulting areas of various land-use types for 2030 under the NDS are shown in Table 9.
The areas of land-use types under the EPS, EDS, and CDS scenarios were quantified and projected using ecological and economic value coefficients. Ecological value coefficients were calculated using the table of service equivalence factors per unit area established by Xie Gaodi et al. [33]. The economic value coefficient data obtained from the Ordos City Statistical Yearbook (for 2010, 2015, 2020, and 2024) exhibit typical “small-sample” characteristics, and the time intervals between successive observations are unequal (5 years, 5 years, and 4 years, respectively), precluding the application of the conventional gray prediction model. Based on the evolution patterns of different indicators, this study adopts a hybrid forecasting strategy with categorized fitting. For indicators exhibiting monotonic growth trends—namely grassland, water, and built-up land—the non-equidistant gray model NEGM (1,1) is used; since gray prediction theory essentially fits exponential patterns, for indicators influenced by policy interventions and thus displaying non-monotonic characteristics—specifically cropland and forest—a quadratic polynomial model is employed for projection based on the data features. Model calculations and solutions were implemented in the Python (v3.14) programming environment, while algorithm parameter configuration, compilation, and debugging were performed on the Visual Studio Code (https://code.visualstudio.com/ accessed on 1 June 2026) platform. The resulting ecological and economic value coefficients for each land-use type in 2030 are presented in Table 10.
Sensitivity analysis of the weight coefficients assigned to the CDS reveals that the optimal land-use area allocation remains highly consistent across different weight configurations. Further examination of the ecological and economic value coefficients indicates that, due to the exceptionally high individual contributions of certain land-use types—such as the economic benefits of built-up land and the ecological benefits of forest and water—a pronounced “value gap” exists among different land-use categories. This gap cannot be overcome by weight adjustments; under strict constraints, the model consistently prioritizes area allocation to high-value land-use types. This indicates that the model results are mathematically robust, with spatial demand projections being jointly determined by intrinsic value differences among land-use types and real-world development constraints, rather than being an artifact of arbitrary weight assignments. Therefore, the adoption of equal weights (i.e., ω12 = 1:1) in this study is both scientifically sound and highly robust, ensuring that pattern projections remain unaffected by shifts in decision-maker preferences.
Based on the constraints and the objective functions, a multi-objective optimization model for regional land use was developed. Using Lingo (v18.0) software, the distribution of land-use types under different development scenarios in Jungar Banner was calculated; the results are shown in Table 11.
By modifying parameters such as neighborhood weights and transition matrices in the PLUS model, we predicted the spatial distribution patterns of land-use types under different scenarios for the year 2030. Referring to Reference [34] and the characteristics of the study area, we set the neighborhood weights and land-use transition matrices for the NDS, EPS, and EDS.
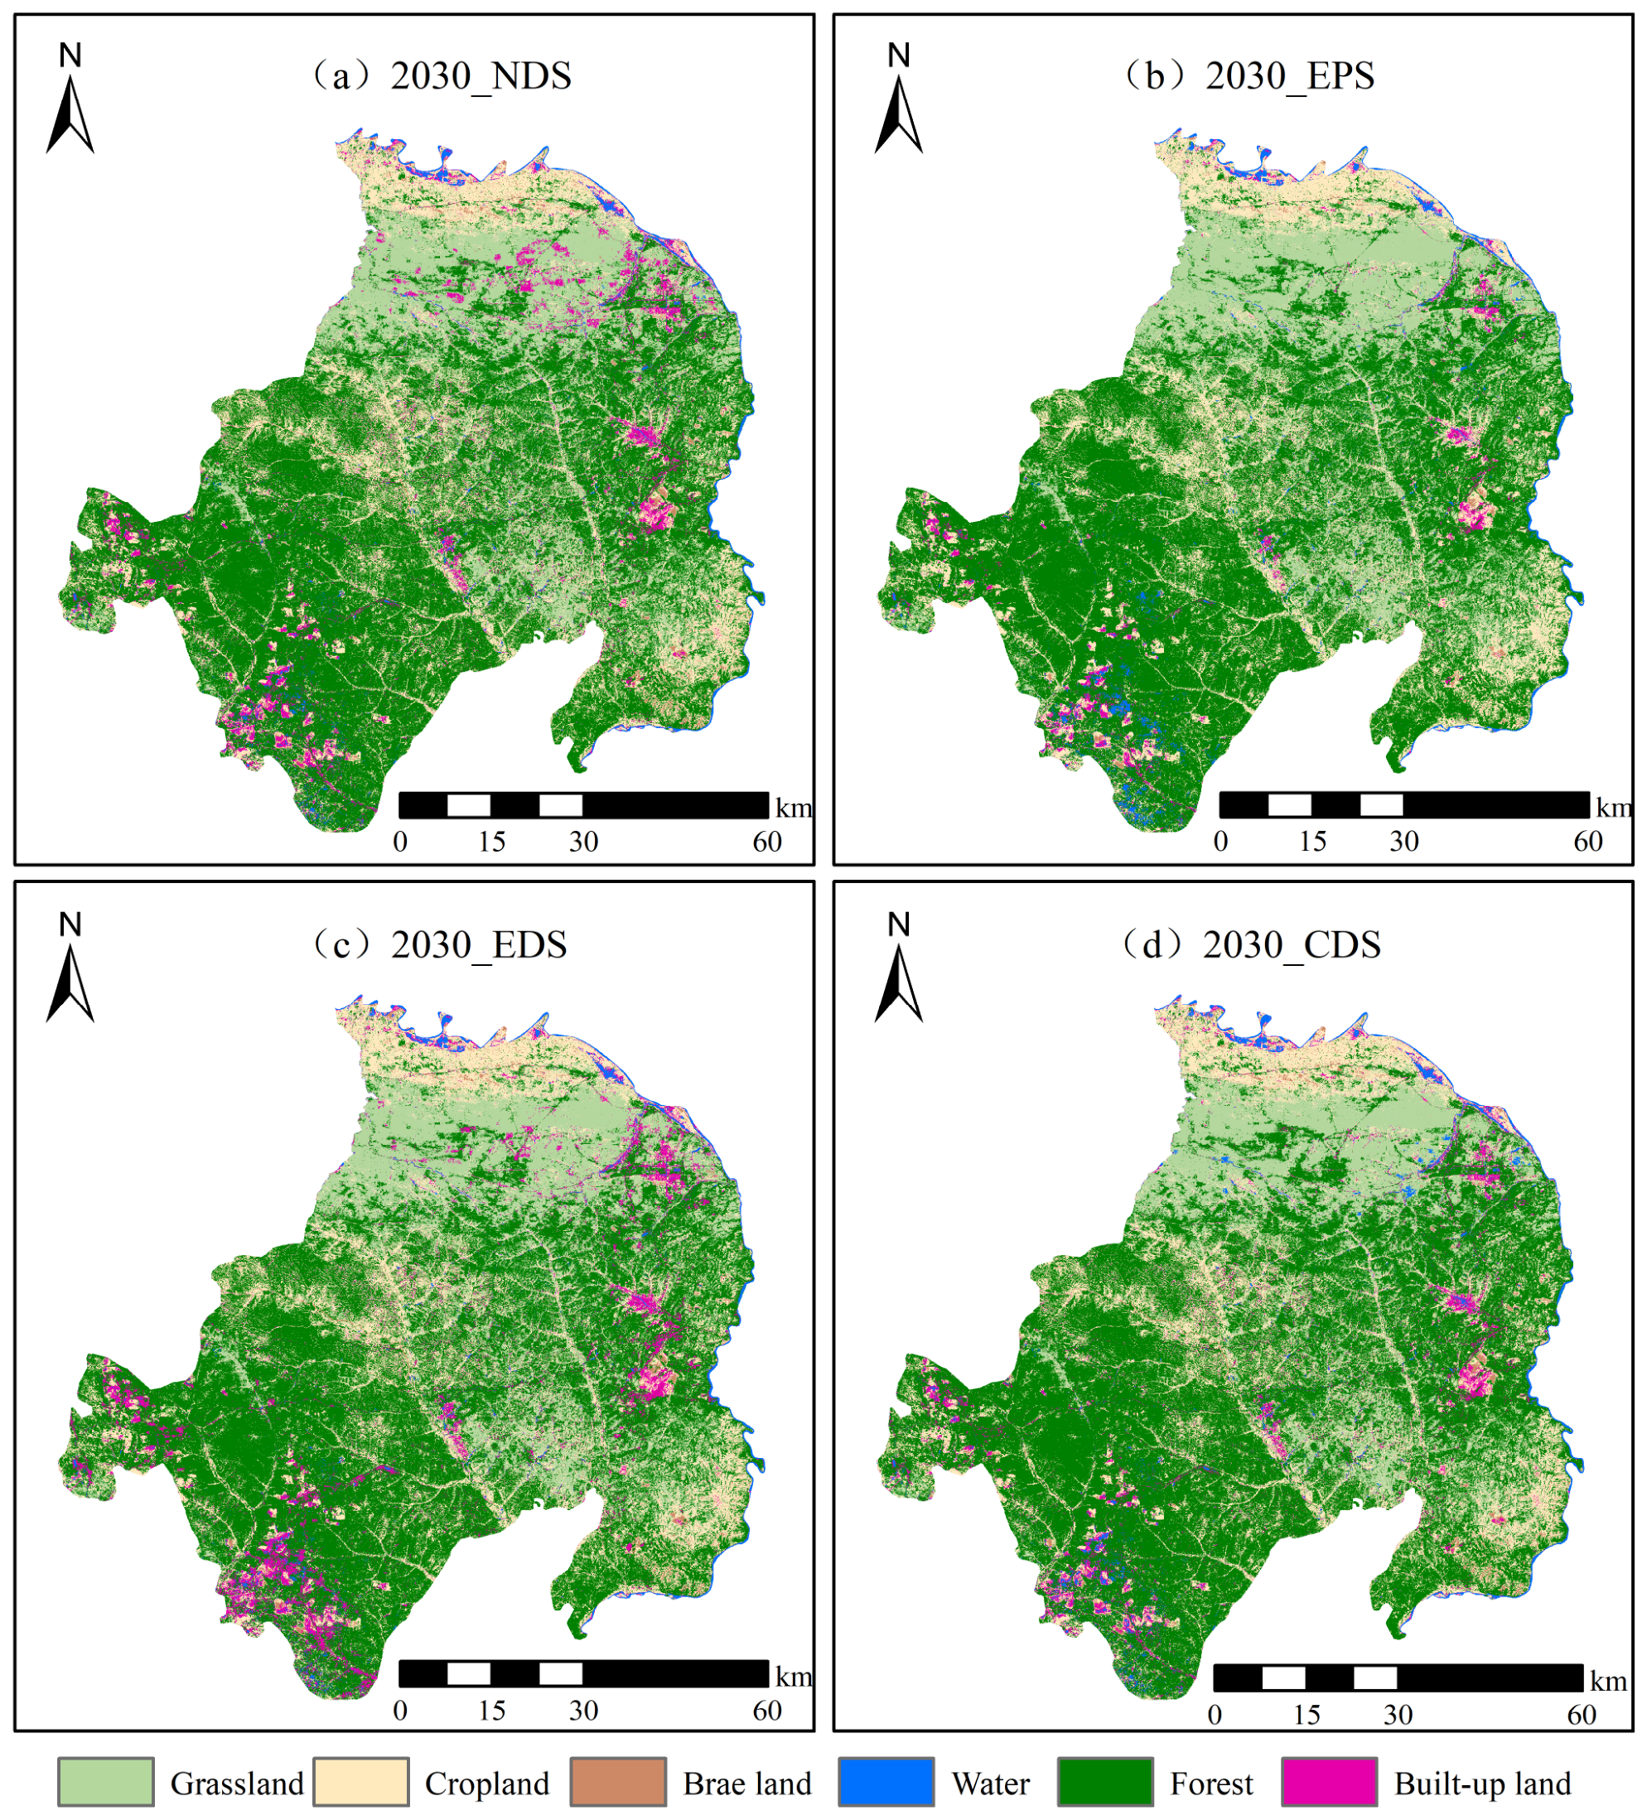
In the prediction of the 2030 spatial patterns of land-use types, the 2020 water areas were used as the restricted conversion zones for the 2030 EPS and CDS, and the 2020 built-up land was used as the restricted conversion zone for the 2030 EDS. The resulting spatial distributions of land-use types for each scenario in 2030 are shown in Figure 10.
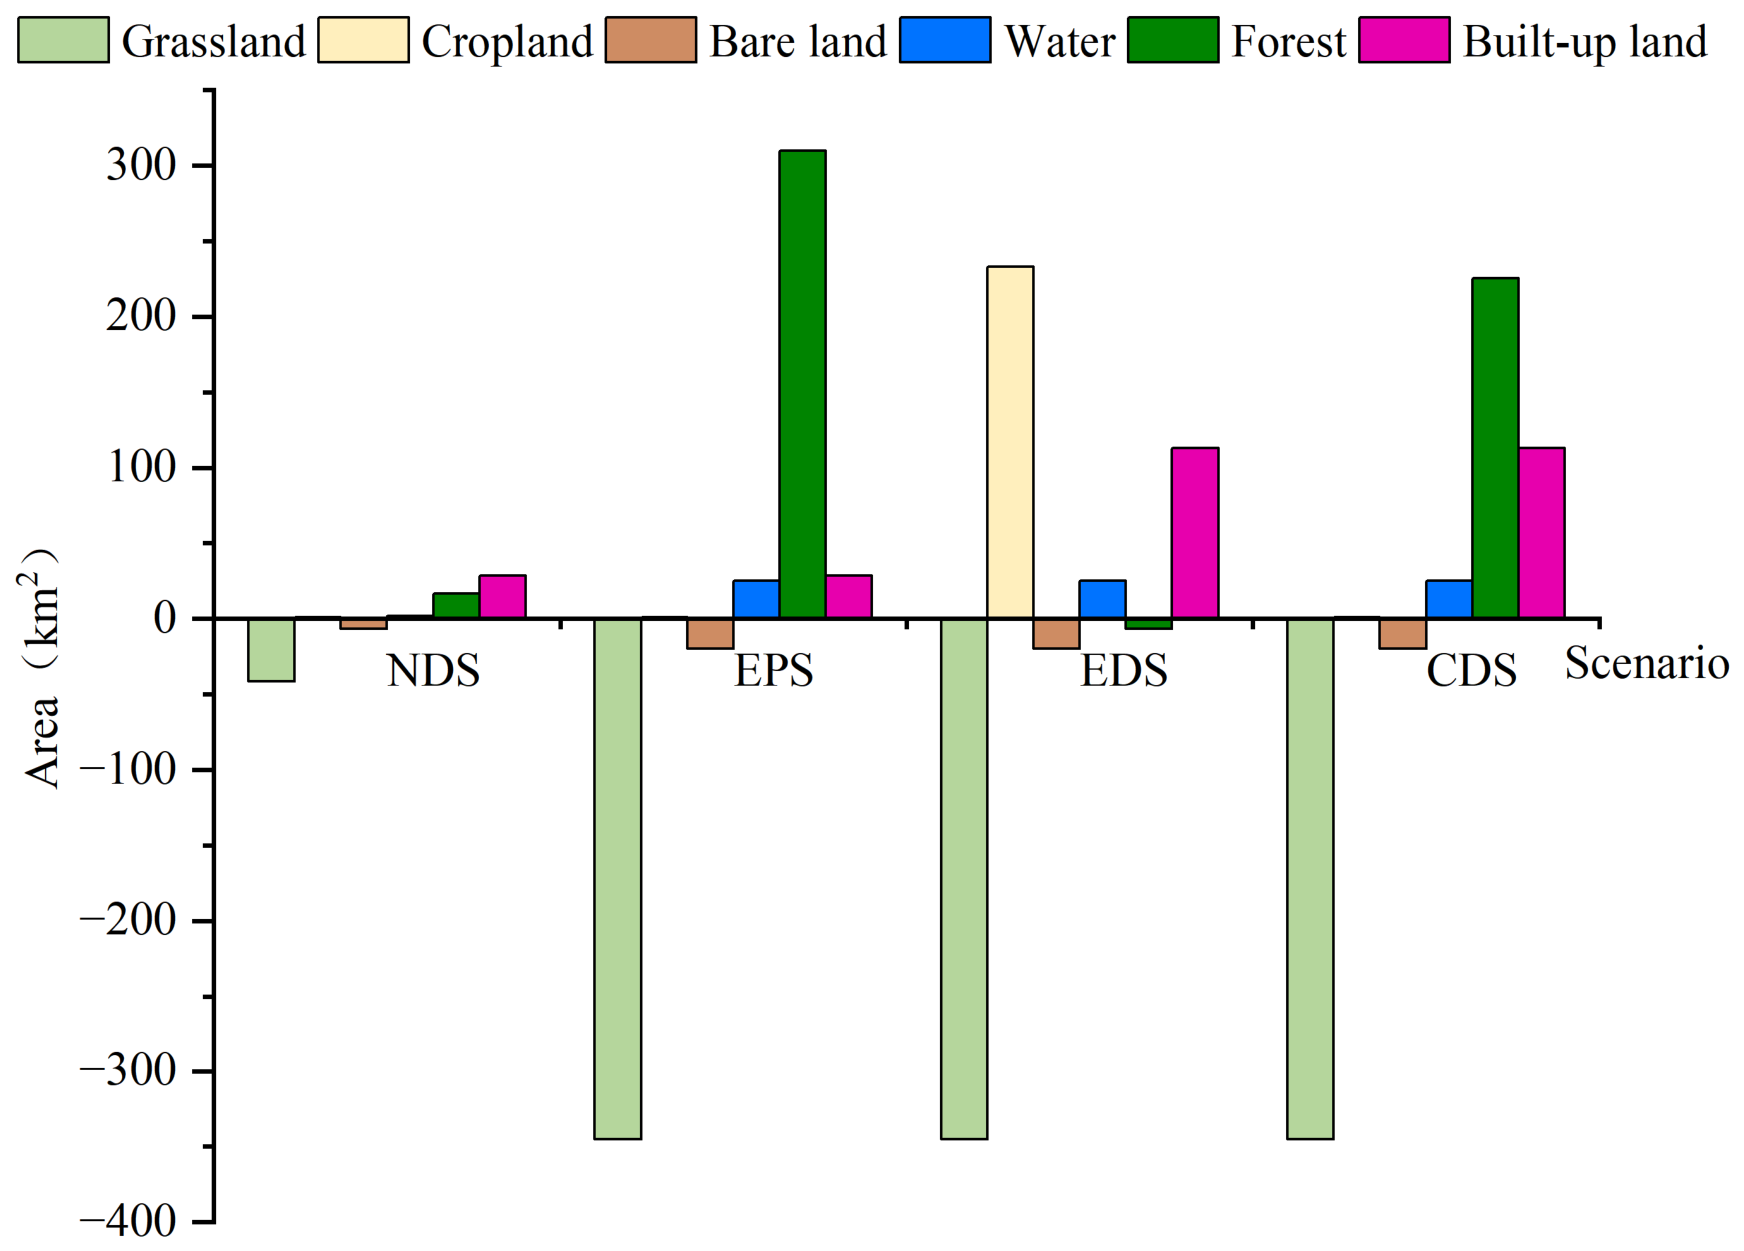
Table 12 shows the changes in land-use types under various scenarios for 2030 compared to the corresponding land categories in 2025; a visualization is shown in Figure 11.
By 2030, the evolution of land use in Jungar Banner will vary significantly across the four scenarios, generally characterized by a continuous decline in grassland and bare land, while water and built-up land continue to expand. Based on the changes in the areas of various land-use types shown in the charts for each scenario, it can be observed that: the NDS follows historical trends, primarily featuring the expansion of built-up land and the degradation of grasslands; the EPS emphasizes ecosystem-based conservation; while strictly maintaining the minimum threshold for cropland, it leads to a sharp increase in forest and water areas and a significant conversion of grasslands through large-scale “returning grazing land to forest”; the EDS, driven by urbanization and high-intensity industrial, mining, and agricultural development, involves drastic restructuring of the land-use pattern, with substantial expansion of built-up land and cropland, leading to severe encroachment on ecological spaces such as forest and grassland; and the CDS, as a comprehensive and coordinated model, effectively balances economic development with ecological conservation. While ensuring high-intensity expansion of urban industrial space, it actively promotes major ecological restoration efforts to achieve significant growth in forest areas. In summary, with the exception of the NDS, the other three scenarios are all accompanied by a substantial reduction in grassland area of comparable magnitude. This fully reflects that in the future, under the combined influence of different macro-policy orientations, high-intensity economic development, and large-scale ecological reconstruction in mining areas, Jungar Banner will undergo dramatic land conversion and a reshaping of its spatial pattern.
The value of ecosystem services can be calculated based on the land area and ecological value coefficient for each scenario. The formula for calculating the value of ecosystem services (ESV) is as follows:
ESV = k = 1 6 A k E k
In the formula: ESV represents the value of regional ecosystem services (yuan); Ak represents the area of the kth land-use type (hm2); and Ek represents the service value per unit area of land category k (yuan/hm2).
Based on the ESV formula, the total ESV under the NDS is approximately 1.21 × 10¹⁰ yuan. Due to the limited growth of high-ESV land types such as forest and water, combined with grassland degradation, its total ecological value is the lowest among the four scenarios. The total ESV under the EPS increases to 1.29 × 10¹⁰ yuan. This is because the substantial expansion of forest and water areas—both of which have extremely high ecological value coefficients—makes it the scenario with the best ecological benefits. The total ESV under the EDS is about 1.24 × 10¹⁰ yuan. Although the expansion of built-up land and cropland boosted economic growth, the loss of forest and grassland caused its ecological value to drop by over 500 million yuan compared with the EPS. The total ESV under the CDS is about 1.27 × 10¹⁰ yuan, ranking second among the four scenarios and exceeding that of the natural development scenario NDS by approximately 623 million yuan.

4. Discussion

Jungar Banner, a typical arid and semi-arid mining city and a nationally important energy base, has experienced land-use changes that profoundly reflect the spatial responses of resource-based regions to the multiple pressures of industrialization, urbanization, and ecological conservation. Drawing on the analytical results of the OPGD model and the NEGM-MOP-PLUS coupled model, this study reveals the evolutionary patterns and driving mechanisms of land-use dynamics in the region over the past fifteen years, while also offering scenario-based guidance for future urban spatial planning.
This study found that land use in Jungar Banner is dominated by grassland and forest; however, the pattern underwent significant changes between 2010 and 2025—cropland, forest, and built-up land continued to expand, while grassland area decreased substantially, with built-up land reaching 395.75 km2 by 2025. This trend is broadly consistent with the findings of related studies conducted both domestically and internationally. [35,36] A closer examination, however, reveals distinct uniqueness in the land-use evolution of Jungar Banner. On one hand, the expansion of built-up land exhibits a strong pattern of “mining–urban spatial decoupling” and “leapfrog” patch growth, primarily due to the spatial dispersion of open-pit mining operations and spoil disposal area construction. On the other hand, the expansion of forest in Jungar Banner differs markedly from the pattern observed in some resource-based cities, [37] where ecological space is simply and completely encroached upon by built-up land. This contrast highlights the intervention effects of national policies—such as the Grain for Green program and ecological protection of the Yellow River Basin—as well as mandatory ecological restoration in mining areas (e.g., revegetation of spoil disposal areas). Together, these forces have shaped a complex spatial landscape in Jungar Banner, characterized by the coexistence of rigid built-up land expansion and human-driven recovery of local ecological land.
One of the most noteworthy findings is the phased transition in driving mechanisms: from natural-factor dominance in 2010 to mining dominance by 2015, and finally to a “mining–precipitation” dual-core structure by 2020. Time-segmented analysis using the OPGD model captures the underlying logic of this transition. Around 2010, regional development remained in an extensive phase, with topography and climate exerting strong constraints on land-use patterns. By 2015, intensified human disturbance—driven by the legacy of the “golden decade” of coal and large-scale open-pit mining—had broken the natural equilibrium and become the primary driving force. In 2020, the weight of precipitation increased notably, forming a dual core with mining influence—a pattern that reflects the ecological characteristics of arid and semi-arid regions. In recent years, large-scale revegetation of spoil areas and reclamation of mined-out zones have been implemented under national “green mining” initiatives and the Yellow River Basin ecological protection strategy. However, in an arid environment, high-intensity ecological restoration is heavily dependent on water resources. The results suggest that natural and anthropogenic factors are not engaged in a simple zero-sum relationship, but have instead evolved into an increasingly strong interactive synergy.
Multi-scenario simulations not only project future spatial patterns but also directly map the associated changes in ecosystem service values (ESV) under different pathways. The results identify the CDS as the optimal orientation for spatial planning in Jungar Banner by 2030, as it performs best in balancing both economic and ecological gains. However, translating the CDS from a “theoretical optimum” to a “policy-feasible solution” warrants the following policy considerations:
(1)
Delineate expansion thresholds and spatial access redlines for built-up land. This study specifies a net increase of 113.17 km2 for built-up land under the CDS, which should serve as a rigid redline for newly added built-up land by 2030. Spatially, new development projects must be confined to existing built-up areas and the eastern industrial park fringe to foster industrial clustering. Meanwhile, construction and mining activities should be strictly prohibited from expanding into the northwestern agro-pastoral zone and the core ecological conservation area, thereby ensuring both the security of coal supply and the development of heavy chemical industries while safeguarding ecological bottom lines.
(2)
Implement mining area restoration based on land-use conversion risk. Given that high-intensity mining around mining area peripheries may trigger soil erosion and cropland degradation, priority conversion zones for cropland to forest should be designated around mining areas. Policy design should integrate local livelihoods and ecological compensation mechanisms to advance mine-pit restoration and cropland-to-forest conversion. Converting low-productivity and degraded slope cropland, along with damaged farmland near mining areas, to forest can not only effectively curb soil erosion but also substantially enhance regional ESV.
(3)
Establish cross-regional grassland ecological compensation and off-site restoration mechanisms. Under the CDS by 2030, despite achieving the best comprehensive outcomes, grassland still faces a net loss of 345 km2—a pragmatic compromise to accommodate necessary economic development and forest restoration. To ensure that grassland loss does not lead to degradation of overall ecological functions, a spatial compensation mechanism based on “off-site balance” should be established. Policy efforts should focus on the targeted restoration and rehabilitation of degraded grassland in non-mining areas in the northern part of the banner. By enhancing the quality and per-unit ESV of grassland in the north, it is possible to offset the grassland loss caused by mining development in the central–southern and central–eastern parts of the banner, thereby achieving a dynamic balance of total ecological value at the county scale.
This study has certain limitations that warrant further investigation. First, the moderate spatial resolution of the remote sensing imagery constrains the accurate detection of small-scale private mining sites, scattered spoil areas, and fine-scale grassland fragmentation. Future work should incorporate high-resolution data (e.g., UAV imagery, Sentinel-2) to improve spatial delineation. Second, the PLUS model’s scenario settings rely largely on historical trends and macro-level policy transition probabilities, without fully incorporating extreme climatic events—such as prolonged droughts or intense rainfall—as abrupt disturbance factors, which introduces uncertainty under climate change. Third, the county-level analysis (at the banner scale) masks considerable spatial heterogeneity among townships in terms of mineral resource endowments, development intensity, and ecological carrying capacity. Future research will attempt to construct a pixel–township–county multi-scale nested modeling framework, coupled with a water resource constraint module, to provide more accurate and targeted spatial planning support for the high-quality transition of mining cities.

5. Conclusions

Based on the interpretation of remote sensing imagery of the mining city of Jungar Banner in an arid region, this study used the OPGD model to analyze the spatiotemporal evolution of land-use change drivers, constructed an optimized NEGM-MOP-PLUS coupled model, and conducted multi-scenario projections of future land-use types for Jungar Banner while considering regional policy planning. The results indicate that:
(1)
Land use in Jungar Banner is dominated by grassland and forest, but the pattern has undergone significant changes in recent years. During the study period, cropland and built-up land continued to expand, with built-up land reaching 395.75 km2 by 2025, while grassland decreased markedly and forest exhibited a growing trend.
(2)
The driving mechanism of land-use change in Jungar Banner has shifted markedly from “natural constraints” to “anthropogenic influences.” In 2010, natural factors dominated; by 2015, mining impacts had taken the lead; and by 2020, a dual-core driving structure of “mining–precipitation” had taken shape.
(3)
By 2030, compared with other scenarios, the CDS scenario, which balances both economic and ecological growth, represents the optimal spatial planning orientation. Future efforts should be based on this scenario, with the following regional planning recommendations aligned with government policies:
  • Establish a built-up land expansion threshold, taking the net increase of 113.17 km2 under the CDS scenario as the redline for newly added built-up land by 2030. New development projects must be confined to existing built-up areas and the eastern industrial park fringe, with strict prohibition of expansion into the northwestern agro-pastoral zone and ecological core areas.
  • Delineate priority conversion zones for cropland and forest. Given that soil erosion around mining areas may lead to cropland degradation, ecological restoration of mine pits and conversion of cropland to forest should be implemented in peripheral mining areas.
  • In response to the net loss of 345 km2 of grassland under the CDS scenario by 2030, targeted restoration and rehabilitation of degraded grassland should be promoted in non-mining areas in the northern part of the banner, ensuring that overall ecological functions are not degraded despite grassland reduction.

Author Contributions

Conceptualization, S.L. and L.C.; methodology, S.L.; software, S.L.; validation, S.L. and L.C.; formal analysis, S.L.; investigation, S.L.; resources, S.L.; data curation, S.L.; writing—original draft preparation, S.L.; writing—review and editing, L.C.; visualization, S.L.; supervision, L.C.; project administration, L.C.; funding acquisition, L.C. All authors have read and agreed to the published version of the manuscript.

Funding

This research received no external funding.

Data Availability Statement

The raw data supporting the conclusions of this article will be made available by the authors on request.

Acknowledgments

During the preparation of this manuscript/study, the authors used Deepl (https://www.deepl.com/zh/translator/L/en/en accessed on 20 August 2026) for the purposes of translation. The authors have reviewed and edited the output and take full responsibility for the content of this publication.

Conflicts of Interest

The authors declare no conflicts of interest.

Abbreviations

The following abbreviations are used in this manuscript:
NDSNatural development scenario
EPSEcological protection scenario
EDSEconomic development scenario
CDSCoordinated development of ecological economy scenario

References

  1. Gao, F.F.; Zhou, J.S.; Jia, R.; Yang, R.D.; Guo, C.Y.; Ren, M.J.; Liu, M. Unraveling the causal cascade from atmospheric disturbances to ecosystem service degradation in open-pit mining areas. Environ. Res. 2026, 302, 124498. [Google Scholar] [CrossRef] [Scilit]
  2. Peng, S.P.; Bi, Y.L. Properties of ecological environment damage and their mechanism of restoration in arid and semi-arid coal mining area of western China. J. China Coal Soc. 2024, 49, 57–64. [Google Scholar] [CrossRef]
  3. Li, J.; Peng, C.Y.; Zhang, C.Y.; Li, Q.S.; Zhang, K.; Liu, J.Q.; Ma, X.S. General statistical rules of vegetation disturbance range by open-pit mining based on a large sample: A case study of Shendong coal base. J. China Coal Soc. 2023, 48, 975–985. [Google Scholar] [CrossRef]
  4. Mi, J.; Yang, Y.; Hou, H.; Zhang, S.; Ding, Z.; Hua, Y. Impacts of Ground Fissures on Soil Properties in an Underground Mining Area on the Loess Plateau, China. Land 2022, 11, 162. [Google Scholar] [CrossRef] [Scilit]
  5. Chen, F.; Zhu, Y.F.; Ma, J.; Dong, W.X.; You, Y.N.; Yang, Y.J. Mechanism, potential and regulation of carbon sequestration and sink enhancement in ecological restoration of mining areas in the Loess Plateau. Coal Sci. Technol. 2023, 51, 502–513. [Google Scholar] [CrossRef]
  6. Li, S.; Wang, H.; Ao, H.; Yuan, X. Ecological Stability Status and Zoning Prediction of the Ordos Plateau: Coupling Analysis of Landscape Ecological Risk and Ecosystem Service Value. Land 2026, 15, 292. [Google Scholar] [CrossRef] [Scilit]
  7. Wei, Z.Y.; Liu, T.; Liang, H.X.; Zhang, Z.; Wang, C.H.; Lv, Y.D.; Sun, J.Z.; Wang, Q. Uncovering the impacts of LUCC on ecological connectivity in suburban open-pit mining concentration areas: A pattern collection of changing relationships between ecological resistance and ecological network elements. Ecol. Model. 2024, 496, 110815. [Google Scholar] [CrossRef] [Scilit]
  8. Lei, S.G.; Xia, J.N.; Bian, Z.F.; Cheng, W. Near-natural ecological restoration in open-pit mine area. J. China Coal Soc. 2024, 49, 2021–2030. [Google Scholar] [CrossRef]
  9. Lei, S.G.; Zhang, J.Y.; Liu, C.; Wang, L.; Jia, Z.W. Collaborative governance model for spoil disposal and gully infill land creation near open-pit coal mines. Coal Sci. Technol. 2025, 53, 374–381. [Google Scholar]
  10. Wang, S.; Zhuang, Y.; Cao, Y.; Yang, K. Ecosystem Service Assessment and Sensitivity Analysis of a Typical Mine–Agriculture–Urban Compound Area in North Shanxi, China. Land 2022, 11, 1378. [Google Scholar] [CrossRef] [Scilit]
  11. Mensah, E.; Liu, X.Y.; Zhang, Z.Y.; Campbell, G. A big data ensemble machine learning framework for robust land use/land cover classification with landsat time-series. Remote Sens. Appl. Soc. Environ. 2026, 42, 102095. [Google Scholar] [CrossRef] [Scilit]
  12. Ma, Z.J.; Li, Y.Y.; Wu, J.; Ouyang, Z.Q.; Wang, M.W.; Qiu, T.X.; Xu, Z.H. Coal fire identification through satellite remote sensing considering the landscapes. Coal Sci. Technol. 2023, 51, 92–103. [Google Scholar] [CrossRef]
  13. Liu, J.Q.; Li, J.; Wang, X.J.; Zhang, C.Y.; Du, M.H.; Ran, W.Y.; Wang, J.Y.; Hu, J.Y. Design and implementation of quantitative remote sensing monitoring and intelligent analysis system for mine ecological environment. Coal Sci. Technol. 2024, 52, 346–358. [Google Scholar] [CrossRef]
  14. Bi, Y.L.; Liu, T. Time series analysis of multi-source data of coordinated evolution of vegetation in open-pit mining area: Taking Jungar Mining Area as an example. Coal Sci. Technol. 2022, 50, 293–302. [Google Scholar]
  15. Lei, S.G.; Chen, H.; Gong, C.G.; Zhang, Z.A.; Wu, Z.H.; Bian, Z.F. Landscape ecology restoration strategies for the coal-electricity base in steppe of China. J. China Coal Soc. 2019, 44, 3662–3669. [Google Scholar] [CrossRef]
  16. Qu, S.J.; Han, L.; Li, L.Z. A Comprehensive Comparative Analysis of Land Use Change Prediction Models Based on Land Types. Environ. Sci. 2026, 47, 1792–1804. [Google Scholar] [CrossRef] [Scilit]
  17. Jiao, Y.H.; Wang, Y.H.; Tu, C.H.; Hou, X.N.; Lyu, C.J.; Fan, X.; Xia, L. Spatiotemporal Evolution and Future of Carbon Storage in Resource-Based Chinese Province: A Case Study from Shanxi Using PLUS-InVEST Model Prediction. Sustainability 2024, 16, 4461. [Google Scholar] [CrossRef] [Scilit]
  18. Xu, L.; Liu, X.; Tong, D.; Liu, Z.; Yin, L.; Zheng, W. Forecasting Urban Land Use Change Based on Cellular Automata and the PLUS Model. Land 2022, 11, 652. [Google Scholar] [CrossRef] [Scilit]
  19. Zhang, Q.; Han, L.; Li, L.Z. Land Use Change and Biodiversity Change in Shaanxi Province Under Multi-Scenario Simulation. Environ. Sci. 2026, 47, 5468–5481. [Google Scholar] [CrossRef]
  20. Zhong, A.Y.; Xu, X.L.; Hu, Z.Q.; Zhou, J.H. Research on carbon stock response and regulation in high groundwater table coal-grain complex area under land use change. Coal Sci. Technol. 2026, 571, 148829. [Google Scholar]
  21. Darius, P.S.H.; Radhakrishnan, G.; Sowjanya, K.K.; Ashok, K. Cellular Automata for Urban Growth Predictions: Review, Simulation, and Prospects. In Sixth Congress on Intelligent Systems, CIS 2025; Lecture Notes in Networks and Systems; Springer: Cham, Switzerland, 2026; Volume 1826, pp. 35–46. [Google Scholar] [CrossRef] [Scilit]
  22. Zhang, Y.; Liao, X.; Sun, D. A Coupled InVEST-PLUS Model for the Spatiotemporal Evolution of Ecosystem Carbon Storage and Multi-Scenario Prediction Analysis. Land 2024, 13, 509. [Google Scholar] [CrossRef] [Scilit]
  23. Zhang, Z.R.; Li, X.M.; Liu, X.Y.; Zhao, K.X. Dynamic simulation and projection of land use change using system dynamics model in the Chinese Tianshan mountainous region, central Asia. Ecol. Model. 2023, 487, 110564. [Google Scholar] [CrossRef] [Scilit]
  24. Lin, Y.; Wang, B.J.; Zhao, L.Y. Land Use Structure Evolution in Resource-Based Cities: Drivers and Multi-Scenario Forecasting-Evidence from China’s Huaihai Economic Zone. Land 2026, 15, 555. [Google Scholar] [CrossRef] [Scilit]
  25. Wu, J.D.; Xie, H.M.; Wu, Q.J.; Zhang, T.; Xian, Y.Y.; Xie, L.H.; Fan, W.; Shu, Y.; Liu, Z.Z. SBAS-InSAR-Based Spa-tiotemporal Characteristics, Driving Factors, and Land Use Conflict Detection of Land Subsidence: A Case Study of Huainan City. Remote Sens. 2026, 18, 837. [Google Scholar] [CrossRef] [Scilit]
  26. Ji, J.Z.; Wang, X.W.; Xue, X.L.; Li, H.B.; Li, G.P.; Cao, Q. Spatio-temporal changes and attribution of vegetation and its influencing factors during 2010 to 2022 in Jungar Banner of Inner Mongolia, China. Ecol. Front. 2025, 45, 1107–1121. [Google Scholar] [CrossRef] [Scilit]
  27. Wang, J.F.; Li, X.H.; Christakos, G.; Liao, Y.L.; Zhang, T.; Gu, X.; Zheng, X.Y. Geographical Detectors-Based Health Risk Assessment and its Application in the Neural Tube Defects Study of the Heshun Region, China. Int. J. Geogr. Inf. Sci. 2010, 24, 107–127. [Google Scholar] [CrossRef] [Scilit]
  28. Song, Y.Z.; Wang, J.F.; Ge, Y.; Xu, C.D. An optimal parameters-based geographical detector model enhances geographic characteristics of explanatory variables for spatial heterogeneity analysis: Cases with different types of spatial data. GISci. Remote Sens. 2020, 57, 593–610. [Google Scholar] [CrossRef] [Scilit]
  29. Ma, B.G.; Liu, X.M. Causal forecasting method and its application based on NEGM(1,1) model. Math. Pract. Theory 2010, 40, 91–95. [Google Scholar]
  30. Li, T.; Mao, Y.; Han, T.; Li, C.K.; Cong, Z. Coupling MOP-RSEI-PLUS Model for Ecological Security Pattern Construction in Resource-Based City. Environ. Sci. Technol. 2026, 49, 235–247. [Google Scholar] [CrossRef]
  31. Lei, Y.H.; Fu, M.C.; Wang, L.; Huang, N.; Guo, Y.Q.; Luo, M. Evolution of Landscape Pattern and Response of Eco-system Service Value in Mining Area. Environ. Pollut. Control 2020, 42, 1123–1127+1131. [Google Scholar] [CrossRef]
  32. Pontius, R.G., Jr.; Boersma, W.; Castella, J.-C.; Clarke, K.; de Nijs, T.; Dietzel, C.; Duan, Z.; Fotsing, E.; Goldstein, N.; Kok, K.; et al. Comparing the Input, Output, and Validation Maps for Several Models of Land Change. Ann. Reg. Sci. 2008, 42, 11–37. [Google Scholar] [CrossRef] [Scilit]
  33. Xie, G.D.; Zhen, L.; Lu, C.X.; Xiao, Y.; Chen, C. Expert Knowledge Based Valuation Method of Ecosystem Services in China. J. Nat. Resour. 2008, 23, 911–919. [Google Scholar]
  34. Yu, Z.L.; Zhao, M.S.; Gao, Y.F.; Wang, T.; Zhao, Z.D.; Wang, S.H. Spatio-temporal Evolution and Prediction of Carbon Storage in Huaibei City Based on InVEST-PLUS Model. Environ. Sci. 2024, 45, 3270–3283. [Google Scholar] [CrossRef] [Scilit]
  35. Chen, Y.; Chang, J.; Li, Z.; Ming, L.; Li, C.; Li, C. Coupling Coordination and Spatiotemporal Analysis of Urban Compactness and Land-Use Efficiency in Resource-Based Areas: A Case Study of Shanxi Province, China. Land 2023, 12, 1658. [Google Scholar] [CrossRef] [Scilit]
  36. Wu, Z.H.; Lu, Q.Q.; Lei, S.G.; Yan, Q.W. Study on Landscape Ecological Classification and Landscape Types Evolution: A Case Study of a Mining City in Semi Arid Steppe. Sustainability 2021, 13, 9541. [Google Scholar] [CrossRef] [Scilit]
  37. Pericak, A.A.; Thomas, C.J.; Kroodsma, D.A.; Wasson, M.F.; Ross, M.R.V.; Clinton, N.E.; Campagna, D.J.; Frank-lin, Y.; Bernhardt, E.S.; Amos, J.F. Mapping the Yearly Extent of Surface Coal Mining in Central Appalachia Using Landsat and Google Earth Engine. PLoS ONE 2018, 13, e0197758. [Google Scholar] [CrossRef] [Scilit]
Figure 1. Schematic map of the administrative boundaries of Jungar Banner.
Land 15 01563 g001
Figure 2. Remote sensing images of Jungar Banner, 2010–2025.
Land 15 01563 g002
Figure 3. Flowchart of the PLUS model.
Land 15 01563 g003
Figure 4. Distribution patterns of land-use types in Jungar Banner, 2010–2015.
Land 15 01563 g004
Figure 5. String plot of land-use type changes in Jungar Banner, 2010–2025 (km2).
Land 15 01563 g005
Figure 6. Extent of the core disturbance zone in the Jungar Mining Area.
Land 15 01563 g006
Figure 7. Single-factor exploration plot (left) and two-factor interaction exploration plot (right) for 2010.
Land 15 01563 g007
Figure 8. Single-factor exploration plot (left) and two-factor interaction exploration plot (right) for 2015.
Land 15 01563 g008
Figure 9. Single-factor exploration plot (left) and two-factor interaction exploration plot (right) for 2020.
Land 15 01563 g009
Figure 10. Spatial distribution of land-use types in Jungar Banner under various scenarios for 2030.
Land 15 01563 g010
Figure 11. Map of changes in areas of land-use types in Jungar Banner in 2030 (vs. 2025).
Land 15 01563 g011
Table 1. Table of Data Types and Data Sources.
Data TypesData NameData Sources
Raster DataDigital Products from Remote Sensing Satellite Imageryhttps://earthengine.google.com/ (accessed on 21 March 2026)
ASTER GDEM 30 m Resolution Digital Elevation Datahttps://www.gscloud.cn/ (accessed on 21 March 2026)
Slope of the Study AreaBased on DEM data
GDPhttps://www.resdc.cn/ (accessed on 10 April 2026)
Population Densityhttps://www.resdc.cn/ (accessed on 10 April 2026)
Annual Average Precipitation in China at 1 km Resolutionhttps://www.geodata.cn/ (accessed on 12 April 2026)
Annual Average Temperature in China at 1 km Resolutionhttps://www.geodata.cn/ (accessed on 12 April 2026)
Nighttime Lighting Datahttps://www.resdc.cn/ (accessed on 10 April 2026)
NDVIhttps://www.resdc.cn/ (accessed on 10 April 2026)
Vector DataAdministrative Divisions of the Banners and Districts of Ordos Cityhttps://www.tianditu.gov.cn/ (accessed on 12 October 2025)
Global Coal Mine Regional Datahttps://zenodo.org/records/17085099 (accessed on 14 April 2026)
Boundaries of Coal Mines in the Jungar Mining AreaSource (Environmental Impact Assessment for the Jungar Mining Area)
Water Area Data for Jungar Bannerhttps://www.openstreetmap.org/ (accessed on 10 April 2026)
Traffic and Road Datahttps://www.openstreetmap.org/ (accessed on 10 April 2026)
Text DataOrdos City Statistical YearbookOrdos Bureau of Statistics
Statistical Bulletin on National Economic and Social Development in Jungar BannerOfficial Website of the Jungar People’s Government
Geographic Data for Jungar Banner and the Current Status of Selected Coal MinesSource (Environmental Impact Assessment for the Jungar Mining Area)
Table 2. Interactions among Geodetical Detectors.
CriterionInteraction Type
q ( X 1 X 2 )   <   min ( q X 1 , q X 2 ) Nonlinear weakening
min ( q X 1 , q X 2 )   <   q ( X 1 X 2 )   <   max ( q X 1 , q X 2 ) Univariate nonlinear weakening
q ( X 1 X 2 )   >   max ( q X 1 , q X 2 ) Bivariate enhancement
q X 1 X 2   >   q X 1 + q X 2 Nonlinear enhancement
q X 1 X 2 = q X 1 + q X 2 X1 and X2 are independent
Table 3. Accuracy assessment metrics for land-use classification in Jungar Banner (2010–2025).
Land-Use Type2010201520202025
PA (%)UA (%)PA (%)UA (%)PA (%)UA (%)PA (%)UA (%)
Grassland96.0592.8697.9798.3996.6699.3590.0199.32
Cropland59.7591.2675.1186.7284.4572.8585.8465.84
Bare land49.261.9493.0196.4479.6280.6866.5685.84
Water72.9993.5698.1999.7485.8199.8552.4591.66
Forest90.186.4697.0489.1292.0983.7597.4886.85
Built-up land50.8979.7377.0870.9286.8294.5394.5492.99
OA (%)90.3695.4793.7389.01
Kappa0.81010.90690.87860.8184
Table 4. Land-use types and areas (km2) in Junggar Banner, 2010–2025.
Land-Use Types2010201520202025
Grassland3280.212597.621650.311560
Cropland284.12570.271367.91439.01
Bare land63.81156.36154.5972.38
Water164.88144.92118.77115.41
Forest3326.733802.553971.63977.33
Built-up land240.13288.16296.71395.75
Total7559.887559.887559.887559.88
Table 5. Land-use dynamics in Jungar Banner (a−1).
Land-Use Type2010–20152015–20202020–20252010–2025
Grassland−5.07%−7.29%−1.09%−3.68%
Cropland20.14%27.97%1.04%27.10%
Bare land29.01%−0.23%−10.64%0.90%
Water−2.42%−3.61%−0.57%−2.00%
Forest2.86%0.89%0.03%1.30%
Built-up land4.00%0.59%6.68%4.32%
Table 6. Comprehensive land-use dynamics in Jungar Banner (a−1).
Year2010–20152015–20202020–20252010–2025
Comprehensive Dynamic degree4.73%3.83%3.68%1.80%
Table 7. Landscape metrics within the core disturbance zone of the mining area (2010–2025).
YearNP (Number)PD (Number/hm2)LPI (%)CONTAG (%)SPLITSHDISHEIAI (%)
201056,3590.430038.79348.76945.70631.06340.593571.7845
201574,3720.567530.369643.60867.65861.16380.649569.4231
202071,2270.543548.27242.90494.27631.21240.676672.2263
202579,5320.606858.454545.42132.92081.15270.643373.0769
Table 8. Variance inflation factors for driving factors (2020).
VariablesVIF
X11.513003
X22.136592
X31.294514
X44.028806
X56.583929
X61.217958
X72.934925
X83.209842
X96.934200
X104.342076
X111.130185
Table 9. Land-use types and areas under the NDS for Jungar Banner in 2030 (km2).
ScenarioGrasslandCroplandBare LandWaterForestBuilt-Up Land
NDS1518.751440.0465.55117.283994.16424.10
Table 10. Ecological and economic value coefficients by land-use type in Jungar Banner for 2030 (10,000 yuan/km2).
Land-Use TypeGrasslandCroplandBare LandWaterForestBuilt-Up Land
Ecological Value Coefficient69.0054.572.721709.39207.120.00
Economic Value Coefficient128.10206.480.0068.3910.6851,225.38
Table 11. Area of various land-use types in Jungar Banner under the EPS and EDS for 2030 (km2).
ScenarioGrasslandCroplandBare LandWaterForestBuilt-Up Land
EPS1215.001440.0452.44140.744287.28424.38
EDS1215.001672.0852.44140.743970.70508.92
CDS1215.001440.0452.44140.744202.74508.92
Table 12. Projected changes in land-use area (km2) from 2025 to 2030 under different scenarios in Jungar Banner.
ScenarioGrasslandCroplandBare LandWaterForestBuilt-Up Land
NDS−41.251.03−6.831.8716.8328.35
EPS−3451.03−19.9425.33309.9528.63
EDS−345233.07−19.9425.33−6.63113.17
CDS−3451.03−19.9425.33225.41113.17
(Note: All values represent the difference (2030 projection − 2025 baseline). Positive values indicate expansion, and negative values indicate reduction).
Disclaimer/Publisher’s Note: The statements, opinions and data contained in all publications are solely those of the individual author(s) and contributor(s) and not of MDPI and/or the editor(s). MDPI and/or the editor(s) disclaim responsibility for any injury to people or property resulting from any ideas, methods, instructions or products referred to in the content.