Article

Where to Act in the Landscape to Minimize Sedimentation and Contamination of the River System: A Multi-Objective Heuristic Approach


1
Center for Computational Mathematics Studies, University of Informatics Sciences, Havana 19370, Cuba
2
Department of Earth and Environmental Sciences, KU Leuven, 3001 Leuven, Belgium
3
International Atomic Energy Agency, 1220 Vienna, Austria
4
Center for Research in Radiation, Isotopes and Earth System Sciences, University of Tsukuba, Tsukuba 305-8572, Japan
5
Vice-Rectorate for Research and Postgraduate Studies, University of Informatics Sciences, Havana 19370, Cuba
6
Department of Computer Science, KU Leuven, 3001 Leuven, Belgium
*
Author to whom correspondence should be addressed.
Land 2026, 15(9), 1557; https://doi.org/10.3390/land15091557
Submission received: 3 July 2026 / Revised: 21 August 2026 / Accepted: 21 August 2026 / Published: 25 August 2026

Abstract

Afforestation can mitigate the export of water, sediment, and dissolved or adsorbed contaminants to river systems, but identifying effective intervention sites requires accounting for multiple flow-related criteria and their spatial interactions. This paper presents a multi-criteria heuristic approach that extends CAMF (Cellular Automata-based Heuristic for Minimizing Flow), originally designed to select cells from a rasterized landscape for interventions that minimize sediment yield at target sites. We integrated the Distance-to-Ideal-Point (DIST2IP) algorithm in CAMF, enabling the selection of cells where intervention can minimize two or more flows simultaneously. The multi-criteria CAMF was applied ex post to the radioactively contaminated Niida river catchment, Fukushima Prefecture, Japan, to identify 1000 cells within decontaminated zones where the then immediate afforestation would have maximally reduced both sediment and residual 137Cs export. The 1000 best cells selected by DIST2IP, representing 4% of the decontaminated cells, would have reduced sediment export by 22% and 137Cs export by 6%. Selected cells are within the union of cells identified by the two single-criteria optimizations and are predominantly close to water bodies, confirming that blocking flow paths before they connect to the river system is most effective.

1. Introduction

After the Fukushima Daiichi Nuclear Power Plant accident on 11 March 2011, more than 2.7 PBq of fallout Radiocaesium (137Cs, RC) was deposited on the landscape [1]. The 137Cs, the most critical radionuclide for long-term exposure, caused widespread and persistent contamination across the Fukushima Prefecture. 137Cs binds strongly to soil particles and is transported as contaminated sediment, which causes additional exposure to living organisms in downhill and downstream areas [2]. Moreover, the use of river water for irrigation and other purposes can further spread contamination [2]. The local government initiated a decontamination program that significantly reduced surface contamination, but this increased soil erosion and transport of low-contaminated sediment into river systems [3].
The behavior of sediment and 137Cs in soil and river networks in the Fukushima Prefecture has been widely studied [4,5], indicating that substantial amounts of particulate 137Cs leave the catchments and enter the Pacific Ocean [2,6,7,8]. Between 2013 and early 2017, approximately 12% of the land in the Niida watershed underwent decontamination through topsoil removal. Given the extent and duration of these interventions, Bin et al. [3] identified the Niida river basin as particularly suitable for evaluating the long-term impacts of decontamination on the dynamics of suspended sediment and particulate 137Cs in river systems. They demonstrated a clear link between upstream decontamination works and the increased suspended sediment loads in the rivers [3]. As a result, suspended sediment loads in the river increased by up to 237% in 2016 compared to pre-remediation levels in 2013 [9].
The loss of vegetation cover explains the increase in erosion and suspended sediment in the rivers. This suggests that rapid re-vegetation, e.g., through afforestation, of decontaminated sites could have helped mitigate the magnitude and persistence of contaminated sediment losses.
Herewith, afforestation is defined as a silvicultural activity that is adapted, in terms of tree species, planting density and other management, to the local environmental conditions and that results in the rapid development of a protective soil cover that significantly reduces the erosion potential compared to the original land cover type. In afforested regions, the amount of sediment production and transport is smaller than in regions with other land cover, such as agriculture.
Several mathematical models have been proposed to model sediment production, transport and accumulation [10,11,12,13]. Since the underlying data, such as elevation and land use, are often represented as discrete data (raster maps), discrete models are often used.
Given the scale of the necessary interventions and the ineffectiveness of re-vegetation in areas that contribute little sediment to the river channels, mitigation efforts must be spatially optimized to maximize impact [14]. Indeed, the intervention effectiveness heavily depends on the spatial context, and the efforts must explicitly account for spatial interaction (also known as spatial inter-dependency) between sites. In this context, spatial interaction refers to the phenomenon that intervention at a site alters the state and behavior of downstream sites, influencing the effectiveness of subsequent interventions. Hence, spatial optimization methods should be used to determine the sites where intervention, e.g., afforestation, should take place to minimize the accumulation of both sediment and 137Cs at target sites, e.g., at a river outlet.
Several optimization methods have been proposed to identify optimal sites for afforestation within a river catchment while reducing sediment export at target locations, such as the catchment outlet, explicitly accounting for spatial interaction, and considering a budget constraint. Vanegas et al. [15] presented an integer programming formulation that used a simple flow-routing model and a convex piecewise linear transport function, although its implementation in Lingo proved effective only for very small datasets. Therefore, Vanegas [16] proposed the Cellular Automata-based Heuristic for Minimizing Flow (CAMF), which integrates a sediment production and transportation model with an iterative approach based on a steepest ascent hill-climbing algorithm. A genetic-algorithm-based approach was proposed by Domingues et al. [17]; however, such approaches generally require large populations and many iterations, leading to high computational costs and providing no guarantee of reaching the global optimum.
CAMF has been applied and extended in several studies [18]. Recently, an accelerated version of CAMF was introduced that incorporates modifications to the steepest ascent hill-climbing approach with negligible effects on the accuracy of the results [19]. In addition to afforestation, CAMF has been applied in the context of deforestation to identify critical areas where deforestation would significantly increase sediment production, as well as areas where deforestation would have minimal impact [20].
For the dual-objective optimization of afforestation interventions in catchments contaminated with 137Cs, we extended in this paper the CAMF heuristic to simultaneously minimize sediment export and 137Cs export while preserving the spatially explicit nature of CAMF. We also extended the sediment production, transport and accumulation models to account for radionuclide transport processes. As a case study, we considered the Niida catchment in the Fukushima region of Japan, to select sites for afforestation that have the greatest potential to simultaneously reduce the loss of sediment and spatially variable associated 137Cs at the outlet of the river.
The paper is organized as follows. Section 2 recalls the CAMF method, including the sediment production and transport model, the calculation of sediment accumulation, and emphasizing the 137Cs concentration. It also describes the modifications implemented in CAMF to address the dual objectives of reducing both sediment and 137Cs yield, and presents the case study focused on the Niida river catchment in the Fukushima region. Section 3 and Section 4 describe the results and provide a discussion of the main findings, respectively. Finally, Section 5 concludes the paper.

2. Materials and Methods

This section presents the models and iterative optimization procedures used in CAMF. The Revised Universal Soil Loss Equation (RUSLE) is used for sediment production, while a Multiple Flow Direction (MFD) model and the Transport Capacity (TC) approach are used for sediment transport and accumulation. A model for the accumulation and transport of 137Cs is presented. We then describe the iterative optimization heuristic in CAMF for identifying optimal sites for intervention, first for single-objective optimization and then for multi-objective optimization, by integrating the Distance to the Ideal Point (DIST2IP) concept into the iterative optimization process, considering sediment and 137Cs export. Since the increase in sediment loss in the Niida river catchment was caused by the removal of the protective vegetation cover and topsoil, the intervention considered is the rapid afforestation of decontaminated zones.

2.1. Sediment Production, Transport and Accumulation

The CAMF method uses a discrete raster representation of elevation, land use, sediment production, and sediment transport in the region. For this study, per-cell 137Cs deposition and topsoil concentration after decontamination are also considered as part of the raster representation.
The sediment production model used is aligned with RUSLE [11] and the sediment transport with WATEM/SEDEM [13]. The mean annual sediment production for each cell of the raster-based representation is calculated with RUSLE as follows:
α = R × K × L S × C × P
with α the mean annual soil loss ( ton ha 1 yr 1 ), R the rainfall erosivity factor ( MJ mm ha 1 h 1 yr 1 ), K the soil erodibility factor ( ton h MJ 1 mm 1 ), L S the two-dimensional slope and slope length factor (−), C the cover management factor (−), and P the erosion control practice factor (−).
The sediment transport from a cell to its neighboring down-slope cell(s) is modeled using the TC approach proposed in Verstraeten et al. [14] as follows:
τ = K t c × R × K × ( L S 4.12 × S g 0.8 )
where τ is the transport capacity ( ton ha 1 yr 1 ); K t c is the transport capacity coefficient; R, K, and L S are as is in Equation (1); S g is the local slope (-).
The empirical coefficient K t c [m] represents the sediment transmissivity of a landscape element and depends on land cover and vegetation conditions. Two transport-capacity coefficients, K t c , low and K t c , high , are defined according to the WaTEM/SEDEM formulation [21]. Which coefficient is used in Equation (2) depends on the value of the RUSLE C-factor: cells with a C-factor K t c , limit are assigned K t c , low , while the other cells are assigned K t c , high . In this study, the threshold K t c , limit is set to 0.01 following Deproost et al. [22].
When a cell is afforested, its land use changes from the original state to forest land. As a result, the C-factor decreases and the transport capacity coefficient K t c may decrease from K t c , h i g h to K t c , l o w . Thus, sediment flow in each cell i is simulated using the locally produced sediment, α i k , and the transport capacity, τ i k . Since the land use of cells can change, the superscript k indicates whether the cell is not yet afforested ( k = 1 ) or whether the cell is afforested ( k = 2 ). Since the sediment production after afforestation, α i 2 , is calculated based on the updated C-factor value, α i 2 < α i 1 , and the sediment transport is calculated using the updated K t c .
In this case study, the Fractional Deterministic Eight-Neighbor (FD8) variant of the MFD model is used. In this approach, cell connectivity along the flow pathway is represented as an acyclic graph, and a topological sorting algorithm determines the order in which cells are traversed to compute sediment transport [23].
For each cell i, the Sediment Accumulation, SA i , and the outgoing sediment, S O i , are calculated by traversing the acyclic graph. To this end, the total amount of sediment present in the cell (incoming sediment + produced sediment, α i k ) is compared to the transport capacity τ i k , which leads to one of two possible outcomes:
  • SA i is smaller than the transport capacity τ i k . In this case, the total amount of sediment in the cell, SA i , is transported to down-slope cell(s).
  • SA i is larger than the transport capacity τ i k . In this case, the outgoing sediment from cell i, is equal to τ i k .
Therefore,
SO i = SA i , if SA i τ i k τ i k , if SA i > τ i k
137Cs concentration in sediment
We assume that the amount of spatially variable 137Cs deposition was available in raster representation; see [24] for the data for the Niida river catchment. To relate 137Cs deposition to concentration in sediment, a solid entrainment coefficient for the particular land use type, denoted by S c , is used [25]. Hence, CC i , the 137Cs concentration in sediment for cell i, is estimated as
CC i = S c × D c s 137 , i
where S c is the solid entrainment coefficient for the particular land use type ( m 2 kg 1 ), and D c s 137 , i is the initial deposition of 137Cs at cell i in the catchment ( Bq m 2 ) [24].
In line with the principles of sediment movement, 137Cs moves with soil particles. Therefore, the amount of 137Cs leaving cell i, and ultimately the catchment, is related to the amount of sediment accumulated in the cell, SA i , the concentration of 137Cs in the sediment, CC i , and the transport capacity in the cell, τ i k .
The 137Cs movement is simplified by assuming that the 137Cs concentration in the sediment in a cell is homogeneous, and when it reaches another cell it will be mixed (becomes homogeneous again) with the sediment in that cell. Thus, the amount of 137Cs transported from cell j to cell i, is equal to
D j i × CC j
where D j i is the amount of sediment flowing from cell j to cell i.
Once the sediment accumulated in cell i, SA i , has been computed, the corresponding accumulated 137Cs activity in the mixed sediment is computed by mass balance as
CA i = α i k × CC i 0 + j U i D j i × CC j
where U i is the set of upstream cells delivering sediment to cell i, CC j is the 137Cs concentration in the sediment delivered from cell j, α i k is the sediment locally produced in cell i, and CC i 0 is the 137Cs concentration in the locally produced sediment. The homogeneous 137Cs concentration in the sediment accumulated in cell i is then obtained as
CC i = CA i SA i , if SA i > 0 , 0 , otherwise .
Modeling and simulation of sediment production and transport and the resulting migration of 137Cs are also discussed by Kitamura et al. [26]. Sediment production is modeled as above, but a Single Flow Direction (SFD) model is used for sediment transport. The distribution of 137Cs in the soil is assumed to decline with depth, but details are not given in [26]. However, optimization, as discussed below, is not considered in [26].

2.2. The Iterative Optimization Procedure in CAMF

In CAMF, only a subset of cells, called candidate cells, can be afforested. These are typically cells with high erosion potential, such as agricultural or bare land. In this study, candidate cells correspond to decontaminated areas.
The iterative CAMF procedure selects a user-defined number of candidate cells for afforestation, which acts as a constraint. We first describe the constrained single-objective optimization procedure used to maximize sediment yield reduction at target locations in the catchment (e.g., the outlet). We then explain how this procedure is modified to maximize 137Cs yield reduction. Finally, we describe how the constrained multi-objective optimization procedure, based on DIST2IP, is integrated into CAMF.

2.2.1. Single-Objective Optimization Procedure

The optimization procedure in CAMF iteratively selects cells based on their potential effect on sediment yield reduction, SYR , at target locations in the catchment (e.g., the outlet). In each iteration t, the following steps are performed to select cells for afforestation [23]:
  • For each candidate cell i, its afforestation is considered independently, by changing the local sediment production α i 1 to α i 2 , and the local sediment transport capacity τ i 1 to τ i 2 . The sediment production and transport model is integrated to evaluate the corresponding sediment loss at the target cell(s), called the sediment yield, SY . Afforestation of the cell reduces the amount of sediment delivered to its down-slope neighbors, and this reduction is propagated from the cell down to the cells on the pathway. The resulting sediment yield, SY i t , is compared with SY 0 , the initial sediment yield before any cell is afforested, and the corresponding sediment yield reduction in iteration t, SYR i t , is given by
    SYR i t = SY 0 SY i t
  • The cells are then ranked in descending order based on their SYR values.
  • The cell with the highest SYR value is added to the set of selected cells for afforestation.
This procedure is repeated until a fixed number of candidate cells is selected for afforestation, or a cumulative SYR is achieved. This iterative process allows for explicit accounting of the spatial interaction between the cells.
To also consider the amount of 137Cs concentration in sediment, we introduce the formulations described in Section 2.1 to compute the cumulative 137Cs in sediment. Step 1 of the above procedure is extended as follows. The 137Cs yield at target cell(s), CY , and the 137Cs yield reduction, CYR , due to the tentatively afforestation of cell in iteration t, are computed as follows, assuming that CY 0 is the CY at the initial situation, and CCY is the 137Cs concentration at the target cell(s).
CY i t = SY i t × CCY i t
CYR i t = CY 0 CY i t
To maximize 137Cs yield reduction at the target locations, cells are selected based on their potential effect on 137Cs yield reduction, by replacing SYR by CYR in steps 2 and 3. The original algorithm presented by Castillo-Reyes et al. [23], modified to compute both the sediment yield, SY , and the 137Cs yield, CY , is given as Algorithm A1 in Appendix A.

2.2.2. Multi-Objective Optimization

To adapt CAMF to simultaneously minimize SY and CY , and thus maximize SYR and CYR , we propose a dual-objective approach for iteratively selecting afforestation sites, by using the DIST2IP concept in a novel way to identify sites that provide the best joint performance for both SYR and CYR .
The DIST2IP concept is often used in Multi-Criteria Decision-Making (MCDM) [27,28,29] to select one solution out of a set of alternative solutions, based on the distance of these solutions from a theoretical Ideal Point (IP), a vector with the best possible values for each of the considered criteria. It is also related to the Technique for Order Preference by Similarity to Ideal Solution (TOPSIS) [30,31]. The concept is well established in environmental and land management studies with multiple dimensions, including water-resource sustainability [32], contaminated groundwater management [33], and regional land-use optimization [34]. In particular, Abrams et al. [29] reviewed studies published between 1995 and 2020 on the use of MCDM methods to select remediation techniques for contaminated soils and found that ideal-point methods were applied in 5 of the 47 cases examined. However, in this study, the DIST2IP concept was used in each iteration step of the CAMF heuristic, therefore combining, in a novel way, multi-objective compromise assessment with the cell-by-cell selection in CAMF, taking into account the spatial interaction.
In each iteration, candidate cells are represented by their normalized SYR and CYR values, and their distance from the IP, represented by the normalized maximal SYR and CYR values, is used to determine which cell is selected for afforestation. The following steps are considered:
  • Normalization of the data. Since the reductions in sediment and 137Cs yields are on different scales, both values are normalized to the range [ 0 , 1 ] , where 0 represents the worst value and 1 the best. For each cell i:
    x i , syr = SYR i t SYR min t SYR max t SYR min t
    x i , cyr = CYR i t CYR min t CYR max t CYR min t
    where SYR min t and SYR max t are the minimum and maximum values obtained due to afforesting all cells independently in iteration t, and similarly for CYR min t and CYR max t .
  • Definition of the IP. The IP is a vector whose coordinates are given by the optimal values for the different criteria, i.e., maximum SYR , and maximum CYR . After normalization, IP becomes
    IP = ( 1 , 1 )
  • Combine the values by calculating the weighted Euclidean Distance to the IP. For each cell i, its DIST2IP is computed as
    DIST 2 IP i = w syr ( 1 x i , syr ) 2 + w cyr ( 1 x i , cyr ) 2 , w syr + w cyr = 1 .
    where w syr and w cyr are non-negative weights assigned to the SYR and CYR objectives, respectively. In this study we used equal weights, giving both objectives the same importance.
  • Rank the cells in ascending order according to their DIST2IP values.
  • The cell(s) with the lower DIST2IP value are added to the set of cells selected for afforestation.
Algorithm A2 in Appendix A shows the modifications added to the heuristic optimization process in CAMF presented in [23].

2.3. Case Study: Niida Catchment

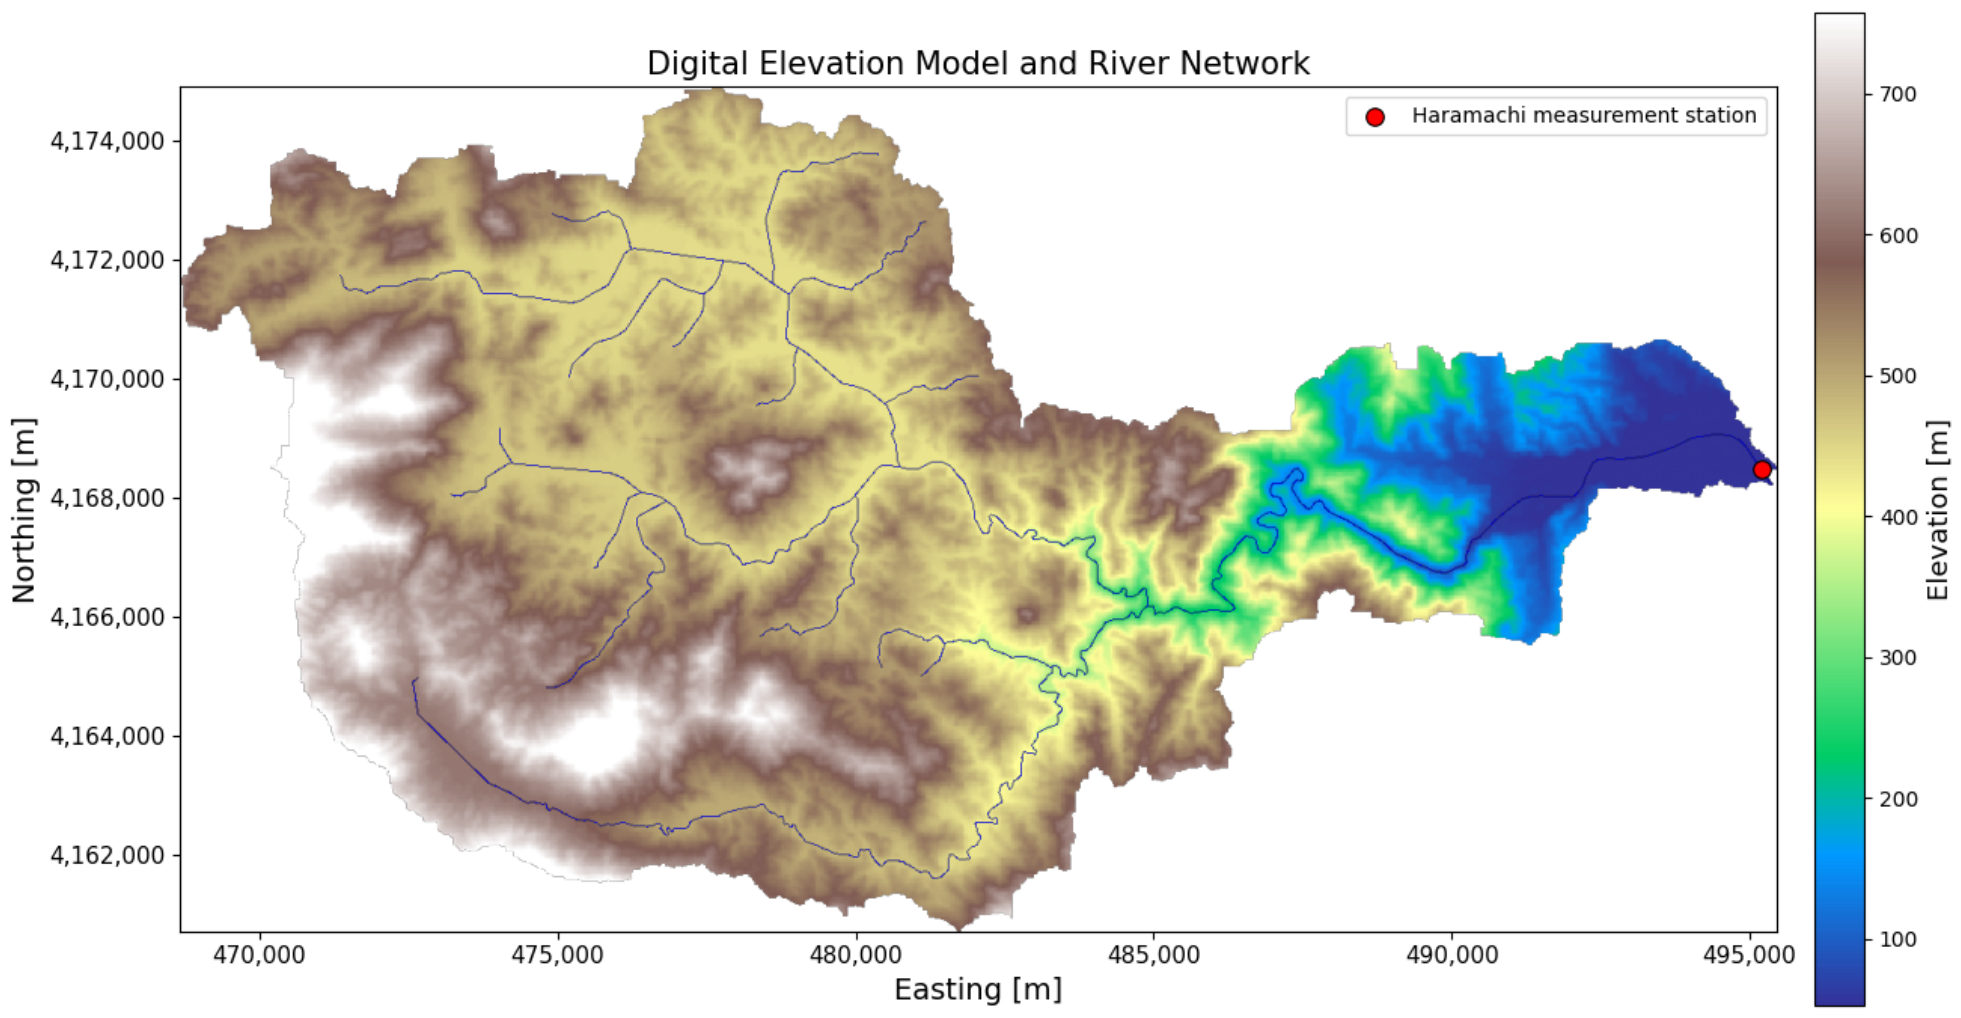
The Niida river catchment upstream of the Haramachi gauging station covers 198 km 2 . It is located ± 40 km from the Fukushima Daiichi Nuclear Power Plant. A Digital Elevation Model (DEM) with a resolution of 10 m × 10 m was obtained from the Geospatial Information Authority of Japan and resampled to a resolution of 20 m × 20 m , Figure 1. The topography is almost mountainous [3], with altitudes reaching 930 m a.s.l.
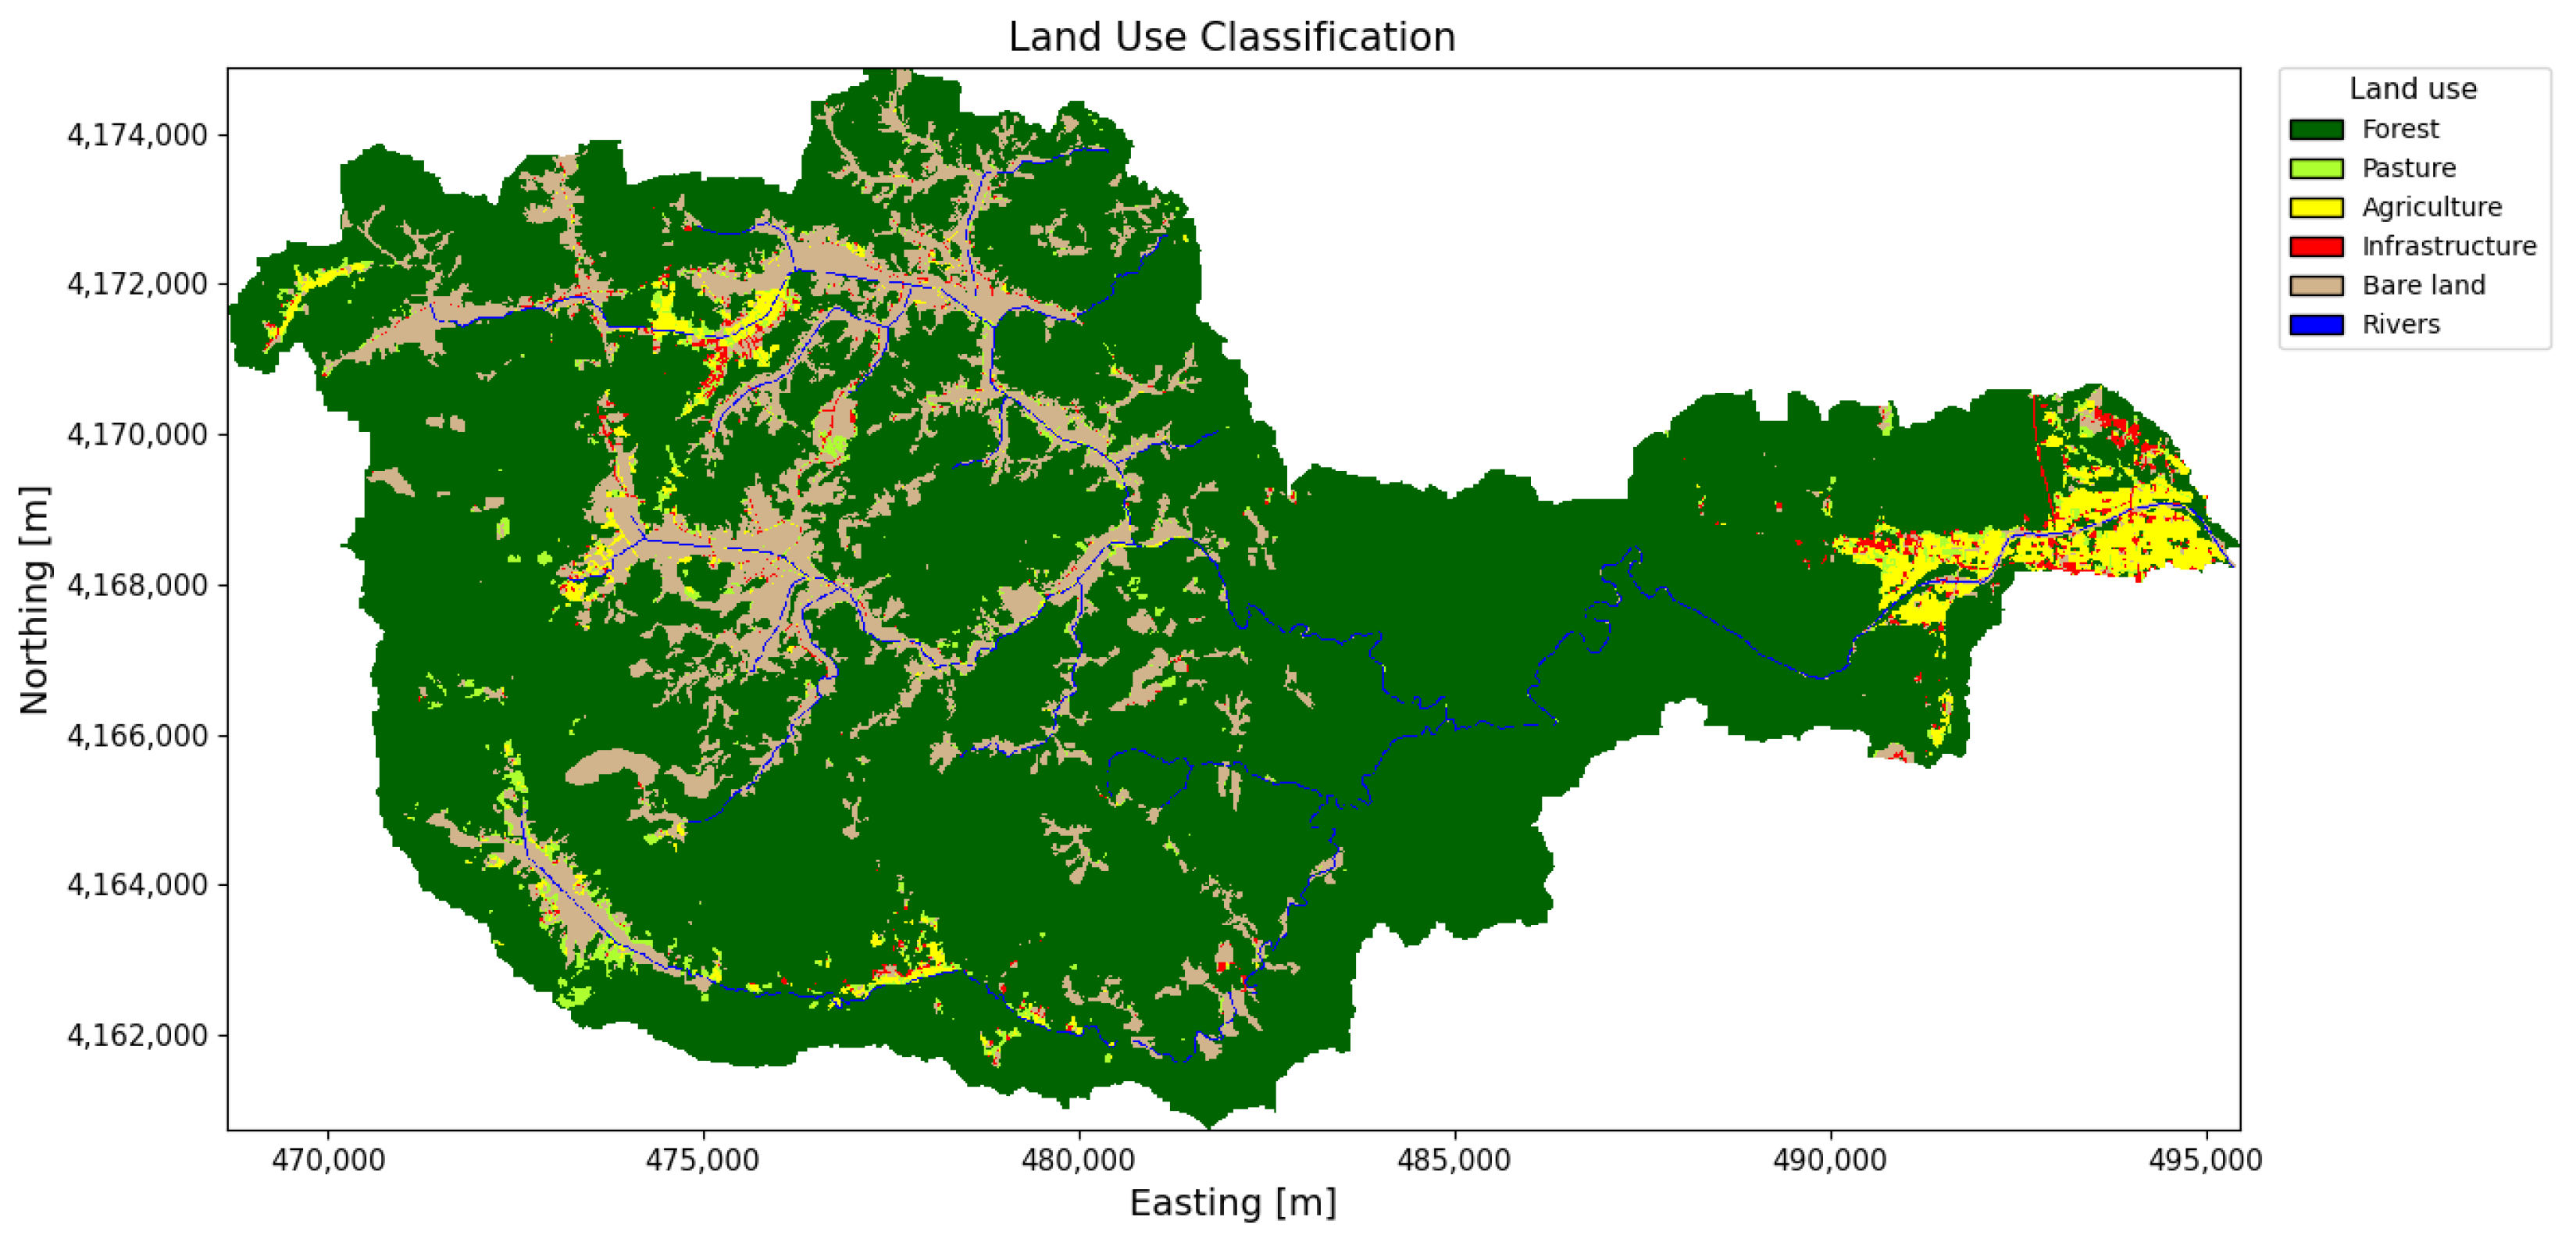
The extent of the DEM is 708 × 1339 cells, of which 695,426 cells cover the catchment, Figure 1. Forest cover accounts for approximately 80% of the catchment area, whereas infrastructure and agricultural land account for only approximately 2% and 5%, respectively. The cells covering the zones that have been decontaminated until 2014 (29,056 cells) were selected as candidate cells for intervention [9]. These cells cover 11.6 km 2 [3] and are mainly located near the river, Figure 2.
The mean annual sediment production per cell is computed using RUSLE, with parameters retrieved from previous studies for the region [3,9,35,36,37,38]. The rainfall erosivity factor R is set to 2191 mm ha 1 h 1 yr 1 , being an average value from several measurements carried out from 2013 to 2018 in the Haramachi station (red dot in Figure 1) [3] and discussed in [24]. The K-factor is set to 0.039 for all cells, as in [9,38]. Given that there are no registers of support practices to control erosion, the P-factor is set to 1 for all cells in the catchment.
Figure 1. Digital Elevation Model of the Niida river catchment in Fukushima Prefecture, Japan. Red dot: Haramachi measurement station. Source: Geospatial Information Authority of Japan [39]. Coordinates are shown in WGS 84/UTM zone 54N (EPSG:32654).
Land 15 01557 g001
The use of spatially uniform values for the R and K factors is a simplification of the erosion modeling. Spatially distributed observations of rainfall erosivity and soil properties were not available. Therefore, average values previously adopted and validated in studies of the same catchment [3,9,38] were used. Since the objective of this study is to evaluate the effectiveness of optimization heuristics to select intervention locations rather than to provide precise predictions of sediment production and transport, uniform R and K factors are used as acceptable approximations.
Figure 2. Land cover map of the Niida river catchment. The bare land class refers to the cells decontaminated between 2012 and 2014; these are considered as candidate cells for afforestation [9,40]. Coordinates are shown in WGS 84/UTM zone 54N (EPSG:32654).
Land 15 01557 g002
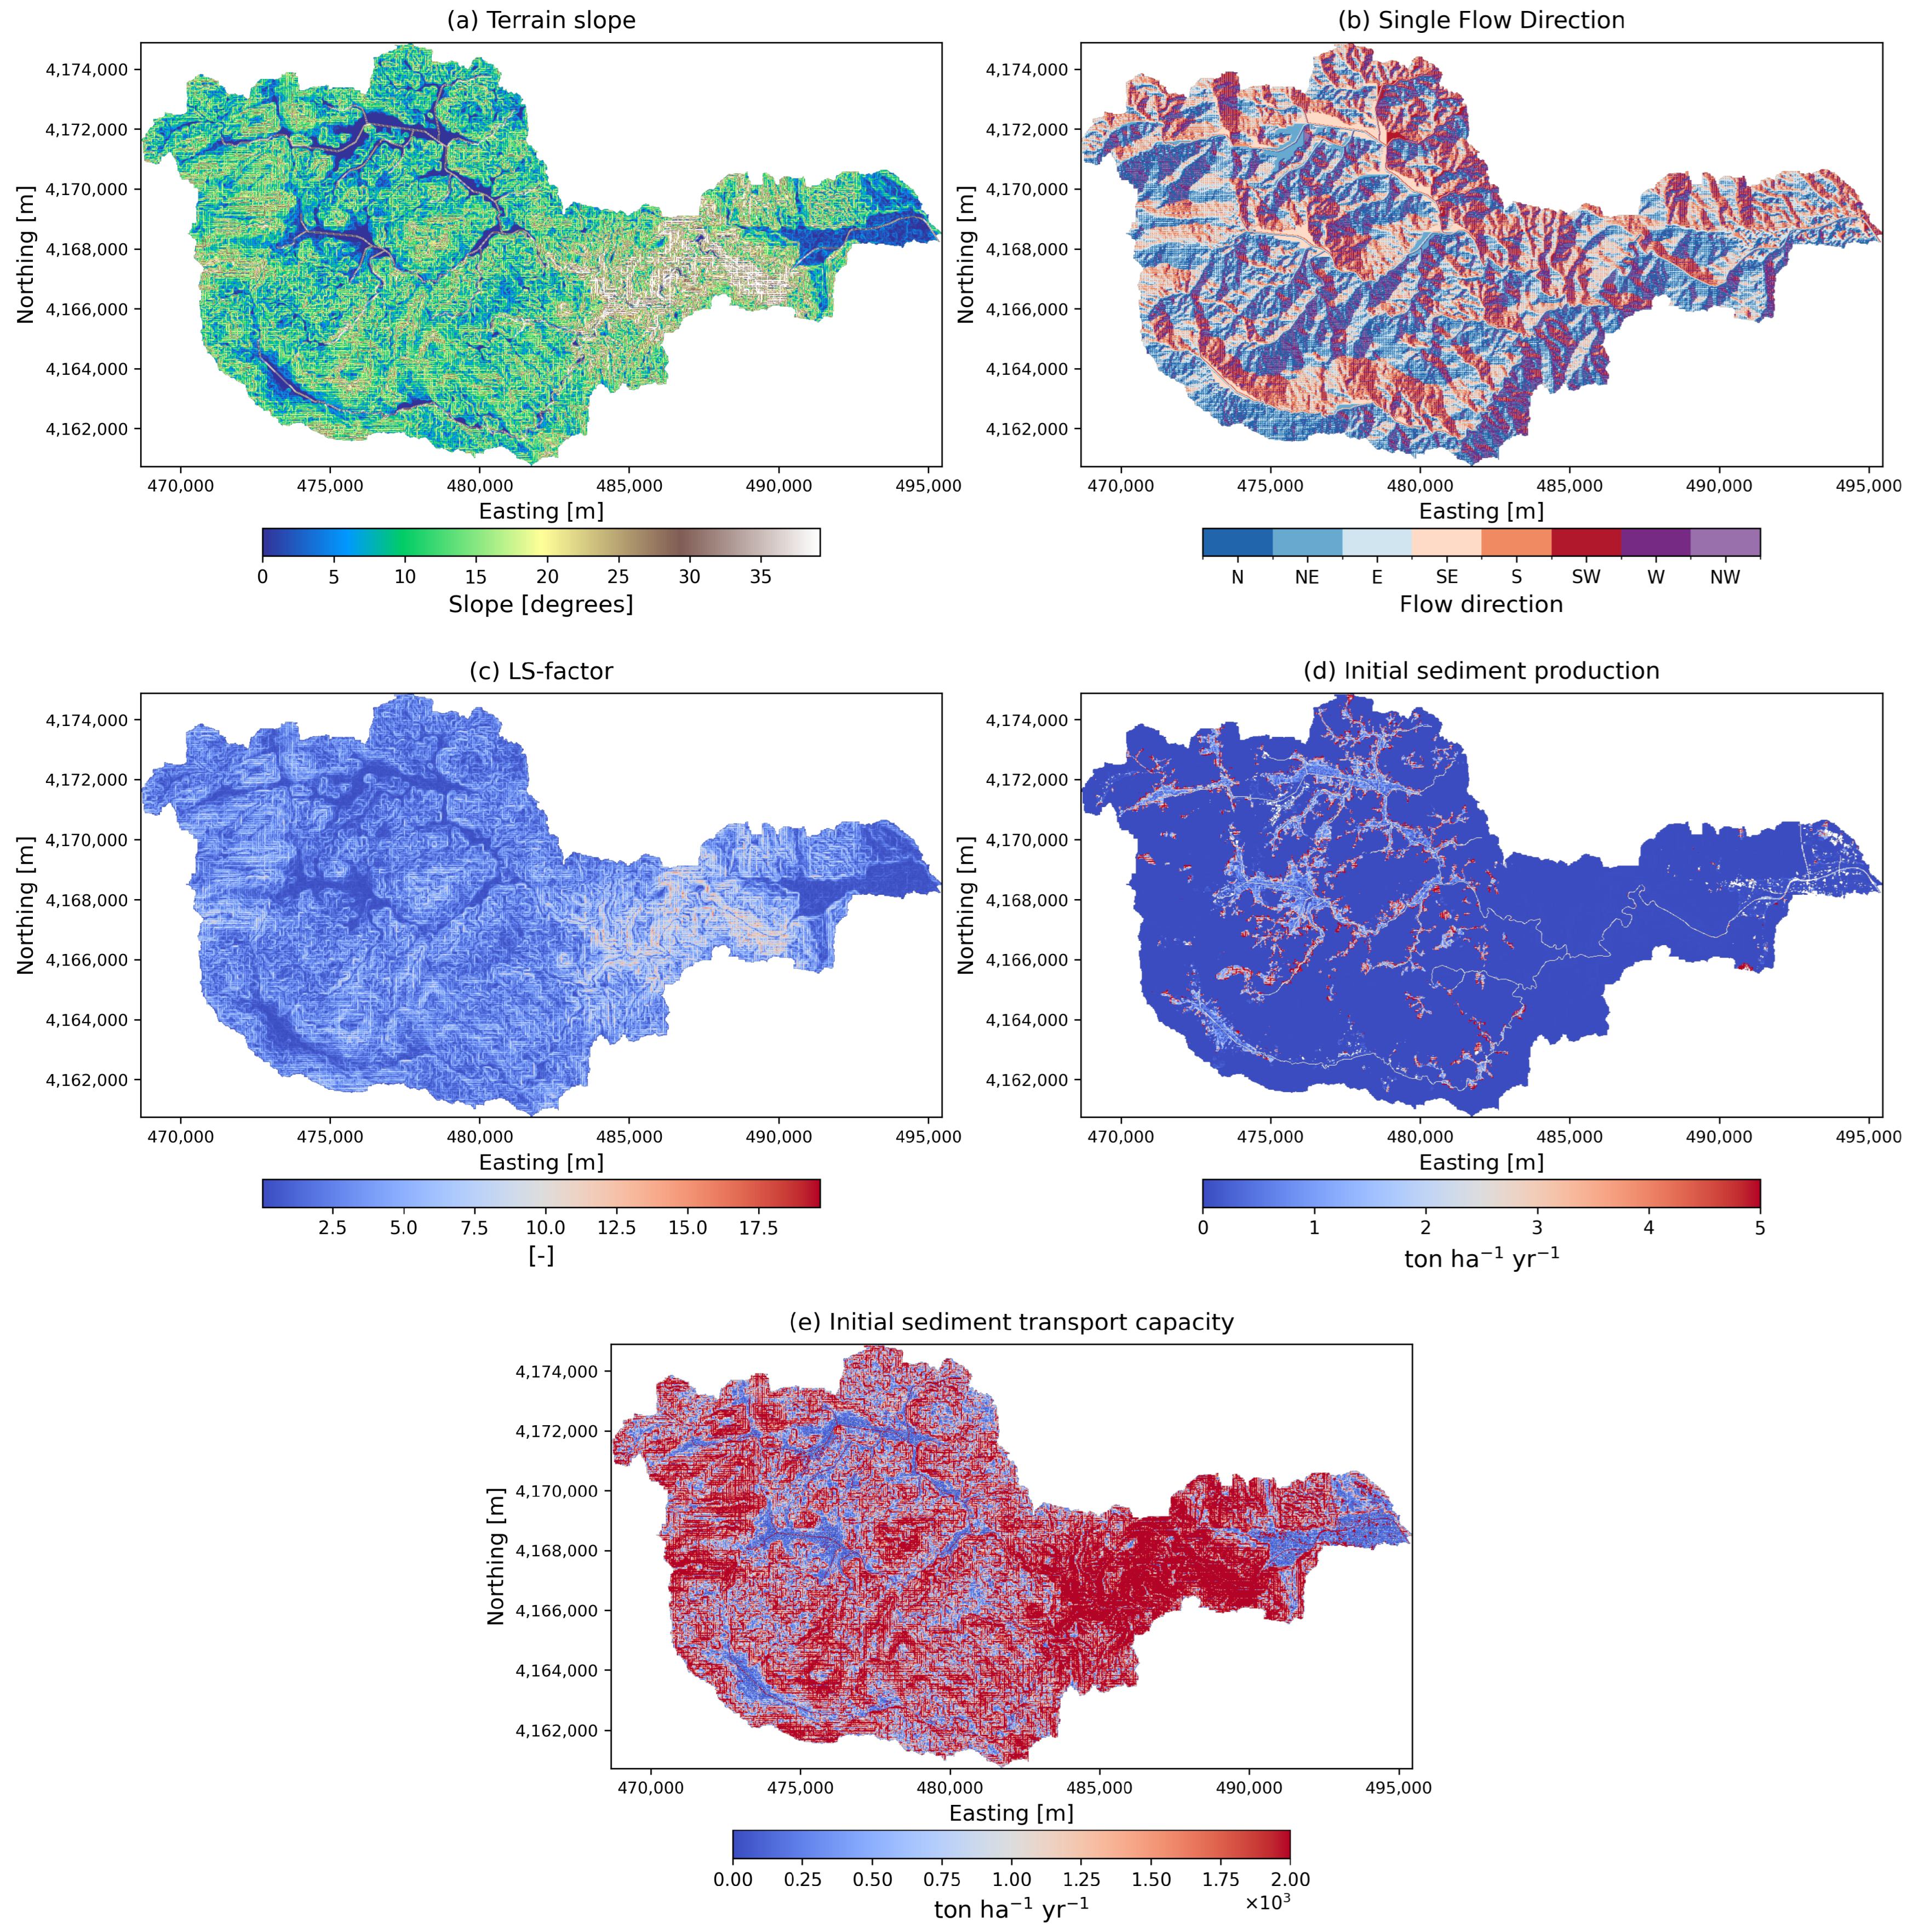
The actual values for the C-factor shown in Table 1 were taken from [24,35,36] and assigned to each cell of the particular land cover type (Figure 2) obtained from the World-cover Land Cover product 2020 [9,40].The L S -factor was computed according to Desmet and Govers [41], the slope angle values were cut off at 50 % as in Abrams et al. [9]; see Figure 3.
In each cell the outgoing sediment is modeled using the transport capacity function, Equation (3), with the same parameter values as those used to estimate the erosion risk using RUSLE. The K t c coefficients were taken from the calibration carried out in Abrams et al. [9] using measurements of sediment loads from 2013 to 2018 and the Nash–Sutcliffe model efficiency coefficient. Hence, K t c , l i m i t is set to 0.01, while K t c , l o w = 2 and K t c , h i g h = 6 .
Figure 3 presents the terrain slope, the flow directions, L S -factor, and spatial distributions of sediment production α 1 and transport capacity τ 1 before afforestation.
Equation (4) was used to estimate the 137Cs concentration in the sediment produced in each cell, based on the land use type, in consecutive years after the Fukushima Daiichi nuclear accident, as in [38]. The values of the solid entrainment coefficient to compute the 137Cs concentration in sediment, S c , are shown in Table 1, whereby “bare land” was set equal to the “agriculture” land use type.
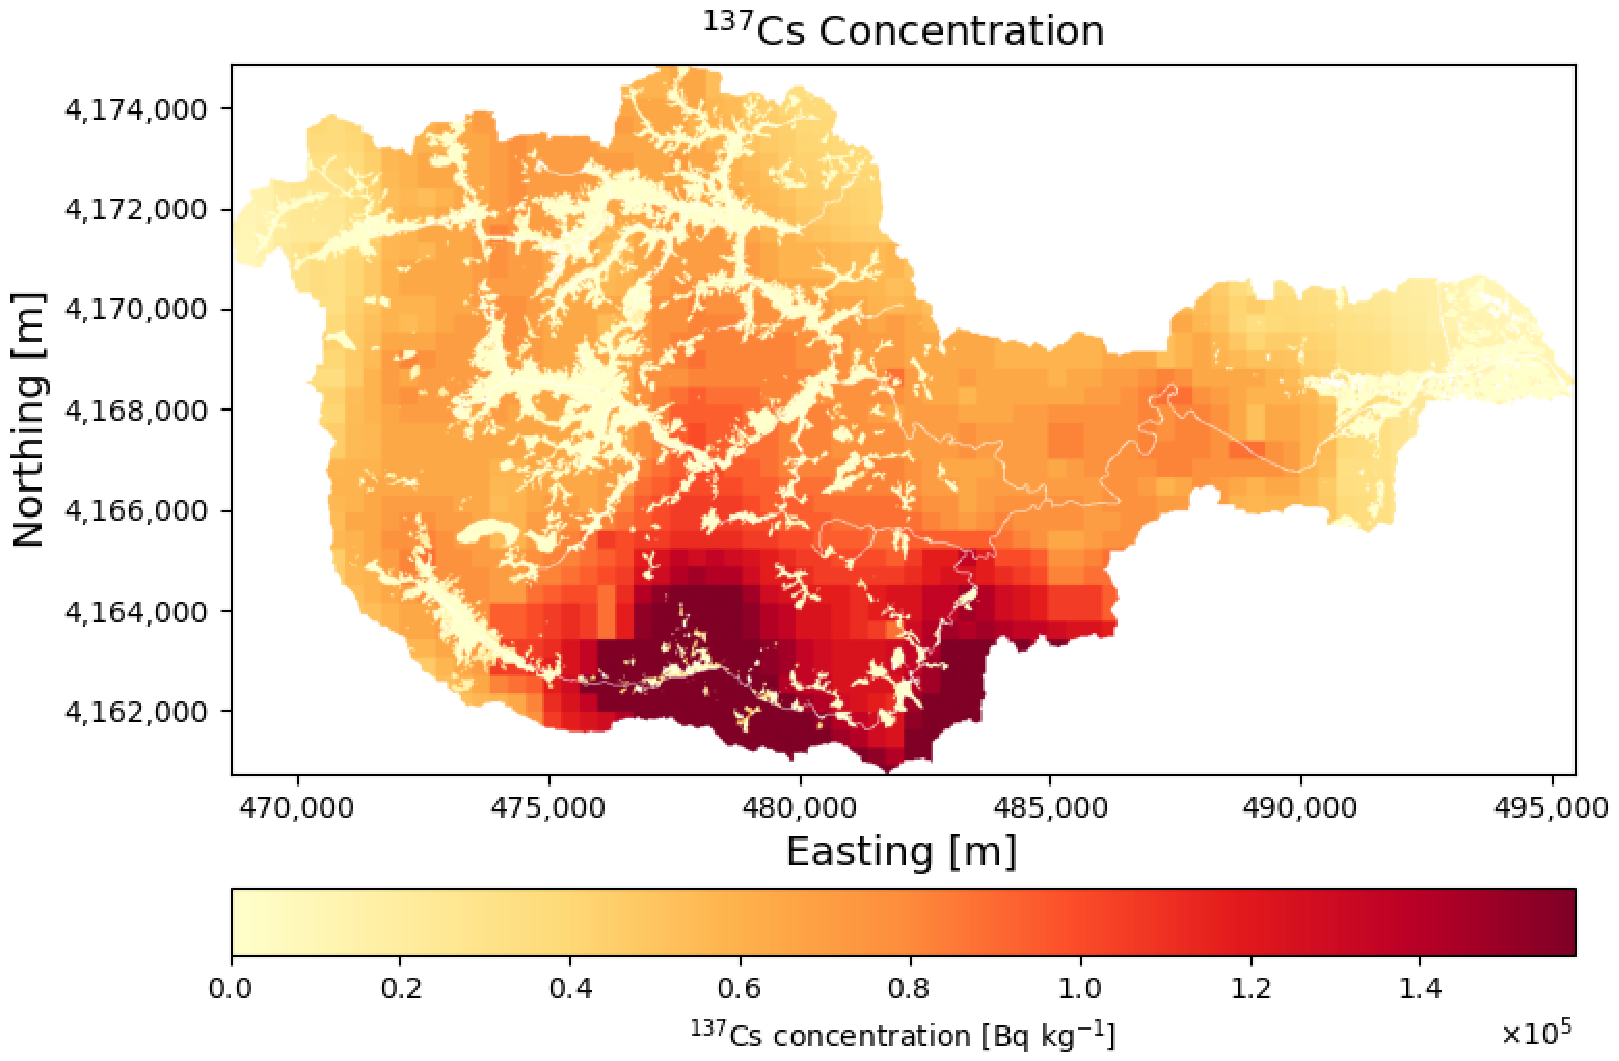
Part of the decontamination works carried out during 2012–2014 were done on agricultural land [24]. They consisted of the removal of vegetation and the topsoil layer ( ± 5 cm ), adapting the land cover from its original type to bare land. Measurements of air dose rate showed a decrease of 20–70% of the original contamination [1], therefore Abrams [24] assumed that the decontamination works reduced the initial 137Cs concentration in sediment by 50%, as shown in the map of Figure 4. Since decontamination removed the vegetation cover, these zones are subject to severe erosion, so the produced, low-contaminated sediment can be easily transported downstream.

3. Results

We used both the single-objective and multi-objective optimization in CAMF to minimize SY and CY at the outlet of the catchment, when up to 1000 cells (≈4% of the candidate cells) of the zones decontaminated between 2012 and 2014, are afforested. The simulated initial values for sediment yield SY 0 , and 137Cs yield CY 0 at the outlet are 50,166 ton yr 1 and 1.82 × 10 11   Bq yr 1 , respectively.
These simulated SY 0 and CY 0 were compared with observations reported by Bin et al. [3] and Abrams [24] for the Haramachi monitoring station, in Table 2. The observed values are the average annual sediment and 137Cs yield measured between 2013 and 2018, which is consistent with the period used to derive the average rainfall erosivity factor R, adopted in this study from [24]. The SY 0 estimated with CAMF is close to the observed average of 48,837 ton yr 1 . While the agreement is strong for SY 0 (2.7% difference), the larger discrepancy in CY 0 (≈60%), is probably due to the assumption of homogeneous mixing of 137Cs within sediments.
Kitamura et al. [26] consider a larger area in the Fukushima Prefecture than the Niida catchment, with a coarse resolution. Their simulation results are of the same order of magnitude as the (sparsely available) measurement data (e.g., a factor of 2 difference for the Niida river) and show the importance of the land use factor when remediation options would be considered, which is the subject of our paper.

Sediment Yield Reduction vs. C s 137 Yield Reduction

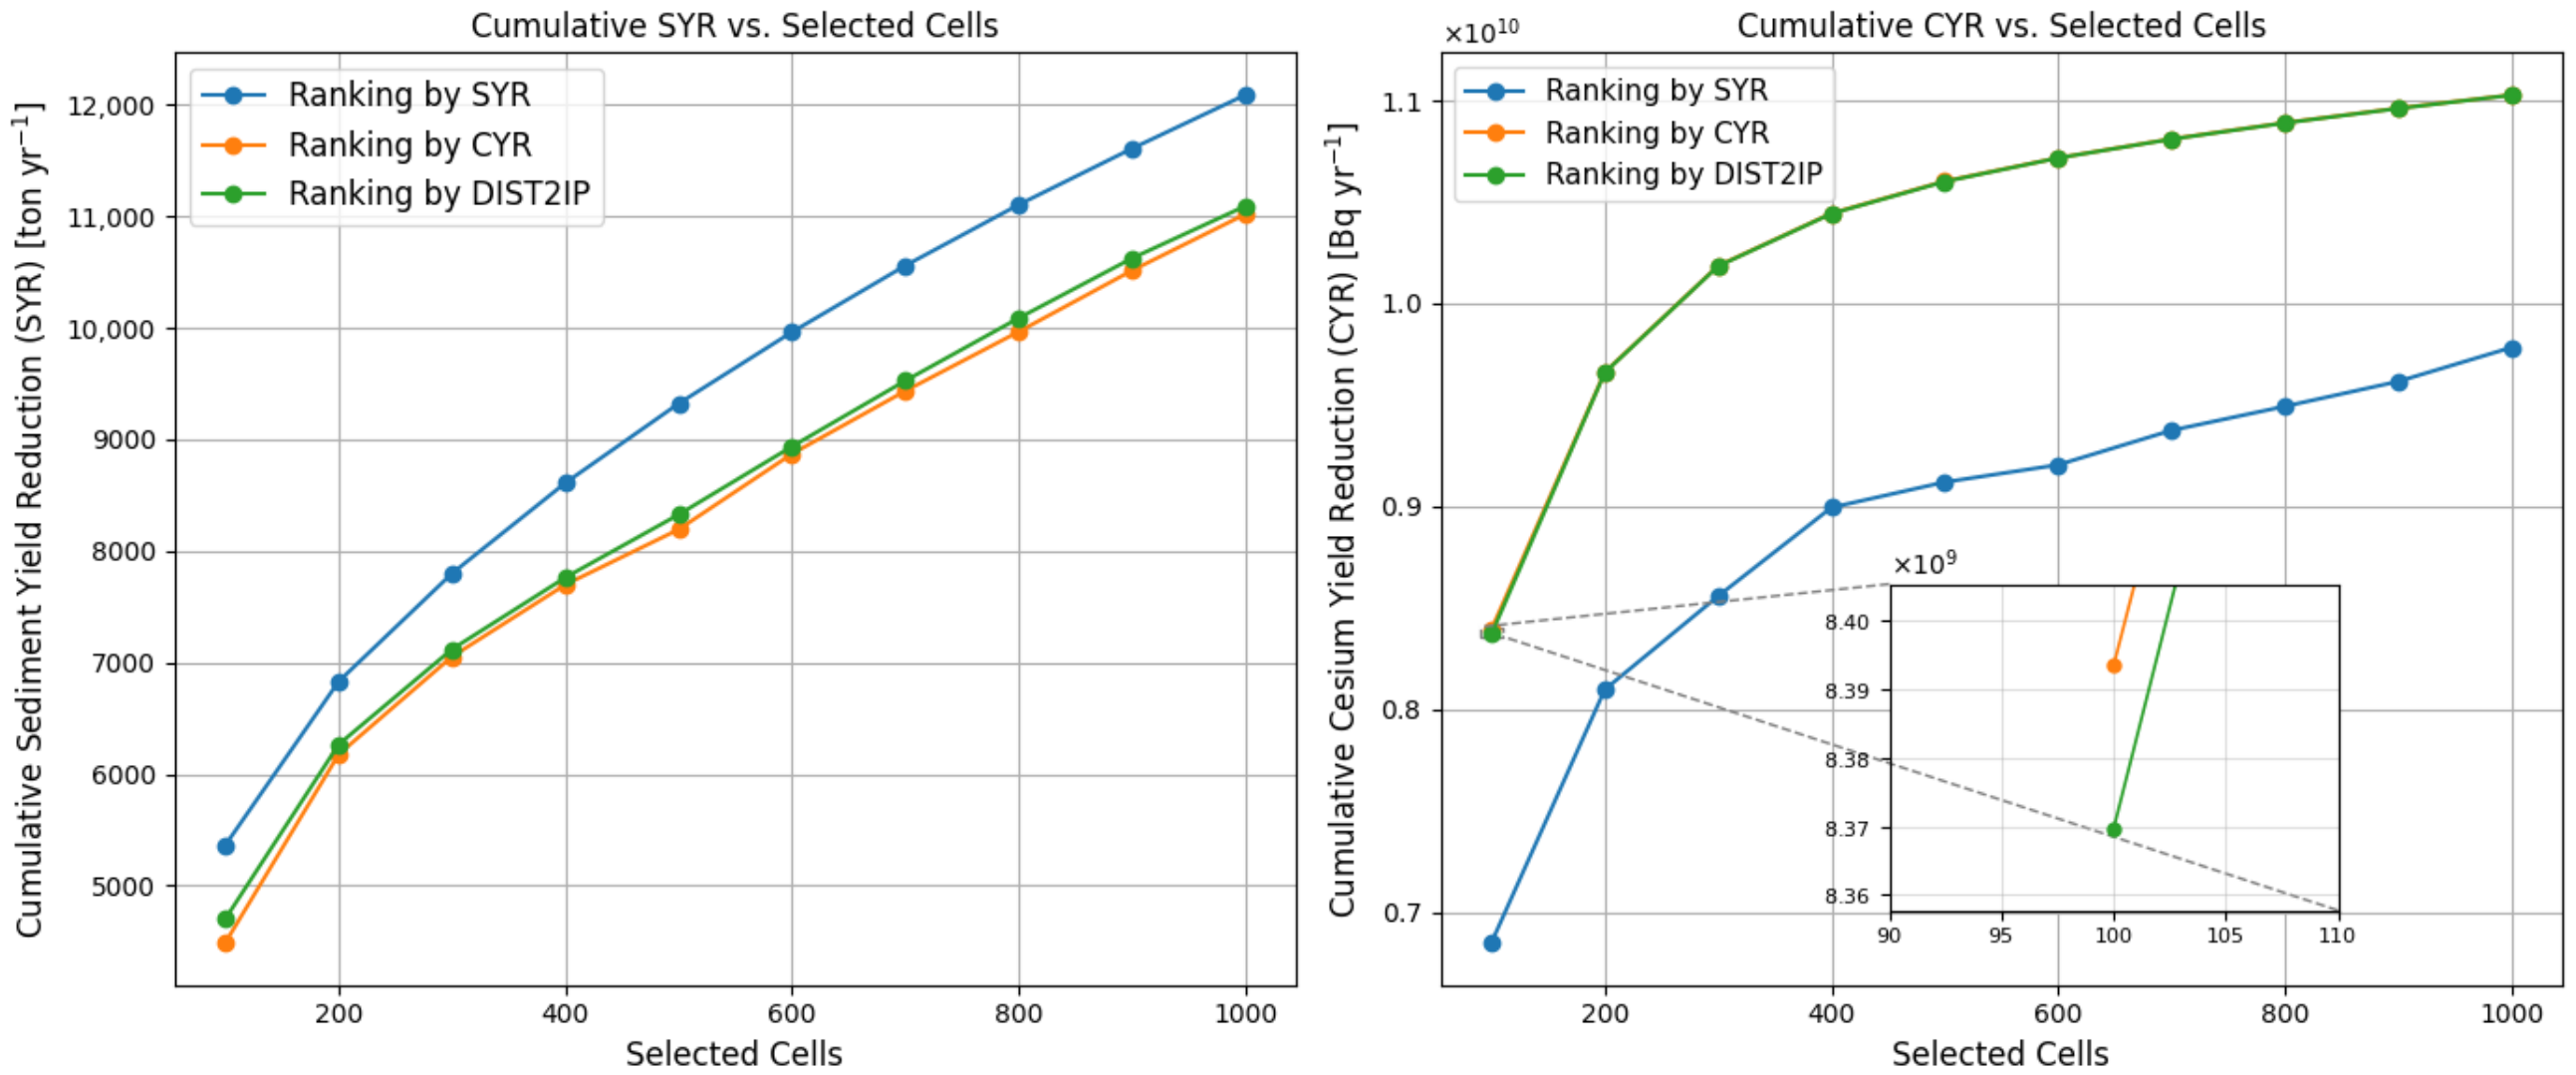
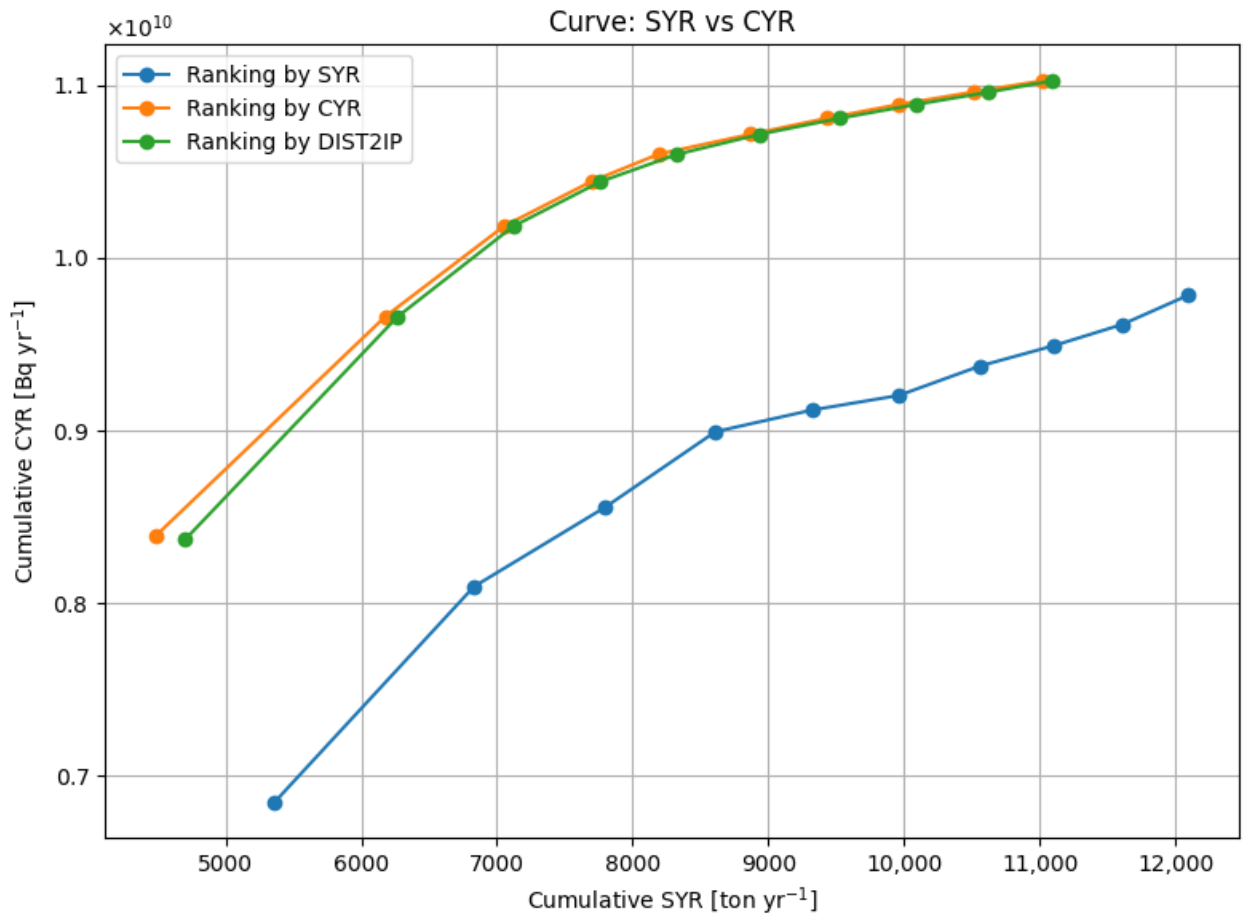
Table 3 presents the values for SYR and CYR after afforesting 100, 200, …, up to 1000 cells for three scenarios: (1) maximizing SYR , (2) maximizing CYR , and (3) maximizing both SYR and CYR by selecting cells according to their DIST2IP.
Selection based on SYR consistently produces the highest cumulative sediment yield reduction values for any given number of cells, but also the lowest 137Cs yield reduction, CYR . The opposite is true for selection based on CYR . Notably, the effect is largest when few cells are selected for afforestation and decreases as the number of selected cells increases, which is expected, as described in [19]. Selection based on DIST2IP provides an intermediate outcome, resulting in SYR and CYR values that are close to the maxima for each objective while avoiding the strong imbalances observed in the single-objective optimization.
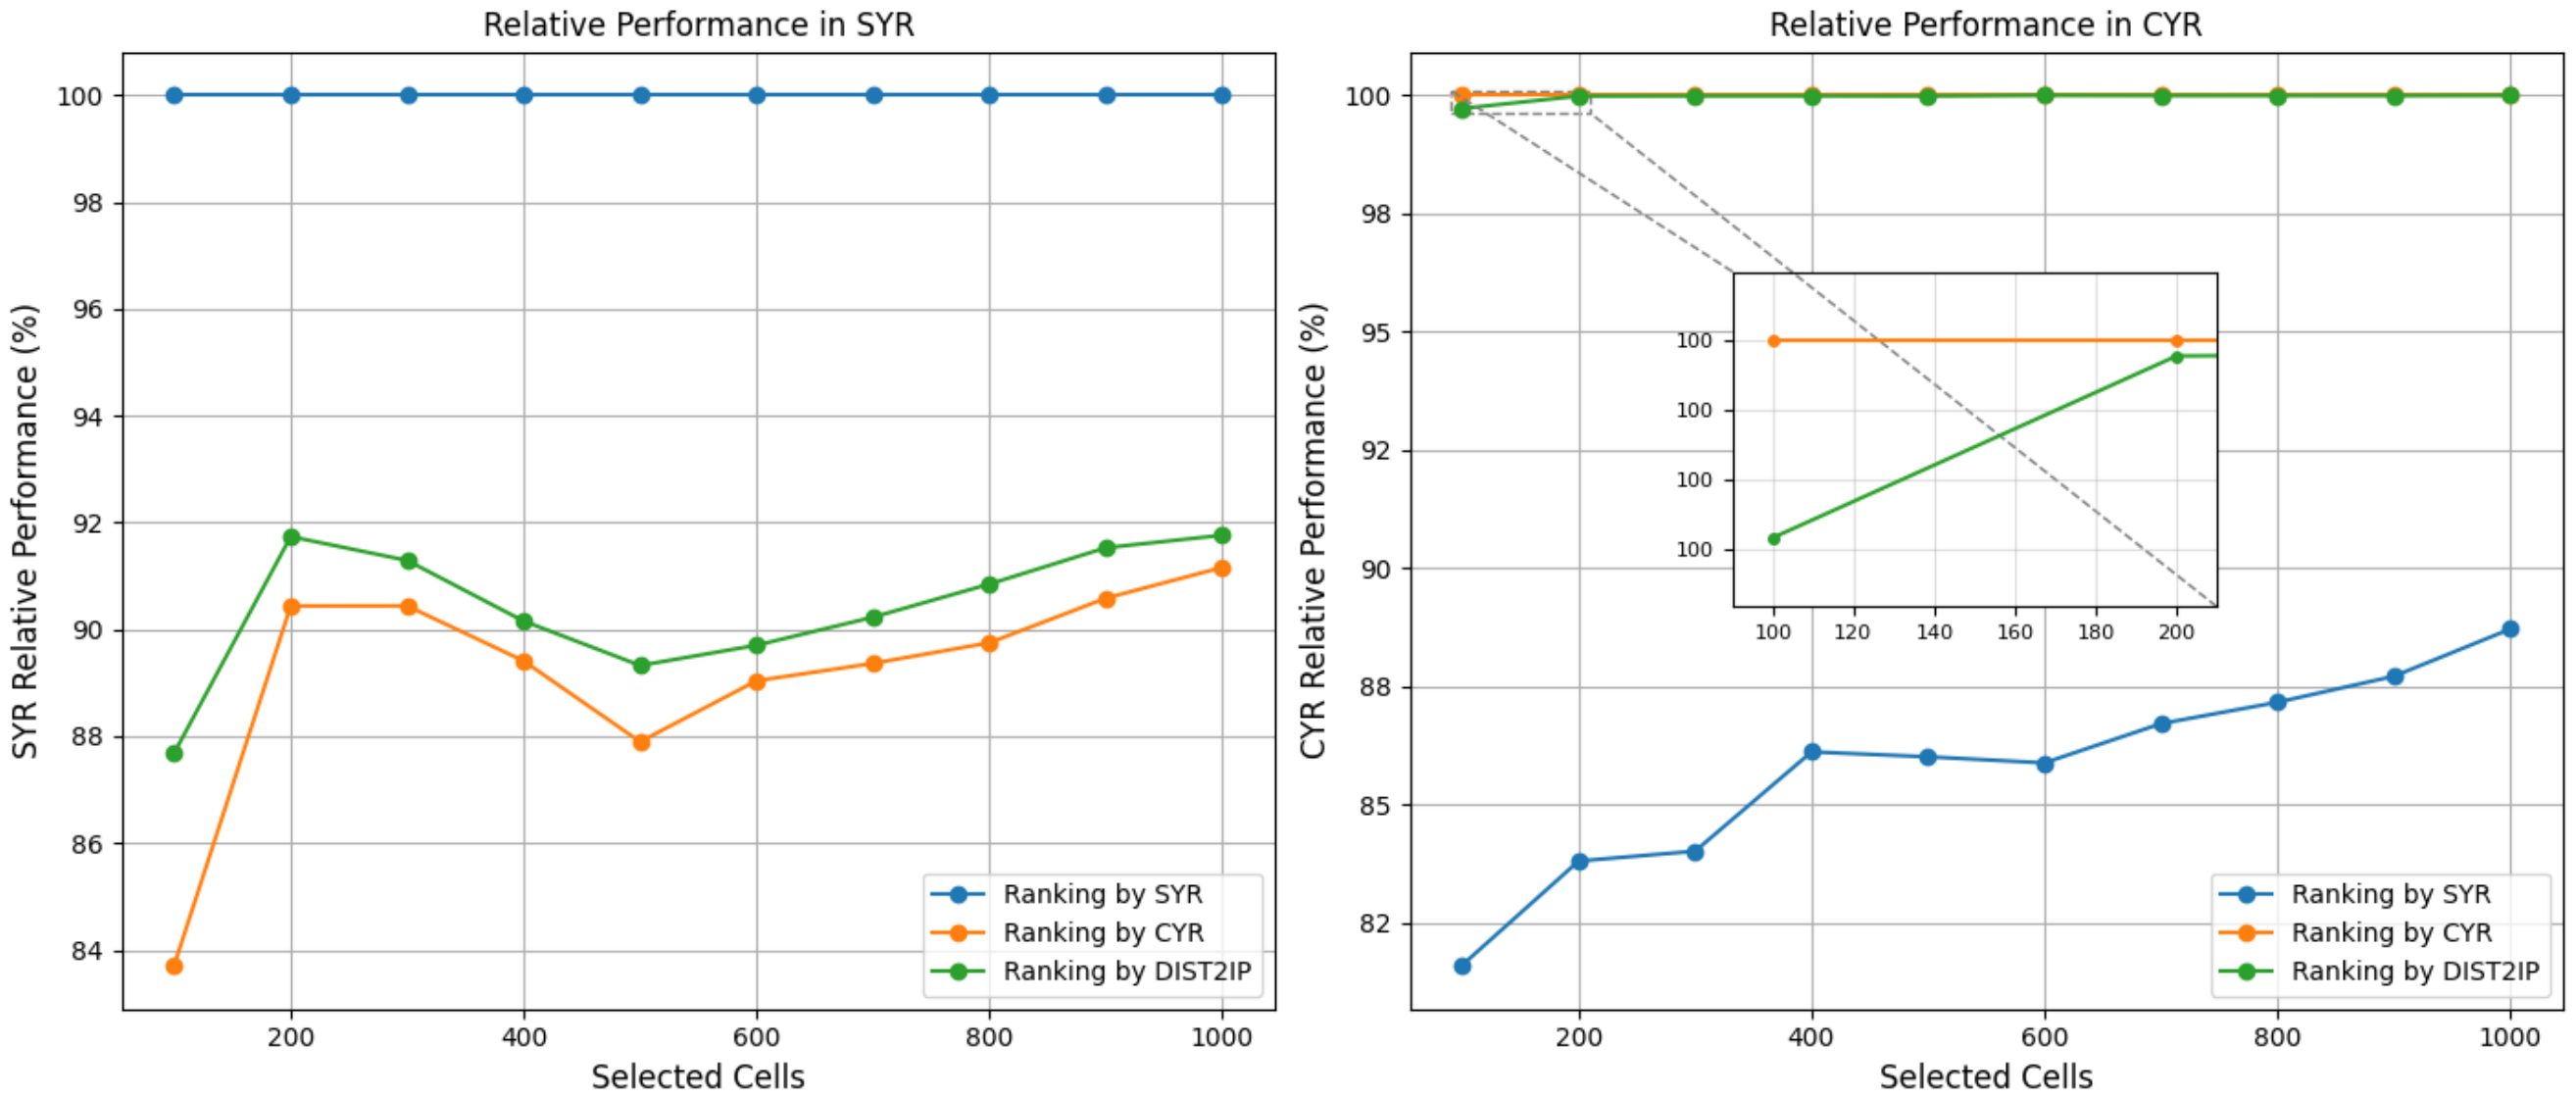
The latter is confirmed in the plots shown in Figure 5 and Figure 6, illustrating the cumulative values of SYR and CYR with respect to the number of cells selected for afforestation, for the three scenarios. Selection based on SYR results in substantially lower CYR values than in the two other scenarios (e.g., ≈18% lower when 100 cells were selected). Selection based on CYR results in lower SYR values than selection based on SYR (≈9–16% lower). The DIST2IP selection scenario results in SYR values that were ≈8–12% lower than in the single-objective SYR optimization scenario, but with negligibly CYR values (≤0.3%) than with the single-objective CYR selection.
Figure 6 shows relative performance plots indicating how much each scenario ( SYR , CYR , DIST2IP) loses compared to the best-performing scenario. The lines corresponding to SYR and CYR consistently stay at 100%. The plot on the right shows a strong performance in CYR when using DIST2IP, consistently being very close to the maximum. This is a very interesting result, which suggests that, in this specific optimization problem and for this specific case study, the compromise using DIST2IP is highly effective, providing nearly the same level of CYR as the selection purely based on CYR , while still maintaining good performance in SYR , as shown in the left plot.
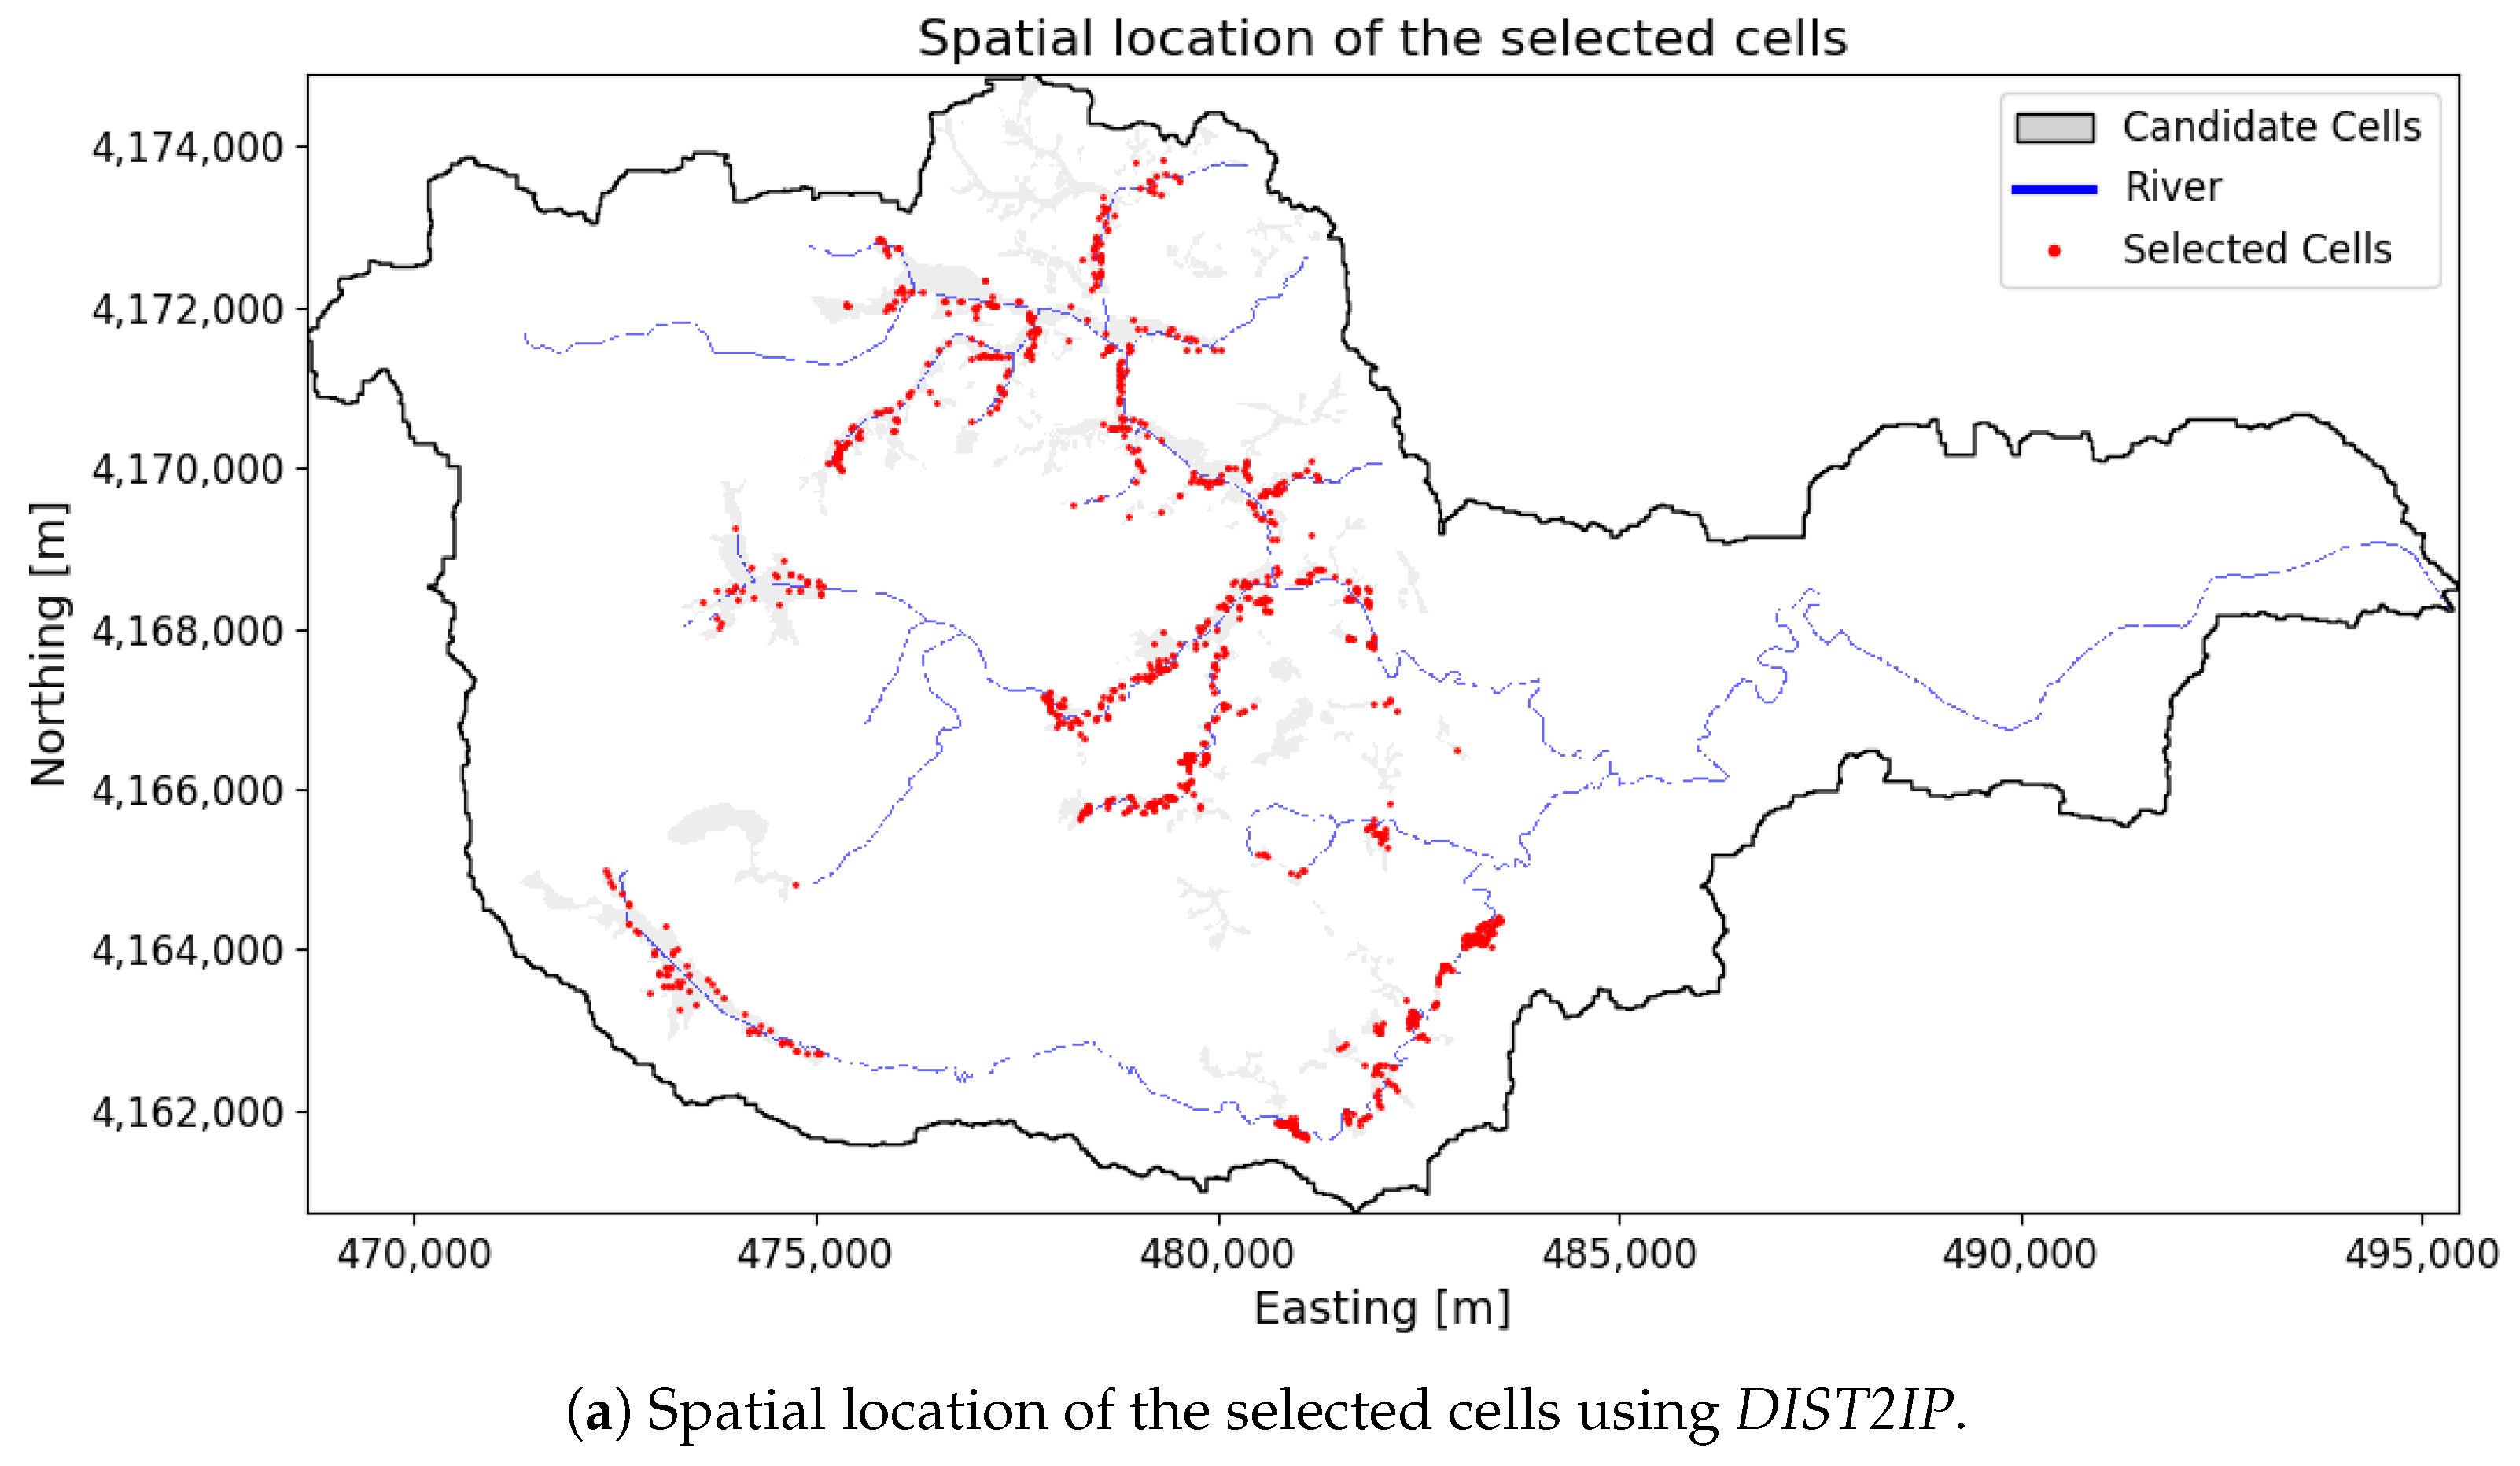
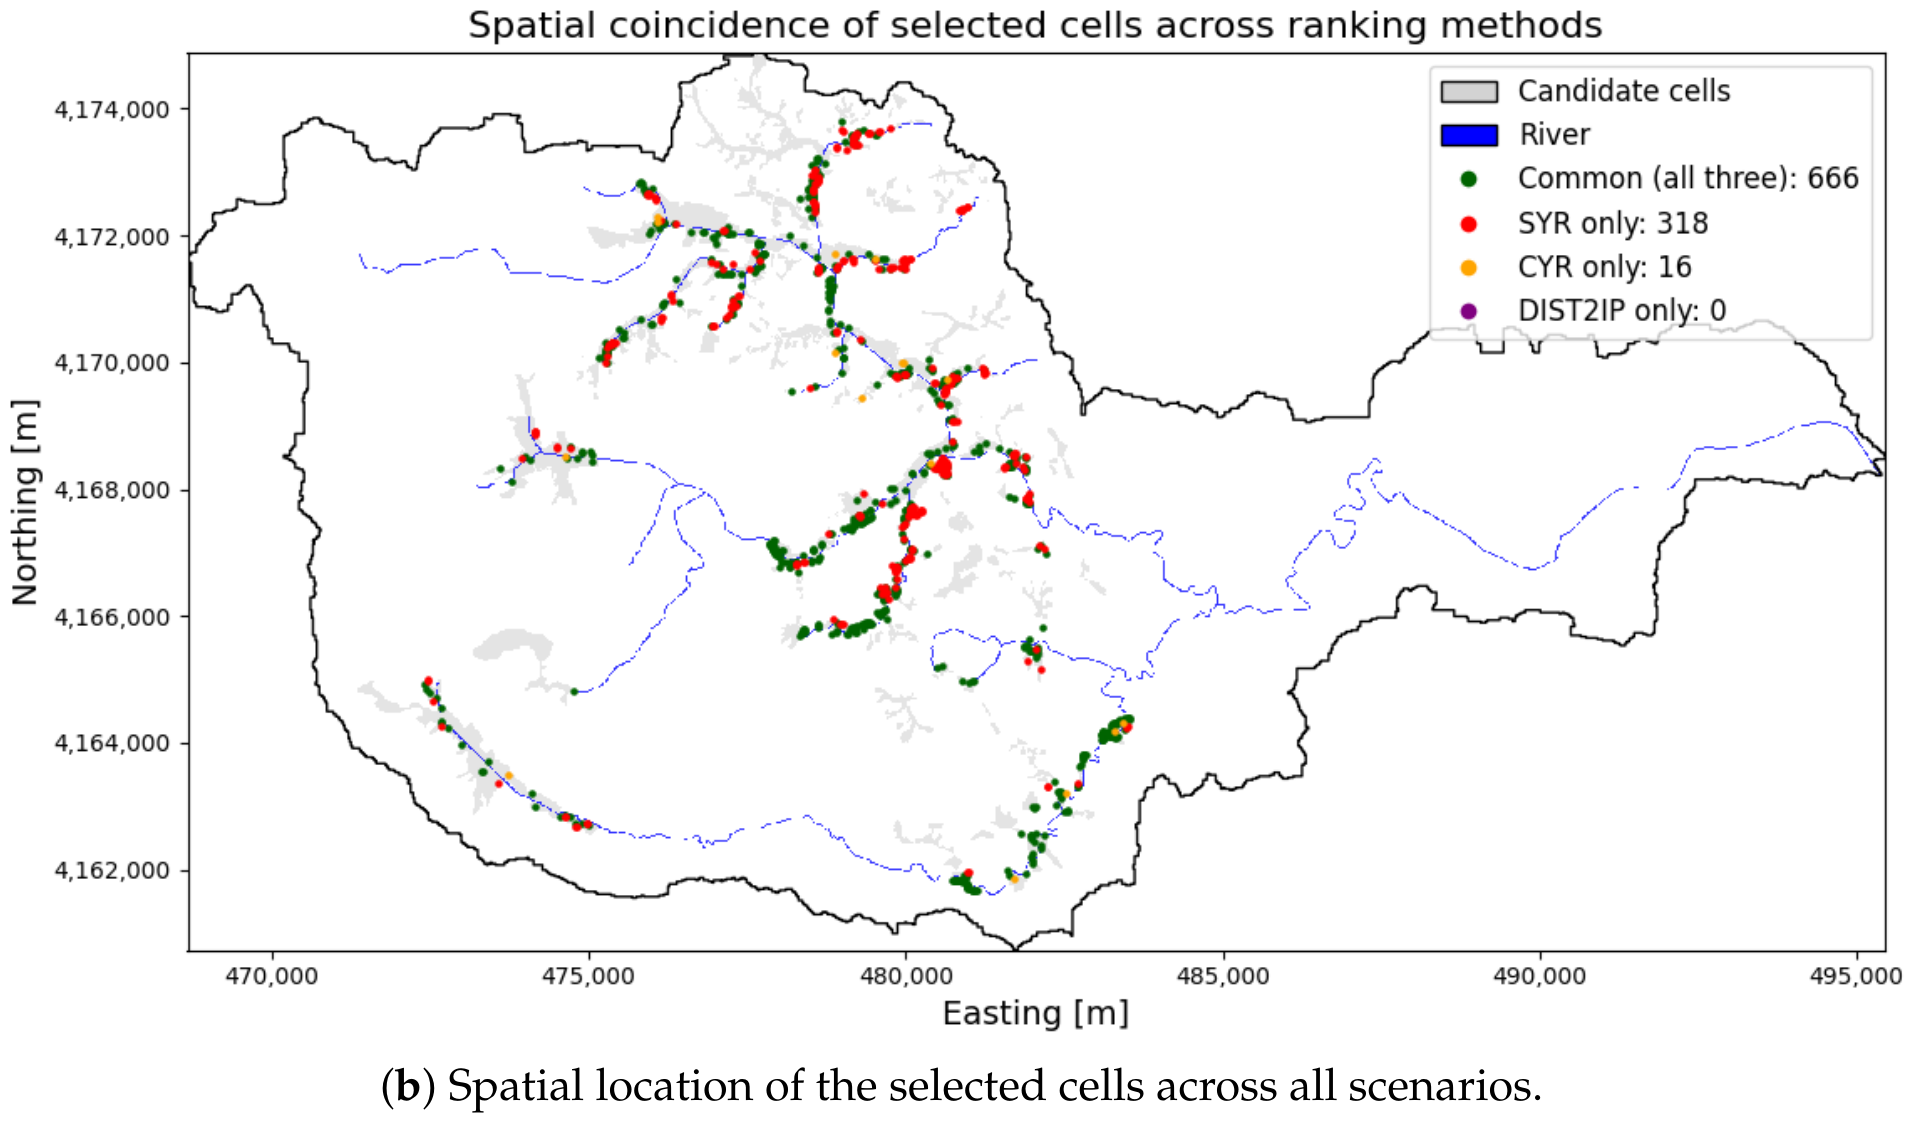
The maps in Figure 7 show the geographic distribution of the selected cells in relation to the candidate cells identified for afforestation. The first map (Figure 7a) shows the spatial location of the cells selected using the DIST2IP scenario, while the second one (Figure 7b) provides the spatial coincidence of the cells across the three scenarios, showing the cells that were selected in common and those uniquely selected by each of the scenarios: SYR , CYR and DIST2IP, respectively.
Generally, the most optimal cells for afforestation are located near the river, because afforestation leads not only to a reduction in sediment production, but also to a reduction of transport capacity, halting part of the sediment moving downward from upper situated cells [24]. The cells located close to the river and within the sediment flow path to the river retain the sediment from up-slope cells, as also observed in [23].
An important observation in the map of Figure 7b is that there are no cells uniquely selected by the DIST2IP method. This means that every single one of the 1000 cells selected by DIST2IP is also selected by the SYR -based selection, the CYR -based selection, or both. Hence, in this case study, the IP compromise is “contained” within the union of the two single-objective selections. Therefore, the multi-objective compromise does not require selecting cells that were not already considered important by at least one of the single-objective scenarios. However, this result should not be interpreted as a general property of the DIST2IP approach. In catchments with different environmental characteristics, or when considering pollutants whose transport pathways differ substantially from those of sediment, stronger conflicts between objectives may emerge.

4. Discussion

4.1. Spatial Targeting and Management Implications

This study illustrated that land use and land management planners must be aware of and take into account the off-site effects of interventions in the landscape, aiming at one or multiple objectives. The decontamination practices in the Niida catchment are a clear example of site-specific interventions where on-site impacts (reduction of local contamination) had large off-site impacts (increased erosion and resulting low contaminated sediment loss at the outlet). Off-site effects are due to spatial interaction: an intervention at a given location affects not only the characteristics and properties of that location but also those of other, even distant, locations in the landscape. These off-site impacts are especially pertinent for flow phenomena such as water and sediment. A consequence is that location does matter for the effectiveness of interventions, impacting the generation, transportation, and accumulation of materials, not only in terms of the location-specific (on-site) characteristics but also regarding the off-site effects. This confirms that applying measures to areas that hardly contribute sediment to river channels is inefficient [14].
When afforestation is used as the intervention to maximally reduce the export of sediment and associated contaminants from the catchment, we showed that cells, representing sites, can be iteratively ranked and selected from high-impact cells to lower-impact cells. The spatial distribution of the highest-ranked intervention sites is in line with many studies that indicate the riparian zone as an efficient area for retaining sediment from surface runoff [42,43,44]. Indeed, the 1000 selected cells have a small median distance to the river, which confirms the critical importance of implementing and maintaining decontamination and erosion-control measures near channel networks, where afforestation can trap sediment and contamination before they reach the main channel (Figure 7). Similar patterns were found by Domingues et al. [17], who used a genetic algorithm to optimize the allocation of forest restoration zones to minimize soil losses in watersheds.
The selected cells are concentrated in a relatively narrow range of elevations, from around 400 m to 500 m . However, there is a significant number of selected cells at higher elevations, with a notable cluster around 600– 625 m . This suggests that while most of the selected cells are in the lower-to-mid elevation ranges, the optimization procedure also finds significant benefits from planting at higher elevations.
The initial local sediment production at the selected cells covers an extremely wide range. Notably, a large portion of the selected cells have very high initial sediment production values. However, the cell in the catchment with the highest sediment production is not among the 1000 selected cells, indicating that optimal afforestation sites are not necessarily the highest sediment producers; sediment routing and connectivity are also important factors [19].
In this study, CAMF identified the cells for which afforestation was most efficient in terms of sediment yield reduction and 137Cs export in a spatially explicit way, taking full account of spatial interaction. For the Niida catchment, the results showed that targeting the most impactful sites could considerably reduce sediment yield, SY , and 137Cs yield, CY , at the outlet of the catchment. The number of selected cells can vary according to management objectives, available resources, and implementation constraints. We selected 1000 cells as an analysis threshold. This threshold is based on the decreasing marginal benefits observed in the cumulative SYR and CYR curves: the largest increase in both objective functions occurs during the initial iterations, whereas subsequent interventions provide progressively smaller additional reductions, as also observed in [19]. Afforesting these 1000 cells, representing only ≈4% of the candidate cells and corresponding to ≈40 ha of the more than ≈12 km 2 decontaminated zones, could reduce SY by 22% and CY by 6% at the outlet.
In this case study, when reductions in both SY and CY were considered, the DIST2IP method was highly effective for selecting cells. It provided solutions on the optimal trade-off curve, as shown in Figure 8, whereas single-objective optimization led to suboptimal outcomes for the other objective.
These results suggest that using DIST2IP in CAMF in the decision-making process could support more effective and efficient schemes for the management of decontaminated land. Consequently, future remediation initiatives should include the off-site implications of the decontamination or other interventions by pre-assessing the prospective sediment dynamics in the remediated locations to assure the sustainability of the remediation, as proposed by Bin et al. [3].

4.2. Sensitivity Analysis

The results presented above are obtained by using already published models and values for the model parameters, without further tuning or calibration. The simple sediment production and transport models accurately predict SY 0 and less accurately CY 0 at the only available measurement station (Haramachi; Table 2). Hence we focus on the sensitivity of the simulated 137Cs yield before afforestation, CY 0 , the reduction of 137Cs yield due to afforestation, CYR , and the selected cells with respect to two uncertain inputs.
Besides the assumed 50% reduction of the concentration in these areas, as in Abrams et al. [9], we also assumed reductions of 40% and 20%. Further, besides assuming homogeneous mixing in the topsoil (upper 5 cm of soil), we also assumed that 137Cs was homogeneously mixed only in the upper 2, 3, and 4 cm of the soil, resulting in higher 137Cs concentrations given by
CC d = CC 5 5 cm d , d { 2 , 3 , 4 , 5 } cm .
where d is the assumed mixing depth and CC 5 is the 137Cs concentration obtained with the previously used mixing depth of 5 cm.
For these five alternative scenarios, CAMF was rerun while keeping all other inputs unchanged to select 100 cells for afforestation. Note that previous experience with CAMF and the discussion above about the results in Table 3 indicate that the first cells selected are most sensitive to the parameters and criteria.
Table 4 shows CY 0 , CYR , and the percentage of CYR relative to CY 0 for the reference solution and the five scenarios. Varying the assumed reduction in 137Cs concentration in the decontaminated areas results in very slight changes in CY 0 and CYR , since only a small fraction of the cells are decontaminated. Varying the assumed mixing depth changes the 137Cs concentration in all cells in the same way and increases CY 0 and CYR by a factor of 5 / d compared with the reference values for d = 5 cm . Further, pairwise comparison of the set of 100 selected cells in the reference solution and the solutions obtained with the alternative scenarios shows that the same 100 cells are always selected, but sometimes in a slightly different ordering, which does not affect the final solution. Hence we conclude that the spatial pattern of intervention cells generated by CAMF-DIST2IP is not very sensitive to these input data. Note that by assuming a mixing depth of ≈2 cm , the simulated initial yield, CY 0 , can be made equal to the observed average at the Haramachi station; see Table 4.
The reference CYR in Table 4 is not equal to the CYR value in the first line of Table 3 (100 cells selected), because all results in Table 4 are computed using the ’accelerated’ variant of the CAMF optimization heuristic (see [19]), which computes a suboptimal solution in a short time, as the CAMF optimization is computationally expensive.

4.3. Methodological Considerations

Some characteristics of the CAMF heuristic and the models used to estimate sediment production and transport must be considered. For the case study presented in this research, we used RUSLE to compute the yearly sediment production per cell in the catchment. RUSLE should be used with caution since it has initially been developed from an agricultural point of view for simple topographic situations. RUSLE has been widely applied for spatial soil-erosion assessment, but its predictions are sensitive to input data, spatial resolution, and the parameterization of land cover and topographic factors; therefore, model parameters should be tested and, where possible, calibrated for the specific study area [11,45,46]. However, as mentioned in [19], it is possible to use other models to estimate soil erosion in CAMF, as the sediment production maps are computed offline beforehand, and then indicated as inputs.
Similarly, the use of a simple transport function to describe sediment flow between cells is a simplification of a complex process involving sediment detachment, transport, deposition, and spatial connectivity [47,48,49]. Due to the range of different (stochastic) processes involved in sediment transport, it is unlikely that simple relationships accurately quantify the process [48]. However, for planning of erosion mitigation measures, the understanding of patterns within the landscape are more important than obtaining exact values, as argued in [17,19].
Our implementation of DIST2IP allows different weights to be assigned to sediment and 137Cs yield reduction in the distance calculation. In this study, equal weights were used, assuming equal importance of both objectives. However, decision-makers can emphasize one objective over the other by specifying different weights.
CAMF considers a direct reduction in sediment production after afforestation, which may overestimate the initial impact [50]. Even so, when afforestation is complemented with soil covering practices such as mulching or rapid re-vegetation, these assumptions are reasonable. In addition, determining the 137Cs concentration in sediment based on a conversion factor can be seen as too simplistic. More complex Bayesian models are proposed by Delmas et al. [51]. However, for the long-term timescale that is considered, the approach is fit for purpose.
Radioactive decay of 137Cs was not considered in this study because the current version of the CAMF heuristic does not consider a temporal dimension. Hence, contamination is treated as static in time, while in reality, 137Cs concentrations decrease over time due to both physical decay and ongoing environmental processes. Future work could incorporate time by running RUSLE for a sequence of years, updating sediment production and transport capacity as vegetation develops after afforestation, while also accounting for radioactive decay. This would allow CAMF to evaluate how priority intervention areas evolve through time.
Although the proposed method was demonstrated for the reduction of sediment and 137Cs export, its applicability is not limited to radioactive contamination or to two criteria. CAMF combined with DIST2IP can be extended to environmental problems involving other pollutants, such as nitrogen or phosphorus, transported through hydrological and sediment connectivity pathways. It can also be applied to more than two criteria exhibiting spatial interaction, or to combinations of criteria with and without spatial interaction. For example, cost can be included as an on-site criterion, although afforestation costs may also depend partly on accessibility and therefore on the afforested or non-afforested status of surrounding cells. The same principle applies as long as the effects of interventions on the selected criteria can be estimated.

5. Conclusions

CAMF, originally designed for spatially targeting interventions aimed at sediment yield reduction only, was effectively adapted to address dual objectives, such as the simultaneous reduction of sediment yield and 137Cs contaminated sediment export. We reported results for the Niida river catchment, affected by the accident at the nuclear power plant in Fukushima, Japan.
This study confirmed that, due to spatial variability and spatial interaction, the effectiveness of afforestation as a post-decontamination intervention to reduce sediment and associated radionuclide export from catchments affected by 137Cs deposition, is highly location-specific. We demonstrated that the multi-objective optimization procedure in CAMF is suitable to identify those locations in the catchment for which the intervention has the highest desired impact.
Selecting cells purely based on their capacity to reduce sediment yield maximizes sediment control, but results in a substantially lower 137Cs Yield Reduction. In contrast, selecting cells based on 137Cs Yield Reduction, minimizes 137Cs yield but sacrifices sediment control. The distance to the ideal point consistently delivers a (near-optimal) balance between sediment and 137Cs yield reduction. This demonstrates its potential as a practical compromise strategy in multi-objective environmental planning in contexts where both objectives have similar importance. When one objective is considered more important, this preference could be incorporated by introducing weights in the calculation of DIST2IP, allowing the compromise solution to reflect different management priorities.
In 137Cs contaminated catchments such as the Niida river catchment, targeted and timely afforestation guided by a multi-objective solution would have simultaneously mitigated downstream sediment fluxes and reduced the transport of 137Cs, thereby enhancing long-term ecological safety.

Author Contributions

Conceptualization, G.C.R., F.A., G.D., Y.O., D.R. and J.V.O.; methodology, G.C.R., F.A., D.R. and J.V.O.; software, G.C.R.; validation, G.C.R., D.R. and J.V.O.; formal analysis, G.C.R., D.R. and J.V.O.; data curation, F.A.; resources, Y.O.; writing—original draft preparation, G.C.R. and D.R.; writing—review and editing, G.C.R., D.R. and J.V.O.; supervision, G.J.M., D.R. and J.V.O.; funding acquisition, G.D., Y.O. and D.R. All authors have read and agreed to the published version of the manuscript.

Funding

This research was funded by the International Atomic Energy Agency (IAEA) through the Coordinated Research Project “Monitoring and Predicting Radionuclide Uptake and Dynamics for Optimizing Remediation of Radioactive Contamination in Agriculture” (CRP D15019), by the VLIR-UOS project “Networks 2019 Phase 2 Cuba ICT” (PhD research grant of G.C.R.) and by the NUMA research unit of the Department of Computer Science, KU Leuven, through a grant supporting of G.C.R.

Data Availability Statement

The CAMF software used in this study was developed by G.C.R. and has been available since 2022. CAMF is implemented in C++ and can be executed on Linux or Windows systems with a multi-core processor. The required libraries are the Geographic Data Abstraction Library (GDAL) and OpenMP for parallelism on multi-core processors. The source code is available at https://gitlab.kuleuven.be/ees/fnl/camf (accessed on 20 August 2026) and https://gitlab.com/greycr89/acamf-project (accessed on 20 August 2026). Detailed documentation for installation, testing, and deployment is available at https://gitlab.com/greycr89/acamf-project/-/blob/dev/README.md (accessed on 20 August 2026). Further information can be requested from the developer at the Center for Computational Mathematics Studies, University of Informatics Sciences, San Antonio de los Baños Km 2½, Cuba; emails: gcreyes@uci.cu and greycr89@gmail.com. The datasets presented in this article, encompassing the radioactive contamination of the Niida catchment, are not readily available because of access restrictions. Questions regarding these datasets should be directed to g.dercon@iaea.org.

Conflicts of Interest

The authors declare no conflicts of interest.

Abbreviations

The following abbreviations are used in this manuscript:
CAMFCellular Automata-based Heuristic for Minimizing Flow
CA137Cs Accumulation
CC137Cs Concentration
CCY137Cs Concentration Yield
CY137Cs Yield
CYR137Cs Yield Reduction
DEMDigital Elevation Model
DIST2IPDistance to the Ideal Point
FD8Fractional Deterministic Eight-Neighbor
IPIdeal Point
LSSlope and Slope Length
MCDMMulti-Criteria Decision-Making
MFDMultiple Flow Direction
RCRadiocaesium
RUSLERevised Universal Soil Loss Equation
SASediment Accumulation
SFDSingle Flow Direction
SYSediment Yield
SYRSediment Yield Reduction
TOPSISTechnique for Order Preference by Similarity to Ideal Solution

Appendix A. Algorithms

Appendix A.1. Computation of Sediment and C s 137 Yield

Algorithm A1 computes sediment yield and 137Cs yield at the target cells by propagating sediment and associated contamination through the sorted flow graph.
Algorithm A1 Compute the sediment yield SY , and the 137Cs yield CY
  • Input: local sediment production α k ; local transport capacity τ k , with k indicating the values before the afforestation ( k = 1 ) or after the afforestation ( k = 2 ); local 137Cs concentration in sediment CC ; target cells p
  • for each cell i in the sorted graph S do
  •     1.  SA i α i k             ▹ SA stores the sediment accumulation for every cell
  •     2.  CA i α i k × CC i    ▹ CA stores the cumulative 137Cs concentration in sediment for every cell
  •     for each ancestor j of cell i do
  •           if  SA j τ j k  then
  •                 3.  D j SA j
  •           else
  •                 4.  D j τ j k
  •           end if
  •           5.  D j i D j × F j i       ▹ F j i is the fraction of sediment delivered from cell j to its neighbor cell i
  •           6.  SA i SA i + D j i
  •           7.  SA j SA j D j i
  •           8.  CA i CA i + D j i × CC j
  •     end for
  •     if  SA i > 0  then
  •           9.  CC i CA i SA i
  •     else
  •           10.  CC i 0
  •     end if
  • end for
  • 11.  SY p SA p in target cells p
  • 12.  CY p CA p in target cells p
  • Output: sediment yield, SY ; 137Cs yield, CY

Appendix A.2. Multi-Objective CAMF Optimization

Algorithm A2 summarizes the iterative selection of intervention cells using the DIST2IP based on sediment and 137Cs yield reductions.
Algorithm A2 Determine the cells to be selected for maximizing both SYR and CYR
  • Input: Number of cells to be selected n
  • 1.  S Ø                         ▹S stores the cells selected
  • 2.  t 0
  • while size of S < n  do
  •       3.  t t + 1
  •       for each candidate cell i that has not been selected do
  •            4. Compute SYR i t and CYR i t by tentatively afforesting cell i
  •       end for
  •       5. Compute x i , syr and x i , cyr by normalizing SYR i t and CYR i t values
  •       6. Compute the DIST2IP based on x i , syr and x i , cyr
  •       7. Rank cells in ascending order according to their DIST2IP
  •       8. Put cell(s) with lowest DIST2IP in solution set S
  • end while
  • Output: Set of selected cells S

References

  1. Onda, Y.; Taniguchi, K.; Yoshimura, K.; Kato, H.; Takahashi, J.; Wakiyama, Y.; Coppin, F.; Smith, H. Radionuclides from the Fukushima Daiichi Nuclear Power Plant in terrestrial systems. Nat. Rev. Earth Environ. 2020, 1, 644–660. [Google Scholar] [CrossRef] [Scilit]
  2. Evrard, O.; Laceby, J.; Lepage, H.; Onda, Y.; Cerdan, O.; Ayrault, S. Radiocesium transfer from hillslopes to the Pacific Ocean after the Fukushima Nuclear Power Plant accident: A review. J. Environ. Radioact. 2015, 148, 92–110. [Google Scholar] [CrossRef] [Scilit]
  3. Bin, F.; Onda, Y.; Wakiyama, Y.; Taniguchi, K.; Hashimoto, A.; Zhang, Y. Persistent impact of Fukushima decontamination on soil erosion and suspended sediment. Nat. Sustain. 2022, 5, 879–889. [Google Scholar] [CrossRef] [Scilit]
  4. Golosov, V.; Konoplev, A.; Wakiyama, Y.; Ivanov, M.; Komissarov, M. Erosion and Redeposition of Sediments and Sediment-Associated Radiocesium on River Floodplains (the Niida River Basin and the Abukuma River as an Example). In Behavior of Radionuclides in the Environment III; Springer: Singapore, 2022. [Google Scholar] [CrossRef] [Scilit]
  5. Konoplev, A.; Kanivets, V.; Zhukova, O.; Germenchuk, M.; Derkach, H. Mid- to long-term Radiocesium wash-off from contaminated catchments at Chernobyl and Fukushima. Water Res. 2021, 188, 116514. [Google Scholar] [CrossRef] [Scilit]
  6. Chartin, C.; Evrard, O.; Laceby, J.; Onda, Y.; Ottlé, C.; Lefèvre, I.; Cerdan, O. The impact of typhoons on sediment connectivity: Lessons learnt from contaminated coastal catchments of the Fukushima Prefecture (Japan). Earth Surf. Process. Landf. 2017, 42, 306–317. [Google Scholar] [CrossRef] [Scilit]
  7. Liu, X.; Machida, M.; Kurikami, H.; Kitamura, A. Long-term simulations of Radiocesium discharge in watershed with improved Radiocesium wash-off model: Applying the model to Abukuma River basin of Fukushima. J. Environ. Radioact. 2019, 203, 135–146. [Google Scholar] [CrossRef] [Scilit]
  8. Ueda, S.; Hasegawa, H.; Kakiuchi, H.; Akata, N.; Ohtsuka, Y.; Hisamatsu, S. Fluvial discharges of radiocaesium from watersheds contaminated by the Fukushima Dai-ichi Nuclear Power Plant accident, Japan. J. Environ. Radioact. 2013, 118, 96–104. [Google Scholar] [CrossRef] [Scilit]
  9. Abrams, F.; Sweeck, L.; Camps, J.; Castillo-Reyes, G.; Feng, B.; Onda, Y.; Van Orshoven, J. Minimizing the loss of radioactively contaminated sediment from the Niida watershed (Fukushima, Japan) through spatially targeted afforestation. In Proceedings of the EGU General Assembly Conference Abstracts, Vienna, Austria, 24–28 April 2023; p. EGU-12670. [Google Scholar] [CrossRef] [Scilit]
  10. Wischmeier, W.; Smith, D.; Service, U.S.A.R.; Station, P.U.A.E. Predicting Rainfall-Erosion Losses from Cropland East of the Rocky Mountains: Guide for Selection of Practices for Soil and Water Conservation; Number n.º 282–284 in Agriculture Handbook; Agricultural Research Service, U.S. Department of Agriculture: Washington, DC, USA, 1965.
  11. Renard, K.; Foster, G.; Weesies, G.; McCool, D.; Yoder, D. Predicting Soil Erosion by Water: A Guide to Conservation Planning with the Revised Universal Soil Loss Equation (RUSLE); USDA-ARS Handbook No. 703; United States Department of Agriculture, Agricultural Research Service: Washington, DC, USA, 1997.
  12. Van Rompaey, A.; Verstraeten, G.; Van Oost, K.; Govers, G.; Poesen, J. Modelling mean annual sediment yield using a distributed approach. Earth Surf. Process. Landf. 2001, 26, 1221–1236. [Google Scholar] [CrossRef] [Scilit]
  13. Verstraeten, G.; Van Oost, K.; Van Rompaey, A.; Poesen, J.; Govers, G. Evaluating an integrated approach to catchment management to reduce soil loss and sediment pollution through modelling. Soil Use Manag. 2002, 18, 386–394. [Google Scholar] [CrossRef] [Scilit]
  14. Verstraeten, G.; Prosser, I.; Fogarty, P. Predicting the spatial patterns of hillslope sediment delivery to river channels in the Murrumbidgee catchment, Australia. J. Hydrol. 2007, 334, 440–454. [Google Scholar] [CrossRef] [Scilit]
  15. Vanegas, P.; Cattrysse, D.; Van Orshoven, J. Comparing exact and heuristic methods for site location based on multiple attributes: An afforestation application. In Proceedings of the Computational Science and Its Applications—ICCSA 2008, Perugia, Italy, 30 June–3 July 2008; Volume 5072, pp. 389–404. [Google Scholar] [CrossRef] [Scilit]
  16. Vanegas, P. A Spatially Explicit Approach to the Site Location Problem in Raster Maps with Application to Afforestation. Master’s Thesis, KU Leuven, Leuven, Belgium, 2010. [Google Scholar]
  17. Domingues, G.; Marcatti, G.; dos Santos, A.; Lorenzon, A.; Telles, L.d.A.; de Castro, N.; Barros, K.; Gonzáles, D.; de Carvalho, J.; Gandine, S.d.S.; et al. Optimized allocation of forest restoration zones to minimize soil losses in watersheds. J. Environ. Manag. 2020, 271, 110923. [Google Scholar] [CrossRef] [Scilit]
  18. Estrella, R. Where to Afforest? Single and Multiple Criteria Evaluation Methods for Spatio-Temporal Decision Support, with Application to Afforestation. Ph.D. Thesis, KU Leuven, Leuven, Belgium, 2015. (In English) [Google Scholar]
  19. Castillo Reyes, G.; Estrella, R.; Roose, D.; Abrams, F.; Jiménez Moya, G.; Van Orshoven, J. Spatially targeted afforestation to minimize sediment loss from a catchment: An efficient hill climbing method considering spatial interaction. Environ. Model. Softw. 2024, 176, 106000. [Google Scholar] [CrossRef] [Scilit]
  20. Castillo-Reyes, G.; Roose, D.; Jiménez-Moya, G.; Estrella, R.; Vanegas-Peralta, P.; Avila-Ordóñez, E.; Cazorla-Vanegas, P.; Van Orshoven, J. Assessing the impact of deforestation on sedimentation using the CAMF heuristic: Application in Manicaragua, Cuba. In Proceedings of the UCIENCIA 2025, UCI, Varadero, Cuba, 14–17 October 2025. [Google Scholar]
  21. Verstraeten, G.; Govers, G.; Van Oost, K.; Van Rompaey, A.; Notebaert, B.; Van de Wauw, J.; Renders, D.; Gobeyn, S.; Van Hoey, S.; De Vleeschouwer, N.; et al. Watem-Sedem/Watem-Sedem, 5.0.1; Zenodo: Geneva, Switzerland, 2024. [CrossRef]
  22. Deproost, P.; Renders, D.; Van de Wauw, J.; Van Ransbeeck, N.; Verstraeten, G. Herkalibratie van WaTEM/SEDEM Met Het DHMV-II Als Hoogtemodel: Eindrapport; Technical Report; Departement Omgeving: Brussel, Belgium, 2018.
  23. Castillo-Reyes, G.; Estrella, R.; Gabriels, K.; Van Orshoven, J.; Abrams, F.; Roose, D. Selecting sites for afforestation to minimize sediment loss from a river basin: Computational complexity of Single and Multiple Flow Direction Methods in raster databases. Comput. Geosci. 2023, 171, 105269. [Google Scholar] [CrossRef] [Scilit]
  24. Abrams, F. Towards More Effective Spatio-Temporal Schemes for Remediation of Agricultural Soils in Response to Large-Scale Contamination with Radionuclides. Ph.D. Thesis, KU Leuven, Leuven, Belgium, 2023. (In English) [Google Scholar]
  25. Yoshimura, K.; Onda, Y.; Kato, H. Evaluation of Radiocaesium wash-off by soil erosion from various land uses using USLE plots. J. Environ. Radioact. 2015, 139, 362–369. [Google Scholar] [CrossRef] [Scilit]
  26. Kitamura, A.; Yamaguchi, M.; Kurikami, H.; Yui, M.; Onishi, Y. Predicting sediment and cesium-137 discharge from catchments in eastern Fukushima. Anthropocene 2014, 5, 22–31. [Google Scholar] [CrossRef] [Scilit]
  27. Yu, P.L. A Class of Solutions for Group Decision Problems. Manag. Sci. 1973, 19, 936–946. [Google Scholar] [CrossRef] [Scilit]
  28. Zeleny, M. A Concept of Compromise Solutions and the Method of the Displaced Ideal. Comput. Oper. Res. 1974, 1, 479–496. [Google Scholar] [CrossRef] [Scilit]
  29. Abrams, F.; Hendrickx, L.; Turcanu, C.; Sweeck, L.; Van Orshoven, J. Multi-Criteria Decision Analysis to Support the Remediation of Polluted Soils: A Review of Case Studies. Land 2024, 13, 887. [Google Scholar] [CrossRef] [Scilit]
  30. Yoon, K. Systems Selection by Multiple Attribute Decision Making. Ph.D. Thesis, Kansas State University, Manhattan, KS, USA, 1980. [Google Scholar]
  31. Hwang, C.; Yoon, K. Multiple Attribute Decision Making: Methods and Applications; Springer: New York, NY, USA, 1981. [Google Scholar] [CrossRef] [Scilit]
  32. Malakar, K.; Lu, C. Measuring sustainability as distance to ideal position of economy, society and environment: Application to China’s provincial water resources (2004–17). J. Environ. Manag. 2021, 292, 112742. [Google Scholar] [CrossRef] [Scilit]
  33. Mirzaee, M.; Safavi, H.R.; Taheriyoun, M.; Rezaei, F. Multi-objective optimization for optimal extraction of groundwater from a nitrate-contaminated aquifer considering economic-environmental issues: A case study. J. Contam. Hydrol. 2021, 241, 103806. [Google Scholar] [CrossRef] [Scilit]
  34. Estrella, R.; Cattrysse, D.; Van Orshoven, J. An Integer Programming Model to Determine Land Use Trajectories for Optimizing Regionally Integrated Ecosystem Services Delivery. Forests 2016, 7, 33. [Google Scholar] [CrossRef] [Scilit]
  35. Kitahara, H.; Okura, Y.; Sammori, T.; Kawanami, A. Application of Universal Soil Loss Equation (USLE) to Mountainous Forests in Japan. J. For. Res. 2000, 5, 231–236. [Google Scholar] [CrossRef] [Scilit]
  36. Chartin, C.; Evrard, O.; Onda, Y.; Patin, J.; Lefèvre, I.; Ottlé, C.; Ayrault, S.; Lepage, H.; Bonté, P. Tracking the early dispersion of contaminated sediment along rivers draining the Fukushima radioactive pollution plume. Anthropocene 2013, 1, 23–34. [Google Scholar] [CrossRef] [Scilit]
  37. Lepage, H.; Laceby, J.P.; Bonté, P.; Joron, J.L.; Onda, Y.; Lefèvre, I.; Ayrault, S.; Evrard, O. Investigating the source of Radiocesium contaminated sediment in two Fukushima coastal catchments with sediment tracing techniques. Anthropocene 2016, 13, 57–68. [Google Scholar] [CrossRef] [Scilit]
  38. Wakiyama, Y.; Onda, Y.; Yoshimura, K.; Igarashi, Y.; Kato, H. Land use types control solid wash-off rate and entrainment coefficient of Fukushima-derived Cs-137, and their time dependence. J. Environ. Radioact. 2019, 210, 105990. [Google Scholar] [CrossRef] [Scilit]
  39. Geospatial Information Authority of Japan. Geospatial Information Authority of Japan—English Website. 2025. Available online: https://www.gsi.go.jp/ENGLISH/ (accessed on 6 November 2025).
  40. Zanaga, D.; Van De Kerchove, R.; De Keersmaecker, W.; Souverijns, N.; Brockmann, C.; Quast, R.; Wevers, J.; Grosu, A.; Paccini, A.; Vergnaud, S.; et al. ESA WorldCover 10m 2020 v100, Evapotranspiration; Zenodo: Geneva, Switzerland, 2021. [Google Scholar] [CrossRef]
  41. Desmet, P.; Govers, G. A GIS procedure for automatically calculating the USLE LS factor on topographically complex landscape units. J. Soil Water Conserv. 1996, 51, 427–433. [Google Scholar] [CrossRef] [Scilit]
  42. Dosskey, M. Toward Quantifying Water Pollution Abatement in Response to Installing Buffers on Crop Land. Environ. Manag. 2001, 28, 577–598. [Google Scholar] [CrossRef] [Scilit] [PubMed]
  43. Fennessy, M.; Cronk, J. The effectiveness and restoration potential of riparian ecotones for the management of nonpoint source pollution, particularly nitrate. Crit. Rev. Environ. Sci. Technol. 1997, 27, 285–317. [Google Scholar] [CrossRef] [Scilit]
  44. Gabriels, K.; Willems, P.; Van Orshoven, J. An iterative runoff propagation approach to identify priority locations for land cover change minimizing downstream river flood hazard. Landsc. Urban Plan. 2022, 218, 104262. [Google Scholar] [CrossRef] [Scilit]
  45. Kinnell, P.I.A. Raindrop-Impact-Induced Erosion Processes and Prediction: A Review. Hydrol. Process. 2005, 19, 2815–2844. [Google Scholar] [CrossRef] [Scilit]
  46. Benavidez, R.; Jackson, B.; Maxwell, D.; Norton, K. A Review of the (Revised) Universal Soil Loss Equation ((R)USLE): With a View to Increasing Its Global Applicability and Improving Soil Loss Estimates. Hydrol. Earth Syst. Sci. 2018, 22, 6059–6086. [Google Scholar] [CrossRef] [Scilit]
  47. Merritt, W.S.; Letcher, R.A.; Jakeman, A.J. A Review of Erosion and Sediment Transport Models. Environ. Model. Softw. 2003, 18, 761–799. [Google Scholar] [CrossRef] [Scilit]
  48. Wainwright, J.; Parsons, A.; Cooper, J.; Gao, P.; Gillies, J.; Mao, L.; Orford, J.; Knight, P. The concept of transport capacity in geomorphology. Rev. Geophys. 2015, 53, 1155–1202. [Google Scholar] [CrossRef] [Scilit]
  49. Najafi, S.; Dragovich, D.; Heckmann, T.; Sadeghi, S.H. Sediment Connectivity Concepts and Approaches. Catena 2021, 196, 104880. [Google Scholar] [CrossRef] [Scilit]
  50. Matthews, F.; Kasprzak, A.; Verstraeten, G. Mapping the Soil Erosion Risk in Flanders: A Remote Sensing Based Assessment of the Crop Management Factor (C-Factor); Departement Omgeving Vlaanderen: Brussel, Belgium, 2024.
  51. Delmas, M.; Garcia-Sanchez, L.; Nicoulaud-Gouin, V.; Onda, Y. Improving transfer functions to describe Radiocesium wash-off fluxes for the Niida River by a Bayesian approach. J. Environ. Radioact. 2017, 167, 100–109. [Google Scholar] [CrossRef] [Scilit]
Figure 3. Topographic and sediment-transport characteristics of the Niida catchment: (a) terrain slope, (b) flow directions visualized using the single-direction D8 algorithm for simplicity; sediment routing in the simulations was performed using the FD8 variant of the MFD model, (c) LS-factor, (d) sediment production before afforestation, and (e) sediment transport capacity before afforestation. Coordinates are shown in WGS 84/UTM zone 54N (EPSG:32654).
Land 15 01557 g003
Figure 4. 137Cs concentration in sediment in the Niida river catchment after decontamination. The low-contamination zones coincide with the decontaminated areas, although significant residual contamination remains. Coordinates are shown in WGS 84/UTM zone 54N (EPSG:32654).
Land 15 01557 g004
Figure 5. Comparison of Sediment Yield Reduction ( SYR ) and Cesium Yield Reduction ( CYR ) in function of the number of selected cells for afforestation for the three strategies: selection based on SYR , CYR , and DIST2IP. The inset in the right plot shows the largest difference between the CYR and DIST2IP strategies, observed when 100 cells are selected (≈0.28).
Land 15 01557 g005
Figure 6. Relative performance in SYR and CYR for the three scenarios, expressed as a percentage of the best-performing method. The inset in the right plot shows the largest difference between the CYR and DIST2IP strategies, observed when 100 cells are selected (≈0.28).
Land 15 01557 g006
Figure 7. Geographic distribution of the selected cells for afforestation from the set of candidate cells corresponding to the decontaminated zones from 2012 to 2014 in the Niida river catchment: (a) cells selected using DIST2IP; and (b) spatial coincidence of the selected cells: green cells represent locations selected by all three methods, while red and orange show cells uniquely selected by SYR and CYR , respectively. Note in (b) that there are no cells uniquely selected by DIST2IP. Coordinates are shown in WGS 84/UTM zone 54N (EPSG:32654).
Land 15 01557 g007aLand 15 01557 g007b
Figure 8. SYR versus CYR for the three scenarios: selection based on SYR , CYR , and DIST2IP.
Land 15 01557 g008
Table 1. C-factor values taken from [9,35,36], and the solid entrainment coefficients S c taken from [25], assigned to each land use type in the Niida river catchment.
Land Cover TypeC-Factor S c
Lake and Infrastructure00
Forest0.0010.084
Pasture0.020.012
Agriculture0.040.0023
Bare land0.50.0023
Table 2. Comparison of the observed annual averages of SY and CY at the Haramachi measurement station for the 2013–2018 period with the SY 0 and CY 0 values simulated using CAMF.
VariableObserved (Average)CAMFDiff. (%)
S Y 0 48,837 ton yr 1 50,166 ton yr 1 + 2.7
C Y 0 4.48 × 10 11 Bq yr 1 1.82 × 10 11 Bq yr 1 59.4
Table 3. Sediment Yield Reduction ( SYR ; ton yr 1 ) and Cesium Yield Reduction ( CYR ; × 10 9 Bq yr 1 ) at the outlet of the Niida catchment when up to 1000 candidate cells are selected for afforestation, for the three strategies: SYR , CYR , and DIST2IP.
# Selected CellsBased on SYRBased on CYRBased on DIST2IP
SYRCYRSYRCYRSYRCYR
10053646.84944908.39347048.370
20068318.09661789.66162679.659
30077988.557705310.185711910.183
40086098.994769810.444776210.442
50093219.119819310.602832610.600
60099629.204887010.717893610.716
70010,5579.374943410.810952510.809
80011,1039.492996510.89010,08710.889
90011,6069.61510,51310.96210,62310.960
100012,0879.78211,01811.02711,09111.026
Table 4. Sensitivity of the initial 137Cs yield ( CY 0 ; × 10 11 Bq yr 1 ), the 137Cs Yield Reduction ( CYR ; × 10 9 Bq yr 1 ), and their ratio ( CYR / CY 0 ; %) to the assumed decontamination efficiency and topsoil mixing depth when 100 cells are selected using DIST2IP. The reference scenario assumes a 50% reduction and a mixing depth of 5 cm.
DimensionAssumption CY 0 CYR CYR / CY 0
Reference50% reduction;
5 cm depth
1.826.683.67
Decontamination
efficiency
40% reduction1.836.793.71
20% reduction1.856.993.77
Mixing depth4 cm2.278.353.67
3 cm3.0311.143.67
2 cm4.5516.713.67
Disclaimer/Publisher’s Note: The statements, opinions and data contained in all publications are solely those of the individual author(s) and contributor(s) and not of MDPI and/or the editor(s). MDPI and/or the editor(s) disclaim responsibility for any injury to people or property resulting from any ideas, methods, instructions or products referred to in the content.