1. Introduction
The human–land relationship constitutes a central theme in geographical research [
1,
2]; its essence lies in elucidating the spatial coupling between the natural environment and human activities, as well as their regional differentiation. As the complexity of the human–land system continues to increase, the human–land relationship no longer manifests solely as a simple coupling between elements; rather, through land-use patterns, element allocation structures, and the organizational forms of human activities, it manifests at the regional scale as distinct types of regional functions [
3]. Consequently, regional function has become an important analytical perspective for characterizing the spatial expression and variations of the human–land relationship. Regional functions are not equally important across all regions; instead, they exhibit prominent dominant functional characteristics within specific spatial contexts [
4]. For border regions, their unique locational conditions and spatial attributes enable them to simultaneously undertake key functions such as economic development and security assurance within the national spatial system [
5]; thus, development functions and security functions emerge as particularly prominent components of the functional system of border regions.
With the deepening of globalization and multilateral cooperation, the relationship between development and security has become a critical concern for countries and regions. In an increasingly volatile international environment, traditional and non-traditional security factors are increasingly intertwined, positioning border regions as important areas of interstate cooperation and strategic competition, where tensions between development and security are particularly pronounced [
6,
7]. Against this backdrop, border regions, located at the periphery of national territories, function not only as the “first line of defense” for national security but also as a “frontline window” for external opening-up. They benefit from favorable conditions for economic development while simultaneously being exposed to geopolitical uncertainties and external security risks. The Fourth Plenary Session of the 20th Central Committee of the Communist Party of China has emphasized the need to coordinate regional development with national security, thereby placing border regions in a strategically important position for balancing development and security and highlighting the significance of their long-term stability and sustainable development. Accordingly, achieving an appropriate balance between security and development in border regions is essential for promoting their sustainable and high-quality development.
The evolution and optimization of regional functions provide an important perspective for understanding dynamic trade-offs and functional adaptation within human–environment systems [
8,
9]. Regional functions provide important manifestations of the state of human–environment systems, and their formation and evolution are shaped by interactions among multiple factors, such as resource and environmental constraints, factor agglomeration, and institutional regulation [
10]. Existing research on functional zoning and regional multifunctionality has shown that different spatial units often accommodate multiple development objectives, with their functional structures characterized by dynamic adjustment and spatial differentiation [
11,
12]. Meanwhile, international studies have shown that synergies and trade-offs commonly occur among these functions, with substantial spatial heterogeneity observed across spatial scales [
13,
14,
15]. From the perspective of the conceptual scope of regional functions, development and security functions can be viewed as distinct functional systems with different objectives and operating mechanisms. Their relationship may involve synergies, trade-offs, and conflicts. Border regions represent particularly important spatial contexts in which these relationships are manifested, and a simplistic binary framework based solely on “development priority” or “security priority” cannot adequately capture the complex realities of border regions. Existing research on regional multifunctionality has primarily focused on synergies and trade-offs among production, living, and ecological functions [
16,
17], with limited attention being paid to the relationship between development and security functions in border regions. Existing coordination studies have concentrated on system-level coupling and coordination [
18,
19], while relatively little attention has been given to the adaptation processes among functions and their dynamic evolution. Furthermore, functional zoning approaches often rely on classifications based on single-function states [
20,
21] and therefore provide limited insight into the relationships between functional states and their evolutionary trajectories. Therefore, this paper develops a regional functional adaptation analysis framework from the perspective of the development–security nexus to examine the spatial differentiation and evolutionary characteristics of development and security functions and their adaptation in border regions.
The concept of “adaptation” originated in systems science and ecology [
22], emphasizing the process through which a system maintains stable operation and supports sustainable development by adjusting its constituent elements and functions in response to changes in the external environment and internal structure. With the development of research on human–land systems, the adaptation framework has been increasingly applied to regional development and spatial governance [
23,
24], where it has been used to characterize the degree of functional adaptation and the dynamic adjustment relationships among different systems or functions. This paper defines regional functional adaptation as a state in which, within a specific spatial scale and stage of development, different regional functions, constrained by resource and environmental conditions and guided by regional development needs, achieve mutual support and coordinated development through structural adjustment and capacity enhancement. Compared with coupling, coordination, and matching, coupling primarily reflects the interactions among systems [
25,
26], whereas coordination focuses on the degree of coordinated development among systems [
27,
28], and matching emphasizes the correspondence between different functions [
29,
30]. Functional adaptation, however, extends beyond matching by incorporating the degree of functional coordination [
31,
32,
33] and emphasizing the capacity of different functional systems to adjust synergistically during dynamic evolution. Consequently, functional adaptation provides a more comprehensive representation of the relationship between the development and security functions in border regions by capturing both their degree of coordination and their capacity for dynamic adjustment.
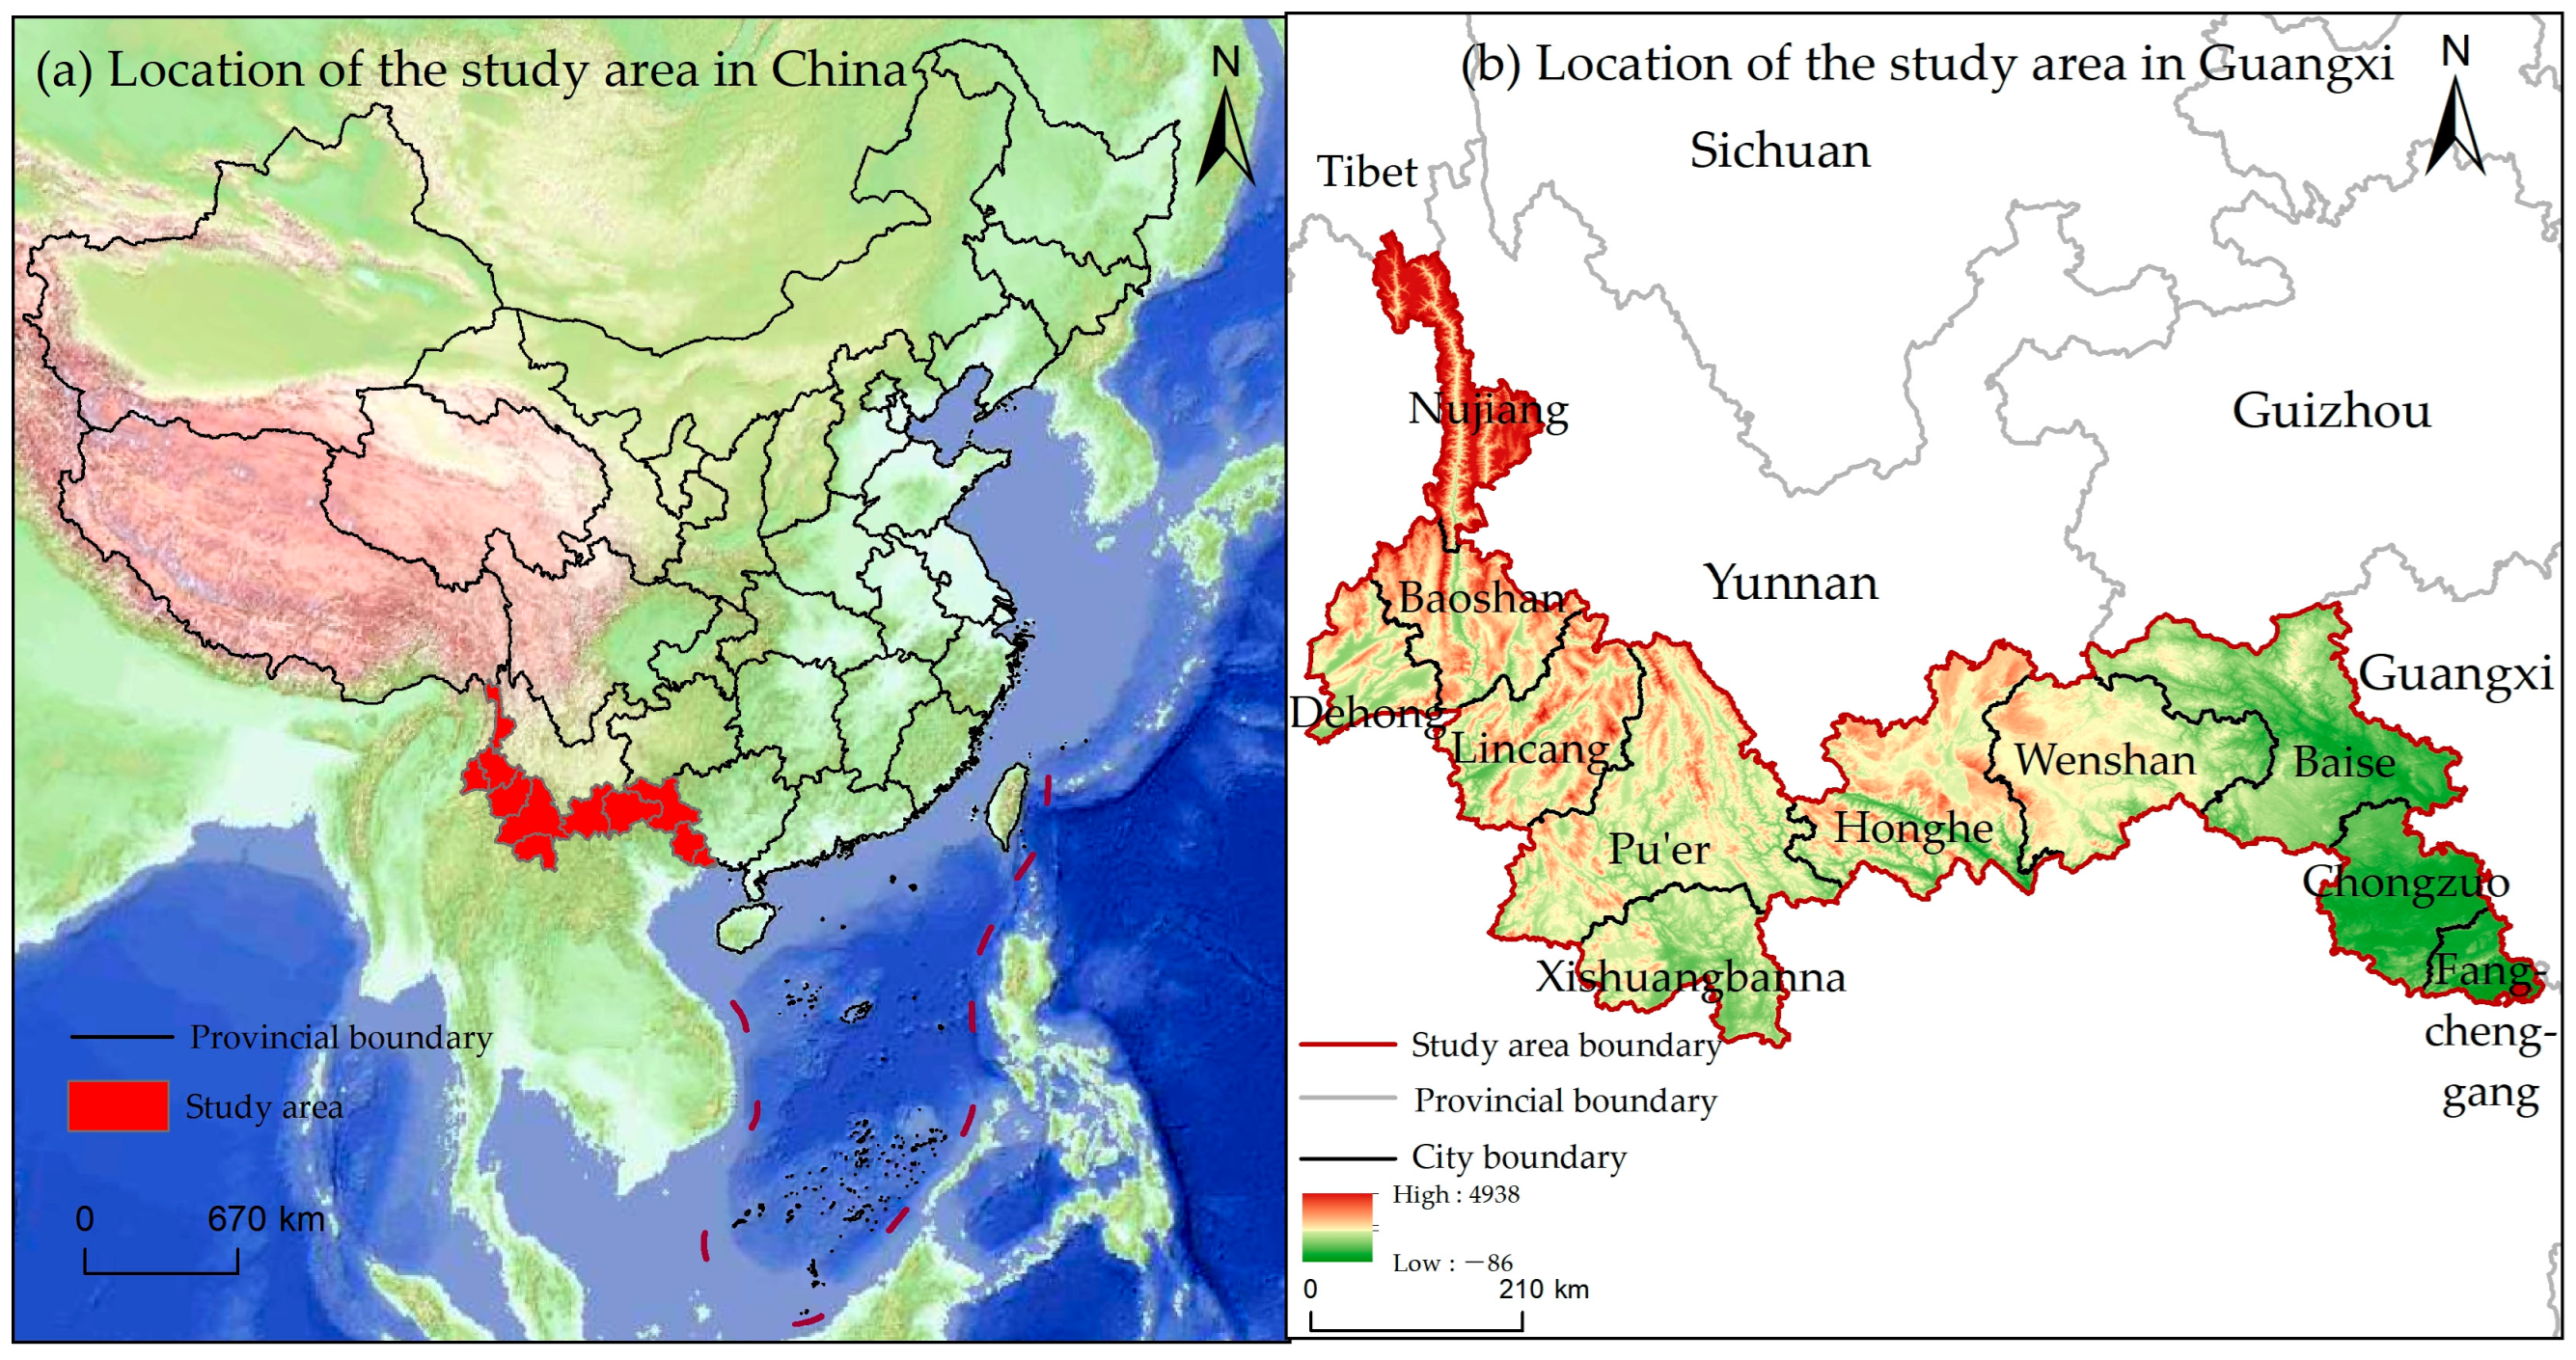
The Yunnan–Guangxi border region in China, serving as a gateway connecting China with South and Southeast Asia and as an important ecological barrier in Southwest China, has a unique geographical location and multifunctional roles. These characteristics enable the region to undertake multiple strategic functions in territorial development and spatial use, including facilitating external opening-up, safeguarding ecological security, and maintaining border stability. However, research on functional adaptation in border regions remains limited, and existing studies have not adequately addressed the tension between open development and security governance. Building on this premise, the Yunnan–Guangxi border region is selected as a case study. From a development–security linkage perspective, a regional functional evaluation system incorporating border-specific indicators, such as border trade development and national territorial security, is constructed. The CRITIC method is employed to measure the levels of development and security functions, while an adaptation model and spatial statistical methods are used to examine their spatiotemporal evolution and adaptation relationships from 2002 to 2022, followed by a classification of functional adaptation types according to adaptation levels. On this basis, differentiated guidance and governance strategies are proposed according to the functional characteristics of different adaptation types. This study aims to reveal the adaptation relationship and spatial differentiation between development and security functions in the Yunnan–Guangxi border region, enhance understanding of the synergistic evolution of regional functions in border areas, and provide a reference for coordinating development and security, improving territorial spatial governance, and strengthening comprehensive governance in frontier regions.
2. Research Framework and Methodology
2.1. Research Framework
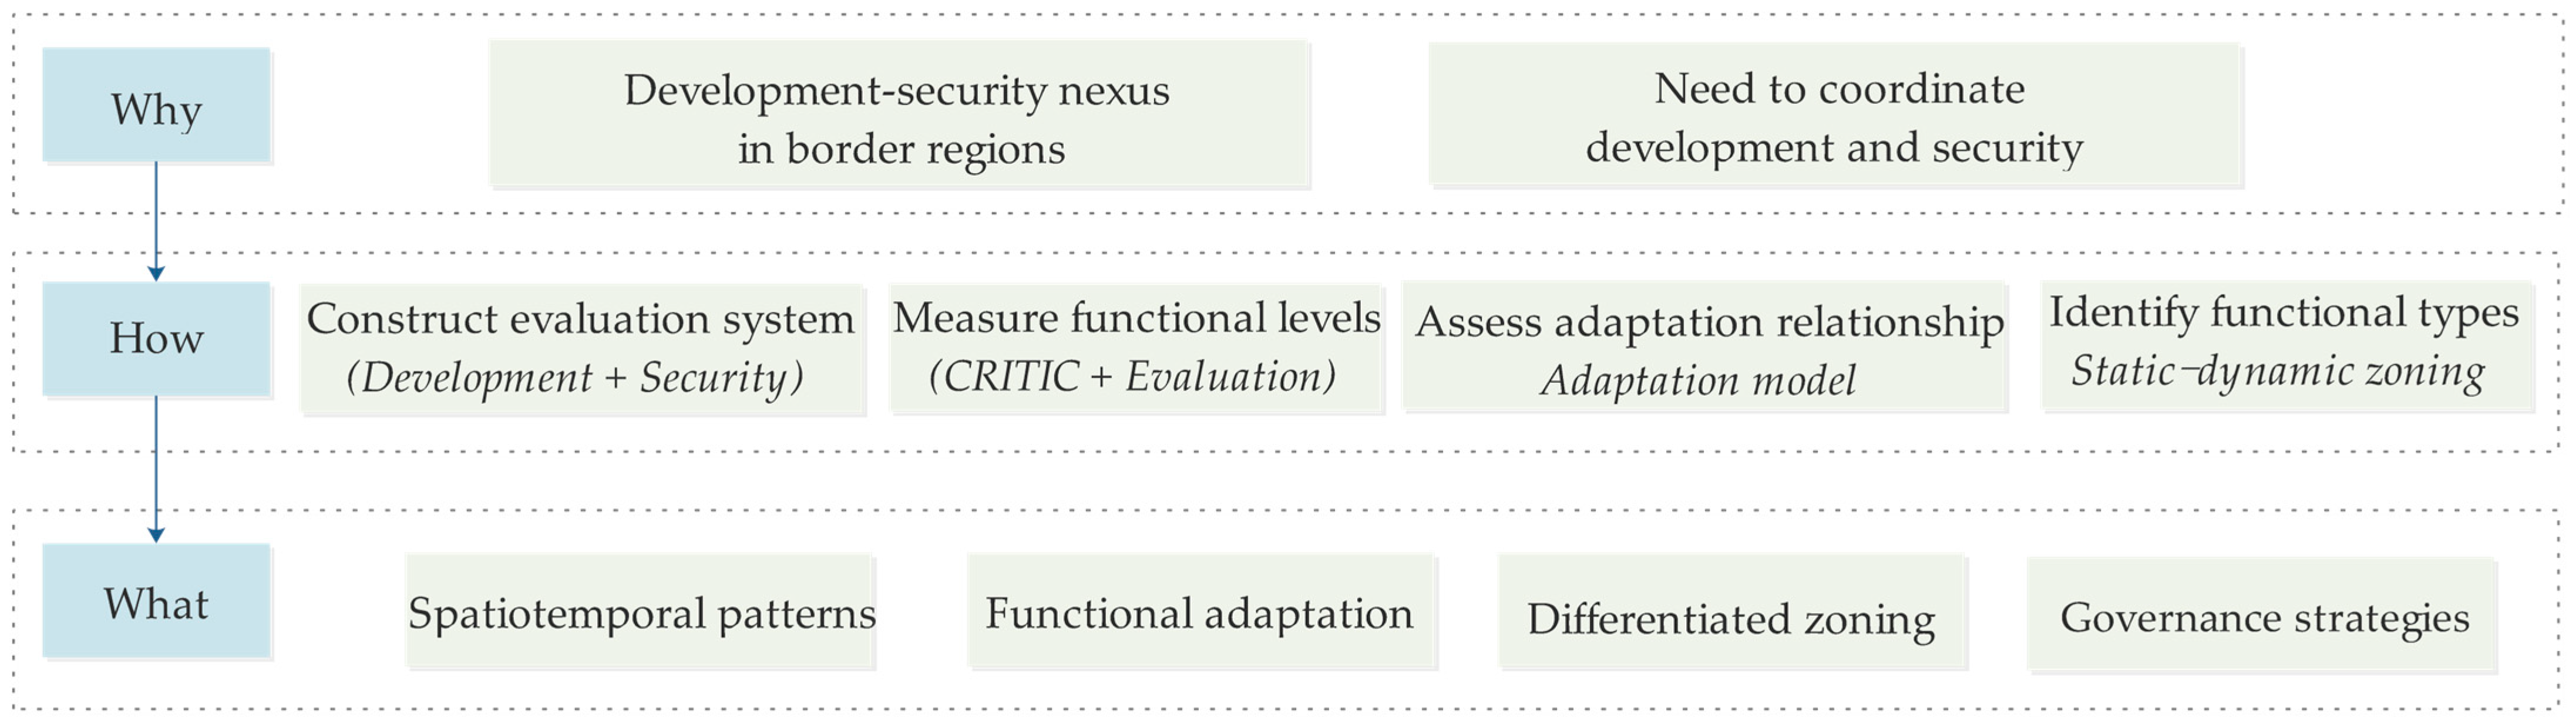
This study develops a “Why–How–What” research framework to examine the adaptation relationship between the development and security functions in the Yunnan–Guangxi border region. As illustrated in
Figure 1, the research framework is organized around three dimensions: “Why,” “How,” and “What,” corresponding to the research rationale, methodological approach, and key findings, respectively. The overall research approach begins with an examination of the development–security nexus in border regions, proceeds through the measurement of regional functions and analysis of their adaptation relationship, identifies distinct functional types, and ultimately translates the findings into differentiated governance strategies. The “Why” dimension provides the conceptual starting point for the study. Border regions simultaneously perform development and security functions, which are not independent but closely interconnected. Consequently, how development and security can be effectively coordinated constitutes the central research question of this study.
From this perspective, this paper translates the development–security nexus into an analyzable spatial problem by examining whether development and security functions in border regions are mutually adapted and how their adaptation relationship varies across county-level administrative units. This approach provides a theoretical and practical basis for examining the two functions jointly rather than separately. The “How” dimension provides the analytical pathway for addressing these research questions. First, a regional functional evaluation system covering both development and security dimensions is constructed to characterize the overall functional state of border regions. By incorporating border-specific indicators, such as border trade development and national territorial security, the system captures the distinctive characteristics of border regions and reflects both their development and security functions. Second, the CRITIC method is employed to evaluate the levels of the development and security functions. The method is used to determine the objective weights of the evaluation indicators and derive comprehensive scores for the two functions, thereby providing a quantitative basis for subsequent analysis of their adaptation relationship. Third, an adaptation model is applied to examine the adaptation relationship between the development and security functions. This step not only considers the relative levels of the two functions but also evaluates the degree of their adaptation and coordination. Subsequently, spatial statistical methods are employed to examine the spatial differentiation and temporal evolution of the two functions and their adaptation relationship, thereby extending the analysis from a static quantitative assessment to the identification of spatial patterns and evolutionary trajectories. Finally, based on the development and security functions and their adaptation characteristics, a static–dynamic zoning method is adopted to classify regional functional adaptation types and identify the functional characteristics and governance needs of different county-level administrative units. The “What” dimension summarizes the key findings derived from the preceding analyses. Specifically, this paper reveals the spatiotemporal evolution of the development and security functions, examines their adaptation relationship and spatial differentiation, classifies regional functional adaptation types, and proposes differentiated governance strategies based on these findings.
Therefore, the various methods employed in this paper do not function as independent analytical tools but form an integrated methodological framework with a clear progression. The CRITIC method provides the basis for measuring regional functions; the functional adaptation model identifies the adaptation relationship between development and security functions; spatial statistical methods reveal the spatial distribution and evolutionary characteristics of this relationship; and functional classification translates the analytical results into differentiated zoning and governance implications. Through this research framework, a coherent linkage is established among regional functional measurement, the identification of development–security adaptation relationships, and differentiated governance of border regions.
2.2. Functional Score Calculation
2.2.1. Indicator System Construction
Building upon existing research on regional functions and considering the spatial characteristics and functional needs of border regions, this paper reconfigures the regional functional system in a context-specific manner around two dominant dimensions: development functions and security functions. Regarding development functions, relevant studies generally focus on economic vitality, industrial foundations, and livelihood conditions, particularly emphasizing the supporting roles of border trade [
34], agricultural production, and living conditions in sustaining regional stability and development [
35]. Regarding security functions, existing research predominantly examines the role of border regions in safeguarding national security [
36] and maintaining ecological security [
37,
38], with attention given to territorial spatial governance, social governance, and ecological protection. Synthesizing these insights, the development functions of border regions are classified into three categories: border trade development, agricultural development, and livelihood development; the security functions are classified into three categories: territorial security, social security, and ecological security. Based on this framework, an evaluation index system for regional functions from the development–security perspective is constructed.
To provide a comprehensive evaluation of regional functions in the Yunnan–Guangxi border region, an indicator system was constructed (
Table 1). Among these indicators, the border trade development function represents a distinctive characteristic of border regions and reflects their ability to leverage locational advantages. The agricultural development function constitutes an important foundational function of border regions. It is associated not only with the regional supply of agricultural products and resource-use efficiency but also with stabilizing border populations and supporting long-term regional development. The livelihood development function is intended to provide a comprehensive assessment of living conditions in border regions. The territorial security function represents a distinctive function of border regions and is associated with safeguarding territorial integrity and maintaining border stability. The social security function reflects the level of social stability in border regions and emphasizes their capacity to prevent and respond to social risks and crises. The ecological security function is defined in recognition of the fact that border regions largely comprise natural ecological barriers and contain relatively fragile ecosystems.
2.2.2. CRITIC Weight
This study employs the CRITIC (Criteria Importance Through Intercriteria Correlation) weighting method to objectively assign weights to the indicator system [
39], with indicator weights determined by quantifying the contrast intensity and conflict among indicators. During the weighting procedure, the contrast intensity and conflict measures are multiplied to obtain the information content of each indicator, which is then normalized to derive the final weights (
Table 1). The regional functional indices are calculated by summing the standardized indicator values weighted by their corresponding CRITIC weights. The weights were further validated using Monte Carlo simulations. The simulated mean weights were highly consistent with the original weights, with relative deviations remaining low (the maximum deviation was 0.013%), indicating that random perturbations had little influence on the estimated weights and supporting the robustness and reliability of the weighting results. In this study, the natural breaks method is used to classify the functional scores into different levels, followed by spatial analysis of their distribution and evolution.
2.3. Coupling Coordination Model
The Coupling Coordination Degree Model is derived from coupling theory and is primarily used to measure interactions among multiple systems and the degree of their coordinated development [
40]. Here, the coupling degree reflects the intensity of interactions among systems, the comprehensive evaluation index represents their overall development level, and the coupling coordination degree characterizes the degree of coordinated development among them. This study constructs a Development–Security Function Coupling Coordination Degree Model by treating the development and security functions as two subsystems to examine their degree of coordinated development. The model is specified as follows:
- (1)
Coupling Degree Calculation
In the formula, Cij denotes the coupling degree between the development function and the security function of region i in year j; U1ij and U2ij represent, respectively, the development function index and the security function index of region i in year j. The closer Cij is to 1, the more tightly the two functions interact with each other.
- (2)
Calculation of the comprehensive evaluation index
In the formula: Tij denotes the comprehensive evaluation index for the development function and security of Region i in year j; α and β represent the weights assigned to the development function and the security security, respectively. Given that border regions are tasked with both regional development objectives and national security safeguarding functions—both of which hold equal importance—the paper sets α = β = 0.5.
- (3)
Coupling coordination degree calculation
In the formula: Dij denotes the coupling coordination degree between the development function and the security in region i during year j, with a value range of [0, 1]. A higher value indicates a stronger level of synergistic development between the development function and the security security.
2.4. Comprehensive Adaptation Model
Building on the concept of functional adaptation as a comprehensive representation of matching and coordination, this study employs an adaptation degree model—combining matching degree and coupling coordination degree—to measure the adaptation level between the development and security functions. The adaptation degree model is used to assess the overall relationship among two or more systems by jointly considering their coordination and matching characteristics. By combining the coupling coordination degree and matching degree through a weighted formulation, an adaptation degree index is derived to capture the overall degree of coordinated and synergistic development among systems. In this paper, a sequence-based matching degree model is employed to quantify the correspondence between the growth rates of the development and security functions across spatial units.
2.4.1. Matching Degree Model
The matching evaluation model is used to assess the degree of correspondence between systems in terms of magnitude, structure, and growth rate, with a focus on whether the relationships among system elements are appropriately aligned. The sequence-based matching index can capture the degree of correspondence between systems across different periods; accordingly, it is employed in this study to quantify their matching degree [
41].
In the formula: Ui denotes the spatial matching degree of computational unit i under the cumulative ranking proportion method; Ui in [0, 1], where a matching degree closer to 1 indicates a better match between the elements; wi represents the cumulative proportion of element x corresponding to computational unit i after sorting in ascending order; n is the rank index of xi after sorting in ascending order; and vi represents the cumulative proportion of element y corresponding to computational unit i after sorting in ascending order; m is the rank index of yi after sorting in ascending order.
2.4.2. Adaptation Degree Model
Because the matching degree alone cannot fully capture the overall adaptation state of the two systems, the matching degree and coupling coordination degree are integrated through a linear weighted method based on their relative importance, from which a comprehensive adaptation degree index is derived.
In the formula,
Aij denotes the adaptation degree of region
i in year
j;
a and
b denote the weights assigned to the coupling coordination degree and matching degree, respectively; and
D denotes the coupling coordination degree. Drawing upon the approach to determining the relative importance of system elements in systems theory and previous studies by Ma Xuefeng [
33], Wang Zhaofeng [
32], and others, the coupling coordination degree is considered to provide the foundation for adaptation between the two functional systems, whereas the matching degree reflects the correspondence between their functional levels. Accordingly, a slightly greater weight is assigned to the coupling coordination degree to emphasize the foundational role of functional coordination in the adaptation assessment; specifically [
41],
a = 0.6 and
b = 0.4. Additionally, using the Gini coefficient classification method with 0.6 as the threshold, the adaptation degree is classified into five levels: highly maladaptive (0 ≤
A < 0.5), moderately maladaptive (0.5 ≤
A < 0.6), basically adaptive (0.6 ≤
A < 0.7), relatively adaptive (0.7 ≤
A < 0.8), and highly adaptive (0.8 ≤
A ≤ 1.0).
2.5. Comprehensive Zoning Scheme
This paper examines the development–security system in the Yunnan–Guangxi border region from two dimensions—static structure and dynamic adaptation—and develops a comprehensive zoning scheme accordingly [
42,
43]. The static structure is characterized by the classification of development–security states based on relative structural criteria, which enables regional capabilities to be assessed, the underlying pattern of resource allocation to be identified, and relative strengths and weaknesses to be revealed. The dynamic adaptation dimension focuses on the adaptation relationship between development and security and examines their interdependence and coordination. The “structure–adaptation” two-dimensional analytical framework enables a multidimensional diagnosis of regional functional characteristics and provides a basis for identifying underlying imbalances and improving the precision of zoning.
2.5.1. Classification of State Types
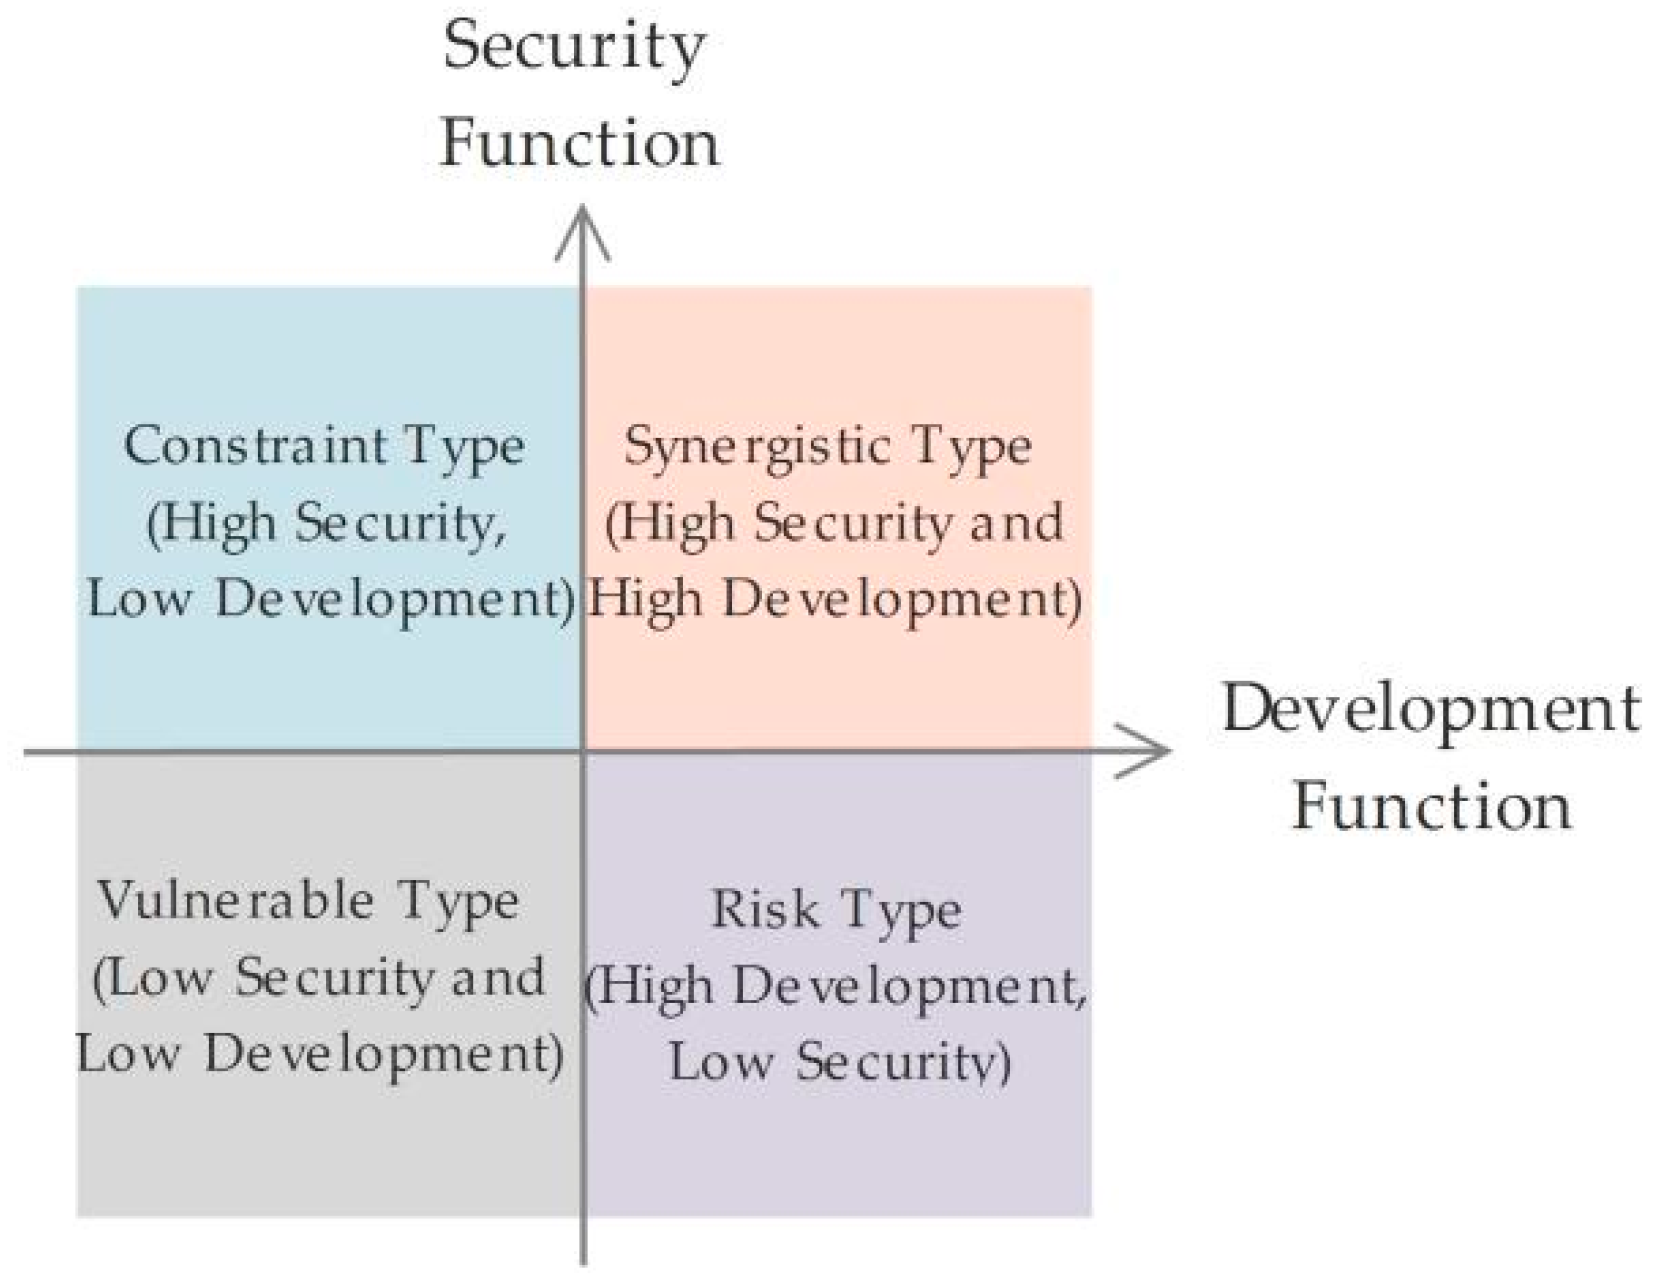
In this study, the development and security functions are first classified into high and low levels by comparing their annual values with the corresponding regional averages. When a county’s functional value exceeds the corresponding regional average in a given year, a high functional level is assigned; otherwise, a low functional level is assigned. Building on this basis, the two functional levels are combined to establish four static functional structure types: synergistic, constraining, vulnerable, and risky (
Figure 2). Specifically, the “synergistic” type is characterized by relatively high levels of both development and security functions, indicating a strong foundation for regional development and robust security assurance capacity. The “constraining” type is characterized by a relatively strong security function but an insufficient development function, indicating that limitations in development may be associated with an imbalance between security and development. The “vulnerable” type is characterized by a relatively high development function but an inadequate security function, indicating potential deficiencies in security assurance. The “risky” type is characterized by relatively low levels of both functions, indicating weak foundations for regional development and security support. For 2002, 2012, and 2022, the average security function values were 0.463, 0.482, and 0.492, respectively, while the corresponding average development function values were 0.349, 0.418, and 0.438, respectively.
2.5.2. Integrated Zoning Scheme
To further propose targeted enhancement strategies, this paper builds upon the classification of static functional states by introducing the development–security functional adaptation relationship to establish an integrated zoning scheme. The static functional state reflects the combined levels of development and security functions at the end of the study period, whereas the dynamic adaptation relationship characterizes the evolution of the adaptation level between the two functions throughout the study period. Specifically, the integrated zoning type is determined jointly by the static functional state and the dynamic adaptation status. The static functional state identifies the current foundation of the regional development–security relationship, whereas the dynamic adaptation status characterizes the evolutionary coordination between the two functions. Together, these two dimensions provide a basis for determining the future enhancement direction of each region.
First, the original five adaptation levels are consolidated into three operational categories according to their degree of coordination: “Maladjusted” (highly maladaptive and moderately maladaptive), “Coordinated” (basically adaptive), and “Highly Coordinated” (relatively adaptive and highly adaptive). Among these, the “Maladjusted” category indicates a pronounced lack of adaptation between development and security functions; the “Coordinated” category indicates that the two functions are evolving in a generally synchronized manner; and the “Highly Coordinated” category indicates that a favorable synergistic relationship has been established between them. On this basis, the static functional state and dynamic adaptation status are combined to establish an integrated zoning scheme (
Table 2), through which the regions are ultimately classified into five zoning categories: “Benchmark-Leading,” “Development-Led Coordination,” “Security-Led Coordination,” “Transformation and Enhancement,” and “Priority Intervention.”
4. Results
4.1. Spatiotemporal Evolution Characteristics of Regional Functions in the Yunnan–Guangxi Border Region
4.1.1. Spatiotemporal Evolution of Comprehensive Regional Functions
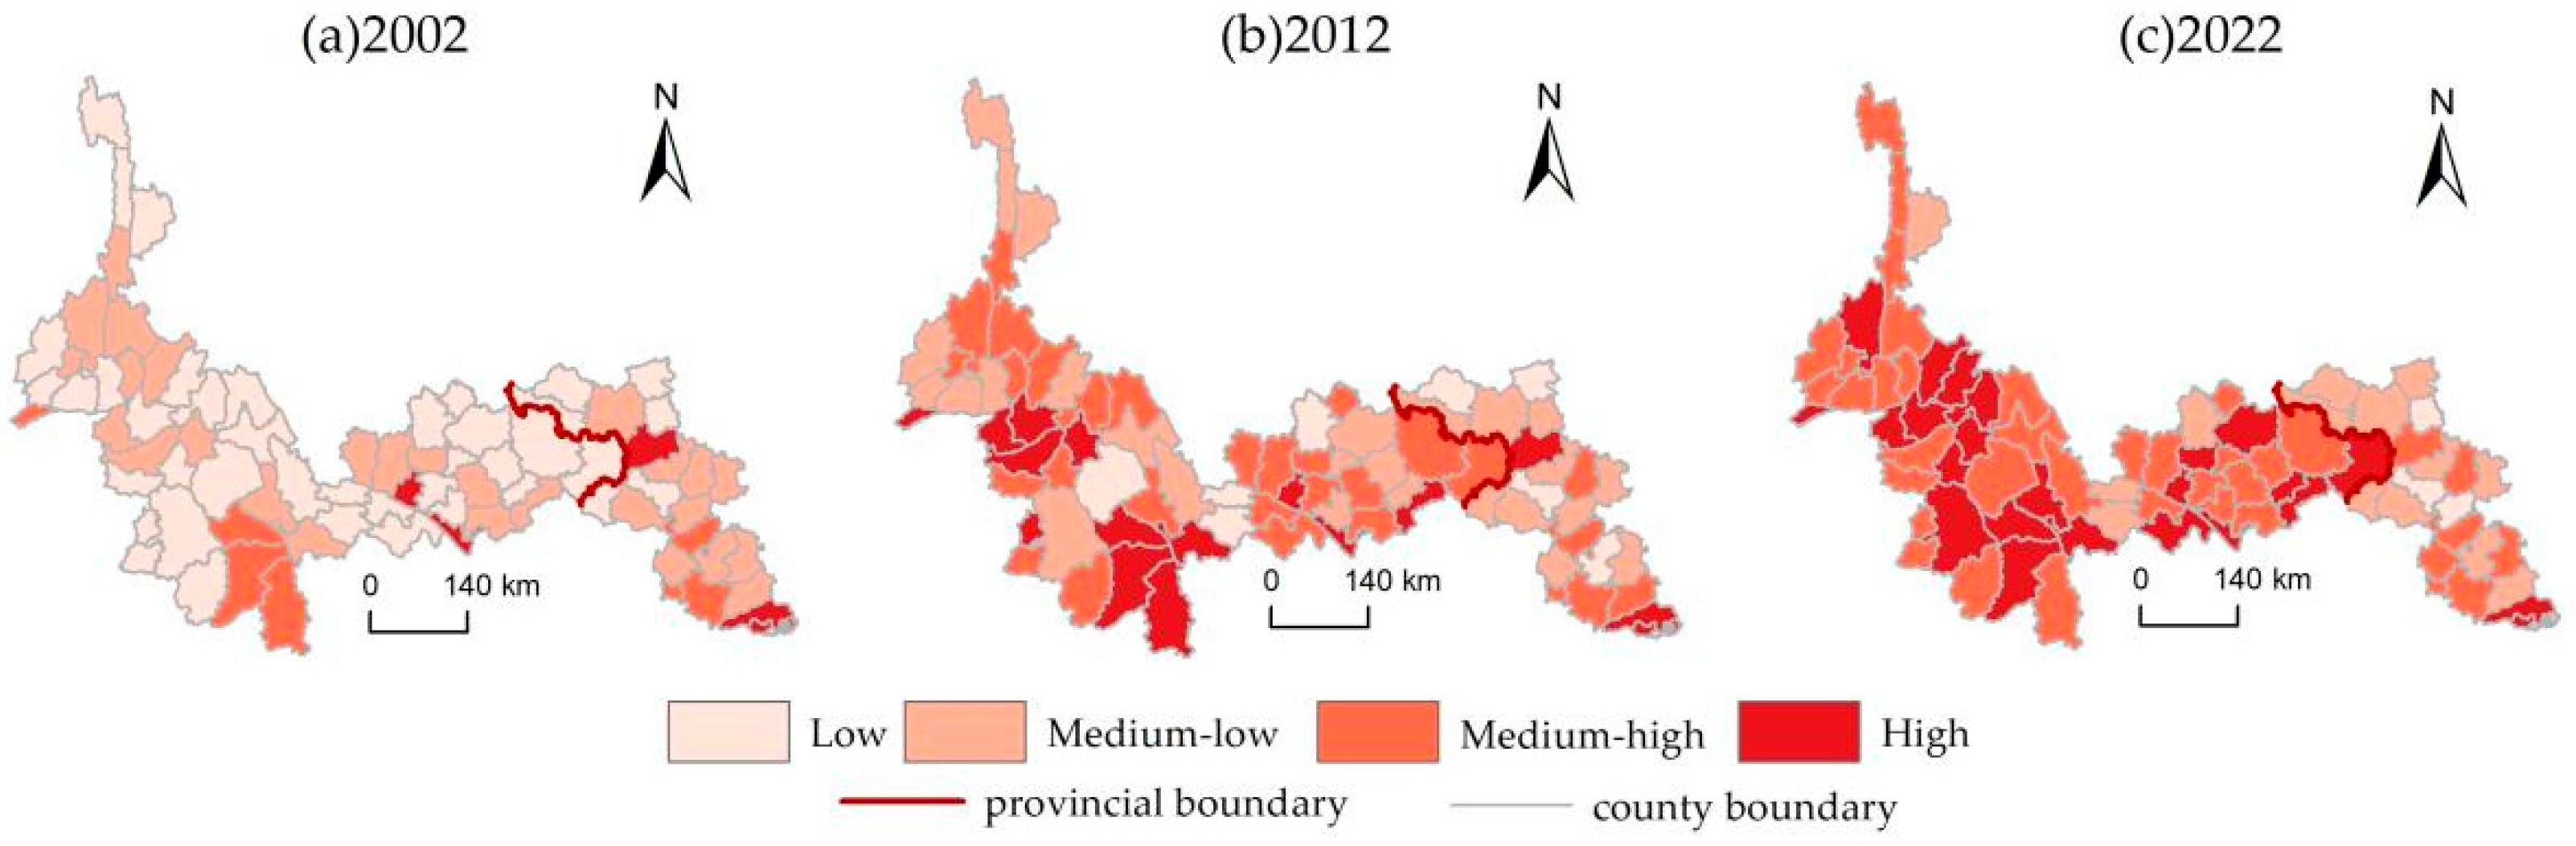
During the study period, the overall level of comprehensive regional functions in the Yunnan–Guangxi border region increased steadily, with the mean value rising from 0.406 to 0.450 and then to 0.465, indicating a phased pattern of rapid growth followed by gradual stabilization. The minimum values of comprehensive regional functions continued to increase, while high-value zones became relatively stable after 2012. Meanwhile, regional disparities first narrowed and subsequently widened. From a policy perspective, between 2002 and 2012, the implementation of the Western Development Strategy and policies targeting infrastructure improvement and livelihood enhancement in border regions contributed to the simultaneous improvement of development and security functions, resulting in relatively rapid growth in comprehensive regional functions. Since 2012, as ecological civilization initiatives, territorial spatial governance, and broader security requirements have been strengthened, development in border regions has been subject to increasing constraints, and improvements in comprehensive regional functions have gradually shifted toward structural optimization and functional coordination. Differences in geographical conditions and policy implementation capacity have further contributed to divergent evolutionary trajectories across regions (
Figure 4).
The evolution of comprehensive regional functions differed markedly between the Guangxi and Yunnan border sections. Overall, the Guangxi border section exhibited a relatively high level of comprehensive regional functions during the early stage, whereas the Yunnan border section subsequently surpassed Guangxi and continued to improve during the middle and later stages. The comprehensive regional functions of the Guangxi border section increased only slightly during the early stage before stabilizing, with the mean value rising from 0.431 to 0.437 and then declining slightly to 0.436, thereby exhibiting a plateau-like pattern. This pattern may be attributed to the early development of border trade and transportation corridors based on its geographical advantages, followed by increasingly stringent constraints from ecological protection and spatial regulation. In contrast, the comprehensive regional functions of the Yunnan border section increased continuously throughout the study period, with the mean value rising from 0.395 to 0.456 and then to 0.476. Against a backdrop of improved infrastructure, advancing cross-border corridor construction, and strengthened territorial and ecological security functions, the synergistic enhancement of development and security functions is likely to have contributed to the sustained improvement of comprehensive regional functions in this region.
The spatiotemporal evolution of comprehensive regional functions exhibits pronounced spatial differentiation, with high-index zones concentrated along the border between Pu’er City and Xishuangbanna and extending outward toward both sides. As shown in
Figure 4, the spatial extent of high-value zones, identified using the natural breaks classification method, continued to expand, contributing to the overall improvement of comprehensive regional functions. The location of the county-level units with the highest comprehensive function scores shifted from Fangcheng District in 2002 to Hekou Yao Autonomous County in 2012 and finally to Ruili City in 2022, indicating a westward shift in the spatial center of high-function areas. All three are located along the national border, suggesting that their relatively high levels of comprehensive regional functions are closely associated with their border locations and port-related development. In particular, Ruili Port and Hekou Port are major ports on the China–Myanmar and China–Vietnam borders, respectively.
4.1.2. Spatiotemporal Evolution of Development Functions
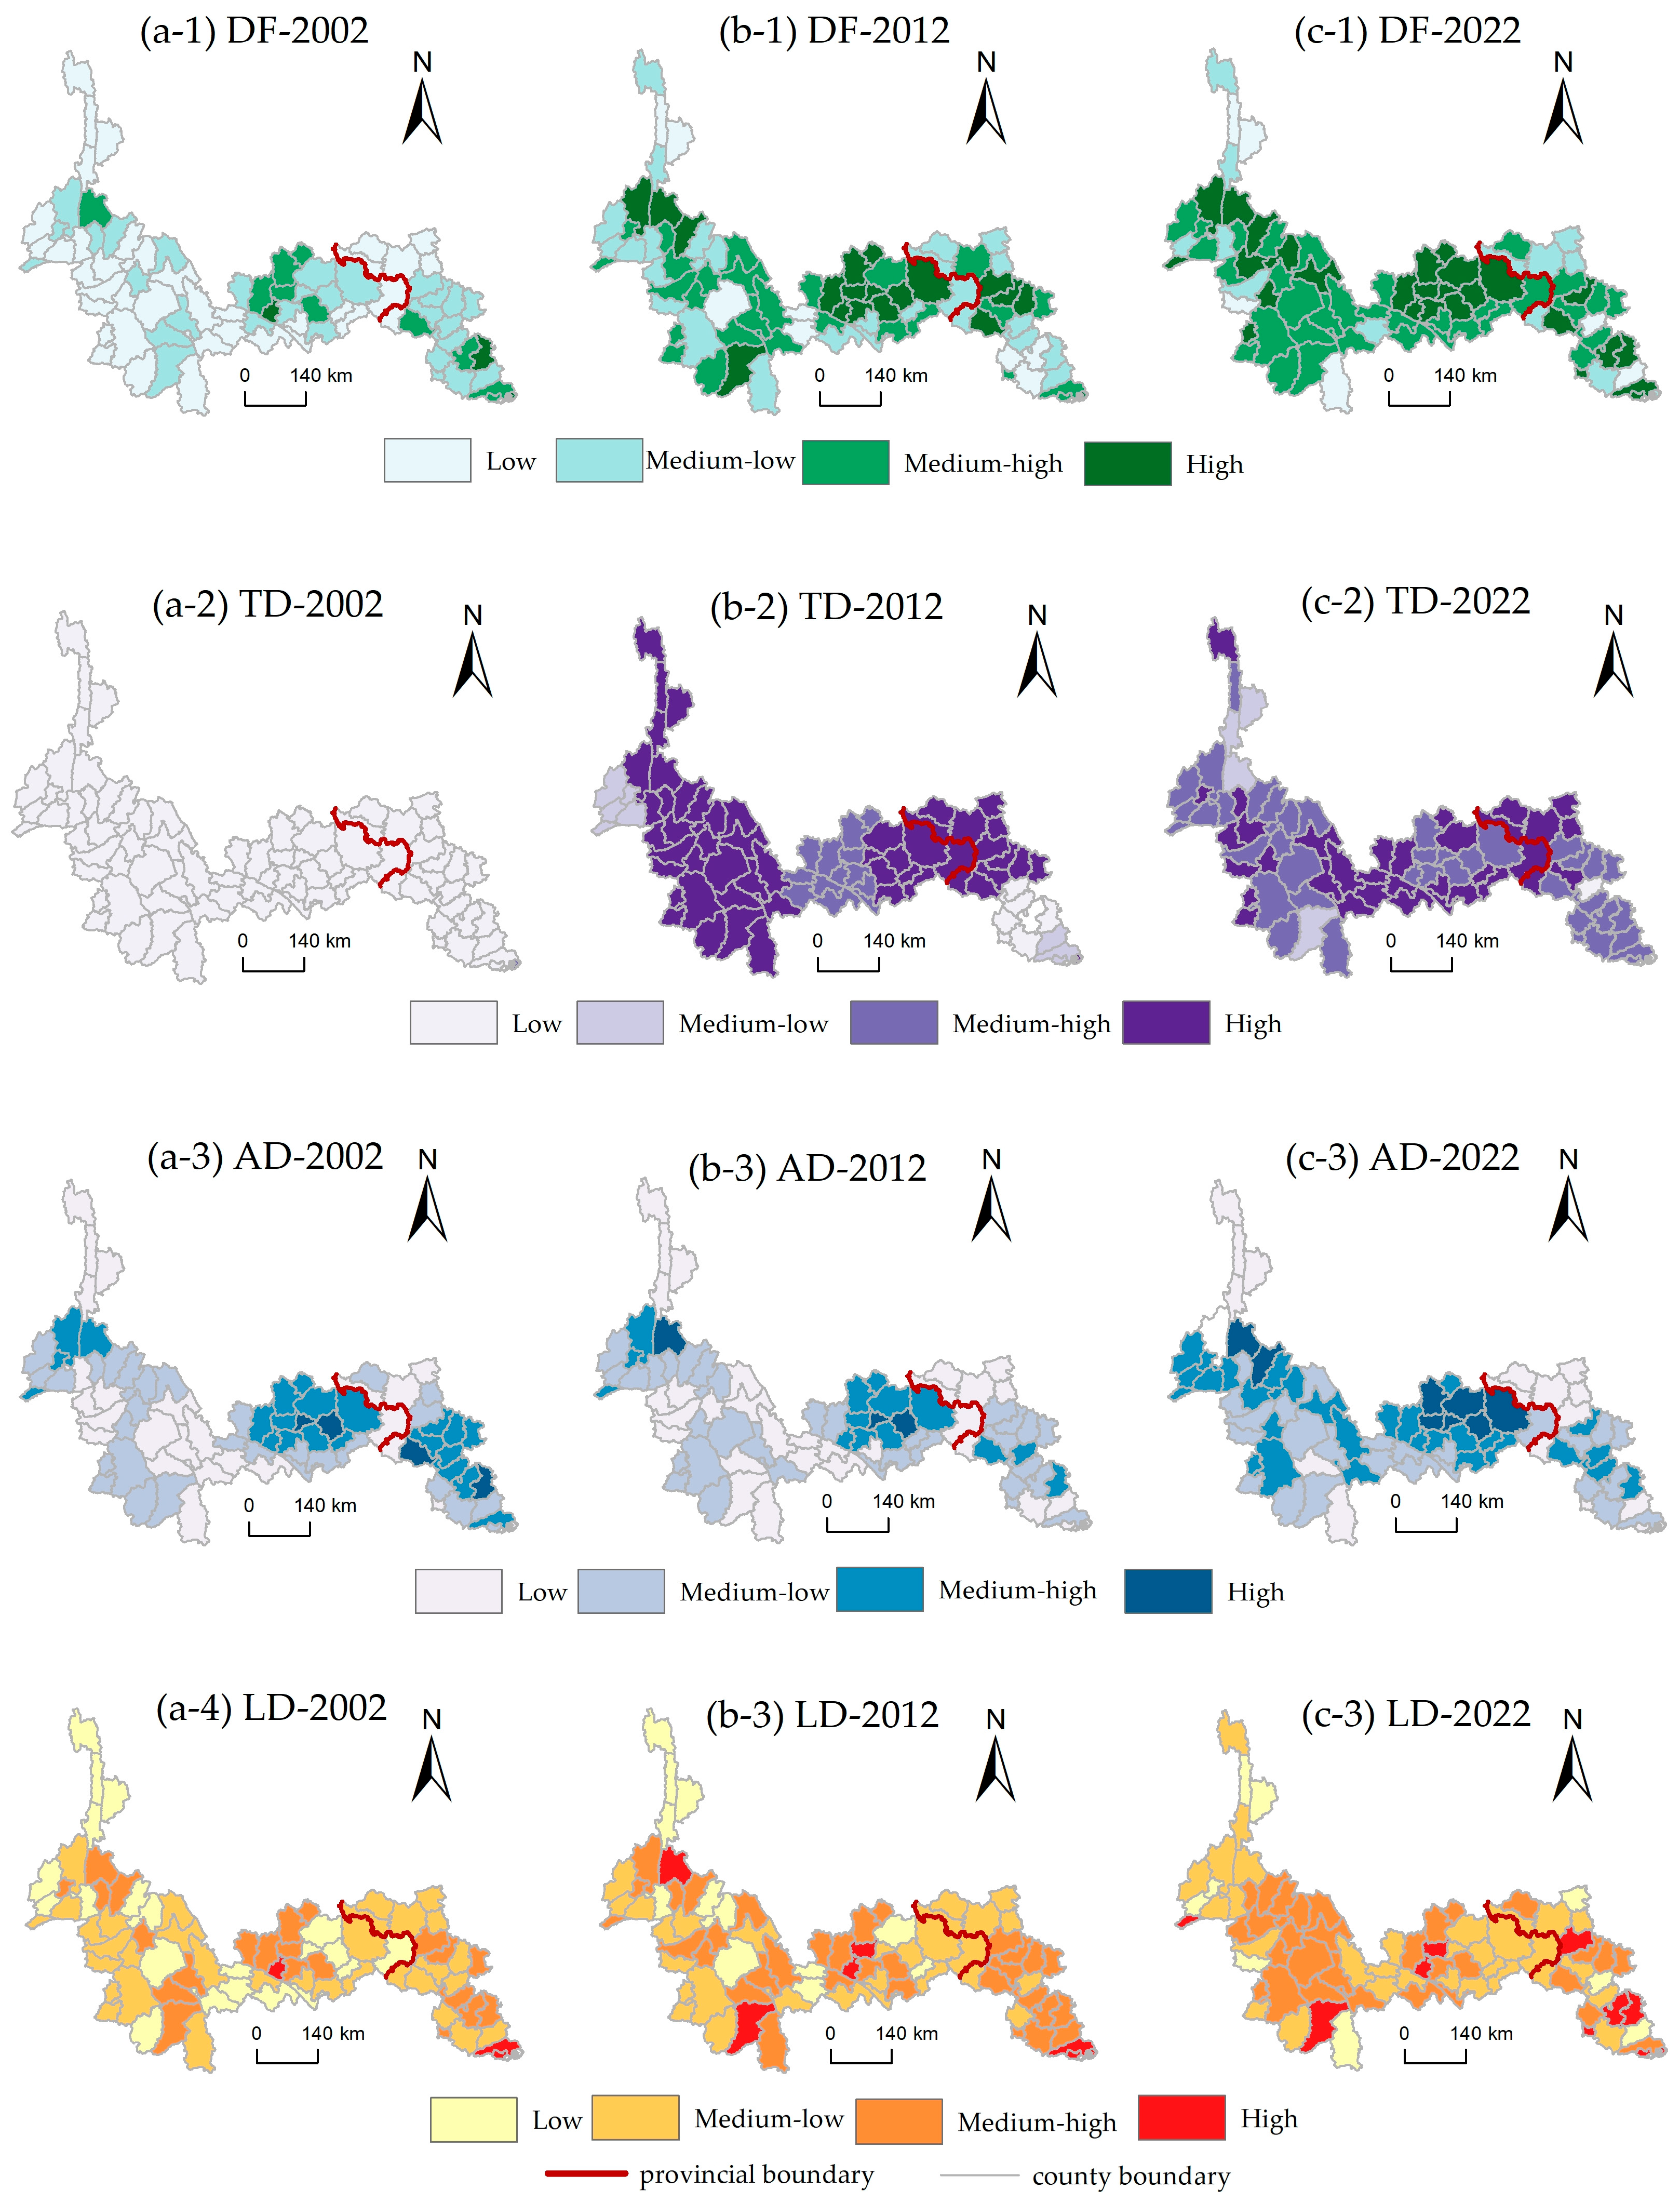
The changes in the proportions of county-level development function levels indicate that the Yunnan–Guangxi border region has undergone a transition from a generally low-level development pattern toward an overall medium-to-high-level development pattern. In 2002, the proportion of counties with lower-level development functions reached 56.962%, whereas the proportions of counties with higher-level development functions increased to 55.696% and 58.228% in 2012 and 2022, respectively, demonstrating the coexistence of overall improvement in development functions and structural optimization. The rapid growth of development functions was mainly concentrated during the first decade of the study period, accounting for 77.621% of the total increase throughout the study period. This early-stage improvement was primarily attributed to infrastructure enhancement and the concentrated release of policy dividends driven by national strategic initiatives. The subsequent slowdown in growth reflected the increasing constraints imposed by resource limitations and structural bottlenecks on the extensive development model, indicating that regional development has entered a transition toward a high-quality and endogenous development pathway. Spatially, high-value zones of development functions exhibited a clustered distribution pattern centered on Kaiyuan City and Yanshan County and were generally located toward the inland side of the region (DF is used to denote the development function in
Figure 5a-1,b-1,c-1).
During the study period, the trade development function of the Yunnan–Guangxi border region, which serves as a gateway for international trade, improved substantially. The spatial pattern of trade development functions changed markedly, evolving from widespread low-value areas to clustered high- and moderately high-value zones, followed by increasing spatial dispersion and an overall expansion in functional intensity (TD is used to denote the trade development function in
Figure 5a-2,b-2,c-2). Notably, the growth during 2002–2012 was substantially greater than that during 2012–2022, which may be associated with the establishment and implementation of the China–ASEAN Free Trade Area. As a gateway for international trade, the Yunnan–Guangxi border region benefited from expanding cross-border trade opportunities, which likely contributed to the rapid improvement of its trade development function.
The spatial pattern of the agricultural development function shows a strong dependence on regional resource endowments, with natural conditions contributing to a relatively stable distribution. High- and moderately high-value agricultural development zones are concentrated around Kaiyuan City and Yanshan County, with two additional growth poles centered on Tengchong City and Longyang District and extending toward each other. Kaiyuan and Yanshan are characterized by contiguous mountain valleys with relatively flat and concentrated land surfaces, which facilitate mechanized and large-scale farming and contribute to relatively high agricultural production efficiency (AD is used to denote the agricultural development function in
Figure 5a-3,b-3,c-3). In contrast, Tengchong and Longyang benefit from the substantial elevation gradients of the Gaoligong Mountains, which create diverse vertical climatic zones and support the cultivation of a wide range of agricultural products.
The improvement of the living development function reflects a typical pattern of agglomeration-driven development, in which core nodes supported by factor agglomeration and their spillover effects play an important role in improving regional living conditions. High- and moderately high-value zones of the living development function have gradually shifted from a scattered to a more clustered distribution, with major high-value areas located in Jiangzhou District, Fusui County, Kaiyuan City, and Gejiu City (LD is used to denote the living development function in
Figure 5a-4,b-4,c-4). Jiangzhou District and Fusui County are located near the regional core areas, while Kaiyuan City and Gejiu City, as former industrial bases, have relatively strong development foundations. Additionally, in border regions, fiscal and resource allocations are often directed toward territorial security and border stability, which may constrain long-term investment in improving living conditions. Consequently, high-value living development-function zones remain relatively limited in these areas.
4.1.3. Spatiotemporal Evolution of Security Functions
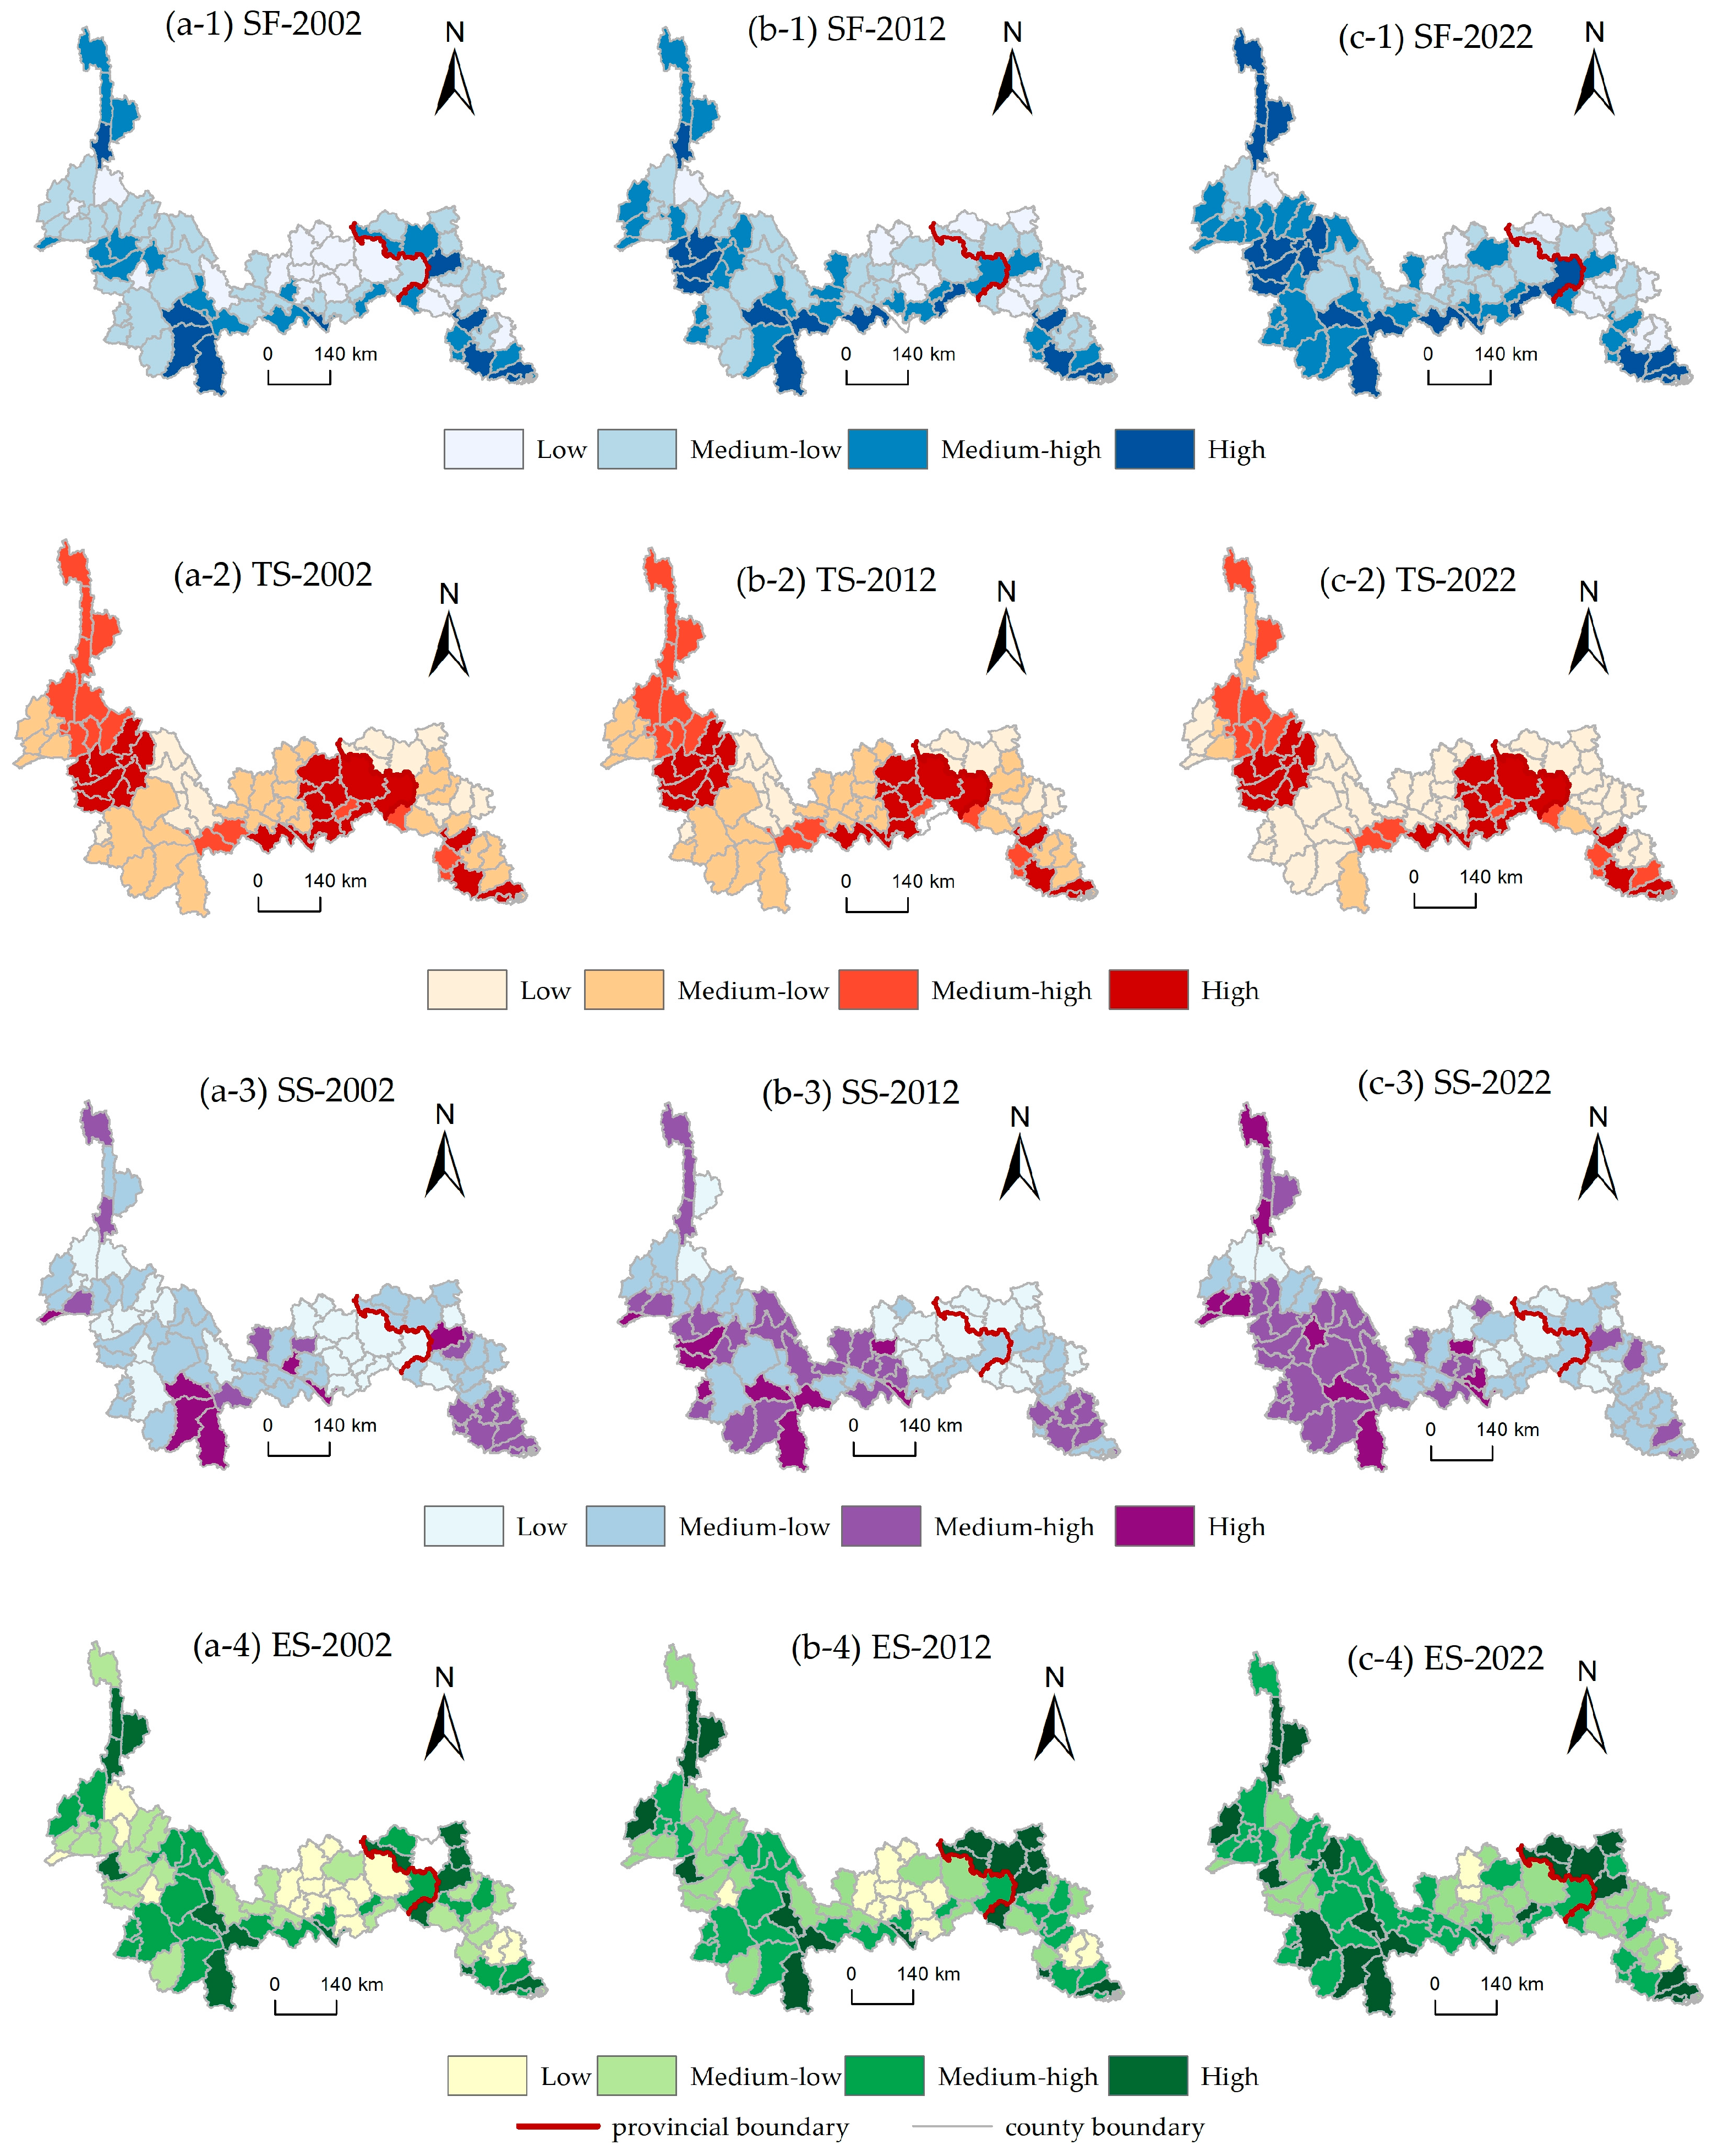
An analysis of changes in the distribution of county-level security function levels indicates that the Yunnan–Guangxi border region exhibited an overall upward trend in security functions during the study period, with a gradual shift toward medium- and high-level categories. The proportions of different security function levels changed relatively steadily: low- and relatively low-level zones gradually decreased, whereas high- and relatively high-level zones expanded; however, the expansion of high-value zones remained relatively limited. Overall, this evolution pattern reflects the coexistence of gradual enhancement and structural optimization of security functions, although differences remain among individual counties. The increase in the security function index was primarily concentrated during the first decade of the study period, accounting for 67.494% of the total increase throughout the entire study period. This rapid improvement during the early stage was closely associated with increased investment under national strategies such as the Revitalizing Border Areas and Enriching Local Populations initiative, which contributed to improvements in border infrastructure, governance capacity, and ecological barrier construction. During the later stage, the slower growth rate indicated a transition in security governance from infrastructure-oriented development toward a stage characterized by refined management, multi-actor collaboration, and enhanced ecological resilience. Spatially, high-value zones of security functions were mainly distributed along the border line and gradually extended toward inland areas (SF is used to denote the security function in
Figure 6a-1,b-1,c-1).
Territorial security functions in the Yunnan–Guangxi border region exhibited a pronounced dependence on strategic geographical nodes. National security requirements have shaped a relatively stable territorial security assurance framework through long-term strategic planning and the reinforcement of key locations. High-value zones of territorial security functions have consistently formed two relatively stable growth poles centered on Gengma County and Yanshan County (TS is used to denote the territorial security in
Figure 6a-2,b-2,c-2). This spatial pattern reflects the long-term projection of national strategic demands through critical geographical nodes. As a key node along the China–Myanmar international corridor, Gengma County is located at the transition zone between the southern extension of the Hengduan Mountains and Myanmar’s Shan Plateau, functioning as an important geographical gateway. In contrast, Yanshan County serves as a crucial link connecting Yunnan with the Beibu Gulf and ASEAN land routes. Located at a transportation hub on the karst plateau of southeastern Yunnan, it controls multiple river valleys and mountain corridors and possesses considerable geopolitical significance.
The enhancement of social security functions reflects the combined effects of governance capacity and public service provision, with regional governance foundations and social resilience serving as important supports for strengthening security assurance capacity. High- and relatively high-level zones of social security functions have gradually shifted from scattered distributions toward clustered patterns and are mainly concentrated in Linxiang District, Simao District, and Kaiyuan City (SS is used to denote the social security in
Figure 6a-3,b-3,c-3). As municipal administrative centers or traditional industrial hubs, these regions benefit from stronger administrative resources and governance capacity, providing advantages in public security management, social protection, and conflict resolution. Furthermore, stable social structures and historical-cultural foundations contribute to enhanced social resilience, while advantages in education, healthcare, and industrial development further improve residents’ well-being and reduce potential social risks.
Ecological security functions demonstrate a strong dependence on natural baseline conditions, with ecological resource endowments and strategic ecological positioning jointly determining their stability. The spatial distribution of ecological security functions remained relatively stable, with high-value zones primarily located in Lushui City, Simao District, and Tianlin County (ES is used to denote the ecological security in
Figure 6a-4,b-4,c-4). Ecological security functions are strongly constrained by natural conditions, require relatively long improvement cycles, and are vulnerable to disturbance from human development activities. Consequently, most regions tend to maintain their existing ecological security conditions under the dual pressures of development and conservation. Lushui City serves as a core ecological security zone of the Gaoligong Mountains; Simao District, as the administrative center of Pu’er City, plays an important role in tropical forest conservation; and Tianlin County functions as a crucial ecological barrier in the upper reaches of the Pearl River. The consistently high values of ecological security functions in these areas are closely related to their strategic ecological positions.
4.2. Spatiotemporal Evolution Characteristics of Adaptation Types
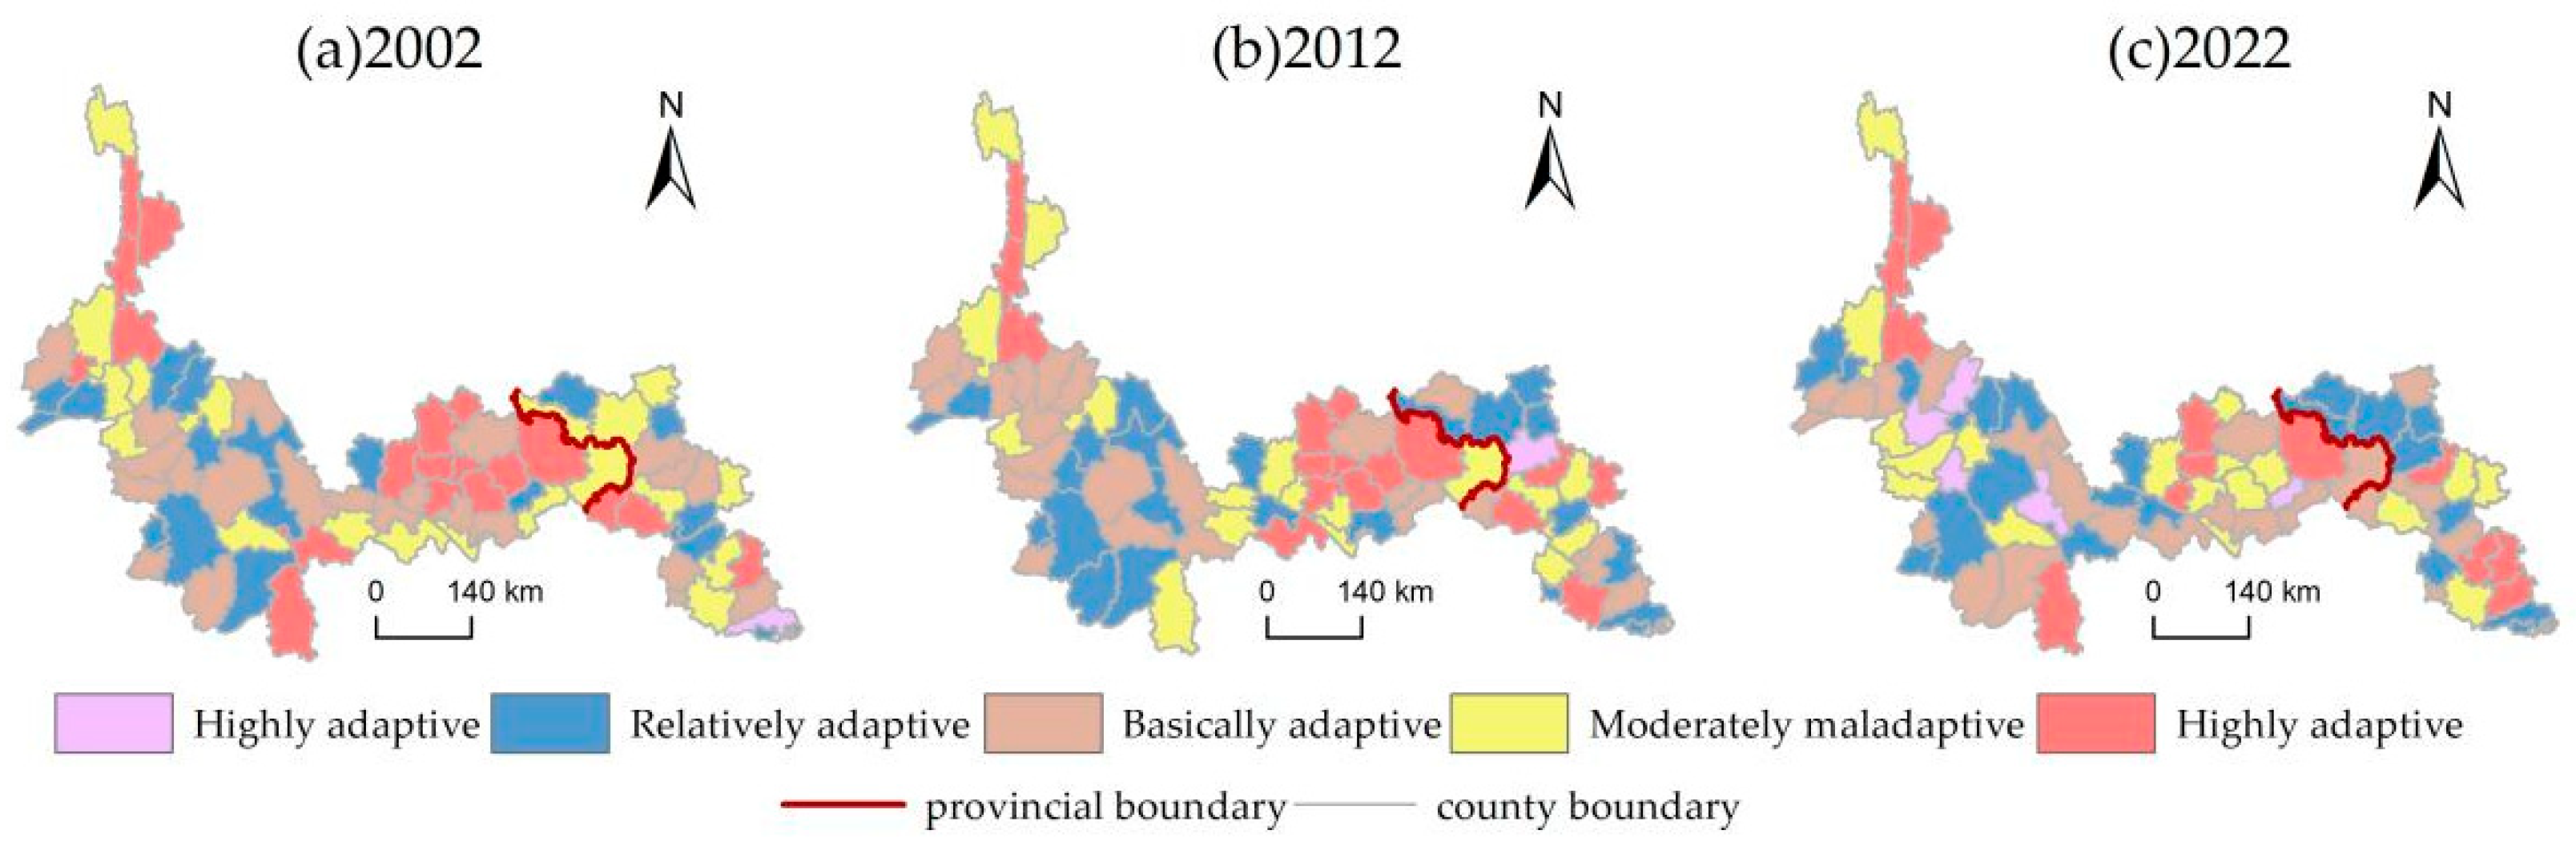
Overall, during the study period, the adaptation index exhibited a gradual upward trend and maintained a relatively high level of coordination, reflecting the cumulative effects of previous development momentum. The adaptation index increased from 0.603 in 2002 to 0.637 in 2022, representing a growth of 5.733%. The dominant adaptation categories were “basic adaptation” and “relatively adaptive,” with values generally falling within the medium-to-high range, indicating a relatively strong coordination relationship between development and security functions in the Yunnan–Guangxi border region. The largest increase occurred during the first decade, accounting for 57.731% of the total increase, whereas the growth during the subsequent decade was relatively limited. The earlier upward trend was closely associated with the simultaneous enhancement of development and security infrastructure driven by national strategic policies, which promoted synergistic improvement from a relatively low initial level. The subsequent slowdown was related to the transition of development functions from a quantity-oriented growth model toward a quality-oriented pathway, as well as the shift in security functions toward refined governance and resilience enhancement, making further coordinated improvement across both domains increasingly challenging (
Figure 7).
Regionally, the adaptation index between development functions and security functions in Guangxi’s border areas averaged 0.638 during the study period, exceeding the value of 0.614 observed in Yunnan. This difference may be explained by the relatively stable and systematic border governance and development mechanisms established in Guangxi during the study period. On the one hand, benefiting from its strategic advantage of connecting coastal and border opening-up, together with development platforms such as the Beibu Gulf Economic Zone, the Border Financial Comprehensive Reform Pilot Zone, and the Dongxing National Key Development and Opening-up Pilot Zone, Guangxi achieved substantial improvements in infrastructure, port-oriented economies, and industrial development in its border counties. On the other hand, Guangxi experienced relatively fewer cross-border conflicts and lower external security pressures compared with regions bordering Myanmar and Laos. Furthermore, supported by policies aimed at improving border residents’ livelihoods, strengthening border communities, and promoting targeted development in ethnic minority regions, Guangxi achieved simultaneous improvements in both development and security functions.
The spatial distribution of adaptation types generally shifted from clustering toward dispersion, accompanied by increasing differentiation among regions. Regions with relatively low adaptation levels were distributed in discontinuous belt-like zones extending from northwest to southeast, whereas extremely low adaptation areas were mainly located inland and counties along the border generally exhibited higher adaptation levels.
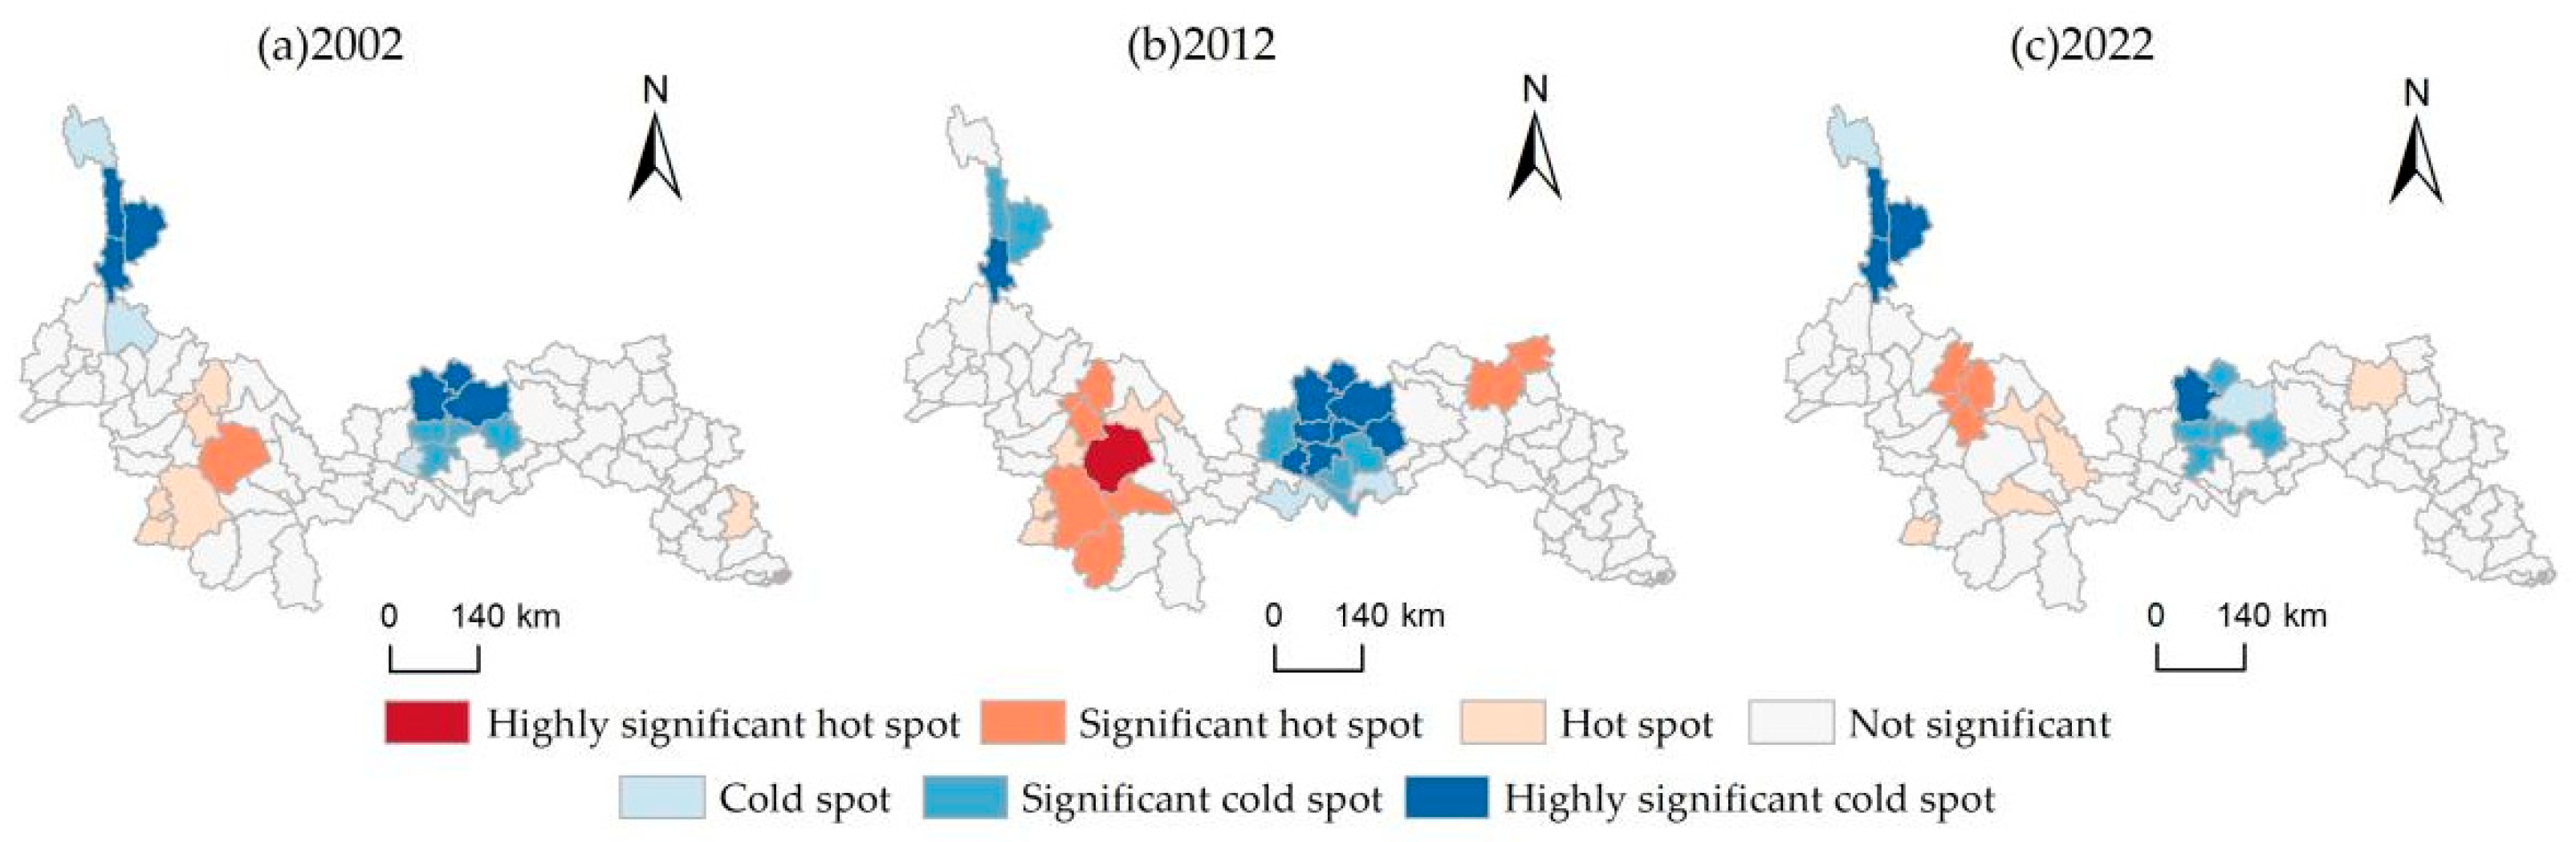
To further identify the spatial clustering characteristics of high and low values of the adaptation index, the Getis–Ord Gi* statistic was employed to conduct hot spot and cold spot analysis using ArcGIS 10.8 software. The spatial relationships were defined using a fixed-distance band, where the distance between spatial units was used to determine spatial associations, and no additional spatial weight matrix was specified. By calculating the Getis–Ord Gi* statistic, the Z-score (GiZScore) and
p-value were obtained. Specifically, a significantly positive Z-score indicates significant clustering of high-value observations (hot spots), whereas a significantly negative Z-score indicates clustering of low-value observations (cold spots). Based on confidence levels of 99%, 95%, and 90%, the spatial patterns were classified into seven categories: highly significant hot spots, significant hot spots, hot spots, non-significant areas, cold spots, significant cold spots, and highly significant cold spots. The 99%, 95%, and 90% confidence levels correspond to significance thresholds of
p < 0.01,
p < 0.05, and
p < 0.10, respectively, with corresponding critical values of |Z| > 2.58, |Z| > 1.96, and |Z| > 1.645 (
Figure 8).
The results indicate that the adaptation index demonstrated significant spatial clustering during the study period. Hotspots were mainly distributed along the border areas of Pu’er and Lincang cities, whereas coldspots were concentrated around the junction of Honghe and Wenshan prefectures; the clustering intensity was strongest in 2012. This spatial pattern may be attributed to differences in development–security factor endowments and variations in policy investment intensity among regions. The Pu’er–Lincang region, as an important port corridor along the China–Myanmar border, has benefited from policy initiatives such as border revitalization, border opening and development, and the construction of the China–Myanmar Economic Cooperation Zone. Consequently, the region has developed relatively complete transportation infrastructure, stronger governance capacity, and expanding cross-border trade and characteristic agriculture, providing a favorable foundation for both development and security functions and contributing to hotspot formation.
In contrast, the Honghe–Wenshan border area is constrained by complex terrain, limited transportation accessibility, insufficient port capacity, and cross-border governance pressures. Its relatively homogeneous industrial structure and weak infrastructure have hindered the coordinated improvement of development and security functions, contributing to the emergence of coldspot clusters. Additionally, differences in the timing and intensity of policy investments have further reinforced these spatial disparities.
4.3. Integrated Zoning Results
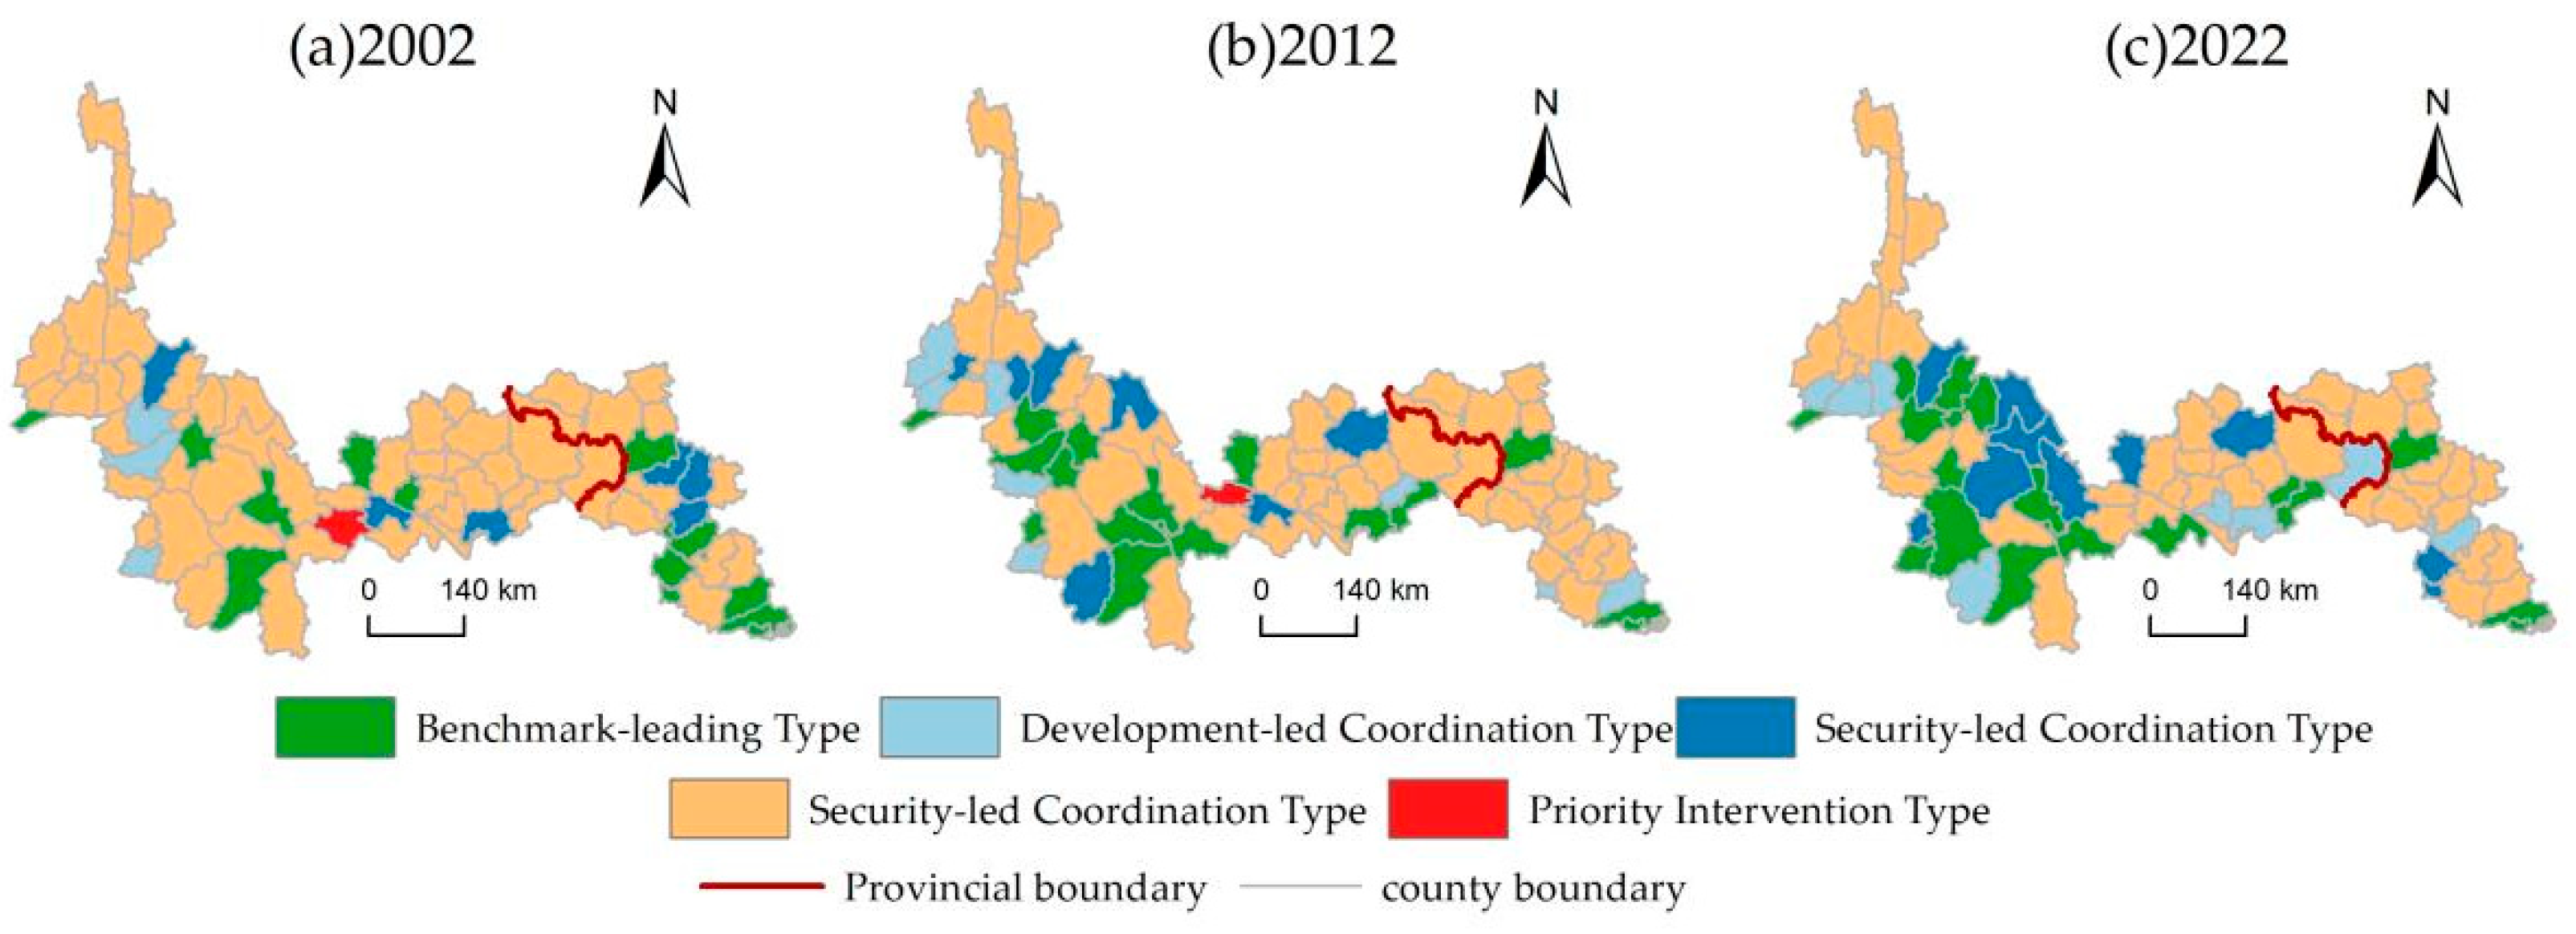
Based on the adaptive relationship and coordination status between development and security functions, county-level units in the southwestern border region can be classified into five types: benchmark-leading, development-dominated coordinated, security-dominated coordinated, transitional improvement, and key intervention types (
Figure 9). These typologies reflect differences among regions in terms of development foundations, security assurance capacity, and the degree of development–security synergy. Benchmark-leading regions exhibit high levels of both development and security, with strong demonstration and spillover effects on surrounding areas. Development-dominated coordinated regions are characterized by relatively strong development functions and are mainly distributed in border areas with active port-oriented economies. Security-dominated coordinated regions are characterized by prominent security functions and are primarily located in ecological conservation zones or inland hinterlands. Transitional improvement regions have considerable potential for enhancing both development and security functions and represent an important transitional stage in regional functional evolution. Key intervention regions face significant deficiencies in both development and security, and are mainly distributed in remote areas with complex natural conditions and limited infrastructure.
In terms of structural changes, transitional improvement regions accounted for the largest proportion during the study period, indicating that most counties remained in a transition phase from low-level equilibrium or functional imbalance toward higher levels of coordination. Meanwhile, some regions gradually evolved toward benchmark-leading or development-dominated coordinated types, reflecting an overall improvement in the synergy between development and security. Spatially, border areas were dominated by transitional improvement, benchmark-leading, and development-dominated coordinated types, whereas security-dominated coordinated regions were mainly concentrated in inland hinterlands, forming an overall pattern characterized by “progressive border areas and stable hinterlands.”
Based on these characteristics, differentiated optimization strategies should be adopted for regions with different functional types: Benchmark-leading regions should further leverage their openness advantages and strengthen their regional driving and spillover effects. Development-dominated coordinated regions should address weaknesses in security governance and enhance risk prevention and control capacity. Security-dominated coordinated regions should develop distinctive industries while maintaining ecological protection and territorial security. Transitional improvement regions should focus on addressing key constraints and improving both development capacity and governance effectiveness. Key intervention regions require prioritized improvements in infrastructure and public service conditions through policy support and financial investment, thereby gradually enhancing their endogenous development capacity.
5. Discussion
5.1. Mechanisms Underlying the Spatial Differentiation of Development and Security Functions
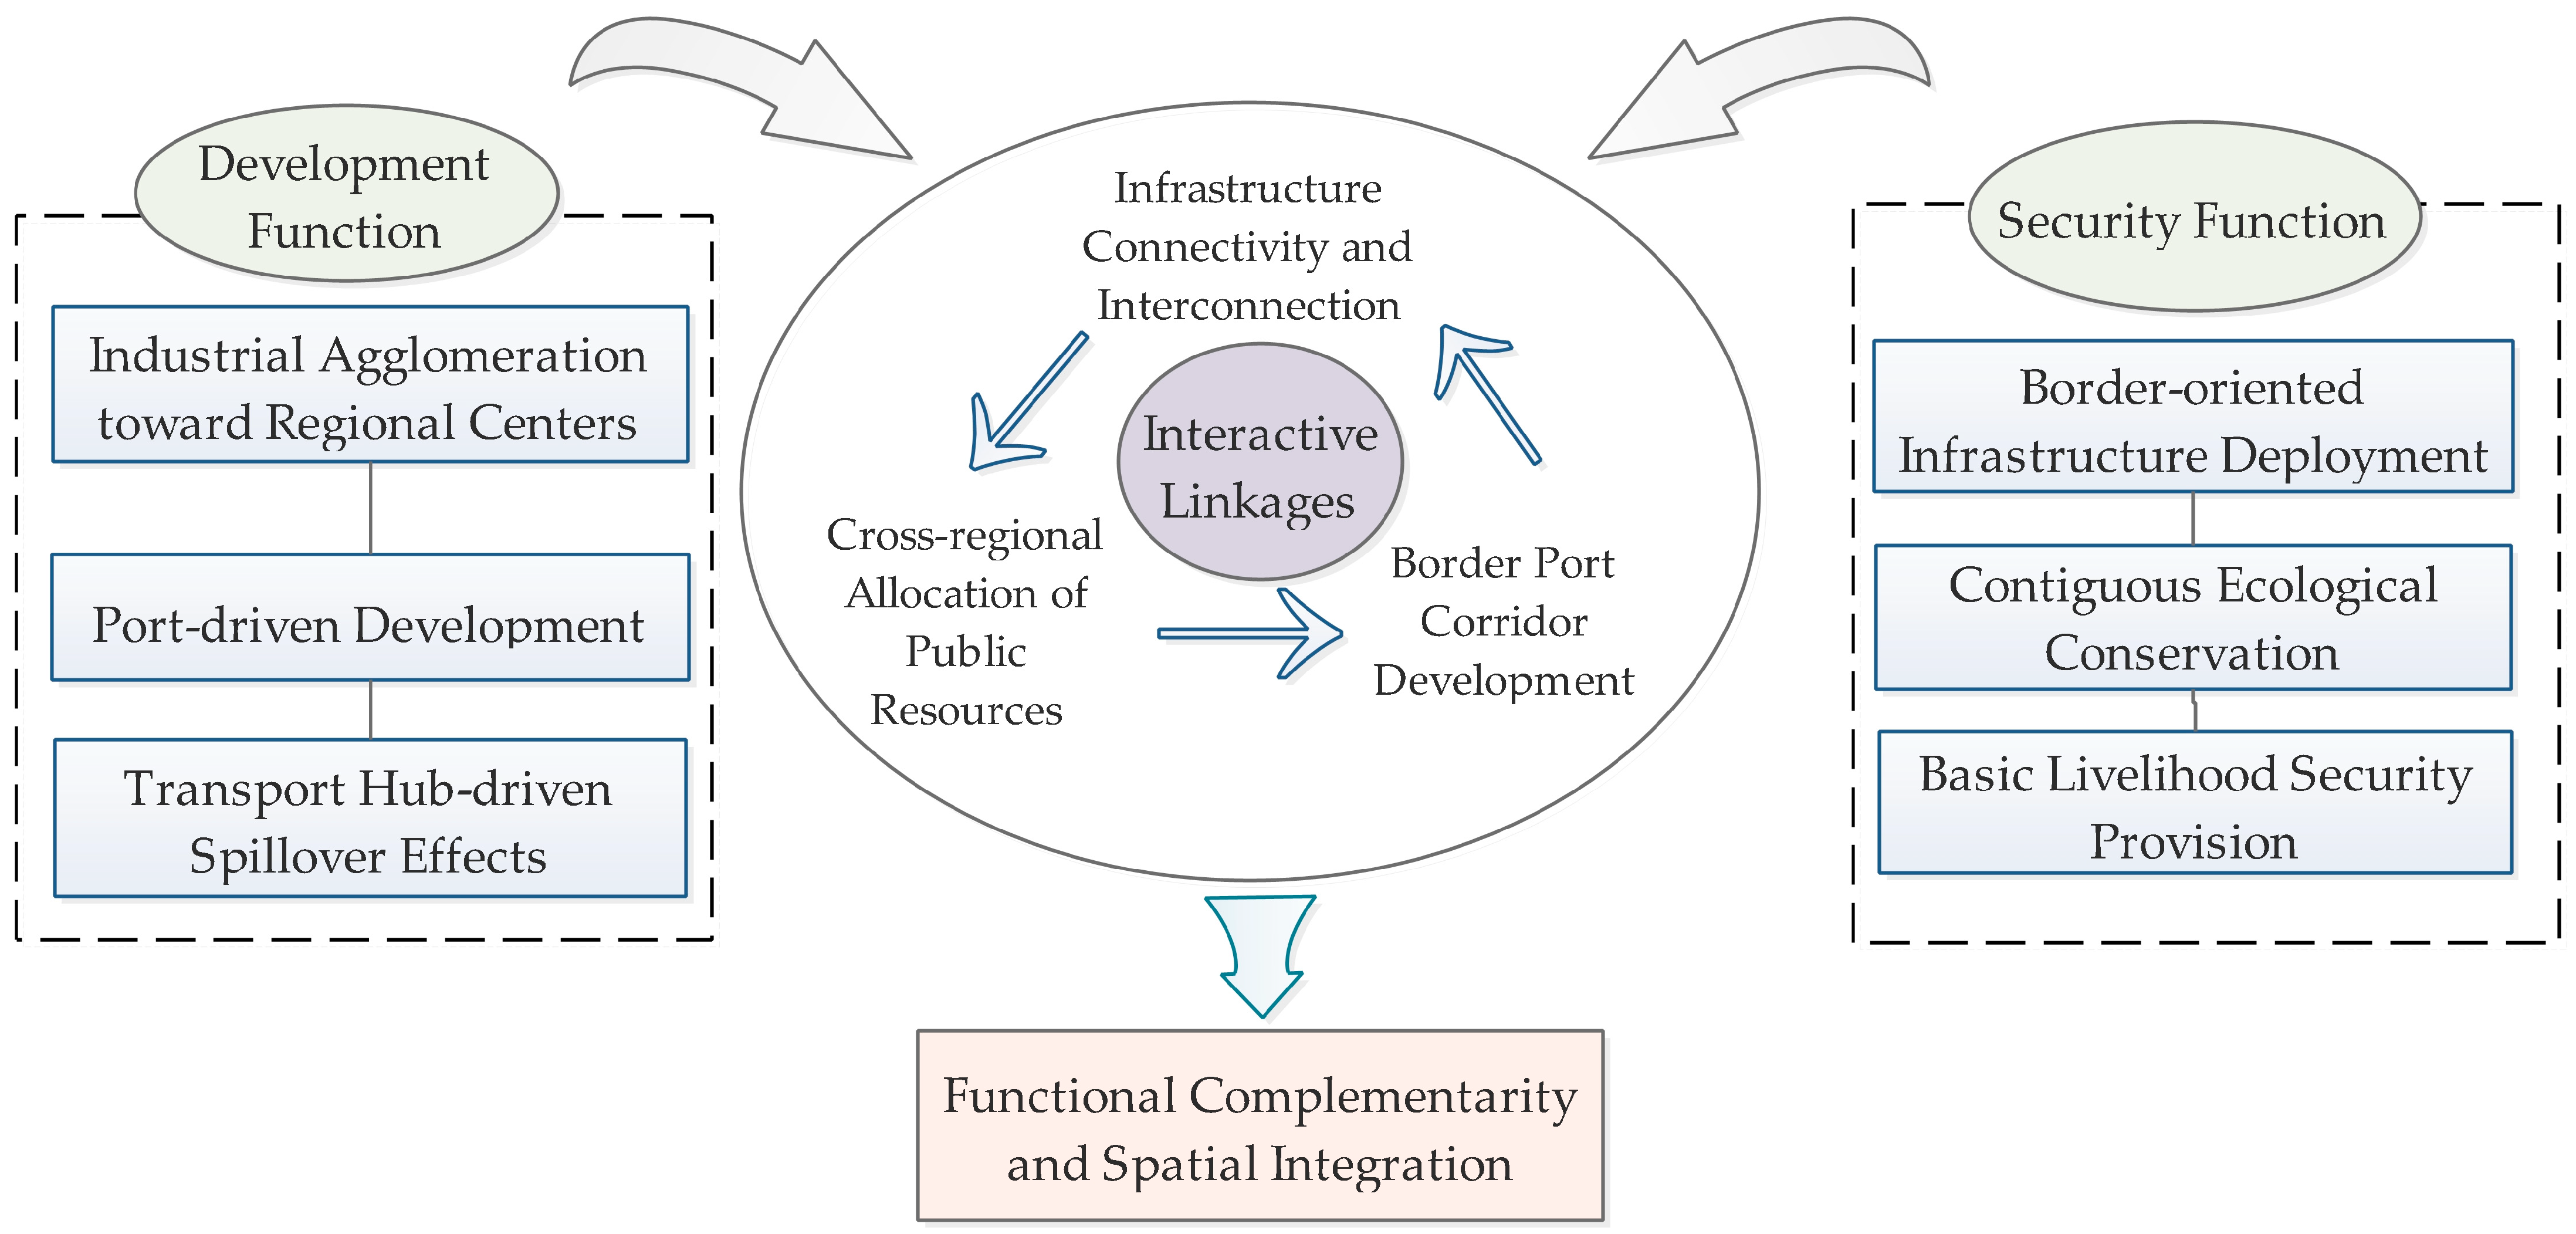
The development functions and security functions exhibit distinct spatial differentiation patterns characterized by “inland agglomeration” and “border-oriented continuity,” respectively; this pattern reflects the spatial outcomes generated by different functional organization mechanisms underlying these two systems. Development functions follow an efficiency-driven agglomeration mechanism, with regional central cities and transportation hubs serving as key spatial carriers. Through the combined effects of industrial advantages, factor mobility, and market accessibility, development polar cores with self-reinforcing growth characteristics are gradually formed. Conversely, security functions follow a security-oriented equalization mechanism, with the border zone serving as the primary spatial axis. Through the coordinated allocation of infrastructure, equalized public service provision, and ecological barrier construction, relatively continuous security functional belts are established along the border areas.
The coexistence of these two spatial mechanisms has shaped a composite functional structure in border regions, characterized by the simultaneous presence of “efficiency-driven polar cores” and “security-oriented functional belts.” These two components are gradually integrated and functionally complemented through the development of port corridors, infrastructure connectivity, and cross-regional public resource allocation (
Figure 10).
5.2. The Relationship Between Development–Security Adaptation and Geopolitical Policy Evolution
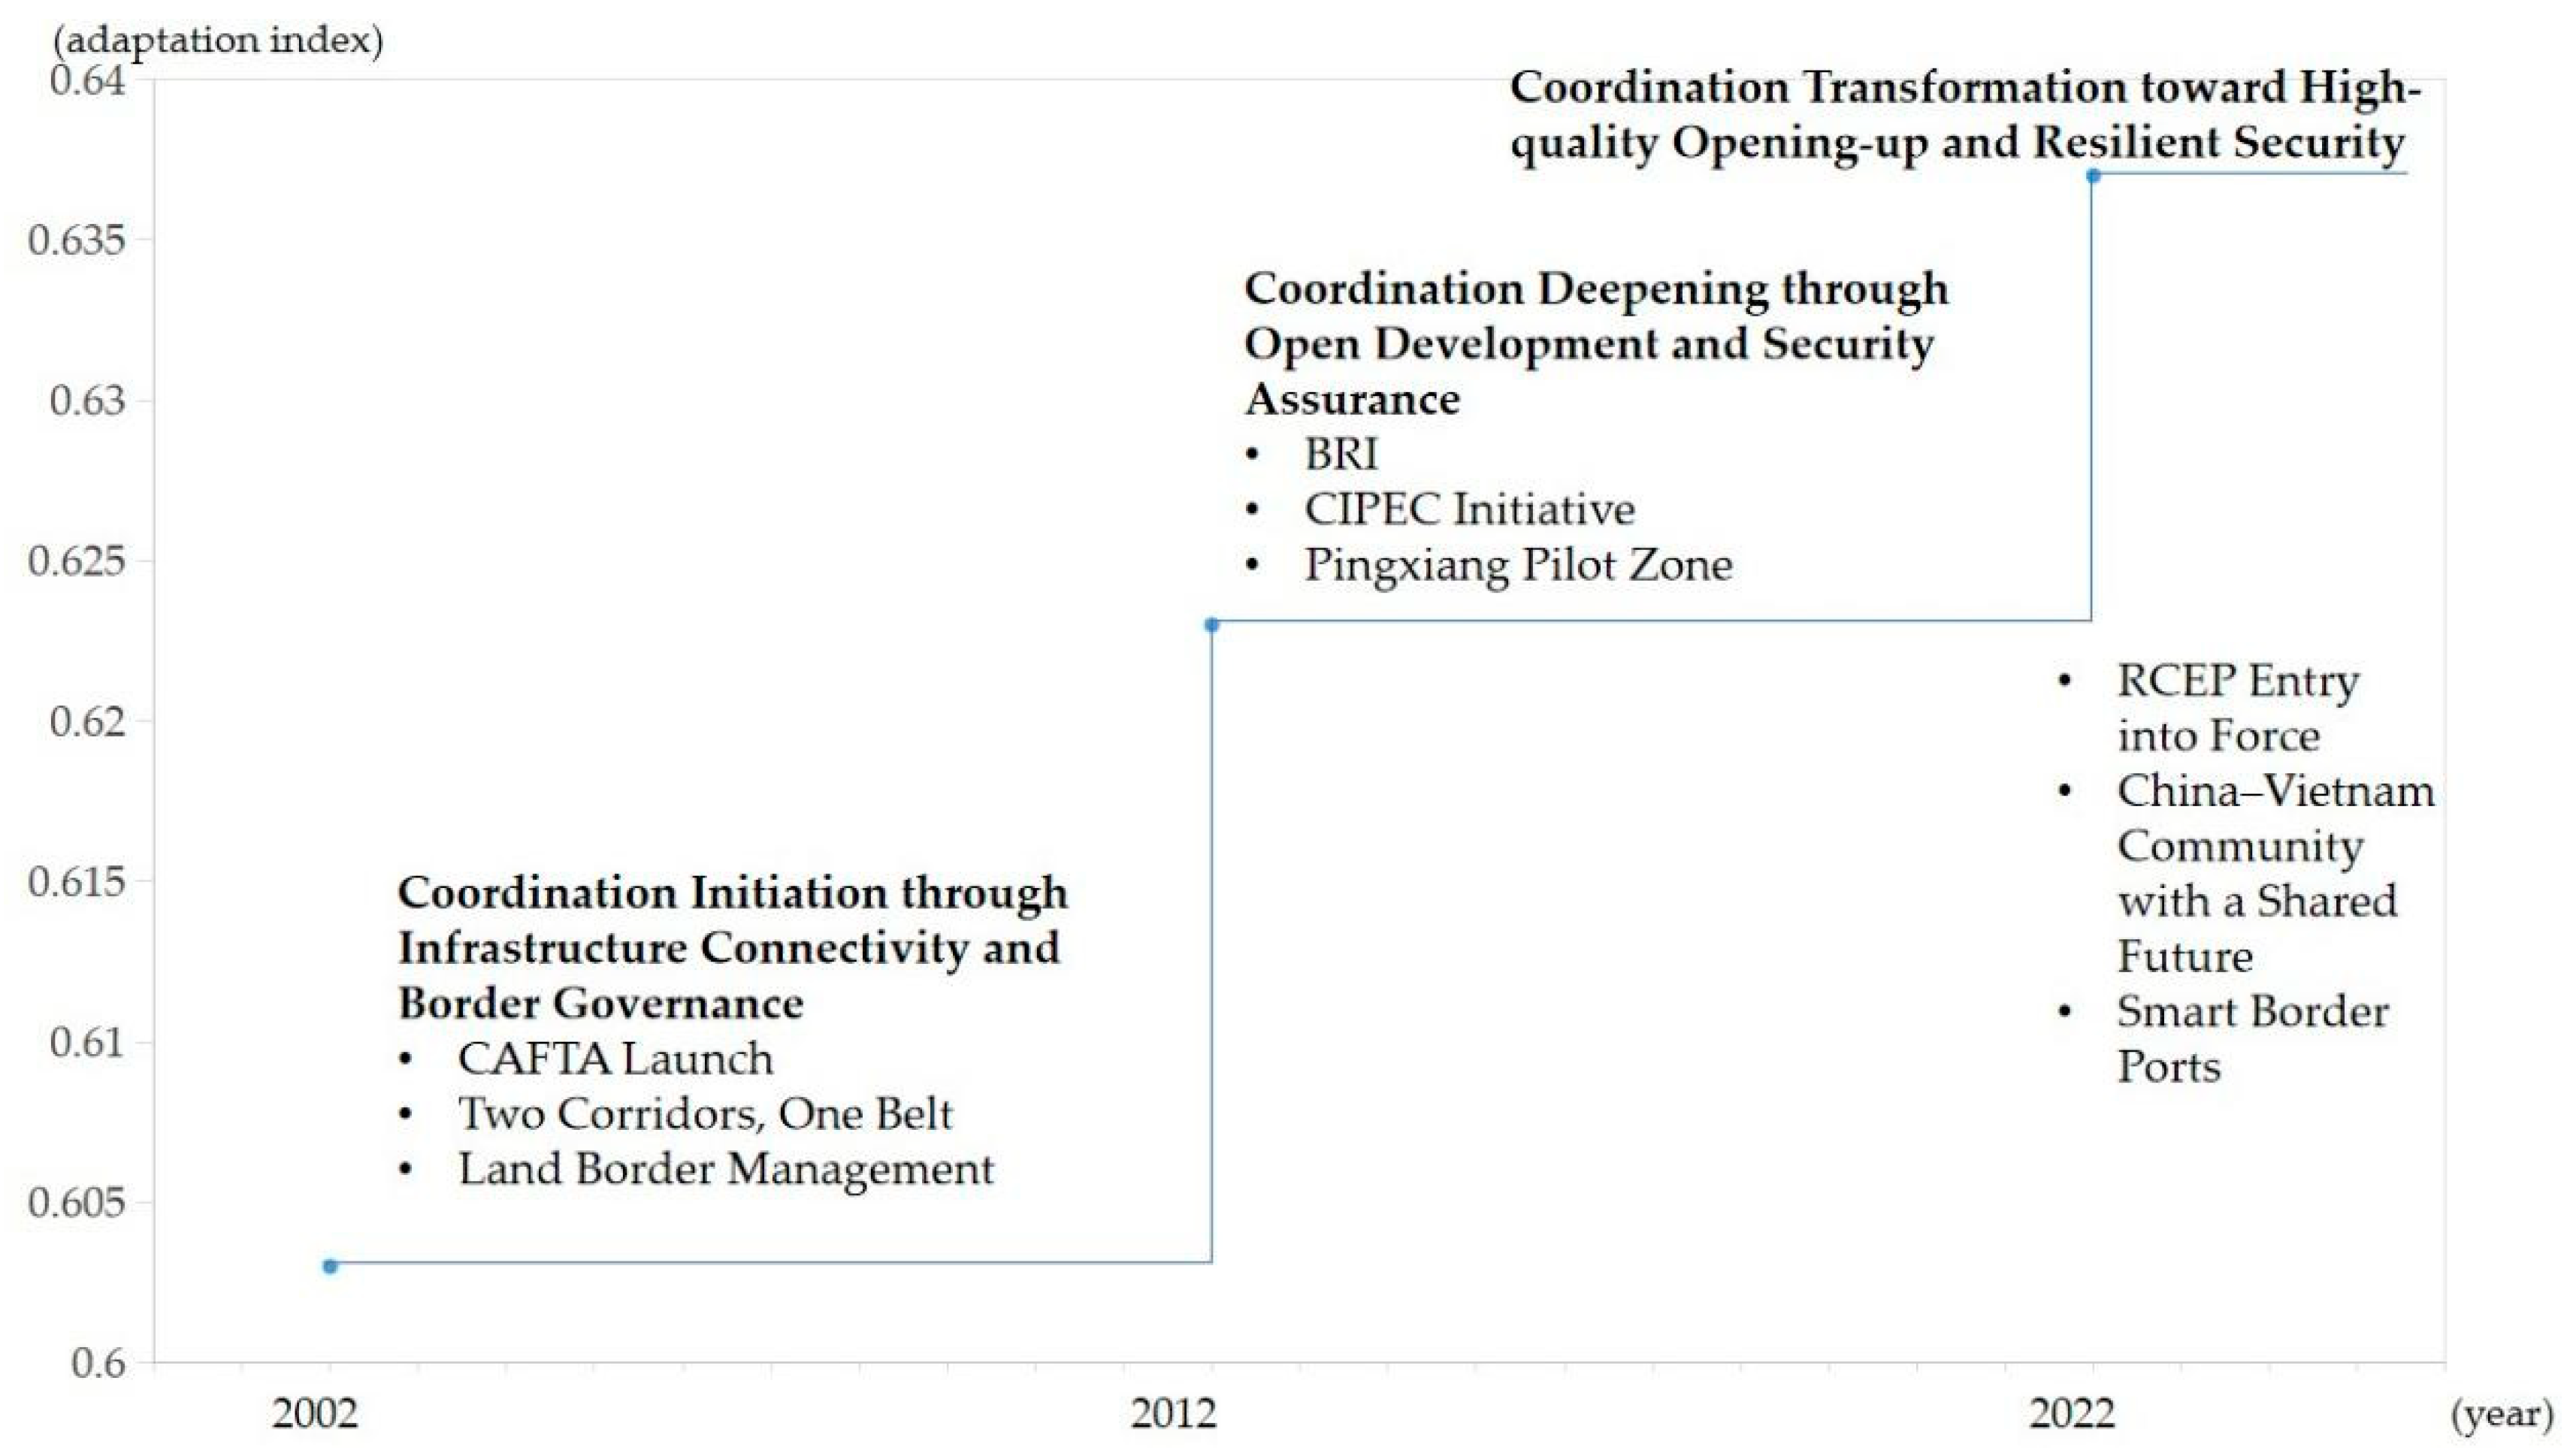
During the study period, the evolution of the development–security nexus in the Yunnan–Guangxi border region was closely associated with phased adjustments in regional geopolitical policies (
Figure 11). The period from 2002 to 2012 represented the “Foundation-Building Phase: Connectivity Enhancement and Border Governance.” During this period, the China–ASEAN Free Trade Area was established, cooperation under the “Two Corridors and One Circle” initiative was promoted, and the China–Vietnam land border management mechanism was gradually improved. Policy priorities shifted from economic connectivity and basic capacity enhancement toward border order maintenance, laying the foundation for initial coordination between development and security.
The period from 2012 to 2022 represented the “Synergistic Enhancement Phase: Open Development and Security Assurance.” During this stage, the Belt and Road Initiative, the China–Indochina Peninsula Economic Corridor, and the establishment of the Pingxiang Key Development and Opening-up Pilot Zone further integrated the border region into broader regional cooperation networks. The development orientation gradually shifted from basic capacity improvement toward border opening and cross-border collaboration. Taking the Pingxiang–Youyi Pass port as an example, border opening policies have transformed it from a traditional border transit point into a comprehensive cross-border trade hub, while simultaneously requiring enhanced port supervision and risk prevention mechanisms, reflecting the coordinated advancement of development expansion and security assurance.
Since 2022, the region has entered the “Coordinated Transformation Phase: High-Quality Opening and Resilient Security.” This stage has been characterized by the implementation of the RCEP, the advancement of China–Vietnam cooperation toward a community with a shared future, and the continued promotion of initiatives such as smart port construction. Border development has shifted from extensive expansion toward quality-oriented growth, while security governance has increasingly emphasized digitalization, precision, and resilience, indicating a transition from parallel development and security enhancement toward deeper integration.
Overall, phased geopolitical policy adjustments have shaped the evolution of the development–security nexus in the Yunnan–Guangxi border region, demonstrating a trajectory from “initial coordination” to “deepened openness” and ultimately toward “resilient integration.”
5.3. Contributions, Limitations, and Future Research
From a theoretical perspective, this study extends beyond the traditional “urban–agricultural–ecological” research paradigm [
36,
45] by incorporating development and security functions into a unified analytical framework. It elucidates the evolutionary trajectory of regional functions in border areas, characterized by a transition from a “development-first” orientation toward coordinated development and security, thereby broadening theoretical perspectives on regional function research and providing a valuable reference for frontier governance studies. From the perspective of practical governance requirements, achieving synergy between development and security has become essential for sustainable development in border regions. Using border regions as a representative case, this study proposes differentiated spatial governance pathways based on the development–security nexus, providing theoretical insights for future innovations in territorial spatial governance [
46]. Building upon existing research [
47], this study further reveals the underlying mechanisms responsible for the differentiated spatial patterns of development and security functions, elucidating how efficiency-oriented factor agglomeration and protection-oriented equitable allocation jointly shape the spatial differentiation characteristics of development–security functions in border regions.
Due to limitations in indicator availability and measurement consistency, the quantitative representation of dynamic variables, such as institutional security and cross-border risk factors, remains relatively constrained. Moreover, county-level analyses may mask internal heterogeneity within finer-scale spatial units, thereby limiting the ability to capture functional differentiation patterns at smaller spatial scales, such as ports and townships.
In future research, multi-source data with high spatiotemporal resolution can be integrated with micro-scale analyses and scenario simulation approaches to further uncover the dynamic mechanisms underlying the evolution of development–security relationships in border regions and establish a more explanatory analytical framework for border regional functions.
6. Conclusions
From the perspective of the development–security nexus, this study develops a regional functional evaluation framework incorporating border-specific indicators, including border trade development and national security, and systematically examines the spatiotemporal evolution of development functions, security functions, and their adaptation relationships in the Yunnan–Guangxi border region from 2002 to 2022. The findings contribute to revealing the synergistic evolution mechanisms between these two functional systems and provide theoretical insights and practical references for improving territorial spatial governance and promoting coordinated development and security in border regions. The main findings are as follows:
(1) The comprehensive functional level in the Yunnan–Guangxi border region showed an overall increasing trend, accompanied by clear phased characteristics and spatial heterogeneity. During the study period, the comprehensive functional level experienced a transition from rapid growth to gradual stabilization, while regional disparities followed a pattern of initial convergence followed by divergence. In the later stages of the study, the comprehensive functional level in the Yunnan border region continued to increase, gradually reducing the disparity with Guangxi and reflecting an evolutionary trajectory toward stronger synergy between development and security functions. Spatially, high-value areas were primarily concentrated around major ports and cross-border corridors, with the highest-value zones exhibiting a westward migration trend over time.
(2) The development functions and security functions achieved substantial improvements and exhibited distinct spatial agglomeration patterns. The development functions experienced a rapid transition from low to medium and high levels, with high-value zones concentrated mainly in regional central cities and transportation hubs; whereas security functions improved steadily, with high-value zones distributed relatively continuously along the border. Both functional systems have shifted from policy-driven expansion toward high-quality development supported by enhanced governance capacity, indicating a transition from factor-input-driven growth to capability-oriented development in border regions.
(3) The adaptation relationship between development functions and security functions remained generally favorable, with the adaptation index showing a gradual upward trend and a relatively stable foundation for development–security synergy being established across the region. The predominant adaptation types were “basic adaptation” and “relative adaptation,” while their spatial distribution evolved from clustering toward dispersion. Among the five regional functional patterns identified based on adaptation relationships and coordination status, the “transformation and upgrading type” was dominant. The overall spatial pattern was characterized by “advancement along the border while maintaining stability in the hinterland,” indicating that border regions are undergoing a critical stage of functional restructuring and governance transformation.