Review

Potentially Toxic Elements in Fertilizers and Associated Risks for Soil Organisms: A Bibliometric and Meta-Analytical Assessment

by
Jéssica Nívea Magalhães Rodrigues
1,*,
Rafael Marques Pereira Leal
1,
Aline Renée Coscione
2,
Vanessa Matos Gomes
3 and
Dener Márcio da Silva Oliveira
3
1
Instituto Federal de Educação, Ciência e Tecnologia Goiano, Campus Rio Verde, P.O. Box 66, Rio Verde 75901-970, GO, Brazil
2
Instituto Agronômico, Avenida Barão de Itapura 1481, Campinas 13075-630, SP, Brazil
3
Laboratório de Manejo e Conservação do Solo e da Água, Instituto de Ciências Agrárias, Universidade Federal de Viçosa, Florestal 35690-000, MG, Brazil
*
Author to whom correspondence should be addressed.
Land 2026, 15(8), 1377; https://doi.org/10.3390/land15081377
Submission received: 23 April 2026 / Revised: 2 June 2026 / Accepted: 4 June 2026 / Published: 31 July 2026

Abstract

Soil contamination by potentially toxic elements (PTEs) from fertilizers represents a major issue threatening agricultural sustainability and global food security. This work conducted a bibliometric analysis and a meta-analysis on the occurrence of As, Cd, Cr, Cu, Pb, Zn, Ni, Co, Mn, Hg, and Fe in fertilizers and their implications for soil biota through risk assessment. The database used was Web of Science, and R software version 4.3.2 (bibliometrix and metafor packages) was utilized to perform bibliometric analyses (1116 documents) and meta-analysis with a five-year filter (548 articles). A total of 45 articles met all the inclusion criteria for the meta-analysis. The risk assessment was based on a quotient risk approach, considering high and low fertilizer application rates, as well as the average and maximum reported metal concentrations. Legal limits were surpassed for Cd in phosphate rock; for Cd, Cu, Cr, and Zn in manure; and for Cd and As in compost. Overall, organic sources presented a higher risk than mineral ones, with major risks related to mid- to long-term applications. These findings highlight the urgent need for strict regulation of contaminants in fertilizers and technical legislation grounded on ecotoxicological data to preserve soil quality and promote agricultural sustainability.

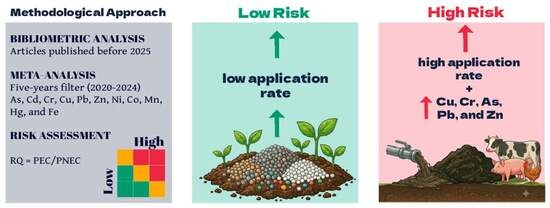
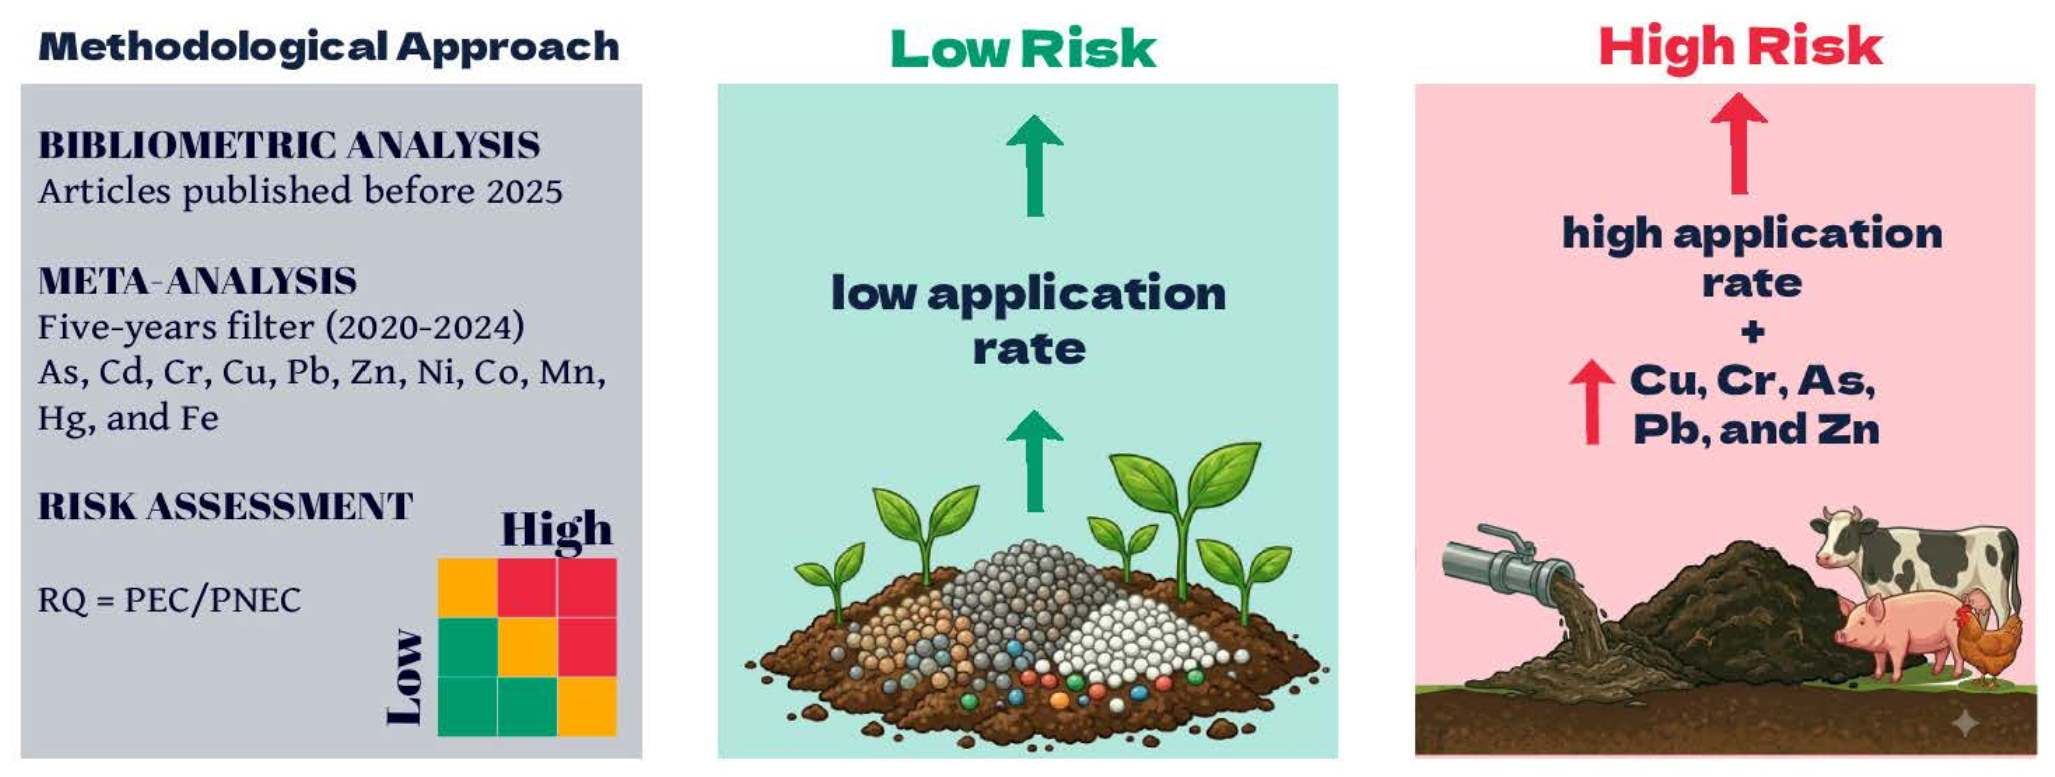
Graphical Abstract

1. Introduction

Soil pollution by potentially toxic elements (PTEs) represents a major environmental issue, with 14 to 17% of the global agricultural area affected by metal pollution and up to 1.4 billion people living in high-risk areas [1]. Global evidence shows that agricultural soils can have high concentrations of metals [2,3], representing a major challenge for sustainable development and food security, especially in developing countries [4,5]. Furthermore, this scenario is likely to worsen in the coming decades due to the projected population growth to 9.4–10.1 billion by 2050 and the consequent increase in food demand [6,7] and, thus, fertilizer application [8,9].
The expression “potentially toxic element(s)” encompasses metals and metalloids that may be considered harmful to biota, depending on the level of exposure, the dose, and the receiving organism or population [10,11]. The PTEs can be classified as essential or non-essential [12]. Essential PTEs, such as zinc (Zn), copper (Cu), and iron (Fe), play a vital role in various physiological processes [13]. On the other hand, non-essential PTEs, such as arsenic (As), cadmium (Cd), and mercury (Hg), do not have known biological functions and can be toxic and carcinogenic, even at low concentrations [14].
The origin of these elements can be natural, for example, through the weathering of igneous and sedimentary rocks [15]. However, previous evidence shows that anthropogenic sources are usually more relevant to explain their environmental occurrence [16]. Major anthropogenic sources are represented by mining and metal casting [17,18], reuse of sewage sludge [19,20,21], chemical manufacturing [16], use of pesticides [22] and application of mineral [23] and organic fertilizers in agriculture [19,24]. Anthropogenic metal input can lead to contamination, when the metal concentration is higher than its natural occurrence, or to pollution, when the concentration is related to negative effects [25].
Mineral fertilizers, especially phosphate fertilizers, can contain impurities in the form of PTEs, such as arsenic (As), lead (Pb), mercury (Hg), nickel (Ni), and especially cadmium (Cd), caused by insufficient purification in the manufacturing process [26,27]. Organic fertilizers may also contain PTEs in their composition, depending on their origin and degree of transformation [16,28,29]. Once introduced into the soil, due to their high persistence and toxicity, PTEs can negatively affect soil quality [10,14,30], which, in turn, can harm agricultural productivity, fauna and flora, ultimately threatening human health [31,32]. Several studies evaluated the ecotoxicological risks associated with soil application of mineral and organic fertilizers, evidencing the accumulation of metals in the soil [33], the contamination of plants and food, and human health risks [34].
Bibliometric analysis is a quantitative method for evaluating the relationships and impacts of countries, institutions, publications, and authors in a specific field, as well as determining research trends, using mathematical and statistical tools [35]. In turn, meta-analysis aims to fill gaps between traditional literature reviews and quantitative analyses, allowing quantitative comparisons based on the results of a set of studies [24]. Given the global relevance of PTEs in fertilizers and the vast amount of scientific production already available, bibliometrics and meta-analysis are useful tools to systematize and synthesize the existing knowledge.
There are bibliometric analyses exploring the development of fertilizers [36] and the application of organic amendments and biofertilizers in agriculture [37,38]. Similarly, there are meta-analyses on Cd accumulation in soils and plants through manure application [24] and on PTEs in soil amendments and fertilizers [39]. However, the present study is the first to integrate both approaches: a bibliometric analysis to identify research trends and gaps regarding the occurrence of PTEs in organic and mineral fertilizers, coupled with a meta-analysis to quantify the concentrations of multiple PTEs across a range of organic and mineral fertilizers. In addition, risk assessments for soil organisms were carried out using a risk quotient (RQ) approach with simulations considering contrasting scenarios of fertilizer rates (low and high) and PTE concentrations (average and maximum).

2. Materials and Methods

2.1. Data Collection and Processing

The Web of Science-Core Collection database (Clarivate Analytics/Thomson Reuters) was used, where a search was applied in the field “Topic” as follows: (“heavy metals” OR “heavy metal” OR “potentially toxic elements” OR “toxic metals”) AND (“contamination” OR “presence” OR “contaminated”) AND (“poultry litter” OR “poultry manure” OR “chicken manure” OR “pig slurry” OR “swine manure” OR “animal waste” OR “agricultural waste” OR “mineral fertilizer” OR “organic fertilizer” OR “phosphate fertilizer” OR “organo-mineral fertilizer” OR “limestone” OR “stone meal” OR “soil remineralizer” OR “rock dust” OR “rock flour” OR “vinasse” OR “stillage” OR “filter cake”) NOT (“drinking water” OR “marine” OR “aquatic” OR “animal experiment”). Articles published in English before 2025 were filtered, returning 1185 results.
For data screening, the open access web interface bibliometrix was used, known as biblioshiny, from R software, Vienna, Austria, version 4.3.2 [40,41]. The bibtex files were imported into the shiny environment, filtering the period before 2025 and the publication type “article”, returning a total of 1116 results. The processes and categories for including and excluding documents are detailed in the PRISMA diagram in Figure S1 [42].

2.2. Bibliometric Analysis and Visualization

Articles were imported into R software using the bibliometrix package for bibliometric analysis, using biblioshiny. Complementarily, the following packages were used: ggplot2, dplyr, extrafont, igraph, maps, mapsdata, and openxlsx [41]. The following bibliometric analyses were performed: annual article production; most productive authors, institutions, affiliations, and countries; conceptual structure analysis using multiple correspondence analysis (MCA) through keywords plus; and a thematic map from keywords plus. The author keywords and plus keywords were extracted from the database generated by Web of Science. The plus keywords are words that frequently appear in the reference titles of an article but do not appear in the article title itself.

2.3. Data Sources and Collecting for Meta-Analysis

For meta-analysis, a five-year filter (2020–2024) was used on the 1116 articles retrieved from the bibliometric analysis, resulting in 548 articles. Articles that did not evaluate PTEs, were reviews of other studies, or did not present standard deviation or standard error were all excluded. In addition, articles solely presenting data on PTE concentration in soil or plant tissue were excluded.
Of the 548 articles analyzed, only 45 articles fully met the meta-analysis requirements: presenting mean, standard deviation, and sample size. Standard error data were converted to standard deviation. For articles where the sample size was not described, three repetitions were adopted as a standard. Overall, 35% of the data had n imputed as three. The choice of triplicate as a standard was based on a commitment to data accuracy [43], in addition to being the most frequently reported n value among studies with non-imputed n (accounting for 67% of the data). From all references included in the meta-analysis (45 articles), data on a total of 115 sources were compiled (a single article may have information on more than one source).
Due to the high variability in the physicochemical composition of the different sources of organic and mineral fertilizers, the random effects model was chosen, with a one-arm forest plot (without a control). The data were categorized into subgroups that mainly reflect their origin, detailed further below. This model assumes that, due to the heterogeneity among studies, the true effect may vary from study to study [44]. Therefore, we recognize that the variability among diets and sources (e.g., type of animal, raw materials, and production patterns) produces high I2 and τ2 values (Table S4). Nevertheless, our assumptions are adequate for the purposes of this work, provided they are interpreted with caution in light of their limitations.
The composition of organic sources is directly related to the type of animal (i.e., species, weight, growth stage, sex, age, and cultivation purpose), the plant material (in the case of organic compost, chicken litter and others), the environment and the sampling procedures. Therefore, manures were grouped according to the type of animal (cattle manure, swine manure, chicken manure), while the composts (mix of animal waste + plant residue) were grouped into a single category. Sewage sludge was a separate category, including different types of municipal solid organic waste. Any residue from the industrial processing of plant, animal, or similar products was categorized as industrial waste. For mineral fertilizers, the same pattern was followed, grouping together items of similar composition. Soil conditioners without a detailed description of their composition (e.g., gypsum or limestone) were grouped into the same category.

2.4. Statistical and Ecotoxicological Risk Analysis

GraphPad, Boston, MA, USA version 9.0 [45] was used to compare the concentrations of Cd, Cu, Ni, Cr, As, Pb, and Zn between mineral and organic sources, with an unpaired t-test with Welch correction, at 5% significance level. Soil conditioners and industrial waste were not included due to a lack of a clear identification of their origin as organic or mineral.
The predicted environmental concentration of PTEs (PEC) in soil was estimated by considering a soil layer of 0.2 m and a bulk density of 1500 kg/m3, using the average concentration (most likely scenario) and the maximum concentration (worst-case scenario) of each metal (M) and the applied dose (D). The concentration was obtained according to Equation (1):
PEC = (D × M)/(3 × 106)
Ecotoxicological risk analysis to soil organisms was performed using the risk quotient approach (RQ), considering predicted no-effect concentration (PNEC) data, a protective value for soil biota and the terrestrial ecosystem. The metals evaluated and their respective PNEC values (mg/kg) were: As (0.86), Cd (0.21), Cr (1.57), Pb (3.05), Hg (0.16), Cu (13.1), and Zn (38.3). The PNEC values were estimated from the hazardous concentration for 5% of the species (HC5), calculated using species sensitivity distribution (SSD) curves, according to the following references: Xu et al., 2019; Wang et al., 2015; Wang et al., 2018; and Wan et al., 2020 [46,47,48,49].
RQ was used to assess the ecotoxicological risk, representing the ratio between the PEC and the PNEC, according to Equation (2):
RQ = PEC/PNEC
RQ is a robust approach for assessing ecotoxicological risk and is widely used in environmental studies [50,51]. RQ was interpreted according to Bhandari et al. (2021) [52], with the following classes: no risk (RQ < 0.01), low risk (0.01 ≤ RQ < 0.1), moderate risk (0.1 ≤ RQ < 1) and high risk (RQ ≥ 1). To estimate the years to achieve the PNEC (Y), Equation (3) was used:
Y = PNEC/PEC
Reference fertilizer doses from studies conducted on maize crops in soils with low natural fertility were used [53,54,55,56,57,58]. The lowest and highest doses presented in the studies were used to establish the risk analysis scenarios. A unique annual application of each fertilizer was considered to estimate the application limit, with exceptions for limestone and silicon fertilizer, with applications every 4 and 2 years, respectively. The following low and high doses were considered for the risk analysis: manure, compost and sewage sludge (5 and 20 t/ha); phosphate fertilizer (133 and 667 kg/ha); phosphate rock (150 and 750 kg/ha); potassium fertilizer (150 and 400 kg/ha); nitrogen fertilizer (333 and 1000 kg/ha); silicon fertilizer (0.88 and 1.32 t/ha); and limestone (0.75–4 t/ha). Four contrasting scenarios were considered: average metal concentration with a low fertilizer dose (Most likely-Low), average metal concentration with a high fertilizer dose (Most likely-High), maximum metal concentration with a low fertilizer dose (Worst-case-Low), and maximum metal concentration with a high fertilizer dose (Worst-case-High). Tables S1 and S2 provide more details on the values and methodologies for deriving the PNEC and on the fertilizer doses used.
It is important to highlight that several uncertainty factors need to be considered in this risk analysis. Among them, the following stand out: (i) the limitation and focus of ecotoxicological data on subtropical climates and organisms; (ii) the physical–chemical and biological variability of soils, including contrasting natural concentrations of PTEs; (iii) other pathways of PTE inputs besides fertilizer application (e.g., atmospheric deposition and pesticide use); (iv) outputs (e.g., leaching, surface runoff, and absorption by agricultural crops), which might slow down soil metal accumulation; and (v) the heterogeneity of methods for PTE quantification between countries, in which the results cannot always be directly compared. These uncertainty factors can all lead to overestimations in risk analyses.

2.5. Reference Values for PTEs in Fertilizers

Allowed values for PTEs in fertilizers were compared against the following regulations: EU 2019/1009 [59], Brazilian IN SDA Nº 27/2006 (as amended by IN SDA Nº 7/2016) [60], California Code of Regulations (3 CCR § 2302) [61], and the limit values from US EPA 40 C.F.R. Part 503 [62]. The more restrictive limits of the US EPA regulation were used as a ceiling for processed organic fertilizers [63,64]. For sewage sludge, the criteria were based on EU Directive 86/278/EEC [65], US EPA-40 C.F.R. Part 503 [62], and Brazilian CONAMA Resolution Nº 498/2020 [66].
European legislation was chosen due to its restrictive nature, while U.S. and Brazilian legislations were selected because they represent major global agricultural players with high fertilizer consumption [67,68]. Chinese legislation (NY/T 525-2021) for organic fertilizers [69] was used in the specific case of total Cr, since European and Brazilian legislation only include Cr (VI), while U.S. legislation does not include Cr in its regulation. The legal limit values adopted by European, Brazilian, and U.S. legislation are presented in Table S3.

3. Results

3.1. Bibliometric Review on PTE Sources

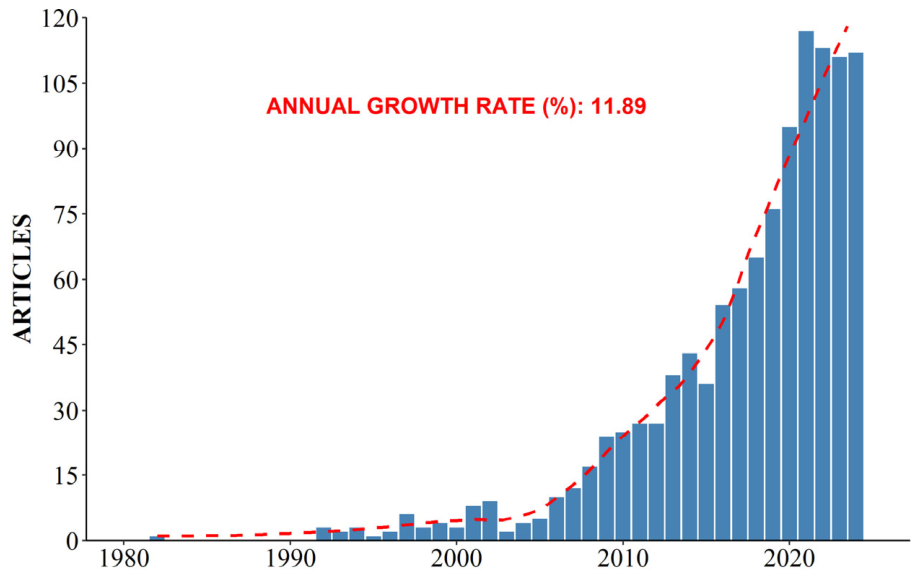
Between 1982 and 2024, there was an annual growth rate of 11.89% in the number of publications (Figure 1). A total of 4728 authors contributed to the 1116 documents, resulting in an average of 4.24 authors per document, 29.45 citations per document, and 28.49% rate of international co-authorship. A total of 3008 author keywords and 2376 keyword plus were generated. The average age of the analyzed documents is 7.52 years since publication, with an average of 3.41 citations per year.
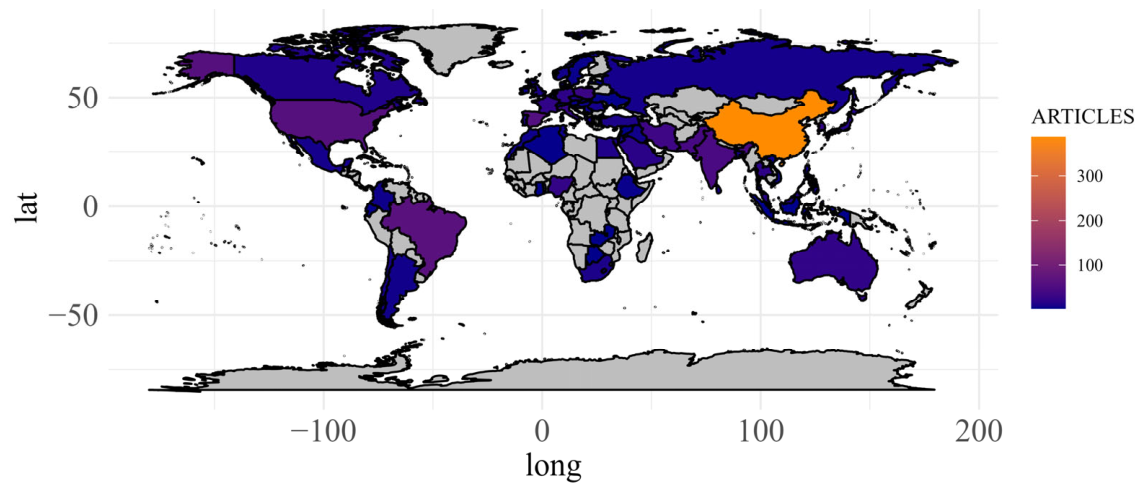
The ten most productive authors were: Li Y (n = 30), Chen Y (n = 29), Zhang Y (n = 25), Wang X (n = 23), Li H (n = 22), Wang Y (n = 21), Wang L (n = 20), Wang J (n = 19), Liu Y (n = 19) and Liu X (n = 19), all from China. The most productive institutions were: Zhejiang University (n = 58), Sun Yat-sen University (n = 43), Institute of Soil Science from Chinese Academy of Sciences (n = 42), Federal University of Santa Maria (n = 40), and Nanjing Agricultural University (n = 32). Globally, the top five publishing countries were: China (n = 388), Brazil (n = 65), USA (n = 60), Spain (n = 57), and India (n = 46) (Figure 2). Of these publications, China stands out for its extensive collaboration with other countries, with 86 publications, followed by Pakistan (26) and Brazil (14).
The three articles most cited were: “Biochar reduces the bioavailability and phytotoxicity of heavy metals” by Park et al. (2011) [70], with 879 citations; “Immobilization of Heavy Metal Ions (CuII, CdII, NiII, and PbII) by Broiler Litter-Derived Biochars in Water and Soil” by Uchimiya et al. (2010) [71], with 589 citations; and “Biochar application for the remediation of heavy metal polluted land: A review of in situ field trials” by O’Connor et al. (2018) [72], with 450 citations. It is important to note that these articles do not address the input of metals into the soil, focusing on remediation aspects.
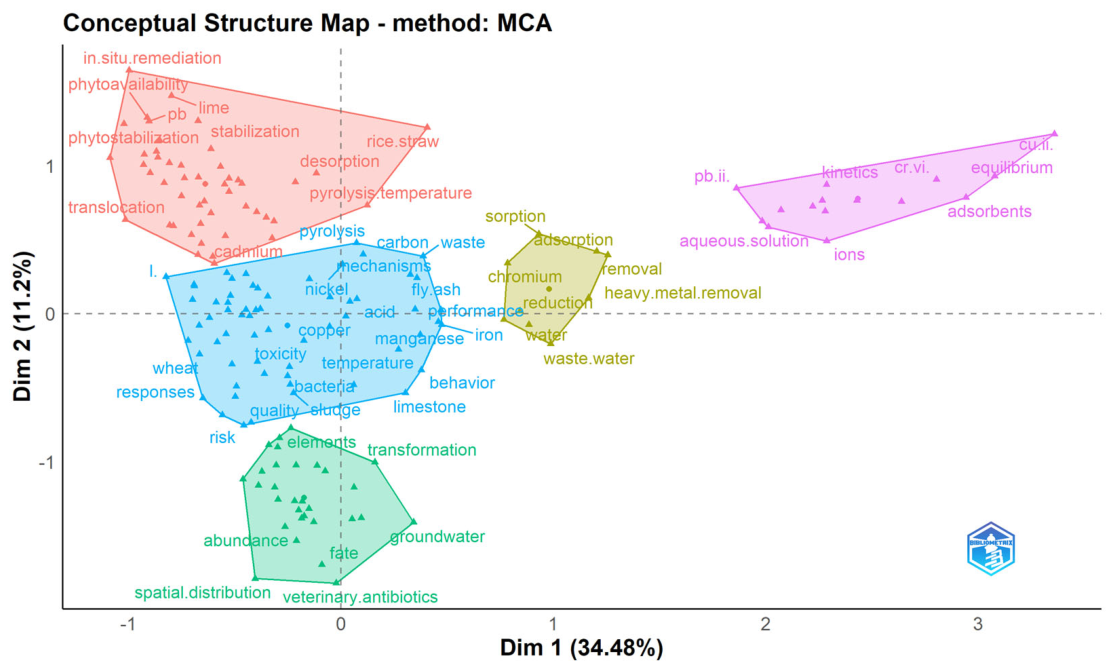
The conceptual structure of the keywords plus (Figure 3), that is, those generated by the database according to the cited references, produced five thematic clusters (number of terms = 50; number of documents = 50). The most cited articles are found in the blue and ochre clusters (Figure 3). The blue cluster has the following key terms: biochar, heavy metal, soil, agricultural soil, pig slurry, plants, and phytoremediation. The central region of Figure 3 presents terms such as sewage sludge, compost, manure, accumulation, zinc, copper, toxicity, and trace elements. The ochre cluster has the following delimiting terms: waste, sorption, adsorption, removal, wastewater, water, biomass, and carbon, with the term “mechanisms” more centrally located.
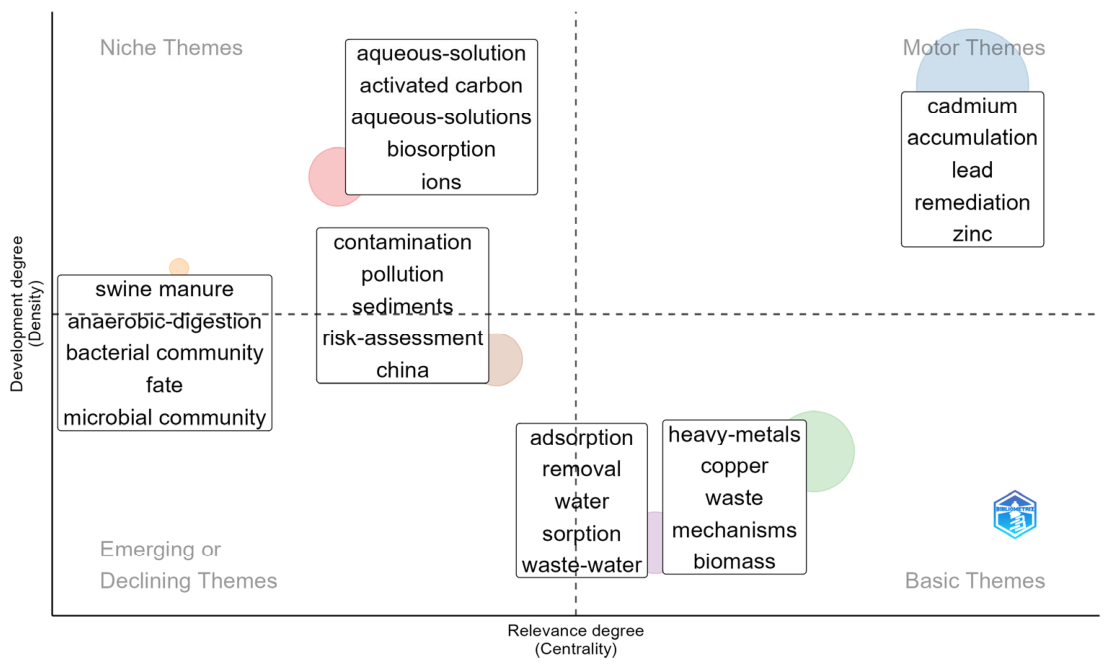
The thematic map (Figure 4) shows the formation of two specialized groups (1: aqueous-solution; activated carbon; aqueous-solutions; biosorption; ions; and 2: swine manure; anaerobic-digestion; bacterial community; fate; microbial community); an emerging or declining group (contamination; pollution; sediments; risk-assessment; China); a driving group (cadmium; accumulation; lead; remediation; zinc); and two basic groups (1: adsorption; removal; water; sorption; wastewater; and 2: heavy-metals; copper; waste; mechanisms; biomass).
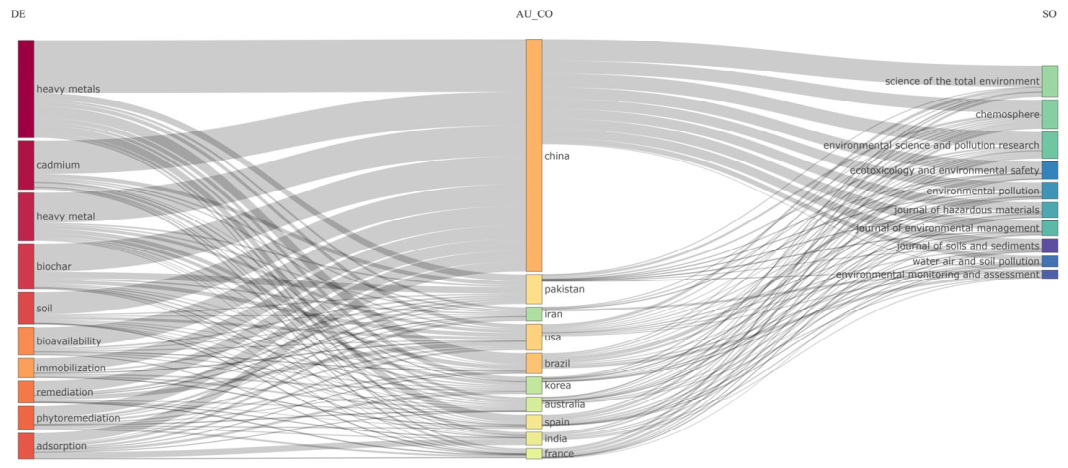
The relationship between these fields and the main research themes, the countries, and the journals is presented in Figure 5. Based on the author keywords, it is possible to observe that heavy metals, cadmium, biochar, soil, and bioavailability are the main research drivers, with the largest contributions coming from China, Pakistan, USA, and Brazil. The major publishing journals were “Science of the Total Environment”, “Chemosphere”, and “Environmental Science and Pollution Research”.

3.2. Meta-Analysis

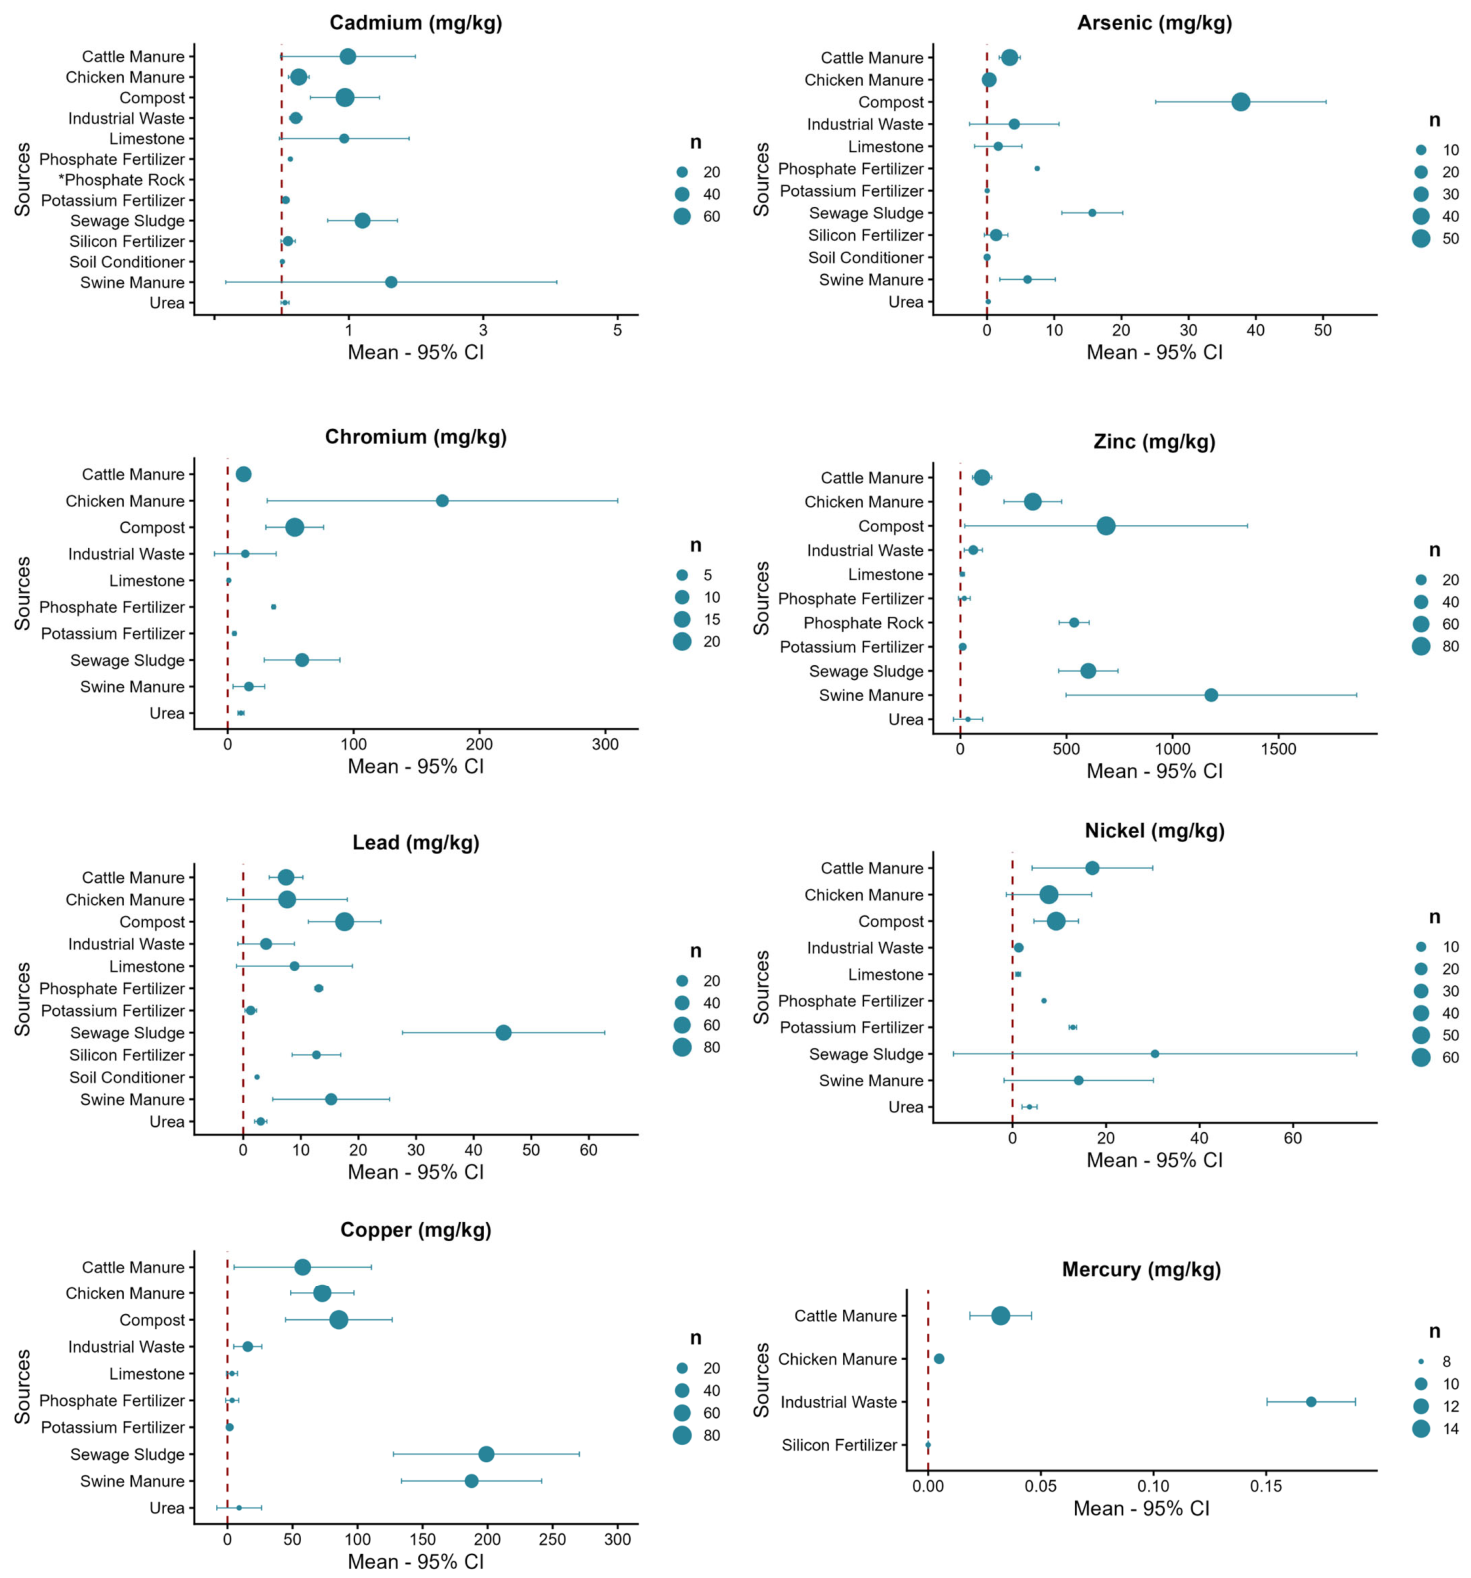
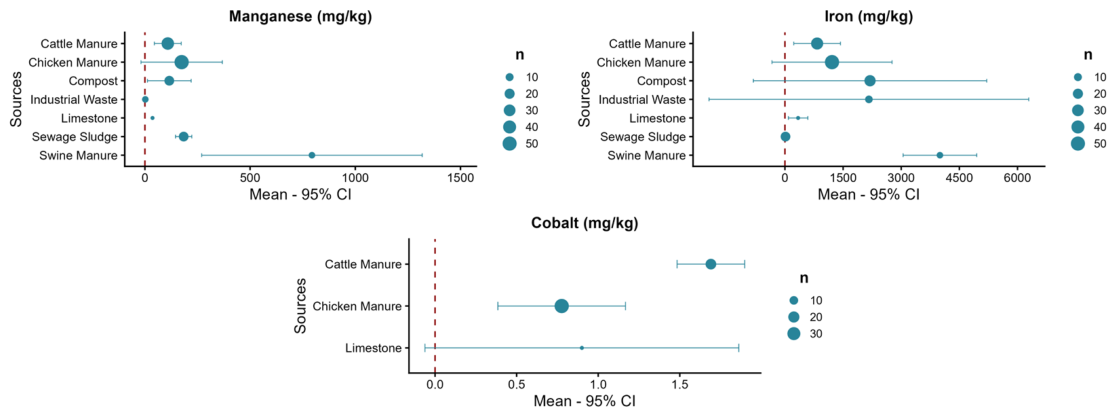
The results evidenced a high heterogeneity and variance of the PTE concentrations in the different fertilizers, as indicated by high values of I2 (above 75%), Q, and τ2 (Table S4). A high heterogeneity was expected due to the fertilizers’ distinct origins and relevant variations in several factors, such as physicochemical composition, management patterns, edaphoclimatic conditions, as well as production processes [73]. Thus, the means and confidence intervals (Figure 6 and Figure 7) were described by the random effects model, which incorporates part of the variance between studies [44].

3.2.1. PTE Occurrence on Mineral Sources

Powdered phosphate rock showed the highest cadmium concentration among all sources (74.2 mg/kg, Table 1). This value exceeds the EU legislation limit of 60 mg/kg for fertilizers with P2O5 ≥ 5%. It is also slightly above the U.S. and Brazilian legislation limits (80 mg/kg).
Other phosphate fertilizers (e.g., calcium superphosphate, calcium magnesium phosphate) had Cd concentrations (0.12–0.14 mg/kg) much lower than phosphate rock, remaining within all the regulations considered (Figure 6; Table 1). Regarding Cr, the phosphate fertilizer had an average concentration of 36.47 mg/kg, the highest value among all mineral sources. California legislation does not limit Cr in phosphate fertilizers; it regulates only As, Cd, and Pb. Brazilian legislation does not evaluate Cr in fertilizers that exclusively supply micronutrients, fertilizers with secondary macronutrients and micronutrients, mixed mineral fertilizers, and complex fertilizers with guaranteed primary macronutrients and micronutrients. European legislation only evaluates hexavalent Cr, precluding a comparison with total Cr concentrations.

3.2.2. PTE Occurrence on Organic Sources

Swine manure showed a maximum Cd concentration of 7.91 mg/kg, exceeding the limits of EU legislation (1.5 mg/kg), as well as the limits set by Brazilian (3 mg/kg) and U.S. (39 mg/kg) legislation. Cu and Zn were also found in high concentrations, ranging from 20.57 to 588.32 and 81.57 to 3270.00 mg/kg, respectively (Figure 6; Table 1). Cu and Zn maximum values are higher than the limits for Cu (300 mg/kg) and Zn (800 mg/kg) in European legislation. However, these values fall within the USEPA legislation limits for Cu (1500 mg/kg) and Zn (2800 mg/kg). Brazilian legislation does not establish limits for these elements. Swine manure also had high concentrations of manganese (525.20–1060.00 mg/kg) and Fe (3490.00–4460.00 mg/kg), which are not regulated by any legislation (Figure 7; Table 1).
Chicken manure showed variable Cr concentration (0.05–418.94 mg/kg), with a large confidence interval, demonstrating high data variability (Figure 6; Table 1). The chicken manure maximum Cr concentration is approximately three times higher and 18 times higher than maximum concentrations for cattle and swine manure, respectively. Chinese legislation on organic fertilizers (NY/T 525-2021) [74] sets a limit of 150 mg/kg for total Cr, which means that the maximum value for chicken manure is approximately three times higher.
Cattle manure showed a Cd maximum concentration of 4.40 mg/kg (Figure 6 and Table 1), above the limits of European (1.5 mg/kg) and Brazilian legislation (3 mg/kg) but within USEPA legislation (39 mg/kg). The range of Ni concentrations found in cattle manure (1.52–38.00 mg/kg) stood out in relation to other animal sources; however, maximum concentrations were within the limits of European, Brazilian, and USEPA legislation (50, 70, and 420 mg/kg, respectively). For total Cr in cattle manure, the maximum value (159.30 mg/kg) was above the limit established in Chinese legislation (150 mg/kg).
The organic compost showed a Cd maximum concentration of 3.14 mg/kg, above the limits of both European (1.5 mg/kg) and Brazilian (3 mg/kg) legislation but below the USEPA legislation limit of 39 mg/kg (Figure 6; Table 1). Concentrations of arsenic ranged from 1.90 to 63.67 mg/kg, with high data variability and a maximum value above the limits of European (40 mg/kg), Brazilian (20 mg/kg) and USEPA legislation (41 mg/kg). Furthermore, the maximum concentrations of Cu (351 mg/kg) and Zn (5651 mg/kg) also exceeded the limits set by European legislation for organic fertilizers (300 and 800 mg/kg, respectively) and only for Zn in the case of USEPA legislation (1500 and 2800 mg/kg, respectively). Iron concentrations ranged from 1.10 to 12,472.00 mg/kg (Figure 7; Table 1).
Sewage sludge showed Cu concentrations between 63.00 and 637.80 mg/kg (Figure 6 and Table 1), not exceeding European (1000–1750 mg/kg), Brazilian (1500–4300 mg/kg) or USEPA (1500–4300 mg/kg) regulations. For Zn, the values varied from 159.00 to 1217.00 mg/kg (Figure 6; Table 1), within the limits adopted by all legislations: European (2500–4000 mg/kg), USEPA (2800–7500 mg/kg) and Brazilian (2800–7500 mg/kg). For Ni, the values in sewage sludge (9.00–53.00 mg/kg) were higher than in other sources (maximum of 38.00 mg/kg in cattle manure) but within the limits established by European (300–400 mg/kg), USEPA (420 mg/kg) and Brazilian (420 mg/kg) legislation. High Pb concentrations were seen in sewage sludge (8.00–119.90 mg/kg) but also did not exceed the limits determined by European (750–1200 mg/kg), USEPA (300–840 mg/kg) and Brazilian (300–840 mg/kg) legislation (Figure 6; Table 1).
For mercury, none of the sources showed concentrations above the limits of the legislation consulted (Figure 6; Table 1). In general, organic sources showed higher concentrations of Mn, Fe, and Co than mineral ones (Figure 7; Table 1).

3.2.3. Other Sources

Potassium and silicon fertilizers, urea, limestone, industrial waste, and soil conditioners did not show relevant concentrations of As, Cd, Cr, Cu, Hg, Ni, Pb, and Zn, being always within the limits of all the legislations consulted. Brazilian legislation does not provide limits for Cu and Zn, although it is more restrictive than European legislation for Hg.

3.3. Mineral Versus Organic Sources

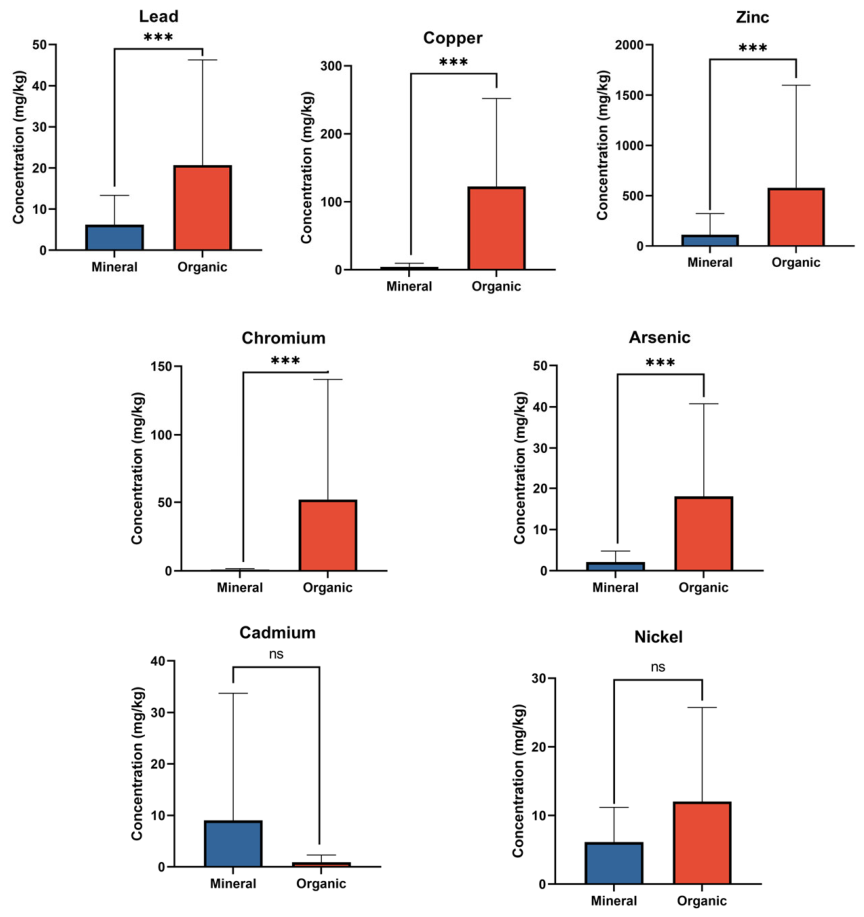
The comparison between mineral and organic sources for PTE concentrations is shown in Figure 8. Significant differences (p < 0.05) were found between the sources for copper (p < 0.0001), chromium (p < 0.0001), arsenic (p = 0.0010), lead (p = 0.0004), and zinc (p = 0.0008), which were all higher in organic sources. In contrast, no significant differences were found for cadmium (p = 0.1940) and nickel (p = 0.1218).

3.4. Ecotoxicological Risk for Soil Organisms

Overall, organic sources showed higher RQ values than mineral ones (Table 2 and Table 3). Considering the most likely scenario (using the mean PTE concentration), at low application rate, only Cr (0.18, moderate risk) for chicken manure and Cd (0.02, low risk) for phosphate rock presented any risk. On the other hand, considering high application rates, other PTEs and fertilizers showed moderate risk (Table 2): Cr—chicken manure (0.72), sewage sludge (0.25), compost (0.23); As—compost (0.29), sewage sludge (0.12); Zn—swine manure (0.21), compost (0.12), sewage sludge (0.10); and Cu—sewage sludge (0.10).
The worst-case scenario (using the maximum reported metal concentration) showed a much more concerning picture for organic sources, with moderate risks at low application rates for: Cr—chicken manure (0.44), sewage sludge (0.19), cattle manure (0.17), compost (0.13); As—compost (0.12); and Zn—compost (0.25), swine manure (0.14). On the other hand, for mineral sources, only low risks were observed: Cd—limestone (0.02), phosphate rock (0.02); and Pb—limestone (0.01). At high application rates, the RQ for Cr in chicken manure (1.78) stood out, surpassing the safety levels as fast as in 1 year (a unique application). In this worst-case scenario, all organic sources presented moderate RQ for at least two PTEs, especially sewage sludge, which showed moderate RQ for: Cr (0.77), Cu (0.32), Pb (0.26), Zn (0.21), As (0.12), and Cd (0.10). Mineral sources presented only low risks for: Cd—phosphate rock (0.10), limestone (0.06); As—limestone (0.03); and Pb—limestone (0.04) (Table 3).

4. Discussion

This study explored the state of the art regarding the presence of potentially toxic elements in organic and mineral fertilizers, encompassing information on publications, keywords, and relationships among authors, countries, and affiliations (bibliometric analyses). Moreover, quantitative information on the occurrence and concentration of these elements in fertilizers was also analyzed (meta-analysis). Overall, the results from the bibliometric analysis indicate two key findings: Firstly, the research frontier on this topic is located in China, which concentrates the majority of publications, authors, and affiliations involved. Secondly, fertilizers can be a relevant source of PTEs, potentially impacting soil organisms, in some cases even in the short-term.
The conceptual structure of article keywords in the bibliometric analysis revealed that, among the most cited papers, various organic materials are used either as a source of PTEs [75,76] or as raw materials for biochar synthesis [77,78]. These studies focus on agricultural soils, particularly in relation to metal toxicity and on advancing remediation techniques in agricultural contexts [79,80]. There is also a strong influence of research related to mechanisms for the removal and sorption of metals in water or wastewater treatment [81,82].
Another way to explore the relationships among these keywords is through a thematic co-word map, which delineates clusters of keywords, using density and centrality to classify themes and map them in a two-dimensional diagram [83]. The results indicate that the metals cadmium, zinc, and lead, along with the concepts of accumulation and remediation, are motor themes, being the most developed and relevant within the domain. In turn, the terms contamination, pollution, risk assessment, sediments, and China represent emerging or declining themes, meaning that they are not yet fully developed or are only marginally relevant. Basic themes include heavy metals, copper, waste, biomass, and mechanisms, which reflect significant values for the domain and are transversal across its different areas. Niche themes, corresponding to themes that are highly developed but marginal to the domain, include activated carbon, biosorption, ions, and aqueous solutions.
The meta-analysis (based on 115 data lines) showed that some metals, such as Zn (n = 91), Cu (n = 89), Cd (n = 88), and Pb (n = 83), were more investigated than others, such as Co (n = 6), Hg (n = 9), Se (n = 2), and Mo (n = 2). Farid et al. (2025) [63] pointed out that, for organic fertilizers, Hg, Se, beryllium (Be), antimony (Sb), silver (Ag), and thallium (Tl) are under-investigated metals. Moreover, in the case of Hg and Se, besides being poorly investigated, they presented high RQ, while for Sb, Ag, and Tl, risks are not clearly defined due to the limited number of available data [63].
China is dominant in this field, which is evidenced by its leading position in the number of published articles, the most productive authors, citations, co-citations, and international collaborations. This may be related to relevant metal pollution that the country has been facing in recent years [84]. For example, local surveys reported that 16% of soil samples and 19% of agricultural Chinese soils are contaminated with inorganic and/or organic pollutants, with 82.4% of the contamination attributed to metals and metalloids and 17.6% to organic contaminants [85]. This contamination poses severe risks to food security and public health, leading to the emergence of so-called “cancer villages” in some regions of China, such as Jiangsu and Guangdong provinces, where cancer morbidity rates are significantly higher than the national average. Metal contamination is directly linked to agricultural and mining activities [20].
Phosphate fertilizers are known to be a relevant source of PTEs [86], which is consistent with our meta-analysis results. Phosphate rocks are the main global source of phosphate fertilizers and occur in the Earth’s crust as igneous, metamorphic, and sedimentary deposits [87]. The geographical origin and geological characteristics of these deposits influence the concentrations of PTEs, which may also be introduced as impurities from acids used during fertilizer manufacturing [88]. In general, rock phosphates, especially those derived from sedimentary rock, contain higher Cd concentrations than other fertilizers, such as diammonium phosphate (DAP) or nitrophosphate (NP) [87]. The meta-analysis showed that phosphate rock mean Cd (74.2 mg/kg) and Zn (536.5 mg/kg) concentrations were substantially higher than any other mineral source. Moreover, the mean Cd concentration in phosphate rock was up to 700-fold higher than that of other phosphate fertilizers, while the Zn concentration was nearly 30-fold higher (Table 1).
Lucena et al. (2025) [39] reported mean Cu concentrations of 360.08 mg/kg in superphosphates, which is one hundred times higher than Cu in the phosphate fertilizers reported here (3.6 mg/kg). Furthermore, the authors reported a Zn concentration of 103 mg/kg in natural phosphate, a concentration much below that found in our phosphate rock (536.5 mg/kg). The authors’ meta-analysis is much different from ours, since it focuses on a very limited region (northeastern Brazil), considering fewer metals (only Cu, Zn, Fe, Mn, and Ni). Additionally, only seven sources were evaluated (limestone, agricultural gypsum, organomineral fertilizers, superphosphates, mixed fertilizers, natural phosphate, and magnesium oxides).
The use of organic fertilizers can alter the soil physicochemical properties due to the addition of organic matter (OM increasing soil concentrations of N, P, K, Cu, and Zn [89,90]. Moreover, it enhances soil microbial activity and diversity, also influencing the bioavailability of metals in soils, such as Cd [91]. Because OM contains a large number of functional groups and surface charges, it can adsorb metals onto its surface and immobilize them [92], reducing their interaction with plants and animals. However, it is important to note that OM can also enhance the transport of PTEs, mainly associated with dissolved organic carbon fractions [91], making monitoring of other soil properties crucial, particularly pH [93]. Under acidic conditions, the solubility of cationic metals increases, enhancing their bioavailability and expected toxicity [83].
Long-term application of organic fertilizers, such as cattle [83] and swine manure [19], may lead to the accumulation of PTEs in soils [19,94]. Duan and Feng (2021) [19], when analyzing PTEs in manures, observed that swine manure (588 mg/kg) had copper concentrations 14 times higher than cattle manure (41 mg/kg). Similarly, Nookabkaew et al. (2016) [95] reported higher average Cu concentrations in swine manure (410 mg/kg) compared with cattle manure (18 mg/kg). These results are consistent with our meta-analysis, where swine manure (187.7 mg/kg) also had higher concentrations of Cu than cattle manure (57.8 mg/kg) and chicken manure (72.9 mg/kg).
High copper and zinc concentrations in manure are directly related to animal diets and mineral supplementation, as these elements are added to improve animal performance and provide protection against bacterial infections [96]. Consequently, the most effective strategy to reduce soil accumulation of these elements from manure, especially swine manure, may be lowering Cu and Zn contents through dietary management [97]. However, this approach may face resistance from the production sector, requiring reformulation of animal supplementation practices, such as the adoption of amino acid–chelated minerals as alternatives to inorganic mineral sources [98]. Chicken manure can also contain PTEs, mainly influenced by the premixed feed used in poultry feeding [99]. This highlights the importance of rigorous quality control of the raw materials used in the manufacture of animal feed [100].
In practice, untreated manure can represent a relevant fraction of the total amount of organic fertilizer applied to the soil. However, in most countries, such as in Brazil, USA and European Union, raw manure is not directly regulated for metal content, [63] which represents a major regulatory gap [63]. However, in the absence of specific legislation for metal content in raw manure, regulations available for processed organic fertilizers can serve as an approximate reference [63]. The European Union has reduced the limits of Cu and Zn in pig feed and banned pharmacological doses of zinc oxide [101]. Considering that slightly more than 40% of the data included in this meta-analysis is from China, concerns related to Cu and Zn concentrations surpassing the European legislative limits may be overestimated for countries outside Europe with less restrictive regulations [102].
Duan and Feng (2021) [19] reported significantly higher Cr concentrations in chicken manure (153.66 ± 176.95 mg/kg) compared to swine (21.86 ± 136.62 mg/kg) and cattle (24.47 ± 34.57 mg/kg) manure, while they were similar when compared to sewage sludge (180.51 ± 35.45 mg/kg). Our results showed a similar trend, except for Cr in sewage sludge, which in our work was almost three times smaller (59.1 mg/kg) than chicken manure (170.5 mg/kg). Chromium mainly exists in two oxidation states: Cr(III) and Cr(VI). The hexavalent form is more toxic and mobile in water than the trivalent form, being classified as carcinogenic to humans [103]. Legislative frameworks are often criticized for failing to distinguish between chromium oxidation states, commonly treating both Cr(III) and Cr(VI) as equally toxic. In contrast, regulations in countries such as the United States, Brazil, and the European Union already consider limit values in organic fertilizers expressed specifically as Cr(VI) [104].
In general, for all fertilizers, European legislation is more restrictive than U.S. and Brazilian legislation (Table S3). For sewage sludge, a distinctive feature of Brazilian legislation is the inclusion of metals such as barium (Ba) and Cr (absent in U.S. legislation), as well as As, Cr, molybdenum (Mo), selenium (Se), and Ba (absent in European legislation). On the other hand, unlike the other legislations, the Brazilian one does not regulate Cu and Zn in manure and compost.
Like Cu, Zn, and Cr, Ni can also be present in industrial animal feed, where it is used as a catalyst in the production of specific ingredients [105]. In the meta-analysis, the highest concentrations of Ni were found in sewage sludge (30.5 mg/kg), cattle manure (17.1 mg/kg), swine manure (14.1 mg/kg), and potassium fertilizer (12.9 mg/kg). These results are consistent with data from the European Food Safety Authority (EFSA), which analyzed 2198 animal feed samples for Ni content and concluded that the category with the highest mean levels was “Minerals and their derived products” (n = 72; 3905 µg/kg), followed by “Compound feed” (n = 516), particularly complementary feeds for cattle fattening (n = 26; 6813 µg/kg), unspecified complementary feeds (n = 9; 5270 µg/kg), and complementary feeds for swine fattening (n = 6; 4344 µg/kg). This report also highlights that sewage sludge, widely used in agriculture, may contain appreciable levels of Ni, representing an additional source of exposure [105].
For As, organic compost was the source with the highest concentration (37.8 mg/kg) and the greatest variation (1.9–63.7 mg/kg) (Table 1). A key aspect of organic fertilizers is their inherent variability in physicochemical composition, which is influenced by numerous factors, such as season, location, animal diet, climate, and management practices [106]. For organic composts, numerous combinations of plant and animal components are possible, such as swine manure + cotton plant residues [29], swine manure + cereal straw [29], cattle manure + straw [107], and coffee pulp + wastewater [108]. As indicated by the bibliometric analysis, China accounts for a large proportion of the articles included in this meta-analysis. Due to the country’s large cereal production, particularly rice, composting with straw is common [30,107]. Several studies conducted in China reported significant arsenic uptake by rice [109,110], which may explain the high As values found in organic composts (Table 1, Figure 6).
For lead, none of the fertilizers exceeded the legal limits of all legislations, indicating that fertilization is not a relevant source of soil lead contamination. Vehicle emissions, especially in soils near highways, and industrial activities are more important sources of Pb in the environment [18,111]. Nevertheless, even within regulatory limits, our data show that Pb may still cause negative impacts, with estimated application times of 40 and 4 years to achieve the PNEC, considering the most likely-low and worst-case-high scenarios, respectively (Table 2 and Table 3).
When comparing organic and mineral sources, the results observed here are consistent with previous studies, such as a study comparing swine manure and mineral fertilizer (urea + triple superphosphate + potassium chloride) [112], where the highest Cu (285.9 ± 154 mg/kg) and Zn (455.6 ± 210 mg/kg) values were found in organic manure, whereas mineral fertilizers exhibited the lowest concentrations (29.3 and 158.5 mg/kg). On the other hand, different from our results, the mineral fertilizer analyzed by these authors contained higher concentrations of As, Cr, and Ni (8, 124, and 21 mg/kg) than the organic sources.
Concerning risk assessment, in the most likely scenario (Table 2), only organic sources (chicken manure, compost, swine manure, and sewage sludge) presented moderate risk to soil organisms. Among these sources, chicken manure stood out, with an estimated application interval until the PNEC is achieved of only 6 years (RQ = 0.18) under a low fertilization rate (5 ton/ha). Under a high fertilization rate (20 ton/ha), safety limits would be achieved in the first year of application, with an RQ = 0.72. Among the mineral sources, only phosphate rock presented a low risk (for Cd, RQ = 0.02), with an estimated application time of 57 years.
In the worst-case scenario (Table 3), chicken manure showed the highest RQ for Cr, with applications limited to 2 years (Moderate RQ = 0.44) under a low rate and only 1 year (High RQ = 1.78) under a high rate. In the worst-case scenario with a high rate, attention is also drawn to Cr in cattle manure (RQ = 0.68; 1 year of application), compost (RQ = 0.53; 2 years of application), and sewage sludge (RQ = 0.77; 1 year of application). Another PTE that stood out was Zn, mainly in compost (RQ = 0.98; 1 year of application) and swine manure (RQ = 0.57; 2 years of application). Mineral sources (limestone and phosphate rock) presented only low risk in the worst-case scenario. Similarly, a study focused exclusively on animal manures (cattle, chicken, pig, and sheep) also reported RQ > 1 for Zn, Cu, As, Hg, and Se, thereby suggesting relevant ecological risks [63].
Considering the worst-case scenario under a high fertilization rate, sewage sludge (Cr = 0.77; Cu = 0.32; Pb = 0.26; Zn = 0.21; As = 0.12; Cd = 0.10) and compost (Zn = 0.98; Cr = 0.53; As = 0.49; Cu = 0.18; Pb = 0.12) stood out from the other organic sources due to the number of situations with moderate risk, indicating a multi-contamination scenario in the long-term (18 and 35 years, respectively). It is also important to highlight that sewage sludge is a relevant source of other pollutants, such as endocrine-disrupting compounds, persistent organic pollutants, microplastics, pharmaceuticals, personal care products, and pathogens [113,114]. These pollutants can accumulate in the soil or be transported to water bodies, entering the food chain and increasing risks to human health and the ecosystem [115]. Composting itself is a low-cost technology for reducing or eliminating pathogens and organic pollutants in sewage sludge, such as polycyclic aromatic hydrocarbons and antibiotic resistance genes [116,117]. However, it has little effect on PTE concentrations, as these are persistent inorganic compounds that are not biologically degraded [117].
A relevant drawback of this work is that it does not account for the dynamics of PTEs in soils and the metal losses that may occur due to different processes such as crop uptake and removal, surface runoff, and leaching [96], all of which directly affect the soil metal balance. Additionally, soil metal contamination may occur through other pathways such as atmospheric deposition and pesticide use [85,92]. However, it should be highlighted that considering metal losses will not necessarily produce relevant changes in the estimated time for metal accumulation in the soil. Taking the application of swine manure as an example, with a Zn average concentration of 1182.5 mg/kg, applied to a soil with a density of 1.5 g/cm3, considering a 0.2 m depth layer and a rate of 5 ton/ha, this would result in a total Zn input of 5912.5 g/ha. Considering losses due to crop harvest equal to 342 g/ha and by leaching of 39 g/ha [118], this would result in a net annual accumulation of 5531.5 g/ha. Considering the PNEC for Zn adopted in this study (38 mg/kg), this would result in an estimated maximum application time of 21 years, which is not much different than our 19-year estimate (Table 2).
The risk assessment illustrated that, in many cases, safe thresholds could be reached within only a few years, underscoring the importance of material characterization, application rate adjustments, and derivation of safe limits to ensure sustainable and safe fertilizer use, particularly over the long term [9]. It is also crucial to recognize that natural concentrations of metals in soils can vary widely, depending on weathering processes, soil mineralogy, and volcanic activity [22]. This is a critical aspect that can strongly influence the time required to reach PNEC values. For example, in a study conducted in the state of Paraná (Brazil), natural concentrations of Cu (103.8 mg/kg) and Sb (3.7 mg/kg) already exceeded the reference values for soil quality protection [119] of 60 and 2 mg/kg, respectively. The authors emphasized the importance of the basaltic rock of this region for the high Cu and Sb natural levels [120].
For manure application in China, Zhang et al. (2026) [102] estimated that the concentration limits of Chinese legislation would be achieved in 15, 18, and 14 years for Cd, Zn, and Cu, respectively. Sun et al. (2023) [121] conducted a field monitoring of PTE accumulation in agricultural soils following continuous application of organic fertilizers, observing distinct dynamics among the analyzed metals (Cu, Zn, As, and Pb) and cropping systems (rice paddy, orchards, and vegetable garden) over a period of up to eight years. In that study, manure application significantly influenced the accumulation of Cu, Zn, and As in soils, whereas its impact on Pb accumulation was relatively minor.
Taken together, our results evidenced relevant ecological risks associated with long-term fertilizer application, especially from organic sources. These findings evidence the urgency of fertilizer management practices, the need for improved animal feed regulation, and the need for rigorous quality control of organic fertilizers. Therefore, medium- and long-term monitoring of the impacts of fertilizer application on soil PTE concentrations is essential for ecosystem sustainability [90,91,122].

5. Conclusions

Bibliometric analyses indicated an annual growth of 11.89% in publications on the topic between 1982 and 2024, driven mainly by China, Pakistan, the United States, and Brazil. Research has focused mainly on cadmium, the use of biochar, and aspects related to the bioavailability of PTEs in soils. Elements such as mercury, manganese, cobalt, and selenium have received little attention compared to cadmium, arsenic, lead, zinc and copper.
The comparison between mineral and organic sources showed that organic sources presented higher concentrations of copper, chromium, arsenic, lead, and zinc, while no differences were found for cadmium and nickel. Concentrations of zinc and copper were especially high in swine manure, with maximum concentrations of 1182 mg/kg for Zn and 588 mg/kg for Cu, respectively. Although Cu and Zn in organic fertilizers are not regulated by Brazilian legislation (IN SDA No. 27, 5 June 2006), it includes Cr and As, which are not regulated in European legislation for sewage sludge. Furthermore, some metals (such as hexavalent chromium and mercury), although included in European and Brazilian regulatory frameworks, have been poorly investigated in the scientific literature, highlighting the relevance of their inclusion in future research.
Organic sources showed higher RQ than mineral ones, representing greater risks to soil organisms. For chicken manure, even at low fertilization doses, a moderate risk for Cr was seen, with applications lasting only six years until reaching the PNEC. Although in some limited cases even short-term applications could already reach the PNEC values, for most sources, this is more likely to occur associated with medium- to long-term applications. Nevertheless, our results clearly show that fertilizers, especially organic ones, can be a relevant source of PTEs in soils.
Overall, our findings highlight the need for: (i) further studies assessing the impact of fertilizer application on soil biota under local edaphoclimatic conditions, especially in long-term application scenarios; (ii) more research to derive reference values for soil quality protection using ecotoxicological tests with native organisms, which is especially important for tropical soils, which actually show less available data; (iii) more stringent feed formulation policies; (iv) specific legislation for monitoring PTEs in raw manure; and (v) fertilization management practices that consider the pollution footprint of fertilizers. Altogether, these efforts constitute strategic means for advancing into the direction of a more sustainable agriculture.

Supplementary Materials

The following supporting information can be downloaded at: https://www.mdpi.com/article/10.3390/land15081377/s1, Figure S1: Flow diagram based on the PRISMA model demonstrating the process of identifying, bibliometric, eligibility, and inclusion of articles. Due to the low number of studies retrieved and the possibility that relevant information might be present in articles that could be excluded during the screening phase all selected references were read; Table S1: Reference values used in risk analysis, characterized as protective for soil biota.; Table S2: Scenarios of fertilizer application rates considered for risk assessment in maize crops under low-fertility soils.; Table S3: Potentially toxic elements threshold adopted by European, Brazilian and U.S. legislation.; Table S4: Meta-analyses parameters by subgroup: number of studies, heterogeneity (I2 and Q) and variance between studies (τ2).

Author Contributions

Conceptualization, D.M.d.S.O., R.M.P.L. and J.N.M.R.; Data Curation, D.M.d.S.O., R.M.P.L. and J.N.M.R.; Methodology, D.M.d.S.O., R.M.P.L. and J.N.M.R.; Funding Acquisition, D.M.d.S.O. and R.M.P.L.; Resources, D.M.d.S.O. and R.M.P.L.; Supervision, D.M.d.S.O. and R.M.P.L.; Project Administration, D.M.d.S.O. and R.M.P.L.; Formal Analysis, J.N.M.R.; Investigation, J.N.M.R.; Software, J.N.M.R.; Validation, J.N.M.R.; Visualization, J.N.M.R.; Writing—Original Draft, J.N.M.R.; Writing—Review and Editing, D.M.d.S.O., R.M.P.L., A.R.C. and V.M.G. All authors have read and agreed to the published version of the manuscript.

Funding

We would like to thank the Instituto Federal de Educação, Ciência e Tecnologia Goiano—IF Goiano, for supporting this research through Call Nº. 11/2026—PROPPI/IF GOIANO (PIAT).

Data Availability Statement

The data that support the findings of this study are openly available in Zenodo at https://doi.org/10.5281/zenodo.18836348 [123].

Acknowledgments

This study was financed in part by the Coordenação de Aperfeiçoamento de Pessoal de Nível Superior—Brasil (CAPES)—Finance Code 001. We also to thank the two anonymous reviewers for their valuable comments that directly contributed to the final version of this work.

Conflicts of Interest

The authors declare no conflicts of interest.

Abbreviations

The following abbreviations are used in this manuscript:
EC10Effective Concentration for 10%
MECMeasured Environment Concentrations
NOECNo Observed Effect Concentration
PNECPredicted No-Effect Concentration
PTEPotentially Toxic Elements
RQRisk Quotient

References

  1. Hou, D.; Jia, X.; Wang, L.; McGrath, S.P.; Zhu, Y.-G.; Hu, Q.; Zhao, F.-J.; Bank, M.S.; O’Connor, D.; Nriagu, J. Global Soil Pollution by Toxic Metals Threatens Agriculture and Human Health. Science 2025, 388, 316–321. [Google Scholar] [CrossRef] [Scilit]
  2. Rashid, A.; Schutte, B.J.; Ulery, A.; Deyholos, M.K.; Sanogo, S.; Lehnhoff, E.A.; Beck, L. Heavy Metal Contamination in Agricultural Soil: Environmental Pollutants Affecting Crop Health. Agronomy 2023, 13, 1521. [Google Scholar] [CrossRef] [Scilit]
  3. Upadhyay, V.; Kumari, A.; Kumar, S. From Soil to Health Hazards: Heavy Metals Contamination in Northern India and Health Risk Assessment. Chemosphere 2024, 354, 141697. [Google Scholar] [CrossRef] [Scilit] [PubMed]
  4. Hou, D.; O’Connor, D.; Igalavithana, A.D.; Alessi, D.S.; Luo, J.; Tsang, D.C.W.; Sparks, D.L.; Yamauchi, Y.; Rinklebe, J.; Ok, Y.S. Metal Contamination and Bioremediation of Agricultural Soils for Food Safety and Sustainability. Nat. Rev. Earth Environ. 2020, 1, 366–381. [Google Scholar] [CrossRef] [Scilit]
  5. Zhang, H.; Yuan, X.; Xiong, T.; Wang, H.; Jiang, L. Bioremediation of Co-Contaminated Soil with Heavy Metals and Pesticides: Influence Factors, Mechanisms and Evaluation Methods. Chem. Eng. J. 2020, 398, 125657. [Google Scholar] [CrossRef] [Scilit]
  6. Giller, K.E.; Delaune, T.; Silva, J.V.; Descheemaeker, K.; van de Ven, G.; Schut, A.G.T.; van Wijk, M.; Hammond, J.; Hochman, Z.; Taulya, G.; et al. The Future of Farming: Who Will Produce Our Food? Food Secur. 2021, 13, 1073–1099. [Google Scholar] [CrossRef] [Scilit]
  7. Gu, D.; Andreev, K.; Dupre, M.E. Major Trends in Population Growth Around the World. China CDC Wkly. 2021, 3, 604–613. [Google Scholar] [CrossRef] [Scilit] [PubMed]
  8. Barłóg, P.; Hlisnikovský, L.; Łukowiak, R.; Kunzová, E. Effect of Long-Term Application of Pig Slurry and NPK Fertilizers on Trace Metal Content in the Soil. Environ. Sci. Pollut. Res. 2024, 31, 60004–60022. [Google Scholar] [CrossRef] [Scilit] [PubMed]
  9. Su, K.; Zhang, Q.; Chen, A.; Wang, X.; Zhan, L.; Rao, Q.; Wang, J.; Yang, H. Heavy Metals Concentrations in Commercial Organic Fertilizers and the Potential Risk of Fertilization into Soils. Sci. Rep. 2025, 15, 1230. [Google Scholar] [CrossRef] [Scilit] [PubMed]
  10. Ali, H.; Khan, E.; Ilahi, I. Environmental Chemistry and Ecotoxicology of Hazardous Heavy Metals: Environmental Persistence, Toxicity, and Bioaccumulation. J. Chem. 2019, 2019, 6730305. [Google Scholar] [CrossRef] [Scilit]
  11. Kristamtini; Widyayanti, S.; Widodo, S.; Pustika, A.B.; Purwaningsih, H.; Hanifa, A.P.; Muazam, A.; Sutardi; Badia Ginting, R.C.; Mulia, S.; et al. Potentially Toxic Elements’ (PTEs) Spatial Distribution in Agricultural Soils and Their Impact on Ecological and Health Risks. Case Stud. Chem. Environ. Eng. 2024, 10, 100936. [Google Scholar] [CrossRef] [Scilit]
  12. Gulcin, İ.; Alwasel, S.H. Metal Ions, Metal Chelators and Metal Chelating Assay as Antioxidant Method. Processes 2022, 10, 132. [Google Scholar] [CrossRef] [Scilit]
  13. Jomova, K.; Makova, M.; Alomar, S.Y.; Alwasel, S.H.; Nepovimova, E.; Kuca, K.; Rhodes, C.J.; Valko, M. Essential Metals in Health and Disease. Chem. Biol. Interact. 2022, 367, 110173. [Google Scholar] [CrossRef] [Scilit] [PubMed]
  14. Balali-Mood, M.; Naseri, K.; Tahergorabi, Z.; Khazdair, M.R.; Sadeghi, M. Toxic Mechanisms of Five Heavy Metals: Mercury, Lead, Chromium, Cadmium, and Arsenic. Front. Pharmacol. 2021, 12, 643972. [Google Scholar] [CrossRef] [Scilit] [PubMed]
  15. Priya, A.K.; Muruganandam, M.; Ali, S.S.; Kornaros, M. Clean-Up of Heavy Metals from Contaminated Soil by Phytoremediation: A Multidisciplinary and Eco-Friendly Approach. Toxics 2023, 11, 422. [Google Scholar] [CrossRef] [Scilit] [PubMed]
  16. Wang, J.; Hou, Q.; Yang, Z.; Yu, T.; Wen, R. Anthropogenic increase of heavy metals in soil from a heavily contaminated area of China. Environ. Pollut. Bioavailab. 2023, 35, 1. [Google Scholar] [CrossRef] [Scilit]
  17. Cheng, W.; Lei, S.; Bian, Z.; Zhao, Y.; Li, Y.; Gan, Y. Geographic Distribution of Heavy Metals and Identification of Their Sources in Soils near Large, Open-Pit Coal Mines Using Positive Matrix Factorization. J. Hazard. Mater. 2020, 387, 121666. [Google Scholar] [CrossRef] [Scilit] [PubMed]
  18. Xu, Y.; Shi, H.; Fei, Y.; Wang, C.; Mo, L.; Shu, M. Identification of Soil Heavy Metal Sources in a Large-Scale Area Affected by Industry. Sustainability 2021, 13, 511. [Google Scholar] [CrossRef] [Scilit]
  19. Duan, B.; Feng, Q. Comparison of the Potential Ecological and Human Health Risks of Heavy Metals from Sewage Sludge and Livestock Manure for Agricultural Use. Toxics 2021, 9, 145. [Google Scholar] [CrossRef] [Scilit] [PubMed]
  20. Lu, Y.; Song, S.; Wang, R.; Liu, Z.; Meng, J.; Sweetman, A.J.; Jenkins, A.; Ferrier, R.C.; Li, H.; Luo, W.; et al. Impacts of Soil and Water Pollution on Food Safety and Health Risks in China. Environ. Int. 2015, 77, 5–15. [Google Scholar] [CrossRef] [Scilit] [PubMed]
  21. Nunes, N.; Ragonezi, C.; Gouveia, C.S.S.; Pinheiro de Carvalho, M.Â.A. Review of Sewage Sludge as a Soil Amendment in Relation to Current International Guidelines: A Heavy Metal Perspective. Sustainability 2021, 13, 2317. [Google Scholar] [CrossRef] [Scilit]
  22. Wan, Y.; Liu, J.; Zhuang, Z.; Wang, Q.; Li, H. Heavy Metals in Agricultural Soils: Sources, Influencing Factors, and Remediation Strategies. Toxics 2024, 12, 63. [Google Scholar] [CrossRef] [Scilit] [PubMed]
  23. Shakoor, A.; Bosch-Serra, À.D.; Alberdi, J.R.O.; Herrero, C. Seven Years of Pig Slurry Fertilization: Impacts on Soil Chemical Properties and the Element Content of Winter Barley Plants. Environ. Sci. Pollut. Res. 2022, 29, 74655–74668. [Google Scholar] [CrossRef] [Scilit] [PubMed]
  24. Tang, T.; Zhou, H.; Yang, Z.; Zeng, P.; Gu, J.-F.; Mu, Y.-S.; Liu, C.-F.; Han, Z.-Y. Meta-Analysis of the Impacts of Applying Livestock and Poultry Manure on Cadmium Accumulation in Soil and Crops. Agronomy 2024, 14, 2942. [Google Scholar] [CrossRef] [Scilit]
  25. Rodríguez-Eugenio, N.; McLaughlin, M.; Pennock, D. Soil Pollution: A Hidden Reality; FAO—Food and Agriculture Organization of the United Nations: Roma, Italy, 2018. [Google Scholar]
  26. Guilherme, L.R.G.; Corguinha, A.P.B.; Ribeiro do Valle, L.A.; Marchi, G. Heavy Metals in P Fertilizers Marketed in Brazil: Is This a Concern in Our Agroecosystems? SYMPHOS 2019–5th International Symposium on Innovation & Technology in the Phosphate Industry. 2020. Available online: https://papers.ssrn.com/sol3/papers.cfm?abstract_id=3627425 (accessed on 3 June 2026).
  27. Nziguheba, G.; Smolders, E. Inputs of Trace Elements in Agricultural Soils via Phosphate Fertilizers in European Countries. Sci. Total Environ. 2008, 390, 53–57. [Google Scholar] [CrossRef] [Scilit] [PubMed]
  28. Choudhary, M.; Datta, S.P.; Golui, D.; Meena, M.C.; Nogiya, M.; Samal, S.K.; Raza, M.B.; Rahman, M.M.; Mishra, R. Effect of Sludge Amelioration on Yield, Accumulation and Translocation of Heavy Metals in Soybean Grown in Acid and Alkaline Soils. Environ. Sci. Pollut. Res. 2023, 30, 101343–101357. [Google Scholar] [CrossRef] [Scilit] [PubMed]
  29. Clemente, R.; Sáez-Tovar, J.A.; Bernal, M.P. Extractability, Distribution Among Different Particle Size Fractions, and Phytotoxicity of Cu and Zn in Composts Made with the Separated Solid Fraction of Pig Slurry. Front. Sustain. Food Syst. 2020, 4, 2. [Google Scholar] [CrossRef] [Scilit]
  30. Li, M.; Zhang, J.; Yang, X.; Zhou, Y.; Zhang, L.; Yang, Y.; Luo, L.; Yan, Q. Responses of Ammonia-Oxidizing Microorganisms to Biochar and Compost Amendments of Heavy Metals-Polluted Soil. J. Environ. Sci. 2021, 102, 263–272. [Google Scholar] [CrossRef] [Scilit] [PubMed]
  31. Mitra, S.; Chakraborty, A.J.; Tareq, A.M.; Emran, T.B.; Nainu, F.; Khusro, A.; Idris, A.M.; Khandaker, M.U.; Osman, H.; Alhumaydhi, F.A.; et al. Impact of Heavy Metals on the Environment and Human Health: Novel Therapeutic Insights to Counter the Toxicity. J. King Saud. Univ. Sci. 2022, 34, 101865. [Google Scholar] [CrossRef] [Scilit]
  32. dos Santos Sousa, J.; Santos, M.M.; Santos, B.N.; dos Santos, N.M.M.; dos Pinto, L.C. Agricultura Em Áreas Industriais e Contaminação Por Metais Pesados: Estratégias Para Redução Deste Impacto Ambiental. Rev. Bras. Geogr. Fis. 2021, 14, 322–331. [Google Scholar] [CrossRef] [Scilit]
  33. Li, J.; Guo, Z.; Wang, Y.; Gao, L.; Peng, X. Long-Term Fertilization Increases Heavy Metals Accumulation in Topsoil but Not in Deeper Layers of Red Soil Sloping Farmland. J. Environ. Manag. 2025, 396, 128171. [Google Scholar] [CrossRef] [Scilit] [PubMed]
  34. Ding, W.Q.; Sawut, R.; Rixit, G.; Xu, M. Combining Random Forest and XGBoost Models for Source Apportionment and Health Risk Assessments of Heavy Metals in Suburban Farmland Soils. Ecotoxicol. Environ. Saf. 2025, 306, 119357. [Google Scholar] [CrossRef] [Scilit] [PubMed]
  35. Fu, Y.; Mao, Y.; Jiang, S.; Luo, S.; Chen, X.; Xiao, W. A Bibliometric Analysis of Systematic Reviews and Meta-Analyses in Ophthalmology. Front. Med. 2023, 10, 1135592. [Google Scholar] [CrossRef] [Scilit] [PubMed]
  36. Gao, Z.; Zhao, L.; Geng, H.; Li, M.; Chen, D.; Zhang, Y. Bibliometric and Literature Review of the Development of Mineral Fertilizers. Environ. Sci. Pollut. Res. 2023, 31, 27–42. [Google Scholar] [CrossRef] [Scilit] [PubMed]
  37. Chen, H.; Yang, H.; Shi, X.; Li, H.; Wang, X.; Ren, Q.; Deng, A.; Song, Z.; Zhang, W. A Bibliometric Review of Research Trends in Exogenous Organic Amendments Application and Soil Leaching (1964–2024). J. Hazard. Mater. Adv. 2025, 19, 100801. [Google Scholar] [CrossRef] [Scilit]
  38. Ouala, O.; Essadki, Y.; Oudra, B.; El Khalloufi, F.; Martins, R. Bibliometric Analysis Towards Industrial-Scale Use of Marine Algae and Lichens as Soil Amendments and Plant Biofertilizers for Sustainable Agriculture. Phycology 2025, 5, 29. [Google Scholar] [CrossRef] [Scilit]
  39. Lucena, W.B.; De Machado, D.C.; Alves, D.O. Metais Pesados Em Corretivos e Fertilizantes Agrícolas: Metanálise. J. Educ. Sci. Health 2025, 5, 1–9. [Google Scholar] [CrossRef] [Scilit]
  40. Aria, M.; Cuccurullo, C. Bibliometrix: An R-Tool for Comprehensive Science Mapping Analysis. J. Informetr. 2017, 11, 959–975. [Google Scholar] [CrossRef] [Scilit]
  41. R Core Team. R: A Language and Environment for Statistical Computing, version 4.3.2; R Foundation for Statistical Computing: Vienna, Austria, 2024. [Google Scholar]
  42. Moher, D.; Liberati, A.; Tetzlaff, J.; Altman, D.G. Preferred Reporting Items for Systematic Reviews and Meta-Analyses: The PRISMA Statement. PLoS Med. 2009, 6, e1000097. [Google Scholar] [CrossRef] [Scilit] [PubMed]
  43. Kambach, S.; Bruelheide, H.; Gerstner, K.; Gurevitch, J.; Beckmann, M.; Seppelt, R. Consequences of Multiple Imputation of Missing Standard Deviations and Sample Sizes in Meta-analysis. Ecol. Evol. 2020, 10, 11699–11712. [Google Scholar] [CrossRef] [Scilit] [PubMed]
  44. Dettori, J.R.; Norvell, D.C.; Chapman, J.R. Fixed-Effect vs Random-Effects Models for Meta-Analysis: 3 Points to Consider. Glob. Spine J. 2022, 12, 1624–1626. [Google Scholar] [CrossRef] [Scilit] [PubMed]
  45. GraphPad. Software GraphPad Prism; version 9.0; GraphPad: Boston, MA, USA, 2020. [Google Scholar]
  46. Xu, X.; Wang, T.; Sun, M.; Bai, Y.; Fu, C.; Zhang, L.; Hu, X.; Hagist, S. Management Principles for Heavy Metal Contaminated Farmland Based on Ecological Risk—A Case Study in the Pilot Area of Hunan Province, China. Sci. Total Environ. 2019, 684, 537–547. [Google Scholar] [CrossRef] [Scilit] [PubMed]
  47. Wang, X.; Wei, D.; Ma, Y.; McLaughlin, M.J. Soil Ecological Criteria for Nickel as a Function of Soil Properties. Environ. Sci. Pollut. Res. 2018, 25, 2137–2146. [Google Scholar] [CrossRef] [Scilit] [PubMed]
  48. Wang, X.; Wei, D.; Ma, Y.; McLaughlin, M.J. Correction: Derivation of Soil Ecological Criteria for Copper in Chinese Soils. PLoS ONE 2015, 10, e0140306. [Google Scholar] [CrossRef] [Scilit] [PubMed]
  49. Wan, Y.; Jiang, B.; Wei, D.; Ma, Y. Ecological Criteria for Zinc in Chinese Soil as Affected by Soil Properties. Ecotoxicol. Environ. Saf. 2020, 194, 110418. [Google Scholar] [CrossRef] [Scilit] [PubMed]
  50. Young, G.; Chen, Y.; Yang, M. Concentrations, Distribution, and Risk Assessment of Heavy Metals in the Iron Tailings of Yeshan National Mine Park in Nanjing, China. Chemosphere 2021, 271, 129546. [Google Scholar] [CrossRef] [Scilit] [PubMed]
  51. Fang, T.; Yang, K.; Wang, H.; Fang, H.; Liang, Y.; Zhao, X.; Gao, N.; Li, J.; Lu, W.; Cui, K. Trace Metals in Sediment from Chaohu Lake in China: Bioavailability and Probabilistic Risk Assessment. Sci. Total Environ. 2022, 849, 157862. [Google Scholar] [CrossRef] [Scilit] [PubMed]
  52. Bhandari, G.; Atreya, K.; Vašíčková, J.; Yang, X.; Geissen, V. Ecological Risk Assessment of Pesticide Residues in Soils from Vegetable Production Areas: A Case Study in S-Nepal. Sci. Total Environ. 2021, 788, 147921. [Google Scholar] [CrossRef] [Scilit] [PubMed]
  53. Yada, M.M.; de Melo, W.J.; Mingotte, F.L.C.; de Melo, V.P.; de Melo, G.M.P. Chemical and Biochemical Properties of Oxisols after Sewage Sludge Application for 16 Years. Rev. Bras. Cienc. Solo 2015, 39, 1303–1310. [Google Scholar] [CrossRef] [Scilit]
  54. Purnomo, J.; Yusron, M.; Jubaedah; Nurjaya; Kariada, I.K. Effect of Lime on Soil Chemical Properties and Corn Growth in Ultisols Lebak, Banten. IOP Conf. Ser. Earth Environ. Sci. 2024, 1377, 012113. [Google Scholar] [CrossRef] [Scilit]
  55. Galindo, F.S.; Pagliari, P.H.; Rodrigues, W.L.; Fernandes, G.C.; Boleta, E.H.M.; Santini, J.M.K.; Jalal, A.; Buzetti, S.; Lavres, J.; Teixeira Filho, M.C.M. Silicon Amendment Enhances Agronomic Efficiency of Nitrogen Fertilization in Maize and Wheat Crops under Tropical Conditions. Plants 2021, 10, 1329. [Google Scholar] [CrossRef] [Scilit] [PubMed]
  56. Coelho, A.E.; Sangoi, L.; Balbinot, A.A.; Kuneski, H.F.; Martins, M.C. Nitrogen Use Efficiency and Grain Yield of Corn Hybrids as Affected by Nitrogen Rates and Sowing Dates in Subtropical Environment. Rev. Bras. Cienc. Solo 2022, 46, e0210087. [Google Scholar] [CrossRef] [Scilit]
  57. Gotz, L.F.; Holzschuh, M.J.; Vargas, V.P.; Teles, A.P.B.; Martins, M.M.; Pavinato, P.S. Phosphate Management for High Soybean and Maize Yields in Expansion Areas of Brazilian Cerrado. Agronomy 2023, 13, 158. [Google Scholar] [CrossRef] [Scilit]
  58. Agbede, T.M. Poultry Manure Improves Soil Properties and Grain Mineral Composition, Maize Productivity and Economic Profitability. Sci. Rep. 2025, 15, 16501. [Google Scholar] [CrossRef] [Scilit] [PubMed]
  59. European Union. Regulation 2019/1009 of the European Parliament and of the Council Laying Down Rules on the Making Available on the Market of EU Fertilising Products and Amending Regulations (EC) No 1069/2009 and (EC) No 1107/2009 and Repealing Regulation (EC) No 2003/2003; European Union: Brussels, Belgium, 2019. [Google Scholar]
  60. Federative Republic of Brazil. Instrução Normativa SDA No 27 de 05/06/2006 Alterada Pela IN SDA No 7, de 12/04/2016. Dispõe Sobre a Importação Ou Comercialização, Para Produção, de Fertilizantes, Corretivos, Inoculantes e Biofertilizantes. Published in the Official Gazette of the Union (DOU) on June 9, 2006. Ministry of Agriculture, Livestock and Supply, Brasília, Brazil, 2006. Available online: https://www.gov.br/agricultura/pt-br/assuntos/insumos-agropecuarios/insumos-agricolas/fertilizantes/legislacao/in-sda-27-de-05-06-2006-alterada-pela-in-sda-07-de-12-4-16-republicada-em-2-5-16.pdf (accessed on 3 June 2026).
  61. Cal. Code Regs. Tit. 3, § 2302; Non-Nutritive Standards; Legal Information Institute: Ithaca, NY, USA, 2001. [Google Scholar]
  62. 40 C.F.R. Part 503; Environmental Protection Agency Standards for the Use or Disposal of Sewage Sludge. Environmental Protection Agency: Washington, DC, USA, 1993.
  63. Farid, S.; Healy, M.G.; Danaher, M.; Fenton, O.; Morrison, L. The Presence and Fate of Priority Pollutant Metals in Animal Manure: Legislation, Impact and Mitigation. Ecotoxicol. Environ. Saf. 2025, 305, 119211. [Google Scholar] [CrossRef] [Scilit] [PubMed]
  64. Gong, Q.; Chen, P.; Shi, R.; Gao, Y.; Zheng, S.-A.; Xu, Y.; Shao, C.; Zheng, X. Health Assessment of Trace Metal Concentrations in Organic Fertilizer in Northern China. Int. J. Environ. Res. Public. Health 2019, 16, 1031. [Google Scholar] [CrossRef] [Scilit] [PubMed]
  65. European Union. Council Directive 86/278/EEC of 12 June 1986 on the Protection of the Environment, and in Particular of the Soil, When Sewage Sludge Is Used in Agriculture; European Union: Brussels, Belgium, 1986. [Google Scholar]
  66. Federative Republic of Brazil. Resolução No 498 de 19 de Agosto de 2020. Define Critérios e Procedimentos Para Produção e Aplicação de Biossólido Em Solos, e Dá Outras Providências. Published in the Official Gazette of the Union (DOU) No. 161, of August 21, 2020, Section 1, Pages 265 to 269. Ministry of the Environment, Brasília, Brazil. 2020. Available online: https://conama.mma.gov.br/index.php?option=com_sisconama&task=arquivo.download&id=797 (accessed on 3 June 2026).
  67. Farias, P.I.V.; Freire, E.; da Cunha, A.L.C.; dos Santos Grumbach, R.J.; de Souza Antunes, A.M. The Fertilizer Industry in Brazil and the Assurance of Inputs for Biofuels Production: Prospective Scenarios after COVID-19. Sustainability 2020, 12, 8889. [Google Scholar] [CrossRef] [Scilit]
  68. Kelemen, R.D. Globalizing European Union Environmental Policy. J. Eur. Public Policy 2010, 17, 335–349. [Google Scholar] [CrossRef] [Scilit]
  69. NY/T 525-2021; Affairs of the People’s Republic of China Formulated the Rules Regarding the Provision of Organic Fertilizer Products on the Market. People’s Republic of China the Ministry of Agriculture: Beijing, China, 2021.
  70. Park, J.H.; Choppala, G.K.; Bolan, N.S.; Chung, J.W.; Chuasavathi, T. Biochar Reduces the Bioavailability and Phytotoxicity of Heavy Metals. Plant Soil 2011, 348, 439–451. [Google Scholar] [CrossRef] [Scilit]
  71. Uchimiya, M.; Lima, I.M.; Thomas Klasson, K.; Chang, S.; Wartelle, L.H.; Rodgers, J.E. Immobilization of Heavy Metal Ions (CuII, CdII, NiII, and PbII) by Broiler Litter-Derived Biochars in Water and Soil. J. Agric. Food Chem. 2010, 58, 5538–5544. [Google Scholar] [CrossRef] [Scilit] [PubMed]
  72. O’Connor, D.; Peng, T.; Zhang, J.; Tsang, D.C.W.; Alessi, D.S.; Shen, Z.; Bolan, N.S.; Hou, D. Biochar Application for the Remediation of Heavy Metal Polluted Land: A Review of in Situ Field Trials. Sci. Total Environ. 2018, 619–620, 815–826. [Google Scholar] [CrossRef] [Scilit] [PubMed]
  73. Khan, M.T.; Aleinikovienė, J.; Butkevičienė, L.-M. Innovative Organic Fertilizers and Cover Crops: Perspectives for Sustainable Agriculture in the Era of Climate Change and Organic Agriculture. Agronomy 2024, 14, 2871. [Google Scholar] [CrossRef] [Scilit]
  74. China NY/T 525-2021; This Document Specifies the Scope, Terms and Definitions, Requirements, Inspection Rules, Packaging, Labeling, Transportation, and Storage of Organic Fertilizers. Ministry of Agriculture and Rural Affairs: Beijing, China, 2021.
  75. Li, C.; Lan, W.; Jin, Z.; Lu, S.; Du, J.; Wang, X.; Chen, Y.; Hu, X. Risk of Heavy Metal Contamination in Vegetables Fertilized with Mushroom Residues and Swine Manure. Sustainability 2023, 15, 10984. [Google Scholar] [CrossRef] [Scilit]
  76. Ferreira, G.W.; Lourenzi, C.R.; Comin, J.J.; Loss, A.; Girotto, E.; Ludwig, M.P.; Freiberg, J.A.; de Oliveira Camera, D.; Marchezan, C.; Palermo, N.M.; et al. Effect of Organic and Mineral Fertilizers Applications in Pasture and No-Tillage System on Crop Yield, Fractions and Contaminant Potential of Cu and Zn. Soil Tillage Res. 2023, 225, 105523. [Google Scholar] [CrossRef] [Scilit]
  77. Tsai, C.-C.; Chang, Y.-F. Poultry Litter Biochar as a Gentle Soil Amendment in Multi-Contaminated Soil: Quality Evaluation on Nutrient Preservation and Contaminant Immobilization. Agronomy 2022, 12, 405. [Google Scholar] [CrossRef] [Scilit]
  78. Beigmohammadi, F.; Solgi, E.; Besalatpour, A.A.; Soleimani, M. Immobilization of Potentially Toxic Elements by Grape Waste Biochar in Contaminated Soils. Geoderma Reg. 2024, 39, e00900. [Google Scholar] [CrossRef] [Scilit]
  79. Yang, S.; Li, Y.; Liu, G.; Si, S.; Zhu, X.; Tu, C.; Li, L.; Luo, Y. Sequential Washing and Eluent Regeneration with Agricultural Waste Extracts and Residues for Facile Remediation of Meta-Contaminated Agricultural Soils. Sci. Total Environ. 2022, 835, 155548. [Google Scholar] [CrossRef] [Scilit] [PubMed]
  80. Long, S.; Ning, X.; Wang, S.; Xu, J.; Wu, Y.; Liu, Z.; Nan, Z. Remediation of Arsenic-Contaminated Calcareous Agricultural Soils by Iron-Oxidizing Bacteria Combined with Organic Fertilizer. Environ. Sci. Pollut. Res. 2023, 30, 68258–68270. [Google Scholar] [CrossRef] [Scilit] [PubMed]
  81. Ha, T.T.V.; Viet, N.M.; Quan, V.T.; Huong, N.T.L. Novel Fe3O4-Modified Biochar Generated from Rice Husk: A Sustainable Strategy for Strengthening Lead Absorption in Wastewater. Int. J. Environ. Sci. Technol. 2024, 21, 9677–9686. [Google Scholar] [CrossRef] [Scilit]
  82. Suresh, D.; Goh, P.S.; Kang, H.S.; Ahmad, M.N.; Ismail, A.F. Waste Reutilization in Pollution Remediation: Paving New Paths for Wastewater Treatment. J. Environ. Chem. Eng. 2024, 12, 113570. [Google Scholar] [CrossRef] [Scilit]
  83. Ali, K.A.; Parisa, H.; Ali, I.-M.R.; Faramarz, S.; Afshin, M.C. Mapping the Intellectual Structure of Chronic Heart Failure: A Co-Word Analysis. J. Scientometr. Res. 2021, 10, 101–109. [Google Scholar] [CrossRef] [Scilit]
  84. Wei, A.; Jia, J.; Chang, P.; Wang, S. Status of Sustainable Balance Regulation of Heavy Metals in Agricultural Soils in China: A Comprehensive Review and Meta-Analysis. Agronomy 2024, 14, 450. [Google Scholar] [CrossRef] [Scilit]
  85. Li, T.; Liu, Y.; Lin, S.; Liu, Y.; Xie, Y. Soil Pollution Management in China: A Brief Introduction. Sustainability 2019, 11, 556. [Google Scholar] [CrossRef] [Scilit]
  86. Verbeeck, M.; Salaets, P.; Smolders, E. Trace Element Concentrations in Mineral Phosphate Fertilizers Used in Europe: A Balanced Survey. Sci. Total Environ. 2020, 712, 136419. [Google Scholar] [CrossRef] [Scilit] [PubMed]
  87. Khadim, M.U.; Murtaza, G.; Farooqi, Z.U.R.; Hussain, T.; Mahmood, N.; Hussain, S. An Application of Rock Phosphate Increased Soil Cadmium Contamination and Hampered the Morphophysiological Growth of Brassica campestris L. J. Soil Sci. Plant Nutr. 2023, 23, 4583–4595. [Google Scholar] [CrossRef] [Scilit]
  88. de Carvalho, M.R.; de Almeida, T.A.; Van Opbergen, G.A.Z.; Bispo, F.H.A.; Botelho, L.; de Lima, A.B.; Marchiori, P.E.R.; Guilherme, L.R.G. Arsenic, Cadmium, and Chromium Concentrations in Contrasting Phosphate Fertilizers and Their Bioaccumulation by Crops: Towards a Green Label? Environ. Res. 2024, 263, 120171. [Google Scholar] [CrossRef] [Scilit] [PubMed]
  89. Ernest, B.; Eltigani, A.; Yanda, P.Z.; Hansson, A.; Fridahl, M. Evaluation of Selected Organic Fertilizers on Conditioning Soil Health of Smallholder Households in Karagwe, Northwestern Tanzania. Heliyon 2024, 10, e26059. [Google Scholar] [CrossRef] [Scilit] [PubMed]
  90. Zhou, S.; Su, S.; Meng, L.; Liu, X.; Zhang, H.; Bi, X. Potentially Toxic Trace Element Pollution in Long-Term Fertilized Agricultural Soils in China: A Meta-Analysis. Sci. Total Environ. 2021, 789, 147967. [Google Scholar] [CrossRef] [Scilit] [PubMed]
  91. Wu, S.; Li, K.; Diao, T.; Sun, Y.; Sun, T.; Wang, C. Influence of Continuous Fertilization on Heavy Metals Accumulation and Microorganism Communities in Greenhouse Soils under 22 Years of Long-Term Manure Organic Fertilizer Experiment. Sci. Total Environ. 2025, 959, 178294. [Google Scholar] [CrossRef] [Scilit] [PubMed]
  92. Liu, J.; Yang, W.; Zhou, H.; Zia-ur-Rehman, M.; Salam, M.; Ouyang, L.; Chen, Y.; Yang, L.; Wu, P. Exploring the Mechanisms of Organic Fertilizers on Cd Bioavailability in Rice Fields: Environmental Behavior and Effect Factors. Ecotoxicol. Environ. Saf. 2024, 285, 117094. [Google Scholar] [CrossRef] [Scilit] [PubMed]
  93. Tao, M.; Ke, X.; Ma, J.; Liu, L.; Qiu, Y.; Hu, Z.; Liu, F. Dissolved Organic Matter (DOM)—Driven Variations of Cadmium Mobility and Bioavailability in Waterlogged Paddy Soil. J. Hazard. Mater. 2025, 492, 138065. [Google Scholar] [CrossRef] [Scilit] [PubMed]
  94. Indraratne, S.P.; Spengler, M.; Hao, X. Cattle Manure Loadings and Legacy Effects on Copper and Zinc Availability under Rainfed and Irrigated Conditions. Can. J. Soil Sci. 2021, 101, 305–316. [Google Scholar] [CrossRef] [Scilit]
  95. Nookabkaew, S.; Rangkadilok, N.; Prachoom, N.; Satayavivad, J. Concentrations of Trace Elements in Organic Fertilizers and Animal Manures and Feeds and Cadmium Contamination in Herbal Tea (Gynostemma pentaphyllum Makino). J. Agric. Food Chem. 2016, 64, 3119–3126. [Google Scholar] [CrossRef] [Scilit] [PubMed]
  96. Provolo, G.; Manuli, G.; Finzi, A.; Lucchini, G.; Riva, E.; Sacchi, G. Effect of Pig and Cattle Slurry Application on Heavy Metal Composition of Maize Grown on Different Soils. Sustainability 2018, 10, 2684. [Google Scholar] [CrossRef] [Scilit]
  97. Gourlez, E.; Beline, F.; Dourmad, J.-Y.; Monteiro, A.R.; Guiziou, F.; Le Bihan, A.; de Quelen, F. The Fate of Cu and Zn along the Feed-Animal-Excreta-Effluent Continuum in Swine Systems According to Feed and Effluent Treatment Strategies. J. Environ. Manag. 2024, 354, 120299. [Google Scholar] [CrossRef] [Scilit] [PubMed]
  98. Xiong, Y.; Zhao, F.; Li, Y.; Wu, Q.; Xiao, H.; Cao, S.; Yang, X.; Gao, K.; Jiang, Z.; Hu, S.; et al. Impact of Low-Dose Amino Acid-Chelated Trace Minerals on Performance, Antioxidant Capacity, and Fecal Excretion in Growing-Finishing Pigs. Animals 2025, 15, 1213. [Google Scholar] [CrossRef] [Scilit] [PubMed]
  99. Chu, L.; Wang, Y.; Huang, B.; Ma, J.; Chen, X. Dissipation Dynamics of Doxycycline and Gatifloxacin and Accumulation of Heavy Metals during Broiler Manure Aerobic Composting. Molecules 2021, 26, 5225. [Google Scholar] [CrossRef] [Scilit] [PubMed]
  100. Feng, L.; Chen, S.; Chu, H.; Zhang, C.; Hong, Z.; He, Y.; Wang, M.; Liu, Y. Machine-Learning-Facilitated Prediction of Heavy Metal Contamination in Distiller’s Dried Grains with Solubles. Environ. Pollut. 2023, 333, 122043. [Google Scholar] [CrossRef] [Scilit] [PubMed]
  101. Shurson, G.C.; Urriola, P.E. Sustainable Swine Feeding Programs Require the Convergence of Multiple Dimensions of Circular Agriculture and Food Systems with One Health. Anim. Front. 2022, 12, 30–40. [Google Scholar] [CrossRef] [Scilit] [PubMed]
  102. Zhang, J.; Li, X.; Ding, C.; Li, L.; Liu, J.; Chen, L.; Wan, L.; Zou, Y.; Wan, S.; Yue, Z. Manure-Borne Heavy Metals in Jiangxi Livestock Systems: Feed Origins, Compost Dynamics, and Soil Accumulation Risks. Environ. Technol. Innov. 2026, 41, 104810. [Google Scholar] [CrossRef] [Scilit]
  103. Gullett, K.L.; Moore, J.M.; Ford, C.L.; Fout, A.R. A Biologically Inspired Iron Complex for the Homogeneous Reduction of Cr(vi) to Cr(III). Dalton Trans. 2025, 54, 6313–6317. [Google Scholar] [CrossRef] [Scilit] [PubMed]
  104. de Sá, I.P.; de Souza, G.B.; de Araújo Nogueira, A.R. Chromium Speciation in Organic Fertilizer by Cloud Point Extraction and Optimization through Experimental Doehlert Design as Support for Legislative Aspects. Microchem. J. 2021, 160, 105618. [Google Scholar] [CrossRef] [Scilit]
  105. Arcella, D.; Gergelova, P.; Innocenti, M.L.; López-Gálvez, G.; Steinkellner, H. Occurrence Data of Nickel in Feed and Animal Exposure Assessment. EFSA J. 2019, 17, e05754. [Google Scholar] [CrossRef] [Scilit] [PubMed]
  106. Horf, M.; Vogel, S.; Drücker, H.; Gebbers, R.; Olfs, H.-W. Optical Spectrometry to Determine Nutrient Concentrations and Other Physicochemical Parameters in Liquid Organic Manures: A Review. Agronomy 2022, 12, 514. [Google Scholar] [CrossRef] [Scilit]
  107. Xu, T.; Xi, J.; Ke, J.; Wang, Y.; Chen, X.; Zhang, Z.; Lin, Y. Deciphering Soil Amendments and Actinomycetes for Remediation of Cadmium (Cd) Contaminated Farmland. Ecotoxicol. Environ. Saf. 2023, 249, 114388. [Google Scholar] [CrossRef] [Scilit] [PubMed]
  108. Alemayehu, Y.A.; Asfaw, S.L.; Terfie, T.A. Hydrolyzed Urine for Enhanced Valorization and Toxicant Degradation of Wet Coffee Processing Wastes: Implications for Soil Contamination and Health Risk Reductions. J. Environ. Manag. 2022, 307, 114536. [Google Scholar] [CrossRef] [Scilit] [PubMed]
  109. Liu, Q.; Lu, W.; Bai, C.; Xu, C.; Ye, M.; Zhu, Y.; Yao, L. Cadmium, Arsenic, and Mineral Nutrients in Rice and Potential Risks for Human Health in South China. Environ. Sci. Pollut. Res. 2023, 30, 76842–76852. [Google Scholar] [CrossRef] [Scilit] [PubMed]
  110. Mondal, R.; Majumdar, A.; Sarkar, S.; Goswami, C.; Joardar, M.; Das, A.; Mukhopadhyay, P.K.; Roychowdhury, T. An Extensive Review of Arsenic Dynamics and Its Distribution in Soil-Aqueous-Rice Plant Systems in South and Southeast Asia with Bibliographic and Meta-Data Analysis. Chemosphere 2024, 352, 141460. [Google Scholar] [CrossRef] [Scilit] [PubMed]
  111. Zhang, Y.; Hou, D.; O’Connor, D.; Shen, Z.; Shi, P.; Ok, Y.S.; Tsang, D.C.W.; Wen, Y.; Luo, M. Lead Contamination in Chinese Surface Soils: Source Identification, Spatial-Temporal Distribution and Associated Health Risks. Crit. Rev. Environ. Sci. Technol. 2019, 49, 1386–1423. [Google Scholar] [CrossRef] [Scilit]
  112. da Rosa Couto, R.; Faversani, J.; Ceretta, C.A.; Ferreira, P.A.A.; Marchezan, C.; Basso Facco, D.; Garlet, L.P.; Silva, J.S.; Comin, J.J.; Bizzi, C.A.; et al. Health Risk Assessment and Soil and Plant Heavy Metal and Bromine Contents in Field Plots after Ten Years of Organic and Mineral Fertilization. Ecotoxicol. Environ. Saf. 2018, 153, 142–150. [Google Scholar] [CrossRef] [Scilit] [PubMed]
  113. He, D.; Zhu, T.; Sun, J.; Pan, X.; Li, J.; Luo, H. Emerging Organic Contaminants in Sewage Sludge: Current Status, Technological Challenges and Regulatory Perspectives. Sci. Total Environ. 2024, 955, 177234. [Google Scholar] [CrossRef] [Scilit] [PubMed]
  114. Bouchaala, L.; Grara, N.; Charchar, N.; Nourine, H.; Dahdah, K.; Driouche, Y.; Amrane, A.; Alsaeedi, H.; Cornu, D.; Bechelany, M.; et al. Microbiological Characterization and Pathogen Control in Drying Bed-Processed Sewage Sludge. Water 2024, 16, 3276. [Google Scholar] [CrossRef] [Scilit]
  115. Grobelak, A.; Całus-Makowska, K.; Jasińska, A.; Klimasz, M.; Wypart-Pawul, A.; Augustajtys, D.; Baor, E.; Sławczyk, D.; Kowalska, A. Environmental Impacts and Contaminants Management in Sewage Sludge-to-Energy and Fertilizer Technologies: Current Trends and Future Directions. Energies 2024, 17, 4983. [Google Scholar] [CrossRef] [Scilit]
  116. Lü, H.; Chen, X.-H.; Mo, C.-H.; Huang, Y.-H.; He, M.-Y.; Li, Y.-W.; Feng, N.-X.; Katsoyiannis, A.; Cai, Q.-Y. Occurrence and Dissipation Mechanism of Organic Pollutants during the Composting of Sewage Sludge: A Critical Review. Bioresour. Technol. 2021, 328, 124847. [Google Scholar] [CrossRef] [Scilit] [PubMed]
  117. Tan, Y.; Cao, X.; Chen, S.; Ao, X.; Li, J.; Hu, K.; Liu, S.; Penttinen, P.; Yang, Y.; Yu, X.; et al. Antibiotic and Heavy Metal Resistance Genes in Sewage Sludge Survive during Aerobic Composting. Sci. Total Environ. 2023, 866, 161386. [Google Scholar] [CrossRef] [Scilit] [PubMed]
  118. Wiggenhauser, M.; Illmer, D.; Spiess, E.; Holzkämper, A.; Prasuhn, V.; Liebisch, F. Cadmium, Zinc, and Copper Leaching Rates Determined in Large Monolith Lysimeters. Sci. Total Environ. 2024, 926, 171482. [Google Scholar] [CrossRef] [Scilit] [PubMed]
  119. CONAMA. Resolução N°420 de 28 Dez 2009. Diário Oficial Da União, 30 Dez. 2009. Seção 1:81–84; CONAMA—Conselho Nacional de Meio Ambiente: Brasília, Brasil, 2009. [Google Scholar]
  120. Bocardi, J.M.B.; Pletsch, A.L.; Melo, V.F.; Quinaia, S.P. Quality Reference Values for Heavy Metals in Soils Developed from Basic Rocks under Tropical Conditions. J. Geochem. Explor. 2020, 217, 106591. [Google Scholar] [CrossRef] [Scilit]
  121. Sun, W.; Ye, J.; Lin, H.; Yu, Q.; Wang, Q.; Chen, Z.; Ma, J.; Ma, J. Dynamic Characteristics of Heavy Metal Accumulation in Agricultural Soils after Continuous Organic Fertilizer Application: Field-Scale Monitoring. Chemosphere 2023, 335, 139051. [Google Scholar] [CrossRef] [Scilit]
  122. Drescher, G.L.; Moura-Bueno, J.M.; Dantas, M.K.L.; Ceretta, C.A.; De Conti, L.; Marchezan, C.; Ferreira, P.A.A.; Brunetto, G. Copper and Zinc Fractions and Adsorption in Sandy Soil with Long-Term Pig Manure Application. Arch. Agron. Soil Sci. 2022, 68, 1930–1946. [Google Scholar] [CrossRef] [Scilit]
  123. Rodrigues, J.N.M.; Leal, R.M.P.; Coscione, A.R.; Gomes, V.M.; da Silva Oliveira, D.M. Data—A worldwide review of Potentially Toxic Elements in fertilizers (Version 1) [Data set]. Zenodo 2026. [Google Scholar] [CrossRef]
Figure 1. Annual production of articles on potentially toxic elements in mineral and organic fertilizers between 1984 and 2024.
Land 15 01377 g001
Figure 2. Global scientific production on potentially toxic elements in mineral and organic fertilizers between 1982 and 2024. The color scale corresponds to the number of articles published per region; gray areas indicate regions with no data available.
Land 15 01377 g002
Figure 3. Conceptual structure based on keywords plus of articles on potentially toxic elements in mineral and organic fertilizers published between 1982 and 2024. The keywords are grouped into thematic clusters represented by distinct colors.
Land 15 01377 g003
Figure 4. Thematic map based on keywords plus articles published between 1982 and 2024 on potentially toxic elements in mineral and organic fertilizers. The quadrants show the developmental degree and relevance of each topic.
Land 15 01377 g004
Figure 5. Three-field map (Sankey Diagram) based on the most relevant author keywords (DE), country (AU_CO), and journal (SO) in articles published between 1982 and 2024 on potentially toxic elements in mineral and organic fertilizers.
Land 15 01377 g005
Figure 6. Average concentrations of potentially toxic elements (mg/kg) found in mineral and organic fertilizers and their confidence intervals (95%). The circle size represents the sample size (N) of each source. The asterisk in the cadmium graph indicates that the confidence interval and the average exceed the adopted scale. The data are derived from the 45 references included in the meta-analysis.
Land 15 01377 g006
Figure 7. Average concentrations of potentially toxic elements (mg/kg) found in mineral and organic fertilizers and their confidence interval (95%). The circle size represents the sample size (N) of each source. The data are derived from the 45 references included in the meta-analysis.
Land 15 01377 g007
Figure 8. Average concentration and standard deviation of the most relevant potentially toxic elements among mineral and organic sources (unpaired t-test with Welch correction). ns = not significant (p > 0.05); *** significant at 1% (p < 0.001). The data are derived from the 45 references included in the meta-analysis.
Land 15 01377 g008
Table 1. Concentration of potentially toxic elements by fertilizer source: average, minimum, maximum values and sample size. The values are expressed in mg/kg. The data are derived from the 45 references included in the meta-analysis.
SourcesCdCuCrAsPbZn
mean (min–max) n−mg/kg
Cattle Manure1.1 (0.0–4.4) 4659.4 (1.0–423.3) 4912.5 (0.0–159.3) 463.7 (0.0–7.5) 377.8 (0.0–19.6) 4696.1 (10.0–371.1) 49
Chicken Manure0.3 (0.0–0.5) 3873.0 (13.1–164.2) 50170.5 (0.0–418.9) 440.3 (0.22–2.7) 287.6 (0.0–53.0) 47341.4 (70.0–655.8) 50
Compost0.9 (0.0–3.1) 6053.8 (0.0–132.7) 5753.3 (0.0–124.2) 6938.0 (1.9–63.7) 3617.6 (0.0–53.3) 63209.2 (0.0–425.8) 60
Industrial Waste0.1 (0.0–0.1) 154.4 (0.3–8.6) 61.5 (0.0–1.5) 157.5 (7.5–7.5) 97.3 (0.0–12.8) 1534.5 (2.0–76.5) 6
Limestone0.9 (0.0–1.9) 153.5 (1.3–5.6) 70.9 (0.9-0.9) 31.7 (0.1-3.6) 78.9 (1.2-20.1) 119.2 (4.3–14.1) 7
Mushroom Residue 0.3 (0.2–0.3) 625.3 (19.2–31.6) 6--1.2 (0.6–1.9) 682.6 (37.4–127.9) 6
Phosphate Fertilizer0.1 (0.1–0.1) 73.6 (1.0–6.1) 736.5 (36.5–36.5) 37.5 (7.5–7.5) 313.1 (0.0–13.1) 718.5 (4.5–32.5) 7
Phosphate Rock74.2 (67.2–81.4) 6----536.5 (500.0–572.0) 6
Potassium Fertilizer0.0 (0.0–0.0) 101.7 (0.5–3.2) 105.4 (5.4–5.4) 30.0 (0.0–0.0) 31.3 (0.0–1.8) 1010.8 (4.3–14.2) 10
Sewage Sludge1.2 (0.0–3.3) 50199.1 (63.0–637.8) 5359.1 (0.0–180.5) 3215.7 (15.7–15.7) 545.2 (8.0–119.9) 50602.9 (159.0–1217.0) 53
Silicon Fertilizer0.1 (0.0–0.2) 16-4.7 (0.2–9.2) 81.3 (0.0–3.8) 1612.7 (10.6–14.9) 8-
Soil Conditioner0.0 (0.0–0.0) 7--0.0 (0.0–0.0) 42.4 (2.4–2.4) 3-
Swine Manure1.6 (0.0–7.9) 25169.8 (20.6–588.3) 3016.7 (0.0–23.2) 156.0 (6.0–6.0) 615.3 (3.0–31.2) 22736.0 (81.6–2404.5) 30
Urea0.0 (0.0–0.0) 79.0 (0.2–17.8) 710.6 (10.6–10.6) 30.2 (0.2–0.2) 33.0 (2.5–3.6) 735.7 (0.7–70.8) 7
NiFeMnCoHg
Cattle Manure19.3 (1.5–38.0) 24858.2 (20.0–2962.0) 24108.6 (9.0–285.7) 361.7 (0.0–1.82) 180.0 (0.0–0.1) 15
Chicken Manure7.8 (0.5–36.8) 391215.2 (83.0–3483.0) 30174.5 (21.0–452.8) 300.7 (0.6–1.0) 170.0 (0.0–0.0) 9
Compost9.3 (0.0–27.6) 422861.7 (1.1–12,472.0) 27115.8 (0.1–257.3) 18--
Industrial Waste0.0 (0.0–0.0) 63189.2 (3.3–6378.0) 61.87 (0.3–3.45) 6-0.2 (0.2–0.2) 9
Limestone1.2 (1.2–1.2) 3340.0 (340.0–340.0) 336.0 (36.0–36.0) 30.9 (0.9–0.9) 3-
Phosphate Fertilizer6.7 (6.7–6.7) 3----
Potassium Fertilizer12.9 (12.9–12.9) 3----
Sewage Sludge30.5 (9.0–53.0) 614.7 (7.5–32.0) 18184.1 (128.6–240.5) 18--
Silicon Fertilizer----0.0 (0.0–0.0) 8
Swine Manure14.1 (3.0–30.3) 93998.1 (3490.0–4460.0) 6793.9 (525.2–1060.0) 6--
Urea3.6 (3.6–3.6) 3----
Table 2. Ecological risk quotient (RQ) and time to PNEC (predicted no-effect concentration) for potentially toxic elements in mineral and organic fertilizers—most likely scenario (mean values).
Mineral Sources
SourcesLimestoneSilicon FertilizerUreaPhosphate RockPhosphate FertilizerPotassium Fertilizer
Low RateMetalMeanRQYears *MeanRQYearsMeanRQYearsMeanRQYearsMeanRQYearsMeanRQYears
Cd0.90.009330.10.0014,0000.0--74.20.02570.10.0052,5000.0--
Cr0.90.0039254.70.00227910.60.001374---36.50.009705.40.005815
As0.10.0034,4001.40.0041950.20.0039,091---7.50.0025830.0--
Pb8.90.00137112.70.0016373.00.009159---13.10.0052501.30.0046,923
Ni1.20.0021,667---3.60.0016,250---6.70.0021,88612.90.0010,078
Cu3.50.0014,971---9.00.0013,113---3.60.0081,8751.70.00154,118
Zn9.20.0016,652---35.70.009664536.50.00142818.50.0046,70710.80.0070,926
SourcesLimestoneSilicon FertilizerUreaPhosphate RockPhosphate FertilizerPotassium Fertilizer
High RateMetalMeanRQYearsMeanRQYearsMeanRQYearsMeanRQYearsMeanRQYearsMeanRQYears
Cd0.90.011750.10.0047730.0--74.20.09110.10.0095450.0--
Cr0.90.007364.70.0075910.60.00457---36.50.011935.40.002181
As0.10.0026,0611.40.0013960.20.0012,836---7.50.005160.0--
Pb8.90.00102812.70.005463.00.003050---13.10.0010471.30.0017,630
Ni1.20.004063---3.60.005417---6.70.00436212.90.003779
Cu3.50.002807---9.00.004367---3.60.0016,3751.70.0057,709
Zn9.20.003122---35.70.003218536.50.0028618.50.00931210.80.0026,597
Organic Sources
SourcesCattle ManureChicken ManureCompostSwine ManureSewage Sludge
Low RateMetalMeanRQYearsMeanRQYearsMeanRQYearsMeanRQYearsMeanRQYears
Cd1.00.011260.30.004200.90.011401.60.01791.20.01105
Cr12.70.0174170.50.18653.30.061816.70.025659.10.0616
As3.40.011520.30.00172037.80.07146.00.018615.70.0333
Pb7.40.002477.60.0024117.60.0110415.30.0112045.20.0240
Ni17.10.002287.80.005009.30.0041914.10.0027730.50.01128
Cu57.80.0113672.90.0110885.60.0192187.70.0242199.10.0339
Zn102.30.00225341.40.0167689.90.03331182.50.0519602.90.0338
SourcesCattle ManureChicken ManureCompostSwine ManureSewage Sludge
High RateMetalMeanRQYearsMeanRQYearsMeanRQYearsMeanRQYearsMeanRQYears
Cd1.00.03310.30.011050.90.03351.60.05201.20.0426
Cr12.70.0519170.50.72153.30.23416.70.071459.10.254
As3.40.03380.30.0043037.80.2936.00.052215.70.128
Pb7.40.02627.60.026017.60.042615.30.033045.20.1010
Ni17.10.02577.80.011259.30.0110514.10.016930.50.0332
Cu57.80.033472.90.042785.60.0423187.70.1010199.10.1010
Zn102.30.0256341.40.0617689.90.1281182.50.215602.90.1010
mg/kg—milligrams per kilogram; kg/ha/year—kilograms per hectare per year. * Annual applications, not considering losses due to leaching, surface runoff, and crop absorption (see a detailed description in Section 2.4). Assumed soil density: 1.5 g/cm3; soil depth: 0.2 m.
Table 3. Ecological risk quotient (RQ) and time to PNEC (predicted no-effect concentration) for potentially toxic elements in mineral and organic fertilizers—worst-case scenario (mean values).
Mineral Sources
SourcesLimestoneSilicon FertilizerUreaPhosphate RockPhosphate FertilizerPotassium Fertilizer
Low RateMetalMaxRQYearsMaxRQYearsMaxRQYearsMaxRQYearsMaxRQYearsMaxRQYears
Cd1.90.02660.20.0072410.10.0019,09181.40.02520.10.0052,5000.10.0042,000
Cr0.90.0010479.20.00116410.60.001334---36.50.009705.40.0048,519
As3.60.011433.80.0015440.20.0039,091---7.50.0025830.0--
Pb20.10.019114.90.0013963.60.007625---13.10.0052501.80.0033,889
Ni1.20.0021,667---3.60.0016,250---6.70.0021,88612.90.0010,078
Cu5.60.001404---17.80.006630---6.10.0048,5193.20.0081,875
Zn14.10.001630---70.80.004873572.00.00133932.50.0026,57914.20.0053,944
SourcesLimestoneSilicon FertilizerUreaPhosphate RockPhosphate FertilizerPotassium Fertilizer
High RateMetalMaxRQYearsMaxRQYearsMaxRQYearsMaxRQYearsMaxRQYearsMaxRQYears
Cd1.90.06170.20.0023860.10.00636481.40.10100.10.0095450.10.0016,154
Cr0.90.002629.20.0038810.60.00444---36.50.011935.40.0018,194
As3.60.03363.80.005140.20.0012,836---7.50.005160.0--
Pb20.10.042314.90.004653.60.002542---13.10.0010471.80.0012,708
Ni1.20.004063---3.60.005417---6.70.00436212.90.003779
Cu5.60.00351---17.80.002208---6.10.0096613.20.0030,679
Zn14.10.00407---70.80.001623572.00.0026832.50.00530014.20.0020,232
Organic Sources
SourcesCattle ManureChicken ManureCompostSwine ManureSewage Sludge
Low RateMetalMaxRQYears *MaxRQYearsMaxRQYearsMaxRQYearsMaxRQYears
Cd4.40.03290.50.002523.10.02417.90.06163.30.0338
Cr159.30.176418.90.442124.20.13810.60.0189180.50.195
As7.50.01692.70.0119163.70.1286.00.018615.70.0333
Pb19.60.019353.00.033553.30.033431.20.0259119.90.0715
Ni38.00.0110336.80.0110627.60.0114130.30.0112953.00.0174
Cu423.30.0519164.20.0248351.00.0422588.30.0713637.80.0812
Zn371.10.0262655.80.03355651.00.2543270.00.1471217.00.0519
SourcesCattle ManureChicken ManureCompostSwine ManureSewage Sludge
High RateMetalMaxRQYearsMaxRQYearsMaxRQYearsMaxRQYearsMaxRQYears
Cd4.40.1470.50.02633.10.10107.90.2543.30.1010
Cr159.30.681418.91.781124.20.53210.60.0522180.50.771
As7.50.06172.70.024863.70.4926.00.052215.70.128
Pb19.60.042353.00.12953.30.12931.20.0715119.90.264
Ni38.00.042636.80.042627.60.033530.30.033253.00.0518
Cu423.30.225164.20.0812351.00.186588.30.303637.80.323
Zn371.10.0615655.80.1195651.00.9813270.00.5721217.00.215
mg/kg—milligrams per kilogram; kg/ha/year—kilograms per hectare per year. * Annual applications, not considering losses due to leaching, surface runoff, and crop absorption (see a detailed description in Section 2.4). Assumed soil density: 1.5 g/cm3; soil depth: 0.2 m.
Disclaimer/Publisher’s Note: The statements, opinions and data contained in all publications are solely those of the individual author(s) and contributor(s) and not of MDPI and/or the editor(s). MDPI and/or the editor(s) disclaim responsibility for any injury to people or property resulting from any ideas, methods, instructions or products referred to in the content.