Article

Spatiotemporal Evolution, Dynamic Decomposition, and Driving Mechanisms of Green Total Factor Productivity in the Yangtze River Economic Belt

1
School of Arts and Communication, China University of Geosciences, Wuhan 430074, China
2
College of Artdesign, Hubei University of Economics, Wuhan 430205, China
3
School of Economics and Management, China University of Geosciences, Wuhan 430074, China
4
School of Foreign Languages, China University of Geosciences, Wuhan 430074, China
*
Author to whom correspondence should be addressed.
Land 2026, 15(8), 1375; https://doi.org/10.3390/land15081375
Submission received: 23 May 2026 / Revised: 7 July 2026 / Accepted: 29 July 2026 / Published: 31 July 2026
(This article belongs to the Section Land Use, Impact Assessment and Sustainability)

Abstract

Green total factor productivity (GTFP) is an important indicator for assessing urban green development under resource and environmental constraints. Using panel data from 110 prefecture-level cities in the Yangtze River Economic Belt from 2007 to 2023, this study examines changes in urban green total factor productivity. A super-efficiency slack-based measure model that includes undesirable outputs is adopted to measure GTFP, while the Malmquist–Luenberger index is used to decompose its dynamic changes. Spatial variation is then analyzed through trend surface analysis, center-of-gravity migration analysis, spatial pattern analysis, and the geographical detector model. The results indicate that GTFP in the Yangtze River Economic Belt improved on the whole, but its growth did not follow a smooth upward path. Among the decomposed effects, technological progress (TC) was the main source of improvement. Clear spatial differences were also observed. Cities in the middle and lower reaches generally had higher GTFP levels than those in the upper reaches, although this gap became less marked over time. The center of gravity of GTFP stayed mainly in the middle reaches and shifted gradually toward the northeast. The driving factors behind spatial differentiation were not constant. In the early stage, energy intensity and economic development level had stronger effects, whereas technological innovation, human capital, and industrial structure upgrading became more influential in the later stage. These findings provide empirical support for differentiated green development policies and coordinated regional governance in the Yangtze River Economic Belt.

1. Introduction

Under growing climate and resource pressures, balancing economic development with environmental protection has become a pressing issue in both academic research and policy practice [1]. This issue is especially relevant to the Yangtze River Economic Belt, which supports China’s economic growth, industrial restructuring, and ecological conservation [2,3]. Stretching across eastern, central, and western China, the region links coastal and inland areas and includes cities with markedly different resource endowments, industrial structures, technological capacities, and environmental governance conditions [4]. These differences suggest that urban green transformation in the Yangtze River Economic Belt is unlikely to follow a uniform path. The region also bears important ecological functions and has been placed at the center of China’s ecological civilization and high-quality development agendas. As the Yangtze River Basin strategy of “prioritizing large-scale protection rather than large-scale development” continues to move forward, a key question is how cities in this region can improve green development while narrowing regional disparities [5].
In this context, green total factor productivity (GTFP) is particularly useful for examining whether economic growth is achieved under resource and environmental constraints. Unlike traditional total factor productivity, GTFP incorporates resource consumption and environmental pollution into productivity assessment, making it better suited to evaluating growth quality and sustainability [6,7]. By accounting for both desirable and undesirable outputs, it captures not only production efficiency but also the environmental costs associated with economic activity. This makes GTFP a relevant measure for empirical studies of green development performance [8,9].
Recent work on GTFP has mainly followed three lines of inquiry: its measurement, its spatial variation, and the factors that shape these differences. In terms of measurement, data envelopment analysis (DEA), stochastic frontier analysis (SFA), and models that include undesirable outputs are commonly used [10]. The slack-based measure (SBM) model is often adopted in this literature because it accounts for input and output slacks and is therefore suitable for evaluating production efficiency under environmental constraints [11]. A related strand of research focuses on the spatial heterogeneity of GTFP, showing that green development performance often differs markedly across regions and may exhibit spatial clustering [12,13]. Other studies have examined the determinants of GTFP, including economic development level, industrial structure upgrading, technological innovation, environmental regulation, opening-up, and urbanization [14,15,16]. This literature provides a basis for measuring and explaining green productivity. However, less is known about how GTFP evolves at the urban scale and how its driving forces change across regions and over time.
Taken together, existing studies have provided useful methodological and empirical foundations for understanding GTFP, but several limitations remain. First, studies on GTFP measurement have gradually shifted from traditional efficiency evaluation to models incorporating resource and environmental constraints, yet the connection between static efficiency measurement and dynamic productivity decomposition is still not sufficiently emphasized. Second, although spatial heterogeneity has been widely recognized, many studies focus on national, provincial, or urban-agglomeration scales, and relatively less attention has been paid to the long-term evolution of GTFP across prefecture-level cities in the entire Yangtze River Economic Belt. Third, existing studies have identified many influencing factors, but they often examine these factors separately and pay insufficient attention to how their explanatory power and interaction effects change over time. Therefore, it is still necessary to integrate GTFP measurement, dynamic decomposition, spatial evolution analysis, and driving mechanism identification into a unified framework, so as to better reveal the spatiotemporal dynamics of and mechanism changes in urban GTFP in the Yangtze River Economic Belt.
Despite these contributions, the spatial scale of current research remains somewhat constrained. GTFP has often been analyzed at the national, provincial, or urban agglomeration level, whereas studies that follow its long-term evolution across the entire Yangtze River Economic Belt using prefecture-level city data are still relatively scarce [17]. Existing studies often treat GTFP measurement, spatial pattern analysis, and driving mechanism identification as separate issues, resulting in a relatively fragmented understanding of the evolution of regional green productivity [18]. Therefore, an integrated analytical framework is urgently needed. More importantly, although some studies have focused on the Yangtze River Economic Belt, most of them are based on relatively short time series, and the dynamic evolution of spatial patterns, especially the migration of the center of gravity, has not been sufficiently characterized [19]. Accordingly, the long-term spatiotemporal dynamics of GTFP in the Yangtze River Economic Belt and the interaction mechanisms among multiple driving factors still require further investigation.
Therefore, this paper takes 110 prefecture-level cities in the Yangtze River Economic Belt as the research objects and constructs panel data for the period from 2007 to 2023. First, the SBM model incorporating undesirable outputs is used to measure urban GTFP. Second, with the help of ArcMap spatial analysis methods, the spatiotemporal distribution characteristics of GTFP are examined from the perspectives of trend surface analysis and center-of-gravity migration, so as to reveal its overall evolutionary trajectory and directional changes. Third, the geographical detector model is introduced to analyze the explanatory power of different factors and identify their interaction effects. On this basis, this paper seeks to answer the following questions: How did GTFP in the Yangtze River Economic Belt evolve from 2007 to 2023? What are its spatial differentiation characteristics and directional changes? Did its center of gravity shift over time? Which factors dominated the spatial differences in GTFP, and how did their interaction mechanisms operate?
The main contributions of this paper are reflected in three aspects. First, taking prefecture-level cities as the research units, this study analyzes the trends and heterogeneity of GTFP in the Yangtze River Economic Belt over a relatively long period. Second, it integrates GTFP measurement, spatial evolution analysis, center-of-gravity migration, and driving mechanism identification into a unified analytical framework, which helps to systematically understand the spatiotemporal dynamics of regional green productivity. Third, by using the geographical detector model to examine both single-factor effects and interaction effects, this study deepens the understanding of the complex mechanisms underlying urban green development. Overall, the findings of this study can provide important empirical support for the formulation of differentiated green development policies and the collaborative governance of regional green transformation in the Yangtze River Economic Belt.

2. Materials and Methods

2.1. Study Area

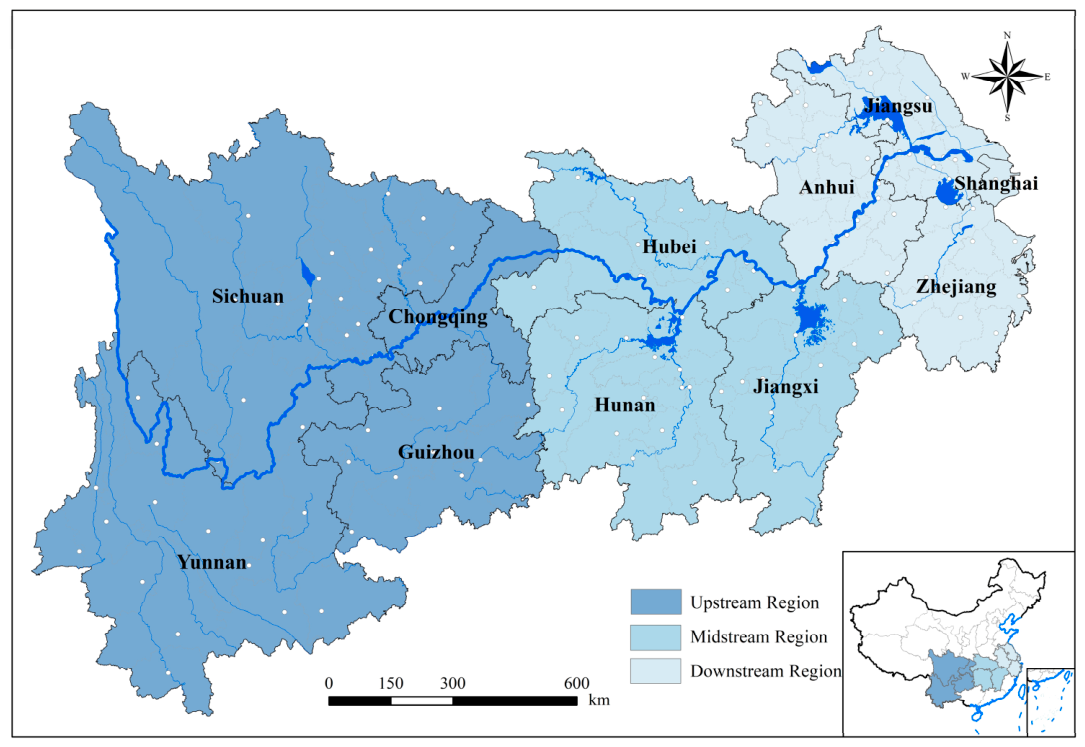
The Yangtze River Economic Belt is one of the most strategically important regions in China and also serves as an important spatial carrier for promoting high-quality development and ecological civilization construction [20,21]. The Yangtze River Economic Belt spans the eastern, central, and western parts of China, covering 11 provincial-level administrative units, namely Shanghai, Jiangsu, Zhejiang, Anhui, Jiangxi, Hubei, Hunan, Chongqing, Sichuan, Yunnan, and Guizhou. Taking the Yangtze River as the main axis, As a strategic corridor linking China’s developed coastal areas and inland hinterland, the YREB plays an important role in economic growth, industrial restructuring, and ecological security [22,23]. The Yangtze River Economic Belt accounts for approximately 21.4% of China’s total land area, while contributing 47.3% of China’s GDP. The population size exceeds 40% of the national total, and the region concentrates 43% of China’s universities, with research and development expenditure accounting for 46.7% of the national total. The study area is shown in Figure 1.
In addition to its economic significance, the YREB also has typical river-basin characteristics. The Yangtze River and its tributaries connect upstream, midstream, and downstream cities through water flows, ecological corridors, and pollution transmission pathways. These hydrological linkages influence resource allocation, ecological connectivity, and environmental governance across regions. Therefore, the spatial differentiation of GTFP in the YREB is not only related to differences in economic development and industrial structure but also to the basin-wide interactions among water-resource use, pollution diffusion, ecological protection, and cross-regional governance.

2.2. Data Sources and Indicator System

2.2.1. Data Sources

This study uses the panel data of 110 prefecture-level cities in the Yangtze River Economic Belt from 2007 to 2023 as the research sample. The sample data mainly come from the China City Statistical Yearbook, the China Urban Construction Statistical Yearbook, the China Energy Statistical Yearbook, provincial statistical yearbooks, and the statistical bulletins of national economic and social development issued by each city. In addition, some environmental and socioeconomic indicators are supplemented by official statistical databases and government reports when necessary.
Considering the diversity of data sources, data preprocessing is conducted before the formal analysis to improve the comparability and consistency of data across different cities and years. Specifically, all monetary variables are converted into constant prices based on the year 2006, so as to reduce the influence of price fluctuations. Considering the missing data in some cities within the YREB, this study finally constructs a panel dataset covering 110 prefecture-level cities to ensure data availability and comparability. For a small number of missing values, interpolation, K-nearest neighbor imputation, and substitution methods were used according to data continuity and variable characteristics.

2.2.2. Indicator System for GTFP Measurement

To measure green total factor productivity under resource and environmental constraints, this study builds an input–output indicator system that includes both desirable and undesirable outputs. The selection of indicators follows two considerations: whether they reflect the production characteristics of cities in the Yangtze River Economic Belt, and whether the data are available and comparable across cities. On this basis, five input indicators, two desirable output indicators, and three undesirable output indicators were selected to calculate urban-level GTFP, as shown in Table 1.
The selection of these indicators is based on the production process of urban green development and the common practice of GTFP measurement. Capital, labor, energy, land, and water represent the main factor inputs required for urban economic activities. GDP reflects desirable economic output, while urban green space area is used to capture the ecological improvement associated with urban development. Industrial wastewater, industrial exhaust gas, and industrial smoke and dust emissions are selected as undesirable outputs because they represent the main environmental costs generated by industrial production. Therefore, this indicator system can reflect both economic performance and resource–environmental constraints in the process of urban green development.
The input dimension covers the main factors involved in urban production activities, including capital, labor, energy, land, and water resources. Among them, capital input is represented by the total investment in fixed assets, while labor input is measured by the number of employees in urban units at the end of the year [24]. To reflect the resource constraints faced in the process of urban expansion and economic growth, this paper further selects total urban electricity consumption, urban construction land area, and total urban water supply as proxy variables for energy, land, and water resource inputs, respectively [25,26]. These indicators are jointly used to characterize the input of traditional production factors and the pressure of resource consumption associated with urban development.
The desirable output dimension reflects the positive outcomes generated by urban economic activities. This paper uses real GDP, converted into constant prices based on the year 2006, as the indicator of economic output. At the same time, urban green space area, represented by the green coverage area of built-up areas, is introduced to reflect, to a certain extent, the ecological benefits brought about by urban development. It should be noted that this indicator mainly reflects the scale of urban ecological space supply, rather than the full quality, functionality, or connectivity of urban ecosystems. By integrating economic output with indicators reflecting environmental improvement, this study attempts to evaluate urban production performance from the perspective of green development rather than merely from the perspective of economic growth. Such a framework enables a more comprehensive understanding of the coordinated relationship between economic expansion and ecological sustainability.
The undesirable output dimension is mainly introduced to characterize the environmental costs generated during the processes of urban industrialization and economic expansion. Referring to existing studies on urban pollution and green productivity, this paper selects industrial wastewater discharge, industrial waste gas emissions, and industrial smoke and dust emissions as the principal undesirable output indicators. These indicators are used to reflect the negative externalities arising from production activities, thereby allowing green productivity to be assessed within an analytical framework that simultaneously considers economic benefits and environmental burdens. Overall, by incorporating resource inputs, economic and ecological outputs, as well as pollution losses into a unified indicator system, this study provides a relatively reliable empirical basis for measuring urban green total factor productivity in the Yangtze River Economic Belt.

2.3. Measurement of Green Total Factor Productivity

To evaluate urban green development performance under the joint constraints of resources and the environment, this study combines static efficiency measurement with dynamic productivity decomposition. Specifically, a super-efficiency slack-based measure (Super-SBM) model with undesirable outputs is employed to estimate the green total factor productivity of cities in the Yangtze River Economic Belt, and the Malmquist–Luenberger (ML) productivity index is further introduced to decompose intertemporal changes in GTFP into efficiency change (EC) and technological change (TC). In this way, the analysis is able to capture not only the relative level of green production efficiency in each city but also the main sources underlying its dynamic evolution over time.
This combined method is adopted because it is well suited to evaluating green productivity under resource and environmental constraints. Compared with traditional DEA models, the Super-SBM model can directly account for input redundancy, desirable output shortfalls, and undesirable output excesses, while its super-efficiency form further distinguishes efficient cities on the production frontier. Compared with SFA, it does not require a predefined production function and is more applicable to multi-input and multi-output urban systems. The ML index is further used because it incorporates undesirable outputs into intertemporal productivity analysis and decomposes GTFP changes into efficiency change and technological change. Therefore, the Super-SBM–ML framework can capture both the static level and dynamic sources of urban green productivity.

2.3.1. Static Measurement Based on the Super-SBM Model

To quantify green production efficiency at the urban level, this paper adopts the super-efficiency SBM model considering undesirable outputs [27]. Compared with traditional DEA models, such as the CCR model and the BCC model, the SBM model is a non-radial and non-oriented model. In this study, the Super-SBM model is specified as a non-radial and non-oriented model with undesirable outputs. Inputs and undesirable outputs are expected to be reduced, while desirable outputs are expected to be expanded. The model was implemented using MAXDEA v12.2, and the undesirable-output setting was selected to ensure that pollution emissions were treated as outputs to be minimized rather than conventional desirable outputs. It can directly incorporate input redundancy, desirable output slack, and undesirable output slack into the objective function, thus more precisely reflecting resource waste and pollution discharge during the production process. This characteristic enables the model to better fit the evaluation scenarios in which resource and environmental constraints coexist. In addition, after introducing the super-efficiency extension, decision-making units located on the efficiency frontier can be further ranked, which improves the discriminatory power of the model.
Assume that there are U decision-making units (DMUs), each using M inputs to produce N desirable outputs and R undesirable outputs. For the k-th DMU, the input, desirable output, and undesirable output are denoted by x i k , y j k , and r l k , respectively. The super-efficiency SBM model with undesirable outputs can be expressed as follows:
min ρ = 1 1 M i = 1 M s i x i k 1 + 1 N + R j = 1 N s j g y j k + l = 1 R s l b r l k
subject to
x i k u = 1 u k U x i u λ u i = 1 , 2 , , M
y j k u = 1 u k U y j u λ u i = 1 , 2 , , M
r l k u = 1 u k U r l u λ u i = 1 , 2 , , M
λ u 0 , s i ¯ 0 , s j g 0 , s l b 0
where ρ denotes the GTFP efficiency score; s i , s j g , and s l b are the slack variables for inputs, desirable outputs, and undesirable outputs, respectively; and λ u is the weight variable. A larger efficiency score indicates a higher level of green production performance under the combined constraints of resource use and environmental pressure. Based on this model, the static GTFP values of 110 cities in the Yangtze River Economic Belt from 2007 to 2023 are estimated.

2.3.2. Dynamic Decomposition Based on the Malmquist–Luenberger Index

Although the Super-SBM model can identify the relative level of green efficiency in a certain period, it is difficult to directly reveal the sources of intertemporal productivity change. To address this limitation, this paper further introduces the Malmquist–Luenberger (ML) productivity index to analyze the dynamic evolution process of GTFP. Unlike traditional productivity indices, the ML index incorporates undesirable outputs into the intertemporal productivity analysis framework. Therefore, it is more suitable for measuring changes in green productivity when pollution emissions are regarded as by-products of production.
Based on the directional distance function, the ML index is used to measure the change in GTFP between two adjacent periods and further decomposes it into efficiency change (EC) and technological change (TC). In this study, the ML index is calculated based on the contemporaneous production frontier of adjacent periods. The direction vector is set to expand desirable outputs and reduce undesirable outputs, which is consistent with the objective of improving green productivity under environmental constraints. Among them, EC reflects the degree to which a city approaches or moves away from the contemporaneous production frontier, namely the “catch-up effect” of green production efficiency. TC describes the movement of the production frontier itself and is usually interpreted as technological progress or technological regress. In general, an index value greater than 1 indicates an improvement in productivity, a value equal to 1 indicates no change, and a value less than 1 indicates a decline in productivity.
The ML index is expressed as follows:
M L t , t + 1 = E C t , t + 1 × T C t , t + 1
where M L t , t + 1 denotes the change in green total factor productivity from period t to period t + 1, E C t , t + 1 represents efficiency change, and T C t , t + 1 denotes technological change. Through this decomposition, the study is able to distinguish whether the growth in GTFP mainly originates from improvements in managerial and allocative efficiency or from outward shifts in the production frontier driven by technological progress.
This paper uses MAXDEA software to calculate the super-efficiency SBM model and the decomposition of the Malmquist–Luenberger index. By combining static efficiency evaluation with dynamic productivity decomposition, this paper can more systematically characterize the features and changing process of urban green total factor productivity in the Yangtze River Economic Belt from both the level and evolution dimensions, thereby providing a more comprehensive analytical basis for deeply understanding its development level and dynamic evolution process. The ML index is used here to identify the main sources of intertemporal GTFP change, while future research may further apply the Global Malmquist–Luenberger index to test cross-period comparability under a global production frontier.

2.4. Spatial Analysis Methods

2.4.1. Spatiotemporal Pattern Analysis

To more intuitively display the temporal evolution and spatial differentiation characteristics of green total factor productivity, this paper uses ArcMap 10.8 software for mapping visualization and spatial pattern analysis. By comparing the spatial distribution of GTFP in different years, the dynamic changes in high-value and low-value areas within the Yangtze River Economic Belt can be identified, thereby providing an intuitive characterization of the spatial evolution process of regional green development.
In terms of the classification method, this paper adopts the natural breaks method, namely the Jenks method, to classify GTFP values. This method is widely used in spatial heterogeneity analysis. Its core lies in minimizing intra-group variance and maximizing inter-group differences, so as to reveal, to a certain extent, the internal distribution characteristics of the data [28,29]. In this study, the Jenks natural breaks method is used to identify natural groupings of GTFP values among cities. By reducing variance within classes and increasing differences between classes, this method can better reveal spatial heterogeneity in urban GTFP than equal-interval classification. Therefore, it is suitable for comparing the spatial distribution characteristics of GTFP across different years.

2.4.2. Trend Surface Analysis

At a broader spatial scale, this paper adopts the trend surface analysis method to reveal the overall spatial gradient and directional evolution characteristics of green total factor productivity in the Yangtze River Economic Belt [30]. Different from the identification of local spatial patterns, this method fits a continuous spatial surface based on the observed values of sample cities, thereby describing the general spatial variation trend of the variable. Therefore, trend surface analysis is particularly suitable for identifying whether GTFP has systematic directional changes in geographical space, such as east–west or north–south gradient differences.
Suppose that ( x q , y q ) denotes the spatial coordinates of city q, Z q ( x q , y q ) denotes the GTFP value of city q, T q ( x q , y q ) denotes the trend function, and ε q represents the random error term. The model can be expressed as follows:
Z q ( x q , y q ) = T q ( x q , y q ) + ε q
where Z q ( x q , y q ) is the observed value of GTFP at location ( x q , y q ) , T q ( x q , y q ) is the fitted trend surface reflecting the overall spatial variation trend, and ε q is the residual term. By fitting the variation in GTFP along the east–west and north–south directions, trend surface analysis helps describe the large-scale spatial gradient of urban green development and its change over time.

2.4.3. Gravity Center Migration Analysis

On the basis of identifying spatial gradient characteristics, this paper further employs the center of gravity migration analysis method to characterize the dynamic changes in the spatial distribution center of GTFP in the Yangtze River Economic Belt. Compared with the simple geometric center method, the weighted center of gravity method incorporates the GTFP level of each city into the weight calculation, and it therefore can more accurately reflect the actual spatial distribution center of regional green development. By calculating the center-of-gravity coordinates for each year and connecting them in chronological order, the migration trajectory, movement direction, and overall evolutionary trend of the center of gravity can be intuitively presented.
The calculation formula of the center of gravity is as follows:
X ¯ = q = 1 n G T F P q x q q = 1 n G T F P q , Y ¯ = q = 1 n G T F P q y q q = 1 n G T F P q
where ( x q , y q ) denotes the spatial coordinates of city q, G T F P q represents the green total factor productivity value of city q, n is the total number of cities, and X ¯ and Y ¯ represent the longitude and latitude coordinates of the annual gravity center.

2.5. Geographic Detector

2.5.1. Model Specification

On the basis of identifying the spatiotemporal evolution characteristics of GTFP, this paper further applies the geographical detector model to analyze the driving mechanism underlying the spatial differentiation of GTFP in the Yangtze River Economic Belt. The core idea of this model is that, if an explanatory factor has a significant influence on the spatial distribution of the dependent variable, the spatial stratification of this factor should exhibit a high degree of consistency with the spatial pattern of the dependent variable [31]. The explanatory power of a given factor can be measured using the q statistic, which is expressed as follows:
q = 1 1 N σ 2 p = 1 L N p σ p 2
where q denotes the explanatory power of a driving factor on the spatial differentiation of GTFP; N and σ 2 represent the number of samples and the variance of GTFP in the whole study area, respectively; N p and σ p 2 denote the number of samples and the variance of GTFP in stratum p; and L is the total number of strata of the driving factor. The value of q ranges from 0 to 1. A larger q value indicates that the factor has a stronger explanatory power for the spatial differentiation of GTFP. Before applying the geographical detector model, continuous driving factors were discretized into categorical variables using the natural breaks method. The same discretization rule was applied across variables and years to maintain comparability in the factor detection results.
This paper conducts two types of analyses. First, factor detection is employed to evaluate the independent explanatory power of each candidate variable. Second, interaction detection is used to examine whether the joint effect of two factors is stronger than, weaker than, or approximately equivalent to their individual effects. In this way, the model can overcome the limitations of single-factor explanations and further identify the coupling mechanisms that may affect regional green development. Before the formal analysis, continuous explanatory variables are discretized into several strata using appropriate classification methods, so as to ensure the consistent applicability of the geographical detector model across different indicators.

2.5.2. Selection of Driving Factors

The spatial differentiation of green total factor productivity in the Yangtze River Economic Belt cannot be explained by any single factor. It is more likely the outcome of several socioeconomic conditions working together, including the level of economic development, industrial structure, urbanization, openness, technological capacity, government intervention, environmental regulation, energy use, and human capital. These conditions influence GTFP in different ways. Some affect the allocation of production factors, some reshape industrial structure, and others work through technological diffusion, environmental governance, or improvements in factor quality.
This study selects the main driving factors according to theoretical relevance and data availability. Per capita GDP is used to describe the economic foundation of each city. The shares of tertiary and secondary industry value added in GDP are used to capture industrial upgrading and industrialization, respectively. The proportion of permanent urban residents reflects the level of urbanization, while the ratio of foreign direct investment to GDP is used to measure openness. Technological innovation, government intervention, and human capital are included to represent innovation support, institutional input, and knowledge accumulation. Environmental regulation and energy intensity are also considered, as they reflect regulatory pressure and the constraints associated with resource-use efficiency. These indicators together make it possible to examine why GTFP differs across cities in the Yangtze River Economic Belt.
More specifically, technological innovation is generally considered to improve GTFP by promoting cleaner production, enhancing energy efficiency, and facilitating the diffusion of green technologies. Under certain conditions, environmental regulation may encourage enterprises to adopt greener production processes through the innovation compensation effect. Human capital contributes to knowledge absorption, technology transfer, and the optimization of resource allocation, while industrial structure and urbanization may simultaneously affect production efficiency and environmental pressure. Based on this analytical framework, this paper applies the geographical detector model to examine the independent explanatory power and interaction effects of each driving factor on the spatiotemporal evolution of GTFP. The specific indicators and their definitions are shown in Table 2. Considering the institutional change from pollutant discharge fees to environmental protection tax after 2018, this study uses the corresponding fiscal revenue item under the same environmental regulation logic to maintain the intertemporal comparability of the environmental regulation indicator.

3. Results

3.1. Temporal Evolution Characteristics of GTFP

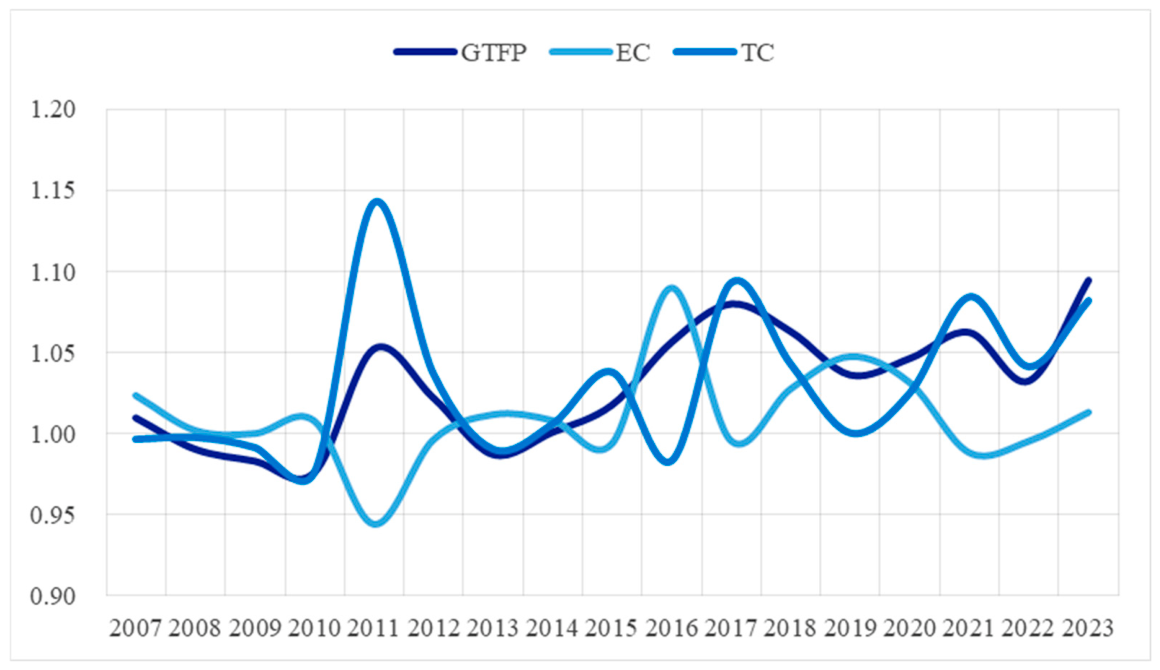
As shown in Figure 2, the green total factor productivity of the Yangtze River Economic Belt exhibited an overall fluctuating upward trend from 2007 to 2023. During the entire study period, the mean value of GTFP remained above 1, reaching approximately 1.030, indicating that the region maintained a favorable trend of continuous improvement in green productivity. However, this upward process was not linear but showed obvious stage-specific fluctuations. Specifically, the temporal evolution of GTFP can be roughly divided into three stages.
First is 2007 to 2010, during which GTFP remained at a relatively low level and showed a slight downward trend, decreasing from 1.010 in 2007 to 0.976 in 2010. This period, to a large extent, reflected the constraints imposed by resource-dependent and pollution-intensive development patterns, as well as the still limited role of green transformation in urban development.
Second is 2011 to 2015, although the recovery was accompanied by clear fluctuations. After falling in the previous stage, GTFP rebounded to 1.052 in 2011. It then remained mostly around the threshold value of 1, or slightly above it, but the pattern was still not stable enough to suggest a continuous improvement.
Third is after 2016. During this stage, GTFP generally shifted into a higher-value range, indicating that the conditions supporting green development in the Yangtze River Economic Belt were gradually improving. The index reached 1.094 in 2023, which was the highest value recorded over the whole observation period.
The decomposition of GTFP shows that this upward movement was driven more by technological progress than by efficiency change. The mean TC value was about 1.031, compared with 1.010 for EC. This difference, although not large, indicates that the main source of GTFP growth was the outward shift of the production frontier. In other words, green productivity improved more because of technological advancement and innovation than because cities simply used existing inputs more efficiently. This pattern is particularly evident in 2011, 2017, 2021, and 2023, when TC showed relatively strong growth. These years suggest the possible effects of green innovation, cleaner production technologies, and technology diffusion. EC, in contrast, fluctuated within a narrower range. It supported GTFP growth in some years, but its contribution was neither as strong nor as stable as that of TC.
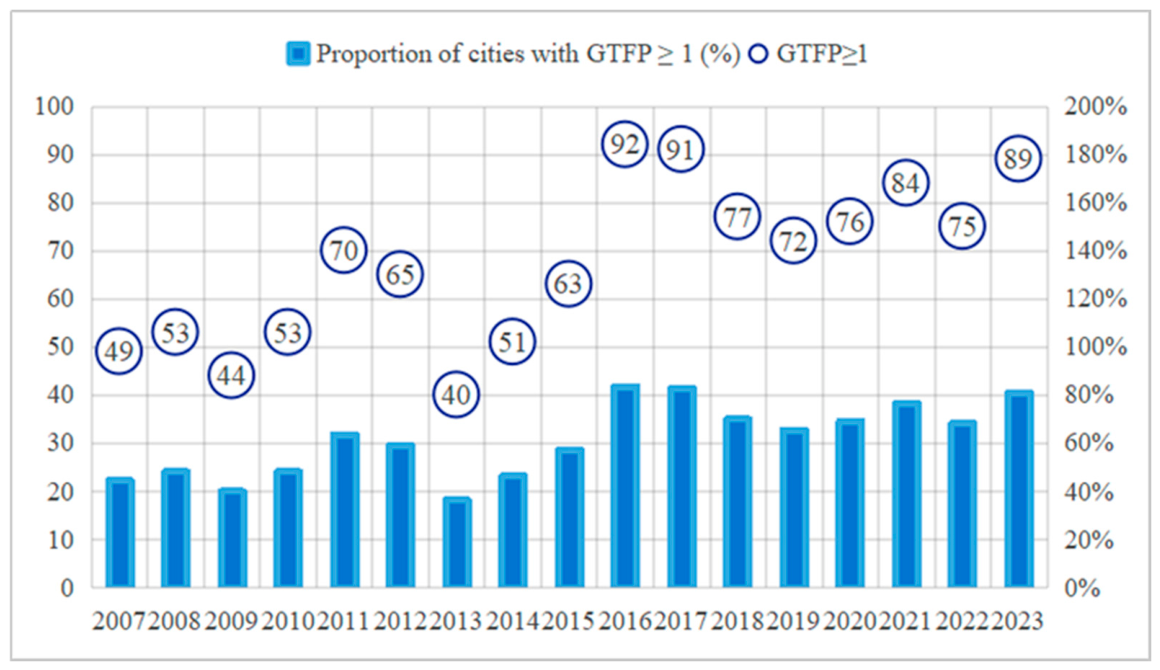
The changes shown in Figure 3 also indicate that green productivity growth gradually became more widespread across the region. In 2007, 49 cities had GTFP values of 1 or above, representing 44.55% of the 110 sample cities. The number did not increase smoothly at first. In 2013, it fell to 40 cities, or 36.36%, showing that the spread of green development was still fragile. After 2015, however, the pattern changed markedly. The number rose to 92 in 2016 and remained at 91 in 2017. Although some fluctuations appeared later, 89 cities still reached or exceeded the threshold by 2023, accounting for 80.91% of the sample. This suggests that green productivity improvement was no longer limited to a few leading cities but had gradually extended to most parts of the Yangtze River Economic Belt.
Although the annual changes in mean GTFP are relatively small, they still have practical significance because GTFP is a composite index reflecting changes in multiple inputs, desirable outputs, and undesirable outputs. A moderate increase in this index therefore indicates that cities improved their production performance while facing resource and environmental constraints. Moreover, the rising number and proportion of cities with GTFP values greater than or equal to 1 suggest that the improvement was not limited to a few leading cities but gradually extended to a wider range of cities in the YREB.

3.2. Spatiotemporal Dynamics of Green Total Factor Productivity

3.2.1. Trend Variation

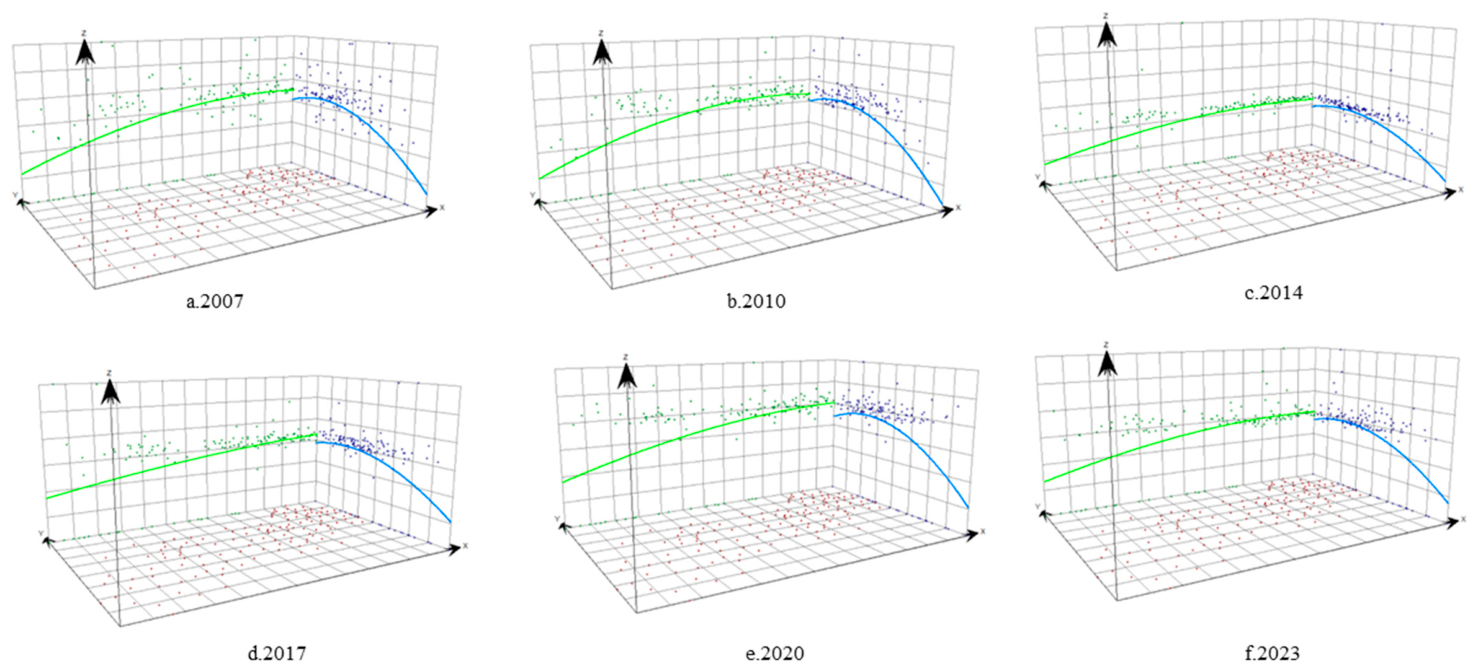
The trend surface in Figure 4 suggests that the spatial pattern of green total factor productivity in the Yangtze River Economic Belt was relatively stable over the study period. The most evident feature is the west–east gradient: GTFP generally increased from the upper reaches toward the lower reaches. By comparison, the north–south difference was weaker. This means that the unevenness of green development was mainly organized along the river-basin development axis, rather than along a simple latitudinal divide.
Along the east–west axis, the fitted surface does not show a simple linear increase. Instead, it forms an inverted U-shaped pattern: GTFP rises from the western part of the Yangtze River Economic Belt toward the middle and lower reaches, but it declines slightly near the eastern edge. This indicates that the main high-value area is concentrated in the middle and lower reaches rather than at the two ends of the belt. The pattern corresponds broadly to the relatively strong green development performance of Shanghai, Nanjing, Hangzhou, and Wuhan. Some western peripheral cities and a few cities close to the eastern margin, however, remain at lower GTFP levels.
Along the north–south axis, the fitted surface changes only slightly. Although GTFP shows a modest upward tendency in this direction, the variation is far less pronounced than along the west–east axis. This suggests that the spatial differentiation of GTFP in the Yangtze River Economic Belt is not mainly a matter of latitude. Instead, it is more closely related to the different development conditions of the upper, middle, and lower reaches, including their economic foundation, innovation capacity, industrial structure, and environmental governance.
The fitted surfaces for different years show that changes in GTFP levels did not substantially alter the underlying spatial pattern. This persistence points to a degree of path dependence in the green development pattern of the Yangtze River Economic Belt. The trend surface became slightly flatter in the later period, indicating that the gap between high-value and low-value areas narrowed to some extent. In particular, while the middle and lower reaches continued to dominate the high-value areas, the upward trend in the western region suggests that the upper reaches gradually improved, and the overall spatial pattern tended to become more balanced.
The fitted surfaces suggest no major spatial reordering of GTFP in the Yangtze River Economic Belt during the study period. Instead, the broad pattern remained stable, with only gradual changes within the region. The west–east gradient was much clearer than the north–south variation. High GTFP values continued to cluster in the middle and lower reaches, while the upper reaches showed some signs of catching up. Even so, this improvement was still limited and had not yet changed the basic spatial structure.

3.2.2. Spatial Pattern Evolution

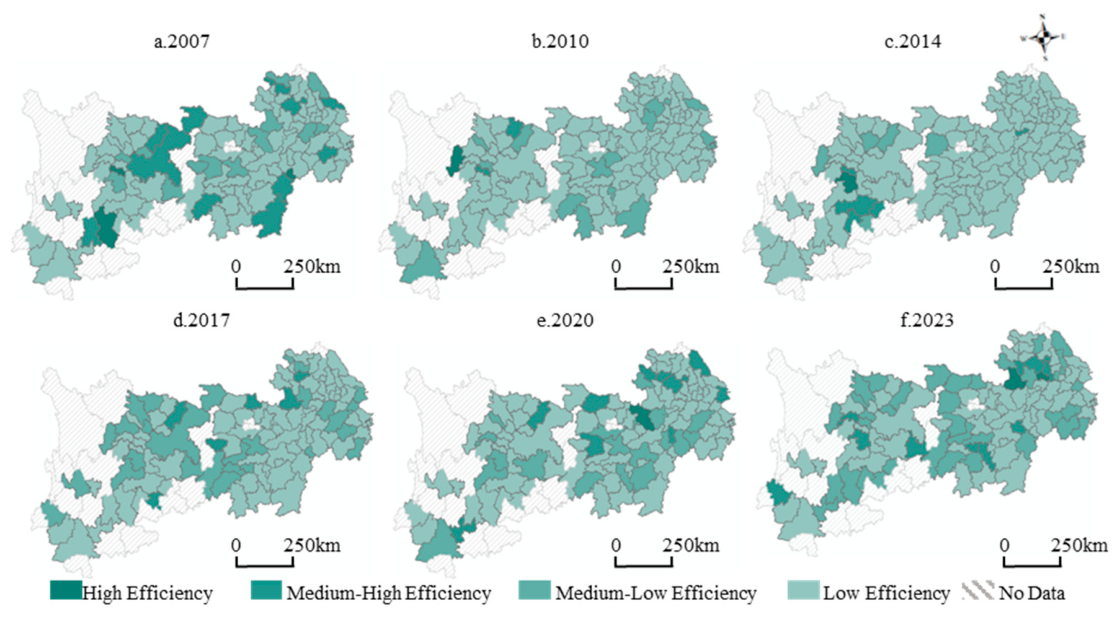
Figure 5 illustrates how the spatial distribution of GTFP in the Yangtze River Economic Belt changed during the study period. The pattern was clearly uneven across regions. Higher GTFP values were more often found in the middle and lower reaches, rather than being evenly distributed across the whole belt. This concentration was particularly evident around cities with stronger economic bases and innovation capacity, including Shanghai, Nanjing, Hangzhou, Suzhou, and Wuhan. In contrast, low-value areas were more widely distributed in some upper-reach regions and peripheral cities. This pattern indicates that the spatial distribution of GTFP was closely related to factors such as economic foundation, industrial structure, innovation resources, and environmental governance capacity.
From the perspective of temporal change, the spatial pattern of GTFP experienced an evolutionary process from local agglomeration to regional diffusion. In the early stage, the number of high-value cities was relatively small and mainly concentrated in a few downstream core cities. Relying on strong agglomeration effects, developed producer services, and relatively high levels of technological innovation, these areas provided favorable conditions for the improvement of green productivity. Over time, the spatial continuity of high-value areas gradually increased and expanded from the lower reaches to some areas in the middle reaches. In this process, cities such as Wuhan, Changsha, and Nanchang showed relatively strong momentum in green development.
By contrast, some cities in the upper reaches, especially those with a strong dependence on resource-based industries or heavy industries, remained at low or medium-low levels for a relatively long period. However, judging from the spatial distribution in the later period, the upper reaches had already shown obvious improvement. For example, Chengdu, Chongqing, and some areas in Yunnan and Guizhou experienced varying degrees of improvement in GTFP, indicating that the green development capacity of the upper reaches gradually strengthened in the later period. This change may be closely related to the continuous advancement of ecological restoration, pollution control, industrial structure upgrading, and regional coordinated development.
Overall, the evolution of the spatial pattern of GTFP in the Yangtze River Economic Belt showed the coexistence of stability and change. On the one hand, the overall pattern of “higher levels in the middle and lower reaches and lower levels in some upper-reach areas” remained relatively stable. On the other hand, the number of high-value cities gradually increased, and the scope of low-value areas narrowed, indicating that green development was gradually evolving from point-based breakthroughs represented by core cities such as Shanghai, Nanjing, Hangzhou, and Wuhan toward wider regional diffusion.

3.2.3. Center Migration

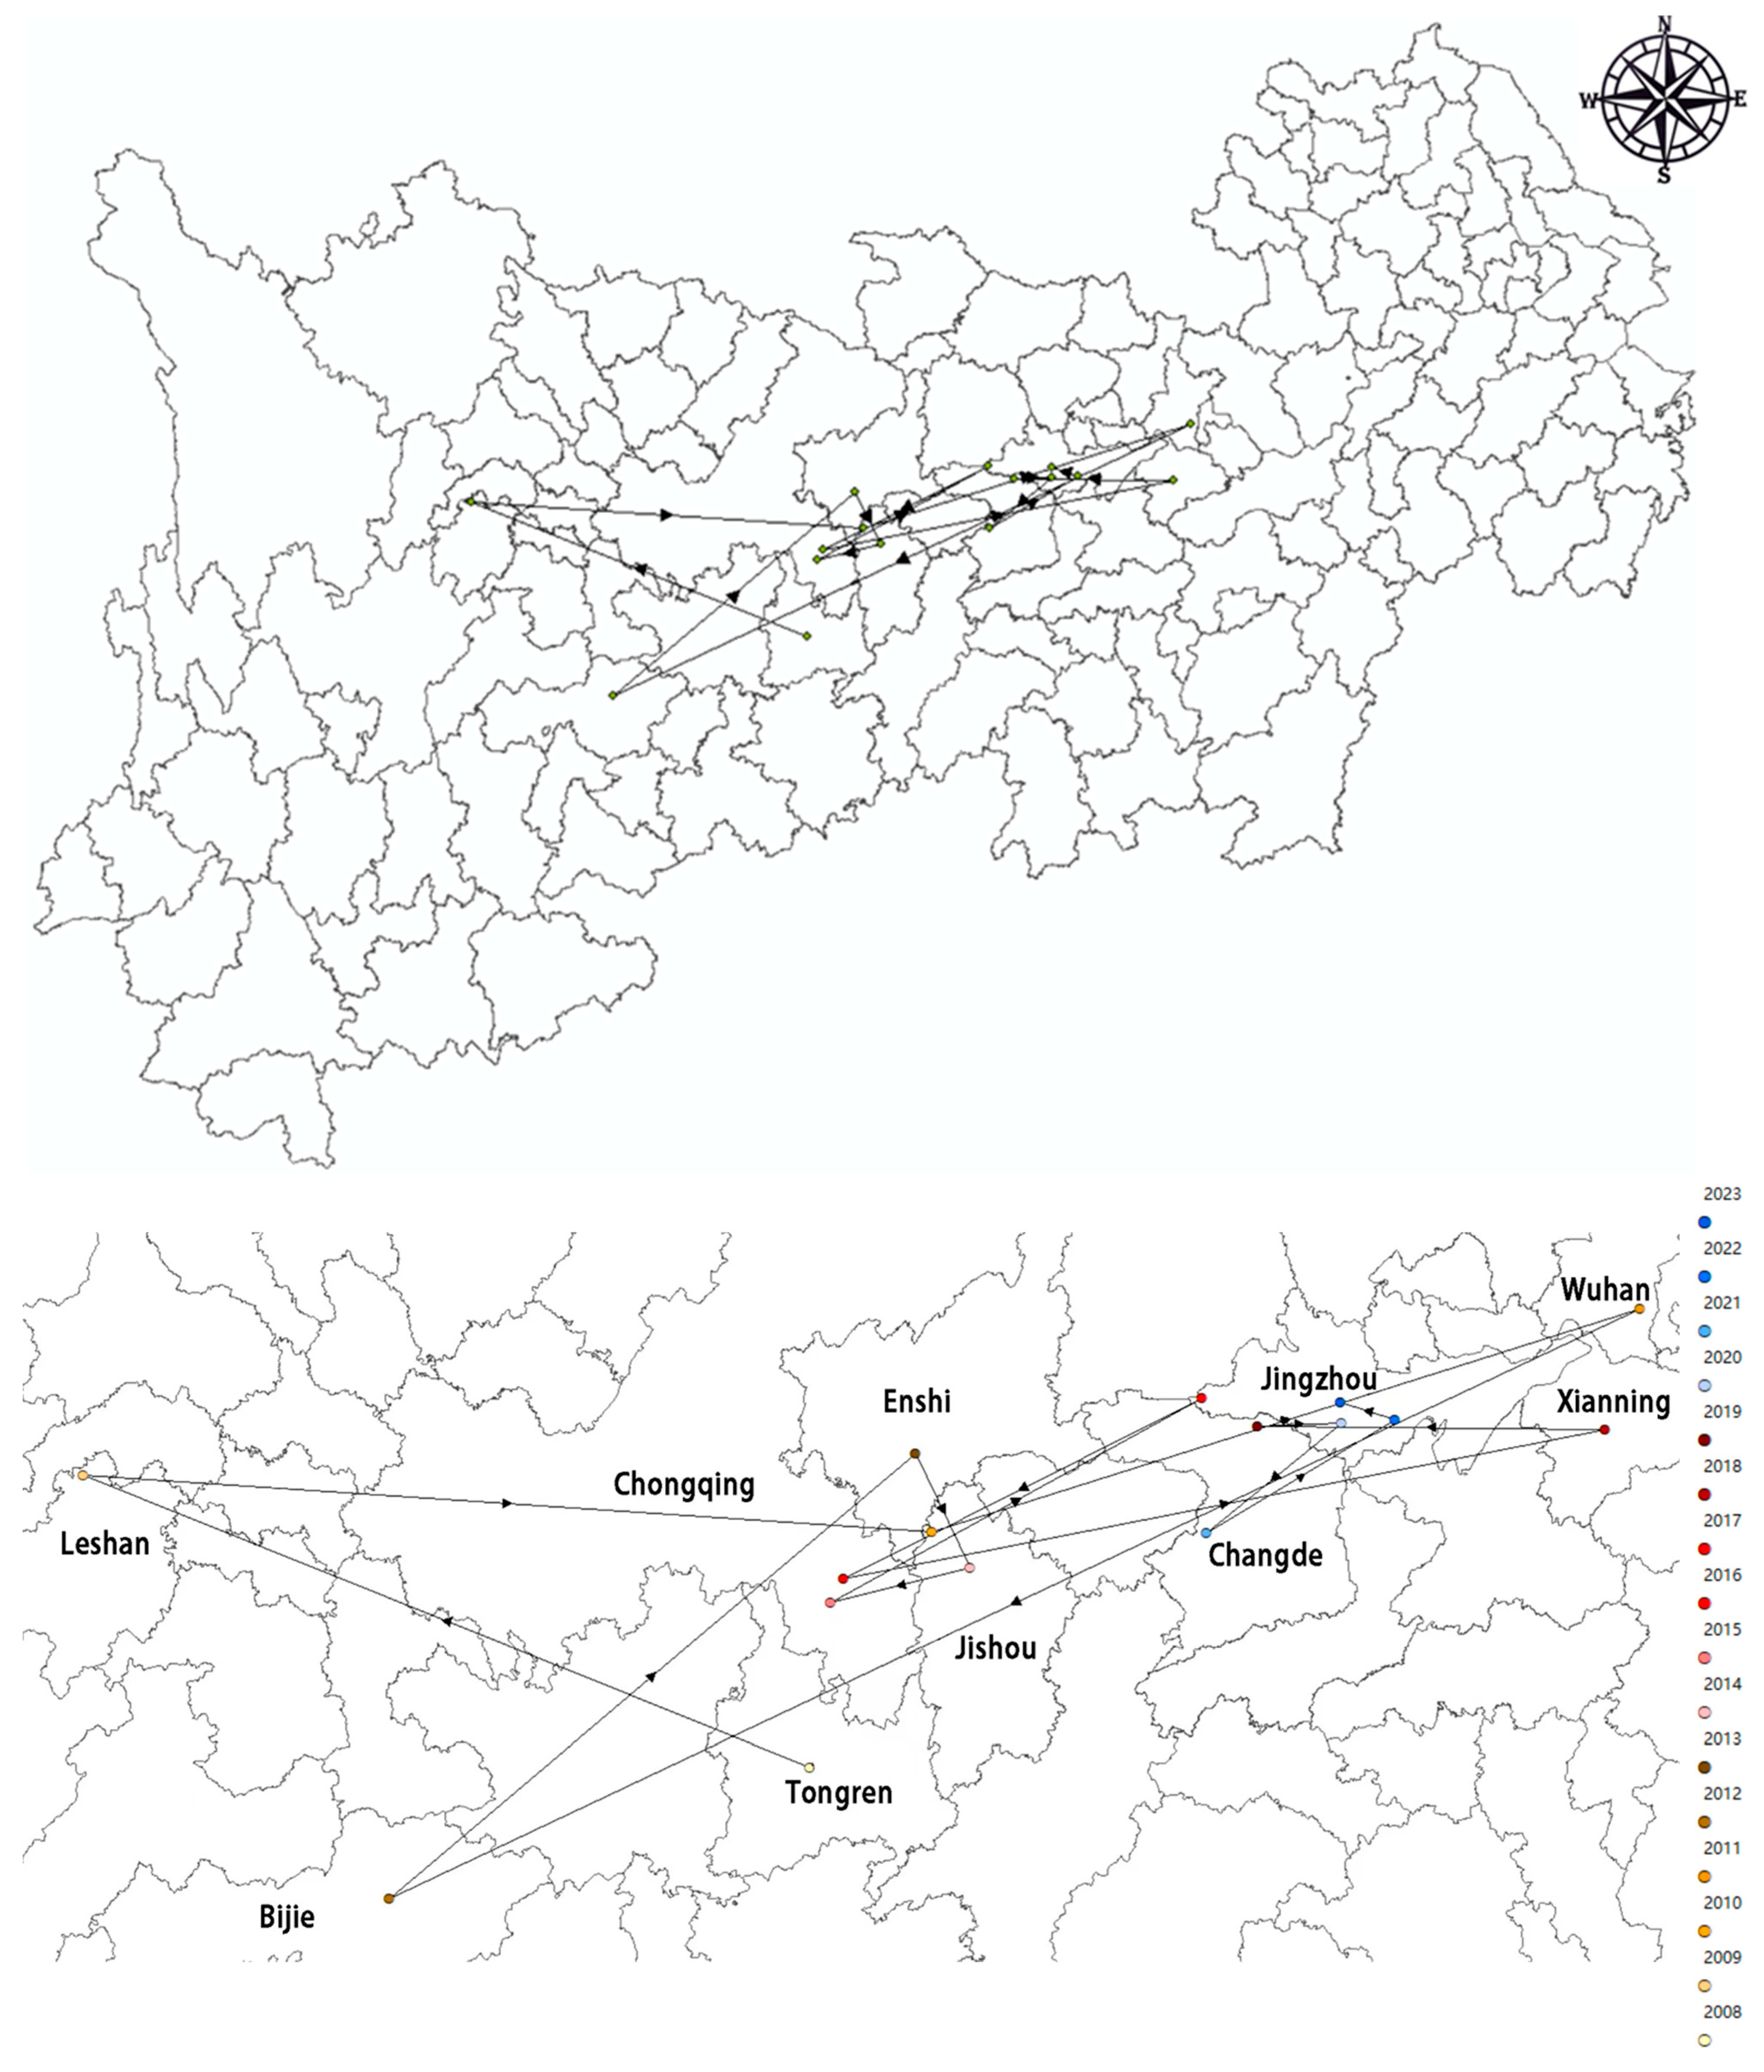
Figure 6 shows the migration trajectory of the center of gravity of green total factor productivity in the Yangtze River Economic Belt. Overall, during the study period, the center of gravity of GTFP was mainly located in the middle reaches and moved within a relatively limited spatial range, indicating that the core spatial center of regional green development was generally stable. At the same time, the trajectory was not static but showed several short-distance fluctuations, while generally presenting a migration trend from the southwest to the northeast. Since GTFP is an efficiency index with relatively moderate numerical variation, the center-of-gravity migration is interpreted as a gradual adjustment in the spatial contribution structure of GTFP rather than a large-scale relocation of the regional productivity center.
From the perspective of stage characteristics, the center of gravity in the early stage was relatively westward, mainly located in the transitional area between the upper and middle reaches. Subsequently, the center of gravity gradually moved eastward and northeastward, approaching the areas around Jingzhou, Xianning, and Wuhan. This indicates that cities in the middle and lower reaches gradually made a stronger contribution to regional GTFP. The migration trajectory was not entirely smooth. The center of gravity moved back and forth in some years, but over the whole period it shifted northeastward. This indicates that the focus of green development was gradually being drawn toward cities with stronger economic bases, greater innovation capacity, and more mature environmental governance.
The trajectory also suggests that key cities did not contribute to the shift in the same way. Wuhan, for example, appears to have strengthened its pull on the regional center of gravity, supported by its advantages in technological innovation, industrial upgrading, transport location, and governance capacity. Chongqing played a different role. Its continued improvement helped anchor the center of gravity in the transition zone between the upper and middle reaches, preventing the pattern from moving too far toward the lower reaches. In this sense, the migration of the center of gravity was not a one-way agglomeration process but the result of the joint influence of multiple growth poles.
From a broader perspective, the northeastward movement of the center of gravity was generally consistent with the long-term optimization trend of the green development pattern in the Yangtze River Economic Belt. At the same time, the repeated fluctuations in the migration path also indicate that this evolutionary process was gradual rather than linear. Overall, the center-of-gravity migration analysis shows that the spatial center of GTFP in the Yangtze River Economic Belt remained relatively stable at the macro level, while the internal center of regional green development gradually shifted from the transitional zone between the upper and middle reaches toward the middle and lower reaches.

3.3. Driving Factors and Interaction Effects

3.3.1. Factor Detection Results

The factor detection results show that the spatial differentiation of green total factor productivity in the Yangtze River Economic Belt is formed by the joint action of multiple socioeconomic factors, but the explanatory power of each factor changes significantly in different periods. As shown in Table 3, in 2007, energy intensity (EI) has the strongest explanatory power, with a q value of 0.233, followed by the level of economic development (PGDP, 0.214) and technological innovation (INNOV, 0.201). Urbanization level (URB) and industrial upgrading (INDUS) also had relatively high explanatory power. By contrast, opening-up (OPEN) contributed the least, with a q-value of 0.097. This indicates that, in the early stage of the study period, the spatial difference in GTFP is mainly affected by the development stage, energy use pressure, and the basic conditions of technological progress.
By 2023, the hierarchy of dominant factors had changed markedly. Technological innovation moved to the top of the ranking, with its q-value rising from 0.201 to 0.315 and its position shifting from third to first. Economic development remained a major factor, ranking second with a q-value of 0.287. Energy intensity slipped in rank, but its explanatory power did not weaken; instead, its q-value increased to 0.261. Human capital and industrial upgrading also became more prominent, with q-values of 0.247 and 0.241, placing them fourth and fifth, respectively. The level of industrialization showed the opposite pattern, falling from seventh to tenth as its q-value declined from 0.153 to 0.118. Taken together, these changes suggest that the spatial differentiation of GTFP in the Yangtze River Economic Belt was moving away from a pattern mainly shaped by industrial expansion and resource consumption, and toward one increasingly driven by innovation capacity, knowledge accumulation, and structural transformation.
This shift becomes clearer when the 2007 and 2023 results are compared. In the early stage, the importance of energy intensity reflects that green productivity is still largely constrained by the extensive growth mode and high energy consumption dependence, especially in the upper and middle reaches, where energy-intensive and heavy industrial sectors are relatively concentrated. In the later stage, the significantly enhanced role of technological innovation indicates that cities with stronger R&D investment, technology diffusion capacity, and innovation ecosystems gain greater advantages in improving GTFP. Meanwhile, the rising importance of human capital also confirms this trend, indicating that educational accumulation, skill improvement, and knowledge diffusion are playing an increasingly prominent role in the growth of green productivity.
Another change worthy of attention is the gradual enhancement of the influence of policy and institutional factors. The q value of environmental regulation increases from 0.142 in 2007 to 0.208 in 2023, and the levels of government intervention and opening up also show a certain degree of increase. Although the influence of these factors is still lower than that of technological innovation, economic development, and energy intensity, the improvement of their explanatory power indicates that institutional support, regulatory pressure, and external openness are becoming increasingly important in regional green development.
To sum up, the factor detection results show that the driving mechanism of the spatial differentiation of GTFP in the Yangtze River Economic Belt is not static. Instead, it has experienced a transition from being dominated by energy constraints and differences in development stages to being characterized by technological progress, human capital accumulation, industrial upgrading, and institutional improvement.

3.3.2. Interaction Effect Identification

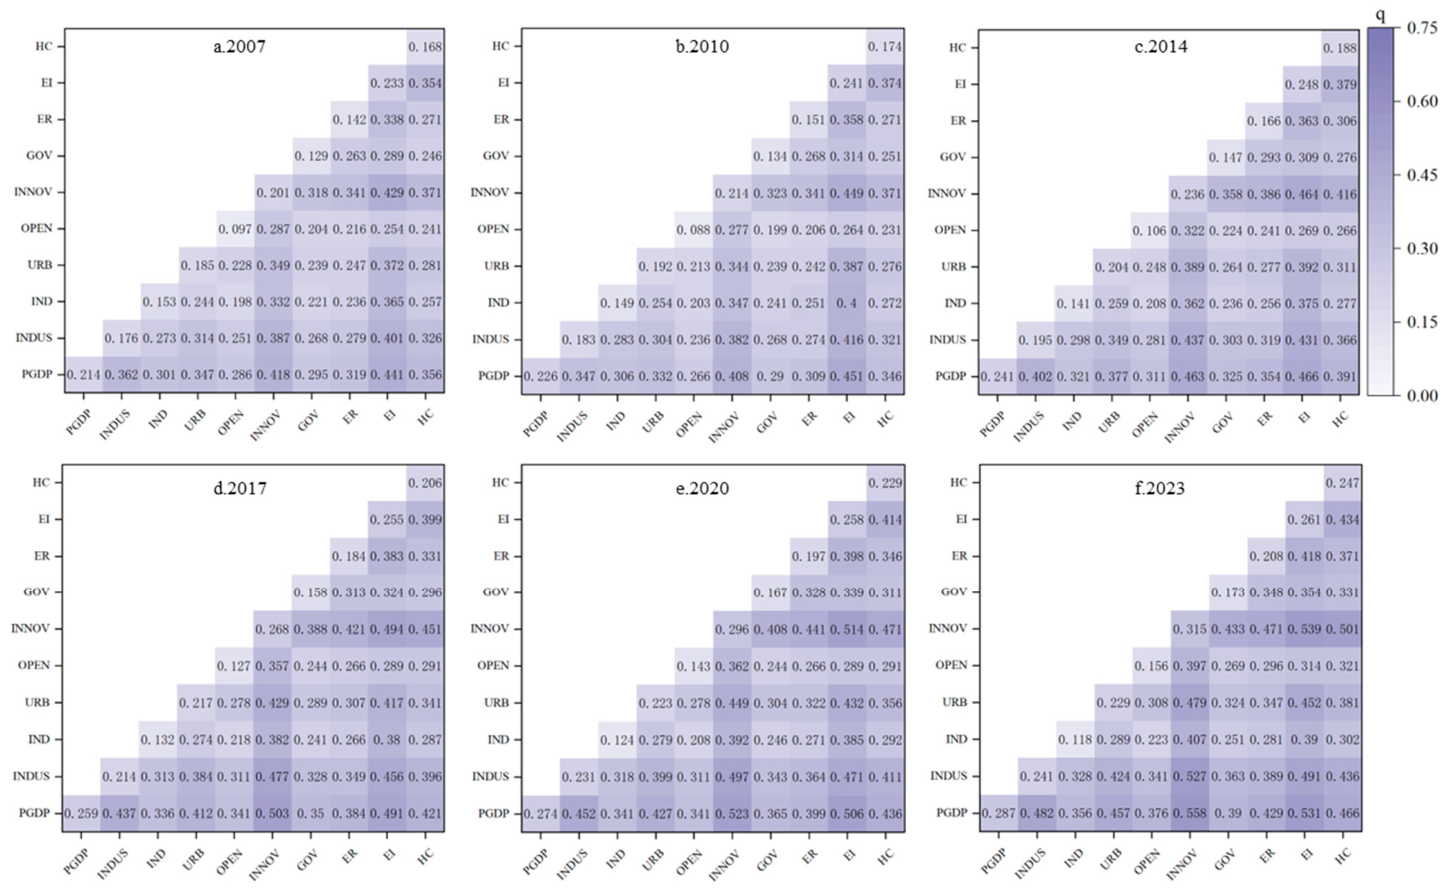
Compared with the results of single-factor detection, the interaction detection results further indicate that the spatial differentiation of GTFP in the Yangtze River Economic Belt is not dominated by a single factor but is the result of the joint action of multiple variables. As shown in Figure 7, in each study year, the q value after the interaction of any two factors is significantly higher than the explanatory power of the corresponding single factor. This suggests that there is no case in which a certain variable acts independently. Instead, regional green development is formed by the coupling effects of multiple factors, including development foundation, industrial structure, urbanization level, innovation capacity, environmental governance, energy efficiency, and human capital.
In the early stage of the study period, the strongest interaction effects are mainly concentrated among economic development level (PGDP), energy intensity (EI), and technological innovation (INNOV). In 2007, the q values of PGDP ∩ EI, INNOV ∩ EI, and PGDP ∩ INNOV reached 0.441, 0.429, and 0.418, respectively, which are all significantly higher than the explanatory power of the corresponding single factors. By 2010, the interaction effects had become more pronounced. The q-value for PGDP ∩ EI rose to 0.451, while those for INNOV ∩ EI and PGDP ∩ INNOV reached 0.449 and 0.408. Other combinations involving energy intensity, such as URB ∩ EI and INDUS ∩ EI, also had strong explanatory power. These results suggest that, at the early stage, differences in GTFP across the Yangtze River Economic Belt were shaped less by any single factor than by the combined effects of economic development, energy intensity, and technological conditions.
During the middle stage, technological innovation became more closely tied to other driving factors. In 2014 and 2017, the interaction terms PGDP ∩ EI, INNOV ∩ EI, and PGDP ∩ INNOV all showed stronger explanatory power. The change in PGDP ∩ INNOV was especially clear, with its q-value rising from 0.463 in 2014 to 0.503 in 2017. By 2017, INNOV ∩ HC had also reached 0.451, while INDUS ∩ EI and URB ∩ EI remained influential. These results suggest that the driving mechanism of green development was changing. Resource constraints and economic development level were still important, but innovation capacity, human capital, and industrial upgrading were becoming more central to the spatial differentiation of GTFP.
In the later stage, the interaction results became more concentrated around economic development, technological innovation, and energy intensity. In 2020, PGDP ∩ INNOV had the highest explanatory power, with a q-value of 0.523. PGDP ∩ EI and INNOV ∩ EI were also strong, reaching 0.506 and 0.514, respectively. This pattern became more pronounced in 2023. The q-value of PGDP ∩ INNOV rose to 0.558, the highest value observed during the study period. At the same time, PGDP ∩ EI, INNOV ∩ EI, and INNOV ∩ HC reached 0.531, 0.539, and 0.501, respectively. These results suggest that, in the later stage, the spatial differentiation of GTFP was increasingly shaped by the combined effects of economic development, technological innovation, energy intensity, and human capital.
Policy-related factors also became more influential when combined with innovation or energy-intensity variables. In 2023, ER ∩ INNOV and ER ∩ EI recorded q-values of 0.471 and 0.418, while GOV ∩ INNOV reached 0.348. Environmental regulation and government intervention are not the most dominant variables in the single-factor analysis, their interaction results indicate that such factors play more of an “amplifier” role, strengthening the effects of technological innovation, cleaner production, and resource use optimization.
The interaction detection results suggest that GTFP differences across the Yangtze River Economic Belt cannot be explained by any single driver. Instead, they reflect the combined effects of development level, energy use, technological innovation, human capital, industrial upgrading, and policy-related factors. The dominant interaction structure also changed over time. In the early stage, combinations involving economic development and energy constraints were more prominent. In the later stage, innovation, human capital, and industrial upgrading became more closely linked to the formation of spatial differences. This shift indicates that green development in the Yangtze River Economic Belt is moving beyond a factor-driven pattern and is increasingly supported by technological progress, knowledge accumulation, and institutional coordination.

4. Discussion

GTFP in the Yangtze River Economic Belt increased overall between 2007 and 2023, although the path was not smooth. The index fluctuated in the early years and then moved into a more stable stage of improvement, suggesting that the region’s growth pattern was gradually becoming less dependent on high resource consumption and heavy environmental pressure. Spatially, the broad pattern remained relatively stable. The middle and lower reaches generally recorded higher GTFP values, while some upstream cities continued to lag behind. At the same time, low-value areas became smaller, more cities reached or exceeded the threshold value of 1, and the center of gravity moved northeastward. These changes suggest that green development was no longer confined to a few local clusters but was spreading across a wider part of the Yangtze River Economic Belt.
These findings broadly align with previous research showing that green development in China varies across regions and often involves changes in spatial structure. They also add to this literature in a more specific way. Earlier studies on the Yangtze River Economic Belt and other regions have highlighted the roles of spatial differentiation, structural upgrading, and environmental governance in shaping green development efficiency [32]. The evidence in this study suggests that, when examined at the prefecture-level city scale over a longer period, the GTFP pattern is not only uneven but also in motion. Results from temporal analysis, trend surfaces, spatial distribution, and center-of-gravity migration all point to the same tendency: green growth in the Yangtze River Economic Belt is gradually spreading from a small number of downstream core cities to a wider regional space. This dynamic process is less visible in studies that focus mainly on static spatial differences.
A key result is that the drivers of GTFP spatial differentiation did not remain fixed over time. In the early years, energy intensity and economic development level had stronger explanatory power, suggesting that regional differences were still closely tied to development stage and resource-use constraints. Later, technological innovation became the leading factor, and the influence of human capital and industrial upgrading also increased. This shift points to a deeper change in the growth logic of the Yangtze River Economic Belt. Green development was becoming less dependent on factor inputs and resource use and more closely linked to innovation capacity, knowledge accumulation, and structural transformation. The growing weight of innovation-related variables therefore reflects more than a change in q-values; it signals a broader transformation in the forces behind green productivity growth.
The interaction results make this point clearer. The high q-values for combinations involving economic development, technological innovation, energy intensity, and human capital suggest that green development in the Yangtze River Economic Belt is not driven by one factor alone. It is better understood as the outcome of several conditions working together. Cities such as Shanghai, Nanjing, Hangzhou, and Wuhan stand out not only because they have strong economic foundations but also because they are better able to combine innovation resources, industrial upgrading, environmental governance, and human capital. These combined advantages help explain why two-factor interactions consistently show stronger explanatory power than single factors. They also suggest that, in the later stage, the GTFP pattern depended increasingly on the coordination of multiple drivers.
These findings point to several policy directions. Technological innovation should remain at the center of green transformation in the Yangtze River Economic Belt. However, a single innovation policy is unlikely to fully play its role, because its effect is highly dependent on supporting conditions such as the improvement of energy efficiency, the optimization of industrial structure, and the accumulation of human capital. Secondly, regional policies should fully reflect internal differences. The downstream region can further consolidate its position as a highland of innovation and green development, the midstream region should accelerate industrial transformation and green upgrading, and the upstream region should pay more attention to ecological protection, cleaner production, and the cultivation of new green growth drivers. Thirdly, the coordination among environmental regulation, fiscal support, and talent development should be strengthened. The results show that institutional and policy factors play more of an enabling role, exerting influence by amplifying the effects of other green development mechanisms. Overall, future policy design for the Yangtze River Economic Belt should shift from fragmented intervention to more integrated and multi-factor collaborative governance.
Moreover, by combining the Super-SBM model, the ML index, spatial analysis, and geographical detector model, this study provides an integrated framework for examining the measurement, spatial evolution, and driving mechanisms of urban GTFP. This framework may also provide a reference for studies on other urban agglomerations or river-basin regions, although the indicators should be adjusted according to local conditions.
It should be noted that this paper still has some limitations. Firstly, due to the limitation of data availability, the undesirable outputs in the measurement of GTFP mainly include traditional industrial pollutants, while carbon emission indicators are not included. Under the current background of carbon neutrality and low-carbon transformation, this limitation may restrict a comprehensive characterization of the environmental dimension of green productivity. Secondly, although the geographical detector method has advantages in identifying spatial explanatory power and interaction relationships, it is not suitable for strict causal inference. Therefore, the results of this paper should be mainly understood as spatial associations rather than causal relationships. Future research can further introduce carbon-emission-related indicators and combine spatial econometric models or causal inference methods to deepen the understanding of regional green development mechanisms.


Author Contributions

Conceptualization, C.S.; methodology, K.C.; formal analysis, C.S.; investigation, C.G. and Y.W.; resources, C.G. and Y.W.; data curation, C.G. and Y.W.; writing—original draft preparation, C.S.; writing—review and editing, C.S., K.C. and J.C.; supervision, J.C.; project administration, J.C. All authors have read and agreed to the published version of the manuscript.

Funding

This research was supported by the Youth Project of the Humanities and Social Sciences Research Program of the Provincial Department of Education (Grant No. 25Q146).

Data Availability Statement

The data presented in this study are available on request from the corresponding author.

Conflicts of Interest

The authors declare no conflicts of interest.

References

  1. Wang, J.; Zhou, F.; Chen, C.; Luo, Z. Does the integration of agriculture and tourism promote agricultural green total factor productivity? Province-level evidence from China. Front. Environ. Sci. 2023, 11, 1164781. [Google Scholar] [CrossRef] [Scilit]
  2. Liu, M.; Zhu, Y.; Zhang, J. Can environmental regulation enhance green total factor productivity? Evidence from 107 cities in the Yangtze River Economic Belt. Sustainability 2024, 16, 5243. [Google Scholar] [CrossRef] [Scilit]
  3. Yan, W.; Yan, D. The regional effect of land transfer on green total factor productivity in the Yangtze River Delta: A spatial econometric investigation. Land 2023, 12, 1794. [Google Scholar] [CrossRef] [Scilit]
  4. Huang, J.; Shangguan, Z.; Gui, T.; Liu, J. How urban development affects green development efficiency in China: Taking the city cluster of Yangtze River Economic Belt as an example. Front. Environ. Sci. 2023, 11, 1169226. [Google Scholar] [CrossRef] [Scilit]
  5. Liu, D.; Zhu, X.; Wang, Y. China’s agricultural green total factor productivity based on carbon emission: An analysis of evolution trend and influencing factors. J. Clean. Prod. 2021, 278, 123692. [Google Scholar] [CrossRef] [Scilit]
  6. Färe, R.; Grosskopf, S.; Hernandez-Sancho, F. Environmental performance: An index number approach. Resour. Energy Econ. 2004, 26, 343–352. [Google Scholar] [CrossRef] [Scilit]
  7. Tone, K. A slacks-based measure of efficiency in data envelopment analysis. Eur. J. Oper. Res. 2001, 130, 498–509. [Google Scholar] [CrossRef] [Scilit]
  8. Chambers, R.G.; Chung, Y.; Färe, R. Benefit and distance functions. J. Econ. Theory 1996, 70, 407–419. [Google Scholar] [CrossRef] [Scilit]
  9. He, J.; Wang, L.; Tang, D. Research on green total factor productivity of Yangtze River Economic Belt based on environmental regulation. Int. J. Environ. Res. Public Health 2021, 18, 12242. [Google Scholar] [CrossRef] [Scilit] [PubMed]
  10. Lv, L.; Chen, C.; Wang, Z. Spatiotemporal differentiation and the obstacle factors influencing the coupling coordination between economic development and water pollution control capability in the Yangtze River Economic Belt. Environ. Sci. Pollut. Res. 2022, 29, 75681–75698. [Google Scholar] [CrossRef] [Scilit] [PubMed]
  11. Fukuyama, H.; Weber, W.L. A directional slacks-based measure of technical inefficiency. Socio-Econ. Plan. Sci. 2009, 43, 274–287. [Google Scholar] [CrossRef] [Scilit]
  12. Zhao, P.; Wu, H.; Lu, Z.; Kou, J.; Du, J. Spatial differences, distributional dynamics, and driving factors of green total factor productivity in China. Front. Environ. Sci. 2022, 10, 1058612. [Google Scholar] [CrossRef] [Scilit]
  13. Pan, T.; Jin, G.; Zeng, S.; Wang, R. Spatial-temporal divergence characteristics and driving factors of green economic efficiency in the Yangtze River Economic Belt of China. Chin. Geogr. Sci. 2024, 34, 1158–1174. [Google Scholar] [CrossRef] [Scilit]
  14. Song, M.; Du, J.; Tan, K.H. Impact of fiscal decentralization on green total factor productivity. Int. J. Prod. Econ. 2018, 205, 359–367. [Google Scholar] [CrossRef] [Scilit]
  15. Yuan, H.; Feng, Y.; Lee, C.-C.; Cen, Y. How does manufacturing agglomeration affect green economic efficiency? Energy Econ. 2020, 92, 104944. [Google Scholar] [CrossRef] [Scilit]
  16. Wang, X.; Zhu, Y.; Ren, X.; Gozgor, G. The Impact of Digital Inclusive Finance on the Spatial Convergence of Green Total Factor Productivity in Chinese Cities. Appl. Econ. 2023, 55, 4871–4889. [Google Scholar] [CrossRef] [Scilit]
  17. Zhou, J.; Zhong, M. Spatial–temporal evolution and peer effects of urban green development efficiency in China. Sci. Rep. 2024, 14, 8501. [Google Scholar] [CrossRef] [Scilit] [PubMed]
  18. Zhu, X.; Chen, H.; Zhang, P. Club convergence and spatial effect on green development of the Yangtze River Economic Belt. Land 2022, 11, 143. [Google Scholar] [CrossRef] [Scilit]
  19. Wang, J.F.; Zhang, T.L.; Fu, B.J. A measure of spatial stratified heterogeneity. Ecol. Indic. 2016, 67, 250–256. [Google Scholar] [CrossRef] [Scilit]
  20. Gong, G.; Zhao, Y. Ecology versus Economic Development: Effects of China’s Yangtze River Economic Belt Strategy. Int. Stud. Econ. 2024, 19, 330–352. [Google Scholar] [CrossRef] [Scilit]
  21. Liu, S.; Yuan, J. Spatial correlation network structure of energy-environment efficiency and its driving factors: A case study of the Yangtze River Delta Urban Agglomeration. Sci. Rep. 2023, 13, 20790. [Google Scholar] [CrossRef] [Scilit] [PubMed]
  22. Zhou, L.; Zhou, C.; Che, L.; Wang, B. Spatio-temporal evolution and influencing factors of urban green development efficiency in China. J. Geogr. Sci. 2020, 30, 724–742. [Google Scholar] [CrossRef] [Scilit]
  23. Li, W.; Zhang, Y.; Yang, C.; Gong, W.; Wang, C.; Zhang, R. Does Producer Services Agglomeration Improve Urban Green Development Performance of the Yangtze River Economic Belt in China? Ecol. Indic. 2022, 145, 109581. [Google Scholar] [CrossRef] [Scilit]
  24. Zhang, J.; Wu, G.; Zhang, J.P. The estimation of China’s provincial capital stock: 1952–2000. Econ. Res. J. 2004, 10, 35–44. [Google Scholar]
  25. Färe, R.; Grosskopf, S.; Pasurka, C.A. Environmental production functions and environmental directional distance functions. Energy 2007, 32, 1055–1066. [Google Scholar] [CrossRef] [Scilit]
  26. Li, B.; Wu, S. Effects of local and civil environmental regulation on green total factor productivity in China: A spatial Durbin econometric analysis. J. Clean. Prod. 2017, 153, 342–353. [Google Scholar] [CrossRef] [Scilit]
  27. Tone, K. A slacks-based measure of super-efficiency in data envelopment analysis. Eur. J. Oper. Res. 2002, 143, 32–41. [Google Scholar] [CrossRef] [Scilit]
  28. Chen, J.; Gao, M.; Cheng, S.; Hou, W.; Song, M.; Liu, X.; Liu, Y.; Shan, Y. County-level CO2 emissions and sequestration in China during 1997–2017: Evidence from structural decomposition and spatial analysis. Sci. Data 2020, 7, 391. [Google Scholar] [CrossRef] [Scilit] [PubMed]
  29. Li, H.; Zou, Q.; Zhang, J. Research on the spatiotemporal evolution and influencing factors of green economy efficiency in the Yangtze River Economic Belt. Environ. Sci. Pollut. Res. 2022, 29, 36125–36142. [Google Scholar] [CrossRef] [Scilit] [PubMed]
  30. Jiang, L.; Chen, X.; Pu, L.; Xue, H. Spatio-temporal evolution characteristics of tourism ecological resilience in China. Land 2025, 14, 966. [Google Scholar] [CrossRef] [Scilit]
  31. Wang, J.F.; Li, X.H.; Christakos, G.; Liao, Y.L.; Zhang, T.; Gu, X.; Zheng, X.Y. Geographical detectors-based health risk assessment and its application in the neural tube defects study of the Heshun Region, China. Int. J. Geogr. Inf. Sci. 2010, 24, 107–127. [Google Scholar] [CrossRef] [Scilit]
  32. Sun, J.; Tang, D.; Kong, H.; Boamah, V. Impact of Industrial Structure Upgrading on Green Total Factor Productivity in the Yangtze River Economic Belt. Int. J. Environ. Res. Public Health 2022, 19, 3718. [Google Scholar] [CrossRef] [Scilit] [PubMed]
Figure 1. Geographical location of the study area.
Land 15 01375 g001
Figure 2. Temporal changes in GTFP and its decomposition.
Land 15 01375 g002
Figure 3. Temporal changes in the number and proportion of cities with GTFP ≥ 1.
Land 15 01375 g003
Figure 4. Trend surface variation in GTFP.
Land 15 01375 g004
Figure 5. Spatial pattern evolution of GTFP in the Yangtze River Economic Belt.
Land 15 01375 g005
Figure 6. Migration trajectory of the gravity center of GTFP in the Yangtze River Economic Belt.
Land 15 01375 g006
Figure 7. Interaction detection matrix of factors influencing GTFP.
Land 15 01375 g007
Table 1. Indicator system for measuring green total factor productivity.
CategoryIndicatorDefinitionUnit
InputCapitalTotal urban fixed-asset investment10,000 CNY
LaborNumber of employees in urban units at the end of the year10,000 persons
EnergyTotal urban electricity consumption10,000 kWh
LandUrban construction land areaKm2
WaterTotal urban water supply10,000 m3
Desirable outputGDPGDP at constant 2006 prices10,000 CNY
Urban green space areaGreen coverage area in built-up areasha
Undesirable outputWastewaterIndustrial wastewater emissions10,000 t
Exhaust gasIndustrial exhaust gas emissions10,000 t
Smoke and dustIndustrial smoke and dust emissions10,000 t
Table 2. Indicator system of driving factors used in the geographic detector analysis.
CategoryIndicatorSymbolDescription
Economic developmentGDP per capita (CNY/person)PGDPEconomic development influences green technology diffusion, industrial upgrading, and environmental governance.
Industrial upgradingShare of tertiary industry in GDP (%)INDUSA larger share of services and high-tech industries is generally associated with higher green productivity.
IndustrializationShare of secondary industry in GDP (%)INDA higher industrial share is usually accompanied by greater resource consumption and pollutant emissions.
UrbanizationShare of urban resident population (%)URBUrbanization may generate agglomeration effects, improve infrastructure, and facilitate technology diffusion, but it may also increase environmental pressure.
OpennessFDI as a share of GDP (%)OPENOpenness promotes the inflow of capital, technology, and managerial experience, but it may also induce pollution transfer.
Technological innovationR&D expenditure as a share of GDP (%)INNOVGreen technological innovation is a key driver of GTFP improvement.
Government interventionFiscal expenditure as a share of GDP (%)GOVGovernment fiscal input, planning, and policy support may influence the efficiency of green transformation.
Environmental regulationPollution charge revenueERAppropriate environmental regulation may enhance GTFP through innovation compensation, but it may also increase firms’ costs.
Energy intensityEnergy consumption per unit of GDP (tce/10,000 CNY)EIHigher energy consumption per unit of output generally indicates lower resource-use efficiency.
Human capitalYears of schoolingHCHuman capital contributes to technology absorption, green innovation, and resource allocation optimization.
Table 3. Driving factors affecting GTFP in 2007 and 2023.
FactorSymbolq Value
(2007)
Rank
(2007)
q Value
(2023)
Rank
(2023)
Economic developmentPGDP0.214 ***20.287 ***2
Industrial upgradingINDUS0.176 **50.241 ***5
IndustrializationIND0.153 **70.118 **10
UrbanizationURB0.185 **40.229 ***6
OpennessOPEN0.097 ***100.156 **9
Technological innovationINNOV0.201 ***30.315 ***1
Government interventionGOV0.129 **90.173 **8
Environmental regulationER0.142 **80.208 ***7
Energy intensityEI0.233 ***10.261 ***3
Human capitalHC0.168 **60.247 ***4
*** and ** denote significance at the 1% and 5% levels, respectively.
Disclaimer/Publisher’s Note: The statements, opinions and data contained in all publications are solely those of the individual author(s) and contributor(s) and not of MDPI and/or the editor(s). MDPI and/or the editor(s) disclaim responsibility for any injury to people or property resulting from any ideas, methods, instructions or products referred to in the content.