Article

Sustainable Development Goal 11 and National Physical Plan Thrust 2 in Focus: Studying a Decade of Land Use and Land Cover Change in Penang Island, Malaysia, Using SPOT 6 and SPOT 7 Satellite Imagery

by
Nur Faziera Yaakub
1,
Mohd Hasmadi Ismail
1,* and
Azita Ahmad Zawawi
2
1
Department of Forestry Science and Biodiversity, Faculty of Forestry and Environment, Universiti Putra Malaysia (UPM), Serdang 43400, Selangor, Malaysia
2
Department of Recreation and Ecotourism, Faculty of Forestry and Environment, Universiti Putra Malaysia (UPM), Serdang 43400, Selangor, Malaysia
*
Author to whom correspondence should be addressed.
Land 2026, 15(8), 1355; https://doi.org/10.3390/land15081355
Submission received: 21 June 2026 / Revised: 5 July 2026 / Accepted: 7 July 2026 / Published: 28 July 2026

Abstract

Urbanization profoundly influences social, economic, and environmental systems, imposing a comprehensive understanding of spatial and temporal land use and land cover (LULC) transformations. This study aims to quantify the LULC changes from 2014 to 2023 in Penang Island, Malaysia, using SPOT 6 and SPOT 7 satellite imagery with a 1.5 m spatial resolution. After preprocessing and transforming data, five LULC classes—namely built-up, forest, water bodies, agriculture and horticulture, and barren land—were classified. The Support Vector Machine (SVM) classifier achieved accuracies of 90.8% in 2014, 91% in 2019, and 94.2% in 2023, with kappa coefficients of 0.85, 0.84, and 0.9, respectively. Analysis at the district level revealed that built-up area decreased by 4.53 km2, forest expanded by 10.32 km2, water bodies grew by 0.26 km2, agriculture and horticulture increased by 8.47 km2, and barren land declined by 11.84 km2. Interestingly, the decline in built-up areas presents a paradox to the conventional narrative of urban growth, which typically anticipates an increase in developed land over time. This counterintuitive trend invites further inquiry into factors that may have driven such a reversal in urbanization patterns. Nevertheless, the findings align with SDG 11 and the NPP, which advocate for sustainable and resilient urban development.

1. Introduction

Urbanization is a major global trend of the 21st century, driving significant changes in landscapes, economies, and societies [1,2,3]. As people migrate to urban centres in pursuit of better opportunities, cities grow and spread, triggering profound land use and land cover (LULC) transformations that reshape the landscape and leave lasting environmental scars [4]. While urban growth supports economic and social development, it also presents major challenges. Therefore, understanding the spatial and temporal patterns of LULC change is crucial, especially in rapidly developing areas.
On the global scale, the 11th Sustainable Development Goal (SDG 11) emphasizes the importance of making cities inclusive, safe, resilient, and sustainable [5]. Koch and Krellenberg [6] stressed the need to contextualize SDG 11 using locally relevant indicators, while Allan et al. [7] highlighted climate-adaptive urban infrastructure as central to achieving its targets. Nabiyeva et al. [8] further showed that cities integrating land use monitoring into planning processes are more likely to succeed in balancing urban expansion with sustainability goals. At the national scale, Malaysia operationalizes sustainable urban planning through the National Physical Plan (NPP).
The NPP is Malaysia’s strategic blueprint for development, integrating economic, social, and sectoral policies into spatial planning. NPP Thrust 2 focuses on Spatial Sustainability and Climate Change, promoting holistic land use planning, sustainable resource management, and progress toward a carbon-neutral nation [9,10]. It emphasizes balancing urban growth with environmental stewardship to ensure inclusive and sustainable development.
Despite increasing attention to LULC change in Malaysia and Southeast Asia, several critical gaps remain. First, most studies have emphasized descriptive mapping without explicitly linking the findings to policy frameworks, revealing a clear conceptual and policy gap and resulting in a persistent science–policy disconnect. Second, long-term analyses of urbanization patterns are often conducted using coarse-resolution data (10–30 m), which overlook fine-scale changes and localized dynamics, indicating a significant methodological gap. Third, Penang Island has typically been studied as a single entity, without comparative insights between the Northeast and Southwest Districts, highlighting a clear geographical and spatial gap. Finally, urbanization in constrained island environments remains poorly understood, as existing models largely assume outward expansion, whereas Penang illustrates alternative pathways of vertical growth, infill development, and mixed land use, pointing to an important conceptual and modelling gap.
This study is theoretically grounded in three complementary frameworks of urban land change. Differential Urbanization Theory [11] posits that cities evolve through distinct phases, ranging from initial outward expansion to consolidation, densification, and internal restructuring. Compact City Theory [12,13] emphasizes efficient land use, mixed land use integration, and infill development as key characteristics of sustainable urban form. Land System Science [14,15] further situates LULC change within a social–ecological system, recognising that changes in spatial configuration, patch connectivity, and landscape fragmentation can influence ecosystem services and urban governance.
Together, these frameworks enable the study to move beyond descriptive mapping towards a theoretically coherent explanation of observed spatial patterns and their implications for sustainable urban development under SDG 11 and NPP Thrust 2. This explains why the two policy frameworks are explicitly emphasized in the title, as they provide the guiding context for interpreting the findings and situating the study’s relevance within sustainable urban development discourses.
This study centres on Penang Island, known for its dynamic economy, diverse population, and cultural heritage [16,17,18]. However, rapid urban expansion poses challenges to its environmental sustainability. Given its limited land area, understanding how urban growth affects LULC is critical. Accordingly, this study aims to quantify LULC changes from 2014 to 2023 in Penang Island, Malaysia. The paper examines a decade of LULC change and assesses its implications for sustainable urban development. Therefore, the added value of this study lies less in methodological innovation and more in providing unique empirical evidence that strengthens the policy relevance of LULC research in Malaysia.

2. Materials and Methods

2.1. Study Area

Penang Island, located at 5.20° N–5.50° N latitude and 100.18° E–100.43° E longitude, has a tropical climate that shapes its ecosystems, biodiversity, and land use, which are key elements in urban and environmental research. Its rapid urbanization alongside rich ecological diversity makes it a focal point for development and sustainability studies. The island comprises two main districts: Northeast and Southwest Penang Island. These districts display contrasting LULC changes and urban growth patterns.
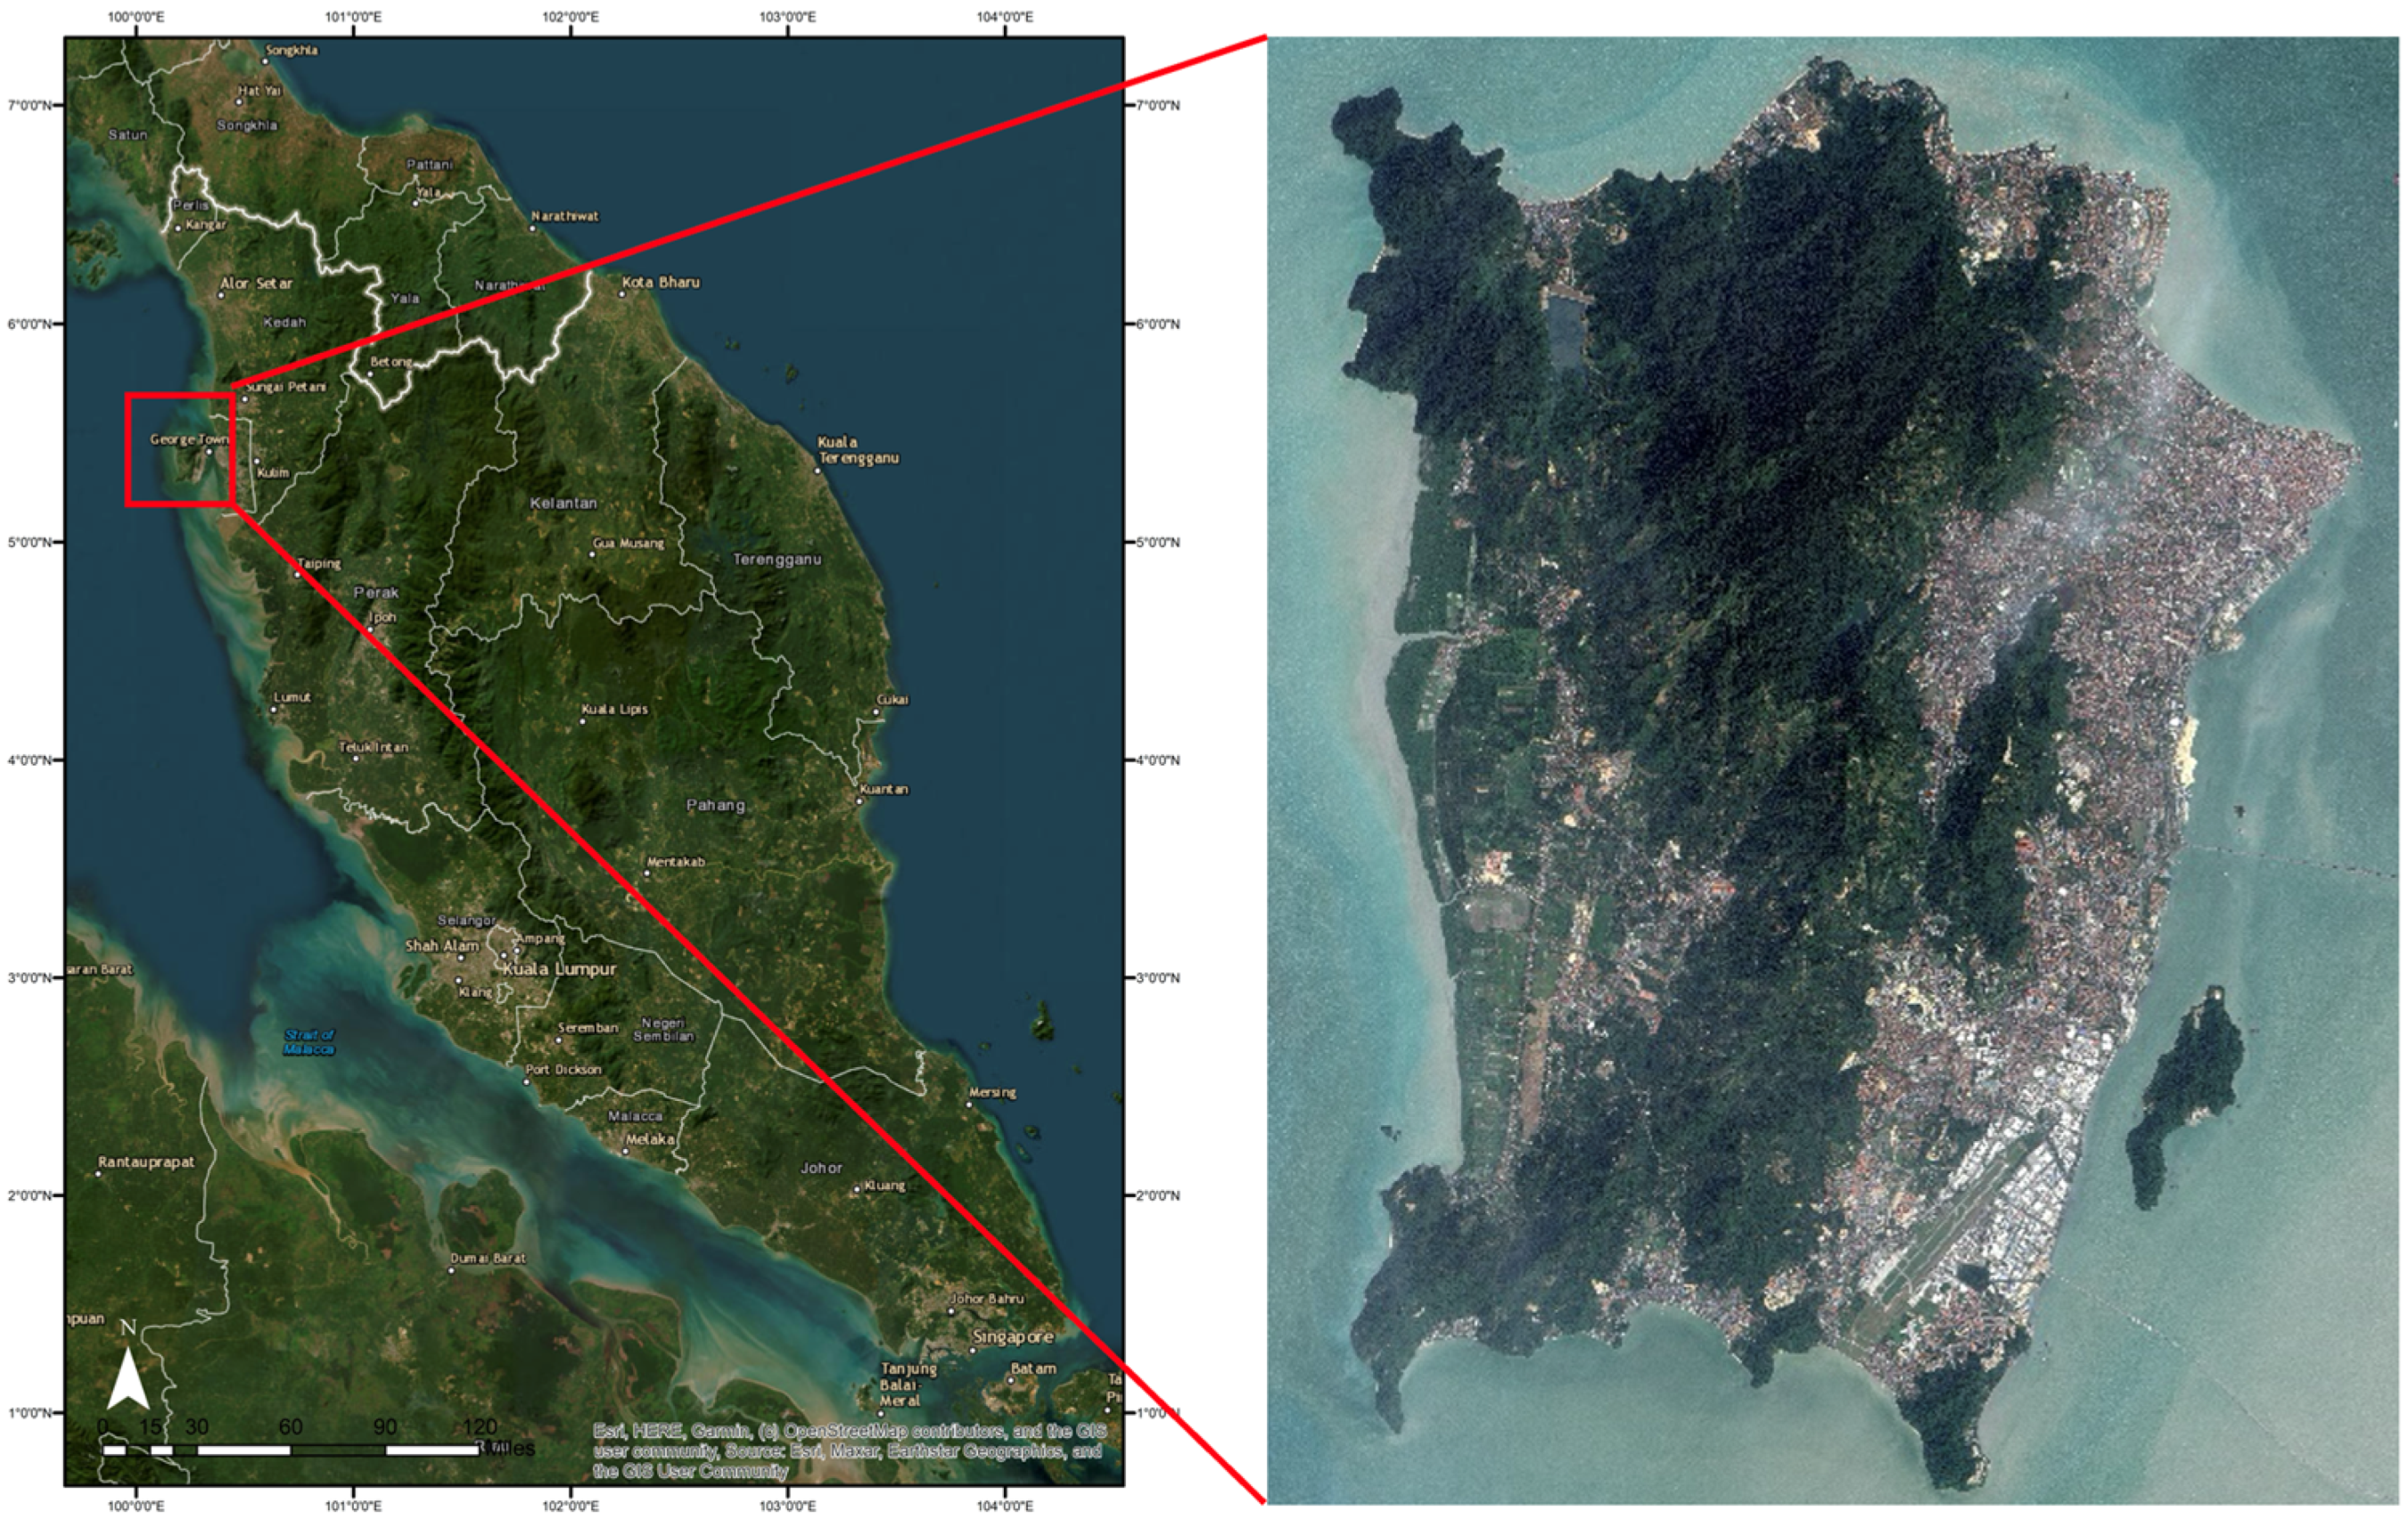
Covering about 298 km2, Penang Island features varied topography, including hills, lowlands, and coastal areas. The northeast, where Georgetown is located, is densely populated and urbanized [19,20], while the south remains largely rural, with forests and agricultural lands [21]. Figure 1 shows the map of Penang Island, Malaysia.

2.2. Primary Data

The primary data source was raster imagery from the Malaysian Space Agency (MYSA) [23] in JPEG 2000 (JP2) format, which offers efficient compression for easier storage and processing [24]. It is suitable for SPOT 6 and SPOT 7 imagery and supports direct use without decompression [25]. Two formats are available: Optimized (lossy, 3.5 bits per pixel) for fast sharing with minor distortions, and Regular (lossless, 8 bits per pixel) for high-precision analysis [24]. For this study, satellite images of 2014, 2019, and 2023 were provided in JPEG 2000 Regular format to ensure accuracy in post-processing.
SPOT 6 images were used for the 2014 and 2023 datasets, while SPOT 7 imagery was selected for the mid-term year (2019) due to its superior image quality and 0% cloud cover, which ensured high classification accuracy. This selection minimized atmospheric distortions and improved consistency in land cover interpretation across the study period. Table 1 presents details of the SPOT 6 and SPOT 7 raster datasets, including sensor specifications, spectral bands, radiometric resolutions, as well as image acquisition dates.

2.3. Ancillary Data

The ancillary data comprised vector data for Penang Island from 2014, 2019, and 2023. Originally divided into 12 land use classes, the data were reclassified into five classes to align with the raster dataset. This ensured consistency and enabled accurate comparative analysis, enhancing the efficiency of land use change detection and understanding of spatial development patterns. Additionally, the vector data served as both the boundary reference and ancillary information to support in cross-checking the classification results, thereby improving the reliability of the interpretation.

2.4. Methodological Approach

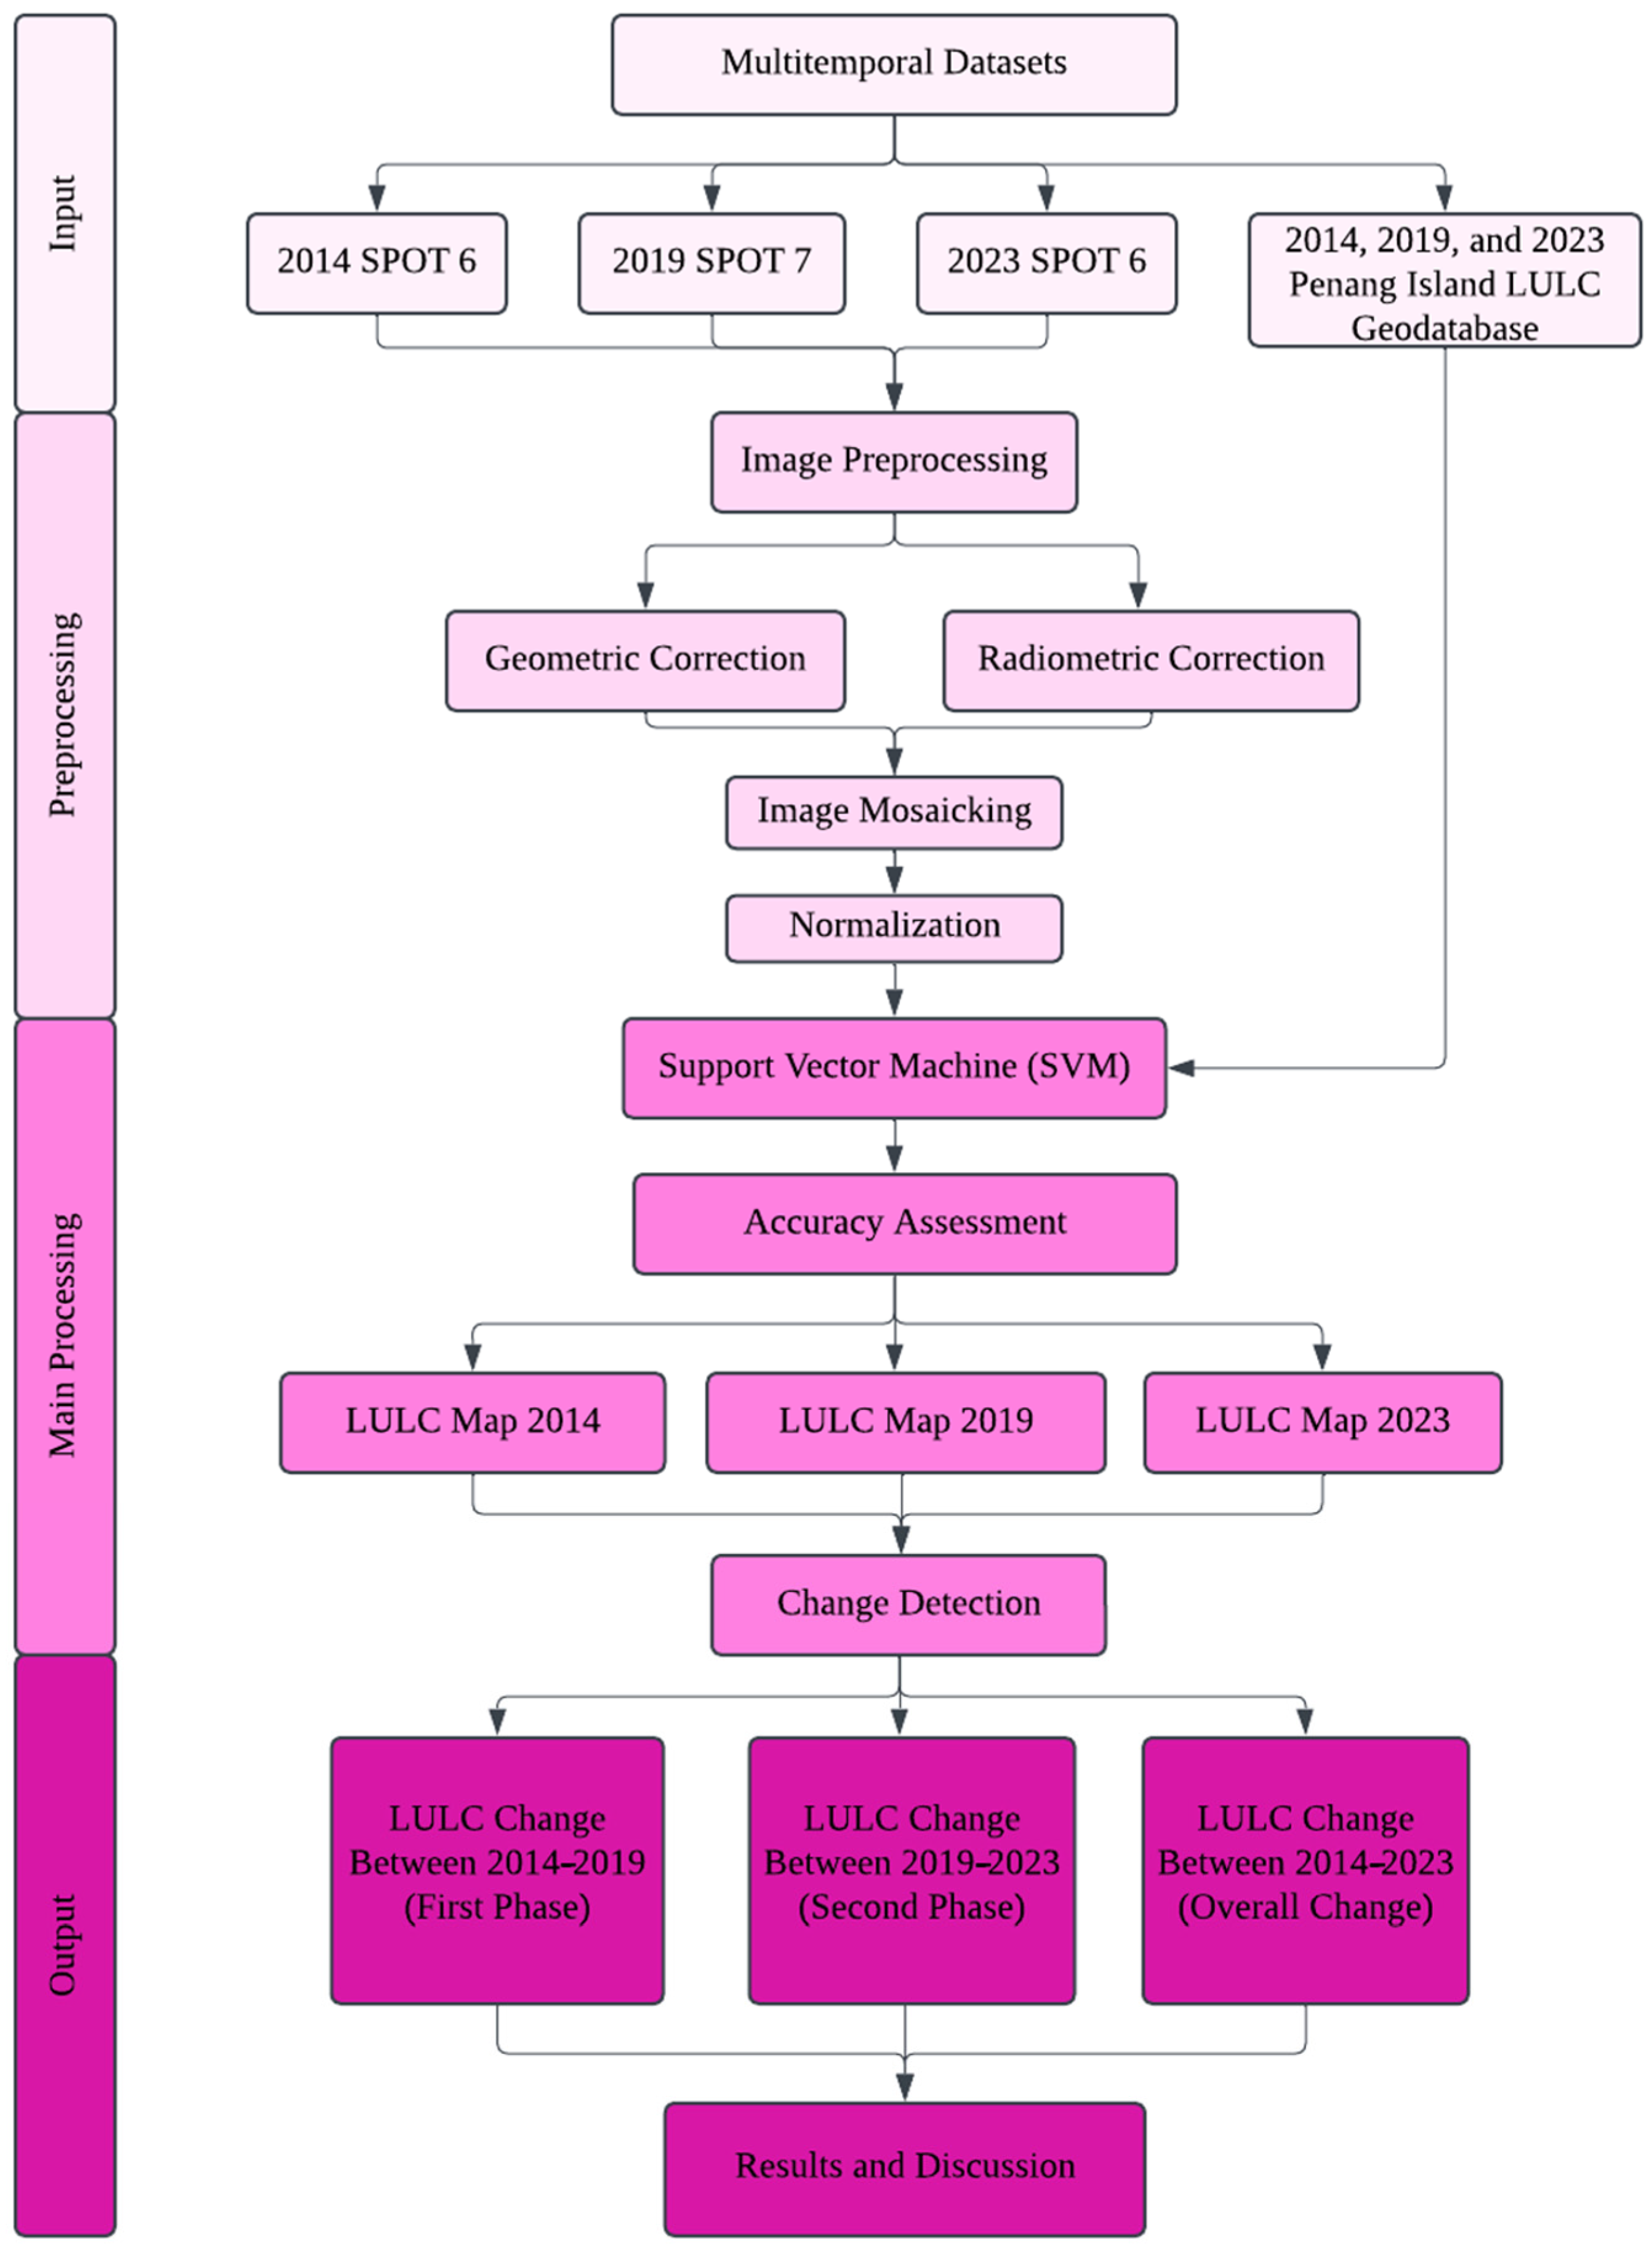
This study utilizes ArcGIS 10.6.1, ArcGIS Pro 3.5, and ERDAS IMAGINE 16.9 for image processing and data analysis, and Python 3.12 (NumPy 2.2.2, SciPy 1.15.1, OpenCV 4.11.0.86, Pillow 11.1.0) for landscape-metric computation and spatial change-detection analysis. The integration of RS and GIS technologies facilitates change detection analysis, offering advanced tools to assess spatial dynamics and transformations effectively. Each software package plays a distinct role in handling both raster and vector data, ensuring a thorough and detailed analytical process. Specifically, ERDAS IMAGINE was used for radiometric and geometric correction and image mosaicking during preprocessing; ArcGIS 10.6.1 and ArcGIS Pro were used for the Support Vector Machine classification and post-classification editing during the main processing stage, as well as for cartographic output; and Python (NumPy, SciPy, OpenCV, Pillow) was used for landscape-metric computation and change-detection analysis at the output stage (Figure 2).
According to Mohd Hasmadi and Kamaruzaman [26] and Carranza-García et al. [27], classification is a vital step in remote sensing research. This study categorized Penang Island’s LULC from 2014 to 2023 into five classes: built-up, forest, water bodies, agriculture and horticulture, and barren land. This classification approach is consistent with internationally recognized standards such as the FAO Land Cover Classification System [28] and the Anderson et al. [29] framework, which have been widely applied in LULC studies. Table 2 provides an overview of the LULC classification scheme adopted for the study area of Penang Island, Malaysia.
Figure 2 shows the conceptual framework for LULC change detection on Penang Island, summarizing the comprehensive workflow employed in the study. This framework is systematically divided into four key stages: input, preprocessing, main processing, and output.
The input stage outlines the collection of high-resolution satellite imagery and ancillary data, serving as foundational datasets. The preprocessing stage involves critical steps such as radiometric and geometric correction, image mosaicking, and normalization to ensure data consistency and usability. In the main processing stage, Support Vector Machine (SVM) classification is applied to extract significant conformations and identify LULC changes, a method that has been widely recognized for its effectiveness in remote sensing applications [30,31,32]. Briefly, SVM is a supervised, kernel-based classifier that identifies the optimal separating hyperplane maximizing the margin between training samples of different LULC classes in a transformed feature space; a radial basis function (RBF) kernel was used to handle the non-linear separability typical of high-resolution multispectral imagery, allowing the classifier to perform robustly even with a comparatively small number of training samples [30,31]. Finally, the output stage consolidates the results, presenting detailed maps, statistical reports, and visualizations that quantify and interpret the changes over time.
Statistical reports and analysis in this study included the computation of overall accuracy, producer’s and user’s accuracy, and the Kappa coefficient for classification validation. Additionally, descriptive statistics were used to calculate the area and percentage changes in LULC classes between 2014, 2019, and 2023, providing insights into spatiotemporal dynamics.

2.5. Landscape Metric Analysis

Landscape metric analysis was computed using a Python-based implementation (NumPy, SciPy, OpenCV) following standard formulas established in the landscape ecology literature [33]. Four class-level metrics were calculated for all five LULC classes: (i) Patch Density (PD), the number of discrete patches per 100 ha; (ii) Largest Patch Index (LPI), the percentage of total landscape area occupied by the single largest patch, serving as a proxy for spatial dominance; (iii) Edge Density (ED), total patch boundary length per hectare; and (iv) Landscape Shape Index (LSI), reflecting the departure of class geometry from a maximally compact (square) reference shape.
Raster pixel value to class mappings were independently validated against the calculated class areas, with all five classes matching within 0.25 km2 across all three years, confirming data integrity. Initial computations revealed a substantial proportion of single- and few-pixel patches, indicative of classification noise commonly associated with per-pixel classification approaches, with a median patch size of two pixels observed for several classes. To ensure ecologically meaningful patch statistics, a Minimum Mapping Unit (MMU) of 0.01 ha (100 m2) was applied as a standard post-classification noise reduction threshold. Patches smaller than this threshold were excluded from patch-based metric calculations, including PD, EED, and LSI, while total class areas remained unchanged.
The MMU corresponded to approximately 32, 40, and 36 pixels for the 2014, 2019, and 2023 rasters, respectively, reflecting differences in their native spatial resolutions of 1.79 m, 1.59 m, and 1.67 m. As planning zone boundary data for Penang Island’s six administrative zones were unavailable for this study, Shannon’s Diversity Index (SHDI) was calculated at the landscape level using the proportional area of the five LULC classes. The use of landscape-level SHDI instead of zone-based analysis is acknowledged as a study limitation and represents an avenue for future research should formal planning zone boundary data become available.

3. Results

3.1. Accuracy Assessment

Accuracy assessment was conducted to evaluate the reliability of the LULC classification for 2014, 2019, and 2023, following standard approaches widely applied in remote sensing studies [34,35]. A total of 500 reference points were selected using stratified random sampling, ensuring proper representation across built-up areas, forests, water bodies, agriculture and horticulture, and barren land. The study area was divided into distinct LULC classes, with points randomly sampled within each class, and the number of points was proportional to the area of each class.
The classification’s accuracy was sequentially evaluated using a Confusion Matrix, which compared the classified map with the ground truth data. For accessible areas, 200 ground truth points collected during field visits were used, while for inaccessible areas, 300 points were interpreted using high-resolution imagery from Google Earth Pro as reference. Key accuracy metrics, including overall accuracy, producer’s accuracy, user’s accuracy, and the Kappa coefficient, were calculated to quantify the classification’s performance. This comprehensive assessment ensured that the LULC classification was reliable and suitable for applications in land management and environmental monitoring. Table 3 presents the Confusion Matrix computed for the years 2014.
The 2014 LULC classification confusion matrix demonstrates strong classification performance in several categories, with an overall accuracy of 90.8% and a Kappa coefficient of 0.847769. The Built-up and Forest classes show high reliability, with User’s Accuracies of 94.25% and 98.21%, respectively, indicating that most pixels classified as Built-up and Forest were indeed correct. Producer’s Accuracies for these classes are also high, at 90.11% for Built-up and 91.64% for Forest, suggesting that the model effectively captured most actual Built-up and Forest areas. The Water Bodies class, while achieving a Producer’s Accuracy of 77.78%, struggled in the same way, with User’s Accuracy standing at 77.78%. Agriculture and Horticulture had moderate accuracy, with 88.89% Producer’s Accuracy and 71.11% User’s Accuracy. Barren Land performed reasonably well, with Producer’s Accuracy of 93.1% and User’s Accuracy of 77.14%, reflecting relatively accurate identification. Table 4 summarises the Confusion Matrix results obtained for the 2019 LULC classification.
In 2019, classification accuracy increased by 0.2%, achieving 91% overall accuracy with a Kappa coefficient of 0.83521. Built-up and Forest classes were again accurately classified, maintaining User’s Accuracies of 94.25% and 97.69%, respectively, indicating reliable classification for these urban and natural areas. Producer’s Accuracies for Built-up and Forest were 85.42% and 97.75%, respectively, showing the model’s effectiveness in capturing the true extent of these classes. Water Bodies saw a marked improvement in classification accuracy, with a User’s Accuracy of 93.54% and a Producer’s Accuracy of 68.88%, suggesting that the model was progressively successful in classifying pixels as Water Bodies. Agriculture and Horticulture showed moderate success, with a User’s Accuracy of 76.36% and a Producer’s Accuracy of 80%, indicating effective identification but some challenges in perfect classification. Barren Land maintained consistent performance, with 80% User’s Accuracy and Producer’s Accuracy, indicating reliable classification though slightly lower than the other main categories. Table 5 illustrates the Confusion Matrix derived from the 2023 classification assessment.
The 2023 classification results yield the highest accuracy of all years, with an overall accuracy of 94.2% and a Kappa coefficient of 0.900456, reflecting near-perfect agreement. Built-up and Forest classes continued to show excellent accuracy, with User’s Accuracies of 98.72% for Built-up and 96.75% for Forest, reflecting a high proportion of correct classifications for these key land uses. Producer’s Accuracies were similarly high at 88.51% for Built-up and 96.98% for Forest. Water Bodies achieved perfect classification in 2023, with both User’s and Producer’s Accuracies at 100%, reflecting outstanding reliability in identifying this class. Agriculture and Horticulture showed strong improvement with a User’s Accuracy of 82.18% and a Producer’s Accuracy of 93.26%, indicating that most classified pixels and actual areas for this class were correctly identified. Barren Land also showed improvement, with a User’s Accuracy of 81.25% and a Producer’s Accuracy of 76.47%, though it remained slightly lower than other classes, indicating ongoing but improved classification performance. Thus, the results show consistent accuracy for Built-up and Forest classes across all years, with significant improvement in Water Bodies classification by 2023, as well as notable enhancements in Agriculture and Horticulture classification.

3.2. LULC of Penang Island from 2014 to 2023

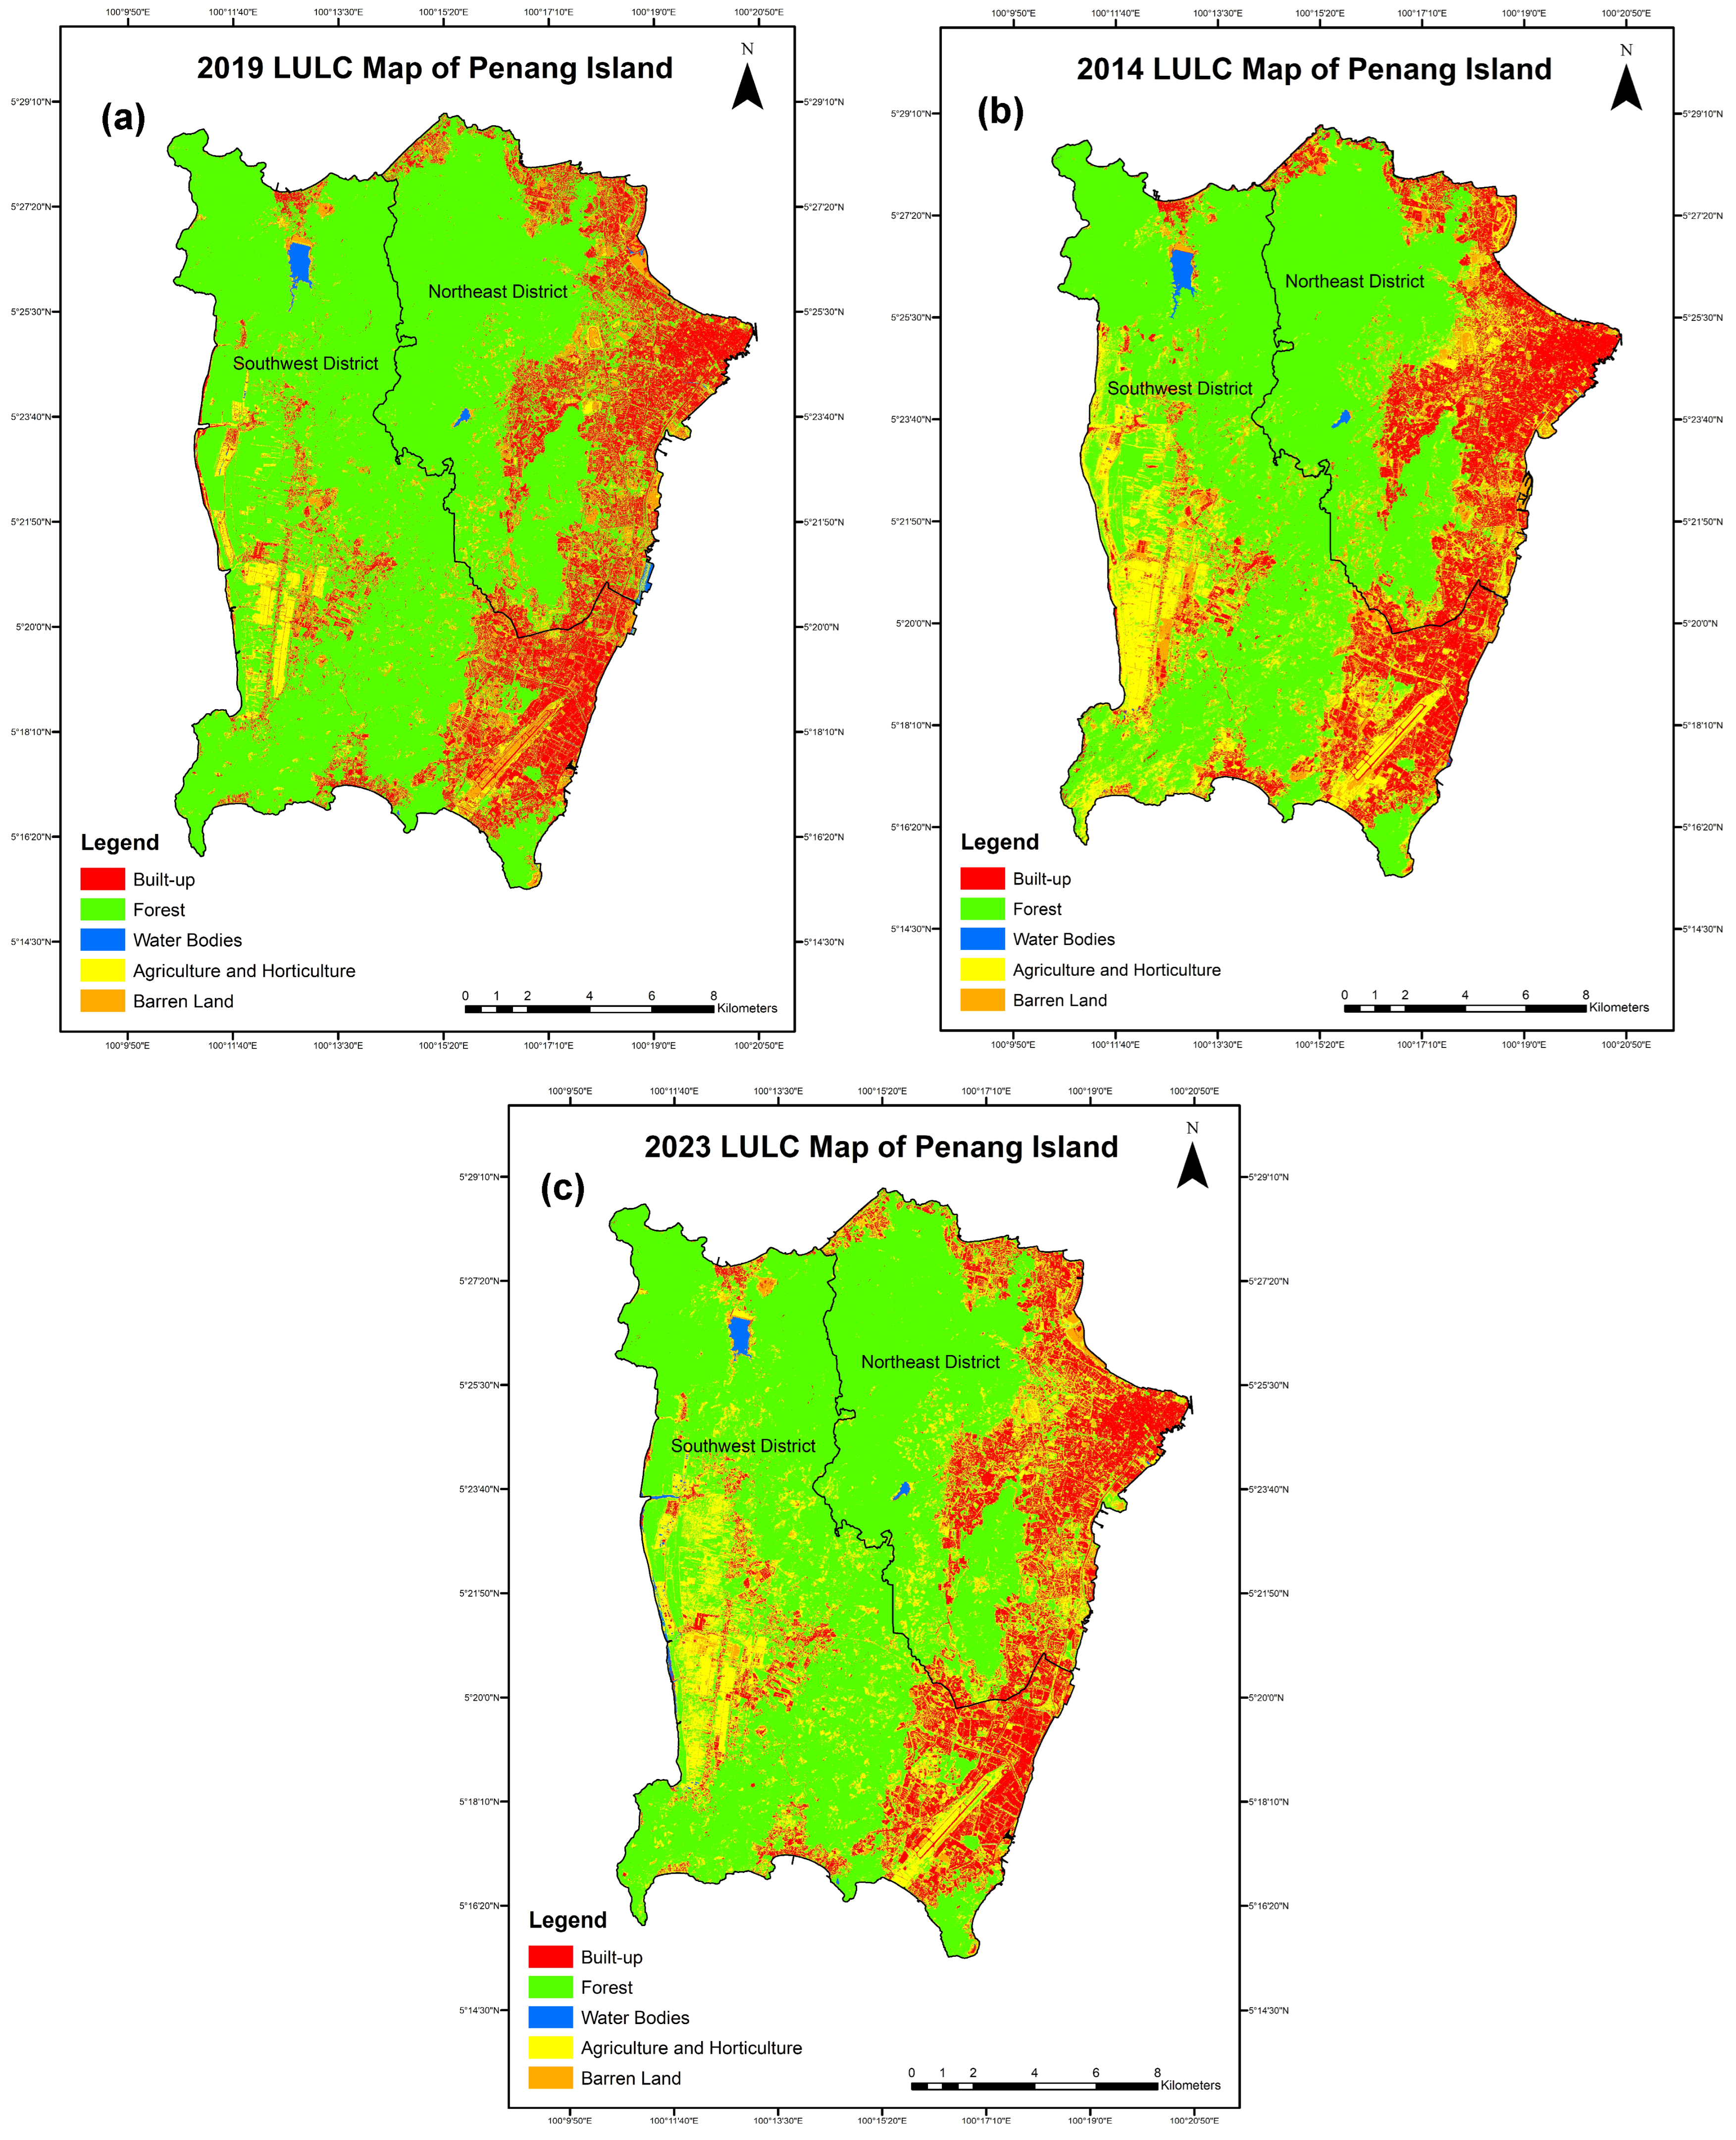
As shown in Table 6, the LULC of Penang Island in 2014 was primarily characterized by forested areas, covering 169.07 km2, which represented 56.62% of the total land area. Agricultural and horticultural lands were the second most extensive category, occupying 54.2 km2 (18.15%), followed closely by built-up areas at 52.82 km2 (17.69%). Barren lands and water bodies were the least represented, covering 21.12 km2 (7.07%) and 1.39 km2 (0.46%), respectively. This spatial distribution of LULC reflects a landscape largely shaped by natural vegetation, with forests and agricultural areas as the dominant land covers. Figure 3a geovisualizes the 2014 LULC of Penang Island.
By 2019, Penang Island showed significant changes in LULC patterns. Forest expanded to 199.51 km2 (66.09%). In contrast, agricultural and horticultural areas experienced a substantial decline, dropping to 33.52 km2 (11.1%). Built-up areas remained relatively stable, with a slight decrease to 52.23 km2 (17.3%). Barren land shrank to 15.26 km2 (5.06%), while water bodies remained largely unchanged, with a small decrease to 1.37 km2 (0.45%). Figure 3b illustrates the LULC spatial distribution of Penang Island for the year 2019.
In 2023, forested areas had decreased to 179.39 km2, making up 59.55% of the total area, while agricultural and horticultural lands expanded to 62.67 km2, representing 20.8%. Built-up areas continued to decrease, reaching 48.29 km2 (16.03%), and barren land shrank further to 9.28 km2 (3.08%). Meanwhile, water bodies increased to 1.64 km2, covering 0.55%. Figure 3c shows the spatial distribution of LULC in Penang Island for 2023.

3.3. Overall Change and Transition Matrix (2014–2023)

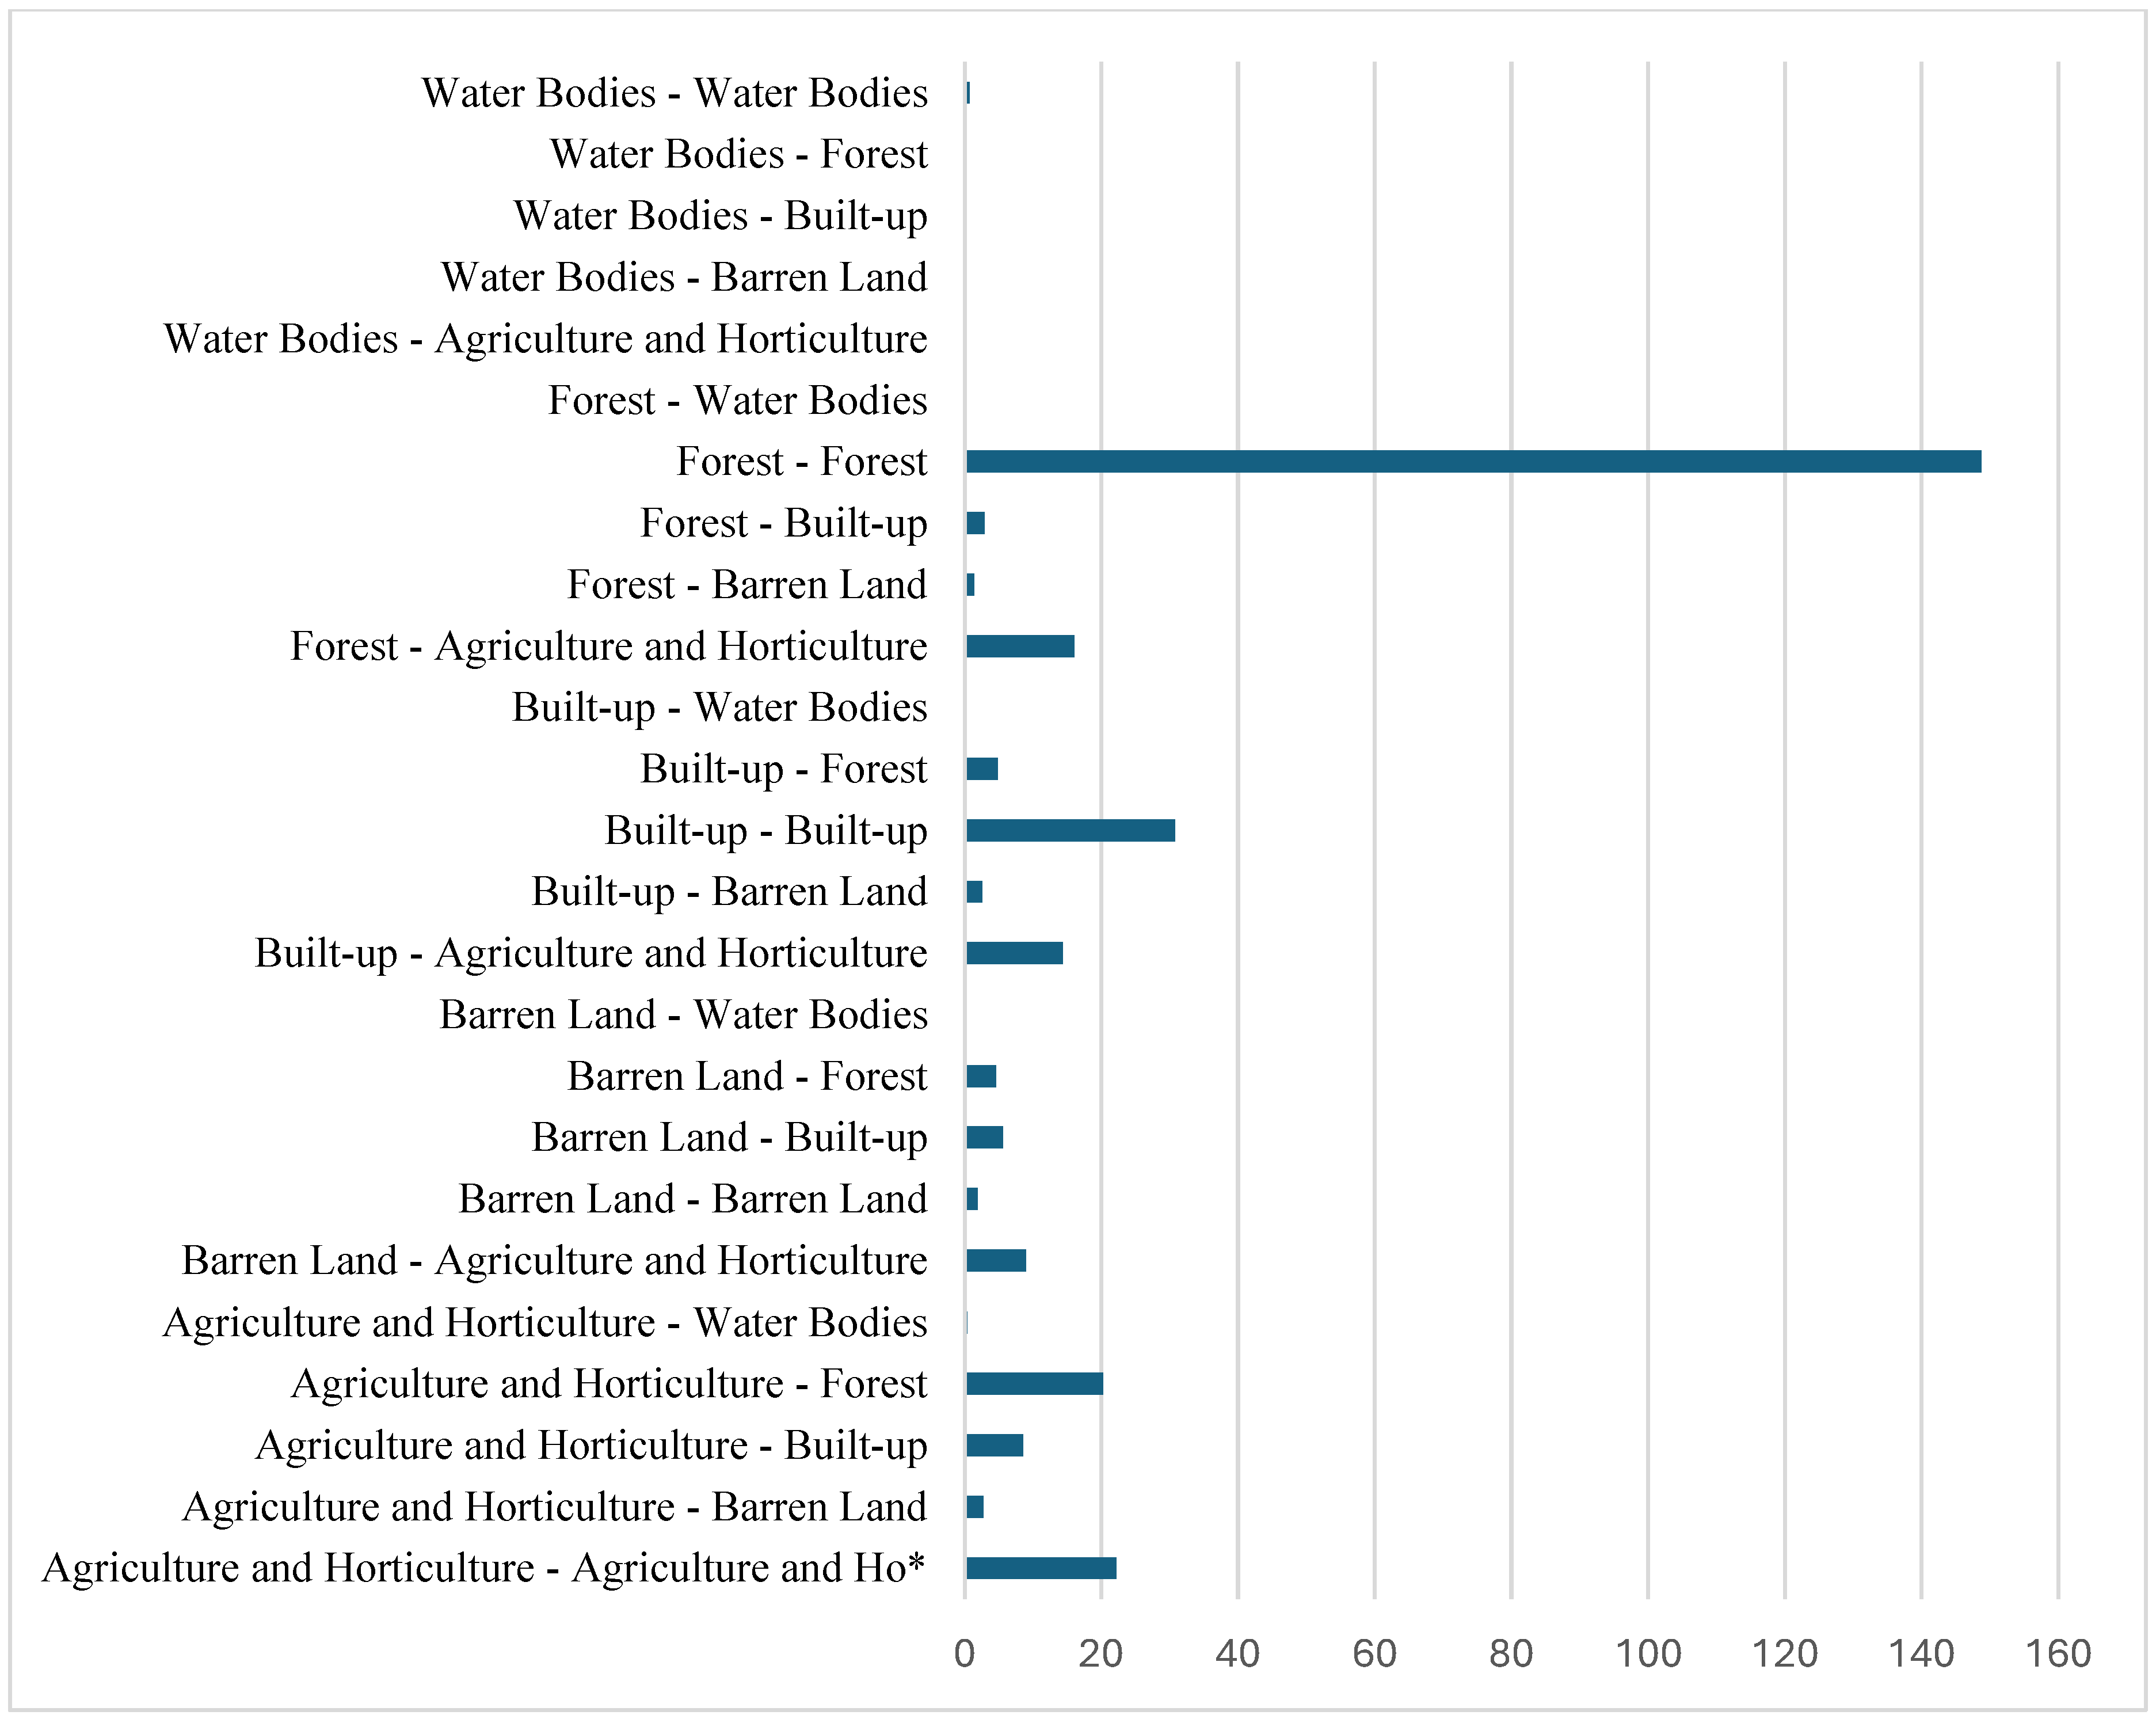
Figure 4 shows the overall change, and Table 7 presents the Transition Matrix of LULC in Penang Island from 2014 until 2023. “Forest–Forest” represents the highest transition, indicating that most of the forested land remained unchanged throughout the study period. “Built-up–Built-up” is the second-highest transition, reflecting the persistence of already-developed land for urban purposes. “Agriculture and Horticulture–Agriculture and Horticulture” ranks third, indicating continuity in agricultural land use across much of the island.
Beyond these dominant stable categories, several cross-class transitions were also recorded. “Forest–Agriculture and Horticulture” and “Agriculture and Horticulture–Forest” both occur at meaningful magnitudes, indicating bidirectional exchange between these classes. Transitions from “Barren Land–Agriculture and Horticulture” were also recorded, as were bidirectional transitions between “Built-up” and “Agriculture and Horticulture.”
The transition from built-up to agriculture and horticulture was verified through ground-truthing and high-resolution imagery checks, confirming that this transition reflects genuine land-use change rather than classification error; this shift was concentrated in small, previously underutilized urban parcels. Overall, the transition matrix shows that stability dominates within the Forest, Built-up, and Agriculture and Horticulture classes, while the most significant cross-class transitions involve exchange between forest, agriculture, and built-up land.

3.4. Landscape Metrics and Urban Compaction Indicators

Landscape metrics reveal a more nuanced spatial trajectory than area statistics alone suggest. For the built-up class, PD increased from 40.8 to 69.5 patches/100 ha between 2014 and 2019, indicating greater fragmentation despite a slight reduction in total built up area. However, PD subsequently declined to 43.7 patches/100 ha by 2023, falling below the 2014 baseline. ED exhibited a similar two-phase pattern, increasing from 236.4 to 398.4 m/ha before declining to 229.6 m/ha. In contrast, the LPI decreased consistently throughout the study period, from 5.75% in 2014 to 4.42% in 2019 and 2.52% in 2023. These results indicate that while the dominant built-up patch became progressively less prominent, the broader built-up landscape underwent a distinct spatial reorganization characterized by increased fragmentation during the first phase, followed by substantial consolidation during the second phase.
For the forest class, LPI increased from 50.45% in 2014 to 58.07% in 2019 before declining to 51.97% in 2023. This pattern provides spatial evidence that the forest loss observed during the second phase was not merely a reduction in total area but also a contraction in the relative dominance of the core forest patch. Similarly, forest PD increased from 35.5 to 49.3 patches/100 ha between 2014 and 2019 before decreasing to 27.2 patches/100 ha in 2023, while ED followed the same trajectory, increasing from 250.5 to 271.8 m/ha before declining to 215.4 m/ha. Together, these metrics suggest an initial phase of fragmentation followed by patch-level recovery, although the dominant forest core did not fully regain its previous spatial prominence after 2019.
At the landscape level, SHDI declined from 1.151 in 2014 to 0.998 in 2019 before partially recovering to 1.066 in 2023. This trend mirrors the patterns of built-up and forest classes, indicating that landscape diversity decreased during the first phase as forest cover became more dominant, then increased during the second phase as agricultural and built-up land expanded their proportional share of the landscape. Collectively, these metrics demonstrate that Penang Island’s spatial evolution over the study period is more accurately characterized as a two-phase process of fragmentation followed by consolidation rather than a uniformly compact development trajectory. This distinction is particularly relevant to NPP Thrust 2, suggesting that the objectives of compact and concentrated development were more strongly realized during the 2019 to 2023 period than across the decade as a whole.

4. Discussion

4.1. Changes in Built-Up LULC Areas

Penang Island’s built-up area contracted by a net 4.53 km2 over the study decade. It is a finding that contradicts the conventional urban growth narrative and signals a shift from expansion-driven to consolidation-driven urbanization, driven by physical constraints and emerging urban agriculture policies. When analysed spatially, both phases indicated no significant expansion of the built-up area or development in any specific direction, with urban growth remaining confined to existing boundaries. In other words, changes only take place internally. This observation aligns with the minor changes recorded in Table 6.
“Changes take place internally” refers to land use modifications occurring within existing built-up areas rather than through outward expansion. This indicates that urban growth in Penang has been accommodated through redevelopment, infill development, and vertical intensification instead of spatial sprawl. Such a pattern is strongly influenced by physical constraints, including limited flat land, extensive mountainous terrain, and overall land scarcity, which restrict horizontal growth [36]. This development approach aligns with NPP Thrust 2, which emphasizes compact and efficient urban development to optimize land resources.
Spatially, urban development has remained largely confined within established boundaries, with minimal expansion into surrounding areas. The island’s mountainous terrain covers approximately 50% of its total land area, significantly limiting developable space [37,38]. Consequently, built-up areas are heavily concentrated in the Northeast District, particularly in Georgetown, where intense land competition and constrained open spaces pose persistent planning challenges [39]. Furthermore, only 1.3% of Penang’s land is designated as open space, which is substantially below the 2030 target of 17% [40,41].
The spatial concentration of built-up land in the Northeast District reflects characteristics of the Concentric Zone Model [42], with urban activity historically radiating outward from Georgetown’s commercial core. However, Penang’s mountainous terrain interrupts this radial pattern, producing instead a polycentric form consistent with the Multiple Nuclei Model [43], wherein Georgetown functions as the administrative-commercial nucleus and Bayan Lepas as the industrial cluster in the south. More significantly, the net decline in built-up area is not anomalous when interpreted through Urban Transition Theory, as it signals a shift from expansion-driven to consolidation-driven urbanization, which means the hallmark of a maturing, land-constrained urban system.
From a Land System Science perspective, the accompanying changes in spatial configuration, fragmentation, and patch connectivity are essential to understanding the ecological and social consequences of this transformation. Evidence of this consolidation includes internal land-use restructuring, vertical densification, and the emergence of urban agriculture within established urban boundaries, all confirmed through multi-source ground validation. This trajectory aligns directly with SDG 11.3.1, which benchmarks the ratio of land consumption rate to population growth, and with NPP Thrust 2’s directive for compact and efficient urban development.
Before the adoption of the industrialization policy in the 1970s, Penang was heavily forested, and its economy was primarily based on agriculture and regional trade. Since the 1970s, Penang has experienced rapid urbanization, with its economy transitioning from a resource-based economy to one focused on trading and manufacturing. A notable increase in built-up areas occurred from 1990 to 2005 [37,44]. As a result, Penang Island now faces challenges in expanding its urban areas without causing environmental damage or encroaching on agricultural and forested lands. Consequently, the rate of new built-up areas is slowing as the land supply dwindles, leading to the introduction of land reclamation and the growth of vertical development.
A comparison between Figure 3a–c reveals that the intense red shade representing built-up area began showing yellow hues interspersed within it, indicating gradual infiltration of small agricultural and horticultural patches into the urban area. This mixing of land uses produced classification ambiguities that contributed to the minor reduction recorded in built-up area, underlining SPOT 6/7’s ability to detect small, complex pixel-level changes [24].
The reduction in built-up areas and the observed transitions from built-up land to agricultural and horticultural uses were further examined to ensure they were not attributable to classification errors. Verification was conducted using 500 stratified reference points, 200 field-validated locations, and additional cross-checking with high-resolution Google Earth imagery. The results confirmed that small pockets of land within established urban areas had been converted into urban farming plots, rooftop gardens, community farms, and temporary fallow areas. These patterns were consistently observed across all reference datasets, indicating that the detected changes represent genuine land use transitions rather than misclassification. These transformations are also associated with the implementation of the Urban Agriculture Program in Penang, which promotes the use of small urban parcels for local food production. Accordingly, the reduction in built-up areas reflects internal restructuring within existing urban boundaries rather than an actual contraction of the urban footprint.
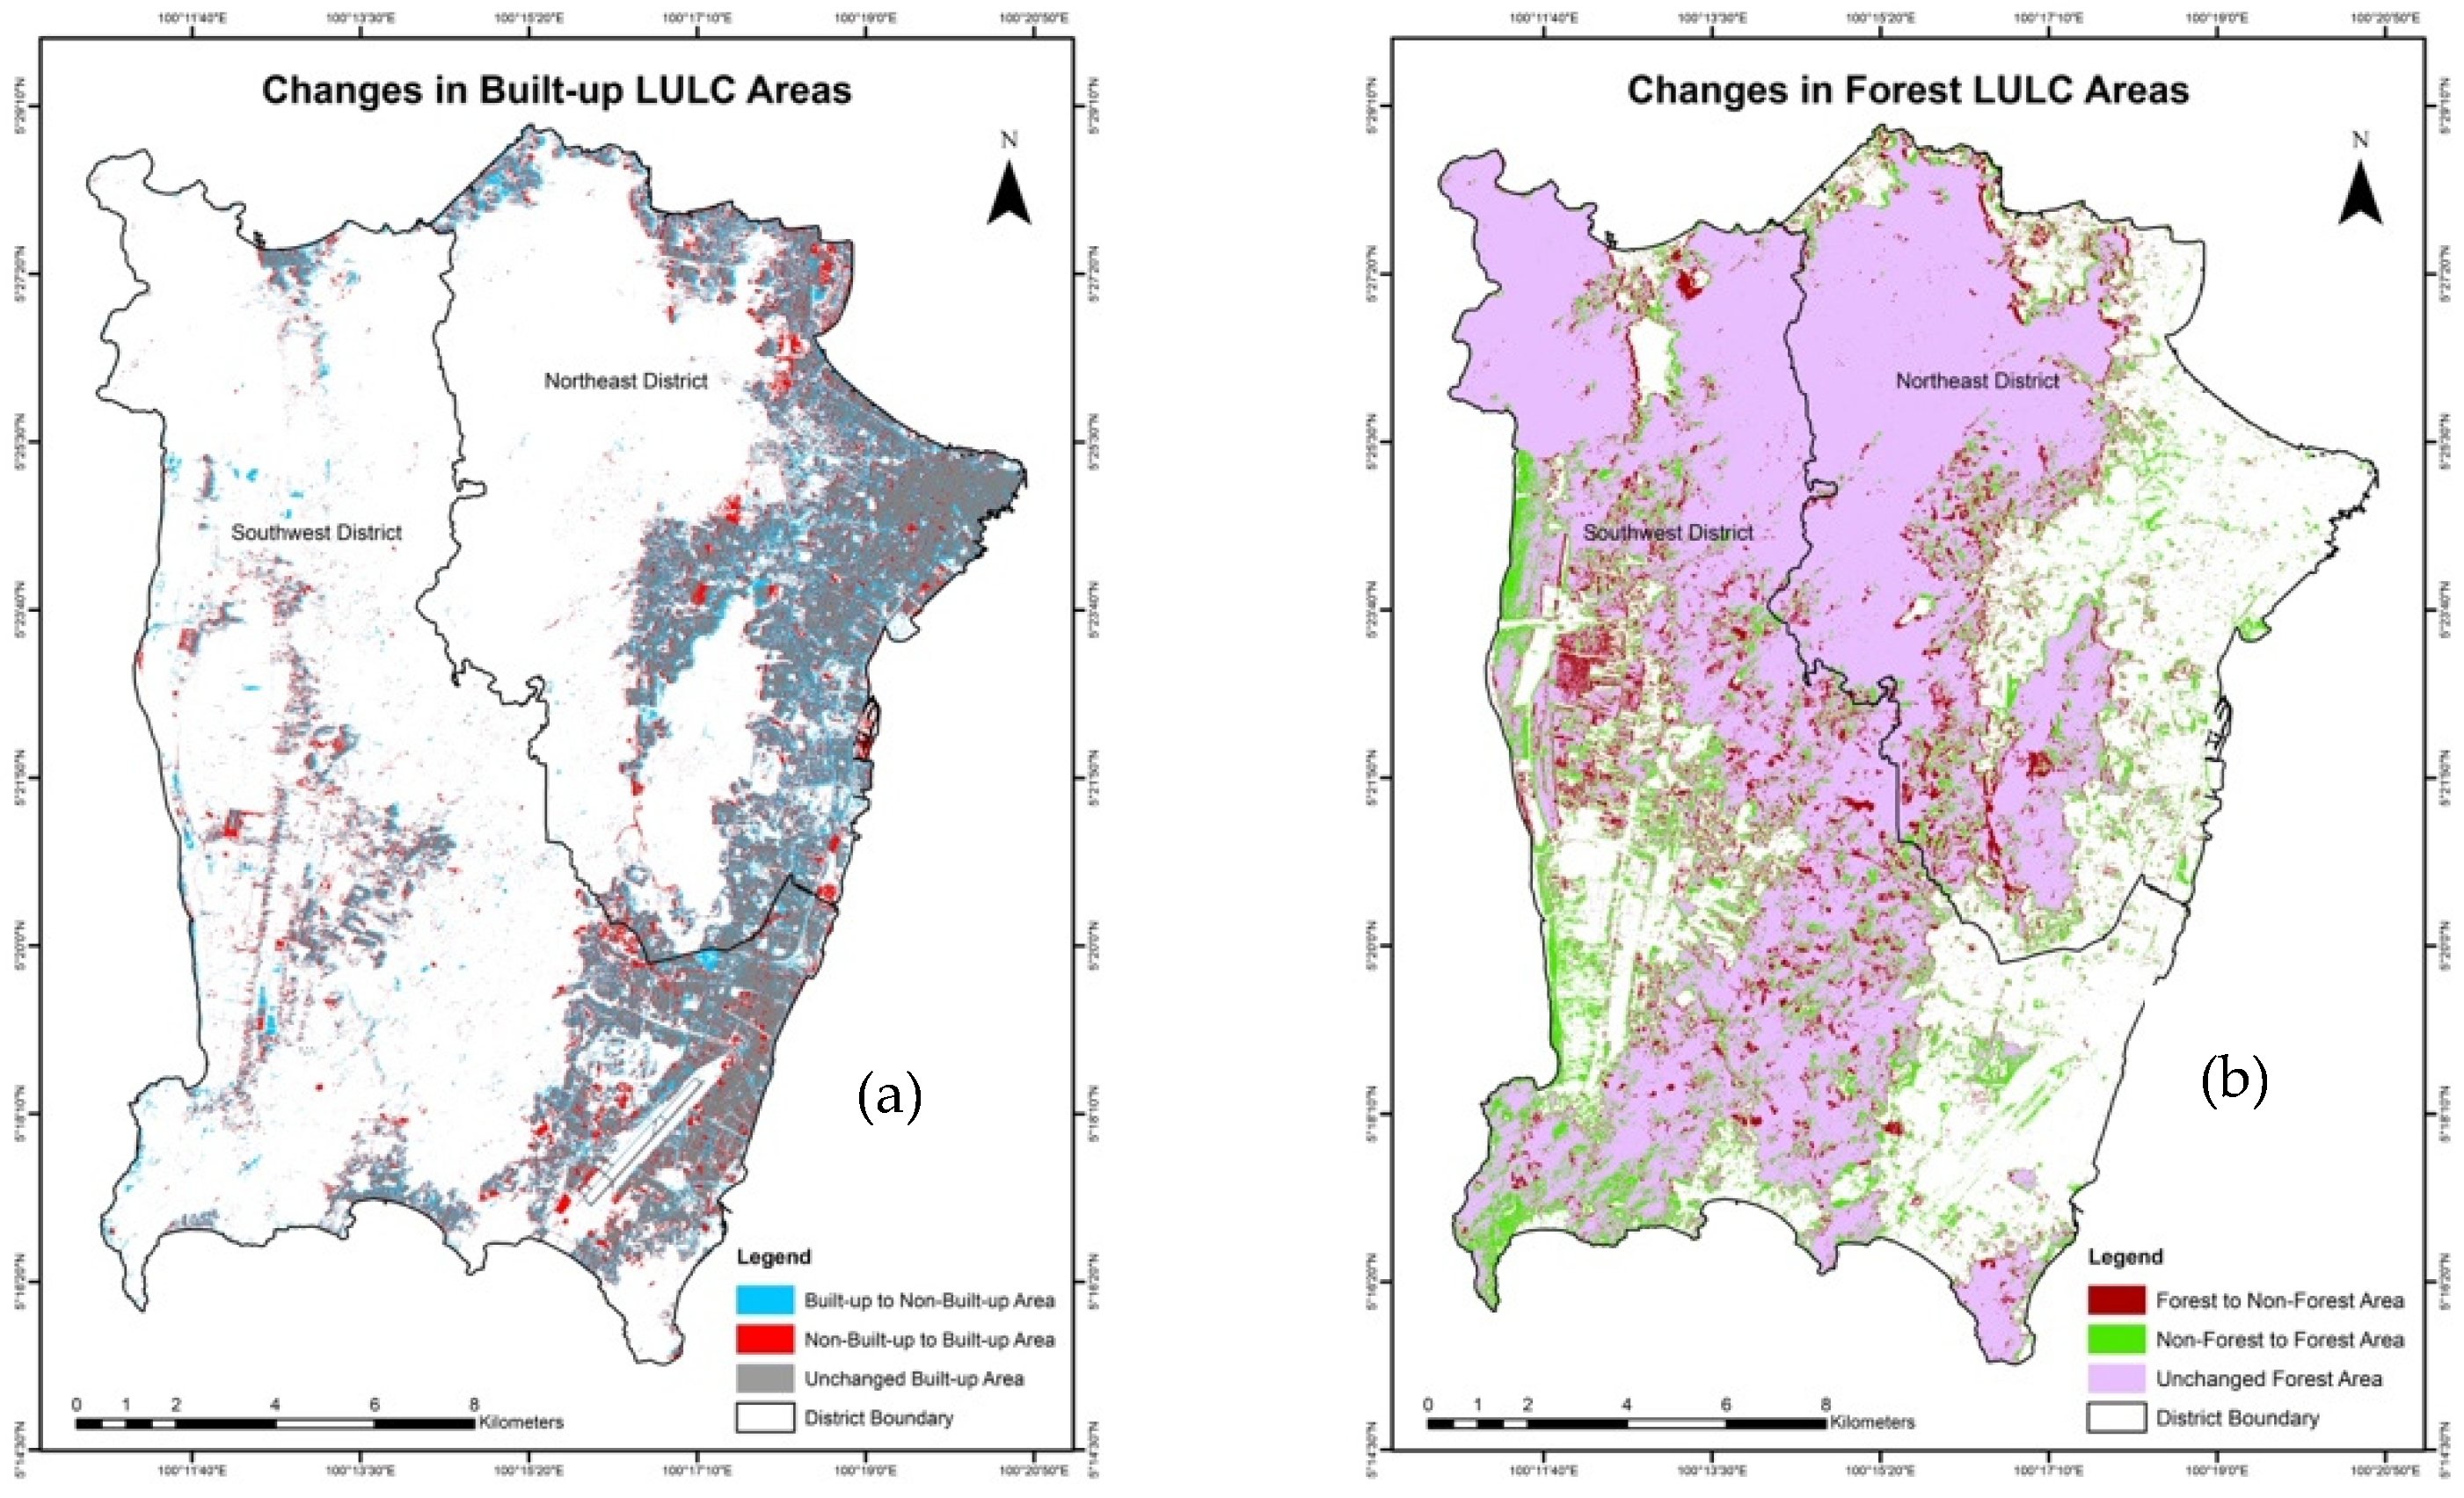
Figure 5a expounds the transition recorded in Table 6 into a map. It shows the changes in built-up areas in the Northeast and Southwest Districts between 2014 and 2023. The overall change observed between 2014 and 2023 shows a slight reduction in the built-up area on Penang Island. This suggests that the expansion of urban development has been counterbalanced by the presence of agricultural land within urban areas. If this trend persists, it could lead to a slowdown in urbanization, promoting a more balanced and sustainable development pattern for Penang Island.

Ground Validation of Built-Up Decline Patterns

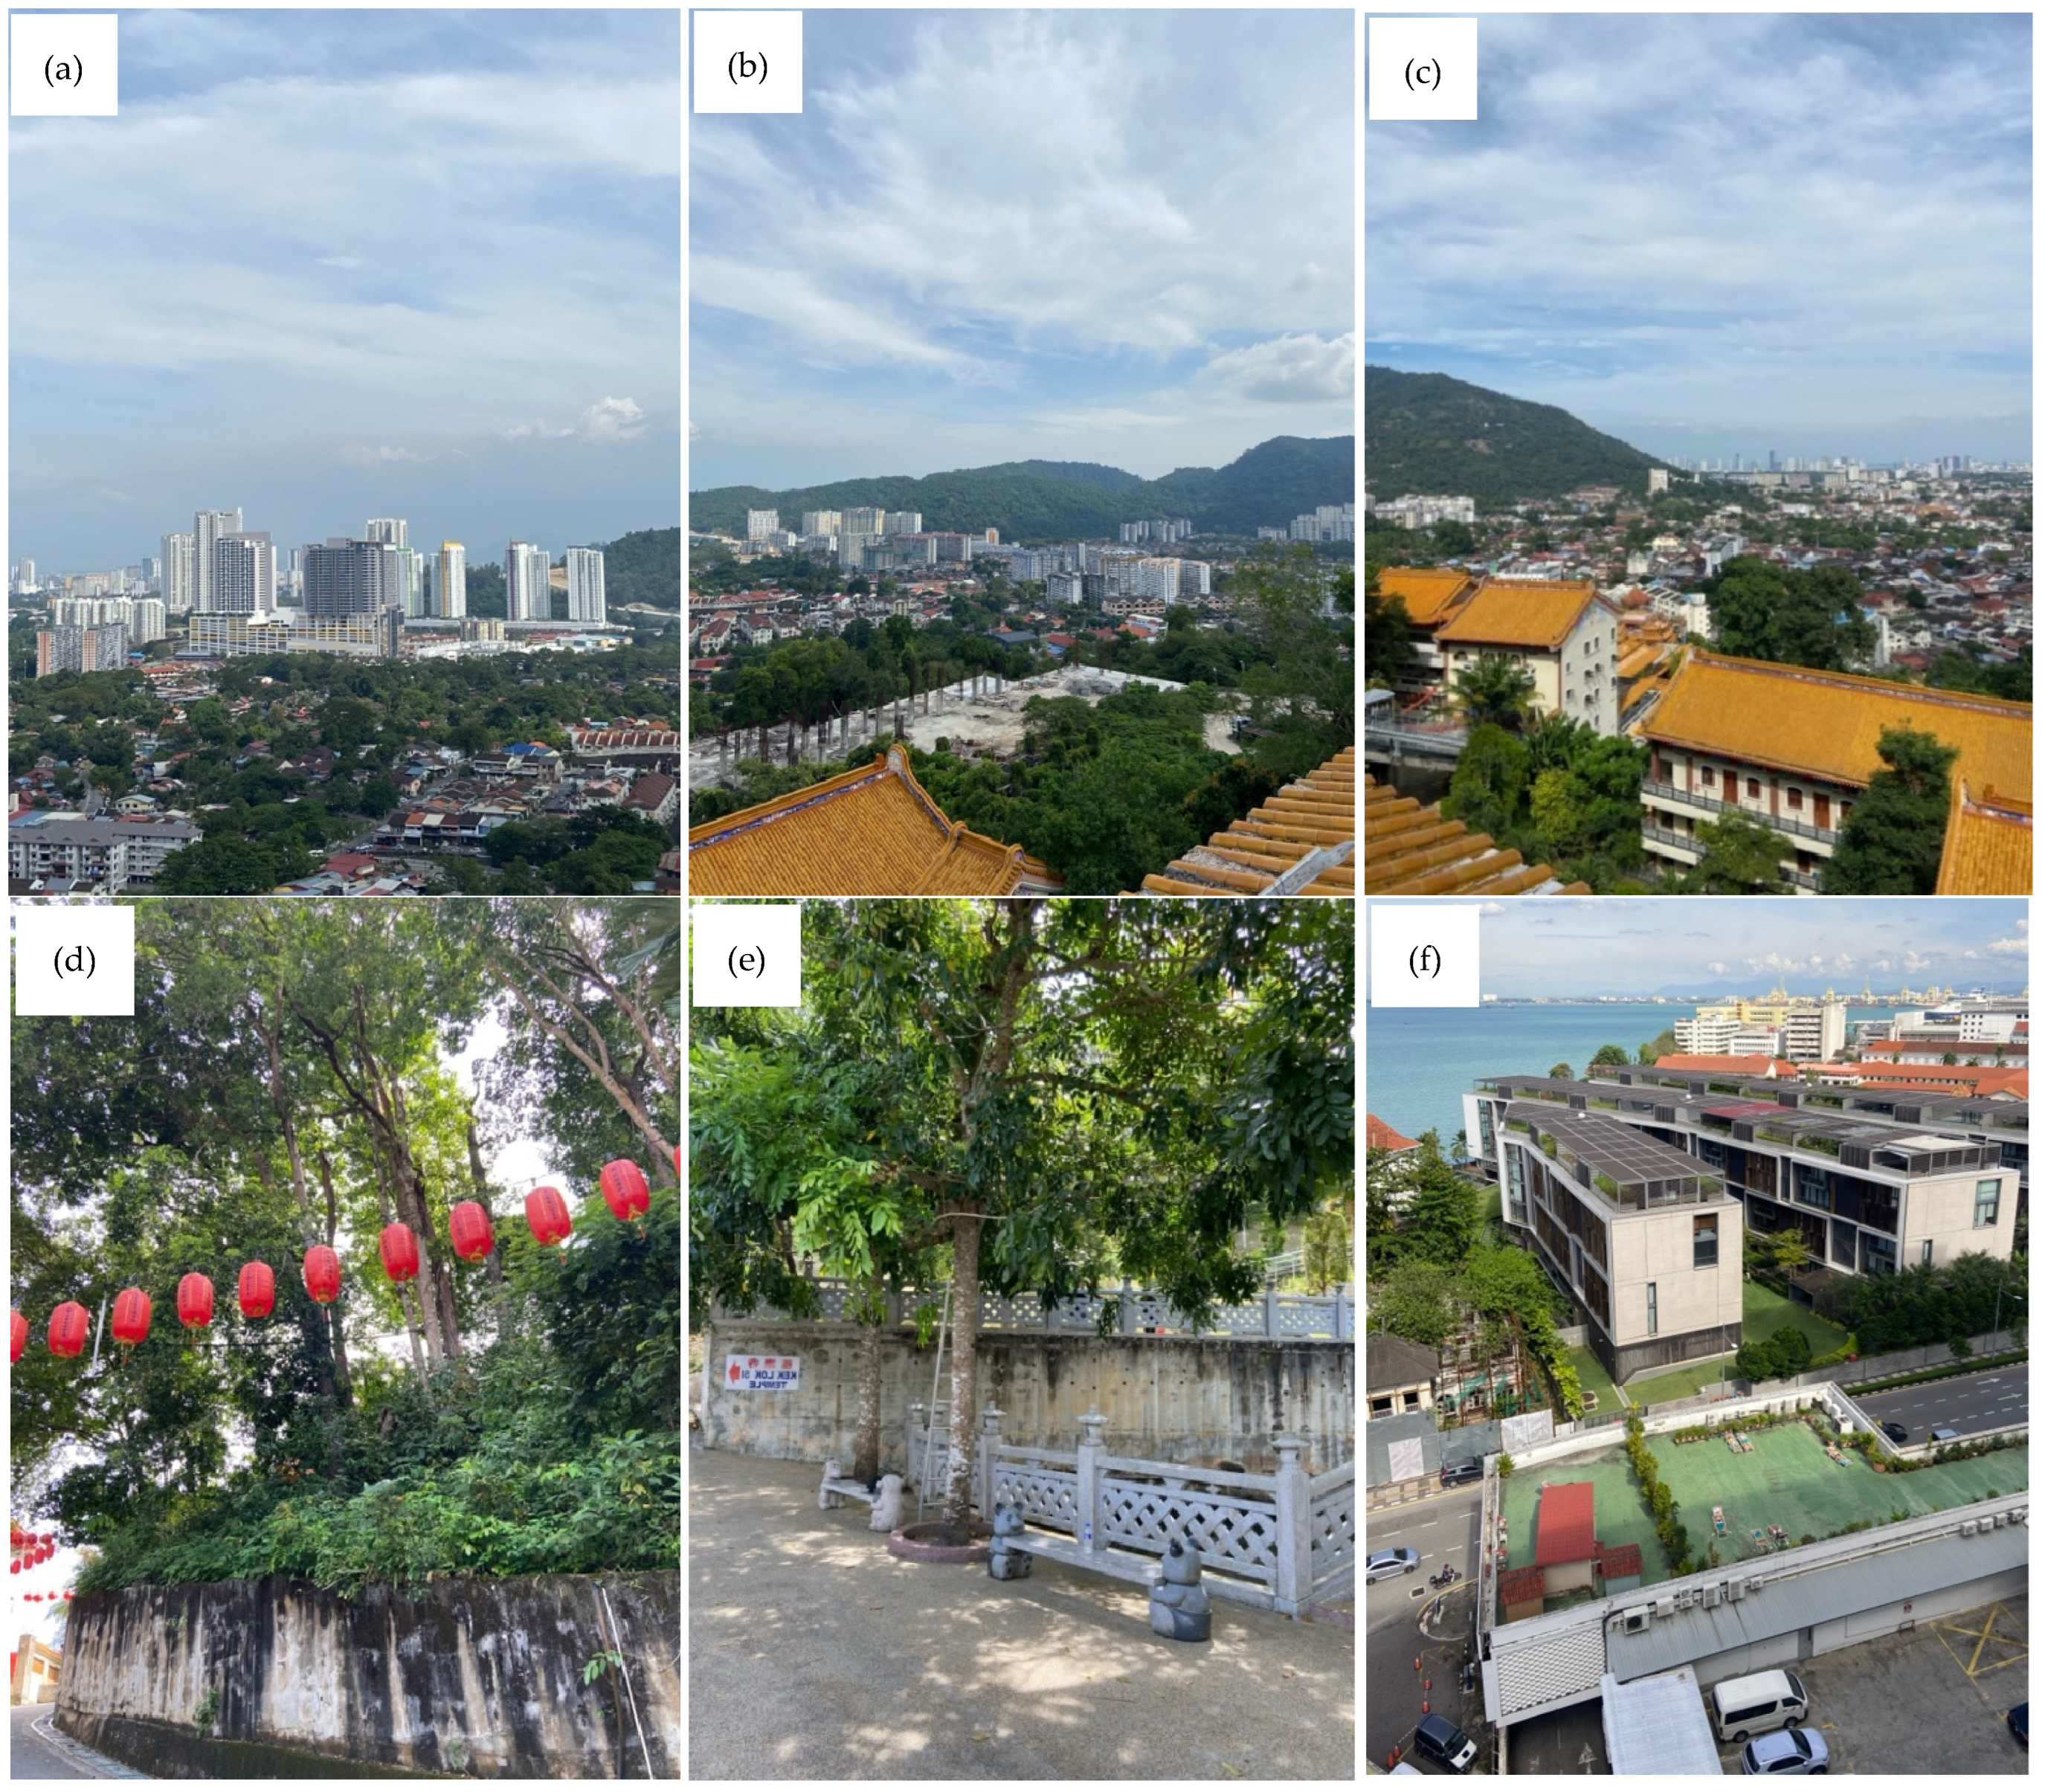
Figure 6a–f illustrates examples of the ground-truthing locations and the surrounding environmental conditions in Penang Island, supporting the validity of the observed land use conversions. Overall, the findings indicate that the reduction in built-up areas reflects internal restructuring within existing urban boundaries, resulting in a more mixed land use pattern rather than a true contraction of the urban footprint.

4.2. Changes in Forest LULC Areas

Forest dynamics exhibited a gain-then-loss trajectory, reflecting the tension between national reforestation objectives and localised development pressures. A substantial increase in forest cover during the first phase was partially offset by losses in the second phase, placing the NPP target of maintaining 50% forest cover under increasing pressure. Nevertheless, the second phase losses did not exceed the earlier gains, resulting in a net increase of 10.32 km2 (2.92%) in forest cover across the study period.
The initial increase may be due to reforestation and afforestation programs, along with national policies to maintain at least 50% of land under forest cover [45]. Sustainable Forest Management practices such as the Selective Management System (SMS) and Reduced Impact Logging (RIL) also contribute to this stability [46]. In contrast, the later decline was driven by infrastructure development, increased road access, and tourism pressure in forested hills [47,48,49]. Privately owned hill forests were more vulnerable because of weaker controls [48]. Figure 5b illustrates forest transitions. Although there was a net gain, the decline during the second phase raises concerns about future deforestation. Maintaining strict land-use policies and reforestation programs remains essential [50,51,52,53,54].
Beyond the net area changes, the transition matrix reveals substantial bidirectional exchange between forest and agricultural land, highlighting the dynamic nature of land use transitions on Penang Island. Transitions from Agriculture and Horticulture to Forest may indicate the abandonment of agricultural land, allowing natural regeneration and secondary forest succession to occur. Conversely, transitions from Forest to Agriculture and Horticulture suggest the conversion of forested areas for agricultural purposes, potentially driven by demand for agricultural production or broader land development pressures. These conversions represent direct losses of forest cover and may further intensify the pressures on forest ecosystems associated with urban expansion and infrastructure development discussed previously.
Figure 5b interprets the transition of forested areas recorded in Table 6 into a map. Medium apple indicates unchanged forest area, peacock green represents non-forest to forest area, and olivenite green signifies forest to non-forest area. The decline of forests on Penang Island during the second phase is concerning because these activities have vibrant significant environmental and socio-cultural impacts, underscoring the urgent need for sustainable management and conservation efforts to prevent further degradation.
From a Land System Science perspective, the net forest gain of 10.32 km2 represents more than a quantitative area change as it reflects the persistence of ecological connectivity within an urbanising landscape. However, the second-phase forest loss of 20.12 km2 signals increasing pressure on patch connectivity, particularly as infrastructure development expands along road corridors and into forested fringes of the Southwest District. This edge-effect dynamic is consistent with patterns documented in other tropical island ecosystems [55] and underscores that the spatial configuration of forest patches determines their ecological function. Maintaining forest patch integrity is therefore both an ecological imperative and a direct compliance requirement under NPP Thrust 2’s 50% forest cover mandate, a target now threatened by the second-phase trajectory.

4.3. Changes in Water Bodies LULC Areas

Water bodies on Penang Island occupy a relatively small area. As a result, between 2014 and 2023, only a modest gain of 0.26 km2 (0.08%) was observed. During the first phase, there was a slight loss of 0.02 km2 (0.01%), but the second phase saw a gain of 0.28 km2 (0.09%). Still, there must be underlying factors that contributed to these changes.
The early decrease was likely caused by drought and urban development [56,57], while the later increase may relate to water conservation projects and rising sea levels [57,58]. Penang has experienced higher temperatures and altered rainfall patterns, leading to water scarcity during El Niño years [56,57]. Heavy urbanization has also increased water demand and reduced natural water retention areas [59,60]. Also, Yen et al. [59] added that increased urban runoff and pollution from residential and industrial areas have consequently degraded water quality, making some water bodies unsuitable for use and contributing to their decline.
Conversely, the area of water bodies increased between 2019 and 2023. One of the factors contributing to the rise in water bodies on Penang Island during the second phase is water conservation initiatives. Efforts to manage water resources more sustainably, such as the construction of water recycling plants and rainwater harvesting systems, may lead to the creation of new water bodies [57].
Additionally, global warming has caused sea levels to rise, which can lead to coastal flooding and the formation of new water bodies in low-lying areas. This phenomenon has been observed in other parts of Malaysia and could similarly affect Penang Island [58]. For water bodies, only a small portion of the areas were detected due to an issue with the raster image’s colour representation, which caused it to be confused with some built-up areas. As a result, this misclassification led to reduced accuracy in identifying water bodies.

4.4. Changes in Agricultural and Horticultural LULC Areas

According to Table 6, agriculture and horticulture on Penang Island recorded an overall increase of 8.47 km2 (2.65%); however, this trend masks a substantial decline during the initial phase of analysis. This pattern is consistent with concerns raised by the Penang Green Council [61], which highlighted the continued loss of agricultural land as one of the sector’s most critical challenges. Similarly, Mohammad et al. [37] reported a marked reduction in agricultural land in Balik Pulau, declining from 6171.32 ha to 4727.83 ha between 1992 and 2002.
Figure 3a,b show that the initial decline occurred mainly in Balik Pulau, Southwest District. This was due to rising land values and development pressures converting farmland to non-agricultural uses, legally and illegally [61,62]. These conversions generate economic benefits but reduce farmland availability.
Climate change further pressures the sector, threatening food security [61]. Major floods in September 2017 affected over 100 locations and displaced 1000 people [63], while another severe flood in November 2017 displaced 3000 residents and affected nearly 100,000 households, with 372 mm of rain recorded overnight [64,65].
Penang also faces drought risk [57]. Between 2015 and 2020, frequent cloud-seeding operations were needed, costing up to RM27,000 each [66]. In 2016, 17 operations were carried out due to El Niño effects [67]. By April 2020, dam storage dropped to 33.3% at Air Itam and 20.9% at Teluk Bahang [68]. These events have significantly affected agriculture and contributed to its decline. In the second phase (Figure 3b,c), agricultural and horticultural areas increased, especially in the Northeast District.
Urbanization has reduced traditional farming but encouraged urban agriculture to meet food demand. This aligns with the Urban Agriculture Program (UAP) launched in 2014 to improve food security and community well-being [69,70], though challenges such as low participation and slow progress persist. Khor [71] also reported a community farm had been launched in 2015 at Kampung Bahru, Air Itam, turning a dumping site into a green space. Residents adopted vertical planting to address space limits, highlighting vertical farming as a promising solution for high-rise buildings [72]. In dense areas like Georgetown, limited space constrains green infrastructure. However, growing awareness of green benefits indicates strong interest in rooftop farming [73].
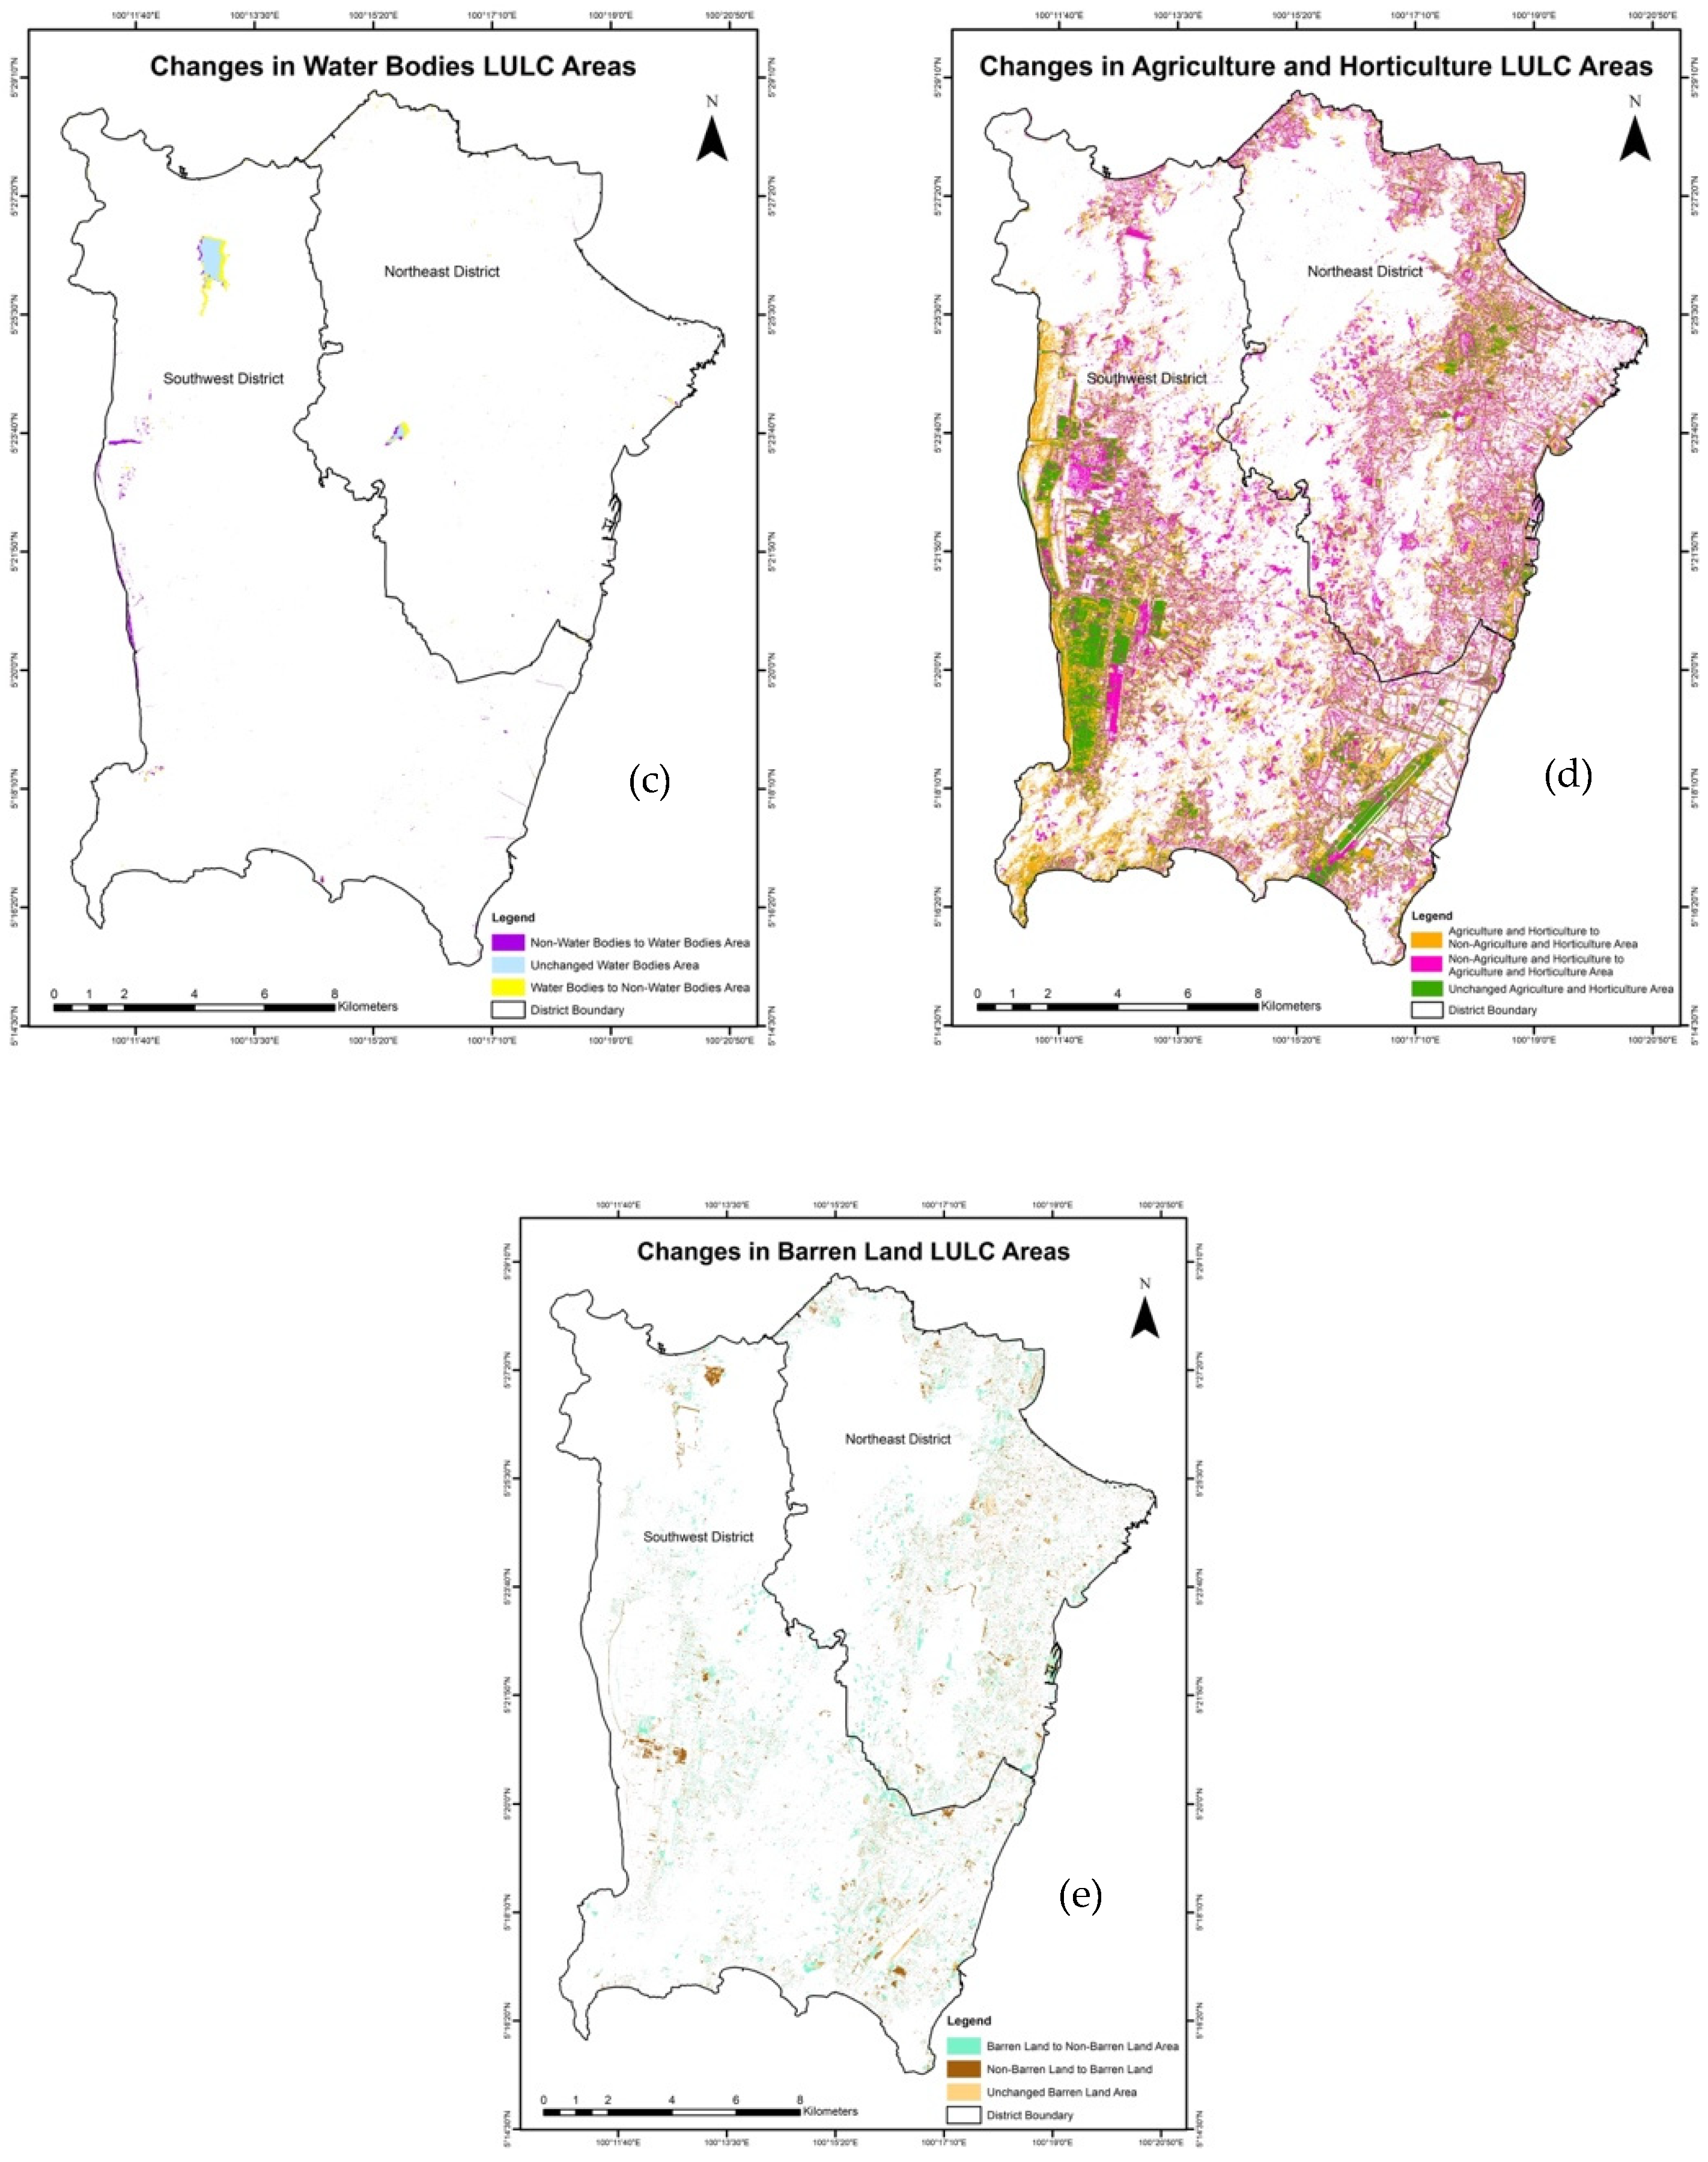
Figure 5d shows these transitions between 2014 and 2023. Overall, LULC changes reveal fluctuating agricultural trends. Sustainable urban planning and promotion of urban agriculture remain crucial to maintain ecological balance. Although agriculture is not Penang’s main economic driver, it is essential for food security and rural income.

4.5. Changes in Barren Land LULC Areas

The near-equal reduction in barren land across both study phases, amounting to 5.85 km2 (2.02%) between 2014 and 2019 and 5.99 km2 (1.98%) between 2019 and 2023, suggests a sustained and consistent land rehabilitation process rather than a short-term or episodic fluctuation. This pattern reflects progressive land conversion and restoration efforts over the decade and carries important implications for urban heat island mitigation, carbon sequestration, and broader environmental quality within Penang Island’s rapidly urbanising landscape.
Efforts to increase green cover through afforestation and reforestation have contributed to the reduction of barren land. These initiatives aim to improve carbon sequestration and mitigate urban heat island effects, leading to a decrease in barren areas [74]. In addition to conversion toward forest and built-up uses, a portion of the barren land decline is attributable to rehabilitation for agricultural purposes. The transition from Barren Land to Agriculture and Horticulture suggests active land management efforts aimed at rehabilitating degraded or underutilised areas for productive agricultural use. Although relatively limited in spatial extent, this transition represents a positive contribution to the overall land use trajectory of the island, indicating incremental improvements in land productivity and utilisation.
Economic development in Penang has increased demand for infrastructure, housing, and commercial spaces, leading to the conversion of barren land into built-up areas [37,75]. Emphasis on balanced development and sustainable land use planning has helped minimize the negative effects of urbanization. Although the overall expansion of built-up areas has declined, transitions from barren to built-up land indicate that physical development is still ongoing on Penang Island.
Moreover, coastal development and land reclamation projects have also played a significant role. Historical and current topographic maps show that land reclamation has replaced coastal swamps, mangrove forests, and other natural habitats with urbanized areas. This process has reduced the extent of barren land along the coast of Penang Island [21]. Additionally, there has been a slight increase in forested areas on the island, which contributes to the reduction of barren land. From 2010 to 2021, forest areas saw a modest increase of 1.57%. These efforts help stabilize the soil and prevent the land from becoming barren [45]. Figure 5e explains the transition of barren land recorded in Table 6 in the form of a map.

4.6. Implications of LULC Changes for SDG 11 Sub-Targets and NPP Thrust 2

SDG 11.3.1 Land Consumption Rate to Population Growth Rate LCRPGR is used to assess whether urban expansion is occurring sustainably by comparing land consumption with population growth, with values above 1.0 indicating unsustainable development. In Penang Island, the population growth rate of approximately 0.8% per annum [41] combined with a net built-up change of −4.53 km2 over the study period results in an LCRPGR value below zero, indicating that unsustainable spatial expansion has not occurred and that net densification is taking place. This pattern contrasts with most rapidly urbanising cities in Southeast Asia, where values typically exceed 1.0 and reflect outward urban sprawl.
SDG 11.7.1 on the proportion of open and green space indicates a substantial deficit in formally designated open space, which currently accounts for only 1.3% of land area [40] compared with the national target of 17% by 2030 [41]. While the expansion of urban agriculture within built-up areas provides some functional green space contribution, it does not substitute for officially designated public open space. At the same time, forest cover, which represents the island’s primary green infrastructure, increased by 10.32 km2 over the study period, offering partial ecological compensation. In this context, the formal recognition of selected urban agriculture areas as designated open space could serve as a practical policy mechanism to help bridge the existing gap.
SDG 11.b.1 on disaster risk reduction highlights the importance of aligning land use planning with Penang Island’s exposure to flooding [65] and drought [56]. In this regard, the observed reduction in barren land of 11.84 km2 and the increase in forest cover contribute to improved hydrological regulation by reducing runoff and erosion risk, while the increase in water bodies of 0.26 km2 reflects both natural hydrological processes and engineered water retention efforts. Nevertheless, the decline in forest cover during the second phase raises concerns about the long-term stability of these ecosystem-based risk buffering functions under continued development pressure.
NPP Thrust 2 spatial sustainability objectives show partial alignment with observed land use dynamics in Penang Island. Throughout the study period, forest cover remained above 56%, and urban growth was primarily characterised by intensification rather than outward sprawl, consistent with compact development principles. However, the reduction in agricultural land during the first phase and the subsequent forest loss in the second phase reveal governance and enforcement limitations, particularly in privately owned hill forests and peri-urban agricultural zones in the Southwest District. These trends underscore the need for stronger spatial planning enforcement and more targeted protection of environmentally sensitive land cover types.
Collectively, the findings yield three key policy implications for sustainable urban management in Penang and comparable island cities. First, the observed urban consolidation trend should be institutionalised in the Penang Island Local Plan by recognising vertical densification and urban agriculture as complementary land use strategies, supported by incentives to scale these practices beyond pilot sites. Second, the second-phase forest loss requires stronger governance, as current controls are insufficient for privately owned hill forests; this calls for stricter enforcement of hillside development moratoriums and mandatory biodiversity impact assessments for developments within 200 m of forest boundaries. Third, the open space deficit of 1.3% compared with the 17% national target necessitates a structured land acquisition programme, with urban agriculture serving as interim multifunctional green space while permanent parkland is developed. Operationally, a state-level SDG 11 monitoring dashboard tracking LCRPGR, open space, forest cover, and landscape compaction would strengthen policy accountability and align LULC evidence with SDG commitments and NPP Thrust 2.

5. Conclusions

In conclusion, a decade of LULC changes on Penang Island highlights the need for a more integrated and sustainable approach to urban planning on Penang Island. Stricter regulatory enforcement, the adoption of green infrastructure, and inclusive governance are essential to balancing economic development with environmental integrity and social equity.
The innovations of this research are fourfold: (i) district-level comparative analysis that uncovers the differing urbanization dynamics between Northeast and Southwest Penang Island; (ii) high-resolution, accuracy-tested classification using SPOT 6 and 7 imagery and SVM; (iii) the focus on an island context that highlights the influence of land scarcity and topography on urbanization pathways; and (iv) the transferability of the SDG 11–NPP Thrust 2 framing, which extends the applicability of the findings to other Malaysian states and rapidly urbanizing regions.
From a theoretical perspective, classical models such as the Concentric Zone Model and Multiple Nuclei Model provide useful insights into urban growth patterns, but Penang’s development trajectory does not fully conform to these frameworks. Its geographic constraints, historical land reclamation, and strong policy interventions have produced a more complex and fragmented urban form than predicted by traditional models. This underscores the need for context-specific planning approaches that go beyond conventional theories.
Importantly, the framing of this study within SDG 11 and NPP Thrust 2 explains their explicit placement in the title. The findings are not only descriptive of land use change but also evaluative in terms of how Penang Island is progressing toward global and national sustainability agendas. SDG 11 provides the international benchmark for resilient and inclusive cities, while NPP Thrust 2 articulates Malaysia’s national commitment to spatial sustainability and climate adaptation. By aligning the empirical evidence of LULC changes with these two frameworks, this research demonstrates how local land use dynamics both challenge and support broader sustainability goals.
By addressing these issues, the observed LULC changes suggest possible ways forward and provide guidance for supporting the global agenda and the national objective. In this context, effective strategies and sustainable urban planning are essential to promote resilient, inclusive, and sustainable urban environments.

Author Contributions

Conceptualization, N.F.Y. and M.H.I.; methodology, N.F.Y., M.H.I. and A.A.Z.; software, N.F.Y.; validation, N.F.Y. and M.H.I.; formal analysis, N.F.Y.; investigation, N.F.Y.; resources, N.F.Y.; data curation, N.F.Y. and M.H.I.; writing—original draft preparation, N.F.Y.; writing—review and editing, N.F.Y., M.H.I. and A.A.Z.; visualization, N.F.Y.; supervision, M.H.I. and A.A.Z.; project administration, M.H.I.; funding acquisition, M.H.I. All authors have read and agreed to the published version of the manuscript.

Funding

This research was funded by Universiti Putra Malaysia (UPM) through the research grant GP-IPS/2023/9768400. The authors extend their gratitude to the Research Management Centre (RMC), Universiti Putra Malaysia (UPM), for their financial and administrative support, which was instrumental in the successful completion of this study.

Data Availability Statement

The datasets presented in this article are not readily available because the satellite imagery is subject to data provider licensing restrictions. Requests to access the datasets should be directed to the corresponding author.

Conflicts of Interest

The authors declare no conflicts of interest.

Abbreviations

The following abbreviations are used in this manuscript:
LULCLand Use and Land Cover
SDGsSustainable Development Goals
NPPNational Physical Plan
RSRemote Sensing
GISGeographic Information System
MYSAMalaysian Space Agency
SVMSupport Vector Machine
JP2JPEG2000
SFMSustainable Forest Management
SMSSelective Management System
RILReduced Impact Logging
UAPUrban Agriculture Program
PDPatch Density
LPILargest Patch Index
EDEdge Density
LSILandscape Shape Index
MMUMinimum Mapping Unit
SHDIShannon’s Diversity Index

References

  1. Akhtar, M.Z.; Zaman, K.; Khan, M.A. The impact of governance indicators, renewable energy demand, industrialization, and travel & transportation on urbanization: A panel study of selected Asian economies. Cities 2024, 151, 103723. [Google Scholar] [CrossRef] [Scilit]
  2. Voukkali, I.; Papamichael, I.; Loizia, P.; Zorpas, A.A. Urbanization and solid waste production: Prospects and challenges. Environ. Sci. Pollut. Res. 2024, 31, 17678–17689. [Google Scholar] [CrossRef] [Scilit] [PubMed]
  3. Carlucci, M.; Salvati, L. Assessing path-dependent urban growth with geographically weighted regressions. Environ. Impact Assess. Rev. 2023, 98, 106958. [Google Scholar] [CrossRef] [Scilit]
  4. Huang, M.; Zhao, S. Tracing trajectories and co-evolution of metropolitan urbanization in the United States, Europe, and China. Sci. Total Environ. 2024, 945, 167576. [Google Scholar] [CrossRef] [Scilit]
  5. United Nations (UN). Sustainable Development Goal 11: Make Cities and Human Settlements Inclusive, Safe, Resilient, and Sustainable; United Nations: New York, NY, USA, 2021. [Google Scholar]
  6. Koch, F.; Krellenberg, K. How to contextualize SDG 11? Looking at indicators for sustainable urban development in Germany. ISPRS Int. J. Geo-Inf. 2018, 7, 464. [Google Scholar] [CrossRef] [Scilit]
  7. Allan, M.; Rajabifard, A.; Foliente, G. Climate resilient urban regeneration and SDG 11—stakeholders’ view on pathways and digital infrastructures. Int. J. Digit. Earth 2024, 17, 2385076. [Google Scholar] [CrossRef] [Scilit]
  8. Nabiyeva, G.N.; Wheeler, S.M.; London, J.K.; Brazil, N. Implementation of Sustainable Development Goal 11 (Sustainable Cities and Communities): Initial good practices data. Sustainability 2023, 15, 14810. [Google Scholar] [CrossRef] [Scilit]
  9. Ghalehteimouri, K.J.; Che Ros, F. The spatial turn in the National Physical Plan (NPP) Malaysia in comparison to Germany for better criteria identification on climate change and environmental hazards issues. Clim. Change 2020, 6, 141–155. [Google Scholar]
  10. PLANMalaysia. Rancangan Fizikal Negara: Apa itu RFN4? PLANMalaysia: Kuala Lumpur, Malaysia, 2024. [Google Scholar]
  11. Magni, P.; Smith, M.; Jacobs, H.; Murray, N. Differential urbanisation for settlement planning—A Western Cape case study. Town Reg. Plan. 2023, 82, 81–97. [Google Scholar] [CrossRef] [Scilit]
  12. Jenks, M.; Burton, E.; Williams, K. (Eds.) The Compact City: A Sustainable Urban Form? E & FN Spon: London, UK, 1996. [Google Scholar]
  13. Burton, E.; Jenks, M.; Williams, K. (Eds.) Achieving Sustainable Urban Form; E & FN Spon: London, UK, 2000. [Google Scholar]
  14. Turner, B.L.; Lambin, E.F.; Reenberg, A. The emergence of land change science for global environmental change and sustainability. Proc. Natl. Acad. Sci. USA 2007, 104, 20666–20671. [Google Scholar] [CrossRef] [Scilit] [PubMed]
  15. Lambin, E.F.; Meyfroidt, P. Global land use change, economic globalization, and the looming land scarcity. Proc. Natl. Acad. Sci. USA 2011, 108, 3465–3472. [Google Scholar] [CrossRef] [Scilit] [PubMed]
  16. Gao, G.; San, L.H.; Zhu, Y. Flood inundation analysis in Penang Island (Malaysia) based on InSAR maps of land subsidence and local sea level scenarios. Water 2021, 13, 1518. [Google Scholar] [CrossRef] [Scilit]
  17. Gin, O.K. Disparate identities: Penang from a historical perspective, 1780–1941. Kaji. Malays. 2015, 33, 27–52. [Google Scholar]
  18. Yaakub, N.F.; Ismail, M.H.; Zawawi, A.A. From Horizontal to Vertical Urban Growth: A Decade of LULC Change in Penang Island, Malaysia. In Proceedings of the Asian Conference on Remote Sensing (ACRS 2025), Makassar, Indonesia, 27–31 October 2025. [Google Scholar]
  19. Samat, N.; Mahamud, M.A.; Tan, M.L.; Maghsoodi Tilaki, M.J.; Tew, Y.L. Modelling land cover changes in peri-urban areas: A case study of George Town conurbation, Malaysia. Land 2020, 9, 373. [Google Scholar] [CrossRef] [Scilit]
  20. Yin, N.S.; Siong, H.C. The relationship between urban population density and transportation fuel consumption in Malaysian cities. Plan. Malays. 2010, 8, 45–66. [Google Scholar] [CrossRef] [Scilit]
  21. Chee, S.Y.; Othman, A.G.; Sim, Y.K.; Mat Adam, A.N.; Firth, L.B. Land reclamation and artificial islands: Walking the tightrope between development and conservation. Glob. Ecol. Conserv. 2017, 12, 80–95. [Google Scholar] [CrossRef] [Scilit]
  22. Esri. World Imagery [Basemap]; Esri: Redlands, CA, USA, 2023. [Google Scholar]
  23. Malaysian Space Agency (MYSA). SPOT 6/7 Satellite Imagery of Penang Island [Data Set]; Ministry of Science, Technology and Innovation (MOSTI): Cyberjaya, Malaysia, 2023. [Google Scholar]
  24. Airbus Defence and Space. SPOT 6/7 Imagery—User Guide; Report No. SI/DC/13034-v1.0; Airbus Defence and Space Intelligence: Toulouse, France, 2013. [Google Scholar]
  25. MicroImages, Inc. Radiometric Correction of Satellite Images; MicroImages, Inc.: Raymond, NE, USA, 2016. [Google Scholar]
  26. Mohd Hasmadi, I.; Kamaruzaman, J. Satellite data classification accuracy assessment based on reference dataset. World Acad. Sci. Eng. Technol. 2008, 2, 96–102. [Google Scholar] [CrossRef] [Scilit]
  27. Carranza-García, M.; García-Gutiérrez, J.; Riquelme, J.C. A framework for evaluating land use and land cover classification using convolutional neural networks. Remote Sens. 2019, 11, 274. [Google Scholar] [CrossRef] [Scilit]
  28. FAO. Land Cover Classification System (LCCS): Classification Concepts and User Manual; Food and Agriculture Organization of the United Nations: Rome, Italy, 2000. [Google Scholar]
  29. Qin, R.; Liu, T. A Review of Landcover Classification with Very-High Resolution Remotely Sensed Optical Images—Analysis Unit, Model Scalability and Transferability. Remote Sens. 2022, 14, 646. [Google Scholar] [CrossRef] [Scilit]
  30. Vapnik, V.N. The Nature of Statistical Learning Theory; Springer: New York, NY, USA, 1995. [Google Scholar]
  31. Huang, C.; Davis, L.S.; Townshend, J.R.G. An assessment of support vector machines for land cover classification. Int. J. Remote Sens. 2002, 23, 725–749. [Google Scholar] [CrossRef] [Scilit]
  32. Mountrakis, G.; Im, J.; Ogole, C. Support vector machines in remote sensing: A review. ISPRS J. Photogramm. Remote Sens. 2011, 66, 247–259. [Google Scholar] [CrossRef] [Scilit]
  33. McGarigal, K.; Marks, B.J. FRAGSTATS: Spatial Pattern Analysis Program for Quantifying Landscape Structure; USDA Forest Service, Pacific Northwest Research Station: Portland, OR, USA, 1995. [Google Scholar]
  34. Pandey, P.C.; Koutsias, N.; Petropoulos, G.P.; Srivastava, P.K.; Ben-Dor, E. Land Use/Land Cover in View of Earth Observation: Data Sources, Input Dimensions, and Classifiers—A Review of the State of the Art. Geocarto Int. 2021, 36, 957–988. [Google Scholar] [CrossRef] [Scilit]
  35. Foody, G.M. Status of land cover classification accuracy assessment. Remote Sens. Environ. 2002, 80, 185–201. [Google Scholar] [CrossRef] [Scilit]
  36. PLANMalaysia. Kajian Rancangan Struktur Negeri Pulau Pinang 2040 (Kajian Semula): Laporan Tinjauan; PLANMalaysia Pulau Pinang: George Town, Malaysia, 2025. [Google Scholar]
  37. Mohammad, K.S.; Samat, N.; Khalid, H.N. Using remote sensing and GIS for observing land use land cover changes and quantifying arable land loss in Penang Island: A case study of Balik Pulau. In Proceedings of the 32nd Asian Conference on Remote Sensing (ACRS), Taipei, Taiwan, 3–7 October 2011. [Google Scholar]
  38. Elmahdy, S.I.; Marghany, M.M.; Mohamed, M.M. Application of a weighted spatial probability model in GIS to analyze landslides in Penang Island, Malaysia. Geomat. Nat. Hazards Risk 2014, 7, 345–359. [Google Scholar] [CrossRef] [Scilit]
  39. Ghazali, S. Sense of place and the politics of “Insider-ness” in villages undergoing transition: The case of city kampung on Penang Island. In Cleavage, Connection, and Conflict in Rural, Urban, and Contemporary Asia; Bunnell, T., Parthasarathy, D., Thompson, E.C., Eds.; Springer: Dordrecht, The Netherlands, 2013; pp. 117–142. [Google Scholar]
  40. Vaghefi, N. Penang’s Progress Towards the Sustainable Development Goals by 2030; Penang Institute Monographs: George Town, Malaysia, 2024. [Google Scholar]
  41. Department of Statistics Malaysia (DoSM). SDG Indikator Pulau Pinang 2022; Department of Statistics Malaysia: Putrajaya, Malaysia, 2022. [Google Scholar]
  42. Batty, M. The size, scale, and shape of cities. Science 2008, 319, 769–771. [Google Scholar] [CrossRef] [Scilit] [PubMed]
  43. Harris, C.D.; Ullman, E.L. The nature of cities. Ann. Am. Acad. Pol. Soc. Sci. 1945, 242, 7–17. [Google Scholar] [CrossRef] [Scilit]
  44. Shariff, N.M. Modelling urban land use change using geographically weighted regression and the implications for sustainable environmental planning. In Proceedings of the 5th Biennial Conference of the International Environmental Modelling and Software Society (iEMSs), Ottawa, Canada, 5–8 July 2010; pp. 1249–1256. [Google Scholar]
  45. Akomolafe, G.F.; Rosazlina, R. Land use and land cover changes influence the land surface temperature and vegetation in Penang Island, Peninsular Malaysia. Sci. Rep. 2022, 12, 21250. [Google Scholar] [CrossRef] [Scilit] [PubMed]
  46. Chan, C.K.; Ling, G.H.T.; Ho, C.S.; Kanniah, K.D. Sustainable forest management and effective land use policies for mitigating forest loss: The case of Malaysia. Chem. Eng. Trans. 2023, 106, 799–804. [Google Scholar] [CrossRef]
  47. Masum, K.M.; Mansor, A.; Sah, S.A.M.; Lim, H.S. Effect of differential forest management on land-use change (LUC) in a tropical hill forest of Malaysia. J. Environ. Manag. 2017, 200, 468–474. [Google Scholar] [CrossRef] [Scilit]
  48. Wallace, B.J. Village-based illegal logging in northern Luzon. Asia-Pac. Soc. Sci. Rev. 2011, 11, 19–26. [Google Scholar]
  49. Weng, C.N.; Mohamed, B.; Wern, H.C. Potentials, threats, and challenges in managing natural heritage in the Penang National Park. Kemanusiaan 2015, 22, 47–65. [Google Scholar]
  50. Gopal, S.; Kelly-Fair, M.; Ma, Y. Palm oil—The increasing materiality of deforestation and biodiversity risks in Indonesia and Malaysia. In IGARSS 2023—IEEE International Geoscience and Remote Sensing Symposium; IEEE: New York, NY, USA, 2023; pp. 374–2377. [Google Scholar]
  51. Turner, E.C.; Snaddon, J.L. Deforestation in Southeast Asia. In Biological and Environmental Hazards, Risks, and Disasters, 2nd ed.; Sivanpillai, R., Shroder, J.F., Eds.; Elsevier: Amsterdam, The Netherlands, 2023; pp. 319–334. [Google Scholar]
  52. Xu, Y.; Yu, L.; Li, W.; Ciais, P.; Cheng, Y.; Gong, P. Annual oil palm plantation maps in Malaysia and Indonesia from 2001 to 2016. Earth Syst. Sci. Data 2020, 12, 847–867. [Google Scholar] [CrossRef] [Scilit]
  53. Shevade, V.S.; Loboda, T.V. Oil palm plantations in Peninsular Malaysia: Determinants and constraints on expansion. PLoS ONE 2019, 14, e0210628. [Google Scholar] [CrossRef] [Scilit] [PubMed]
  54. Rahim, A.S.A.; Wahid, H.O.M.S. Determinants of deforestation in Peninsular Malaysia: An ARLD approach. Malays. For. 2009, 72, 155–164. [Google Scholar]
  55. Laurance, W.F.; Nascimento, H.E.M.; Laurance, S.G.; Andrade, A.; Ewers, R.M.; Harms, K.E.; Luizão, R.C.C.; Ribeiro, J.E. Habitat fragmentation, variable edge effects, and the landscape-divergence hypothesis. PLoS ONE 2007, 2, e1017. [Google Scholar] [CrossRef] [Scilit] [PubMed]
  56. Tan, M.L.; Zhang, F.; Derek, C.J.C.; Yu, K.H.; Shaharudin, S.M.; Chan, N.W.; Asyirah, A.R. Spatio-temporal analysis of precipitation, temperature, and drought from 1985 to 2020 in Penang, Malaysia. Water Supply 2022, 22, 4757–4768. [Google Scholar] [CrossRef] [Scilit]
  57. Chan, N.W.; Ghani, A.A.; Samat, N.; Roy, R.; Tan, M.L.; Rahman, H.A. Addressing water resources shortfalls due to climate change in Penang, Malaysia. In Water Security in Asia; Springer Water; Springer: Cham, Switzerland, 2021; pp. 239–249. [Google Scholar]
  58. Sah, S.S.; Maulud, K.N.; Karim, O.A.; Sharil, S.; Yaseen, Z.M. Extensive assessment of climate change impacts on coastal zone paddy growth using multispectral analysis and hydrodynamic modelling. Sci. Total Environ. 2023, 868, 161442. [Google Scholar] [CrossRef] [Scilit]
  59. Yen, L.J.; Matsumoto, Y.; Yin, C.S.; Wern, H.C.; Inoue, T.; Usami, A.; Iwatsuki, E.; Yagi, A. Characteristics of water quality of rivers related to land-use in Penang Island, Malaysia. AIP Conf. Proc. 2017, 1892, 040008. [Google Scholar] [CrossRef] [Scilit]
  60. Lai, C.H.; Chang, C.K.; Zakaria, N.A. Institutional reform for water conflict resolution in Malaysia: A preliminary study of Penang state and Kedah state. In Proceedings of the E-Proceedings of the 38th IAHR World Congress, Panama City, Panama, 1–6 September 2019; pp. 467–475. [Google Scholar]
  61. Penang Green Council. Penang Green Agenda 2030: Agriculture; Think Tank & Policy Division, Agriculture Working Group: Penang, Malaysia, 2020. [Google Scholar]
  62. Penang Institute. Penang Economic Development Report 2019/2020; Penang Institute: Penang, Malaysia, 2020. [Google Scholar]
  63. Yaakob, F.F. Banjir kilat lagi di Pulau Pinang. Berita Harian Online, 4 November 2017.
  64. Teoh, S. Seven dead in worst floods to hit Penang. Straits Times, 6 November 2017.
  65. Saleh, A.; Yuzir, A.; Abustan, I. Flood mapping using Sentinel-1 SAR imagery: Case study of the November 2017 flood in Penang. IOP Conf. Ser. Earth Environ. Sci. 2020, 479, 012013. [Google Scholar] [CrossRef] [Scilit]
  66. Malaysian Meteorological Department (MMD). Cloud Seeding Operations Report 2015–2020; Malaysian Meteorological Department: Petaling Jaya, Malaysia, 2020. [Google Scholar]
  67. Rohde, R. Global Temperature Report for 2020; Berkeley Earth: California, USA, 2021. [Google Scholar]
  68. Dermawan, A. Penang mahu pembenihan awan, tampung sumber air. Harian Metro, 15 April 2020.
  69. Chong, N.O.; Nawawi, F.N.; Ali, M.M.; Ahmad, M.S.; Juhari, S.K. Urban agriculture activities scenario in relation to food security: Delving into urban farming practices. Plan. Malays. 2024, 22, 307–319. [Google Scholar] [CrossRef] [Scilit]
  70. Amira Yusuf, M.S.; Man, N.; Mohamed Haris, N.B.; Ismail, I.A.; Maruf, A. Evaluating urban agriculture program effectiveness using the CIPP model: A review. E3S Web Conf. 2021, 306, 01012. [Google Scholar] [CrossRef] [Scilit]
  71. Khor, T.C. Community farms start to flourish in Penang. The Sun, 12 December 2024.
  72. Papathy, S. An overview of vertical farming: Highlighting the potential in Malaysian high-rise buildings. Pertanika J. Sci. Technol. 2022, 30, 949–981. [Google Scholar] [CrossRef] [Scilit]
  73. Then, E.; Hong, M. Urban agriculture: The feasibility of rooftop farming in Penang Island, Malaysia. J. Reg. City Plan. 2022, 33, 116–130. [Google Scholar] [CrossRef] [Scilit]
  74. Rahaman, Z.A.; Al Kafy, A.; Saha, M.; Rahim, A.A.; Almulhim, A.I.; Rahaman, S.N.; Fattah, M.A.; Rahman, M.T.; Al Rakib, A. Assessing the impacts of vegetation cover loss on surface temperature, urban heat island, and carbon emission in Penang city, Malaysia. Build. Environ. 2022, 222, 109425. [Google Scholar] [CrossRef] [Scilit]
  75. Osmadi, A.; Ling, G.S.; Yusof, N. Effects of rapid development of high-rise buildings on the environment in Penang Island. Adv. Environ. Biol. 2015, 9, 101–103. [Google Scholar]
Figure 1. The Map of Penang Island, Malaysia. Sources: ESRI [22] and MYSA [23].
Land 15 01355 g001
Figure 2. Conceptual Framework of LULC Change Detection on Penang Island, Malaysia.
Land 15 01355 g002
Figure 3. (ac) LULC Classification of Penang Island for 2014, 2019 and 2023.
Land 15 01355 g003
Figure 4. LULC Changed Area (km2) in Penang Island (2014–2023). Ho* represents the horticulture class, with the asterisk included as part of the abbreviation to accommodate the limited space available in the figure.
Land 15 01355 g004
Figure 5. (ae) Overall Change in Each LULC Class.
Land 15 01355 g005aLand 15 01355 g005b
Figure 6. (af) On-Site Validation of LULC Classes through Ground Truthing.
Land 15 01355 g006
Table 1. Raster Datasets Used in the Study.
No.Data Type Product Level Resolution
(Pan-Sharpened)
Date Obtained
1.SPOT 6 Pansharp Allbands RAW RSensor 1.5 m17 January 2014
2.SPOT 7 Pansharp Allbands RAW RSensor 1.5 m5 March 2019
3.SPOT 6 Pansharp Allbands RAW RSensor 1.5 m6 March 2023
Table 2. LULC Classification used in the study for Penang Island, Malaysia.
LULC TypeDescription
Built-upResidential, commercial areas, industrial establishments, roads, and other uncategorized surface pavements
ForestMangrove and all other forest fields
Water BodiesOpen water bodies like rivers, streams, lakes, ponds and reservoirs
Agriculture and HorticultureOrchards and cropland
Barren LandExposed soils, landfills, and areas of active excavation
Table 3. Confusion Matrix for 2014 Land Use and Land Cover (LULC) Classification.
ClassBuilt-UpForestWater BodiesAgriculture and HorticultureBarren LandTotalUser’s AccuracyKappa
Built-up821031870.9420
Forest02740502790.9820
Water Bodies0170190.7770
Agriculture and Horticulture1232640900.7110
Barren Land800027350.7710
Total912999722950000
Producer’s Accuracy0.9010.9160.7770.8880.93100.9080
Kappa00000000.847
Table 4. Confusion Matrix for 2019 Land Use and Land Cover (LULC) Classification.
ClassBuilt-UpForestWater BodiesAgriculture and HorticultureBarren LandTotalUser’s AccuracyKappa
Built-up820005870.9420
Forest1700080.8750
Water Bodies203041903250.9350
Agriculture and Horticulture607420550.7630
Barren Land500020250.80
Total967311612550000
Producer’s Accuracy0.85410.9770.6880.800.910
Kappa00000000.835
Table 5. Confusion Matrix for 2023 Land Use and Land Cover (LULC) Classification.
ClassBuilt-UpForestWater BodiesAgriculture and HorticultureBarren LandTotalUser’s AccuracyKappa
Built-up770001780.9870
Forest12890602960.9760
Water Bodies00900910
Agriculture and Horticulture6908331010.8210
Barren Land300013160.8120
Total872989891750000
Producer’s Accuracy0.8850.96910.9320.76400.9420
Kappa00000000.900
Table 6. LULC from 2014 until 2023 and Three Phases of Changes in Penang Island.
LULC Type201420192023Change Over 2014–2019
(First Phase)
Change Over 2019–2023
(Second Phase)
Change Over 2014–2023
(Overall Change)
km2%km2%km2%km2%km2%km2%
Built-up52.8117.6852.2317.3048.2816.02−0.58−0.38−3.94−1.27−4.52−1.66
Forest169.0756.62199.5066.08179.3959.5430.439.46−20.11−6.5410.312.92
Water Bodies1.380.461.360.451.640.54−0.02−0.010.270.090.250.08
Agriculture and Horticulture54.2018.1533.5211.1062.6620.80−20.68−7.0429.149.698.472.64
Barren Land21.117.0715.265.059.273.07−5.85−2.01−5.98−1.97−11.83−3.99
Table 7. LULC Transition Matrix (2014–2023).
Sum of Area Change (km2)2023 LULC
Agriculture and HorticultureBarren LandBuilt-UpForestWater BodiesGrand Total
2014 LULCAgriculture and Horticulture22.1232.7198.53620.2570.391354.028
Barren Land8.9341.9115.5954.5910.05021.084
Built-up14.3632.55630.7354.8080.22052.684
Forest15.9681.3592.889148.7570.087169.062
Water Bodies0.2400.05390.0950.24250.7141.347
Grand Total61.6318.60147.852178.6571.464298.206
Disclaimer/Publisher’s Note: The statements, opinions and data contained in all publications are solely those of the individual author(s) and contributor(s) and not of MDPI and/or the editor(s). MDPI and/or the editor(s) disclaim responsibility for any injury to people or property resulting from any ideas, methods, instructions or products referred to in the content.