Ecological Network Bottlenecks and Restoration Priorities in the Chengjiang Karst Basin, China

Abstract
1. Introduction
2. Materials and Methods
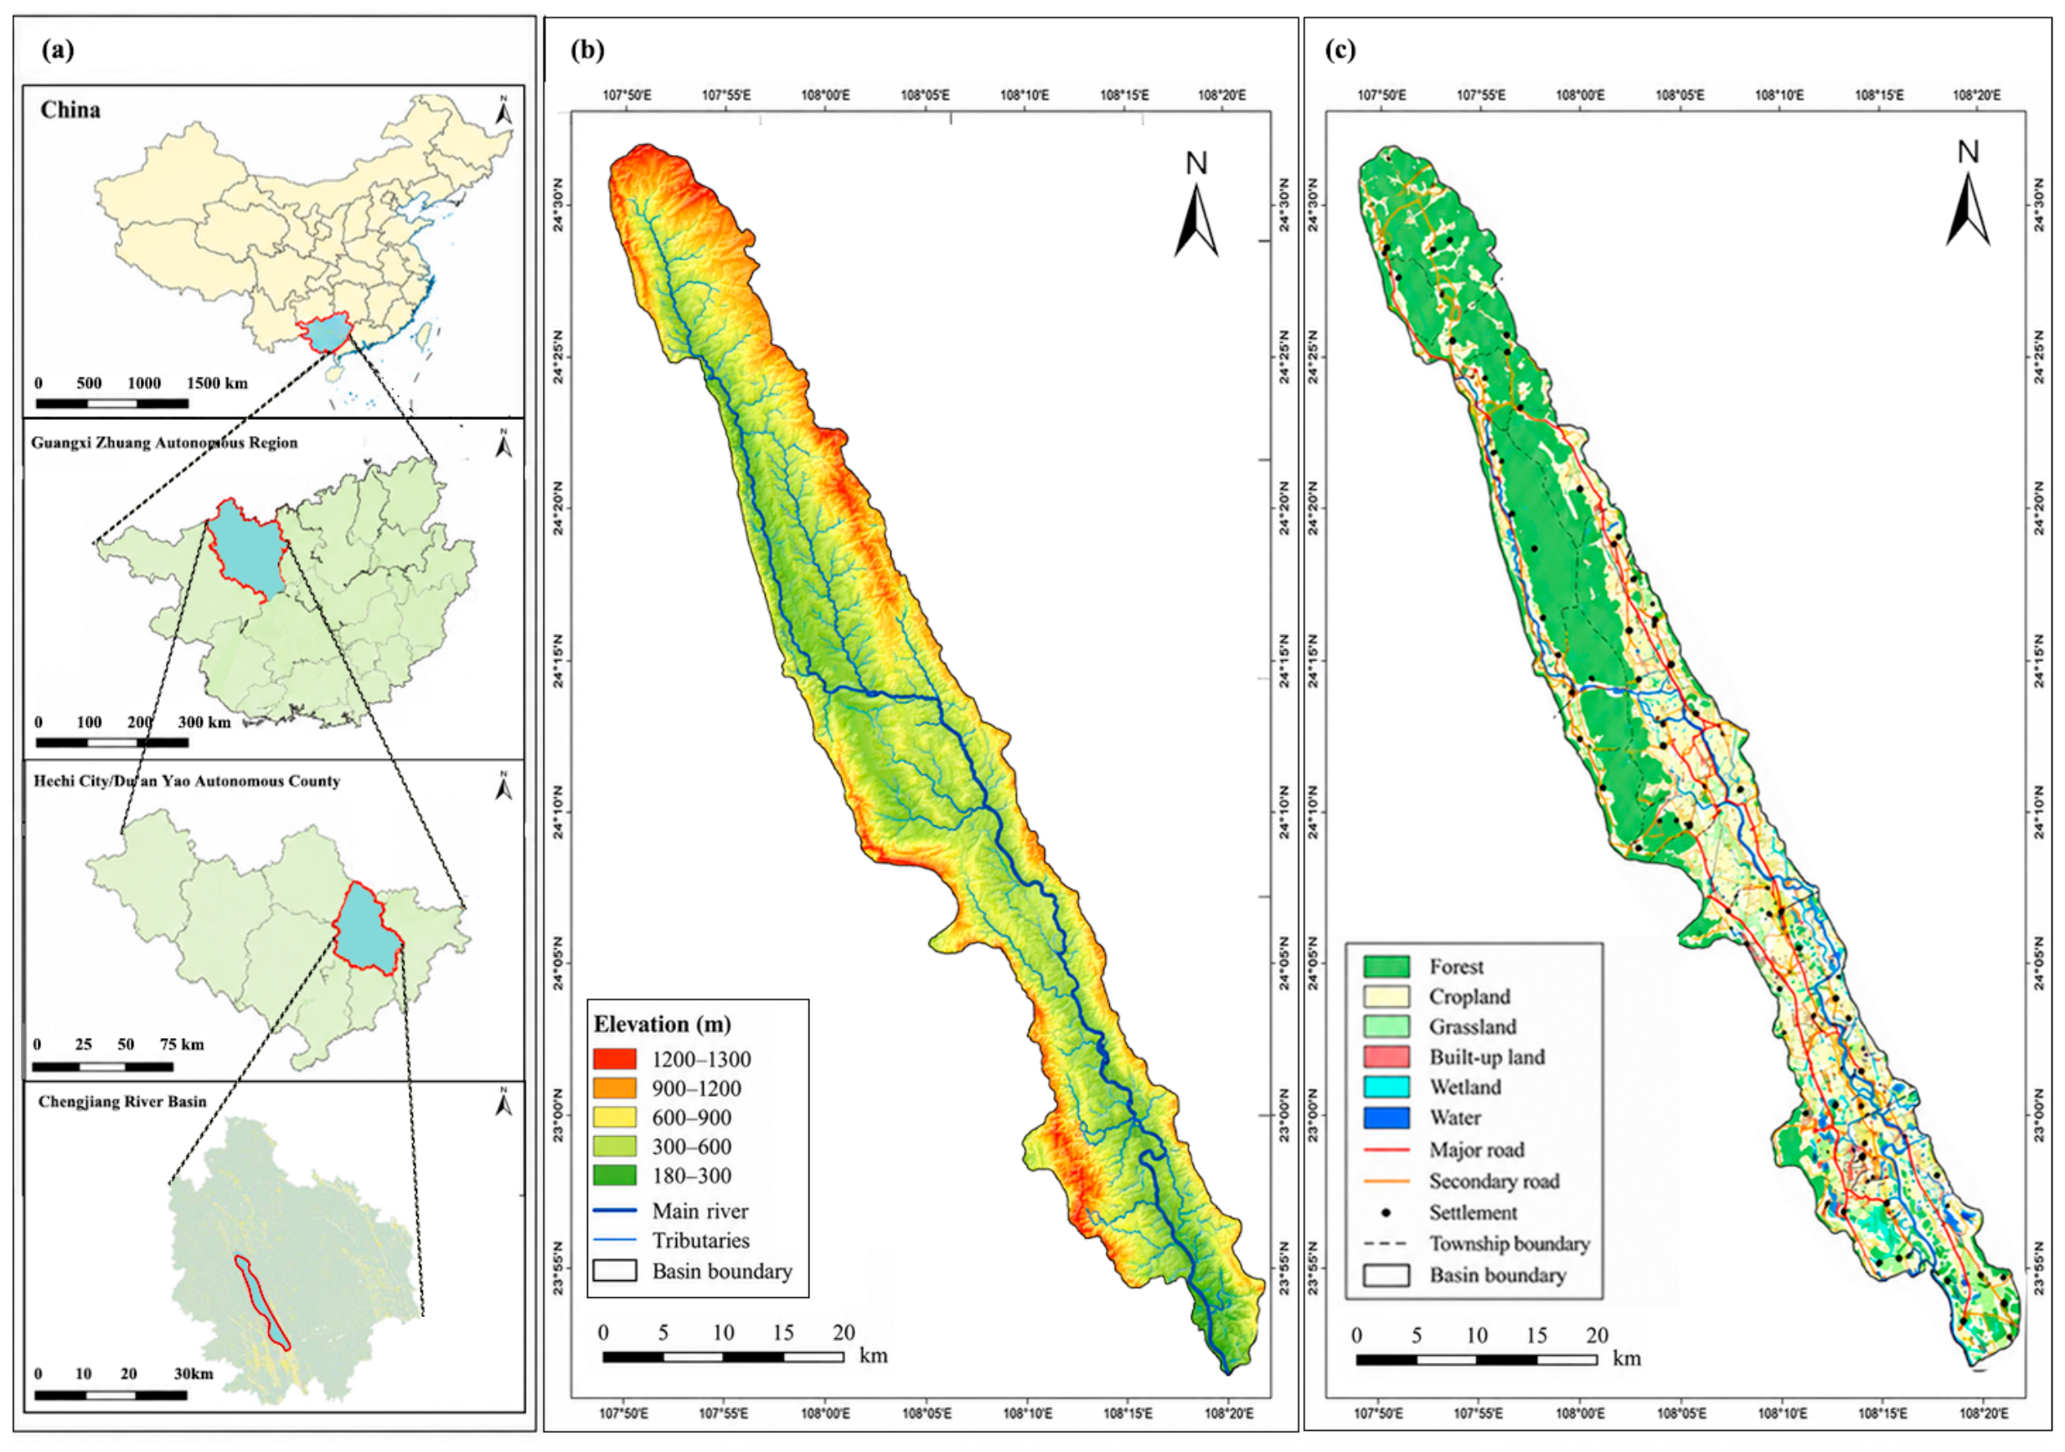
2.1. Study Area
2.2. Data Sources and Preprocessing
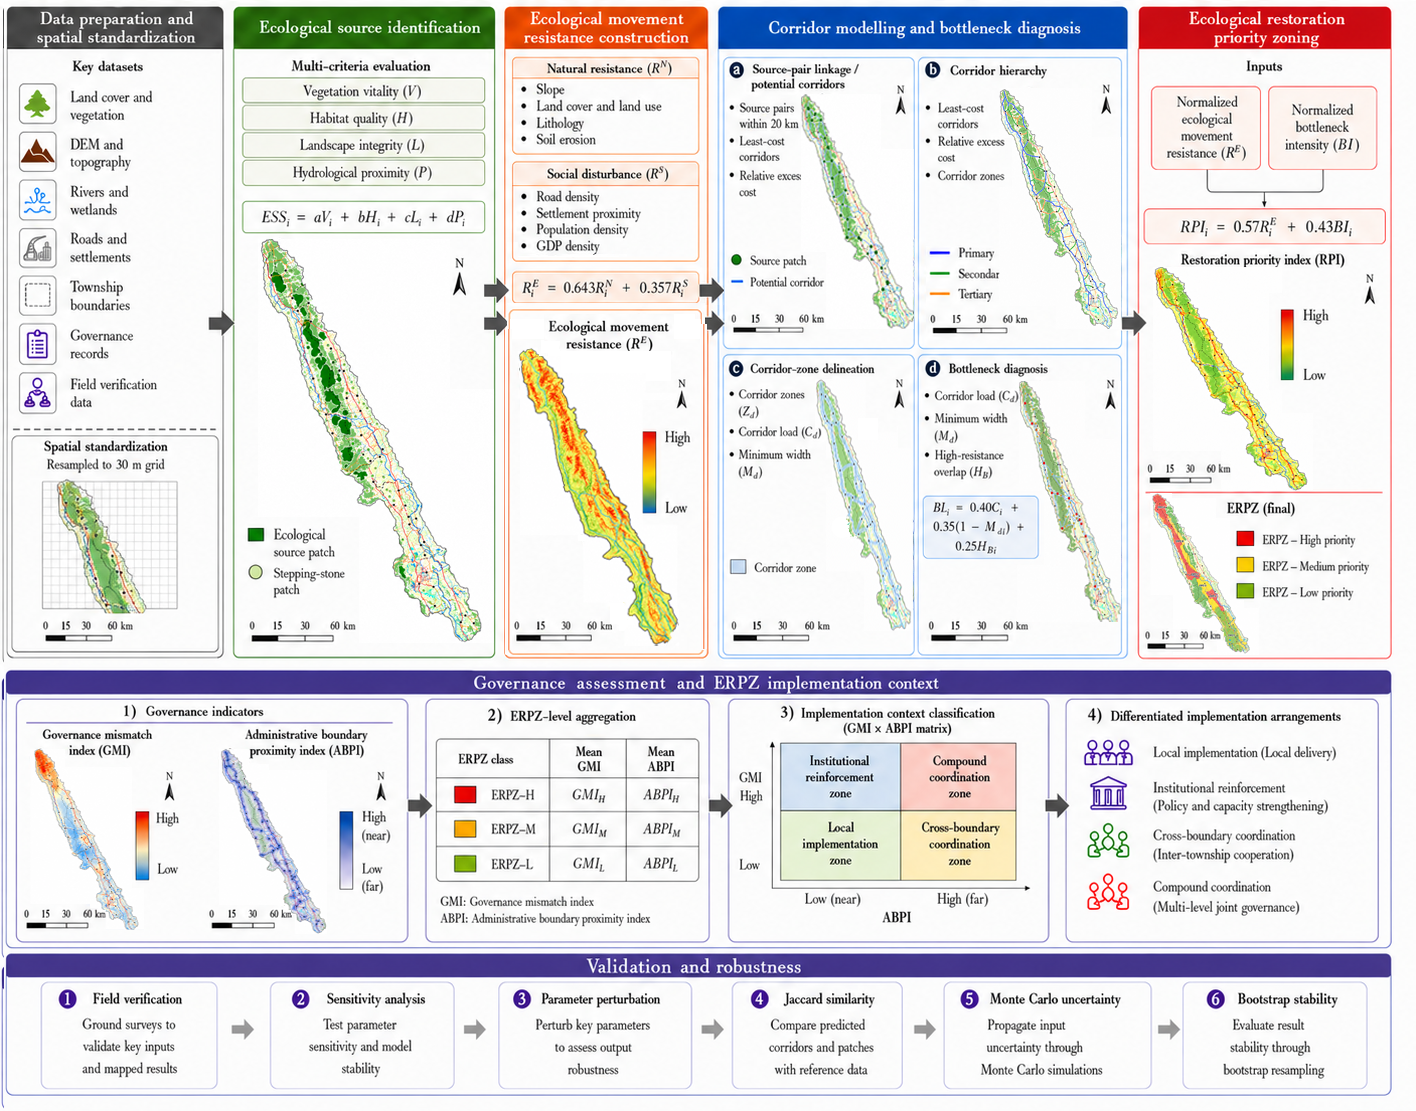
2.3. Structure–Resistance–Connectivity–Governance Framework
2.3.1. Ecological Source Identification
2.3.2. Ecological Movement Resistance
2.3.3. Potential Corridor Modelling and Bottleneck Diagnosis
2.3.4. Ecological Restoration Priority Zoning and Governance Implementation Assessment
2.4. Validation and Sensitivity Analysis
3. Results
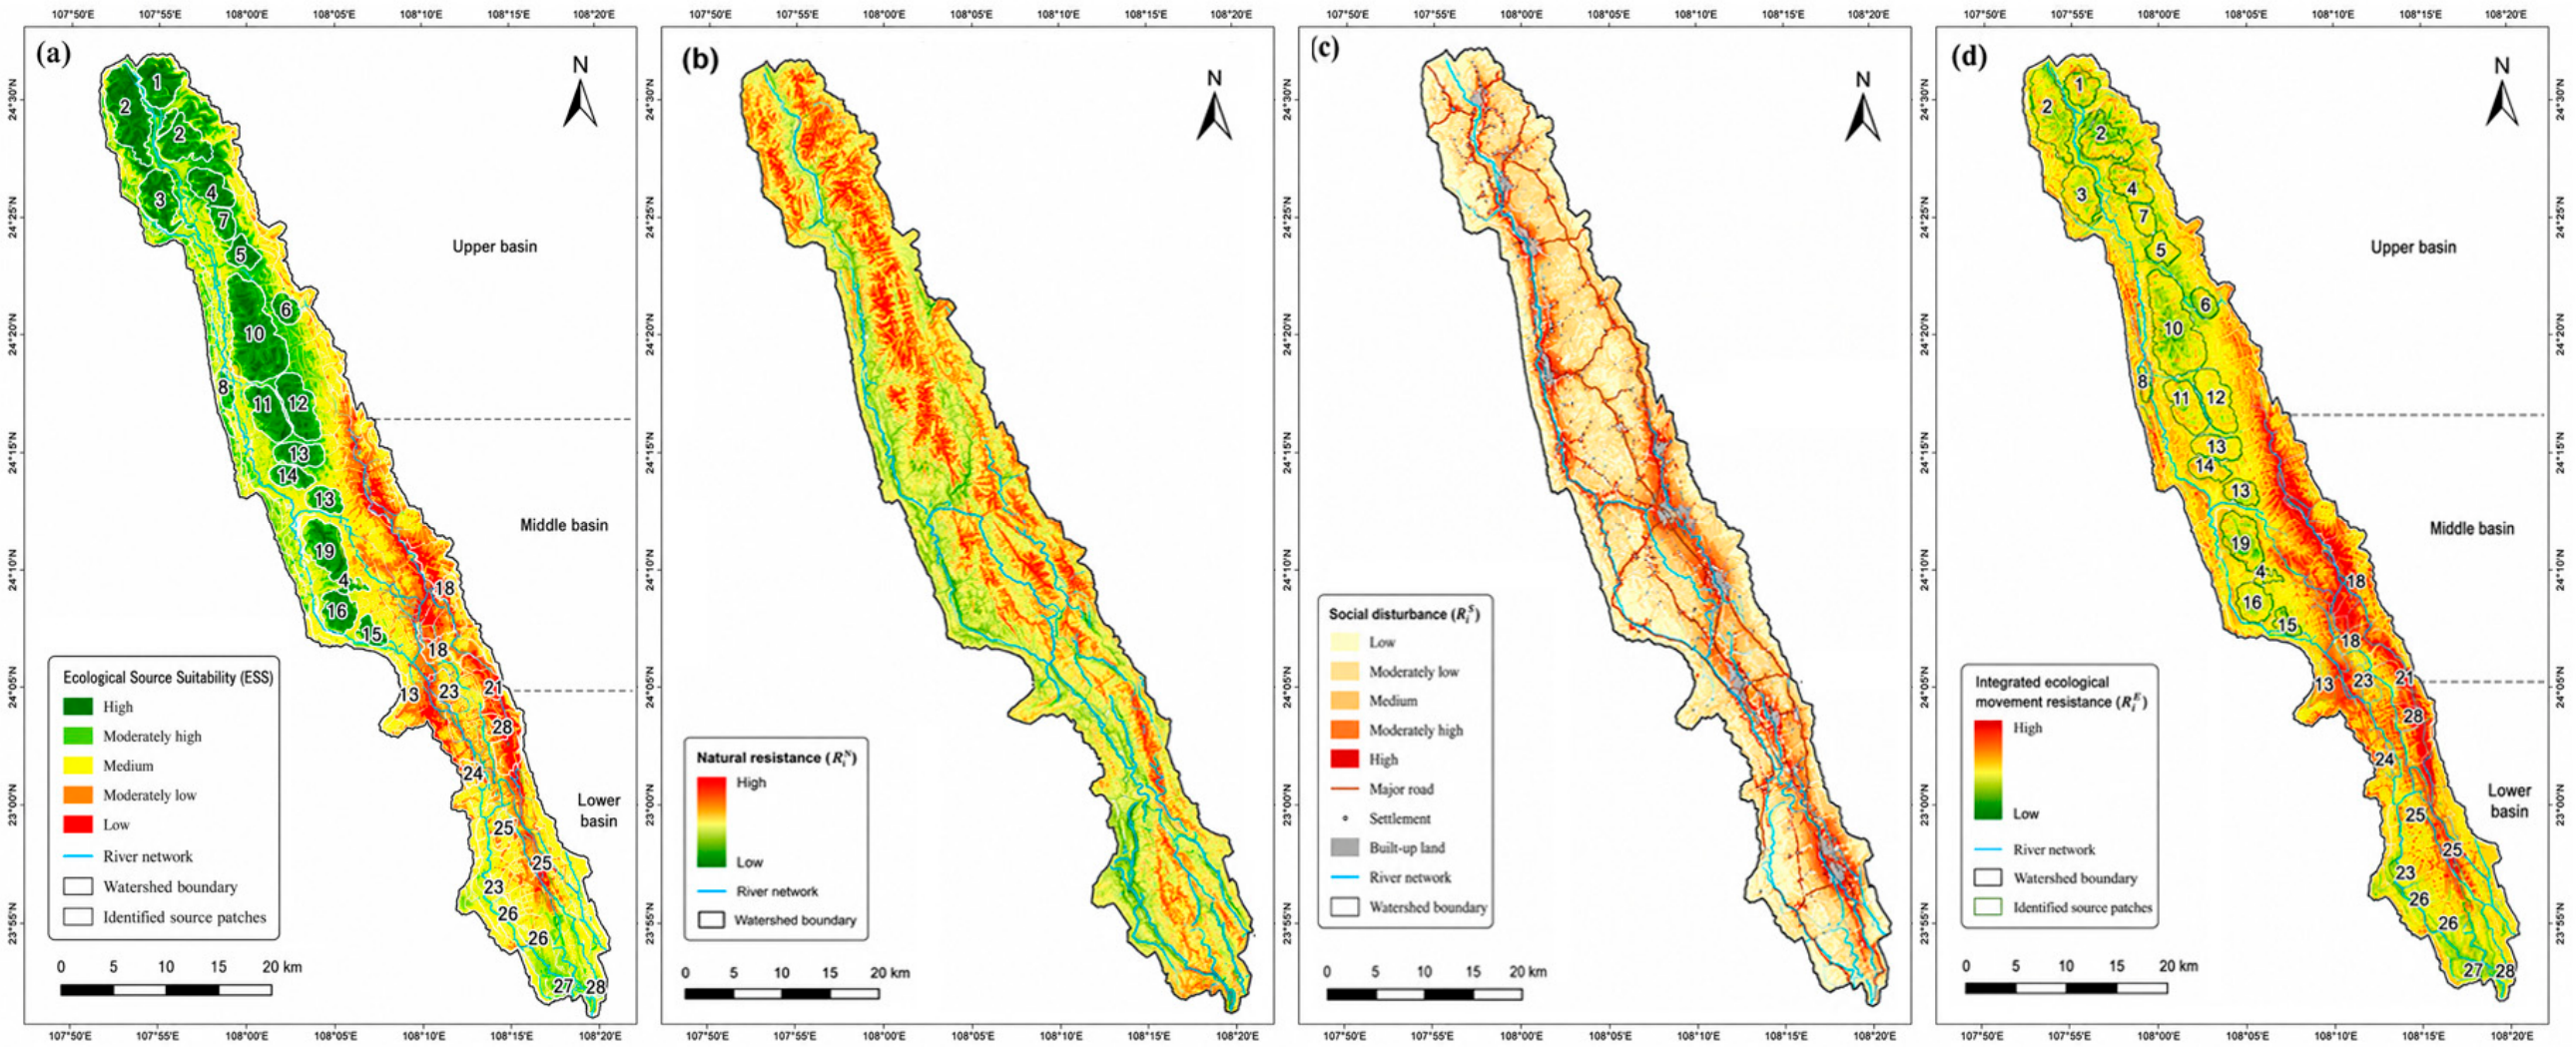
3.1. Ecological Sources and Ecological Movement Resistance
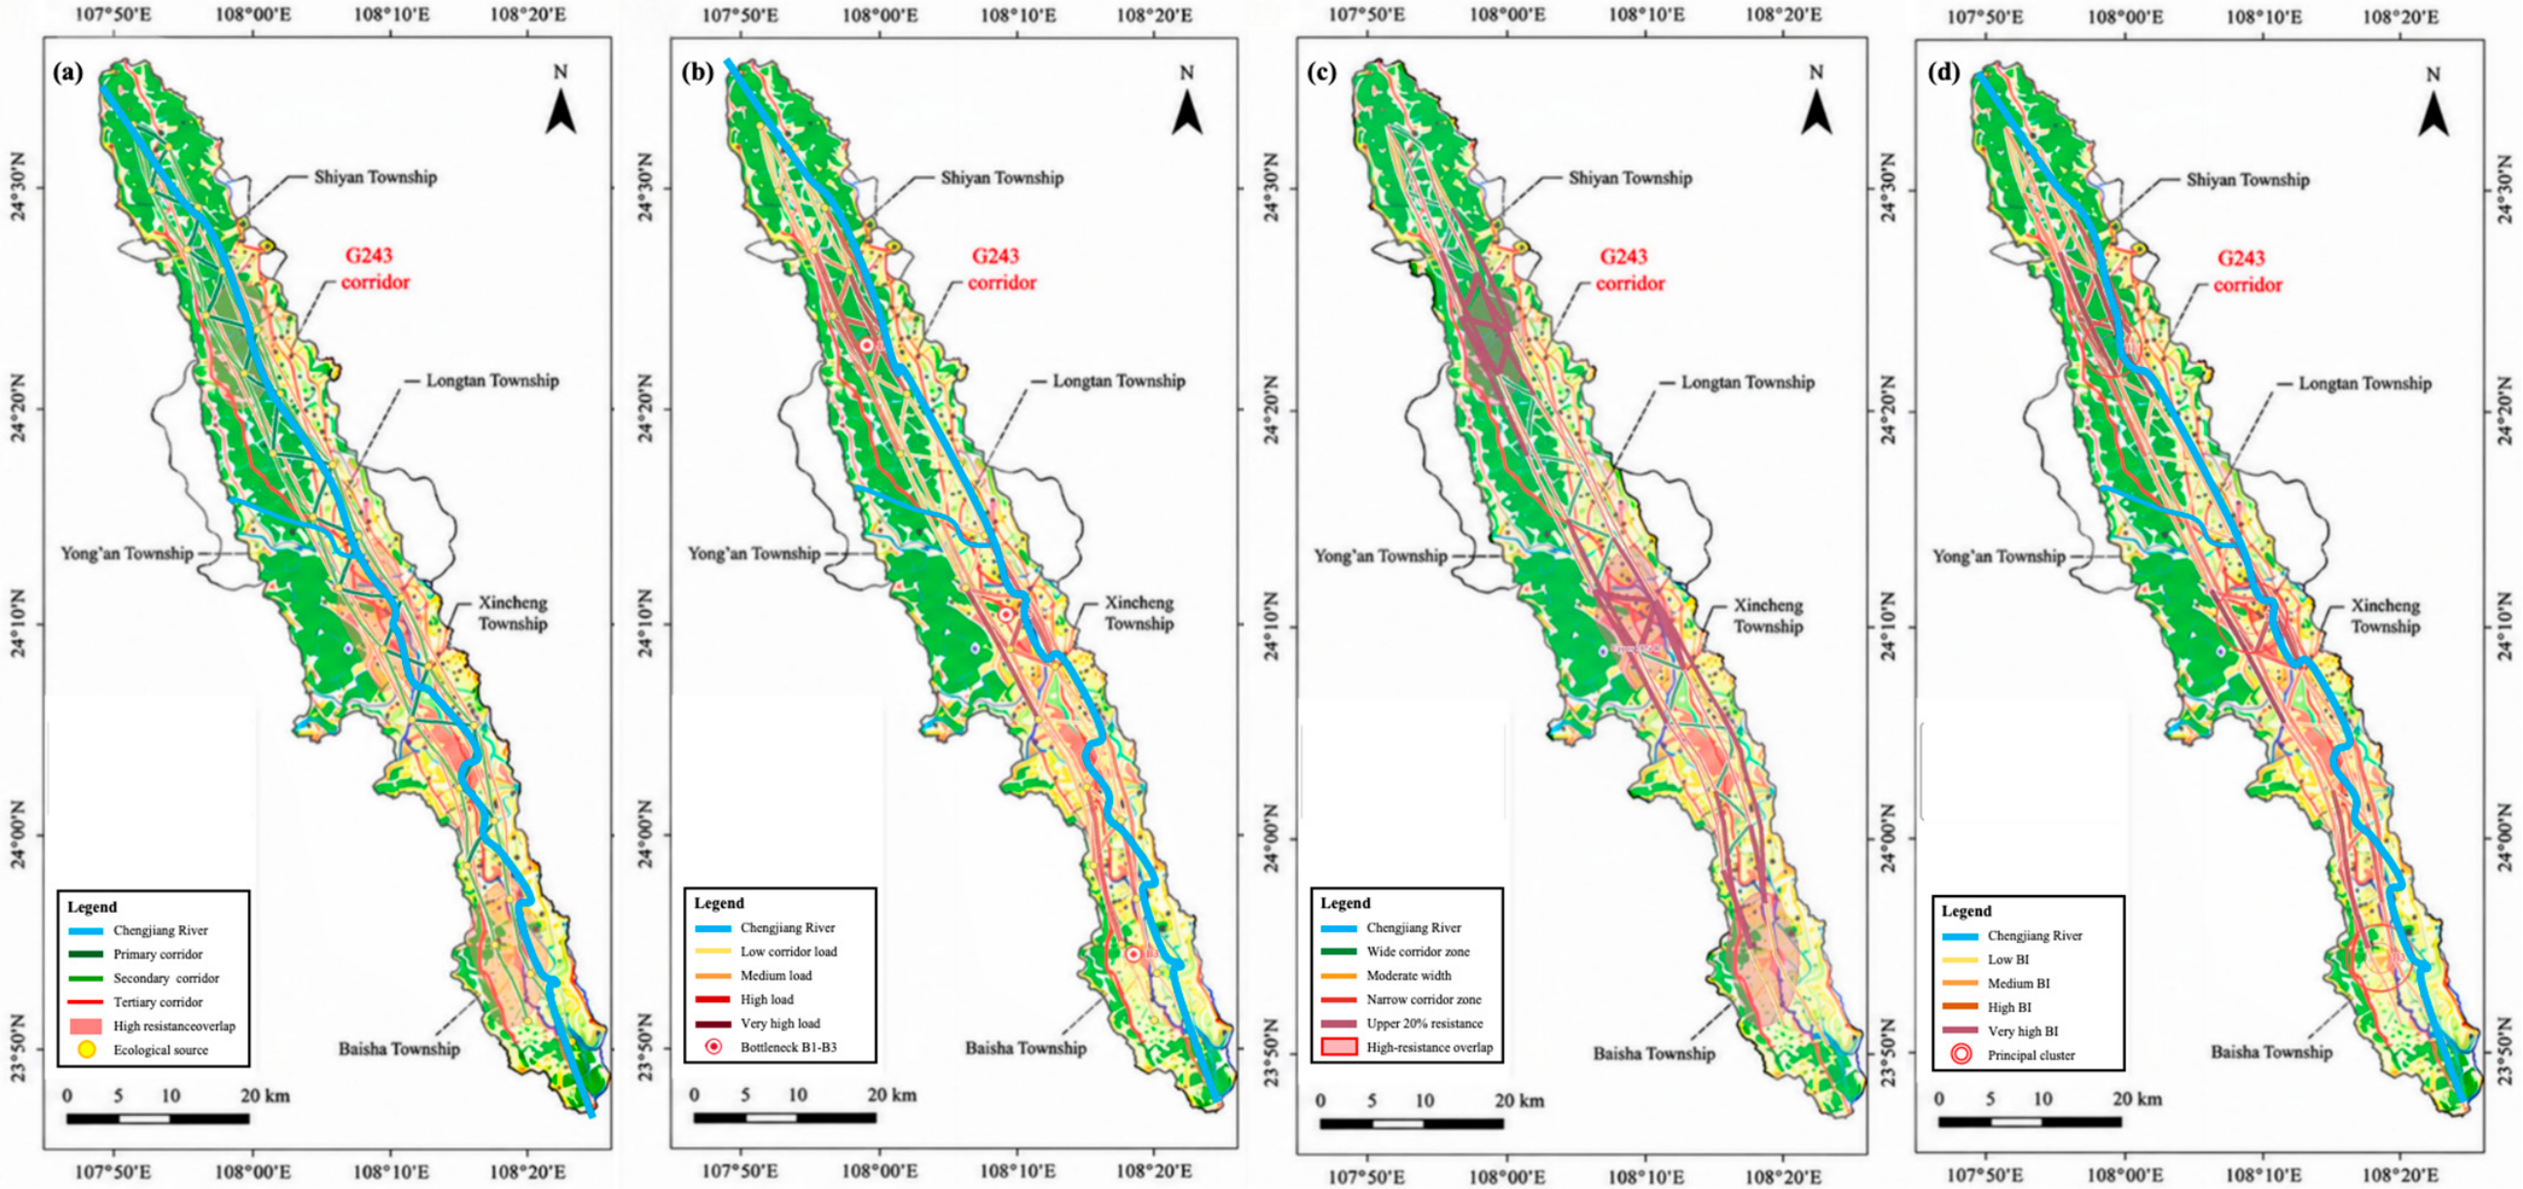
3.2. Potential Corridor Network and Bottleneck Diagnosis
3.3. Ecological Restoration Priority Zones and Governance Implementation Contexts
3.4. Validation and Sensitivity Results
4. Discussion
4.1. Structural Connectivity and Bottleneck Mechanisms in a Karst Basin
4.2. Differentiated Restoration Mechanisms of the ERPZs
4.3. Governance Implementation Contexts and Land-Governance Responses
4.4. Methodological Contributions, Limitations, and Future Research
5. Conclusions
Supplementary Materials
Author Contributions
Funding
Data Availability Statement
Conflicts of Interest
References
- Ford, D.; Williams, P. Karst Hydrogeology and Geomorphology; John Wiley and Sons: Chichester, UK, 2007. [Google Scholar] [CrossRef] [Scilit]
- Jiang, Z.C.; Lian, Y.Q.; Qin, X.Q. Rocky desertification in Southwest China: Impacts, causes, and restoration. Earth-Sci. Rev. 2014, 132, 1–12. [Google Scholar] [CrossRef] [Scilit]
- Tong, X.; Brandt, M.; Yue, Y.; Horion, S.; Wang, K.; de Keersmaecker, W.; Tian, F.; Schurgers, G.; Xiao, X.; Luo, Y.; et al. Increased vegetation growth and carbon stock in China karst via ecological engineering. Nat. Sustain. 2018, 1, 44–50. [Google Scholar] [CrossRef] [Scilit]
- Pascual-Hortal, L.; Saura, S. Comparison and development of new graph-based landscape connectivity indices: Towards the priorization of habitat patches and corridors for conservation. Landsc. Ecol. 2006, 21, 959–967. [Google Scholar] [CrossRef] [Scilit]
- Saura, S.; Pascual-Hortal, L. A new habitat availability index to integrate connectivity in landscape conservation planning: Comparison with existing indices and application to a case study. Landsc. Urban Plan. 2007, 83, 91–103. [Google Scholar] [CrossRef] [Scilit]
- McRae, B.H.; Dickson, B.G.; Keitt, T.H.; Shah, V.B. Using circuit theory to model connectivity in ecology, evolution, and conservation. Ecology 2008, 89, 2712–2724. [Google Scholar] [CrossRef] [Scilit] [PubMed]
- Zeller, K.A.; McGarigal, K.; Whiteley, A.R. Estimating landscape resistance to movement: A review. Landsc. Ecol. 2012, 27, 777–797. [Google Scholar] [CrossRef] [Scilit]
- Li, Z.-T.; Li, M.; Xia, B.-C. Spatio-temporal dynamics of ecological security pattern of the Pearl River Delta urban agglomeration based on LUCC simulation. Ecol. Indic. 2020, 114, 106319. [Google Scholar] [CrossRef] [Scilit]
- Jiang, H.; Peng, J.; Zhao, Y.; Xu, D.; Dong, J. Zoning for ecosystem restoration based on ecological network in mountainous region. Ecol. Indic. 2022, 142, 109138. [Google Scholar] [CrossRef] [Scilit]
- Gao, M.; Hu, Y.; Bai, Y. Construction of ecological security pattern in national land space from the perspective of the community of life in mountain, water, forest, field, lake and grass: A case study in Guangxi Hechi, China. Ecol. Indic. 2022, 139, 108867. [Google Scholar] [CrossRef] [Scilit]
- Zhang, Y.; Zhao, Z.; Fu, B.; Ma, R.; Yang, Y.; Lü, Y.; Wu, X. Identifying ecological security patterns based on the supply, demand and sensitivity of ecosystem service: A case study in the Yellow River Basin, China. J. Environ. Manag. 2022, 315, 115158. [Google Scholar] [CrossRef] [Scilit] [PubMed]
- Gao, C.; Pan, H.; Wang, M.; Zhang, T.; He, Y.; Cheng, J.; Yao, C. Identifying priority areas for ecological conservation and restoration based on circuit theory and dynamic weighted complex network: A case study of the Sichuan Basin. Ecol. Indic. 2023, 155, 111064. [Google Scholar] [CrossRef] [Scilit]
- Dong, X.; Wang, F.; Fu, M. Research progress and prospects for constructing ecological security pattern based on ecological network. Ecol. Indic. 2024, 168, 112800. [Google Scholar] [CrossRef] [Scilit]
- Yang, M.; He, J.; Shi, L.; Lv, Y.; Li, J. Integrating policy quantification analysis into ecological security pattern construction: A case study of Guangdong–Hong Kong–Macao Greater Bay Area. Ecol. Indic. 2024, 162, 112049. [Google Scholar] [CrossRef] [Scilit]
- Ma, B.; Zeng, C.; Lv, T.; Liu, W.; Yang, W. prioritisation of ecological conservation and restoration areas through ecological networks: A case study of Nanchang City, China. Land 2024, 13, 878. [Google Scholar] [CrossRef] [Scilit]
- Zhang, R.; Li, H.; Liu, Z. Synergistic enhancement of carbon sinks and connectivity: Restoration and renewal of ecological networks in Nanjing, China. Land 2025, 14, 93. [Google Scholar] [CrossRef] [Scilit]
- Su, J.; Wu, M.; Liu, Z. Spatial–temporal evolution of ecological network structure during 1967–2021 in Yongding River Floodplain. Land 2025, 14, 930. [Google Scholar] [CrossRef] [Scilit]
- Zhang, W.; Fan, Y.; Qiao, Q.; Shao, G.; Zhang, M.; Lei, S.; Han, Y. Delineating ecological restoration zoning integrating functional and structural models in Horqin Sandy Land, China. Forests 2025, 16, 1616. [Google Scholar] [CrossRef] [Scilit]
- Yan, S.; Zhang, X.; Yan, R.; Luo, Y.; Wang, H.; Xing, B.; Liu, C.; Xu, D.; Liao, G. Identification of ecological restoration zones based on ecological security pattern and ecological risk assessment—A case study of Liaoning Province. Sustainability 2026, 18, 204. [Google Scholar] [CrossRef] [Scilit]
- Cumming, G.S.; Cumming, D.H.M.; Redman, C.L. Scale mismatches in social-ecological systems: Causes, consequences, and solutions. Ecol. Soc. 2006, 11, 14. [Google Scholar] [CrossRef] [Scilit]
- Ren, J.; Wang, W.J.; Fei, L.; Wang, L.; Xing, S.; Cong, Y. Impacts of climate change and land use/cover change on ecological security networks in Changbai Mountains, Northeast China. Ecol. Indic. 2024, 169, 112849. [Google Scholar] [CrossRef] [Scilit]
- Turner, M.G.; O’Neill, R.V.; Gardner, R.H.; Milne, B.T. Effects of changing spatial scale on the analysis of landscape pattern. Landsc. Ecol. 1989, 3, 153–162. [Google Scholar] [CrossRef] [Scilit]
- Main-Knorn, M.; Pflug, B.; Louis, J.; Debaecker, V.; Müller-Wilm, U.; Gascon, F. Sen2Cor for Sentinel-2. In Image and Signal Processing for Remote Sensing XXIII; SPIE: Bellingham, WA, USA, 2017; Volume 10427, p. 1042704. [Google Scholar] [CrossRef] [Scilit]
- Soenen, S.A.; Peddle, D.R.; Coburn, C.A. SCS+C: A modified sun-canopy-sensor topographic correction in forested terrain. IEEE Trans. Geosci. Remote Sens. 2005, 43, 2148–2159. [Google Scholar] [CrossRef] [Scilit]
- Breiman, L. Random forests. Mach. Learn. 2001, 45, 5–32. [Google Scholar] [CrossRef] [Scilit]
- Cutler, D.R.; Edwards, T.C., Jr.; Beard, K.H.; Cutler, A.; Hess, K.T.; Gibson, J.; Lawler, J.J. Random forests for classification in ecology. Ecology 2007, 88, 2783–2792. [Google Scholar] [CrossRef] [Scilit] [PubMed]
- Congalton, R.G. A review of assessing the accuracy of classifications of remotely sensed data. Remote Sens. Environ. 1991, 37, 35–46. [Google Scholar] [CrossRef] [Scilit]
- Foody, G.M. Status of land cover classification accuracy assessment. Remote Sens. Environ. 2002, 80, 185–201. [Google Scholar] [CrossRef] [Scilit]
- Tucker, C.J. Red and photographic infrared linear combinations for monitoring vegetation. Remote Sens. Environ. 1979, 8, 127–150. [Google Scholar] [CrossRef] [Scilit]
- Huete, A.; Didan, K.; Miura, T.; Rodriguez, E.P.; Gao, X.; Ferreira, L.G. Overview of the radiometric and biophysical performance of the MODIS vegetation indices. Remote Sens. Environ. 2002, 83, 195–213. [Google Scholar] [CrossRef] [Scilit]
- Savitzky, A.; Golay, M.J.E. Smoothing and differentiation of data by simplified least squares procedures. Anal. Chem. 1964, 36, 1627–1639. [Google Scholar] [CrossRef] [Scilit]
- Farr, T.G.; Rosen, P.A.; Caro, E.; Crippen, R.; Duren, R.; Hensley, S.; Kobrick, M.; Paller, M.; Rodriguez, E.; Roth, L.; et al. The Shuttle Radar Topography Mission. Rev. Geophys. 2007, 45, RG2004. [Google Scholar] [CrossRef] [Scilit]
- Bazeley, P.; Jackson, K. Qualitative Data Analysis with NVivo, 2nd ed.; SAGE Publications: London, UK, 2013. [Google Scholar]
- Cohen, J. A coefficient of agreement for nominal scales. Educ. Psychol. Meas. 1960, 20, 37–46. [Google Scholar] [CrossRef] [Scilit]
- Sharp, R.; Douglass, J.; Wolny, S.; Arkema, K.; Bernhardt, J.; Bierbower, W.; Chaumont, N.; Denu, D.; Fisher, D.; Glowinski, K.; et al. InVEST 3.9.0 User’s Guide; The Natural Capital Project: Stanford, CA, USA, 2020. [Google Scholar]
- McGarigal, K.; Marks, B.J. FRAGSTATS: Spatial Pattern Analysis Program for Quantifying Landscape Structure; General Technical Report PNW-GTR-351; USDA Forest Service, Pacific Northwest Research Station: Portland, OR, USA, 1995. [CrossRef] [Scilit]
- Naiman, R.J.; Décamps, H. The ecology of interfaces: Riparian zones. Annu. Rev. Ecol. Syst. 1997, 28, 621–658. [Google Scholar] [CrossRef] [Scilit]
- Adriaensen, F.; Chardon, J.P.; de Blust, G.; Swinnen, E.; Villalba, S.; Gulinck, H.; Matthysen, E. The application of least-cost modelling as a functional landscape model. Landsc. Urban Plan. 2003, 64, 233–247. [Google Scholar] [CrossRef] [Scilit]
- Yu, K.J. Security patterns and surface model in landscape ecological planning. Landsc. Urban Plan. 1996, 36, 1–17. [Google Scholar] [CrossRef] [Scilit]
- Beier, P.; Majka, D.R.; Spencer, W.D. Forks in the road: Choices in procedures for designing wildland linkages. Conserv. Biol. 2008, 22, 836–851. [Google Scholar] [CrossRef] [Scilit] [PubMed]
- Spear, S.F.; Balkenhol, N.; Fortin, M.J.; McRae, B.H.; Scribner, K. Use of resistance surfaces for landscape genetic studies: Considerations for parameterization and analysis. Mol. Ecol. 2010, 19, 3576–3591. [Google Scholar] [CrossRef] [Scilit] [PubMed]
- Saura, S.; Torné, J. Conefor Sensinode 2.2: A software package for quantifying the importance of habitat patches for landscape connectivity. Environ. Model. Softw. 2009, 24, 135–139. [Google Scholar] [CrossRef] [Scilit]
- Moss, T. Spatial fit, from panacea to practice: Implementing the EU Water Framework Directive. Ecol. Soc. 2012, 17, 2. [Google Scholar] [CrossRef] [Scilit]
- Young, O.R. The Institutional Dimensions of Environmental Change: Fit, Interplay, and Scale; MIT Press: Cambridge, MA, USA, 2002. [Google Scholar] [CrossRef] [Scilit]
- Cash, D.W.; Adger, W.N.; Berkes, F.; Garden, P.; Lebel, L.; Olsson, P.; Pritchard, L.; Young, O. Scale and cross-scale dynamics: Governance and information in a multilevel world. Ecol. Soc. 2006, 11, 8. [Google Scholar] [CrossRef] [Scilit]
- Epstein, G.; Pittman, J.; Alexander, S.M.; Berdej, S.; Dyck, T.; Kreitmair, U.; Rathwell, K.J.; Villamayor-Tomas, S.; Vogt, J.; Armitage, D. Institutional fit and the sustainability of social-ecological systems. Curr. Opin. Environ. Sustain. 2015, 14, 34–40. [Google Scholar] [CrossRef] [Scilit]
- Efron, B.; Tibshirani, R.J. An Introduction to the Bootstrap; Chapman & Hall/CRC: New York, NY, USA, 1993. [Google Scholar] [CrossRef] [Scilit]
- Saltelli, A.; Tarantola, S.; Campolongo, F.; Ratto, M. Sensitivity Analysis in Practice: A Guide to Assessing Scientific Models; John Wiley and Sons: Chichester, UK, 2004. [Google Scholar] [CrossRef] [Scilit]
- Jaccard, P. The distribution of the flora in the alpine zone. New Phytol. 1912, 11, 37–50. [Google Scholar] [CrossRef] [Scilit]
- Tischendorf, L.; Fahrig, L. On the usage and measurement of landscape connectivity. Oikos 2000, 90, 7–19. [Google Scholar] [CrossRef] [Scilit]
- Baguette, M.; van Dyck, H. Landscape connectivity and animal behavior: Functional grain as a key determinant for dispersal. Landsc. Ecol. 2007, 22, 1117–1129. [Google Scholar] [CrossRef] [Scilit]
- Keeley, A.T.H.; Beier, P.; Keeley, B.W.; Fagan, M.E. Habitat suitability is a poor proxy for landscape connectivity during dispersal and mating movements. Landsc. Urban Plan. 2017, 161, 90–102. [Google Scholar] [CrossRef] [Scilit]
- Chetkiewicz, C.L.B.; St. Clair, C.C.; Boyce, M.S. Corridors for conservation: Integrating pattern and process. Annu. Rev. Ecol. Evol. Syst. 2006, 37, 317–342. [Google Scholar] [CrossRef] [Scilit]
- Bodin, Ö. Collaborative environmental governance: Achieving collective action in social-ecological systems. Science 2017, 357, eaan1114. [Google Scholar] [CrossRef] [Scilit] [PubMed]
- Pahl-Wostl, C.; Lebel, L.; Knieper, C.; Nikitina, E. From applying panaceas to mastering complexity: Toward adaptive water governance in river basins. Environ. Sci. Policy 2012, 23, 24–34. [Google Scholar] [CrossRef] [Scilit]



| Data Type | Variables | Data Source and Period | Spatial Resolution/Scale | Analytical Application |
|---|---|---|---|---|
| Land use and land cover | Forest and mixed woodland; cropland; grassland and shrubland; built-up land and settlements; bare rock and sparsely vegetated land; wetland; water | Landsat 8 and Sentinel-2 L2A imagery, 2023 | 10–30 m | Land-cover classification, habitat-quality assessment, ecological source identification, and resistance assignment |
| Classification samples | Land-cover reference samples distributed across land-cover classes, basin sections, and terrain settings | High-resolution reference imagery and field observations, 2023–2024 | Sample points | Random Forest training and independent validation; 1200 training samples and 230 validation samples |
| Vegetation condition | NDVI and EVI | MODIS MOD13Q1, 2000–2023 | 250 m | Long-term vegetation vitality and ecological source screening |
| Topography | Elevation, slope, curvature, and topographic wetness index | SRTM v3; ASTER GDEM used for terrain-pattern checking | 30 m | Terrain analysis and natural resistance |
| Karst lithology and geology | Carbonate-rock type, limestone and dolomite distribution, non-carbonate geological units, and structural features | GLiM v1.0 and Guangxi regional geological maps | Polygon data; regional maps at approximately 1:50,000–1:250,000 | Lithological resistance and interpretation of karst sensitivity |
| Soil erosion and rocky desertification | Soil-erosion intensity, erosion risk, bare-rock exposure, and rocky-desertification tendency | RUSLE-based erosion assessment using 2023 environmental inputs and supporting erosion data | 30 m after harmonisation | Erosion-related resistance and high-resistance interpretation |
| Hydrology and wetlands | Main river, tributaries, perennial water bodies, wetlands, and riparian zones | Official hydrological records and remote-sensing interpretation | Vector and raster | Hydrological proximity, source identification, and corridor interpretation |
| Infrastructure and settlements | Roads, transport crossings, settlements, construction land, and quarry-affected areas | OpenStreetMap, high-resolution imagery, and field correction, 2022–2024 | Vector and classified raster | Localised anthropogenic disturbance and interpretation of corridor constraints |
| Socioeconomic conditions | Population and GDP | Guangxi statistical yearbooks and township statistics, 2023 | Township | Broad socioeconomic-pressure gradients within the social-disturbance component and contextual interpretation of restoration implementation |
| Governance and administrative data | Policy coordination, fiscal and ecological-compensation support, joint monitoring, inter-township cooperation, and township boundaries | Du’an County and township records, 2018–2024 | Text, township, and vector | GMI, ABPI, and ERPZ implementation-context assessment |
| Field observations | Land cover, vegetation continuity, riparian condition, corridor constriction, transport disturbance, exposed slopes, and quarry disturbance | Field surveys, May–August 2024 | Points and corridor sections | Land-cover validation and landscape-condition verification |
| Dimension | Operational Indicator | Calculation and Normalisation | Native Spatial Scale | Analytical Role And Interpretation |
|---|---|---|---|---|
| Policy coordination | Proportion of relevant clauses addressing coordinated restoration | Relevant coded provisions divided by all included provisions and normalised to 0–1 | Township | Measures formal policy alignment and constitutes in the GMI |
| Fiscal alignment | Correspondence between restoration responsibilities and available fiscal or ecological-compensation support | Responsibility–support correspondence transformed into an adequacy score and normalised to 0–1 | Township | Measures alignment between restoration responsibility and fiscal support and constitutes in the GMI |
| Cooperation frequency | Recorded joint meetings, shared monitoring, coordinated projects, and inter-township activities | Joint meetings, shared monitoring, inter-township coordination, and cross-boundary projects; normalised to 0–1 | Township | Measures operational capacity for joint implementation and constitutes in the GMI |
| Administrative boundary proximity | Distance to the nearest township boundary | where is the distance from grid cell i to the nearest township boundary and is the distance-decay parameter. | Grid summarised by ERPZ | Identifies ERPZs with greater potential demand for cross-boundary coordination |
| Analytical Component | Baseline Setting | Alternative Settings | Stability Output |
|---|---|---|---|
| Minimum ecological-source area | 1.5 km2 | 1.2 and 1.8 km2 | Source number, total source area, spatial overlap, dPC and dIIC rankings |
| Natural/social resistance ratio | 0.643/0.357 | 0.50/0.50, 0.60/0.40, and 0.70/0.30 | Resistance-surface correlation, corridor configuration, bottleneck retention, and ERPZ overlap |
| Maximum source-pair distance | 20 km | 16 and 24 km | Retained source pairs, corridor number and length, IIC, PC, dPC, and dIIC |
| Relative excess-cost tolerance | 0.05 | 0.04 and 0.06 | Corridor-zone area, width, class retention, and Jaccard similarity |
| High-resistance threshold | Upper 20% of the basin-wide resistance distribution | Upper 15% and upper 25% | High-resistance overlap, BI rankings, and retention of B1–B3 |
| BI component weights | Corridor load/minimum width/high-resistance overlap = 0.40/0.35/0.25 | Each component perturbed by ±10% and ±20%, followed by renormalisation | Segment-level BI rankings and retention of principal bottlenecks |
| RPI component weights | Ecological movement resistance/BI = 0.57/0.43 | 0.50/0.50, 0.60/0.40, and 0.70/0.30 | RPI rankings, ERPZ number and area, Jaccard similarity, and ecological-priority type |
| GMI construction | Equal weights of 1/3 for policy coordination, fiscal alignment, and cooperation frequency | Three component-dominant weighting scenarios and geometric aggregation | ERPZ-level GMI rankings and implementation-context classification |
| ABPI distance-decay parameter | 500 m | 400 and 600 m | ERPZ-level ABPI rankings and implementation-context classification |
| Basin Section | Number of Sources | Total Source Area (km2) | Share of Total Source Area (%) | Mean Source Area (km2) | Mean (%) | Key Sources | Highest / Source | Highest /(%) | Spatial Characteristics |
|---|---|---|---|---|---|---|---|---|---|
| Upper basin | 11 | 154.8 | 49.6 | 14.07 | 8.85 | ES-01, ES-02 ES-03, ES-04 | ES-01 | 17.6/16.1 | Large forest and headwater cores; contribution primarily associated with habitat area and flux |
| Middle basin | 10 | 112.5 | 36.0 | 11.25 | 11.39 | ES-12, ES-13 ES-14, ES-16 ES-17, ES-18 | ES-16 | 19.2/16.8 | Heterogeneous valley sources with strong riparian and slope–valley connector functions |
| Lower basin | 7 | 45.1 | 14.4 | 6.44 | 7.29 | ES-24 | ES-24 | 12.4/10.6 | Smaller fragmented sources with localised wetland-margin connector importance |
| Entire basin | 28 | 312.4 | 100.0 | 11.16 | 9.37 | 11 sources | ES-16 | 19.2/16.8 | Basin-wide connectivity maintained jointly by large habitat cores and intermediate connector patches |
| Corridor Class | Number of Connections (%) | Total Centreline Length, km (%) | Standardised MCR, Median (IQR) | Minimum Width, m, Median (IQR) | High-Resistance Overlap, %, Median (IQR) | Bottleneck Intensity, Median (IQR) |
|---|---|---|---|---|---|---|
| Primary | 22 (28.9) | 86.9 (35.7) | 0.17 (0.09–0.26) | 286 (205–392) | 8.6 (5.1–13.4) | 0.26 (0.18–0.34) |
| Secondary | 33 (43.4) | 93.4 (38.4) | 0.48 (0.37–0.59) | 164 (112–236) | 21.7 (15.2–29.8) | 0.52 (0.42–0.62) |
| Tertiary | 21 (27.6) | 62.8 (25.8) | 0.81 (0.70–0.91) | 76 (48–118) | 42.6 (33.5–52.8) | 0.79 (0.68–0.88) |
| Entire network | 76 (100.0) | 243.1 (100.0) |
| ERPZ | Basin Section | Dominant Ecological Constraint | Ecological Priority Type | Area (km2) | BI | RPI | GMI | ABPI | |
|---|---|---|---|---|---|---|---|---|---|
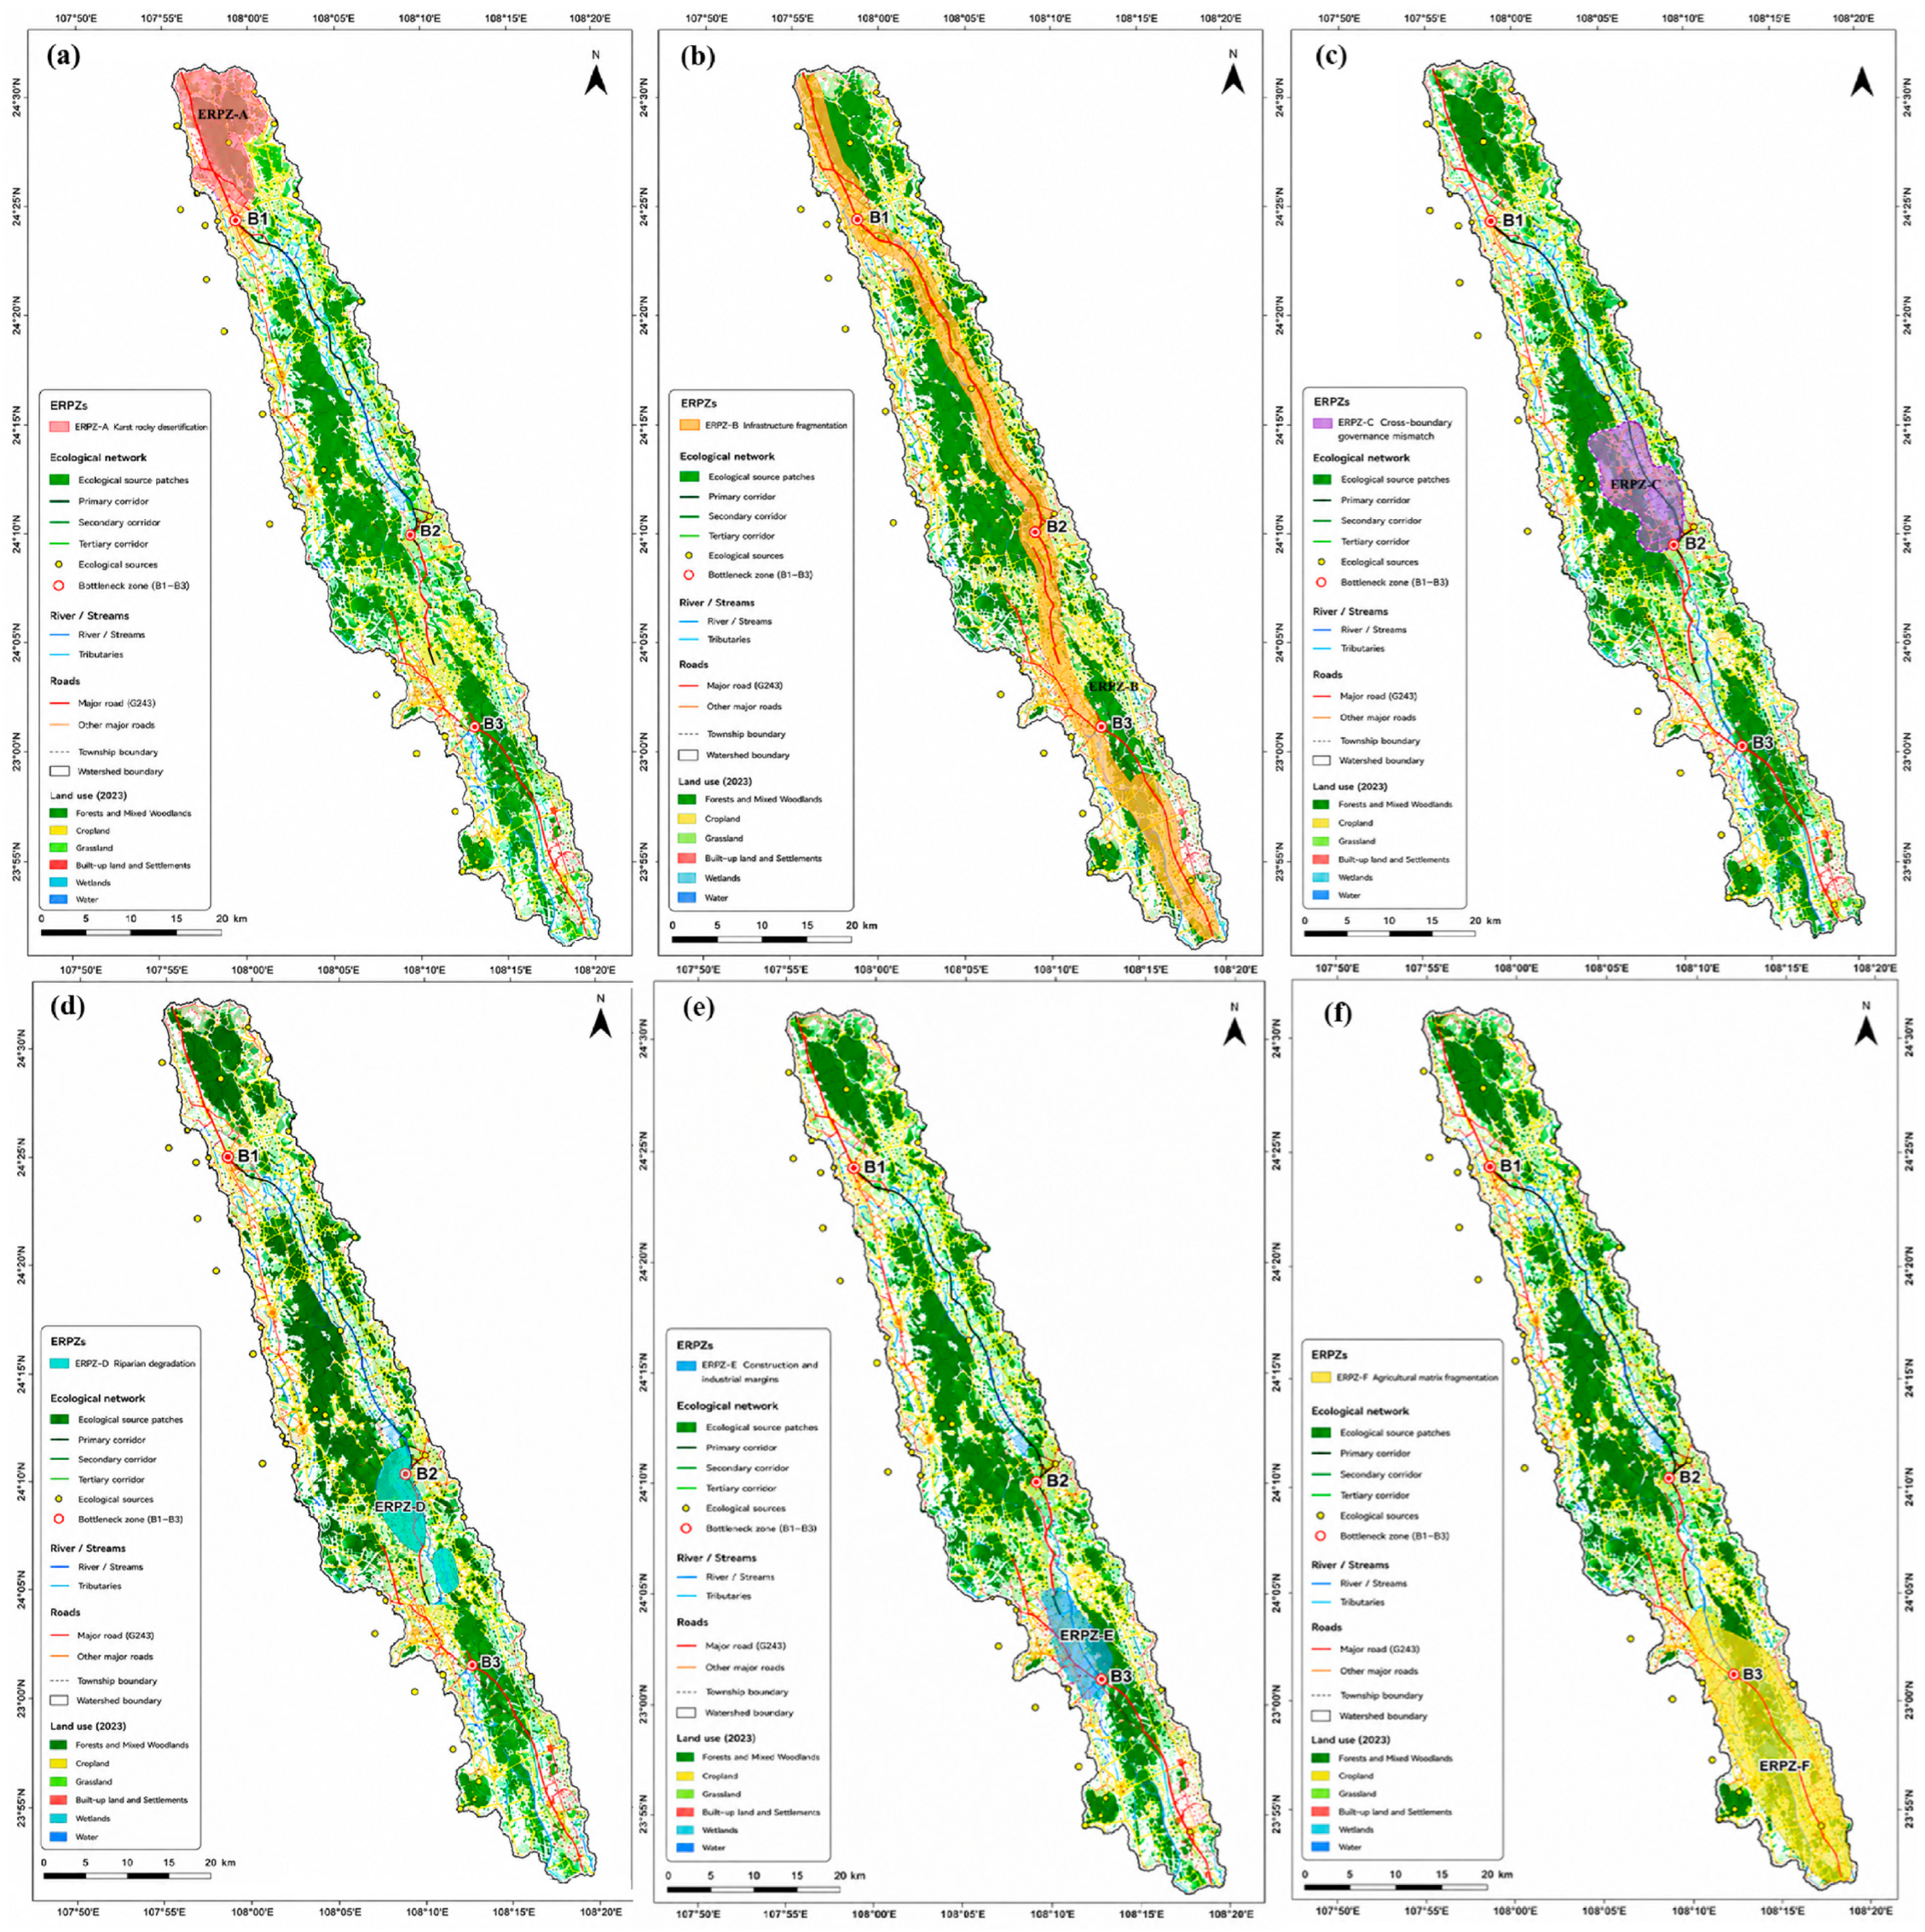
| ERPZ-A | Upper middle | Quarry disturbance, exposed karst slopes, vegetation degradation, and erosion-prone source margins | Resistance dominated | 24.8 | 0.74 | 0.62 | 0.69 | 0.61 | 0.58 |
| ERPZ-B | Middle | Road–riparian interruption, corridor convergence, and localised corridor-zone narrowing | Bottleneck dominated | 13.6 | 0.63 | 0.84 | 0.72 | 0.68 | 0.86 |
| ERPZ-C | Middle | Connector discontinuity and multiple corridor convergence within a fragmented valley matrix | Compound priority | 20.7 | 0.68 | 0.78 | 0.72 | 0.64 | 0.74 |
| ERPZ-D | Middle lower | Riparian discontinuity, wetland-margin degradation, and restricted longitudinal connectivity | Resistance | 18.4 | 0.60 | 0.73 | 0.66 | 0.72 | 0.69 |
| ERPZ-E | Lower | Construction-, settlement-, and industrial-edge compression of riparian and wetland-associated connections | Resistance | 16.9 | 0.72 | 0.65 | 0.69 | 0.57 | 0.82 |
| ERPZ-F | Middle lower | Agricultural-matrix fragmentation, rural-road disturbance, and discontinuous field-margin and stepping-stone habitats | Resistance | 24.1 | 0.66 | 0.58 | 0.63 | 0.66 | 0.63 |
| Total or median | — | — | — | 118.5 | — | — | — | 0.65 | 0.72 |
| Assessment Component | Validation or Scenario Basis | Metric | Interpretation |
|---|---|---|---|
| Land-cover classification | 230 independent validation samples | Overall accuracy | 0.896; 95% CI: 0.852–0.935 |
| Land-cover classification | 230 independent validation samples | Cohen’s kappa | 0.874; 95% CI: 0.821–0.921 |
| Field verification | 16 representative corridor sections | Consistent sections | 14 of 16 (87.5%) |
| Corridor-zone stability | Alternative source, resistance, corridor, and BI settings | Jaccard similarity | 0.760–0.936 |
| ERPZ stability | Alternative resistance–BI weights and corridor settings | 0.851–0.953 | |
| Source-ranking stability | Alternative source and resistance settings | Spearman correlation of | 0.986–1.000 |
| Spearman correlation of | 0.993–0.999 | ||
| Bottleneck stability | Alternative resistance thresholds and BI weights | Principal-cluster retention | B1–B3 retained |
| Governance sensitivity | Alternative GMI weights and ABPI decay parameters | Implementation context stability | Changes concentrated near median thresholds |
| Implementation Context | ERPZs | Main Implementation Issue | Indicative Coordination and Monitoring |
|---|---|---|---|
| Local implementation | ERPZ-A | Low governance mismatch and limited boundary exposure | Designate a lead unit; monitor implementation, maintenance, vegetation recovery, and erosion control. |
| Institutional reinforcement | ERPZ-D, ERPZ-F | Higher governance mismatch within the relevant administrative units | Clarify responsibilities and monitoring procedures; assess implementation continuity, riparian condition, and agricultural compatibility. |
| Cross-boundary coordination | ERPZ-C, ERPZ-E | High exposure to township boundaries | Coordinate restoration timing, land-use controls, monitoring, and maintenance between adjacent townships. |
| Compound coordination | ERPZ-B | High governance mismatch and boundary exposure at a road–riparian bottleneck | Establish interdepartmental coordination; monitor responsibility fulfilment, crossing condition, riparian continuity, and maintenance. |
| Analytical Component | Contribution | Principal Limitation | Future Validation |
|---|---|---|---|
| Sequential SRCG framework | Separates ecological-priority identification from governance implementation assessment | Does not demonstrate causal relationships between governance conditions and ecological outcomes | Longitudinal evaluation of implemented restoration projects |
| Source and graph analysis | Quantifies habitat, flux, and connector importance using dPC and dIIC | Results depend on source definition and generalised connectivity assumptions | Species-specific habitat, occurrence, movement, or genetic data |
| Ecological movement resistance | Integrates natural constraints and anthropogenic disturbance without governance variables | Does not capture species- or season-specific responses | Taxon-specific and seasonal resistance models |
| MCR and BI | Identifies potential connections and local structural vulnerability | Modelled corridors and corridor load do not demonstrate actual movement | Camera traps, acoustic surveys, tracking and landscape genetics |
| RPI and ERPZs | Differentiates resistance-, bottleneck-, and compound-priority mechanisms | Boundaries depend on parameters and classification choices | Finer-resolution mapping and post-restoration monitoring |
| GMI–ABPI assessment | Characterises institutional mismatch and boundary exposure after ecological zoning | Does not prove governance conflict or implementation failure | Interviews, budgets, project records, and stakeholder analysis |
| Stability analysis | Tests consistency under deterministic parameter scenarios | Does not provide a full probabilistic uncertainty distribution | Reproducible GIS ensembles and formal uncertainty propagation |
Disclaimer/Publisher’s Note: The statements, opinions and data contained in all publications are solely those of the individual author(s) and contributor(s) and not of MDPI and/or the editor(s). MDPI and/or the editor(s) disclaim responsibility for any injury to people or property resulting from any ideas, methods, instructions or products referred to in the content. |
© 2026 by the authors. Licensee MDPI, Basel, Switzerland. This article is an open access article distributed under the terms and conditions of the Creative Commons Attribution (CC BY) license.
Share and Cite
Wang, J.; Li, B.; Song, J. Ecological Network Bottlenecks and Restoration Priorities in the Chengjiang Karst Basin, China. Land 2026, 15, 1332. https://doi.org/10.3390/land15081332
Wang J, Li B, Song J. Ecological Network Bottlenecks and Restoration Priorities in the Chengjiang Karst Basin, China. Land. 2026; 15(8):1332. https://doi.org/10.3390/land15081332
Chicago/Turabian StyleWang, Jing, Bo Li, and JianBing Song. 2026. "Ecological Network Bottlenecks and Restoration Priorities in the Chengjiang Karst Basin, China" Land 15, no. 8: 1332. https://doi.org/10.3390/land15081332
APA StyleWang, J., Li, B., & Song, J. (2026). Ecological Network Bottlenecks and Restoration Priorities in the Chengjiang Karst Basin, China. Land, 15(8), 1332. https://doi.org/10.3390/land15081332