Article

Assessing Public Experience of Waterfronts and Its Coupling with Urban Vitality: Evidence from Shanghai, China

1
School of Ecological and Environmental Sciences, East China Normal University, Shanghai 200241, China
2
Shanghai Environmental Sanitation Engineering Design Institute Co., Ltd., Shanghai 200232, China
3
School of Landscape Architecture, Nanjing Forestry University, Nanjing 210037, China
4
Department of Environmental Sciences, University of North Carolina Wilmington, Wilmington, NC 28403, USA
5
School of Design and Humanities, Chongqing University of Science and Technology, Chongqing 401331, China
*
Author to whom correspondence should be addressed.
Land 2026, 15(7), 1297; https://doi.org/10.3390/land15071297
Submission received: 20 June 2026 / Revised: 14 July 2026 / Accepted: 18 July 2026 / Published: 19 July 2026

Abstract

Urban waterfronts are important components of urban blue-green infrastructure, supporting ecological functions and public activities. However, existing assessments often examine waterfronts from separate perspectives, limiting an integrated understanding of waterfront experience. Building upon existing research on waterfront environments, this study develops an integrated socio-ecological framework that incorporates multiple environmental and spatial attributes to assess the Public Experience of Waterfronts (PEW) across four dimensions: amenity, comfort, experiential diversity, and access equity. By applying this framework to river segments in central Shanghai, the study examines spatial variations in PEW and its spatial coordination with surrounding urban vitality within 15 min living circles. Results reveal clear differences across river groups and spatial locations. Large rivers generally exhibit higher PEW levels, while medium and small rivers show relatively lower performance. High PEW areas are mainly concentrated along major waterfront corridors, whereas urban vitality is stronger in inner urban areas and declines outward. The coordination between PEW and urban vitality follows similar spatial patterns, with large rivers showing higher coordination levels and smaller rivers more frequently experiencing spatial mismatches. These findings highlight the importance of integrated assessment of waterfront qualities and surrounding urban contexts, providing practical insights for differentiated waterfront planning and sustainable urban development.

1. Introduction

Urban waterfronts are transitional zones between land and water, serving multiple functions within urban ecosystems and public life. As a key component of urban blue-green infrastructure, waterfronts perform vital ecological functions, such as climate regulation and flood risk mitigation, whilst also serving as public spaces for recreation and social interaction [1,2,3,4]. In recent years, waterfront areas have been studied within the broader framework of blue spaces and attracted increasing attention due to their environmental and social value.
A variety of studies show that blue spaces can play a significant role in enhancing good human health and well-being. From the perspective of environmental psychology, blue spaces have increasingly been recognized as restorative environments that may facilitate stress reduction and psychological recovery [5,6]. Furthermore, repeated interactions with waterfront places may foster a sense of place and place attachment by creating emotional bonds and strengthening social connections between people and their environments [7,8]. An analysis of the Scottish national records shows that older adults living near freshwater or coastal environments have fewer prescriptions for antidepressants [9], with similar findings observed in India [10]. These findings also link waterfront research to the United Nations Sustainable Development Goals (SDGs) 3 (Good Health and Well-Being) and 11 (Sustainable Cities and Communities) [11].
The influence of environmental characteristics on user perception and evaluation has also been studied. For instance, Luo et al. [12] found that visitors’ preferences for urban blue spaces are closely linked to their perceptions of physical and aesthetic qualities, particularly their preference for spatial harmony. Furthermore, an analysis of a large-scale online review dataset indicates that blue environments are rated more highly than green environments, with aesthetic value being the most highly appreciated aspect [13]. In addition to perceptual evaluations, studies have examined how waterfronts promote public use through spatial attributes such as accessibility, facilities, and spatial continuity. Che et al. [14] proposed an index for urban riverfront public accessibility that integrates spatial and visual accessibility, corridor continuity, and amenity. From the perspective of environmental justice, unequal access to high-quality blue spaces may reinforce socio-spatial inequalities, making access equity an important consideration in waterfront evaluation [15]. Liu et al. [3] assessed the vitality of waterfront areas using social media data, showing that site design, surrounding population density and facilities are closely associated with usage.
Taken together, these studies indicate that waterfront experience cannot be understood through environmental quality alone, but also involves perceptual qualities, opportunities for public use, and equitable access to waterfront resources. Despite these advances, most existing studies still investigate waterfronts from separate perspectives, focusing separately on human well-being, environmental perception, or spatial use. As a result, it remains unclear how the various characteristics of urban waterfront areas collectively influence human-water interactions. Given that current planning visions place a strong emphasis on the public experience, this limitation is particularly evident. For example, Vision 2020: New York City Comprehensive Waterfront Plan [16] identifies enhancing the public experience of urban waterways as a central goal, but offers limited guidance on how to systematically assess this aspect.
To bridge this gap, this study introduces the concept of Public Experience of Waterfronts (PEW). Rather than directly measuring individuals’ subjective experiences or satisfaction, PEW is understood as a multidimensional characteristic of waterfront environments, reflecting the extent to which their spatial, environmental, and perceptual qualities support public use and meaningful human-water interactions. Based on this conceptualization, a four-dimensional assessment framework is developed from a socio-ecological perspective. The four dimensions are considered complementary rather than hierarchical. Waterfront amenity reflects the environmental quality, safety, and supporting conditions that make waterfront spaces suitable for public use; waterfront comfort represents the physical and visual conditions that support comfortable stays; experiential diversity reflects the variety of waterfront settings, water-engagement facilities, and observed activity diversity that support diverse human-water interactions; and access equity emphasizes the accessibility, openness, spatial availability, and connectivity of waterfront resources.
In addition to evaluating waterfront areas as standalone public spaces, they are generally expected to contribute to the revitalization of surrounding urban areas. In studies on waterfront regeneration, this role has been described as an urban catalytic effect, where high-quality waterfront environments may attract human activities and support local revitalization, while surrounding urban vitality provides contextual conditions for waterfront use [17,18,19,20]. Therefore, PEW and urban vitality can be regarded as two interrelated yet distinct urban subsystems: PEW reflects the quality of waterfront environments in supporting human-water interactions, whereas urban vitality represents the intensity of surrounding human activities and socioeconomic support. In high-density cities such as Shanghai, waterfront areas are extremely valuable public spaces. However, high-quality waterfront environments do not necessarily correspond to high urban vitality, whilst highly vibrant urban districts may lack high PEW performance, indicating possible spatial mismatches between environmental conditions and human activities [21,22,23]. Previous research has primarily linked urban vitality to urban morphological characteristics such as density, land-use mix and accessibility [24,25,26], but has paid less attention to its spatial coordination with waterfront experience. Consequently, investigating their coupling coordination is essential for identifying spatial mismatches and formulating tailored planning strategies.
Therefore, the overall goal of this study is to systematically evaluate PEW and reveal its spatial coupling patterns with surrounding urban vitality. Specifically, this study aims to: (1) develop a multidimensional framework for assessing PEW; (2) examine spatial variations of PEW across different river segments in Shanghai’s central urban area; (3) evaluate the coupling coordination between PEW and surrounding urban vitality within 15 min living circles; and (4) identify spatial mismatch patterns and provide targeted planning implications.

2. Study Area

This study focuses on the central urban area of Shanghai, China, within the Outer Ring Road. As an international metropolis, Shanghai is rich in water resources and boasts a long-standing waterfront culture. In recent years, Shanghai has vigorously promoted the regeneration and redevelopment of its waterfront areas, with the most notable achievements being those along the banks of the Huangpu River and the Suzhou Creek. The slow-mobility systems on both banks have been fully integrated, creating continuous and unobstructed spaces for walking and cycling. Such large regeneration projects have strongly increased the value of the waterfronts in terms of leisure and recreation available for the citizens.
However, this raises a question worthy of consideration: even if waterfront spaces are physically accessible and well-connected, does this necessarily facilitate meaningful interactions between people and water? Field observations indicated that in several waterfront segments, the activities recorded were mostly walking, resting, and sightseeing, whereas opportunities for direct water-related engagement appeared relatively limited. This pattern was consistent with the observed physical conditions of these waterfront environments, such as engineered or visually separated shorelines, single-function infrastructure, and the limited provision of facilities that support close contact with the water. Against this background, Shanghai serves as a suitable case for examining whether improved waterfront accessibility and continuity are accompanied by enhanced public experience, whilst also providing a reference for other megacities facing similar waterfront regeneration challenges.
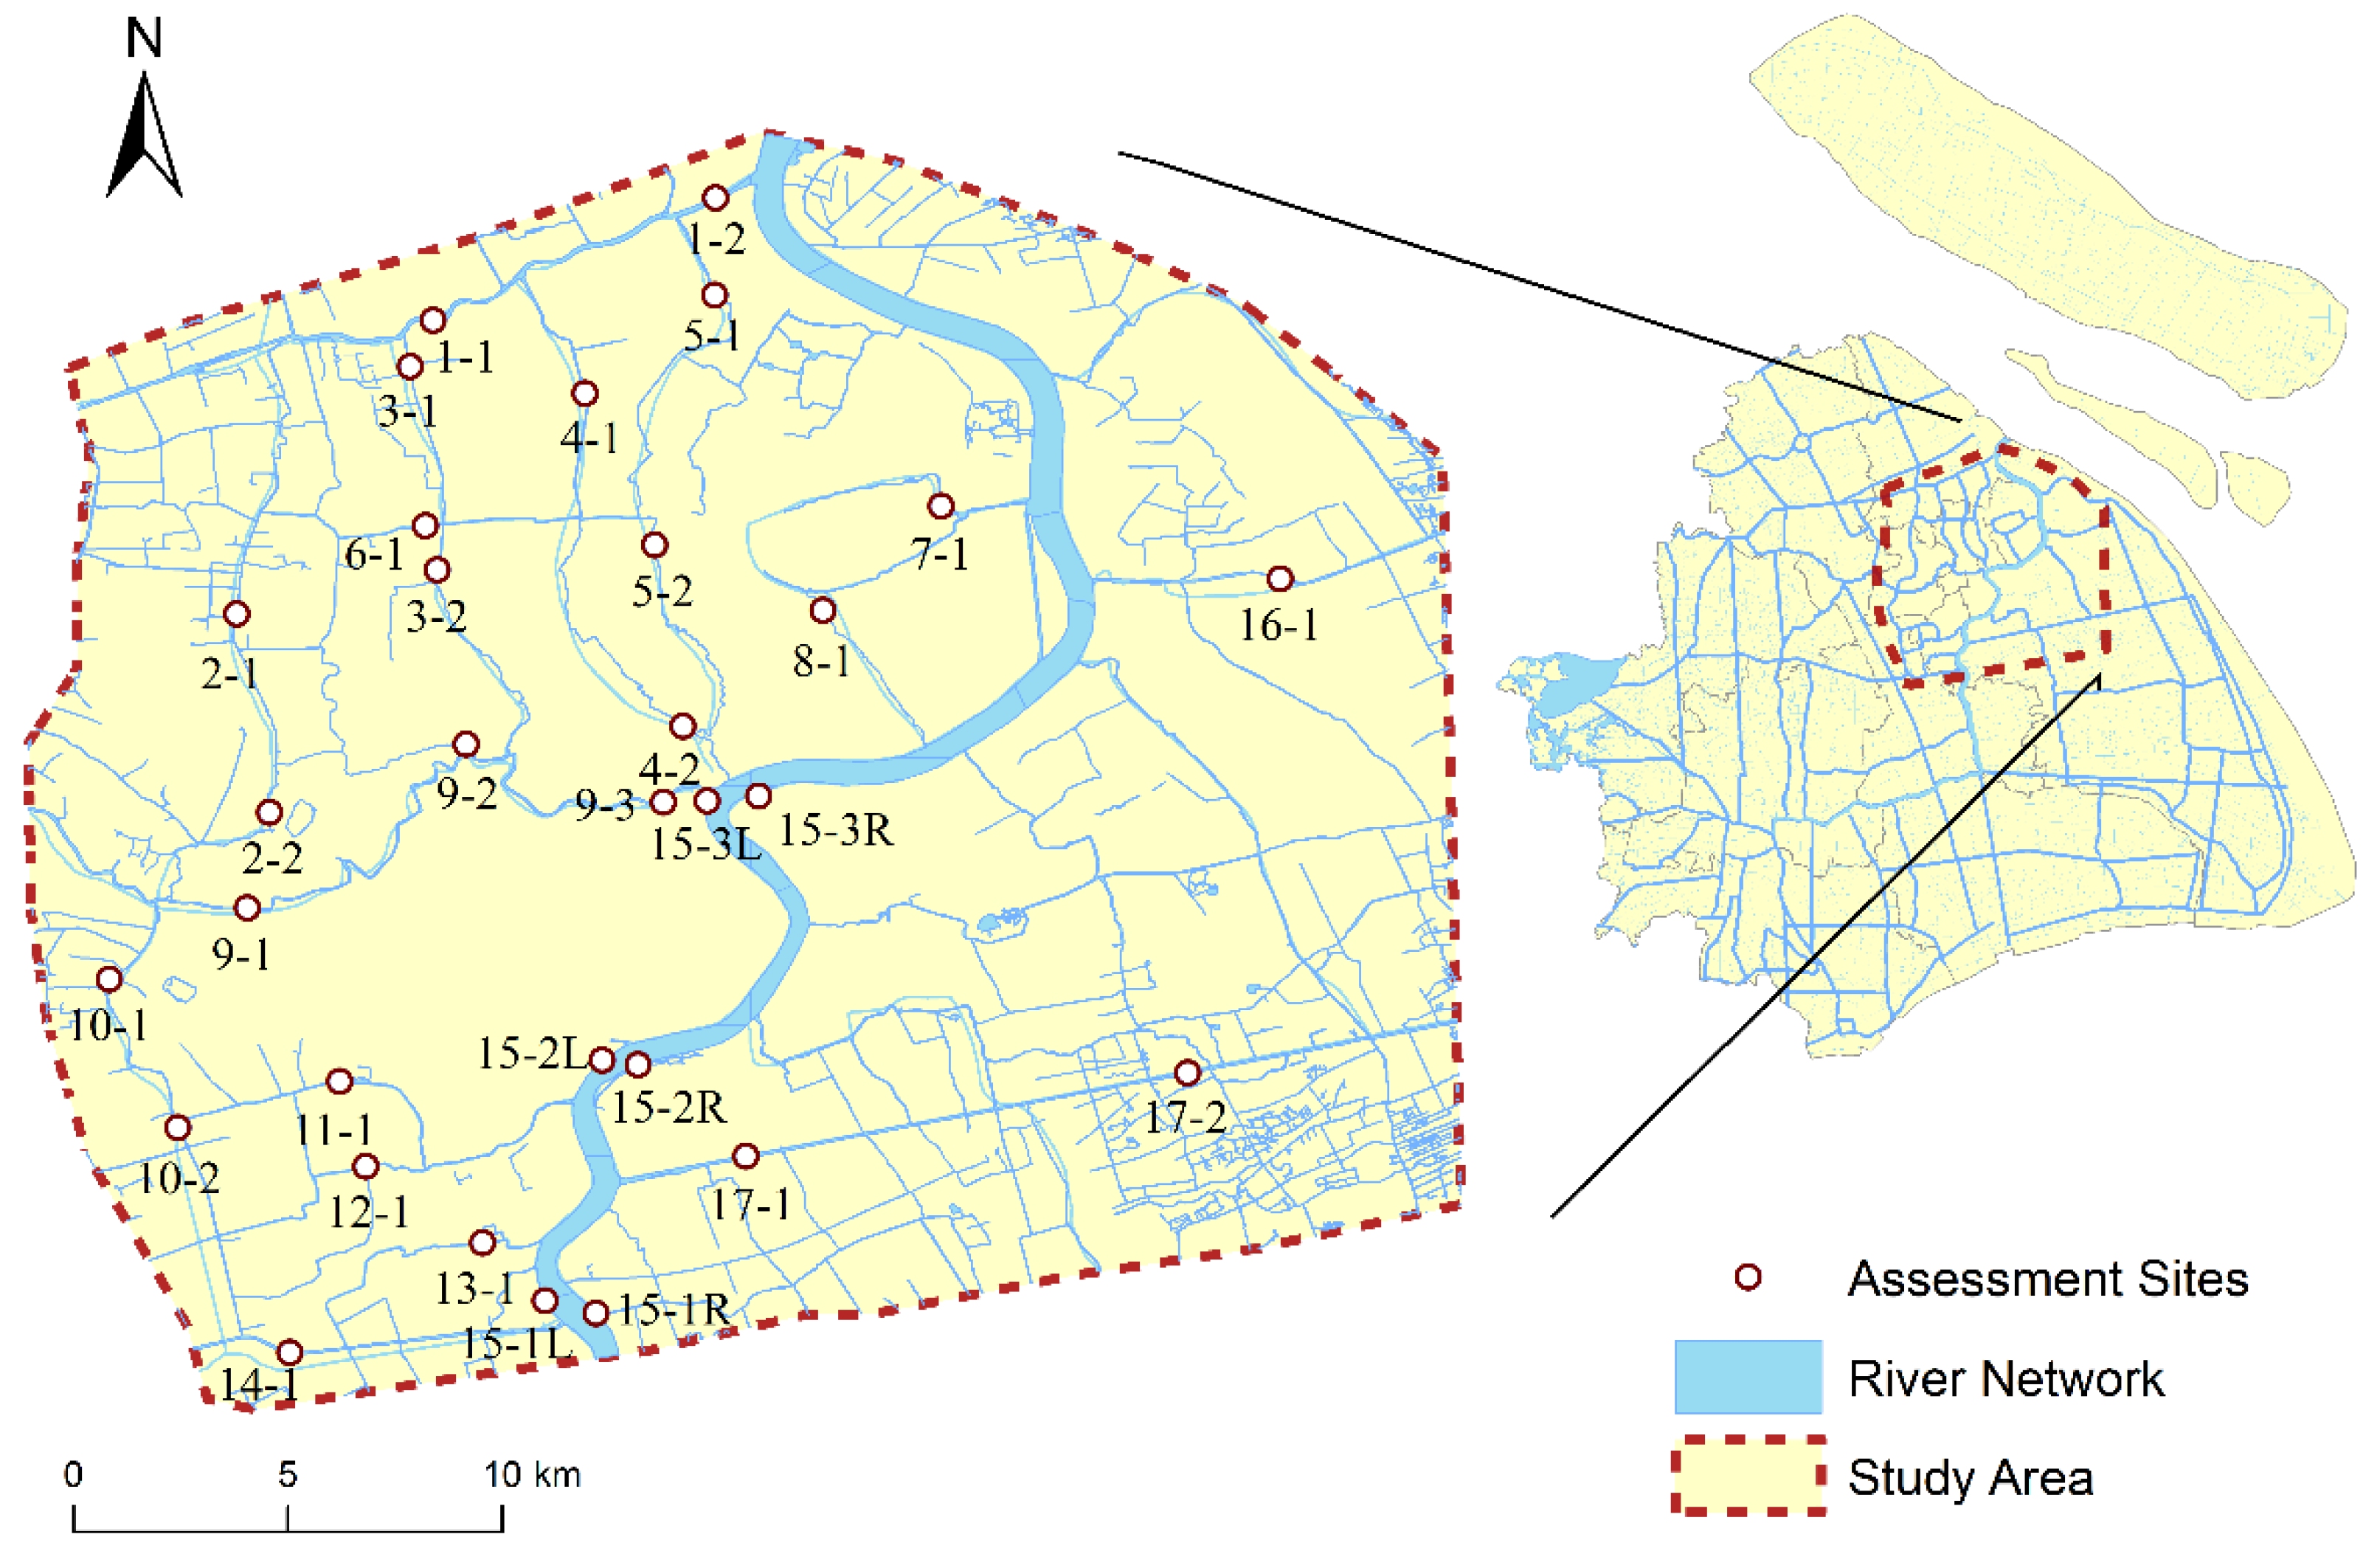
According to the 2023 Shanghai River (Lake) Report [27], the city has 46,441 rivers and lakes, covering a total area of 655.19 km2, with a water surface ratio of 10.33%. Based on official river datasets and field verification, this study selected riparian areas along 17 municipal rivers within the central urban area. These rivers were selected to cover major regenerated waterfront corridors, ordinary urban rivers, and smaller neighborhood waterways, as well as diverse surrounding urban contexts. To ensure an even distribution of field sites along the selected rivers, the selected riparian spaces were divided into 28 sampling units using an interval of approximately 10 km as a reference. Within each sampling unit, two assessment points were established on the left and right banks so that both banks of each river segment could be assessed, resulting in a total of 56 assessment points. The detailed geographical coordinates of the sampled riparian segments are provided in Supplementary Table S1. For field evaluation, each assessment point was assigned a 1 km evaluation reach along the corresponding riverbank, following the monitoring-segment length recommendation in the Guidelines for River and Lake Health Assessment (Trial) [28]. Although the sample does not cover all waterfronts in Shanghai, it includes waterfront segments with different spatial characteristics, riverfront development conditions, and surrounding urban contexts within the central urban area. The study area and distribution of assessment sites are illustrated in Figure 1.

Data Sources and Collection

This study integrates field observations, official monitoring records, and multi-source spatial datasets to construct PEW indicators and characterize surrounding urban vitality. Field survey records, river water quality data, and spatial datasets were used for PEW assessment, while population and GDP grid data, together with POI data, were used to characterize demographic, economic, and social-service vitality around waterfront areas. OSM data provided base spatial layers, including road networks and building footprints, for spatial indicator calculation and GIS-based analysis. Table 1 summarizes the data sources, spatial and temporal information, and their analytical purposes.

3. Methods

This study follows a three-stage methodological framework. First, an evaluation framework for Public Experience of Waterfronts (PEW) is developed (Section 3.1). Second, length-based river grouping and statistical analyses of PEW performance are conducted across waterfront sampling points and river groups (Section 3.2). Third, urban vitality is characterized within delineated 15 min living circles, and its spatial coordination with PEW performance is assessed using a coupling coordination degree model, complemented by quadrant analysis (Section 3.3).

3.1. Development of the PEW Assessment Framework

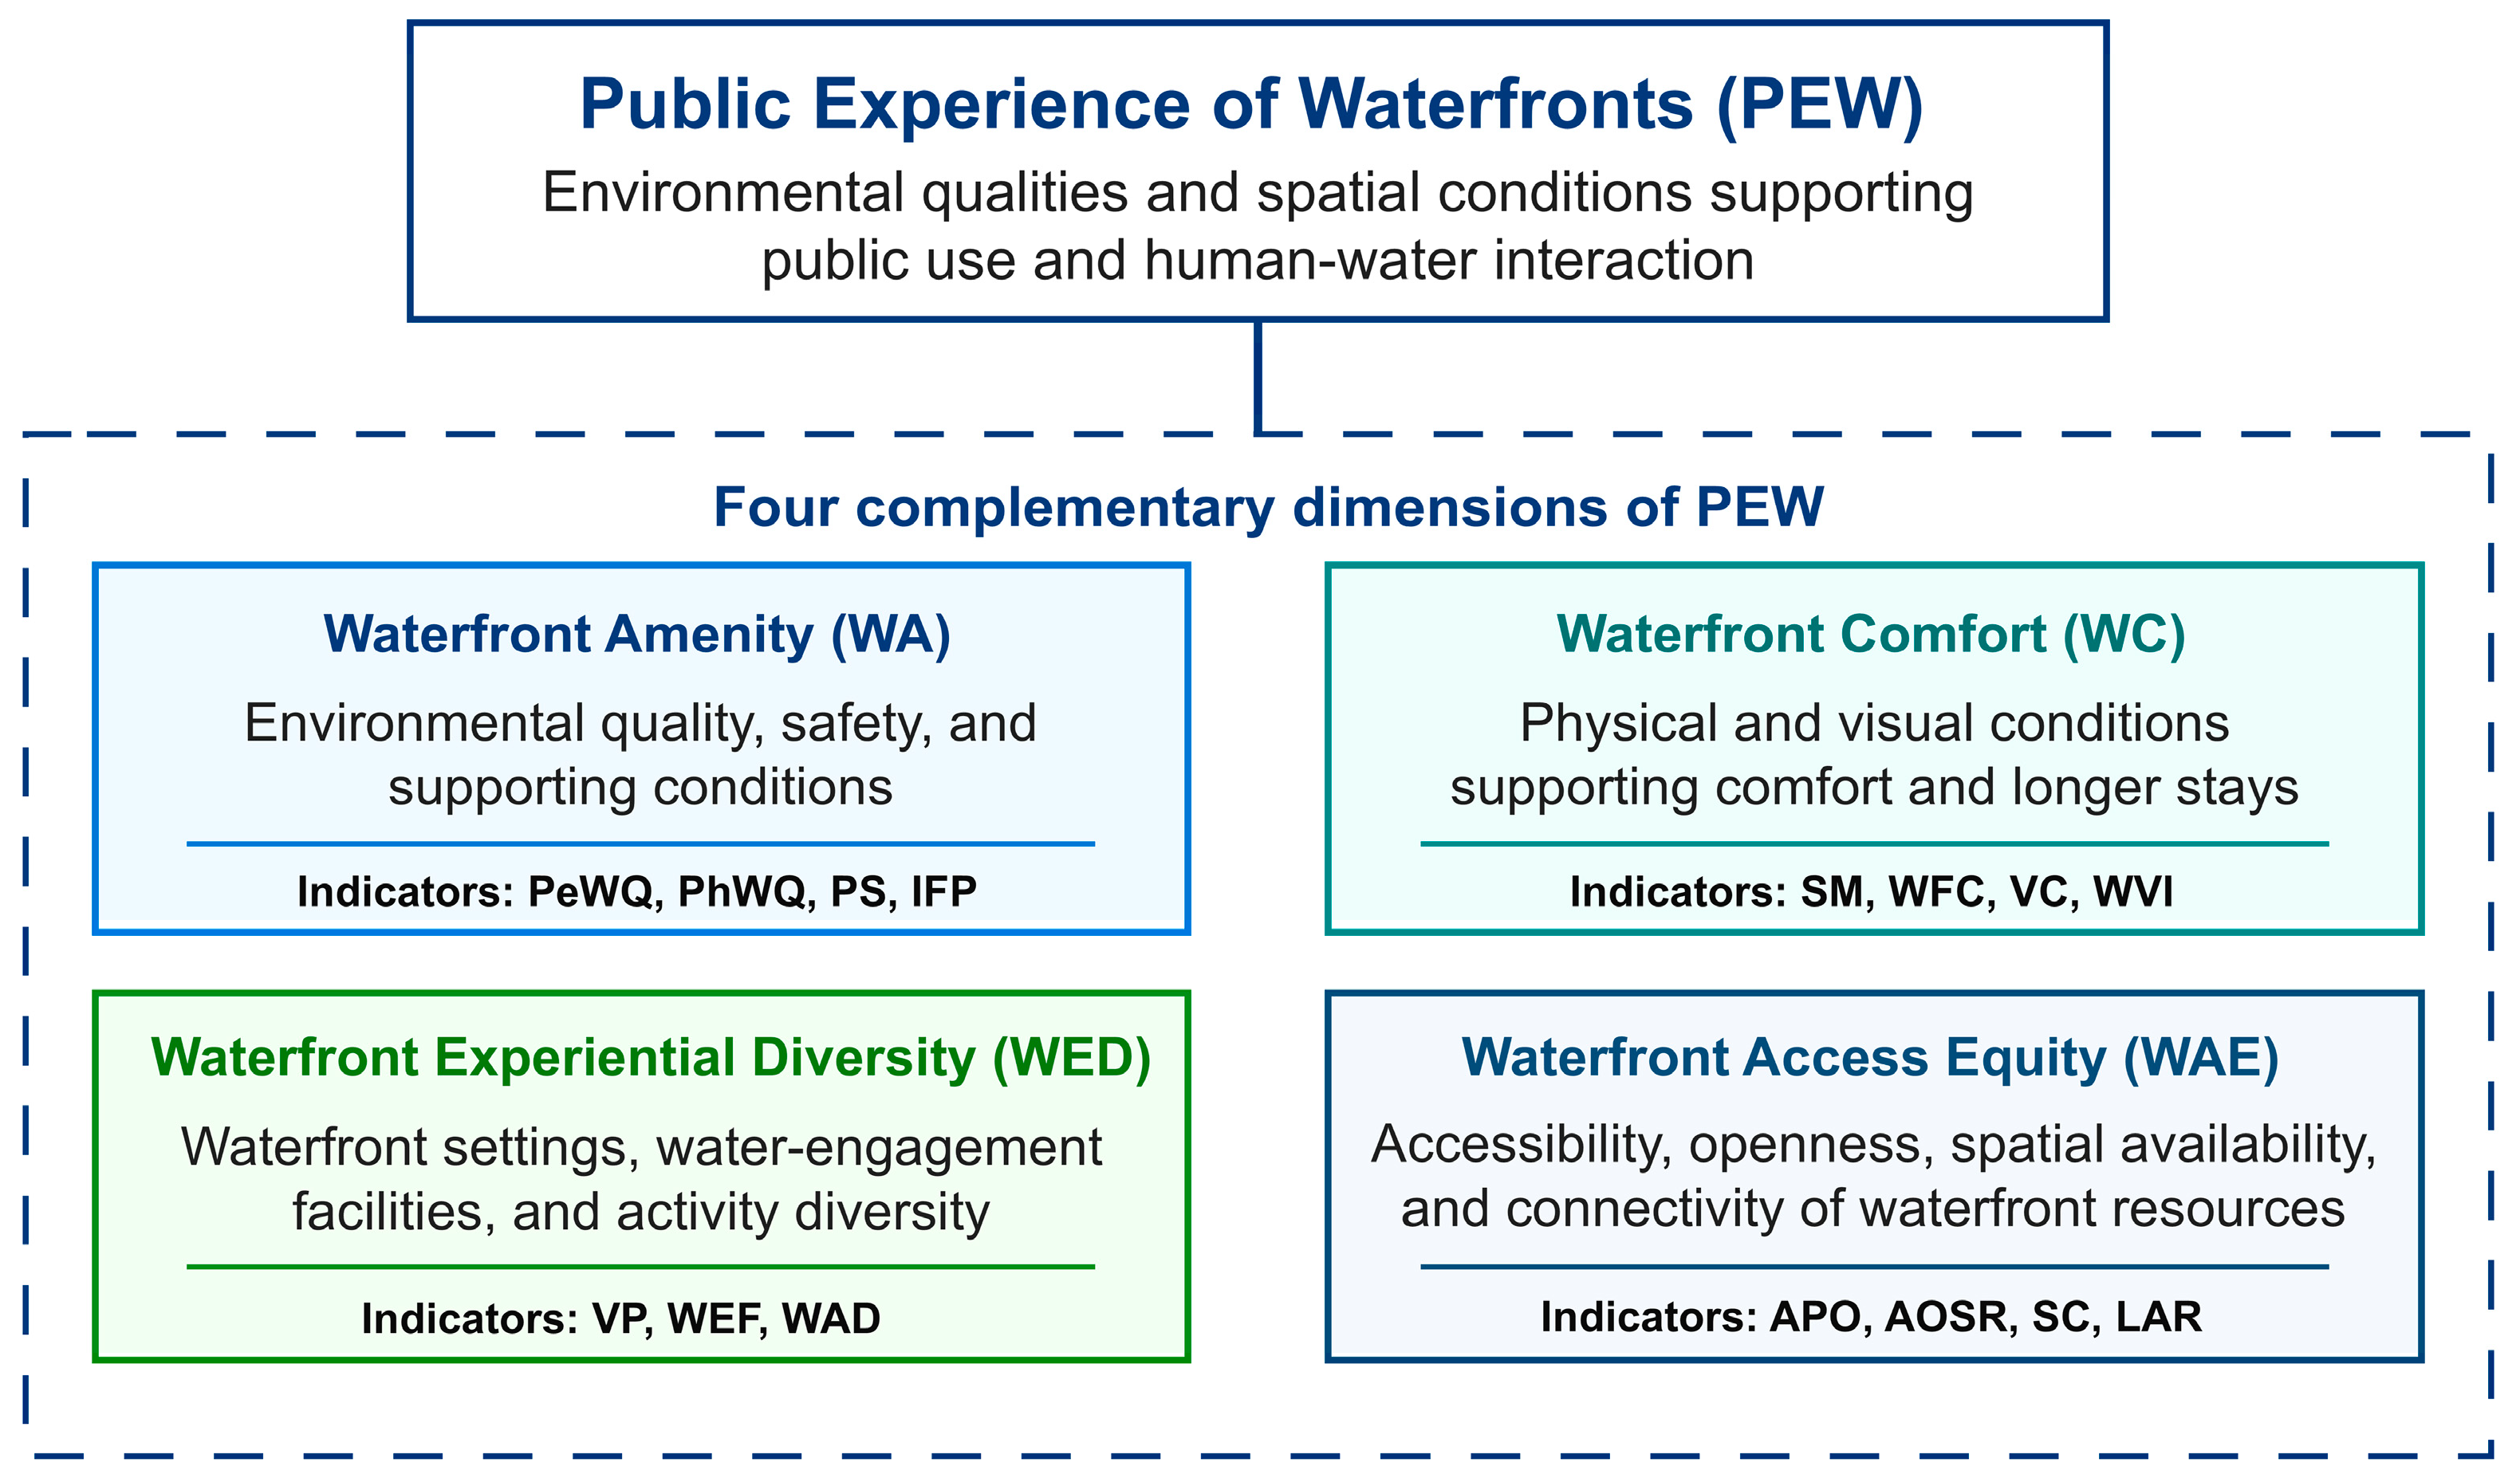
To operationalize the concept of Public Experience of Waterfronts (PEW), this study developed a four-dimensional assessment framework from a socio-ecological perspective. The framework evaluates waterfront experience through environmental qualities and spatial conditions that support public use and human-water interaction. It includes four complementary dimensions: Waterfront Amenity (WA), Waterfront Comfort (WC), Waterfront Experiential Diversity (WED), and Waterfront Access Equity (WAE). Figure 2 presents the conceptual framework of the PEW assessment system.
The indicators were selected based on their relevance to public waterfront experience, their measurability through field observations or spatial datasets, and their comparability across sampled river segments. Accordingly, the PEW framework comprises 15 indicators across the four dimensions. Table 2 summarizes the indicators, descriptions, data sources or assessment methods, and references used to operationalize the PEW assessment framework. All indicators were standardized using a five-point ordinal scale (1 = low, 5 = high), with detailed scoring criteria provided in Supplementary Table S2.
Water Visibility Index (WVI). This indicator quantifies the visible extent of water bodies using panoramic images and semantic segmentation. It is calculated as
W V I i = A r e a w ,     i A r e a i m g , i ,
where i denotes the panorama image sample at each sampling point, Areaw,i denotes the pixel area of visible water bodies, and Areaimg,i denotes the total area of the panorama image.
Accessible Open Space Ratio (AOSR). For this indicator, in accordance with local planning guidelines [43], each evaluation unit is defined as 1 km in length and 100 m in width, extending outwards from the riverbank. Field verification was conducted prior to calculation, and inaccessible units were assigned a value of zero. For accessible units, the ratio is calculated as
    A O S R i = A r e a u n i t , i A r e a b , i A r e a u n i t , i ,
where A r e a u n i t , i denotes the total area of unit i and A r e a b , i denotes the building footprint area within the same unit.
Lateral Access Ratio (LAR). This indicator reflects the degree of lateral connectivity between the waterfront area and the surrounding urban space and is calculated as
    L A R i = L i V i ,
where L i denotes the number of lateral access corridors within unit i and V i denotes the number of shoreline access nodes within the same unit. A lower value indicates stronger lateral connectivity. Specifically, LAR < 1 indicates that a single corridor can connect multiple shoreline points, LAR = 1 indicates a one-to-one correspondence, and LAR > 1 indicates that some corridors cannot directly reach the shoreline.

3.2. River Grouping, Score Calculation, and Unit Aggregation

To compare PEW performance across rivers of different lengths, sampled rivers were divided into three length-based groups for comparative analysis: large rivers (>20 km), medium rivers (10–20 km), and small rivers (<10 km). Channel width was additionally incorporated as a continuous variable in correlation analysis to further examine the associations between river scale and PEW indicators.
Statistical analyses were conducted at the indicator, dimension and system levels using the 56 sampling points. Indicator-level performance was analyzed using descriptive statistics, including mean values and score distributions (1–5). Dimension-level scores were calculated as the arithmetic mean of the indicators within each dimension and used to compare performance across WA, WC, WED, and WAE. The system-level PEW score was calculated as the arithmetic mean of all 15 standardized indicators. Equal weighting was used because PEW is conceptualized as a multidimensional framework for integrating complementary environmental and spatial attributes, without assuming differential importance among individual indicators. These scores were then compared among the three river groups. Spearman’s rank correlation analysis was used to examine the interrelationships among indicators and their associations with river scale, represented by channel width.
For spatial representation and subsequent coupling coordination analysis, the 56 sampling points were aggregated into 31 spatial analytical units (Figure 1). For river segments represented by a single analytical unit, the unit-level PEW value was calculated as the average of the two bank-level scores after examining paired-bank differences. Because of the Huangpu River’s substantially wider channel and larger spatial extent, the two banks of the Huangpu River were retained as separate analytical units to preserve bank-specific characteristics.

3.3. Coupling Coordination and Spatial Analysis

3.3.1. Delineating the 15 min Waterfront Living Circle

The 15 min living circle refers to a spatial planning unit enabling access to essential services within a 15 min travel range [46,47,48]. In this study, a 15 min cycling catchment was adopted to delineate the surrounding service area of each waterfront analytical unit. Cycling was used instead of walking because waterfront spaces are linear public corridors and often serve users beyond the immediate neighborhood. Assuming an average cycling speed of 12 km/h, the catchment distance was set at approximately 3000 m.
Building upon the 31 spatial analytical units defined in Section 3.2, service areas were delineated using the shortest-path algorithm in ArcGIS 10.8 Network Analyst based on road network data. The catchment was used to characterize the surrounding urban context associated with each waterfront analytical unit. Within each service area, population density, GDP density, and POI data were used to characterize demographic, economic, and social-service vitality.

3.3.2. Quantifying Urban Vitality Components

Urban vitality was quantified based on three components: demographic, economic, and social-service vitality. Population density and GDP density were used to represent demographic and economic vitality, respectively. To address differences in spatial resolutions and data formats, the 15 min service areas were used as common spatial units. For population and GDP raster datasets, pixel values within each service area were aggregated and divided by the corresponding area to derive population density and GDP density. For POI data, the numbers of transportation facilities, daily life services, and public facilities were counted within the same service areas to characterize the intensity of different social-service functions.
The derived population density, GDP density, and three POI category counts were classified into five ordinal levels (1–5) using the Natural Breaks (Jenks) method. The ordinal levels were then used as the corresponding urban vitality scores, ensuring comparability across variables and consistency with the PEW scoring scheme.
The demographic and economic vitality scores were assigned according to the ordinal levels of population density and GDP density, respectively. The social-service vitality score was calculated as the unweighted arithmetic mean of the ordinal scores of the three POI categories. These three component scores were used in the subsequent coupling coordination analysis. For quadrant analysis, a Comprehensive Urban Vitality score was calculated for each unit as the unweighted arithmetic mean of the three components, for descriptive comparison with PEW performance.

3.3.3. Coupling Coordination Degree Model (CCDM)

This study adopted the coupling coordination degree model (CCDM) [49,50] to examine the spatial coordination between PEW performance and surrounding urban vitality. The CCDM has been widely applied to assess coordination among interrelated socio-environmental subsystems [51,52,53,54]. In this study, the model was used to identify the degree to which PEW performance is spatially coordinated with demographic, economic, and social-service conditions around waterfront areas. The results were therefore interpreted in terms of spatial coordination rather than causal relationships.
In the CCDM, PEW, demographic vitality, economic vitality, and social-service vitality were treated as four interrelated subsystems. The three urban vitality components were retained as separate subsystems to reflect the different aspects of surrounding urban vitality, including population concentration, economic activity, and service provision, rather than merging them into a single urban vitality index before the coordination assessment.
Prior to calculation, the 1–5 ordinal scores of each subsystem were normalized to a 0–1 range using interval transformation to ensure comparability among subsystems. The formulas are as follows:
    C = 4 × ( U 1 U 2 U 3 U 4 ) 1 / 4 U 1 + U 2 + U 3 + U 4 ,
      T = α U 1 + β U 2 + γ U 3 + δ U 4 ,
  D = C × T ,
where U1, U2, U3, and U4 denote the normalized scores of PEW, demographic vitality, economic vitality, and social-service vitality, respectively. The weights of the four subsystems were determined through expert consultation [55,56]. Five experts with relevant backgrounds in urban planning and environmental assessment were asked to assign weights to the four subsystems based on their overall contribution to the coordination assessment framework. The final weights were obtained by averaging the expert-assigned values. Accordingly, α, β, γ, and δ were set to 0.37, 0.22, 0.15, and 0.26, respectively. The expert-assigned weights are summarized in Supplementary Table S7.
A higher D value indicates stronger coordination. D values are categorised into five levels: 0.0–0.2 (Severe mis-coordination), 0.2–0.4 (Mild mis-coordination), 0.4–0.6 (Basic coordination), 0.6–0.8 (Good coordination), and 0.8–1.0 (High-quality coordination). These levels describe the degree of coordination among the subsystems and do not imply causal relationships.

3.3.4. Quadrant-Based Classification

To examine spatial alignment and mismatch patterns between PEW performance and Comprehensive Urban Vitality, a quadrant-based classification method was employed. As both PEW and Comprehensive Urban Vitality were measured on a 1–5 scale, 3.0 was used as the midpoint threshold to divide the analytical units into four groups:
  • High–High: Both PEW and Comprehensive Urban Vitality scores ≥ 3.0.
  • High Vitality–Low PEW: PEW < 3.0, Comprehensive Urban Vitality ≥ 3.0.
  • High PEW–Low Vitality: PEW ≥ 3.0, Comprehensive Urban Vitality < 3.0.
  • Low–Low: Both scores < 3.0.
This classification reveals spatial alignment and mismatch patterns between PEW performance and Comprehensive Urban Vitality.

4. Results

4.1. Indicator-Level Performance and Correlations

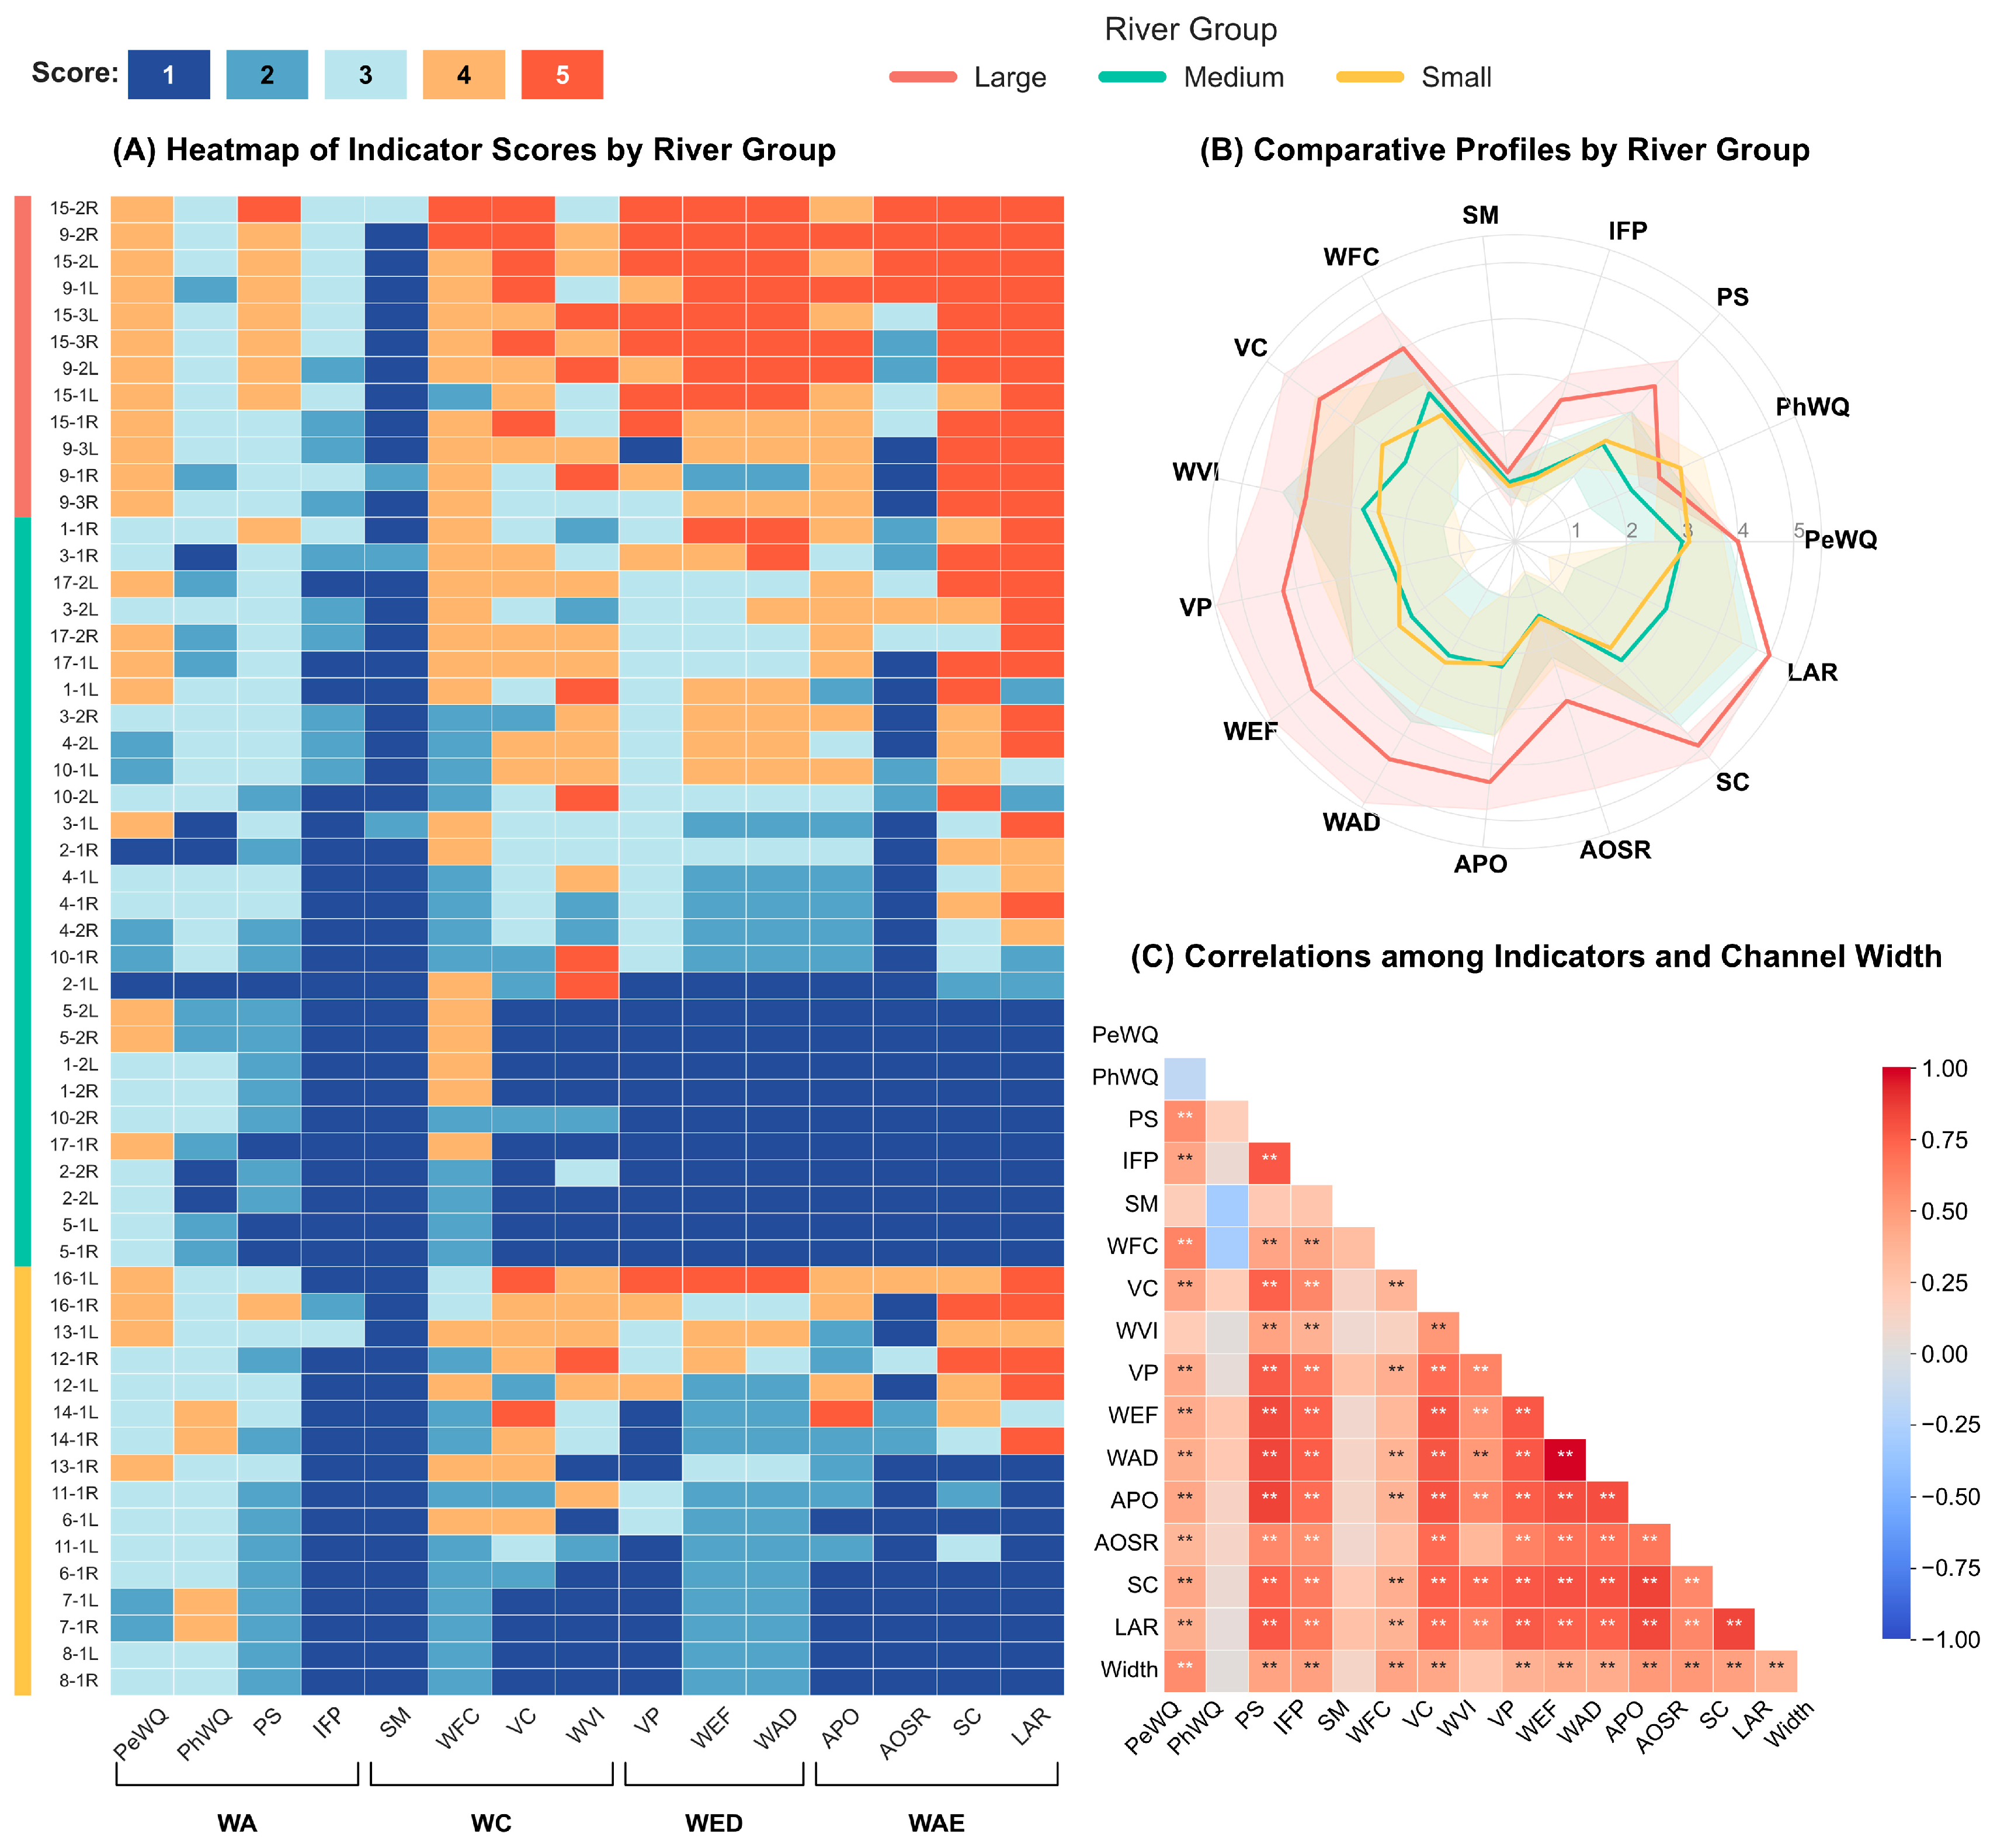
As shown in Figure 3A,B, large rivers score higher on most indicators, whilst medium and small rivers exhibit broadly similar mean scores. This difference is most pronounced for the indicators SC, LAR, APO, WEF, WAD and VP. These indicators consistently show higher values in large rivers, but are obviously lower in medium and small rivers. In contrast, PhWQ achieves the highest mean score in small rivers. Across all river categories, SM and IFP consistently record the lowest mean scores.
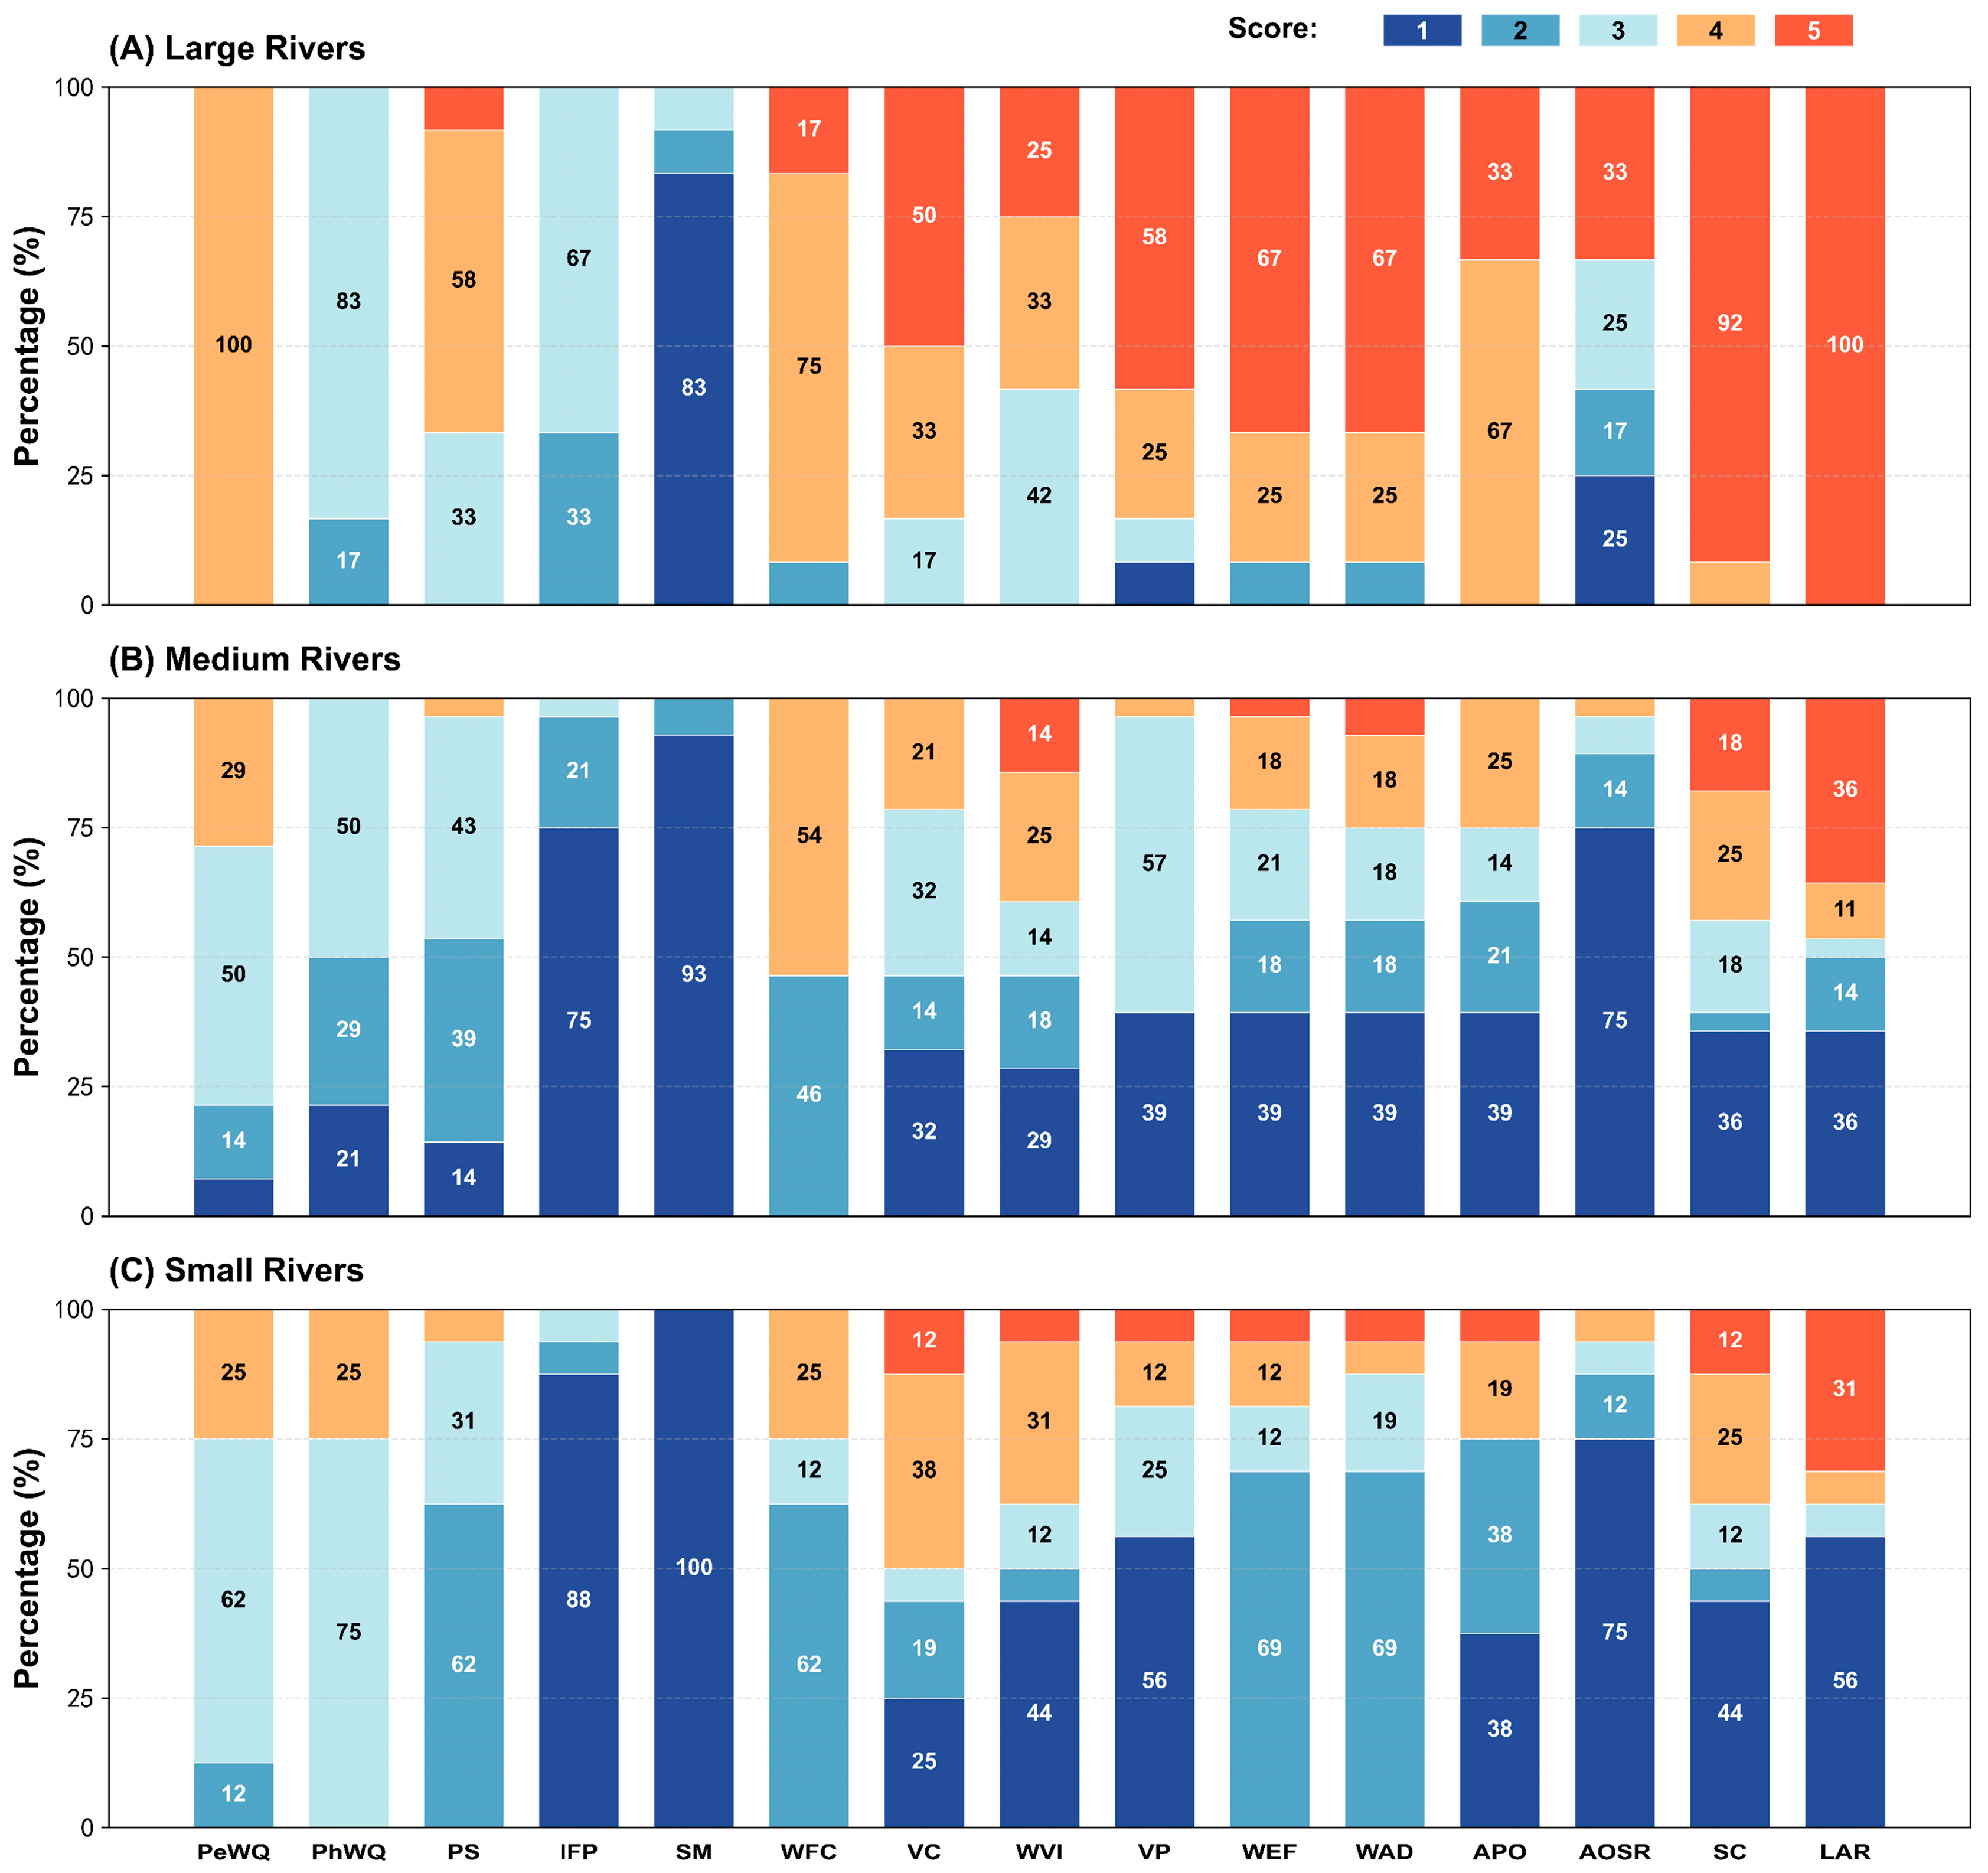
The distribution of indicator scores (Figure 4) further illustrates these differences. Among large rivers (Figure 4A), SC, LAR and APO all receive high scores (4–5), whilst WEF, WAD, PeWQ, and WFC are also predominantly high-scoring. In contrast, the distribution for AOSR is more dispersed. The distribution for medium and small rivers (Figure 4B,C) leans towards lower scores, with some internal variation. SM and IFP are concentrated at score 1, particularly in small rivers (100% and 88% respectively). Medium rivers perform slightly better than small rivers in WFC, SC, LAR, VP and WVI, whilst small rivers have a higher proportion of high scores in several indicators (particularly VC), and small rivers have the lowest proportion of low scores in PhWQ across all river categories.
To examine associations between indicator performance and river scale, a Spearman correlation analysis was conducted using channel width as a continuous variable (Figure 3C). Channel width shows significant positive correlations (p < 0.01) with 12 of the 15 indicators, particularly PeWQ, APO, and AOSR. In contrast, PhWQ, SM, and WVI do not exhibit significant correlations. Most indicators are positively correlated with each other, whereas PhWQ and SM show limited associations with other indicators. These results indicate that channel width is positively associated with most indicators, while categorical comparisons reveal only partial differentiation between medium and small rivers.

4.2. Dimension- and System-Level Performance and Spatial Distribution

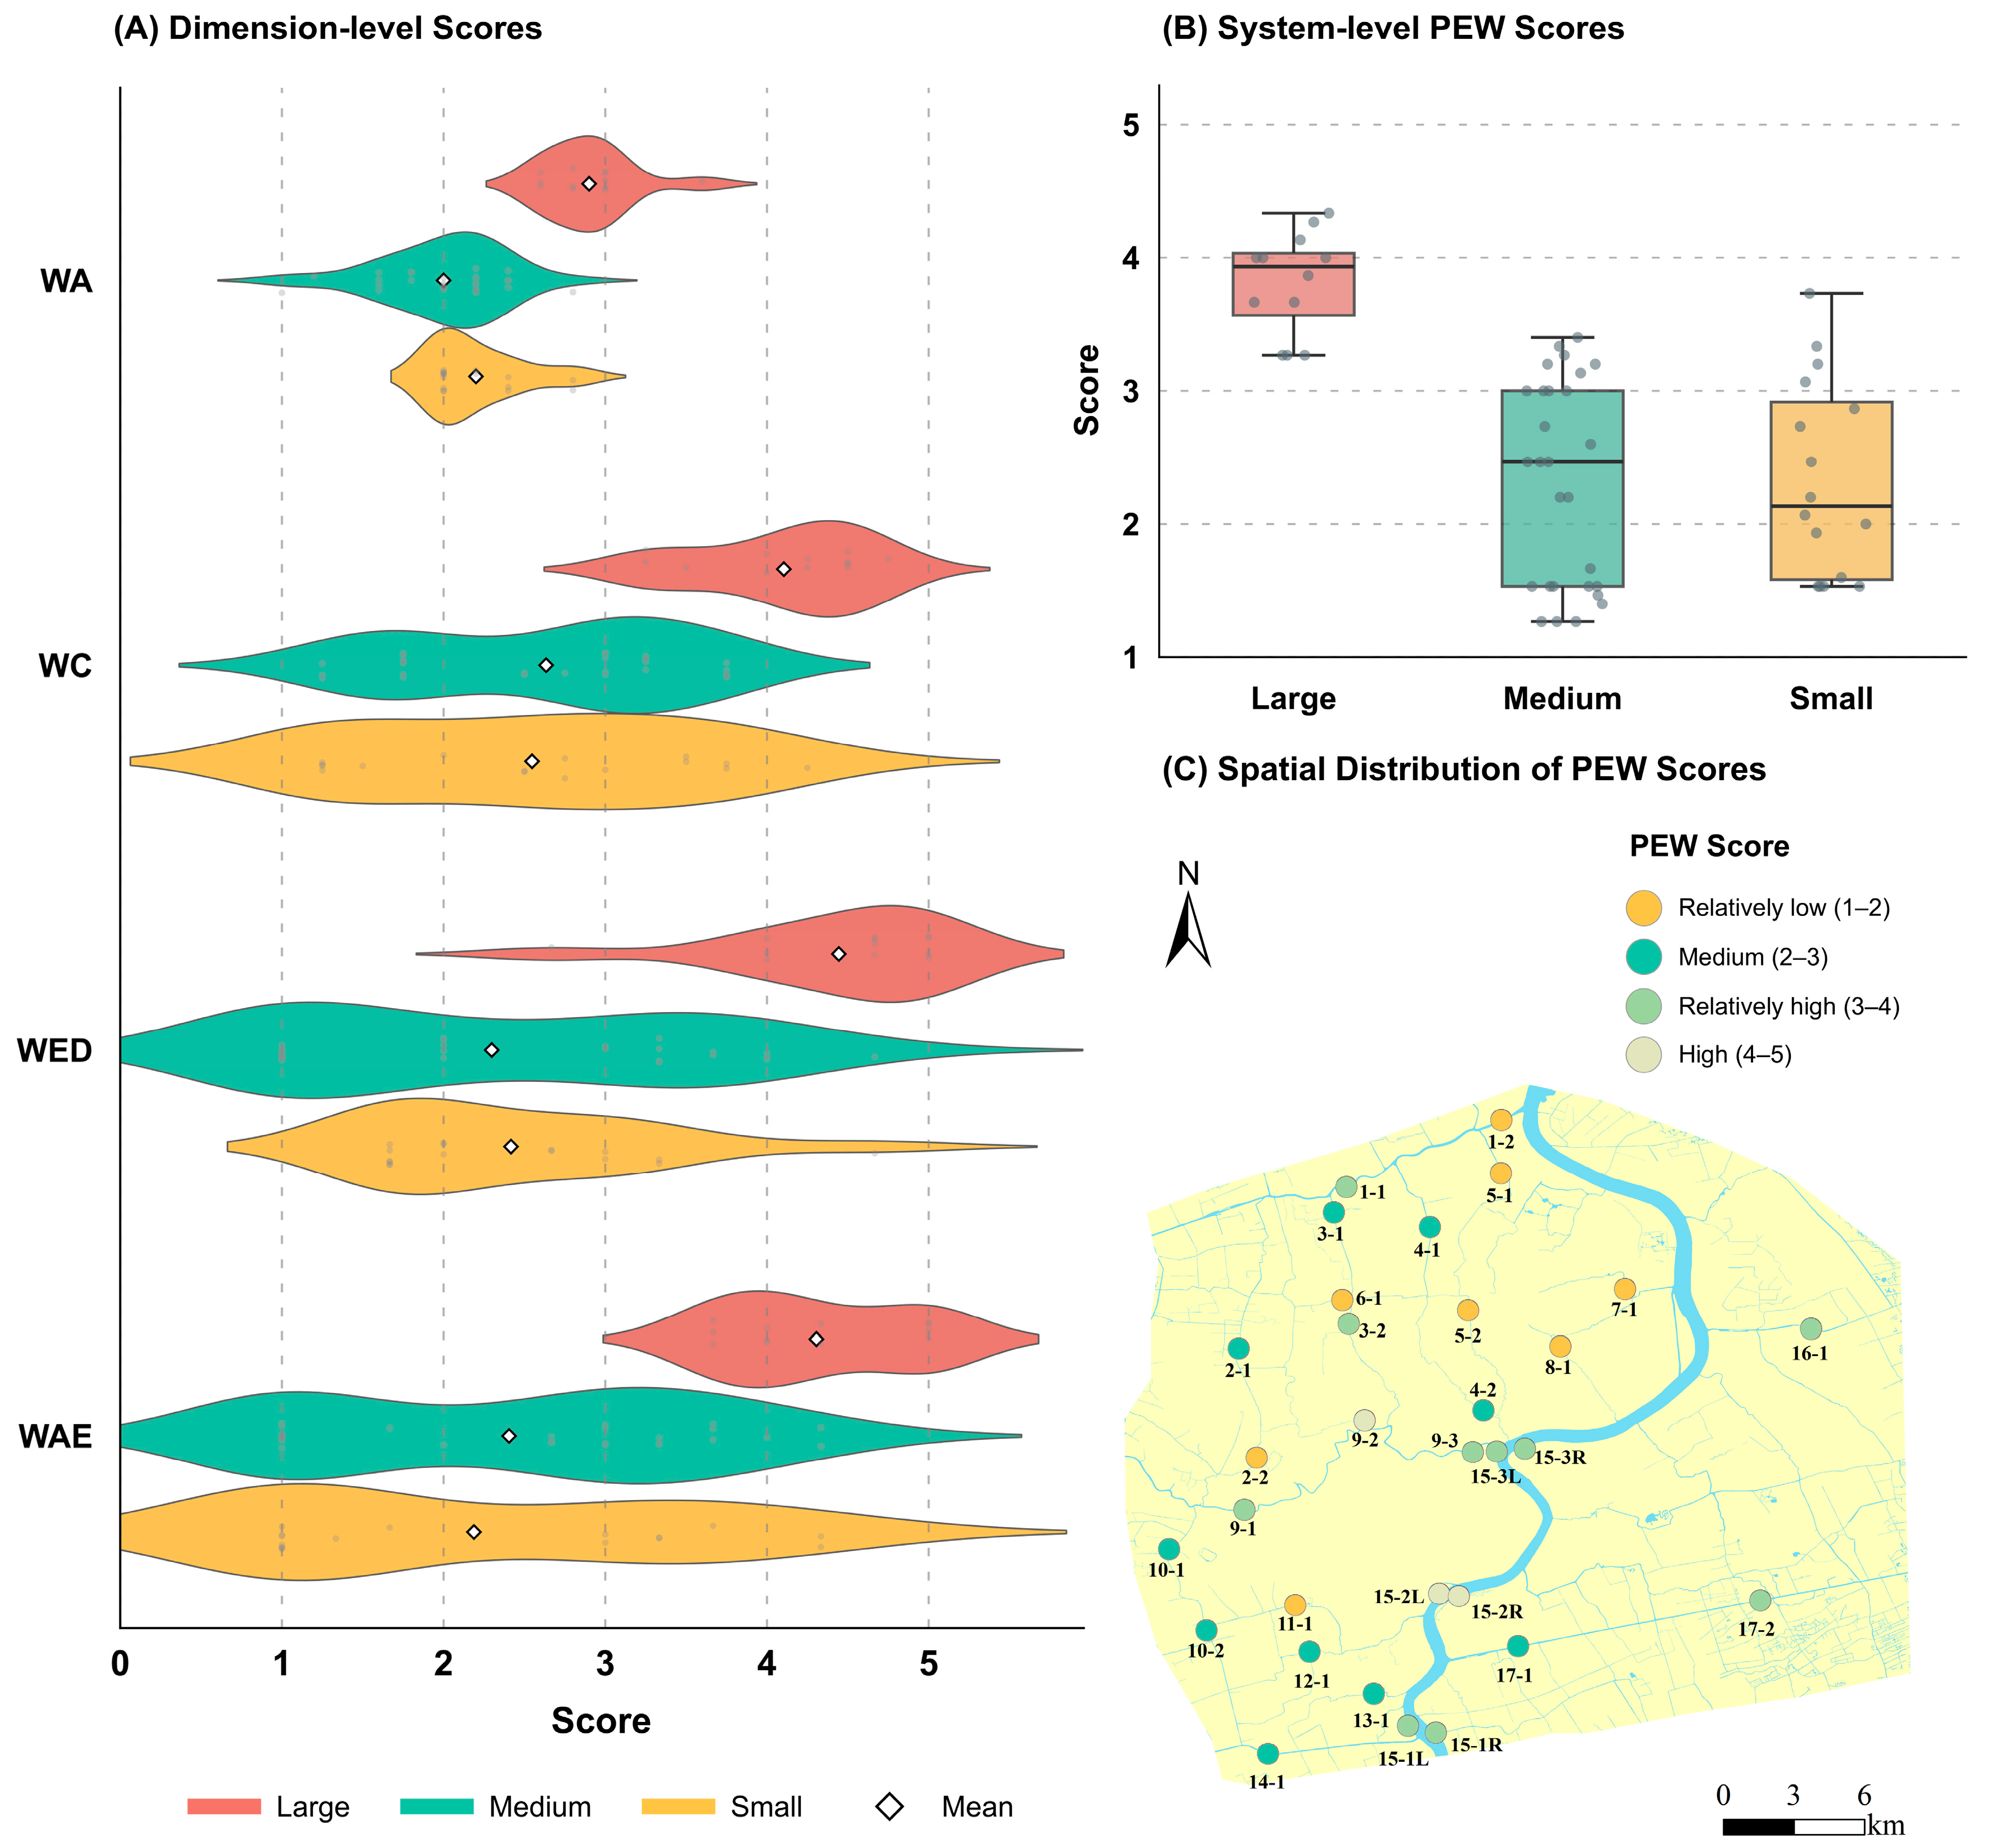
As shown in Figure 5A, large rivers exhibit consistently higher scores across the four dimensions, particularly in the WED and WAE dimensions, with mean values above 4.0. In contrast, medium and small rivers show largely overlapping distributions. Dispersion is especially pronounced in the WED and WAE dimensions, with values spanning a wide range, whereas the WA and WC dimensions are more concentrated in lower score intervals (mostly below 3.0).
At the system level, PEW scores (Figure 5B) further reflect these differences. Large rivers exhibit a higher median, with their interquartile range (IQR) clearly separated from the IQRs of medium and small rivers. By contrast, there is substantial overlap between medium and small rivers in the lower score ranges. Medium rivers generally cover a wider range, indicating greater internal variation; whereas small rivers, although they occasionally exhibit higher values, have a lower median.
The spatial distribution of PEW scores (Figure 5C) shows that higher values are mainly concentrated along the two major rivers, Suzhou Creek (segments 9-x) and the Huangpu River (segments 15-xL/R). Beyond these areas, medium and lower scores are more prevalent, particularly in medium and small rivers in outer urban areas (e.g., segments 1-2 and 14-1). Outside the two major river corridors, relatively high scores are also observed in a few specific segments (e.g., segments 1-1 and 16-1).

4.3. Spatial Patterns of Urban Vitality Within the 15 min Waterfront Living Circles

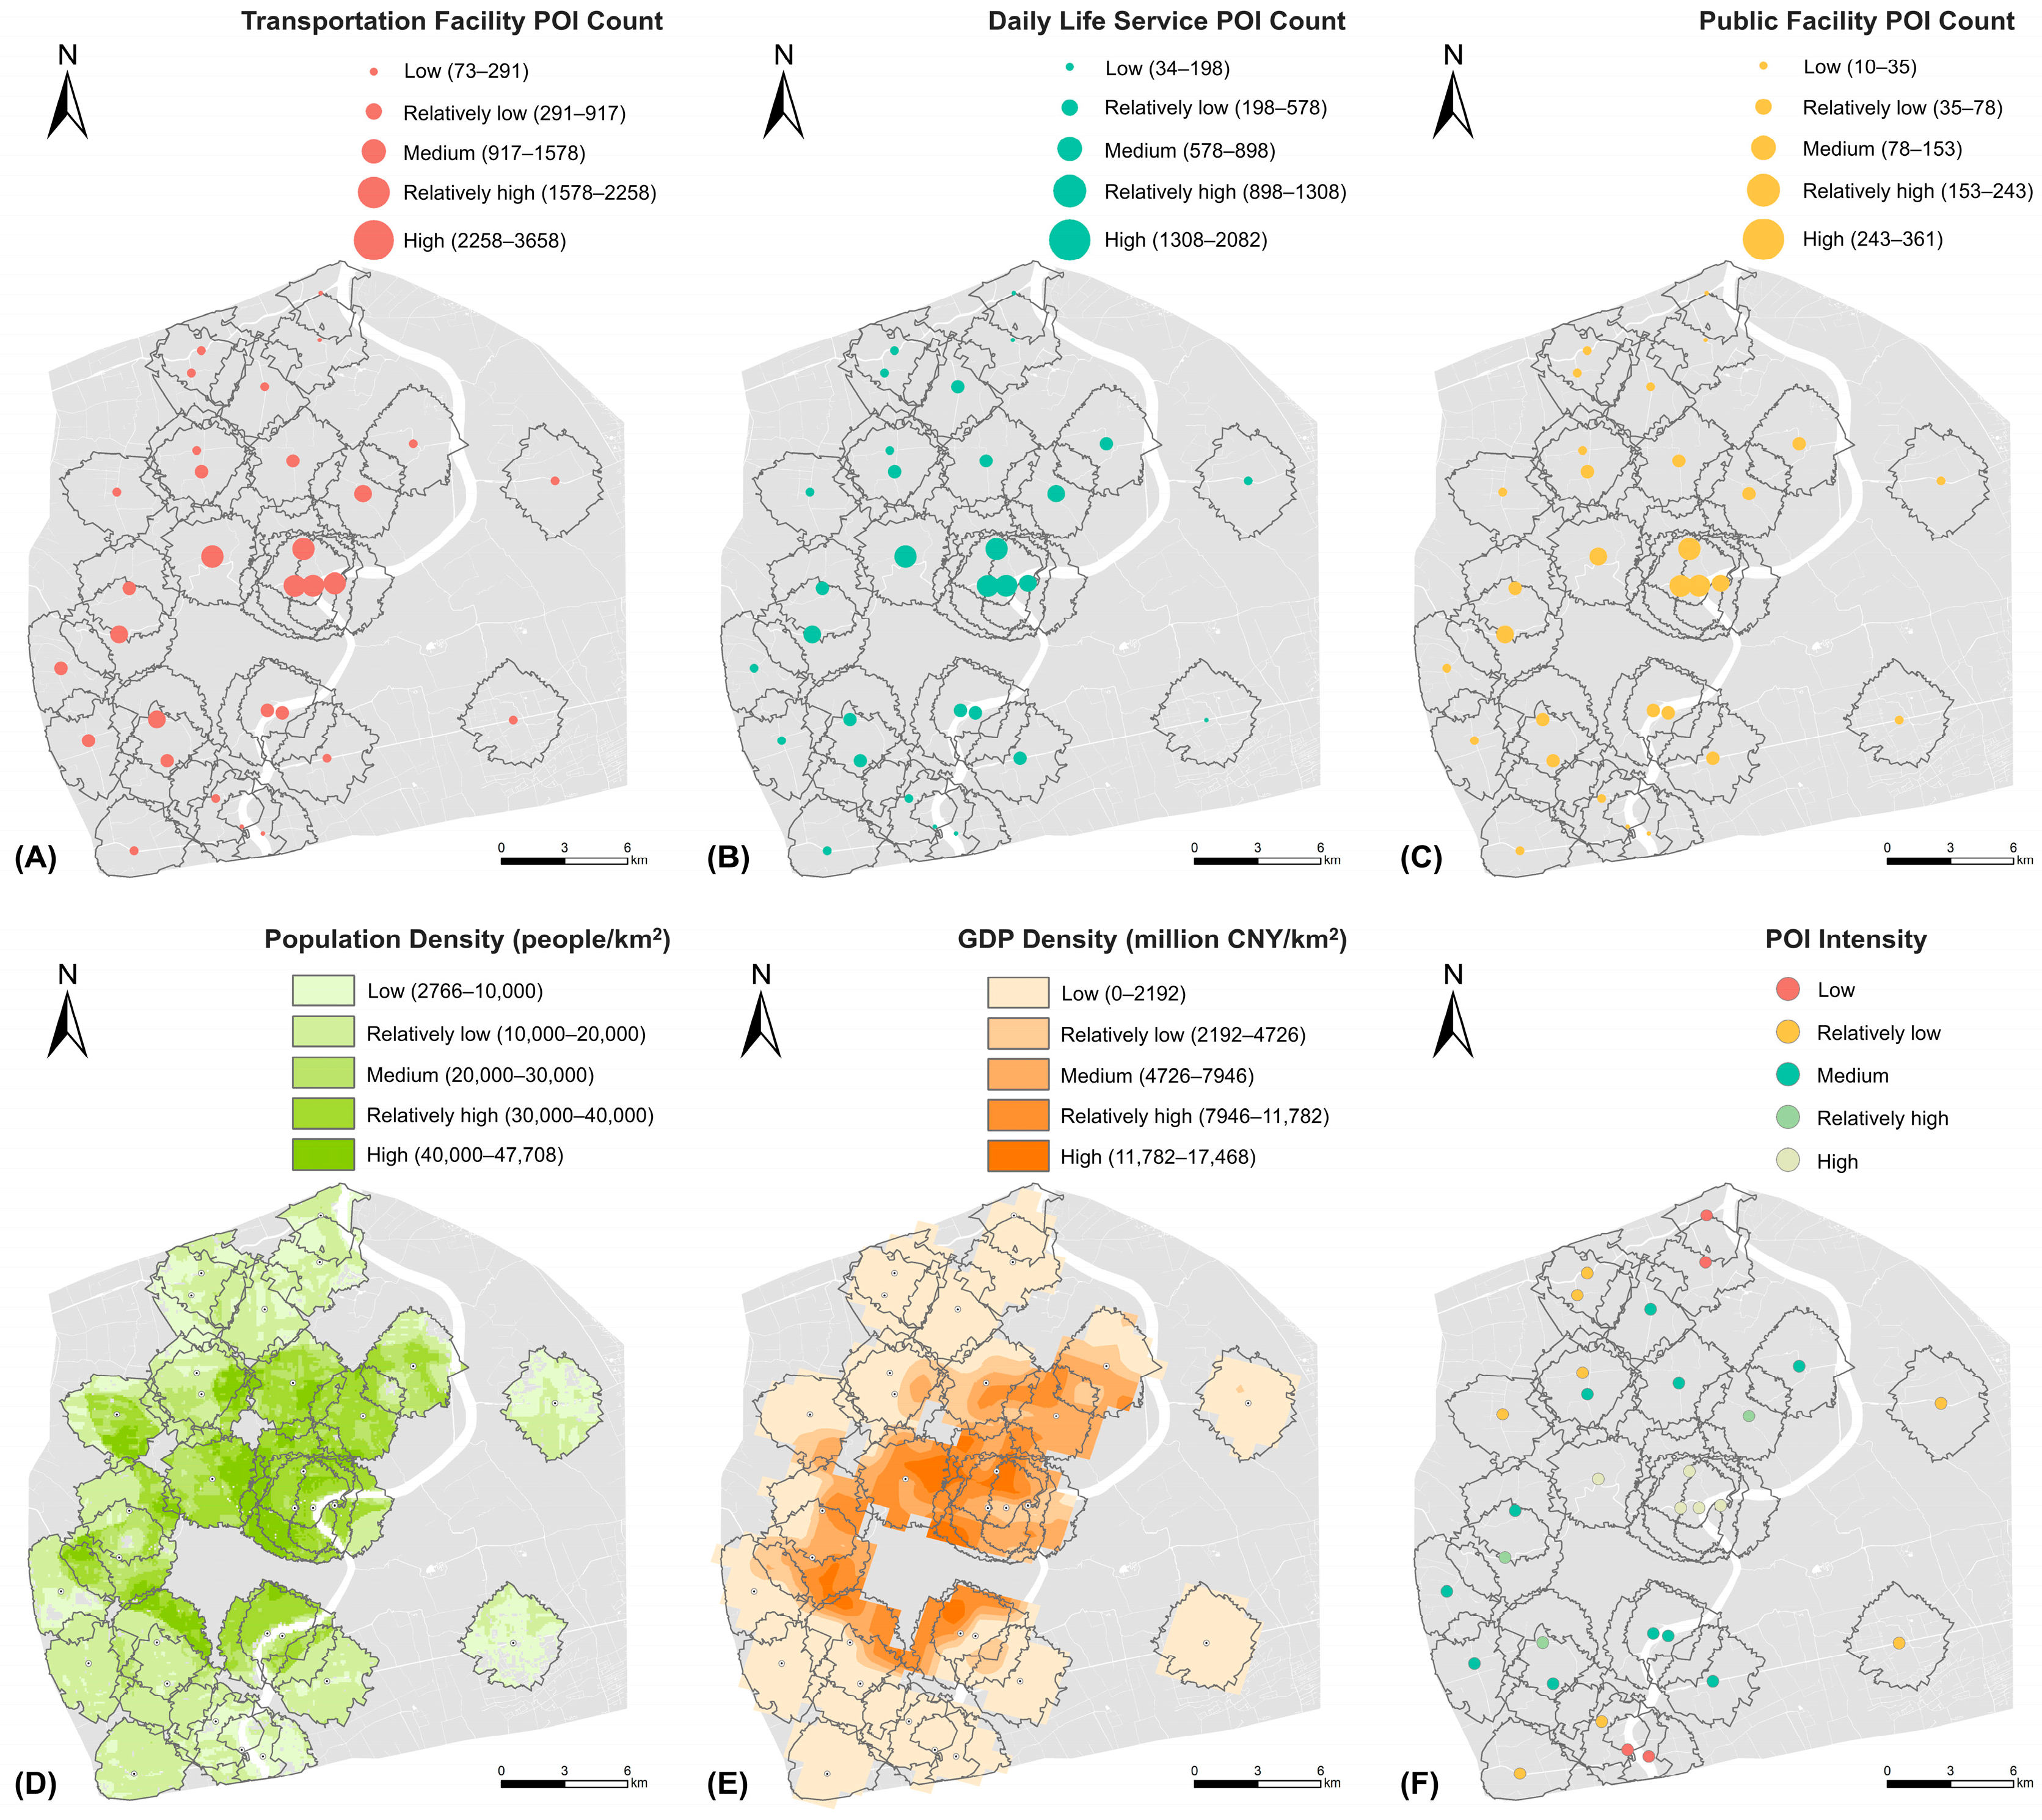
Urban vitality exhibits clear spatial differentiation across the 15 min waterfront living circles. Demographic vitality (Figure 6D), economic vitality (Figure 6E), and social-service vitality, represented by transportation facility, daily life service, and public facility POIs (Figure 6A–C,F), all show compact concentrations in inner urban areas and lower levels toward outer urban areas, forming a pronounced spatial gradient.

4.4. Coupling Coordination Between PEW Performance and Urban Vitality

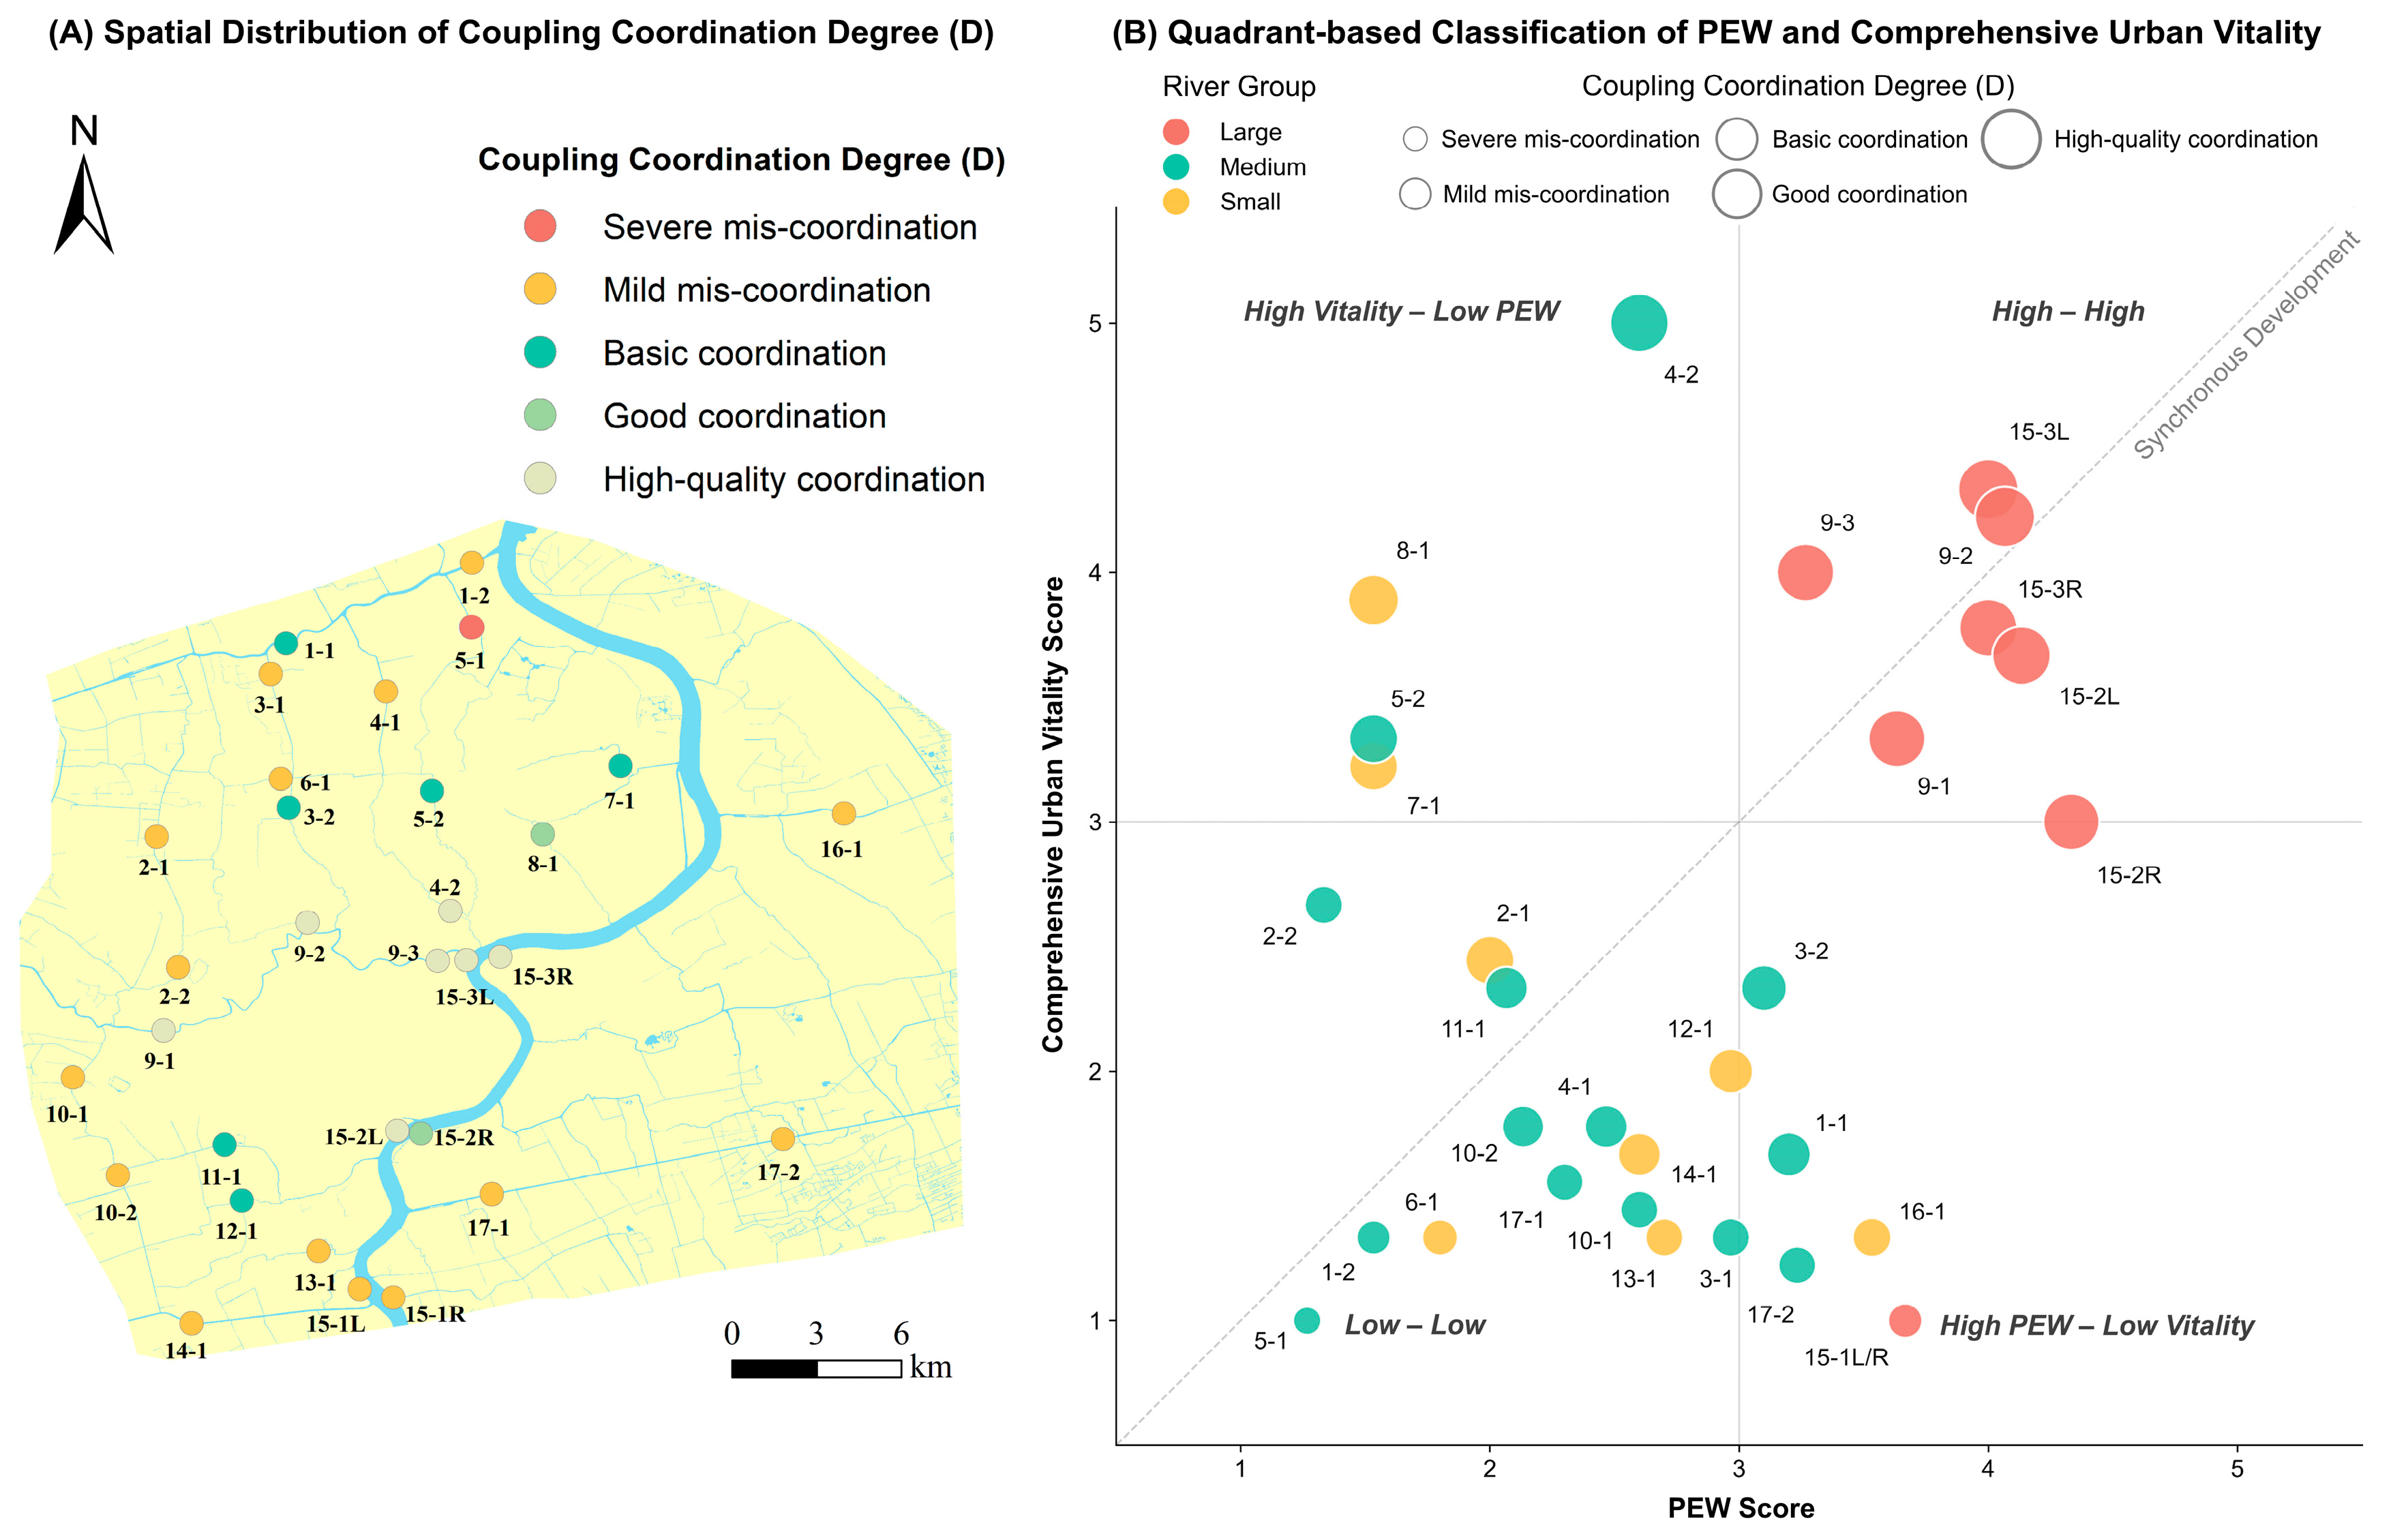
The coupling coordination degree exhibits clear spatial variation across the sampled waterfront living circles (Figure 7A). Higher levels of coordination are primarily observed in inner urban areas, where several segments (e.g., 9-2, 9-3, and 15-3L/R) achieve high-quality coordination, while 8-1 and 15-2R reach good coordination. By contrast, outer urban areas show a more mixed pattern, ranging from basic coordination to mis-coordination. However, mis-coordination is more common in these areas, mainly at the mild level, with severe mis-coordination observed in segment 5-1.
As shown in Figure 7B, the spatial distribution of the river segments differs clearly among the four quadrants. The High–High quadrant, which identifies segments with both high PEW and Comprehensive Urban Vitality scores, contains only large river segments. The High Vitality–Low PEW quadrant includes segments such as 4-2 and 8-1, whilst the High PEW–Low Vitality quadrant includes segments such as 15-1L/R and 16-1. A lot of the segments are in the Low–Low quadrant (e.g., 1-2 and 5-1) with comparatively lower scores for both PEW and Comprehensive Urban Vitality. In general, large river segments are mostly in the High–High quadrant, whereas medium and small river segments are absent from this quadrant and are more frequently found in the Low–Low quadrant.

5. Discussion

5.1. Differences in Waterfront Experience Across River Groups

The relatively higher PEW performance observed in large rivers can be partly explained by their greater spatial capacity and long-term development strategies. Indeed, a broader riparian zone provides the necessary physical conditions for public use and the siting of facilities, which has been recognized as a key factor in enhancing waterfront vitality [3,57]. As the city’s core water systems, the Huangpu River and Suzhou Creek have long been prioritized in Shanghai’s urban development. Under the guidance of the “One River, One Creek” strategy, public spaces and slow-mobility systems along the two rivers have been continuously developed and systematically improved [58].
By contrast, the comparatively lower performance observed in medium and small rivers can be attributed to their historical functions and physical constraints. In the past, a number of these waterways were designed for industrial use, transportation needs or flood control and drainage, and were rarely considered for public use [59]. This historical context may continue to influence current waterfront development. Moreover, many small and medium rivers run through dense residential or industrial areas, where constrained riverbank space and surrounding land-use pressures have led to persistent encroachment on riverbank areas. These spatial constraints can limit waterfront accessibility, functional diversity, and opportunities for diverse public activities, partly explaining the lower experiential diversity observed in these river groups [14,60].
Channel width is positively correlated with most indicators, suggesting that river scale, represented here by channel width, is associated with variations in waterfront environmental conditions. However, this correlation is not consistent across all indicators. SM, WVI and PhWQ show almost no correlation with channel width, suggesting that certain aspects of the waterfront experience depend more on local design and management than on river size alone. For instance, the widespread use of standardized engineered embankments reduces morphological differences across river groups. The visual experience depends more on direct viewing conditions than on the overall size of the water body, whilst physicochemical water quality is more influenced by targeted water quality management measures. The limited differences between medium and small rivers further suggest that, despite variations in channel width, constrained riverbank space limits improvements to the waterfront experience. Furthermore, the positive correlations observed between most indicators suggest that a high-quality waterfront experience depends on interrelated environmental and spatial conditions rather than isolated attributes. Accessibility, environmental quality and amenities tend to improve in tandem, a pattern also noted in studies of other urban public spaces [61,62].
SM and IFP scores are low across the sampled rivers, indicating that shoreline morphology and inclusive facility provision remain common weaknesses in Shanghai’s waterfront environments. SM’s poor performance is primarily linked to Shanghai’s long-standing reliance on rigid, vertical embankments for flood control. As a low-lying delta city, Shanghai has consistently adopted this approach to flood management [63], which has resulted in engineered shorelines and limited water–land transition spaces. Meanwhile, the persistently low IFP scores reflect shortcomings in accessibility facilities and inclusive design, indicating that inclusive access for diverse user groups remains insufficiently supported in some waterfront spaces.
Unlike other indicators, the reason why PhWQ scores are highest in small rivers may be linked to the “black and odorous water body remediation” campaigns carried out nationwide in China in recent years [64,65], in which severely polluted small tributaries are often the primary targets of intervention. This suggests that while water quality has improved through intervention, this does not necessarily lead to a better public experience. Restoring waterfront areas requires not only environmental remediation but also more comprehensive strategies that combine ecological improvement with spatial accessibility and public use.

5.2. Spatial Differentiation of Coupling Coordination Between PEW Performance and Urban Vitality

The geographic pattern of urban vitality shows that population density, economic activity, and public services are mainly concentrated in inner urban areas. This spatial pattern is consistent with Shanghai’s historical urban expansion model, in which major waterways have long supported trade, transportation, and urban development [66]. The spatial distribution of coupling coordination further shows that higher coordination levels are mainly concentrated along large river segments in inner urban areas, particularly along the Huangpu River and Suzhou Creek. This pattern suggests that higher coordination is often associated with well-developed waterfront environments and dense surrounding urban functions, which is consistent with previous studies on waterfront vitality and regeneration [67,68,69].
Quadrant analysis identifies two distinct types of spatial mismatch. In densely developed inner urban areas, strong surrounding urban vitality does not necessarily correspond to high PEW performance, as intensive land use and limited riverbank space may constrain further waterfront improvement. Segments such as 4-2 and 8-1 are representative of this pattern. Both are located in highly urbanized areas, where limited riverbank space leaves relatively little room for further waterfront enhancement. Conversely, some river segments exhibit relatively high PEW performance despite lower surrounding urban vitality. This pattern may reflect insufficient urban density in adjacent areas and a lag between waterfront improvement and the development of surrounding social and economic interactions [70,71]. Segments such as 15-1L/R along the Huangpu River are representative of this mismatch. Their relatively high PEW performance may reflect the long-term improvement of the Huangpu River waterfront, whereas the surrounding vitality remains comparatively weaker than in more active inner urban waterfront sections.
In addition, many river segments fall into the Low–Low category, where both PEW performance and urban vitality remain relatively limited. These areas suggest that waterfront improvement alone may not be sufficient to achieve higher levels of coordination when surrounding urban functions remain relatively limited [72]. Waterfront improvement should therefore be coordinated with broader urban regeneration efforts that strengthen surrounding accessibility, public services, and urban functions.

5.3. Planning Implications for Differentiated Waterfront Development

The observed coordination and quadrant patterns indicate that planning priorities should vary across different coordination contexts. In inner urban areas with relatively high PEW performance and strong urban vitality, planning should focus on maintaining existing strengths while addressing the remaining weaknesses. For example, given the consistently low SM and IFP scores across the sampled rivers, consideration may be given to combining ecological restoration with everyday recreational uses, such as introducing more naturalized shoreline forms where site conditions permit, improving inclusive facilities, and providing more water-access facilities. Supporting a wider range of everyday activities can help to maintain the multifunctional role of these spaces [1,69].
In densely built inner urban areas with relatively high surrounding vitality but lower PEW performance, where spatial constraints limit waterfront upgrading, priority should be given to improving accessibility through small-scale interventions, such as opening enclosed segments, adding access points, and introducing pocket parks [42,73,74,75]. Strengthening connections between street networks and the waterfront is also important, as it can improve usability in spatially constrained areas [76,77,78]. Such interventions are particularly suitable where limited riverbank space constrains broader waterfront improvement. In areas with relatively high PEW performance but lower surrounding vitality, strengthening connections between waterfronts and surrounding urban functions by introducing mixed-use development and supporting daily activities may help improve actual use [79,80]. In such areas, improving the integration between waterfront spaces and surrounding urban functions may be more important than further physical upgrading of the waterfront itself.
For medium and small river segments with both low PEW performance and urban vitality, improvements should be integrated into broader neighborhood upgrading by enhancing accessibility and strengthening links to surrounding streets and activity spaces [72,76]. Such integration can promote more frequent everyday use and gradually strengthen local urban development [81,82,83]. Overall, the proposed approach may help urban planners and municipal authorities prioritize waterfront investment, accessibility improvement, and neighborhood renewal under different spatial conditions.

5.4. Limitations and Future Research

This study has several limitations. First, PEW was evaluated through observable environmental and spatial attributes that serve as proxies for public experience rather than direct measures of individual perceptions or preferences. Some field-based indicators may also be influenced by observation conditions. For example, PeWQ relies on sensory assessment and may be influenced by weather, lighting conditions, and assessor judgement, while WAD was based on a single field observation and may not fully capture temporal variations in waterfront activities across different times of day, days of the week, and seasons. Future studies could combine repeated observations with more systematic assessor training, inter-rater reliability testing, public surveys, interviews, and social media data to improve the robustness of PEW assessment.
Second, this study combined the available multi-source datasets collected between 2020 and 2023, and differences in their temporal coverage may introduce temporal heterogeneity. Future research should use more temporally consistent, higher-resolution, and activity-based datasets to better capture urban vitality and waterfront use.
Finally, the PEW assessment applied equal indicator weights, which may not fully reflect differences in their relative importance. Future studies could explore expert-based or data-driven weighting methods and conduct sensitivity analysis. Although channel width was additionally examined as a continuous variable, the length-based river grouping used for comparison remains a simplified approach. Moreover, this study focused on selected waterfronts in central Shanghai, and further applications in other cities and waterfront contexts are needed to evaluate the transferability of the framework.

6. Conclusions

This study developed a socio-ecological framework to evaluate the Public Experience of Waterfronts (PEW) from four dimensions: amenity, comfort, experiential diversity, and access equity. Based on this framework, we investigated the PEW performance of waterfront spaces in central Shanghai and analyzed its coupling coordination with surrounding urban vitality within 15 min living circles.
The results reveal clear differences across river groups. Large rivers generally show better PEW performance, while medium and small rivers remain at lower levels. Spatially, high PEW is mainly concentrated along major waterfront corridors, whereas urban vitality is stronger in inner urban areas and weakens outward. This spatial distribution is reflected in a similar pattern in coupling coordination, which is higher in inner urban areas and more uneven in peripheral zones. Specifically, large rivers typically maintain both high PEW and strong urban vitality, while medium and small rivers are more prone to low overall performance or spatial mismatches.
These findings suggest that enhancing the public experience of waterfront areas requires a comprehensive approach that takes multiple factors into account, rather than optimizing individual elements in isolation. Furthermore, tailored planning strategies need to be developed to better align the development of waterfront areas with the specific conditions of the surrounding urban environment. Overall, this study frames PEW as a multidimensional attribute of waterfront environments, combines PEW assessment with coordination analysis of surrounding urban vitality, and provides implications for differentiated waterfront renewal.

Supplementary Materials

The following supporting information can be downloaded at: https://www.mdpi.com/article/10.3390/land15071297/s1, Figure S1: Schematic illustration of shoreline morphology types: (a) artificial straight, (b) curved or segmented, and (c) natural-ecological shorelines; Figure S2: Schematic illustration of bank configuration types: (a) single-level bank structure, (b) multi-level bank structure, and (c) engineered revetment; Figure S3: Panoramic image processing and semantic segmentation for calculating the Water Visibility Index (WVI): (a) original panoramic image captured at a representative waterfront site, and (b) corresponding semantic segmentation result. The colored legend denotes identified elements, in order: vegetation, paved surfaces, sky, water bodies, railings, buildings, embankments, soil, and pedestrian paths. The proportion of water pixels is utilized to compute the WVI; Figure S4: Examples of viewing platforms: (a) distant-view platform, (b) near-water platform, and (c) water-touching platform; Table S1: Geographical coordinates of the sampled waterfront segments; Table S2: Scoring criteria for all indicators in the PEW evaluation framework; Table S3: Detailed criteria for the Physical Safety (PS) indicator; Table S4: Classification criteria for shoreline form and bank configuration for the Shoreline Morphology (SM) indicator; Table S5: Categorization of waterfront experience facility types for the Water-Engagement Facilities (WEF) indicator; Table S6: Categorization of waterfront activity types for the Waterfront Activity Diversity (WAD) indicator; Table S7: Expert-assigned weights for the four CCDM subsystems.

Author Contributions

Conceptualization, L.D. and X.L.; methodology, L.Z.; software, X.L. and L.Z.; validation, X.L. and L.Z.; formal analysis, X.L. and L.Z.; investigation, X.L. and L.Z.; resources, L.D.; data curation, X.L. and Y.L.; writing—original draft preparation, X.L.; writing—review and editing, Y.L., K.V. and L.D.; visualization, X.L.; supervision, L.D.; project administration, L.D.; funding acquisition, L.D. All authors have read and agreed to the published version of the manuscript.

Funding

This research was funded by the Research Foundation of Chongqing University of Science and Technology, grant number ckrc20250629, and the Research Foundation of Shanghai Water Authority, grant number KY-HSK 2026-02.

Data Availability Statement

The data that support the findings of this study are available from various sources. Publicly available datasets were analyzed in this study; these data can be found here: OpenStreetMap (https://www.openstreetmap.org), WorldPop (https://www.worldpop.org), and Amap (https://www.amap.com). The field survey data generated during this study are available from the corresponding author upon reasonable request.

Conflicts of Interest

Author Lingge Zhai was employed by the company Shanghai Environmental Sanitation Engineering Design Institute Co., Ltd. The remaining authors declare that the research was conducted in the absence of any commercial or financial relationships that could be construed as a potential conflict of interest.

References

  1. Chen, L.; Ma, Y. How Do Ecological and Recreational Features of Waterfront Space Affect Its Vitality? Developing Coupling Coordination and Enhancing Waterfront Vitality. Int. J. Environ. Res. Public Health 2023, 20, 1196. [Google Scholar] [CrossRef] [Scilit] [PubMed]
  2. Hysa, A.; Löwe, R.; Geist, J. Waterfront Usage Trends across German Metropolitan Areas: A Social-Ecological Perspective to Urban Blue-Green Infrastructure Connectivity. Landsc. Urban Plan. 2025, 260, 105369. [Google Scholar] [CrossRef] [Scilit]
  3. Liu, S.; Lai, S.-Q.; Liu, C.; Jiang, L. What Influenced the Vitality of the Waterfront Open Space? A Case Study of Huangpu River in Shanghai, China. Cities 2021, 114, 103197. [Google Scholar] [CrossRef] [Scilit]
  4. Zhao, Q.; Zhou, Y.; Zhai, J. Bridging Beauty and Biodiversity: Coupling Diversity and Aesthetics through Optimized Plant Communities in Urban Riverfront Landscapes. Sci. Total Environ. 2024, 950, 175278. [Google Scholar] [CrossRef] [Scilit] [PubMed]
  5. Yin, J.; Ramanpong, J.; Chang, J.; Wu, C.-D.; Chao, P.-H.; Yu, C.-P. Effects of Blue Space Exposure in Urban and Natural Environments on Psychological and Physiological Responses: A within-Subject Experiment. Urban For. Urban Green. 2023, 87, 128066. [Google Scholar] [CrossRef] [Scilit]
  6. Gascon, M.; Zijlema, W.; Vert, C.; White, M.P.; Nieuwenhuijsen, M.J. Outdoor Blue Spaces, Human Health and Well-Being: A Systematic Review of Quantitative Studies. Int. J. Hyg. Environ. Health 2017, 220, 1207–1221. [Google Scholar] [CrossRef] [Scilit] [PubMed]
  7. de Bell, S.; Graham, H.; Jarvis, S.; White, P. The Importance of Nature in Mediating Social and Psychological Benefits Associated with Visits to Freshwater Blue Space. Landsc. Urban Plan. 2017, 167, 118–127. [Google Scholar] [CrossRef] [Scilit]
  8. Isa, M.I.; Marzbali, M.H.; Saad, S.N. Mediating Role of Place Identity in the Relationship between Place Quality and User Satisfaction in Waterfronts: A Case Study of Penang, Malaysia. J. Place Manag. Dev. 2021, 15, 130–148. [Google Scholar] [CrossRef] [Scilit]
  9. McDougall, C.W.; Hanley, N.; Quilliam, R.S.; Bartie, P.J.; Robertson, T.; Griffiths, M.; Oliver, D.M. Neighbourhood Blue Space and Mental Health: A Nationwide Ecological Study of Antidepressant Medication Prescribed to Older Adults. Landsc. Urban Plan. 2021, 214, 104132. [Google Scholar] [CrossRef] [Scilit]
  10. Ghosh, S.; Pal, S. Anthropogenic Impacts on Urban Blue Space and Its Reciprocal Effect on Human and Socio-Ecological Health. J. Environ. Manag. 2024, 351, 119727. [Google Scholar] [CrossRef] [Scilit] [PubMed]
  11. Velempini, K. Assessing the Role of Environmental Education Practices Towards the Attainment of the 2030 Sustainable Development Goals. Sustainability 2025, 17, 2043. [Google Scholar] [CrossRef] [Scilit]
  12. Luo, S.; Xie, J.; Furuya, K. Effects of Perceived Physical and Aesthetic Quality of Urban Blue Spaces on User Preferences—A Case Study of Three Urban Blue Spaces in Japan. Heliyon 2023, 9, e15033. [Google Scholar] [CrossRef] [Scilit] [PubMed]
  13. Ballesteros-Olza, M.; Palencia-González, F.J.; Blanco-Gutiérrez, I. Using Big Data to Analyze How and Why Users Value Urban Blue Spaces in Spain. Urban For. Urban Green. 2024, 95, 128308. [Google Scholar] [CrossRef] [Scilit]
  14. Che, Y.; Yang, K.; Chen, T.; Xu, Q. Assessing a Riverfront Rehabilitation Project Using the Comprehensive Index of Public Accessibility. Ecol. Eng. 2012, 40, 80–87. [Google Scholar] [CrossRef] [Scilit]
  15. Thornhill, I.; Hill, M.J.; Castro-Castellon, A.; Gurung, H.; Hobbs, S.; Pineda-Vazquez, M.; Gómez-Osorio, M.T.; Hernández-Avilés, J.S.; Novo, P.; Mesa-Jurado, A.; et al. Blue-Space Availability, Environmental Quality and Amenity Use across Contrasting Socioeconomic Contexts. Appl. Geogr. 2022, 144, 102716. [Google Scholar] [CrossRef] [Scilit]
  16. New York City Department of City Planning. Vision 2020: New York City Comprehensive Waterfront Plan. 2011. Available online: https://www.nyc.gov/content/planning/pages/our-work/plans/citywide/vision-2020-nyc-comprehensive-waterfront-plan (accessed on 16 June 2026).
  17. Biscaya, S.; Elkadi, H. A Catalyst Approach for Smart Ecological Urban Corridors at Disused Waterways. Urban Plan. 2023, 8, 406–424. [Google Scholar] [CrossRef] [Scilit]
  18. Craig-Smith, S.J.; Fagence, M. Recreation and Tourism as a Catalyst for Urban Waterfront Redevelopment: An International Survey; Praeger: Westport, CT, USA, 1995. [Google Scholar]
  19. Gunay, Z.; Dokmeci, V. Culture-Led Regeneration of Istanbul Waterfront: Golden Horn Cultural Valley Project. Cities 2012, 29, 213–222. [Google Scholar] [CrossRef] [Scilit]
  20. Smyth, H. Marketing the City: The Role of Flagship Developments in Urban Regeneration; Taylor & Francis: London, UK, 1994; ISBN 978-0-203-97595-4. [Google Scholar]
  21. Curran, W.; Hamilton, T. (Eds.) Just Green Enough: Urban Development and Environmental Gentrification; Routledge: London, UK, 2017; ISBN 978-1-315-22951-5. [Google Scholar]
  22. Dovey, K. Fluid City: Transforming Melbourne’s Urban Waterfront; Routledge: London, UK, 2004; ISBN 978-0-203-85780-9. [Google Scholar]
  23. Thorning, D.; Balch, C.; Essex, S. The Delivery of Mixed Communities in the Regeneration of Urban Waterfronts: An Investigation of the Comparative Experience of Plymouth and Bristol. Land Use Policy 2019, 84, 238–251. [Google Scholar] [CrossRef] [Scilit]
  24. Long, Y.; Huang, C. Does Block Size Matter? The Impact of Urban Design on Economic Vitality for Chinese Cities. Environ. Plan. B Urban Anal. City Sci. 2019, 46, 406–422. [Google Scholar] [CrossRef] [Scilit]
  25. Mouratidis, K.; Poortinga, W. Built Environment, Urban Vitality and Social Cohesion: Do Vibrant Neighborhoods Foster Strong Communities? Landsc. Urban Plan. 2020, 204, 103951. [Google Scholar] [CrossRef] [Scilit]
  26. Sung, H.; Lee, S. Residential Built Environment and Walking Activity: Empirical Evidence of Jane Jacobs’ Urban Vitality. Transp. Res. Part Transp. Environ. 2015, 41, 318–329. [Google Scholar] [CrossRef] [Scilit]
  27. Shanghai Municipal Water Authority. 2023 Shanghai River (Lake) Report. 2024. Available online: https://swj.sh.gov.cn/swj-hhbg/20250913/208aa4dca5d74e5b904e8092512a3293.html (accessed on 16 May 2026). (In Chinese)
  28. Ministry of Water Resources of China. Guidelines for River and Lake Health Assessment (Trial). 2020. Available online: https://www.waterinfo.com.cn/zt/hhzz/zcwj/202505/P020250527764733639458.pdf (accessed on 16 May 2026). (In Chinese)
  29. Shanghai Municipal Bureau of Ecology and Environment. Shanghai Surface Water Quality Status in October 2023. 2023. Available online: https://sthj.sh.gov.cn/hbzhywpt1143/hbzhywpt1149/20231127/78afc17cdccb4f28973781df7aa2b20d.html (accessed on 15 June 2026). (In Chinese)
  30. Zhao, N.; Liu, Y.; Cao, G.; Samson, E.; Zhang, J. Forecasting China’s GDP at the Pixel Level Using Nighttime Lights Time Series and Population Images. GIScience Remote Sens. 2017, 54, 407–425. [Google Scholar] [CrossRef] [Scilit]
  31. Sun, F.; Liu, Y.; Zeng, S.; Dong, X. Methodology for Designating Water Uses and Developing Water Quality Standards for Urban Surface Water. China Water Wastewat. 2014, 30, 25–31. (In Chinese) [Google Scholar] [CrossRef]
  32. GB 3838–2002; Environmental Quality Standards for Surface Water. Ministry of Ecology and Environment of China: Beijing, China, 2002. Available online: https://www.mee.gov.cn/ywgz/fgbz/bz/bzwb/shjbh/shjzlbz/200206/t20020601_66497.shtml (accessed on 17 June 2026). (In Chinese)
  33. Beijing Municipal Commission of Planning and Natural Resources. Beijing River Planning & Design Guidelines. 2021. Available online: https://ghzrzyw.beijing.gov.cn/zhengwuxinxi/tzgg/sj/202203/t20220331_2645147.html (accessed on 15 June 2026). (In Chinese)
  34. U.S. Department of Justice. 2010 ADA Standards for Accessible Design. 2010. Available online: https://www.ada.gov/law-and-regs/design-standards/2010-stds/ (accessed on 16 June 2026).
  35. Grzyb, T.; Kulczyk, S. How Do Ephemeral Factors Shape Recreation along the Urban River? A Social Media Perspective. Landsc. Urban Plan. 2023, 230, 104638. [Google Scholar] [CrossRef] [Scilit]
  36. Whalley, J.M. Water in the Landscape. Landsc. Urban Plan. 1988, 16, 145–162. [Google Scholar] [CrossRef] [Scilit]
  37. Eid, S.; Khalifa, M.; Abd Elrahman, A. Biophilic Perceptions in the Urban Waterfront: Analytical Study of the Nile Waterfront in Central Cairo. HBRC J. 2021, 17, 19–39. [Google Scholar] [CrossRef] [Scilit]
  38. Chen, L.-C.; Zhu, Y.; Papandreou, G.; Schroff, F.; Adam, H. Encoder-Decoder with Atrous Separable Convolution for Semantic Image Segmentation. In Proceedings of the Computer Vision–ECCV 2018; Ferrari, V., Hebert, M., Sminchisescu, C., Weiss, Y., Eds.; Springer International Publishing: Cham, Switzerland, 2018; pp. 833–851. [Google Scholar]
  39. Mikkelsen, J.B.; Stevens, Q.; Hills, C.; Mueller, F. “Floyd” Exploring How Urban Waterfronts Can Encourage Visitors’ Active Engagement with Water through a Temporary Design Installation. Archnet-IJAR Int. J. Archit. Res. 2018, 12, 91–111. [Google Scholar] [CrossRef] [Scilit]
  40. Wang, W.; Ma, X. Vitality Assessment of Waterfront Public Space Based on Multi-Source Data: A Case Study of the Huangpu River Waterfront. Urban Plan. Forum 2020, 1, 48–56. (In Chinese) [Google Scholar] [CrossRef]
  41. Yan, C.; Cai, X.; Wu, Y.; Tang, X.; Zhou, Y.; Yang, Q.; Li, F.; Lan, S.; Lin, L. How Do Urban Waterfront Landscape Characteristics Influence People’s Emotional Benefits? Mediating Effects of Water-Friendly Environmental Preferences. Forests 2024, 15, 25. [Google Scholar] [CrossRef] [Scilit]
  42. Zhou, S.; Chen, F.; Xu, Z. Evaluating the Accessibility of Urban Parks and Waterfronts through Online Map Services: A Case Study of Shaoxing, China. Urban For. Urban Green. 2022, 77, 127731. [Google Scholar] [CrossRef] [Scilit]
  43. Shanghai Municipal Bureau of Planning and Natural Resources. Construction Planning for the Areas Along the Huangpu River (2018–2035). 2020. Available online: https://ghzyj.sh.gov.cn/ghjh/20200820/8068daedd94846b29e22208a131d52fc.html (accessed on 15 June 2026). (In Chinese)
  44. Shanghai Municipal Commission of Housing and Urban-Rural Development. Design Guidelines for Public Space Construction in Areas on Both Sides of the Huangpu River. 2017. Available online: https://zjw.sh.gov.cn/xwfb/20180911/0011-1500.html (accessed on 16 June 2026). (In Chinese)
  45. Durgut, Z.C.; Yıldız Özkan, D. The Effects of Spatial Connectivity on Pedestrian Movement and Space Usage in Waterfront Areas. In Proceedings of the 13th Space Syntax Symposium, Bergen, Norway, 20–24 June 2022; p. 436. [Google Scholar]
  46. Khavarian-Garmsir, A.R.; Sharifi, A.; Sadeghi, A. The 15-Minute City: Urban Planning and Design Efforts toward Creating Sustainable Neighborhoods. Cities 2023, 132, 104101. [Google Scholar] [CrossRef] [Scilit]
  47. Moreno, C.; Allam, Z.; Chabaud, D.; Gall, C.; Pratlong, F. Introducing the “15-Minute City”: Sustainability, Resilience and Place Identity in Future Post-Pandemic Cities. Smart Cities 2021, 4, 93–111. [Google Scholar] [CrossRef] [Scilit]
  48. Weng, M.; Ding, N.; Li, J.; Jin, X.; Xiao, H.; He, Z.; Su, S. The 15-Minute Walkable Neighborhoods: Measurement, Social Inequalities and Implications for Building Healthy Communities in Urban China. J. Transp. Health 2019, 13, 259–273. [Google Scholar] [CrossRef] [Scilit]
  49. Liao, C. Quantitative Judgement and Classification System for Coordinated Development of Environment and Economy: A Case Study of the City Group in the Pearl River Delta. Trop. Geogr. 1999, 19, 171–177. Available online: https://www.rddl.com.cn/CN/Y1999/V19/I2/171 (accessed on 16 June 2026). (In Chinese)
  50. Tang, Z. An Integrated Approach to Evaluating the Coupling Coordination between Tourism and the Environment. Tour. Manag. 2015, 46, 11–19. [Google Scholar] [CrossRef] [Scilit]
  51. Ariken, M.; Zhang, F.; Chan, N.W.; Kung, H. Coupling Coordination Analysis and Spatio-Temporal Heterogeneity between Urbanization and Eco-Environment along the Silk Road Economic Belt in China. Ecol. Indic. 2021, 121, 107014. [Google Scholar] [CrossRef] [Scilit]
  52. Fan, Y.; Fang, C.; Zhang, Q. Coupling Coordinated Development between Social Economy and Ecological Environment in Chinese Provincial Capital Cities-Assessment and Policy Implications. J. Clean. Prod. 2019, 229, 289–298. [Google Scholar] [CrossRef] [Scilit]
  53. Li, Y.; Li, Y.; Zhou, Y.; Shi, Y.; Zhu, X. Investigation of a Coupling Model of Coordination between Urbanization and the Environment. J. Environ. Manag. 2012, 98, 127–133. [Google Scholar] [CrossRef] [Scilit] [PubMed]
  54. Manna, S.; Bartoli, M.; Mazzocchi, C. Harmonizing Socioeconomic and Environmental Factors in Lake Ecosystems: The Case of Lake Iseo. Environ. Sustain. Indic. 2026, 30, 101222. [Google Scholar] [CrossRef] [Scilit]
  55. Huang, I.B.; Keisler, J.; Linkov, I. Multi-Criteria Decision Analysis in Environmental Sciences: Ten Years of Applications and Trends. Sci. Total Environ. 2011, 409, 3578–3594. [Google Scholar] [CrossRef] [Scilit] [PubMed]
  56. Malczewski, J. GIS-Based Multicriteria Decision Analysis: A Survey of the Literature. Int. J. Geogr. Inf. Sci. 2006, 20, 703–726. [Google Scholar] [CrossRef] [Scilit]
  57. Fan, Y.; Kuang, D.; Tu, W.; Ye, Y. Which Spatial Elements Influence Waterfront Space Vitality the Most?—A Comparative Tracking Study of the Maozhou River Renewal Project in Shenzhen, China. Land 2023, 12, 1260. [Google Scholar] [CrossRef] [Scilit]
  58. Shanghai Municipal Government. The 14th Five-Year Plan for the Development of the “One River, One Creek” Areas in Shanghai. 2021. Available online: https://www.shanghai.gov.cn/2021hffwj/20210830/6a27a89d0f2540a79a8e58ed3ea3a7e9.html (accessed on 17 June 2026). (In Chinese)
  59. Kondolf, G.M.; Pinto, P.J. The Social Connectivity of Urban Rivers. Geomorphology 2017, 277, 182–196. [Google Scholar] [CrossRef] [Scilit]
  60. Durán Vian, F.; Pons Izquierdo, J.J.; Serrano Martínez, M. River-City Recreational Interaction: A Classification of Urban Riverfront Parks and Walks. Urban For. Urban Green. 2021, 59, 127042. [Google Scholar] [CrossRef] [Scilit]
  61. Chen, L.; Wan, H.; Hu, H.; Zhang, H.; Liu, L.; Xu, L.; Jiang, Z.; Sroczyńska, J. Correlation Analysis between Everyday Public Space and Urban Built Environment and a Study of Its Evaluation Framework: Taking Tianjin as an Example. Buildings 2025, 15, 4348. [Google Scholar] [CrossRef] [Scilit]
  62. Zhang, R.; Peng, S.; Sun, F.; Deng, L.; Che, Y. Assessing the Social Equity of Urban Parks: An Improved Index Integrating Multiple Quality Dimensions and Service Accessibility. Cities 2022, 129, 103839. [Google Scholar] [CrossRef] [Scilit]
  63. Du, S.; Scussolini, P.; Ward, P.J.; Zhang, M.; Wen, J.; Wang, L.; Koks, E.; Diaz-Loaiza, A.; Gao, J.; Ke, Q.; et al. Hard or Soft Flood Adaptation? Advantages of a Hybrid Strategy for Shanghai. Glob. Environ. Change 2020, 61, 102037. [Google Scholar] [CrossRef] [Scilit]
  64. Tang, W.; Pei, Y.; Zheng, H.; Zhao, Y.; Shu, L.; Zhang, H. Twenty Years of China’s Water Pollution Control: Experiences and Challenges. Chemosphere 2022, 295, 133875. [Google Scholar] [CrossRef] [Scilit] [PubMed]
  65. Xu, W.; Wang, W.; Deng, B.; Liu, Q. A Review of the Formation Conditions and Assessment Methods of Black and Odorous Water. Environ. Monit. Assess. 2024, 196, 42. [Google Scholar] [CrossRef] [Scilit] [PubMed]
  66. Wan, Y.; Mou, Z. On the Evolution and Spatiotemporal Characteristics of the Urban Spatial Morphology of Modern Shanghai (1843–1949). J. East China Norm. Univ. Humanit. Soc. Sci. 2025, 57, 42–52. (In Chinese) [Google Scholar] [CrossRef]
  67. Ding, J.; Luo, L.; Shen, X.; Xu, Y. Influence of Built Environment and User Experience on the Waterfront Vitality of Historical Urban Areas: A Case Study of the Qinhuai River in Nanjing, China. Front. Archit. Res. 2023, 12, 820–836. [Google Scholar] [CrossRef] [Scilit]
  68. Fan, Z.; Duan, J.; Luo, M.; Zhan, H.; Liu, M.; Peng, W. How Did Built Environment Affect Urban Vitality in Urban Waterfronts? A Case Study in Nanjing Reach of Yangtze River. ISPRS Int. J. Geo-Inf. 2021, 10, 611. [Google Scholar] [CrossRef] [Scilit]
  69. Yin, Y.; Ma, D.; Xu, X. The Landscape Catalytic Effect of Urban Waterfronts—A Case Study of the Huangpu River in Shanghai. Land 2025, 14, 422. [Google Scholar] [CrossRef] [Scilit]
  70. Ye, Y.; Li, D.; Liu, X. How Block Density and Typology Affect Urban Vitality: An Exploratory Analysis in Shenzhen, China. Urban Geogr. 2018, 39, 631–652. [Google Scholar] [CrossRef] [Scilit]
  71. Zhang, H.; Wu, Z.; Jiang, X.; Hu, J. Spatial and Temporal Characteristics of China’s Urbanization Development Stage Centered on Land Conversion. Land 2025, 14, 1841. [Google Scholar] [CrossRef] [Scilit]
  72. Ji, X.; Fu, Y.; Shi, J.; Liu, H. Measurement and Influencing Factors of Urban Waterfront Street Vitality from the Perspectives of Behavior and Perception. Environ. Res. Commun. 2025, 7, 015041. [Google Scholar] [CrossRef] [Scilit]
  73. Cao, Y.; Tang, X. Evaluating the Effectiveness of Community Public Open Space Renewal: A Case Study of the Ruijin Community, Shanghai. Land 2022, 11, 476. [Google Scholar] [CrossRef] [Scilit]
  74. Jian, I.Y.; Chan, E.H.W.; Xu, Y.; Owusu, E.K. Inclusive Public Open Space for All: Spatial Justice with Health Considerations. Habitat Int. 2021, 118, 102457. [Google Scholar] [CrossRef] [Scilit]
  75. Yung, E.H.K.; Conejos, S.; Chan, E.H.W. Public Open Spaces Planning for the Elderly: The Case of Dense Urban Renewal Districts in Hong Kong. Land Use Policy 2016, 59, 1–11. [Google Scholar] [CrossRef] [Scilit]
  76. Hermida, M.A.; Cabrera-Jara, N.; Osorio, P.; Cabrera, S. Methodology for the Assessment of Connectivity and Comfort of Urban Rivers. Cities 2019, 95, 102376. [Google Scholar] [CrossRef] [Scilit]
  77. Luo, Y.; Lin, Z. Spatial Accessibility Analysis and Optimization Simulation of Urban Riverfront Space Based on Space Syntax and POIs: A Case Study of Songxi County, China. Sustainability 2023, 15, 14929. [Google Scholar] [CrossRef] [Scilit]
  78. Wu, J.; Xiong, J. How Governance Tools Facilitate Citizen Co-Production Behavior in Urban Community Micro-Regeneration: Evidence from Shanghai. Land 2022, 11, 1243. [Google Scholar] [CrossRef] [Scilit]
  79. Delclòs-Alió, X.; Miralles-Guasch, C. Looking at Barcelona through Jane Jacobs’s Eyes: Mapping the Basic Conditions for Urban Vitality in a Mediterranean Conurbation. Land Use Policy 2018, 75, 505–517. [Google Scholar] [CrossRef] [Scilit]
  80. Ewing, R.; Cervero, R. Travel and the Built Environment: A Meta-Analysis. J. Am. Plan. Assoc. 2010, 76, 265–294. [Google Scholar] [CrossRef] [Scilit]
  81. Delclòs-Alió, X.; Gutiérrez, A.; Miralles-Guasch, C. The Urban Vitality Conditions of Jane Jacobs in Barcelona: Residential and Smartphone-Based Tracking Measurements of the Built Environment in a Mediterranean Metropolis. Cities 2019, 86, 220–228. [Google Scholar] [CrossRef] [Scilit]
  82. Jacobs, J. The Death and Life of Great American Cities; Random House: New York, NY, USA, 1961; ISBN 978-0-394-42159-9. [Google Scholar]
  83. Sung, H.-G.; Go, D.-H.; Choi, C.G. Evidence of Jacobs’s Street Life in the Great Seoul City: Identifying the Association of Physical Environment with Walking Activity on Streets. Cities 2013, 35, 164–173. [Google Scholar] [CrossRef] [Scilit]
Figure 1. Study area and distribution of assessment sites. Note: Left (L) and right (R) bank sites are labeled separately for the Huangpu River (15-x); for other rivers, paired sites are represented by a single marker.
Land 15 01297 g001
Figure 2. Conceptual framework of the PEW assessment system.
Land 15 01297 g002
Figure 3. Indicator-level PEW performance across river groups and correlation analysis. (A) Indicator scores across river segments. (B) Mean indicator profiles across river groups; shaded areas represent ±SD. (C) Spearman correlation matrix of indicators and channel width (** p < 0.01).
Land 15 01297 g003
Figure 4. Distribution of indicator scores across river groups. Stacked bar charts show the proportional distribution of indicator scores (1–5) for (A) large, (B) medium, and (C) small rivers.
Land 15 01297 g004
Figure 5. Dimension- and system-level PEW performance and spatial distribution. (A) Dimension-level scores across river groups. (B) System-level PEW scores across river groups. (C) Spatial distribution of PEW scores.
Land 15 01297 g005
Figure 6. Spatial distribution of urban vitality within the 15 min waterfront living circles. (AC) Distribution of transportation facility POIs, daily life service POIs, and public facility POIs. (DF) Distribution of population density, GDP density, and overall POI intensity.
Land 15 01297 g006
Figure 7. Coupling coordination and quadrant-based classification of PEW performance and urban vitality. (A) Spatial distribution of the coupling coordination degree (D) based on four subsystems (PEW score and three urban vitality component scores). (B) Quadrant-based classification of PEW and Comprehensive Urban Vitality scores.
Land 15 01297 g007
Table 1. Overview of data sources, spatial and temporal information, and analytical purposes.
Data TypeSourceSpatial and Temporal InformationPurpose
Field survey dataOn-site survey records based on structured field observations56 assessment points; October–December 2023; each point assigned a 1 km evaluation reachCapture on-site physical characteristics, accessibility, water-engagement features, and observed human activities for PEW assessment
River water quality dataShanghai Surface Water Quality Status Report [29]Official monitoring results; October 2023Assess physicochemical water quality, including pH, dissolved oxygen, permanganate index, COD, BOD5, ammonia nitrogen, total phosphorus, and total nitrogen
OSM map dataOpenStreetMap (https://www.openstreetmap.org)Vector data; 2023Provide road networks, building footprints, and other base spatial layers for spatial indicator calculation and GIS-based analysis
Population grid dataWorldPop (https://www.worldpop.org)100 m raster resolution; 2020Derive population density to characterize demographic vitality within 15 min waterfront living circles
GDP grid dataNighttime light and population-derived GDP dataset [30]1 km raster resolution; 2020Derive GDP density to characterize economic vitality within 15 min waterfront living circles
POI dataAmap (Gaode Map) (https://www.amap.com)Point-based data; 2022Characterize social-service vitality within 15 min waterfront living circles using transportation facilities, daily life services, and public facilities
Table 2. PEW indicator system and assessment methods.
DimensionIndicatorDescriptionData/MethodReferences
WA (Waterfront Amenity)Perceived Water Quality (PeWQ)Field-observed sensory conditions of water bodies, including water color, odor, and floating debrisStructured field observations[31]
Physicochemical Water Quality (PhWQ)Suitability of water quality for human contactOfficial monitoring data[32]
Physical Safety (PS)Safety-related design and infrastructural conditions (e.g., bank stability, hazard prevention; see Table S3 for details)Structured field observations[16,33]
Inclusive Facility Provision (IFP)Provision of barrier-free access and inclusive-support facilitiesStructured field observations[16,34]
WC (Waterfront Comfort)Shoreline Morphology (SM)Horizontal patterns and vertical structural configurations of the land-water interface (See Figures S1 and S2 and Table S4)Structured field observations[35]
Water Flow Characteristics (WFC)Hydrodynamic conditions influencing perceived comfort (flow diversity, velocity, volume, and water level)Structured field observations[36]
Vegetation Composition (VC)Vegetation structure, species richness, and overall coverage in waterfront spacesStructured field observations[37]
Water Visibility Index (WVI) *Quantitative visual exposure of water bodies within waterfront spaces (See Figure S3)Panoramic images & Semantic segmentation[38]
WED (Waterfront Experiential Diversity)Viewing Platforms (VP)Spatial settings enabling different degrees of proximity to water (See Figure S4)Structured field observations[39]
Water-Engagement Facilities (WEF)Provision of facilities supporting diverse waterfront activities and experiences (See Table S5)Structured field observations[40]
Waterfront Activity Diversity (WAD)Diversity of observed waterfront activity types (See Table S6)Structured field observations[40,41]
WAE (Waterfront Access Equity)Access & Perceived Openness (APO)Degree of physical accessibility and perceived openness enabled by spatial configurationStructured field observations[3,42]
Accessible Open Space Ratio (AOSR) *Proportion of accessible, non-built-up open space within evaluation unitsOpenStreetMap & ArcGIS 10.8[43]
Shoreline Continuity (SC)Ratio of continuously accessible shoreline to total shoreline length within each unitSpatial data & Structured field observations[44]
Lateral Access Ratio (LAR) *Lateral connectivity between waterfront and surrounding urban street networksSpatial data & Structured field observations[42,45]
* Indicators marked with an asterisk (*) include specific calculation formulas; details are provided below.
Disclaimer/Publisher’s Note: The statements, opinions and data contained in all publications are solely those of the individual author(s) and contributor(s) and not of MDPI and/or the editor(s). MDPI and/or the editor(s) disclaim responsibility for any injury to people or property resulting from any ideas, methods, instructions or products referred to in the content.