1. Introduction
Landslides are not only geological hazards but also important forms of rapid land surface disturbance in mountainous regions. They alter slope morphology, damage vegetation and farmland, disrupt transportation corridors, and reshape land-use safety patterns. Therefore, accurate mapping of landslide-affected land surfaces is essential for land degradation monitoring, post-disaster land assessment, and sustainable land management in mountain–basin transition zones.
Landslides are geological phenomena in which rock and soil on slopes lose stability, fail, and move downslope. They are common in mountainous regions worldwide and represent persistent threats to human life and critical infrastructure [
1,
2,
3,
4,
5,
6,
7]. Located in northeastern Qinghai Province, the Xining Basin is prone to landslides because its fault-basin setting, loess-covered hillslopes, unconsolidated near-surface deposits, concentrated summer rainfall, and intensive engineering disturbance jointly promote slope instability [
8,
9]. As the main urban center of the region, Xining City is especially affected: under the combined influence of intense rainstorms and intensive engineering activities, geological hazards often occur abruptly and impact large areas. In recent years, landslide-related events have highlighted the need for reliable hazard interpretation in the Xining region. On 15 September 2022, a destructive mudstone landslide in Xining damaged a bridge and affected the Lanzhou–Xinjiang high-speed railway [
10]. This event underscores the need for timely and accurate landslide identification and reliable pixel-level delineation for geological hazard interpretation and risk screening in the Xining region, where digital technologies are increasingly used to support landslide disaster risk research and management [
11,
12,
13,
14,
15,
16,
17].
Driven by the rapid expansion of very-high-resolution optical remote sensing imagery, deep learning (DL) has accelerated the transition of landslide identification from manual visual interpretation to automated semantic segmentation [
18,
19]. DL methods extract hierarchical features automatically through models such as convolutional neural networks (CNNs), recurrent neural networks (RNNs), and autoencoders. These approaches are well suited for large-scale landslide identification, removing the need for manual feature construction and enabling efficient analysis of complex environments. Among them, CNNs have emerged as one of the most widely adopted techniques for landslide detection [
20,
21,
22,
23,
24]. CNN-based architectures (e.g., U-Net, DeepLabV3+, ResNet variants, and Mask R-CNN) exhibit a strong capability to capture spatial and textural information across diverse mountainous settings and achieve competitive performance on public benchmarks, including recent landslide segmentation datasets [
25,
26,
27,
28,
29]. However, optical remote sensing-based methods remain sensitive to topographic shadows, vegetation cover, and spectral confusion with look-alike backgrounds, which can lead to false detections and missed landslides, particularly on steep and shaded slopes [
30,
31,
32,
33]. Beyond data-related limitations, current DL models also face architectural trade-offs. CNNs are effective at reconstructing boundaries and fine details but are limited in modeling long-range context, whereas Transformer-based encoders capture global dependencies but often require substantial memory and computational resources for very-high-resolution imagery [
26,
34]. As a result, designing efficient hybrid architectures that integrate CNN-style local refinement with attention-enabled global context modeling, while maintaining a favorable balance between accuracy and efficiency, remains a key challenge in landslide segmentation [
35]. Recent multi-scale and attention-enhanced frameworks have also been explored for landslide recognition in complex terrain [
36]. In landslide segmentation, the dominant errors are often concentrated at boundaries and slender runout zones. Landslide surfaces are frequently characterized by weak, heterogeneous textures and irregular gully-aligned shapes, and they are easily confused with look-alike backgrounds. As a result, Transformer-dominated encoders may produce over-smoothed or fragmented masks for small and elongated failures, whereas CNN-based models, although better at local boundary reconstruction, may still fail to capture long-range geomorphic cues required to suppress false positives. Therefore, a decoder-centric design guided by global context is considered necessary for practical mapping in very-high-resolution scenes.
To address these issues, this study proposes TM-Net (Twin-path Multi-scale Network) for very-high-resolution landslide segmentation in complex mountainous basins. TM-Net integrates an adopted encoder-side Inception Token Mixer with a newly designed decoder-side TM-Block. The contribution of this study lies in the task-oriented twin-path refinement mechanism for landslide boundary recovery and target-background discrimination. Specifically, TM-Block couples parallel channel calibration and multi-scale spatial refinement through residual feature modulation to reduce fragmented boundaries, missed narrow runout zones, and visually confusing background responses.
For experimental validation, the fused public benchmark is constructed with spatial isolation and is used together with XBLD as an independent regional benchmark for loess-area landslides. The main contributions of this work are summarized as follows: (1) TM-Net is proposed with TM-Block as a newly designed decoder-side twin-path multi-scale refinement module for landslide boundary recovery and background suppression; (2) a spatially isolated public fused benchmark is constructed, and XBLD is used as an independent Xining loess-region validation dataset; and (3) eight-model comparisons, ablation experiments, qualitative visualizations, and efficiency comparisons show that TM-Net provides an advantageous overall segmentation balance reflected by IoU and F1.
2. Materials and Methods
2.1. Public Landslide Datasets
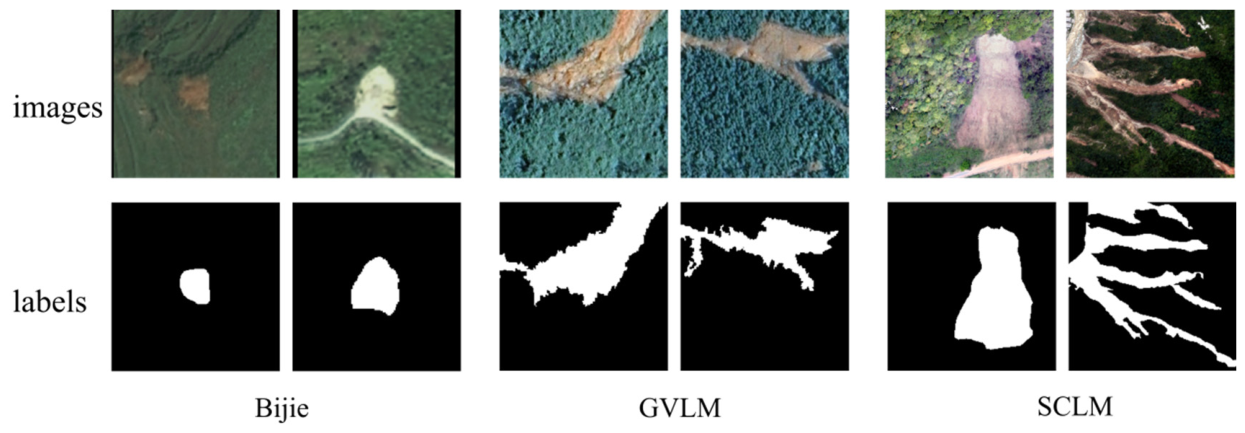
All datasets are provided at their original ground sampling distance (GSD), that is, their native spatial resolution. To evaluate robustness and in-domain performance, three public landslide datasets (
Figure 1) are fused into a unified benchmark for comparative experiments. The fused public benchmark retains the original annotations of the constituent datasets. Because landslide types, image sources, regional backgrounds, and labeling philosophies differ across Bijie, GVLM, and SCLM, this benchmark is intended to evaluate robustness under heterogeneous cross-region conditions rather than to represent a fully harmonized geological inventory standard. XBLD, by contrast, is an independent regional dataset constructed under the unified interpretation rules used in this study. Accordingly, the XBLD target definition described below is not retroactively imposed on the public datasets; their original label semantics are retained for cross-region robustness evaluation.
The Bijie subset (released by Wuhan University) covers Bijie City, Guizhou Province, a mountainous and hilly transition zone with steep relief and extensive mosaics of cropland and bare soil [
37]. The region is characterized by complex mountain river systems and a fragile ecological environment, making it highly prone to rainfall-induced landslides [
17]. This subset is built from 0.8 m TripleSat RGB imagery acquired between May and August 2018; landslides are typically small and elongated, with boundaries blurred by vegetation and cultivated land, thus stressing thin object recovery and boundary fidelity. The GVLM subset is a global very-high-resolution landslide mapping dataset interpreted from 0.59 m Google Maps imagery, covering 17 subregions worldwide across varied climates and landforms [
38]. It contains mixed rainfall-induced and earthquake-induced landslides as well as abundant landslide-like backgrounds such as cast shadows, talus, scree, and terraced fields, which pose a strong challenge to the cross-region robustness of segmentation models. The SCLM subset was constructed from high-resolution digital orthophotos and manually interpreted labels of landslide and debris-flow disasters in Sichuan Province and adjacent areas acquired between 2008 and 2020. The source imagery has a spatial resolution of approximately 0.2–0.9 m and covers diverse geomorphological and disaster settings. Because the dataset includes both landslide and debris-flow samples, it adds morphological variability and complex background conditions to the fused benchmark [
39,
40].
2.2. Study Area and Xining Basin Landslide Dataset
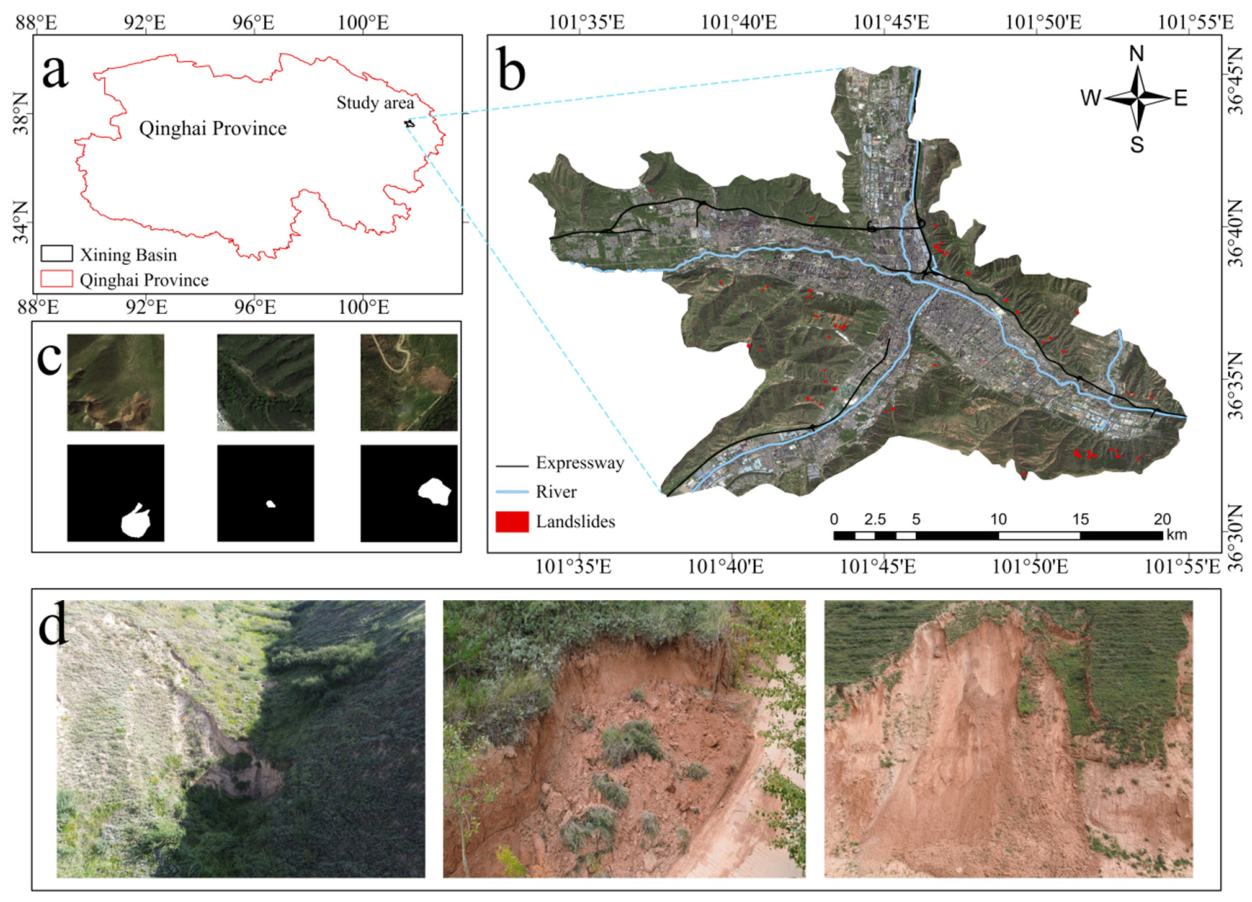
The Xining Basin is situated on the northeastern margin of the Qinghai–Tibet Plateau, at the transition to the Loess Plateau, and represents a complex mountain–basin environment [
8,
9]. It covers about 490 km
2 between 101°33′45″–101°56′15″ E and 36°25′05″–36°47′30″ N, and Xining, the capital of Qinghai Province, lies within this high-altitude basin at a mean elevation of about 2261 m. The regional topography exhibits strong relief, with elevations generally decreasing from southwest to northeast. The basin lies within a faulted Mesozoic–Cenozoic depression of the Qilian Mountain fold system, and its upper deposits include sand, gravel, and thick loess. The loose, porous loess and steep hillslopes are sensitive to rainfall infiltration and human disturbance, creating conditions favorable for shallow landslides and debris flows [
8,
9,
41]. The local climate is continental semi-arid, with long winters and short summers; a large proportion of annual rainfall occurs between June and September [
8,
41]. Xining has a spatially concentrated population distribution [
42], while cut slopes, fills, terraces, and other disturbed surfaces form complex look-alike backgrounds in the optical imagery used for XBLD. The study area and illustrative examples, including representative image–label pairs and field photographs acquired by an unmanned aerial vehicle, are shown in
Figure 2.
Within the above study area, we constructed XBLD from Gaofen-2 (GF-2) satellite imagery with a ground sampling distance of 0.8 m. GF-2 scenes acquired in 2022 and 2023 with low cloud cover were selected over landslide-prone zones, and landslide boundaries were manually delineated through visual interpretation to produce pixel-level labels.
For XBLD, the term landslide-affected land surface refers to the optically discernible ground surface altered by a discrete landslide at the time of image acquisition. It includes identifiable source, displaced-body, and runout or accumulation components when they can be interpreted as a spatially continuous landslide feature. The label does not represent the subsurface slip plane and is not equivalent to all bare land, disturbed ground, or engineering-exposed surfaces. Ordinary bare soil, farmland patches, road cuts, engineering slopes, terraces, and erosion gullies were treated as background unless morphology, slope position, texture, and spatial continuity jointly supported their interpretation as landslide foreground.
The inclusion criteria required that a landslide source area, main body, or transport/accumulation zone could be identified in the imagery; that the candidate had a reasonable geomorphic relation to slope position, gullies, road cuts, or disturbance boundaries; that continuous or semi-continuous landslide morphology, texture, or boundary evidence was present; and that the feature could be reliably separated from neighboring backgrounds. Excluded cases included highly ambiguous boundaries, erosion gullies or bare-soil patches lacking landslide morphology and spatial continuity, large composite failures extending beyond the patch context, and surface disturbances of uncertain origin. The labels were produced by manual visual interpretation based on GF-2 imagery, UAV photographs, and Google Earth 3D imagery to assess landslide morphology, slope position, boundary continuity, and geomorphic context. The main characteristics of the four datasets used in this study are summarized in
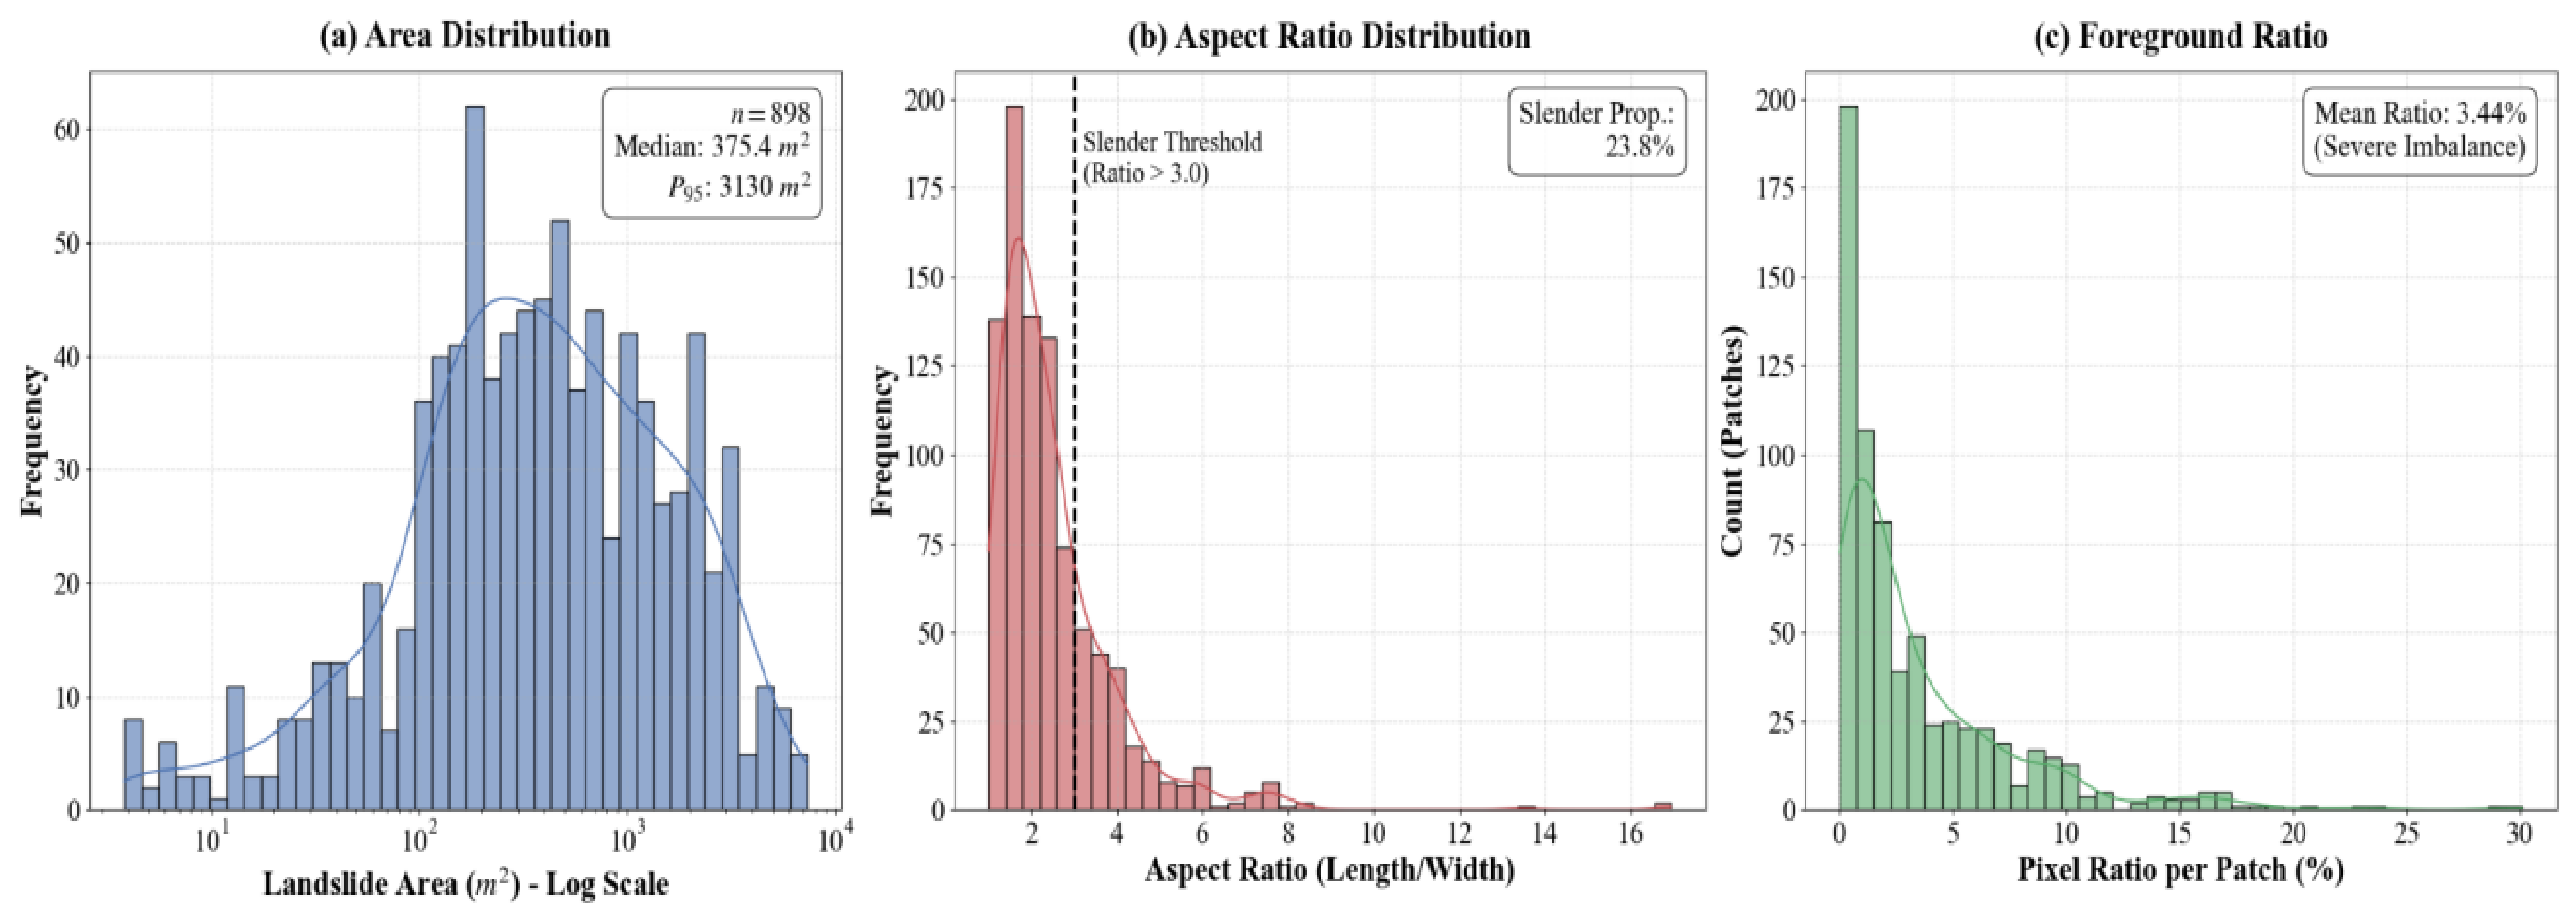
Table 1. The statistical properties of the 898 cropped landslide instances, including area, aspect ratio, and foreground pixel ratio, are shown in
Figure 3.
2.3. Preprocessing and Spatially Isolated Splits
For all datasets used in this study, a unified preprocessing pipeline is applied prior to model training. Images and labels are represented as 224 × 224 pixel three-channel RGB patches and binary labels, respectively, with landslide pixels encoded as 255 and background pixels as 0 (threshold value 127). Channel-wise z-score normalization statistics (mean and standard deviation) are estimated on the training split and applied to all images. During training, lightweight, label-consistent data augmentations are adopted, including horizontal and vertical flips, small rotations within the image plane (up to ±10°), and scale jittering in the range 0.7–1.4, whereas validation and test inference are performed without random augmentation, using a deterministic preprocessing pipeline [
43]. For the three public datasets (Bijie, GVLM, and SCLM), the original scenes and labels are converted into this common patch format by padding and center cropping or by sliding window tiling and resampling. For each patch, the proportion of landslide pixels is computed, and only patches whose landslide ratio exceeds a small threshold are retained as positive samples, while background-dominated patches are kept as negatives to alleviate class imbalance. After preprocessing, geographic blocking is first performed at the scene level to ensure spatial isolation; the blocked units are then assigned to training and validation subsets to approximate an 8:2 ratio, and this fused public split is used for training and evaluating all baseline models and the proposed TM-Net.
For the self-constructed XBLD derived from GF-2 imagery, spatial isolation is performed at the original GF-2 scene level rather than by randomly splitting cropped patches. Five cloud-free GF-2 scenes covering landslide-prone areas of Xining are cropped into 224 × 224 patches based on the manually delineated landslide labels. Four scenes (Groups A, B, C, and E) are used to generate the training set, whereas the remaining scene (Group D) is reserved for validation, so the training and validation subsets do not share original scenes or spatially overlapping source imagery. Within each split, landslide-free patches are sampled from non-failure areas according to the original experimental setting, and all comparison models use the same XBLD split and evaluation protocol.
2.4. TM-Net Architecture
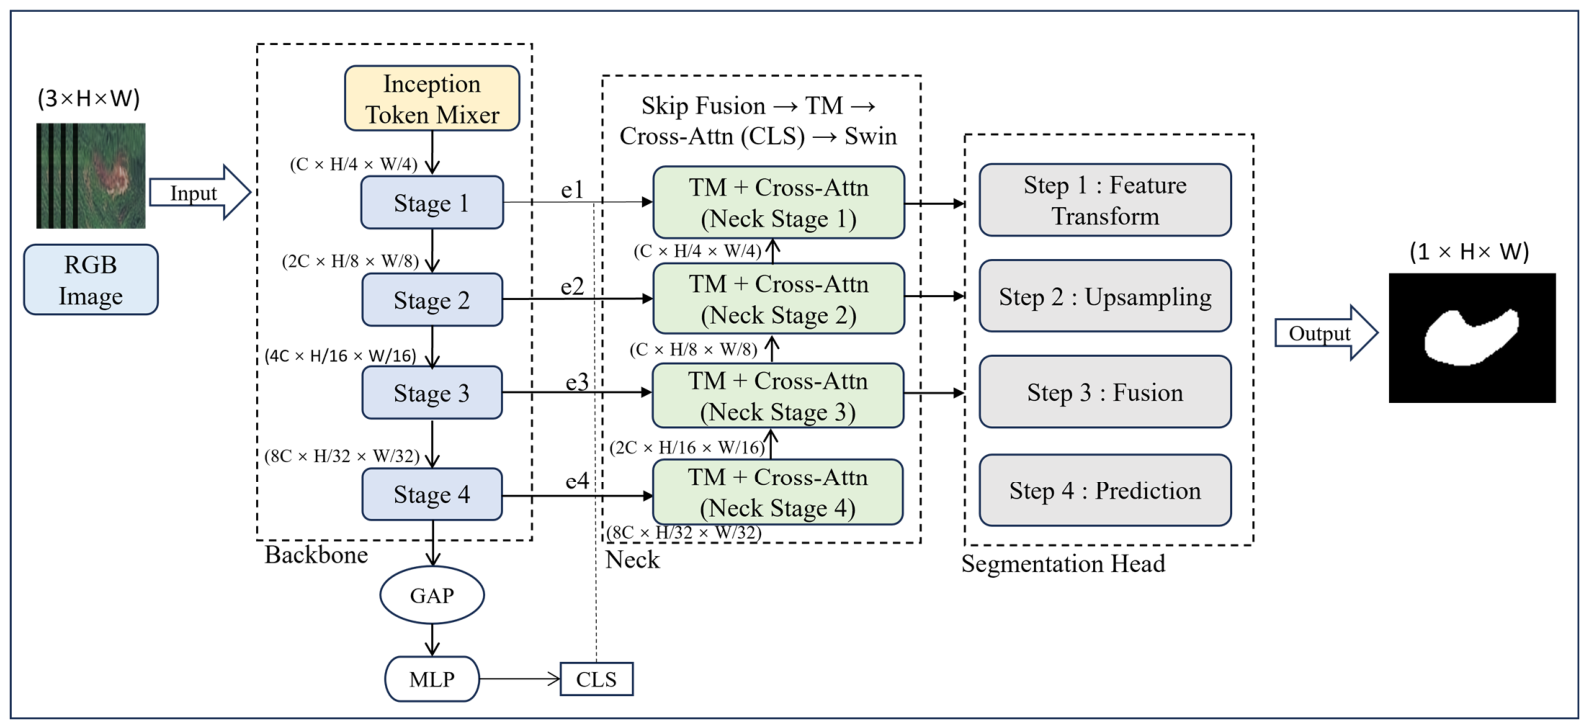
The proposed TM-Net is a decoder-centric hybrid architecture designed for landslide segmentation in very-high-resolution optical imagery. As shown in
Figure 4, the network follows an encoder–decoder paradigm, where a hierarchical Transformer-based encoder with an adopted Inception Token Mixer [
44] extracts multi-scale semantic features and a lightweight bottleneck bridges the encoder and decoder. In the decoding stage, multi-level features are progressively upsampled and fused with skip connections from the encoder, and each stage employs the newly designed TM-Block to support channel-wise recalibration and multi-scale spatial refinement. This design is intended to reduce landslide-like background interference and support recovery of thin, elongated landslide bodies.
This decoder-centric design is motivated by the observation that major segmentation errors in landslide mapping are often not caused by complete target absence but by boundary fragmentation, omission of narrow runout zones, and leakage into visually similar backgrounds.
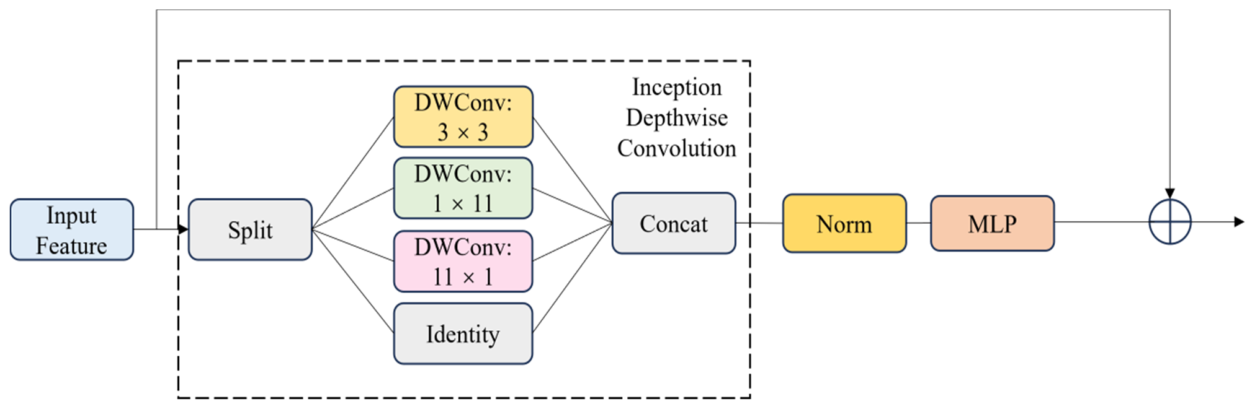
On the encoder side, the Inception Token Mixer is adopted from InceptionNeXt at the input stage to replace the conventional single convolution operation. Its role is early low-cost anisotropic and multi-scale feature extraction, which helps represent elongated and gully-aligned landslide components before deep semantic abstraction. It is not claimed as an original module of this paper.
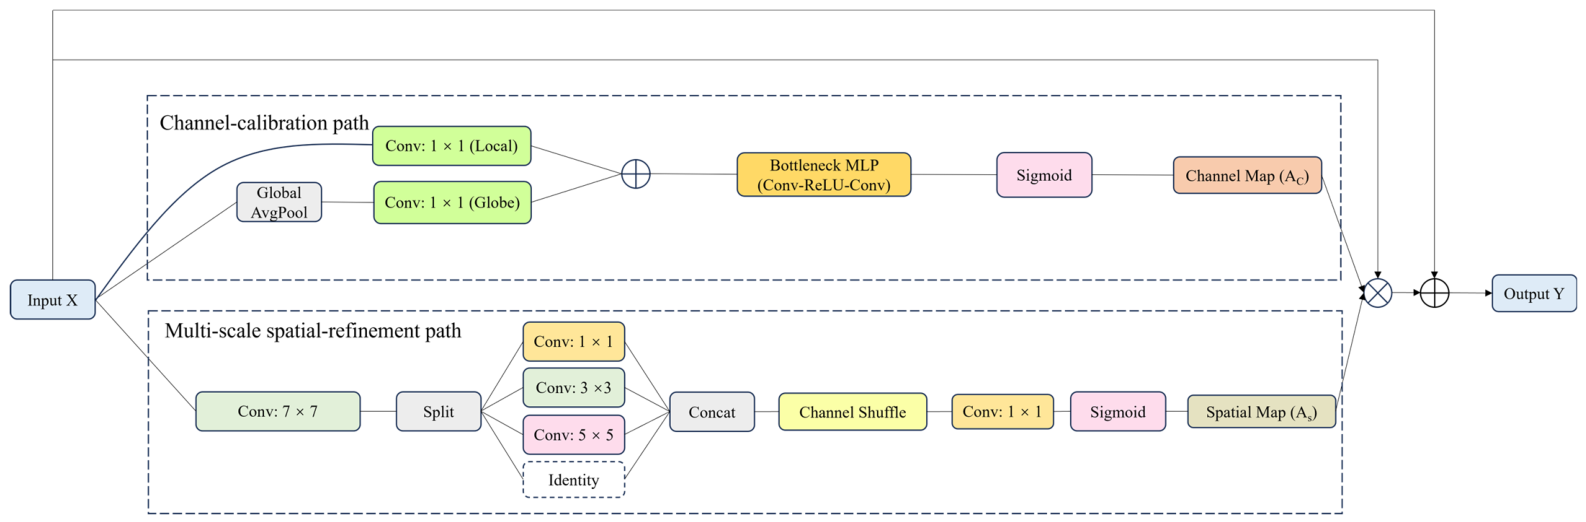
On the decoder side, TM-Block is the newly designed core module. TM-Block adopts a decoder-specific twin-path structure: a channel-calibration path performs adaptive global response recalibration, whereas a multi-scale spatial-refinement path restores local boundaries and texture details. The two paths are coupled through residual feature refinement to facilitate boundary continuity and reduce look-alike background responses.
2.5. Inception Token Mixer
The input feature map X is split channel-wise into four branches:
In this study, the Inception Token Mixer at the encoder input is implemented using the IncepDWConv module proposed in InceptionNeXt, also termed IncStem. We use this module as an adopted lightweight stem to inject directional and mixed-scale priors at the earliest feature extraction stage. Its contribution in TM-Net is functional and task-oriented.
where Y denotes the output feature map, Concat(·) denotes channel-wise concatenation, and DWConv(·) represents depthwise convolution with the corresponding kernel size.
By factorizing a large receptive field into several lightweight depthwise branches, a rich set of multi-scale, anisotropic local priors is provided at modest cost, which is particularly beneficial for capturing slender landslide bodies and narrow runout traces in the complex terrain of Xining City and for laying a solid foundation for subsequent hierarchical feature extraction. The Token Mixer block is shown in
Figure 5.
2.6. TM-Block
In the decoding stage, TM-Block is employed to support recovery of fine-grained boundaries and texture details that are typically degraded in deep networks. TM-Block is a newly designed decoder-side Twin-path Multi-scale Block. Its channel-calibration path emphasizes globally relevant feature channels, while its multi-scale spatial-refinement path uses grouped multi-scale perception and channel interaction to sharpen local landslide boundaries and suppress confusing backgrounds. The overall architecture and processing workflow of TM-Block are illustrated in
Figure 6.
In the channel attention branch, channel responses are recalibrated under global contextual guidance. Local responses are first extracted by a lightweight convolutional transformation, while global statistics are simultaneously captured by global average pooling (GAP) followed by a 1 × 1 convolution. The two streams are fused and passed through a bottleneck multilayer perceptron (MLP) to produce the channel attention map A
C, which is defined as
where σ(·) denotes the Sigmoid activation function and M(·) represents the bottleneck MLP structure, and A
C denotes the channel attention map. This branch emphasizes landslide-related feature channels while suppressing less informative responses from complex backgrounds.
In the multi-scale spatial attention branch, which forms the spatial-refinement component of the proposed TM-Block, a “Compress–Split–Perceive” strategy is adopted. The input feature map X is first compressed and smoothed by a 7 × 7 convolution, generating an intermediate representation Z. Then, Z is split along the channel dimension into four subgroups, denoted as
. These subgroups are processed in parallel to capture structures at different spatial scales:
where Ẑ denotes the concatenated multi-scale spatial representation. The 1 × 1, 3 × 3, and 5 × 5 convolution branches capture spatial responses with different receptive fields, while the identity branch Z4 preserves part of the original compressed representation.
To facilitate information exchange across the four branches, a Channel Shuffle operation S(·) is applied to Ẑ. The shuffled representation is then projected by a 1 × 1 convolution and normalized by the Sigmoid function to generate the spatial attention map A
S:
Finally, the refined output
is obtained by modulating the input
with both A
C and A
S, followed by a residual addition:
where ⨀ denotes element-wise multiplication. Through this twin-path multi-scale design, TM-Block is intended to enhance landslide-relevant channel responses, refine local boundaries, and reduce background noise. This supports decoder-stage feature reconstruction for small, slender, and morphologically complex landslides in very-high-resolution scenes.
2.7. Hierarchical Feature Refinement Pipeline
To effectively integrate the proposed modules into the network, a structured feature refinement pipeline is employed within each decoder stage. At the beginning of each stage, the upsampled deep features are fused with the corresponding skip-connected encoder features through a lateral fusion block. The fused feature map is then processed by a TM-Block, which recalibrates channel responses and restores fine-grained spatial details at an early stage of decoding. Subsequently, a cross-attention module interacts with the global class token to inject long-range semantic guidance and suppress background noise. Finally, a Swin Transformer block further abstracts the refined representation and prepares it for propagation to the next stage. With this serial design, where local refinement is followed by global guidance, the features passed to subsequent stages are endowed with both sharp boundary delineation and consistent semantic structure, which is crucial for accurate segmentation of small and morphologically complex landslides.
2.8. Experimental Settings and Evaluation Metrics
TM-Net was implemented using the PyTorch 2.1 framework and trained on a single NVIDIA RTX 4090 GPU. For TM-Net, the AdamW optimizer was used with an initial learning rate of 1.0 × 10
−3 and a weight decay of 0.05, together with cosine annealing after a 20-epoch warm-up. TM-Net was trained for 100 epochs with a batch size of 32. The compared models were trained using their respective implementation settings, including model-specific batch sizes. All models were evaluated using the same spatially isolated data splits and the same cumulative pixel-level metric calculation. The checkpoint with the best validation IoU was used for final evaluation. The training configuration of TM-Net is summarized in
Table 2.
In this study, Intersection over Union (IoU), Precision (Pre), Recall (Rec), and F1 score were used to evaluate landslide segmentation performance. All metrics were calculated from the cumulative numbers of true positive (TP), false positive (FP), and false negative (FN) pixels over the complete validation set. This unified evaluation protocol ensures that F1 is mathematically consistent with both IoU and Precision/Recall and avoids inconsistencies caused by averaging rounded image-level values.
where TP denotes landslide pixels correctly predicted as landslides, FP denotes background pixels incorrectly predicted as landslides, and FN denotes landslide pixels incorrectly predicted as background. IoU measures the overlap between the predicted and reference landslide regions. Precision reflects the ability of the model to suppress false-positive predictions, Recall indicates the ability to recover true landslide pixels, and F1 provides a balanced assessment of Precision and Recall.
3. Results
3.1. Comparison with Representative Advanced Models
On the fused public benchmark, TM-Net achieved the highest IoU (73.56%) and F1 (84.76%) under the identical evaluation protocol (
Table 3). The improvement over the strongest baseline was moderate but consistent: compared with SegFormer, TM-Net improved IoU by 0.89 percentage points and F1 by 0.59 percentage points. TM-Net also achieved the highest Pre (82.47%), whereas SegFormer produced the highest Rec (88.29%), indicating that TM-Net did not rank first in every individual metric.
These results support a restrained interpretation. TM-Net provided a more favorable overall balance between missed landslide pixels and false-positive predictions rather than comprehensively outperforming every model on every metric. The adopted Inception Token Mixer supports recovery of elongated targets, while the newly designed TM-Block strengthens decoder-side boundary refinement and confusing-background suppression.
All metrics were calculated from cumulative pixel statistics over the complete validation set. The relatively small numerical margin between TM-Net and the strongest baseline is also informative. On a fused benchmark containing different landslide types, image sources, spatial resolutions, and background conditions, large performance gaps are not necessarily expected. Instead, the results show that several models can achieve competitive performance while exhibiting different prediction tendencies. For example, a higher Recall may reflect more complete recovery of candidate landslide pixels, but it can also be accompanied by increased false-positive responses in visually similar terrain. Conversely, higher Precision may indicate more conservative suppression of background interference, while potentially excluding weak or fragmented target pixels. The joint consideration of IoU, F1, Precision, and Recall is therefore necessary for interpreting segmentation behavior in complex mountainous imagery.
3.1.1. Comparative Analysis of Segmentation Results
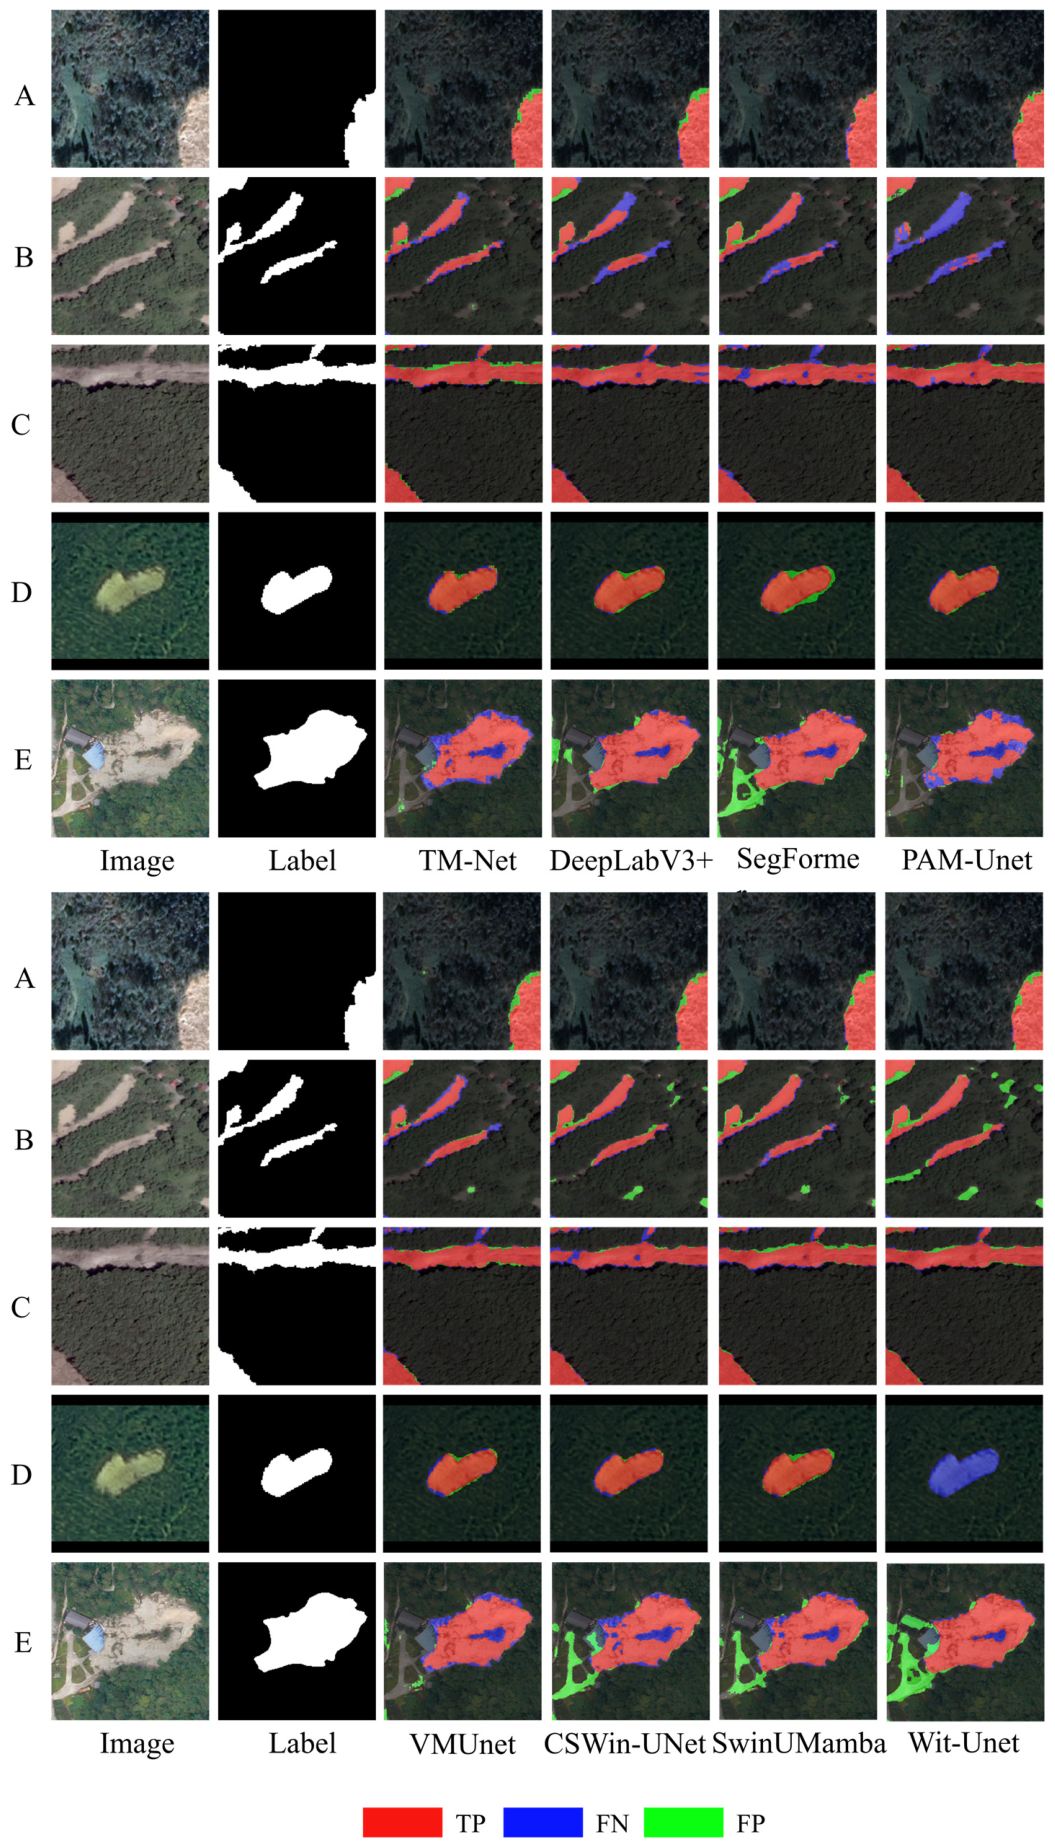
To qualitatively compare TM-Net with other state-of-the-art models, five representative validation patches are examined in
Figure 7, where red, green, and blue denote TP, FP, and FN pixels, respectively. In the selected examples, TM-Net generally produced more continuous landslide masks with fewer fragmented boundaries, but these examples should be interpreted as qualitative support rather than proof of universal superiority.
The main visual differences among models can be summarized by three recurring error patterns: boundary shrinkage, fragmentation of narrow targets, and leakage into visually similar backgrounds. TM-Net was associated with fewer fragmented responses in several slender or low-contrast cases, while some baselines showed local omissions or false positives near forest edges, roads, bare soil, and terrace-like surfaces.
These qualitative observations are consistent with the quantitative comparison in
Table 3. They suggest that TM-Net improves the balance between target recovery and false-positive suppression in the selected validation examples, while remaining subject to boundary uncertainty and background confusion in challenging scenes. In particular, the selected visual examples illustrate why a single metric cannot fully describe the mapping difficulty. For elongated or gully-aligned targets, a model may correctly identify the central part of a landslide while omitting the narrow terminal or lateral portions. Such errors can reduce the spatial continuity of the mapped surface even when the main body is recognized. In other cases, background elements with exposed soil, linear road margins, terrace boundaries, or shadow transitions may generate isolated false-positive patches. The qualitative comparison therefore complements
Table 3 by showing how omission and commission errors are distributed spatially. It also highlights that the remaining uncertainty is concentrated mainly along weak boundaries and in locations where the optical appearance of landslide-affected surfaces overlaps with surrounding disturbed terrain.
3.1.2. Interpretability Analysis via Grad-CAM Visualization
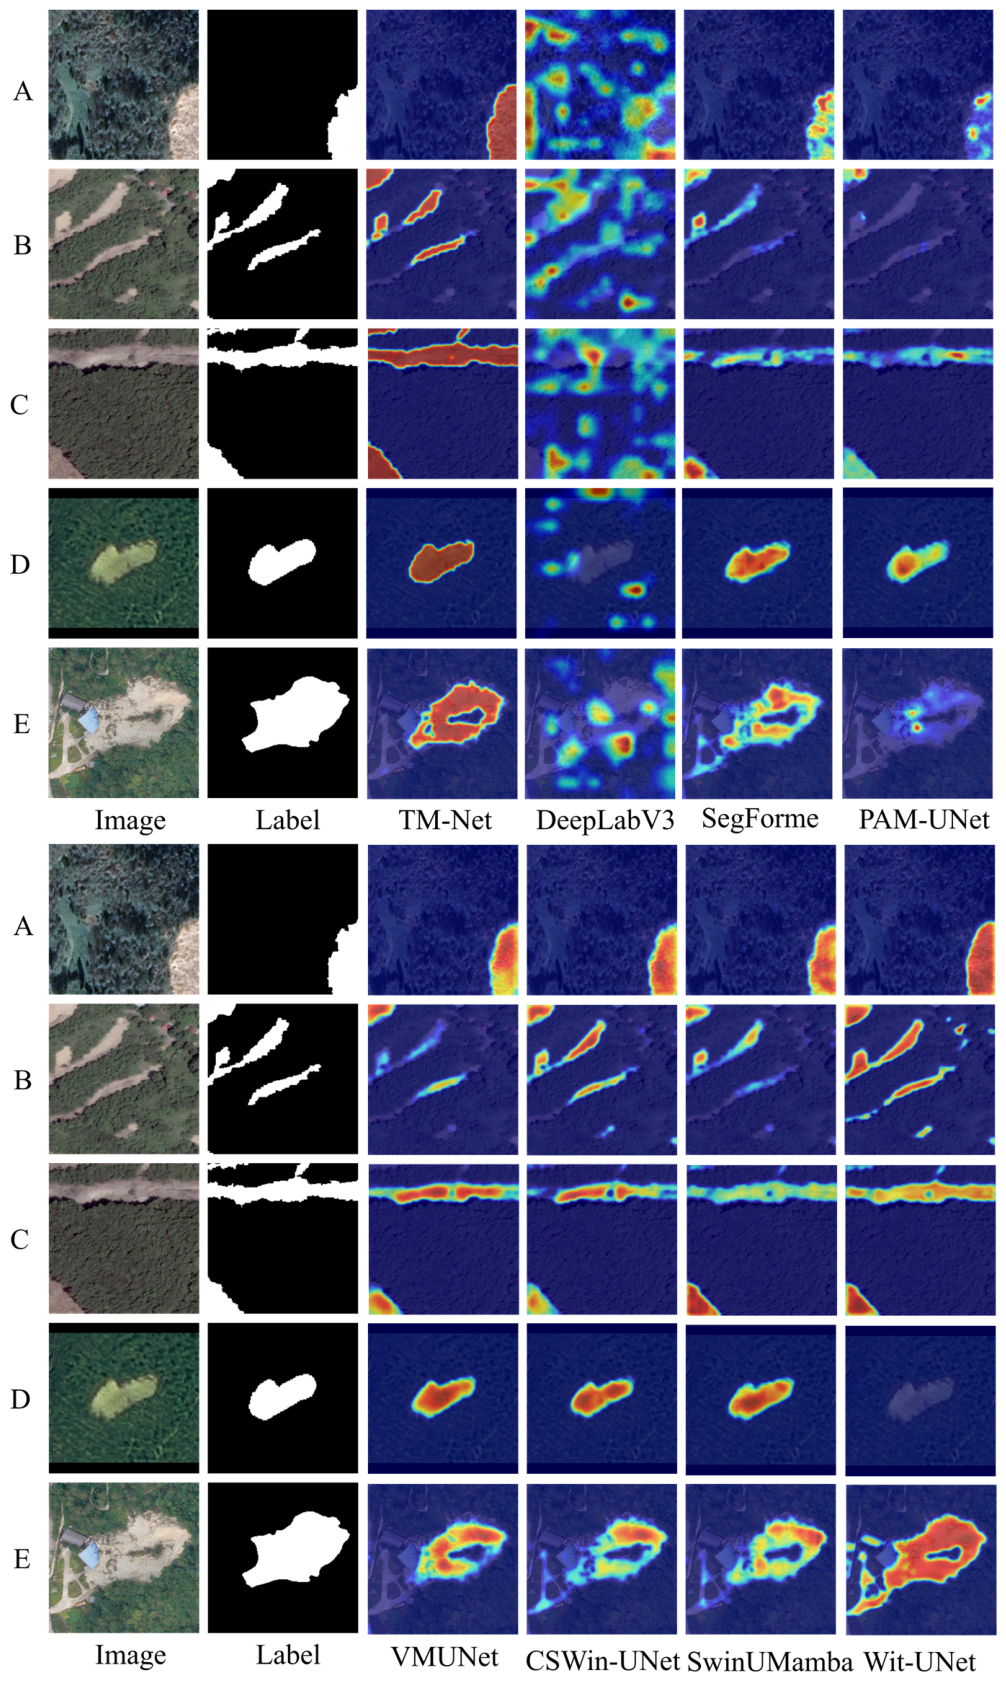
Grad-CAM visualizations (
Figure 8) are used as qualitative supporting evidence for how different models concentrate responses over representative validation scenes. TM-Net generally produced more compact responses over mapped landslide bodies in the selected examples, whereas several baselines showed more diffuse, fragmented, or displaced activation under complex textures.
These Grad-CAM patterns are consistent with the segmentation outputs and the numerical comparison, but they should not be interpreted as strict proof of the internal mechanism or causal behavior of the network. The activation maps should also be interpreted in relation to the heterogeneous appearance of the mapped targets. Landslide-affected surfaces may include exposed source areas, displaced materials, and runout components with different textures and illumination conditions within the same image patch. Consequently, a useful response pattern is not necessarily one that concentrates only on the visually brightest or most homogeneous part of a target. In the selected examples, TM-Net tended to maintain attention over a broader portion of the mapped landslide body while reducing diffuse responses in adjacent terrain. This observation is consistent with the more continuous masks shown in
Figure 7, although the activation maps are not used as a quantitative measure of model reliability.
3.2. Ablation Study
To validate the effectiveness of the adopted Inception Token Mixer and the proposed TM-Block, a progressive ablation study was conducted on the fused public benchmark using the Baseline network. Three configurations were evaluated: adding TM-Block to the decoder, replacing the original stem with the Inception Token Mixer, and integrating both modules to form TM-Net. The results are summarized in
Table 4.
Compared with the Baseline (IoU = 70.72%), adding TM-Block alone increased IoU to 73.06%, which is the largest single-module IoU improvement among the ablation variants. The TM-Block variant also achieved the highest Pre (84.15%), supporting its role in boundary discrimination and false-positive suppression.
Replacing the encoder stem with the Inception Token Mixer increased IoU to 72.16% and produced the highest single-module Rec (87.21%). This suggests that the adopted early anisotropic mixed-scale stem contributes more to target completeness and recovery of slender or low-contrast landslide regions.
When both modules were combined, TM-Net achieved the highest IoU (73.56%) and F1 (84.76%). These results support the interpretation that TM-Block primarily improves boundary discrimination and false-positive suppression, whereas the Inception Token Mixer contributes to target completeness. Their integration yields the best balance between omission and commission errors.
3.2.1. Qualitative Analysis of Ablation Study Results
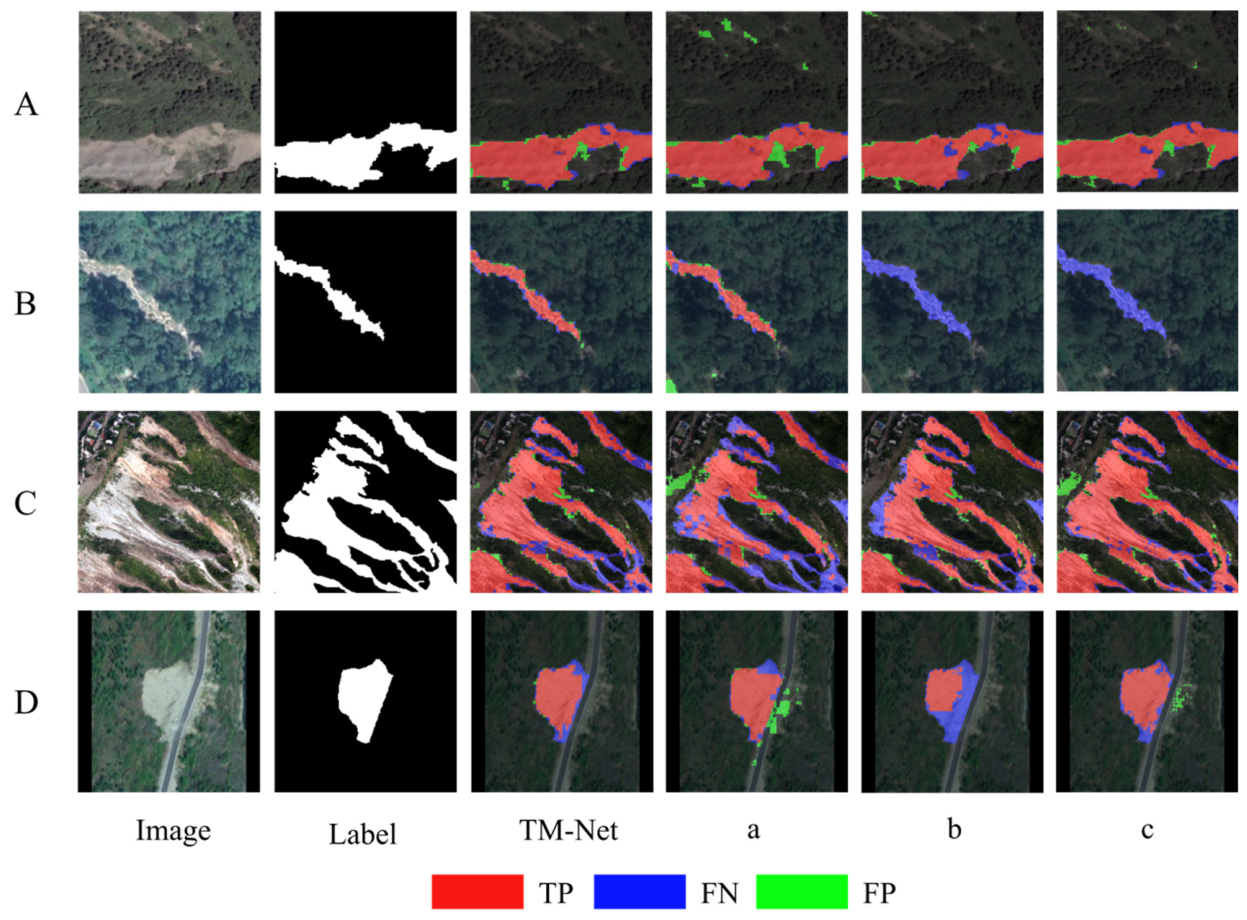
TP-FP-FN visualizations on representative validation patches are provided in
Figure 9 to qualitatively compare TM-Net with its ablation variants. The Baseline decoder can roughly localize landslide bodies, but the predictions tend to show boundary instability, fragmented narrow targets, and scattered false positives on visually similar backgrounds.
The Inception Token Mixer variant was associated with more complete recovery of some slender or low-contrast targets, consistent with its higher Rec. The TM-Block variant showed stronger suppression of confusing backgrounds in several examples, consistent with its higher Pre. These qualitative patterns should be viewed as supporting evidence for the numerical ablation results rather than as exhaustive proof across all scenes.
With both modules integrated, TM-Net showed the most favorable qualitative balance among the ablation variants in the selected examples. The masks were generally more continuous, boundary errors were more localized, and false positives were better constrained than in the Baseline or single-module variants. The qualitative ablation comparison also helps explain why the full configuration does not simply inherit the strongest individual metric from either single-module variant. The Inception Token Mixer variant produced higher Recall, suggesting a tendency to retain more weak or elongated target components, whereas the TM-Block variant produced higher Precision, indicating stronger control of background responses. When both components were used together, the resulting masks generally preserved the main landslide extent while limiting part of the over-expansion observed in difficult backgrounds. This pattern is consistent with the higher IoU and F1 of the complete model. However, residual errors remained in areas characterized by low contrast, incomplete optical exposure, or ambiguous boundaries, indicating that the combination reduces but does not eliminate the inherent uncertainty of optical landslide delineation.
3.2.2. Interpretability Analysis of the Ablation Study via Grad-CAM
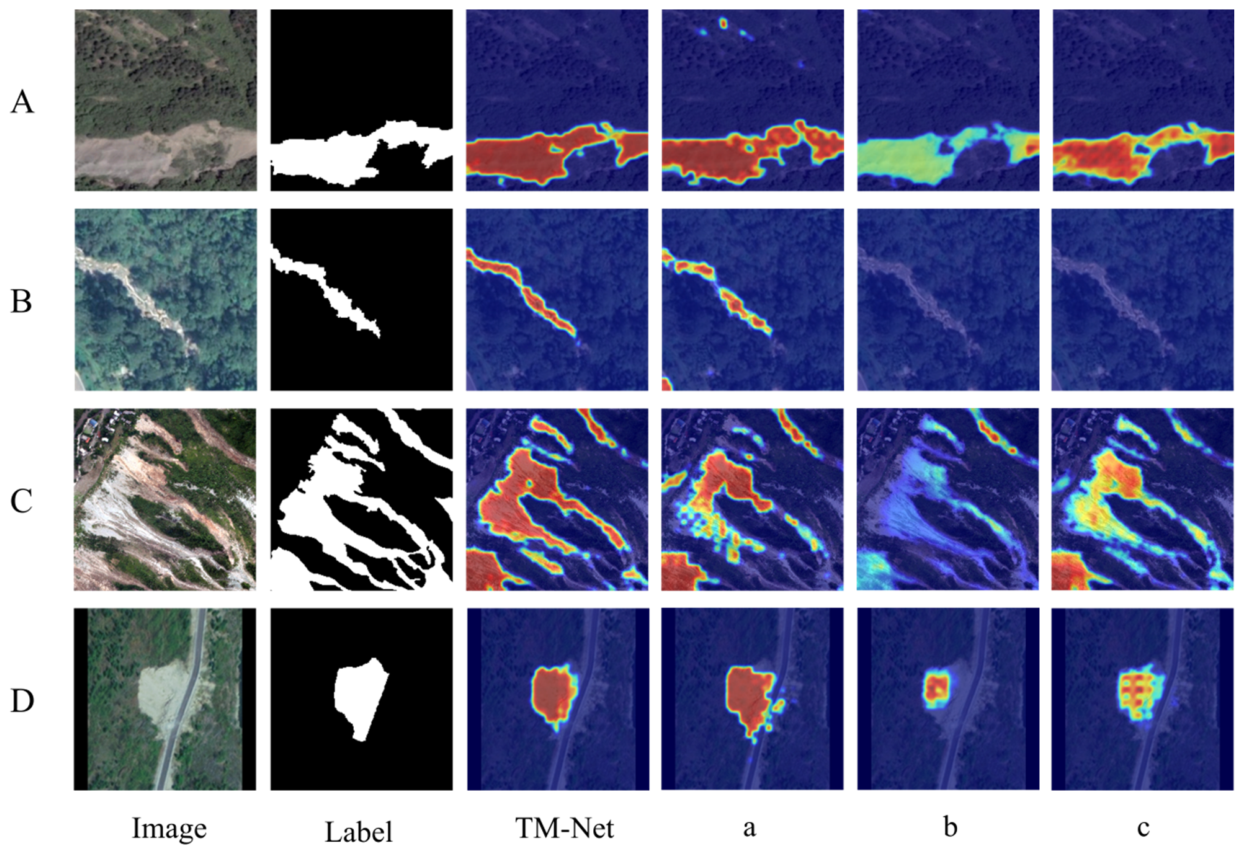
To further interpret the contributions of the key architectural components, Grad-CAM visualizations are generated for four representative validation scenarios (
Figure 10A–D). From top to bottom, the four rows correspond to
Figure 10A, a large irregular landslide extending to the image boundary;
Figure 10B, a long, narrow landslide body in forested terrain;
Figure 10C, multiple closely spaced elongated landslide bodies in complex terrain; and
Figure 10D, a small isolated landslide adjacent to a road. Collectively, these cases cover diverse landslide geometries and typical background interferences.
The Grad-CAM visualizations in
Figure 10 provide qualitative support for the complementary roles suggested by
Table 4. The Inception Token Mixer variant tended to retain broader responses over landslide targets, whereas the TM-Block variant was associated with more localized background suppression. The complete TM-Net combined these tendencies, but the visualizations are interpreted as supporting evidence rather than strict mechanistic proof.
3.3. Independent Regional Robustness Evaluation on XBLD
Under the same XBLD split and evaluation protocol, TM-Net achieved the highest IoU (44.94%) and F1 (62.01%), indicating the best overall segmentation balance on this dataset. TM-Net was not the best in every individual XBLD metric. DeepLabV3+ produced a slightly higher Pre (57.75%), while several models produced higher Rec, including Swin-UMamba (72.46%). These results show that TM-Net’s advantage is the overall balance between landslide recovery and false-positive control rather than dominance in every single metric.
The lower absolute metric values on XBLD relative to the fused public benchmark indicate that the independent regional task is substantially more difficult. This difference likely reflects the combined effects of regional domain shift, scene-level spatial isolation, and visually similar loess-slope backgrounds. XBLD contains small and fragmented landslide-affected surfaces embedded within loess slopes, cultivated land, terraces, road cuts, erosion features, and other disturbed surfaces. These elements often have partially overlapping spectral and textural characteristics, particularly where vegetation cover is sparse or where engineering disturbance has modified the slope surface. The results therefore should not be interpreted only as a ranking of models but also as evidence of the difficulty of applying optical segmentation methods to a realistic urban–rural fringe environment. Although TM-Net achieved the highest IoU and F1, the moderate values across all methods show that substantial uncertainty remains in distinguishing landslides from look-alike backgrounds.
3.3.1. Qualitative Comparison on XBLD
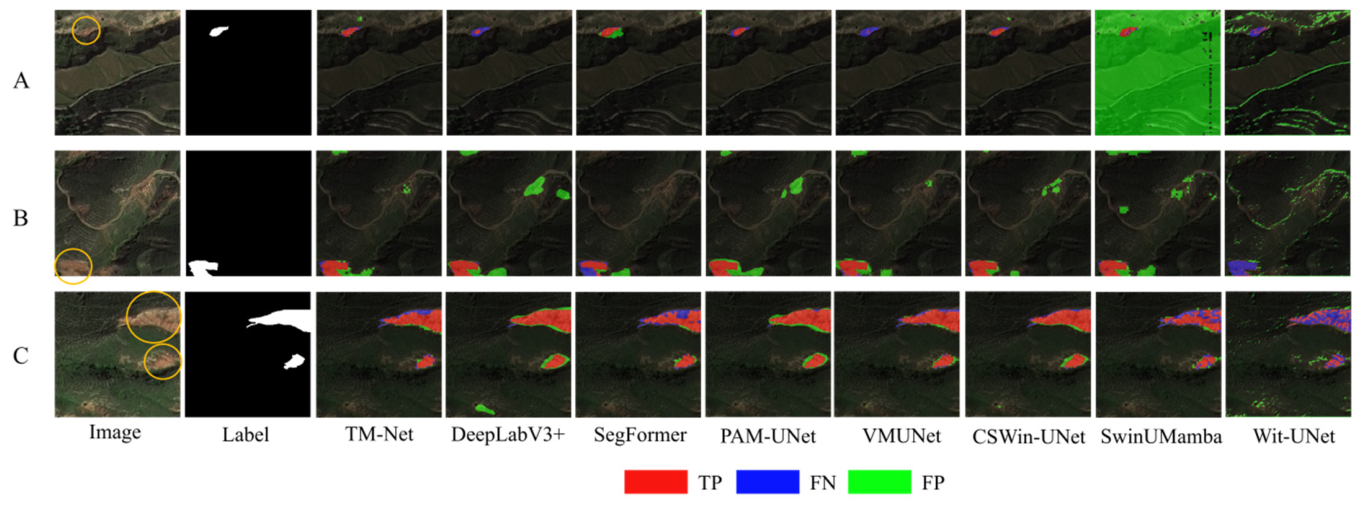
To qualitatively assess independent regional robustness on XBLD under complex real-world conditions, three representative samples are compared in
Figure 11A–C.
Figure 11A shows a small landslide near the upper image boundary,
Figure 11B shows a partially visible landslide near the lower-left image boundary, and
Figure 11C contains multiple spatially separated landslide bodies of different sizes.
Across the representative XBLD cases, TM-Net generally produced compact and spatially coherent responses while avoiding some extended false-positive patterns observed in several baselines. These observations are consistent with the XBLD results, where TM-Net achieved the highest IoU (44.94%) and F1 (62.01%), supporting a better balance between target recovery and background suppression under complex loess terrain. The three representative scenarios also reflect different sources of difficulty in the regional dataset. Isolated small landslides are vulnerable to omission because only a limited number of pixels represent the target. In scenes affected by strong texture interference, patches of exposed loess, cultivated surfaces, and erosion-related features can resemble disturbed landslide materials. Compound scenes introduce an additional challenge because adjacent failures and background disturbances may be spatially close while not belonging to the same landslide unit. In these situations, the visual objective is not only to recover as many target pixels as possible but also to preserve plausible object extent and avoid merging unrelated disturbed areas. The selected examples suggest that TM-Net can provide relatively coherent responses in such cases, although false positives and local omissions remain visible in difficult parts of the scenes.
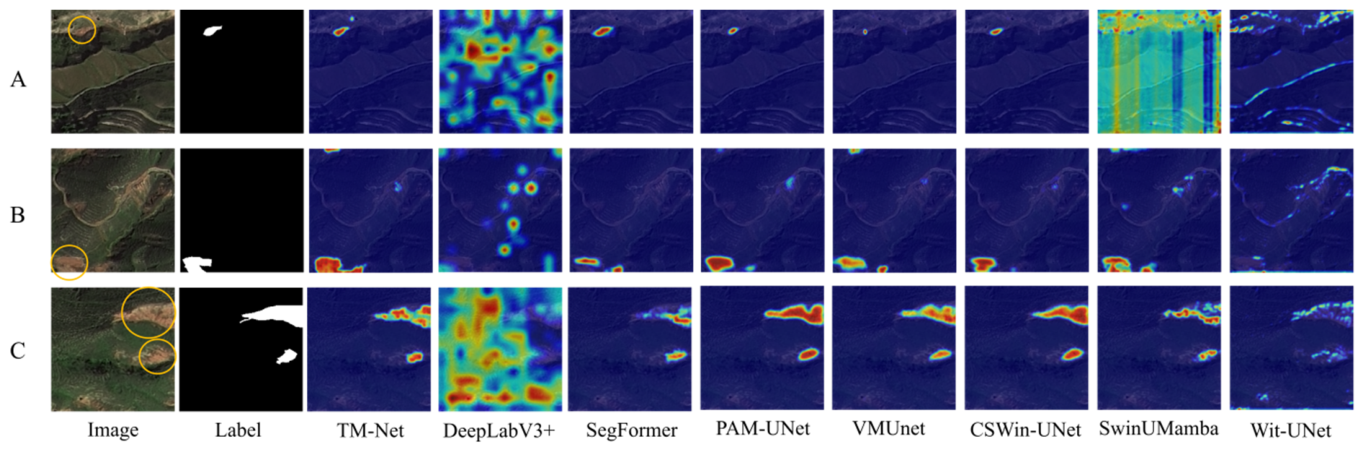
3.3.2. Qualitative Attention Visualization on XBLD
Figure 12 shows Grad-CAM visualizations for three representative samples from XBLD, comparing TM-Net with mainstream baselines. These maps are used only as qualitative supporting evidence. Across the examples, TM-Net tended to produce compact responses over mapped landslide-affected surfaces, whereas several baselines showed more diffuse, fragmented, or displaced attention under look-alike loess backgrounds.
Overall, the Grad-CAM comparisons on XBLD are consistent with the segmentation outputs and
Table 5 results. They suggest more coherent responses over landslide-affected surfaces in selected examples, but they do not constitute strict proof of the network’s internal mechanism.
3.4. Computational Efficiency Analysis
Table 6 summarizes the computational complexity and inference throughput of the compared models. TM-Net is not the smallest or highest-throughput model; instead, it provides a competitive accuracy–efficiency trade-off by combining the highest IoU and F1 in
Table 3 with moderate parameter count, FLOPs, and FPS. The complexity results should be interpreted together with the intended mapping setting. TM-Net contains 35.85 M parameters and requires 4.18 G FLOPs, placing it between very lightweight architectures and larger convolutional models in terms of computational demand. Its inference speed of 71.97 FPS is lower than that of the fastest compared models but remains suitable for patch-based batch inference on a modern GPU. The table also shows that low parameter count does not necessarily correspond to low FLOPs or high throughput, because runtime behavior depends on feature resolution, decoder operations, attention mechanisms, and implementation details. For practical use, the relevant consideration is therefore not whether a model is universally fastest but whether its computational cost is acceptable relative to the quality and spatial coherence of the segmentation output. Under this perspective, TM-Net provides a usable compromise for high-resolution landslide mapping workflows that require both detailed boundary delineation and repeated processing of image patches.
4. Discussion
4.1. Mechanism: Synergy of Anisotropy and Refinement
A persistent difficulty in optical landslide segmentation is the simultaneous presence of strong background interference and fine boundary ambiguity. TM-Net addresses this problem through a task-oriented decoder-centric architecture. The adopted Inception Token Mixer introduces early anisotropic mixed-scale representation for elongated and gully-controlled targets, while the newly designed TM-Block performs decoder-stage residual refinement by coupling global channel recalibration with local multi-scale spatial modulation. This design is intended to improve landslide boundary recovery and target–background discrimination, especially where bare soil, terraces, roads, erosion gullies, shadows, and engineering slopes resemble landslide-affected surfaces. The ablation results support different but complementary roles: TM-Block contributes more to boundary discrimination and false-positive suppression, whereas the Inception Token Mixer contributes to target completeness. Grad-CAM is used only as qualitative supporting evidence for these observations. The observed behavior can also be understood from the spatial organization of landslide-affected surfaces in optical imagery. A landslide rarely appears as a uniform object with a single stable texture. Source areas may be brighter because of exposed soil, displaced material may show rougher texture, and runout zones may be partially covered by vegetation or affected by cast shadows. At the same time, adjacent non-landslide surfaces can contain similar exposed materials, linear boundaries, and local roughness. This spatial heterogeneity explains why coarse semantic representations alone may be insufficient for accurate delineation. The results suggest that maintaining local detail during decoding is particularly important where the mapping decision depends on weak boundary cues rather than on a strong spectral contrast. Nevertheless, optical evidence remains incomplete in some settings, especially where the original slope morphology is obscured, the image is shadowed, or the affected surface has already undergone partial recovery.
4.2. Implications for Mountainous Land Monitoring and Hazard-Related Land Management
The comparative results in
Table 3 indicate that TM-Net achieved the highest IoU (73.56%) and F1 (84.76%) on the fused public benchmark, while maintaining competitive but not highest Recall. This pattern suggests that TM-Net provides a useful balance between preserving subtle landslide pixels and suppressing false positives. For mountainous land monitoring, such behavior is valuable because missed landslide-affected pixels can lead to incomplete post-disaster land damage inventories, fragmented candidate zones, or truncated runout boundaries.
In practical land-management workflows, TM-Net can support candidate-area extraction, preliminary mapping, boundary drafting, and decision support before expert review or field verification. The XBLD experiment reflects a realistic loess-region setting where landslides are embedded within complex backgrounds such as terraces, roads, erosion features, bare soil, and shadows. TM-Net should therefore be regarded as a deep-learning-assisted tool for improving the mapping efficiency of visually interpretable landslide-affected surfaces, not as a replacement for full geological interpretation, field investigation, or expert judgment. A practical application workflow would involve first applying the model to produce a preliminary probability map or binary candidate map over areas of interest, followed by visual review of locations with uncertain boundaries or strong background interference. The resulting products could help prioritize expert interpretation, identify areas requiring field verification, and provide an initial spatial framework for post-event land-surface inventorying. This is particularly relevant in mountain–basin transition zones, where the number of potentially unstable slopes may be large and manual interpretation of very-high-resolution imagery is time-consuming. The model output may also be useful for comparing mapped disturbance patterns between image dates when consistent data are available, although such comparisons should be interpreted cautiously because apparent changes can be influenced by illumination, vegetation, image quality, and seasonal surface conditions. In all cases, the segmentation result should be combined with terrain context, geological knowledge, and independent observations before it is used for engineering or hazard-management decisions.
4.3. Limitations and Future Work
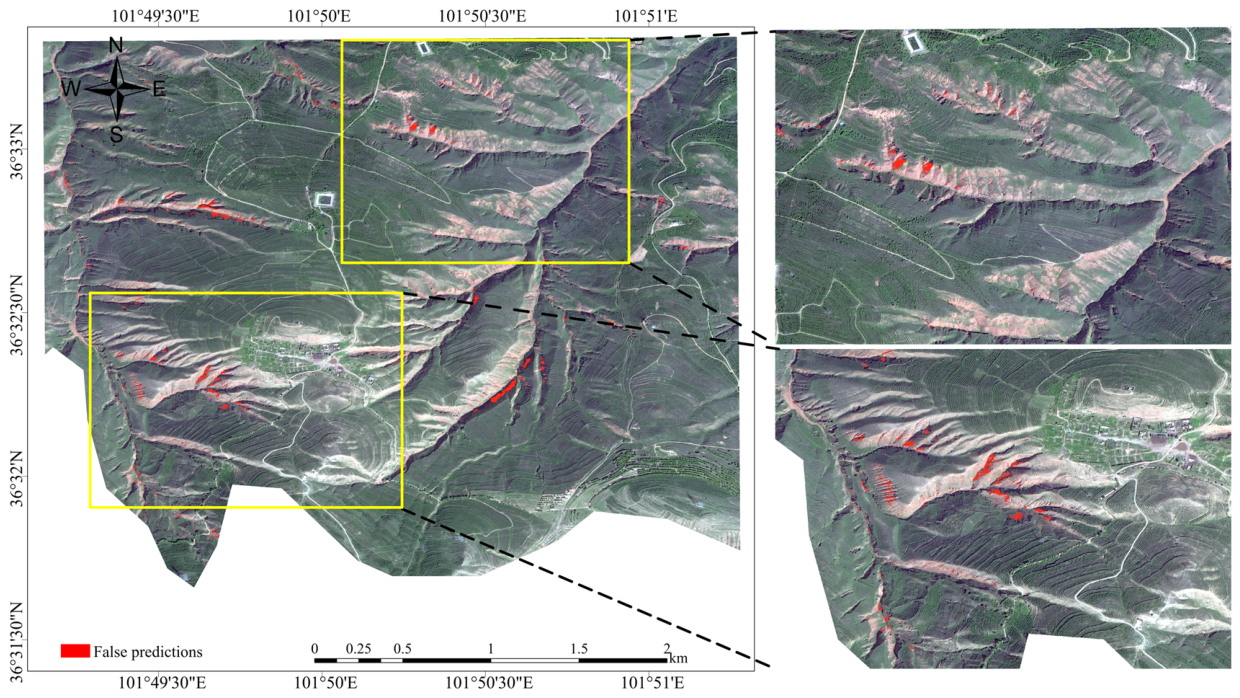
Although TM-Net showed the best overall IoU and F1 balance across the public and XBLD evaluations, several limitations remain. First, the performance gap between the fused public benchmark and XBLD indicates that domain shift and look-alike backgrounds remain substantial. In loess-dominated geomorphology, erosion gullies, terrace edges, engineering cut slopes, and naturally exposed bare soil can present spectral and textural signatures similar to landslide scars. Because TM-Net primarily relies on mono-temporal RGB appearance cues, these ambiguous surfaces can still generate false positives when explicit geomorphic or temporal constraints are unavailable.
Figure 13 illustrates a representative XBLD case of spectral confusion between landslide-affected surfaces and erosion features.
The fused public benchmark and XBLD also play different experimental roles. The public benchmark retains the original annotations of Bijie, GVLM, and SCLM, so its label semantics are heterogeneous across regions, image sources, landslide types, and publication-specific annotation practices. It is therefore used to evaluate robustness under heterogeneous cross-region conditions, not as a fully harmonized geological inventory standard. XBLD, by contrast, represents landslide-affected land surfaces that can be reliably interpreted from high-resolution imagery under the unified rules used in this study.
XBLD intentionally retains small, fragmented, shadow-affected, and urban–rural transition cases, so it is not a simple dataset. However, extremely ambiguous objects for which landslides could not be reliably distinguished from engineering disturbance or bare soil were excluded. The labels were generated through manual visual interpretation based on GF-2 imagery, UAV photographs, and Google Earth 3D imagery; however, a formal inter-interpreter consistency assessment was not conducted. This choice improves supervised label reliability but may underestimate the true recognition difficulty under the most ambiguous real-world conditions. Future work should incorporate inter-interpreter consistency assessment, more ambiguous boundary samples, multi-temporal optical imagery, DEM-derived terrain attributes, InSAR deformation products, and systematic field verification.
Second, the current framework is optimized for single-date optical segmentation. As a result, it cannot directly characterize landslide evolution, and it may fail to capture subtle, slow-moving, or dormant instabilities that lack clear optical expression. Future work will integrate multimodal information, such as DEM-derived terrain attributes and InSAR deformation products, to provide geometric and kinematic constraints for separating spectrally similar classes. The model will also be extended to time-series settings to enable change-aware mapping and life-cycle monitoring of landslide activity.
Third, the current model was evaluated mainly on small- and medium-sized landslides at a fixed spatial resolution. Its transferability to substantially different resolutions, large composite landslides, and extremely small-sample settings remains to be tested. Future studies should examine multi-resolution transfer learning, introduce object- or scene-level constraints for large landslide complexes, and test few-shot or semi-supervised learning strategies for regions with limited labeled data.