Article

InSAR-Derived Spatiotemporal Evolution of Land Subsidence and Its Response to Groundwater Overexploitation in Hainan, China

1
Key Laboratory of the Ministry of Education Land Subsidence Mechanism and Prevention, Capital Normal University, Beijing 100048, China
2
China Institute of Geo-Environmental Monitoring, Beijing 100081, China
3
Beijing Institute of Geo-Environment Monitoring, Beijing 100195, China
*
Authors to whom correspondence should be addressed.
Land 2026, 15(7), 1272; https://doi.org/10.3390/land15071272
Submission received: 3 July 2026 / Accepted: 13 July 2026 / Published: 15 July 2026

Abstract

Land subsidence is one of the most critical geological hazards in Hainan Province, primarily driven by groundwater overexploitation. This study integrates regional-scale SBAS-InSAR deformation results with groundwater observations from nine representative monitoring wells to investigate the spatiotemporal evolution of land subsidence and its groundwater-related response mechanisms in Hainan Province. Sentinel-1A imagery from 2019 to 2023 was used to derive LOS deformation time series, which were converted into vertical land subsidence using local incidence-angle correction under the assumption of negligible horizontal displacement. Seasonal and Trend decomposition using Loess (STL), Pearson correlation analysis, dynamic time warping (DTW), and lag correlation analysis were applied to separate multiscale signals and examine groundwater–subsidence responses in representative hydrogeological settings. The results indicate that (1) land subsidence in Hainan Province is mainly concentrated in coastal plains, with Haikou, Wenchang, and Danzhou identified as the main subsidence centers, where local annual subsidence rates exceed −50 mm/yr; (2) representative well-based analysis shows that groundwater-level decline is closely synchronized with cumulative subsidence in major subsidence-sensitive areas, with DTW distances consistently below 10, indicating high temporal consistency; long-term groundwater depletion is an important driver of cumulative subsidence in these representative areas; (3) lag correlation analysis reveals spatially heterogeneous lag responses of 1–6 months between groundwater-level fluctuations and land subsidence, with lag time and phase relationship closely related to aquifer structure, low-permeability layer distribution, and groundwater extraction intensity. This study provides a scientific basis for land subsidence mitigation and sustainable groundwater management in tropical island regions.

1. Introduction

Land subsidence is a gradual geological hazard driven by the combined effects of natural processes and anthropogenic activities, and it is widely distributed in coastal regions and areas with intensive groundwater extraction worldwide [1]. With rapid urbanization, excessive groundwater exploitation and the resulting land subsidence have become increasingly pronounced. These hazards not only induce ground fissures and structural deformation, but also exacerbate the risks of seawater intrusion and flooding, posing serious threats to regional ecological security and sustainable socio-economic development [2,3].
Unsustainable groundwater extraction induces plastic deformation within aquifer systems, which propagates to the land surface as subsidence. This response relationship is typically nonlinear and characterized by time-lag effects, with pronounced spatial heterogeneity across different regions [4,5,6]. The coupling mechanism is particularly complex in monsoon-influenced island environments, where precipitation recharge and groundwater dynamics exhibit strong temporal variability. Therefore, systematically elucidating the temporal correlation and lagged response between groundwater level variations and land subsidence is of critical importance for understanding the mechanisms of subsidence formation and supporting sustainable groundwater resource management.
Monitoring techniques for land subsidence have evolved from traditional discrete point-based observations to continuous spatial measurements. Conventional approaches mainly include leveling surveys, GNSS measurements, and stratigraphic marker observations. Although these methods provide high accuracy and reliability, they are constrained by limited spatial coverage, high operational costs, and insufficient spatiotemporal resolution, making them inadequate for regional-scale subsidence monitoring [7]. With the advancement of Interferometric Synthetic Aperture Radar (InSAR) technology, land subsidence monitoring has entered an era of large-scale, high-precision observation. Differential InSAR (D-InSAR) retrieves surface deformation through interferometric processing of dual-temporal SAR images; however, it is susceptible to temporal decorrelation, atmospheric delays, and orbital errors, which limit its performance in long-term time-series analysis [8,9]. To overcome these limitations, multi-temporal InSAR (MT-InSAR) techniques, including Permanent Scatterer InSAR (PS-InSAR) and Short Baseline Subset InSAR (SBAS-InSAR), have been developed. By constructing multi-temporal interferometric networks, these approaches effectively reduce spatiotemporal decorrelation and atmospheric noise, enabling the retrieval of high-precision, long-term deformation time series. They have been widely applied in urban subsidence monitoring and spatiotemporal evolution analysis.
Despite substantial progress in subsidence monitoring and mechanism analysis, several limitations remain. Most existing studies focus on typical subsidence-prone regions such as the Beijing–Tianjin–Hebei region, the Yangtze River Delta, and the Pearl River Delta, whereas systematic investigations in Hainan and other tropical island regions are relatively scarce. Moreover, many studies conduct correlation analyses directly on raw time series without separating long-term trends from seasonal variability, which may obscure the intrinsic relationship between groundwater levels and land subsidence [10]. In addition, although pronounced seasonal signals and lag effects are commonly observed between groundwater levels and subsidence, investigations of their coupling relationship at the seasonal scale remain limited, hindering a comprehensive understanding of subsidence mechanisms [11,12].
To address these gaps, this study focuses on Hainan Province, a typical tropical island region where groundwater dynamics and land subsidence are strongly influenced by monsoon climate, coastal geomorphology, and human activities. Regional-scale time-series deformation associated with land subsidence is retrieved using SBAS-InSAR, and groundwater-level observations from representative monitoring wells are integrated to investigate groundwater–subsidence response mechanisms in typical hydrogeological settings. A comprehensive analytical framework is established by combining multi-source time-series monitoring, multi-scale signal decomposition, and multi-dimensional response analysis. Specifically, the Seasonal and Trend decomposition using Loess (STL) method is employed to separate trend and seasonal components of both subsidence and groundwater-level time series. Pearson correlation analysis and dynamic time warping (DTW) are applied to characterize the cumulative response at the trend scale, while cross-lag analysis of the seasonal components is conducted to identify the response intensity, phase relationship, and lag time of subsidence relative to groundwater-level fluctuations. This study aims to improve the understanding of periodic groundwater–subsidence coupling mechanisms and their spatiotemporal differentiation in tropical island regions, and to provide scientific support for land subsidence interpretation, groundwater resource management, and geological hazard mitigation in Hainan Province.

2. Study Area and Data

2.1. Overview of the Study Area

Hainan Province is located in the southern coastal region of China and is characterized by a tropical monsoon climate. Surrounded by the sea, the region exhibits persistently warm and humid climatic conditions. In terms of topography, Hainan displays a typical geomorphological pattern of “high in the center and low along the periphery” [13]. The central region is dominated by mountainous and hilly terrains with relatively high elevations, where the lithology is primarily composed of karst formations and metamorphic rocks. This area is characterized by complex geological structures and abundant mineral resources [14]. In contrast, the coastal zones are extensively developed with alluvial and marine sedimentary landforms, generally associated with relatively weak geological conditions. In particular, low-lying coastal plains are widely underlain by thick soft soil deposits, high moisture content, and complex subsurface conditions.
As shown in Figure 1, the above geological and environmental features make Hainan highly vulnerable to land subsidence. In recent decades, with the intensification of agricultural irrigation and the rapid expansion of urbanization and infrastructure development, land subsidence in Hainan Province has become increasingly pronounced. Excessive groundwater extraction, coupled with unsustainable land use and development practices, has significantly accelerated the initiation and progression of subsidence. Furthermore, long-term coastline evolution has increased the exposure of low-lying coastal areas to sea-level rise. These impacts are especially evident in regions with complex geological and hydrogeological conditions, where the susceptibility to land subsidence is particularly high [15].

2.2. Data Sources

The primary remote sensing dataset used in this study consists of Sentinel-1A (S1A) synthetic aperture radar imagery acquired between 11 January 2019 and 28 December 2023, comprising a total of 131 scenes. The detailed sources and basic parameters of the S1A SAR imagery and the groundwater monitoring well data used in this study are summarized in Table 1. To remove topographic phase contributions during interferometric processing, the Shuttle Radar Topography Mission (SRTM) Digital Elevation Model (DEM) provided by the National Aeronautics and Space Administration (NASA) was employed, with a spatial resolution of 30 m. Considering that atmospheric phase delay is a major source of uncertainty in InSAR-based deformation measurements, Generic Atmospheric Correction Online Service for InSAR (GACOS) products were applied for atmospheric phase correction. This correction effectively mitigates errors caused by atmospheric turbulence and water vapor variability, thereby enhancing the accuracy and reliability of the retrieved surface deformation.
Groundwater level data were obtained from long-term monitoring wells operated under the National Groundwater Monitoring Project. Although more groundwater monitoring wells are available in Hainan Province, nine representative monitoring wells (W1–W9) were selected for the coupled groundwater–subsidence analysis based on data availability, temporal continuity, data quality, hydrogeological representativeness, and the availability of coherent InSAR pixels around the well locations. The selected wells have monitoring periods consistent with the Sentinel-1A observation period and monthly sampling intervals, and they cover typical hydrogeological units and major subsidence-sensitive areas within the study region. These groundwater data were systematically collected, quality-controlled, and released by the National Groundwater Monitoring Network. Following rigorous data screening, invalid observations, including outliers and missing records, were excluded. The resulting dataset exhibits high temporal continuity and reliability, providing robust support for characterizing groundwater-level dynamics at representative monitoring sites. Therefore, the selected monitoring wells provide a reliable data foundation for analyzing the response relationship between groundwater variations and land subsidence and for identifying the spatial differences in groundwater–subsidence coupling processes in representative areas of Hainan Province.

3. Method

This study employs 131 Sentinel-1A IW-mode images acquired from January 2019 to December 2023 as the primary data source. Time-series InSAR surface deformation inversion is implemented using the SBAS-IPTA algorithm on the GAMMA software platform (version 20181201). The image acquired on 12 January 2021 is selected as the reference image for co-registration and interferometric processing, and 387 interferogram pairs are generated for multi-parameter interferometric analysis. The topographic phase is eliminated using the 30 m SRTM Digital Elevation Model (DEM). After phase unwrapping, baseline refinement, and atmospheric filtering, the Singular Value Decomposition (SVD) algorithm was adopted to estimate the LOS deformation time series. The LOS displacement was then converted into vertical land subsidence using local incidence-angle correction under the assumption that horizontal displacement is negligible compared with vertical deformation. A high-precision, long-term land subsidence dataset for Hainan Province is thereby obtained. Concurrently, the STL time-series decomposition method is applied to decompose the land subsidence time series and groundwater level time series from nine monitoring wells with a 12-month seasonal cycle, so as to separate the trend and seasonal components. Based on the trend components, Pearson correlation analysis and Dynamic Time Warping (DTW) analysis are conducted to reveal the cumulative response relationship between long-term groundwater level variations and land subsidence. Cross-lagged correlation analysis was performed on the seasonal components within a 1–6-month lag window to determine the optimal response lag time. This procedure quantitatively identifies the discrepancies in lag duration, response intensity and phase between land subsidence and seasonal groundwater level fluctuations across different hydrogeological units, and systematically elucidates the multiscale coupling mechanisms between land subsidence and groundwater dynamics.

3.1. SBAS-InSAR Time-Series Deformation Inversion and LOS-to-Vertical Conversion

The SBAS-InSAR technique was applied to process a total of N + 1 SAR images covering the study area [16]. One image was selected as the master image, and the remaining images were precisely co-registered with respect to the master image, with the co-registration error controlled within 0.1 pixels. After differential interferometric processing, M differential interferograms were generated. The number of interferometric pairs satisfies the following relationship [17]:
N + 1 2 M N N + 1 2
For two SAR images acquired at times t a and t b , where t b > t a , the i-th interferogram was generated after removing the flat-earth phase and topographic phase. For a pixel with azimuth coordinate x and range coordinate r, the differential interferometric phase can be expressed as:
Δ φ i x , r = φ t b , x , r φ t a , x , r = 4 π λ d LOS t b , x , r d LOS t a , x , r
where λ is the radar wavelength; d LOS t b , x , r and d LOS t a , x , r represent the cumulative displacement along the radar line of sight relative to the reference time t 0 and at times t b and t a , respectively. It should be noted that d LOS represents LOS displacement rather than pure vertical displacement.
The average phase change rate during the monitoring interval can be expressed as:
v i = φ t b , x , r φ t a , x , r t b t a
The interferometric phase can be further described as the cumulative relationship between the average deformation rate and the corresponding time interval:
j = a + 1 b t j t j 1 v j = δ φ i
The matrix form of the SBAS inversion can be written as:
A v = δ φ
where v is the vector of LOS deformation rates, δ φ is the observation vector composed of the differential interferometric phases from the M interferograms, and A is the M × N coefficient matrix. By constructing the coefficient matrix and phase observation vector, the deformation-rate vector can be solved. When M ≥ N, the rank of the coefficient matrix is N, and the LOS deformation rates are estimated using the least-squares method. When M < N, the system has multiple solutions, and singular value decomposition (SVD) is used to obtain the minimum-norm optimal solution. The cumulative LOS displacement for each acquisition time is then calculated through temporal integration.
Since InSAR measures displacement along the radar line of sight rather than directly in the vertical direction, a geometric conversion is required before interpreting the results as vertical land subsidence. In general, the LOS displacement can be expressed as a combination of vertical, east–west, and north–south displacement components:
d LOS = d v cos θ d e sin θ sin α + d n sin θ cos θ
where d v is the vertical displacement component, d e and d n are the east–west and north–south horizontal displacement components, respectively, θ is the radar incidence angle, and α is the satellite heading angle.
Because only single-view Sentinel-1A SAR observations were used in this study, the three-dimensional displacement field cannot be uniquely decomposed. Considering that groundwater-extraction-induced land subsidence is generally dominated by vertical compaction of aquifer systems, the horizontal displacement components were assumed to be negligible relative to the vertical component:
d e 0 ,     d n 0
Under this assumption, the LOS displacement can be approximated as:
d LOS d v cos θ
Accordingly, the vertical displacement was calculated using the incidence-angle correction:
d v = d LOS cos θ
where the local incidence angle of each Sentinel-1A pixel was used for the conversion. After conversion, negative vertical displacement values represent land subsidence, whereas positive values indicate uplift or elastic rebound. In this study, the term “vertical land subsidence” refers to the approximate vertical displacement derived from LOS displacement under the assumption of negligible horizontal motion. Because horizontal deformation cannot be fully separated using a single viewing geometry, the derived vertical displacement may contain uncertainty associated with the neglected horizontal components. The SBAS-InSAR inversion and LOS-to-vertical conversion together provide the vertical deformation time series required for the subsequent spatial characterization, well-based time-series extraction, and groundwater–subsidence response analysis.

3.2. STL Time Series Decomposition Method

Seasonal and Trend decomposition using Loess (STL) is a time-series decomposition method based on Locally Weighted Regression (LOESS), which decomposes the original series into trend, seasonal and residual components. The decomposition formula is given as [18]:
Y t = T t + S t + R t
where Y t is the original observation series; T t is the trend component reflecting the long-term tendency of the series; S t is the seasonal component reflecting periodic seasonal impacts; R t is the residual component reflecting random fluctuations. This method separates different components through iterative smoothing and exhibits advantages including strong robustness to outliers and good adaptability to non-stationary series. In this framework, the trend component is used to characterize long-term cumulative subsidence associated with persistent groundwater-level changes, whereas the seasonal component is used to examine periodic deformation responses and possible lag effects related to seasonal recharge and extraction.
In this study, before STL decomposition was applied, the land subsidence time series corresponding to each groundwater monitoring well was constructed from the SBAS-InSAR-derived vertical deformation results. Considering that groundwater-level observations are point-based measurements, whereas InSAR deformation results are spatially distributed, a buffer-based spatial averaging method was used to match the two datasets. Specifically, a 500 m buffer was generated around each monitoring well, and coherent InSAR pixels within the buffer were selected. Pixels with low coherence or obvious anomalous deformation values were excluded before averaging. The vertical deformation time series of the remaining pixels were then averaged to represent the land subsidence time series associated with the corresponding well. Because the groundwater-level observations were recorded at monthly intervals, whereas Sentinel-1A InSAR deformation measurements were acquired at approximately 12-day revisit intervals and corresponded to specific satellite acquisition dates, the two datasets were further matched to a common monthly time scale before STL decomposition. Monthly deformation values were generated from the InSAR-derived vertical deformation observations within each month, so as to ensure temporal consistency with the groundwater-level records. This buffer-based extraction and monthly temporal matching strategy reduces the influence of single-pixel noise and minimizes the spatial and temporal mismatch between point-based groundwater observations and spatially distributed InSAR deformation measurements.
The extracted land subsidence time series and the corresponding monthly groundwater-level records were then temporally aligned and preprocessed. Because the groundwater-level observations have a monthly sampling interval, the seasonal period for STL decomposition was set to 12 months. Subsequently, STL decomposition was performed on both the land subsidence and groundwater-level time series at each monitoring well, with emphasis on extracting the trend and seasonal components for subsequent analysis. The trend component was used to characterize long-term variations in land subsidence and groundwater levels, reflecting cumulative effects associated with continuous groundwater extraction or recharge. The seasonal component was used to characterize periodic fluctuations mainly controlled by seasonal factors such as precipitation recharge and groundwater exploitation. Through this decomposition, signals at different time scales were effectively separated, providing reliable data support for the subsequent analysis of the groundwater–subsidence response relationship and lag effects [19].

3.3. Methods for Analyzing the Land Subsidence–Groundwater Response Relationship

Based on the STL decomposition results, response characteristic analysis is implemented from two dimensions (trend component and seasonal component) to quantitatively reveal the land subsidence–groundwater level response relationship across different time scales.

3.3.1. Long-Term Trend Response Analysis Based on DTW

At the long-term time scale, the trend component series derived from STL decomposition is selected. Initially, the Pearson correlation coefficient is used to conduct a preliminary assessment of the linear correlation between land subsidence and groundwater levels [20]. Furthermore, the Dynamic Time Warping (DTW) algorithm is introduced to perform similarity analysis on the trend component series. DTW achieves optimal matching between distinct time-series datasets via non-linear stretching and compression of the time axis, effectively overcoming the limitation of traditional correlation analysis in handling temporal asynchrony [21].
Let the ground subsidence trend series be g t and the groundwater level trend series be h m . The recursive formulation of the cumulative distance in DTW is presented in Equation (11):
U t , m = d g t , h m + min U t 1 , m 1 , U t 1 , m , U t , m 1
where d g t , h m represents the distance between the two sequences at corresponding time points (typically using Euclidean distance), and U(t,m) denotes the minimum cumulative distance from the starting point (1,1) to the current node (t,m).
The objective of the DTW algorithm is to find the optimal path that minimizes the cumulative distance, and the final distance value characterizes the overall evolutionary similarity between the two series. By evaluating the consistency between long-term land subsidence and groundwater level variations using the DTW distance, and combining the offset features of the optimal matching path, the lagged response relationship between land subsidence and groundwater level changes is analyzed.

3.3.2. Analysis of Seasonal Cyclic Responses Based on Lagged Correlation

On the seasonal variation scale, the seasonal component series obtained from STL decomposition is selected, and a lag correlation analysis method is employed to investigate the response relationship between the periodic fluctuations of the two [22]. By time-shifting the seasonal groundwater level series, the correlation coefficients with the seasonal ground subsidence series are calculated for different lag lengths, using the following formula:
r k = t S d t S d ¯ S w t k S w ¯ t S d t S d ¯ 2 t S w t k S w ¯ 2
where S d t and S w t represent the seasonal components of ground subsidence and groundwater level, respectively; S d ¯ and S w ¯ denote their mean values; k is the lag time; and r(k) is the correlation coefficient under the corresponding lag condition.
Correlation coefficients for different lag lengths were calculated within the 1–6-month lag window. The optimal lag time was defined as the lag corresponding to the maximum absolute correlation coefficient, and the signed correlation coefficient at this lag was retained to indicate the phase relationship between groundwater-level fluctuations and land subsidence. A positive coefficient indicates that the two seasonal components vary in phase after lag correction, whereas a negative coefficient indicates an anti-phase relationship. Therefore, the magnitude of the coefficient reflects the strength of the seasonal coupling, while its sign reflects the phase relationship between the two variables. Furthermore, by comparing the periodic features and the timing of peaks and troughs in the seasonal components of both variables, and analyzing their phase differences and amplitude variations, the driving mechanisms of groundwater fluctuations on the elastic response of land subsidence are further revealed. Through comprehensive analysis of the trend and seasonal components, the response characteristics of land subsidence to groundwater dynamic changes can be systematically characterized from two perspectives: long-term cumulative effects and short-term cyclic responses [23].

4. Results and Discussion

4.1. Analysis of Spatiotemporal Characteristics of Land Subsidence

4.1.1. Spatial Distribution Characteristics of Ground Subsidence in Hainan Province

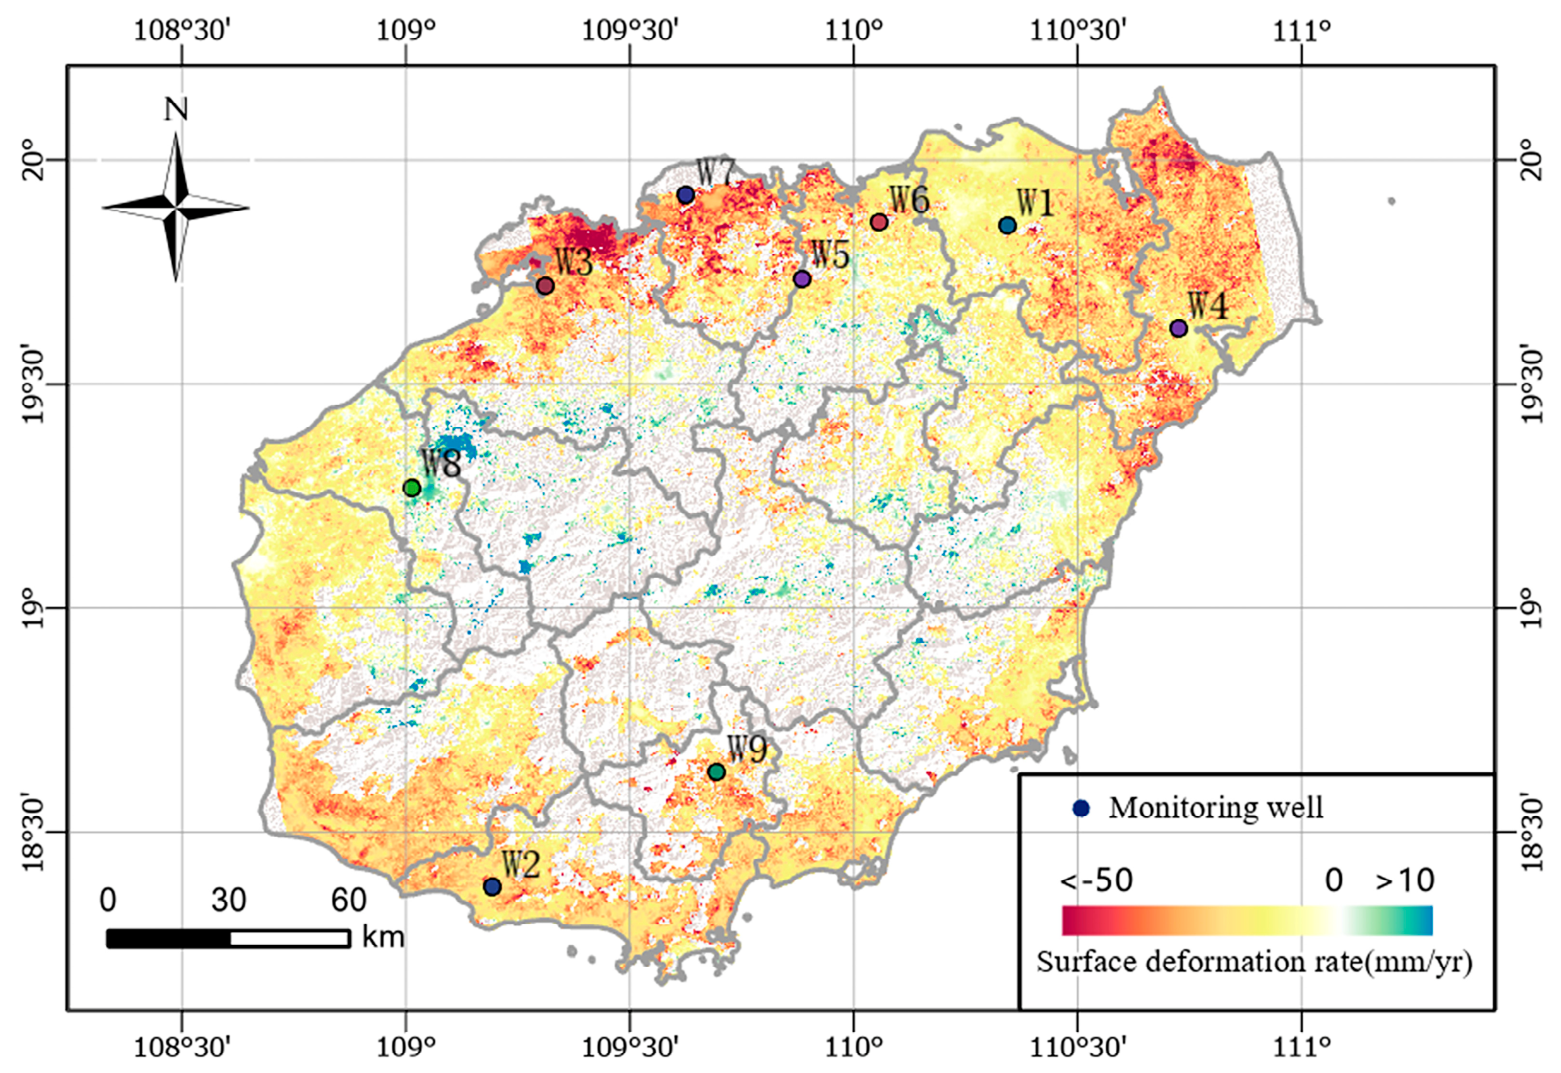
The deformation results shown in Figure 2 are vertical deformation rates converted from Sentinel-1A LOS displacement using local incidence-angle correction under the assumption of negligible horizontal displacement. The results are expressed in mm/yr, where positive values indicate surface uplift and negative values denote land subsidence. The locations of the selected representative groundwater monitoring wells are also indicated.
Overall, the central part of the study area is dominated by exposed bedrock and hilly terrain, with relatively thin Quaternary unconsolidated deposits. No significant subsidence is observed in most of these areas, and the average annual deformation rates range from −10 to 10 mm/yr, indicating a generally stable condition. In contrast, subsidence is predominantly concentrated in coastal plains characterized by flat topography and extensively developed Quaternary unconsolidated sediments [24,25]. These areas spatially coincide with regions undergoing intensive urban expansion and agricultural development. The distribution of severe subsidence is spatially heterogeneous. Initially isolated subsidence patches have progressively expanded and coalesced into large, contiguous subsidence zones. Several prominent subsidence centers can be identified, mainly located in coastal and near-coastal plains, including Danzhou, Haikou, and Wenchang. As illustrated in Figure 2, the southeastern part of Haikou and the Wenchang area exhibit the most extensive subsidence coverage and the highest deformation intensity, with local average annual subsidence rates exceeding −50 mm/yr. The concentration of subsidence in coastal plains is consistent with the general mechanism of groundwater-extraction-induced land subsidence reported in previous studies. In areas underlain by thick unconsolidated sediments, groundwater withdrawal can reduce pore-water pressure and increase effective stress, leading to aquifer-system compaction and surface subsidence [26]. Similar subsidence patterns have been widely observed in coastal plains, deltas, and urbanizing regions where compressible sediments and intensive groundwater exploitation coexist [27]. Therefore, the spatial coincidence between severe subsidence zones and coastal plains in Hainan suggests that local hydrogeological conditions and anthropogenic groundwater demand jointly contribute to the development of land subsidence [28].
In summary, land subsidence in Hainan Province during 2019–2023 exhibits a clear spatial pattern, with pronounced subsidence concentrated in coastal plains and adjacent urbanized areas, while the central mountainous region remains relatively stable over the study period. The relative stability of the central mountainous region can be attributed to the dominance of exposed bedrock and thin unconsolidated deposits, which limit the development of compressible aquifer layers. This contrast further indicates that the spatial pattern of land subsidence in Hainan is closely controlled by geomorphology, sedimentary conditions, and groundwater exploitation intensity [29].

4.1.2. Temporal Evolution Characteristics of Land Subsidence in Hainan Province

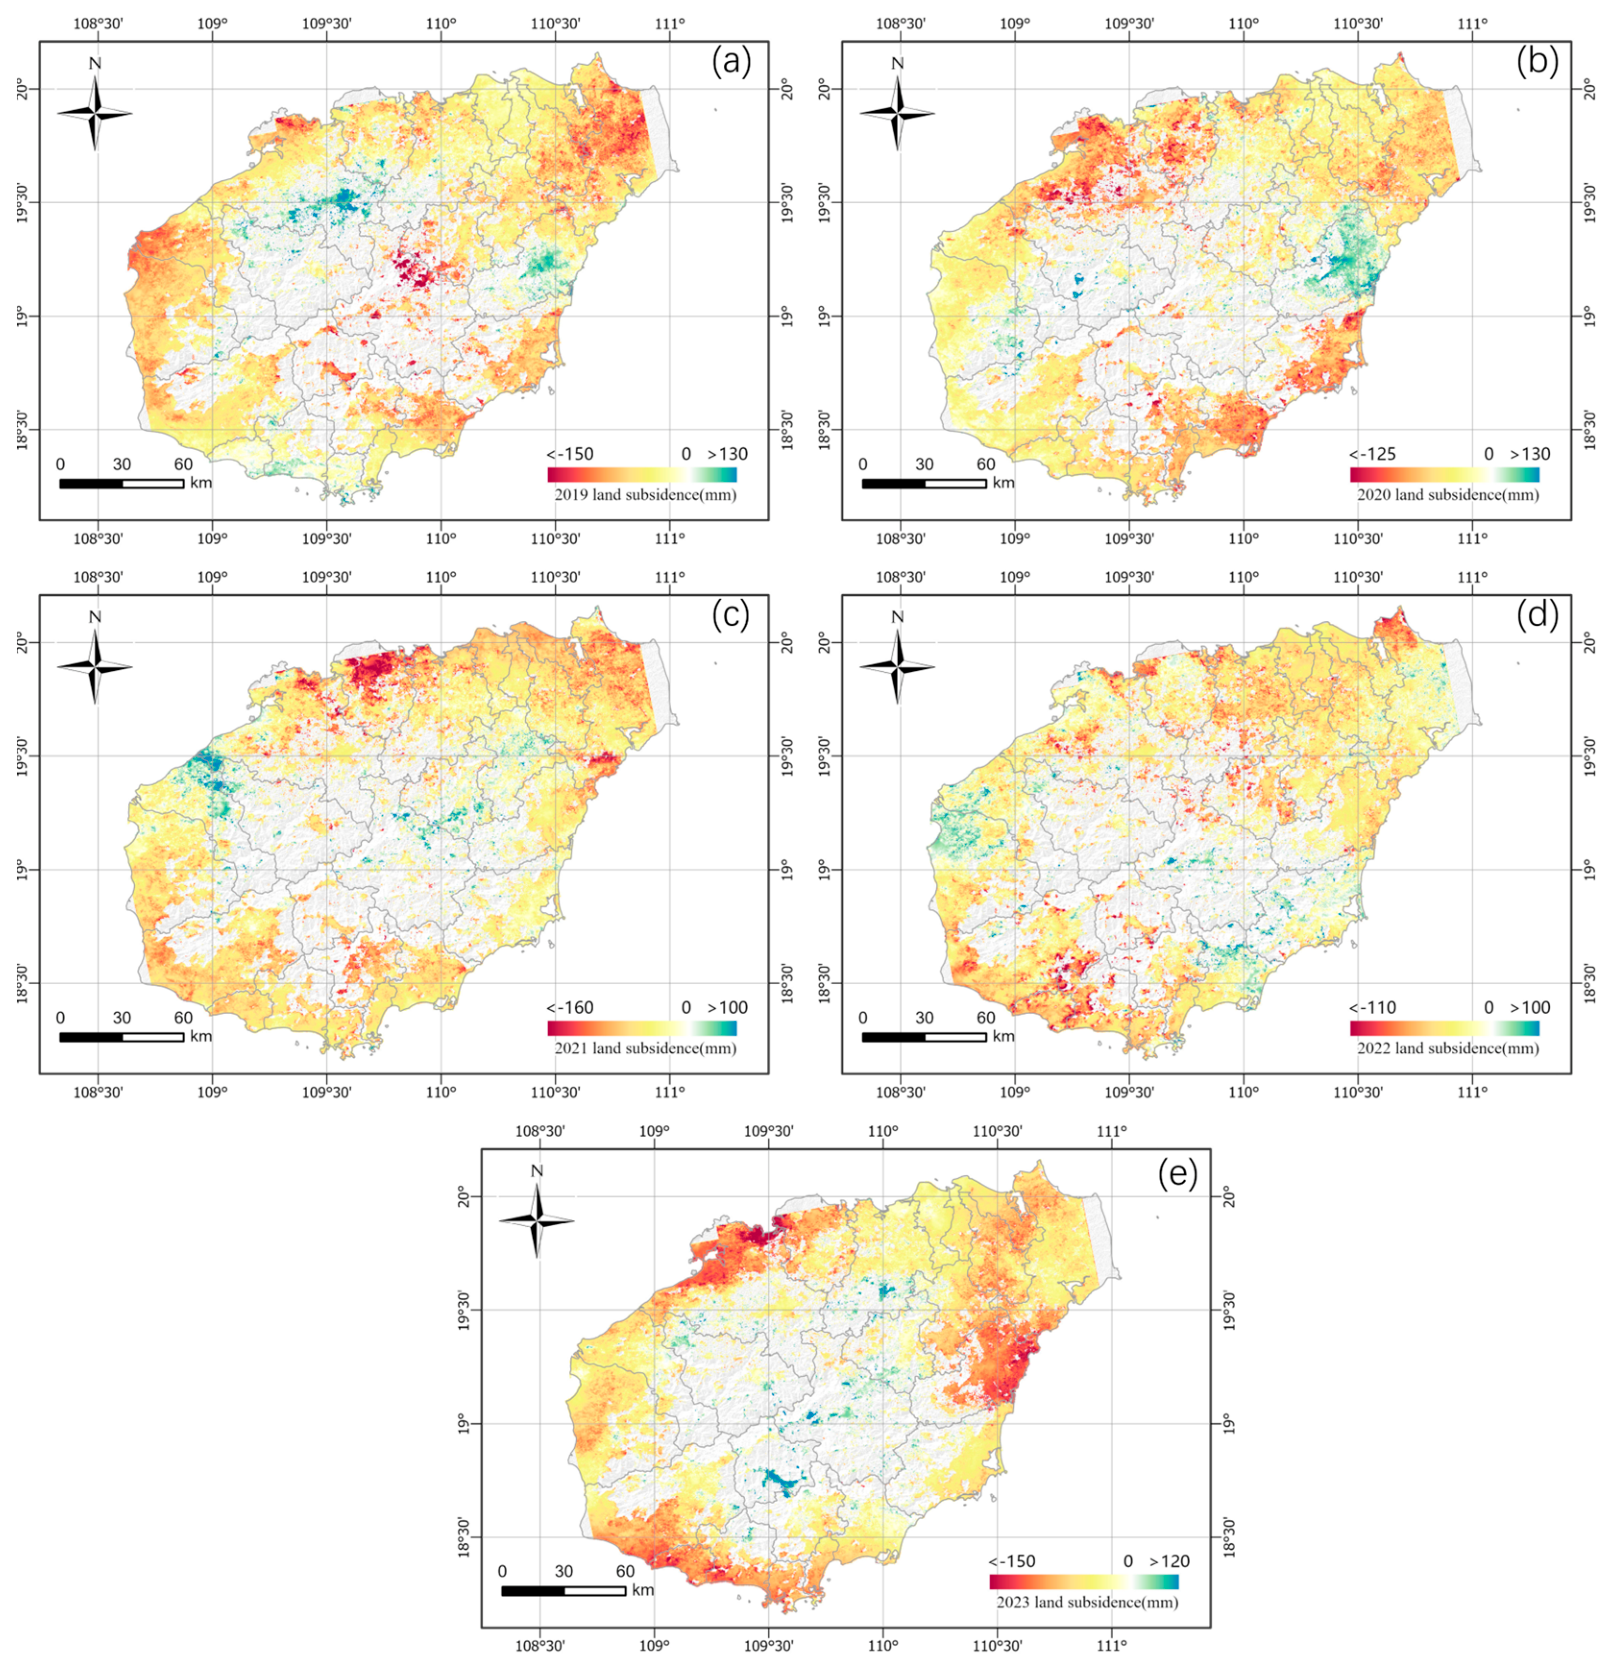
Based on the LOS-derived vertical land subsidence results converted using local incidence-angle correction from 2019 to 2023 (Figure 3), surface deformation in the study area exhibits pronounced spatial heterogeneity, characterized by relative stability in the central mountainous regions and significant subsidence in coastal plains and peri-urban areas. Overall, most regions of Hainan Province remain stable over the long term, with only minor fluctuations in the deformation time series and no evident persistent cumulative subsidence. In contrast, typical subsidence-prone areas—particularly Danzhou, Lingao, Chengmai, and Wenchang—show a clear and continuous downward trend in the deformation time series, indicating progressive cumulative subsidence.
In terms of temporal evolution, surface deformation patterns were relatively complex in 2019. Notable subsidence occurred in northern Danzhou, the vicinity of Haikou, and the eastern coastal area of Wenchang, where local cumulative subsidence reached approximately −150 mm. By comparison, the central mountainous regions, dominated by exposed bedrock, exhibited stable conditions, with deformation rates generally ranging from 0 to 10 mm/yr.
During 2020–2021, possibly influenced by changes in regional hydrological conditions and groundwater extraction regimes, surface deformation displayed a pattern of expanding spatial extent and variable intensity. In 2020, subsidence zones gradually extended outward, with increased spatial continuity. The subsidence area along the Danzhou coast expanded markedly, with maximum cumulative subsidence remaining in the range of −150 to −120 mm. By 2021, deformation in major coastal subsidence centers, particularly in Danzhou, intensified further, accompanied by a substantial increase in the extent of high-magnitude subsidence zones. The outward expansion and coalescence of subsidence zones during 2020–2021 may reflect the cumulative nature of aquifer-system compaction under sustained groundwater extraction [27]. Because compaction of fine-grained sediments and low-permeability layers is often delayed relative to groundwater-level decline, subsidence centers may continue to expand even when short-term hydrological conditions fluctuate [30]. This behavior has also been reported in other groundwater-extraction-induced subsidence regions, where long-term hydraulic head decline produces persistent and spatially expanding deformation.
After 2021, surface deformation in Hainan Province exhibited characteristics of reduced subsidence intensity and spatial reorganization. In 2022, the overall subsidence magnitude decreased slightly, and the extent of high-subsidence zones contracted, with subsidence in most coastal counties stabilizing within −100 mm. Monitoring results for 2023 indicate that subsidence centers became more concentrated in densely populated urban areas. The northern coastal area of Danzhou, the western coastal zone of Haikou, and the eastern suburbs of Wenchang remained the primary subsidence regions, where deformation centers persisted and cumulative subsidence effects were particularly pronounced.
In addition, localized deformation processes exhibit nonlinear behavior, including short-term rebound events during certain periods. Time-series observations from several subsidence zones reveal fluctuations in deformation rates, suggesting that land subsidence is jointly controlled by multiple factors, including anthropogenic influences (e.g., groundwater extraction and engineering activities) and external drivers (e.g., climatic variability). The observed short-term rebound and nonlinear deformation behavior may be related to the elastic response of aquifer systems to seasonal groundwater recharge, whereas the persistent cumulative subsidence reflects irreversible compaction of compressible sediments under long-term groundwater depletion [31]. Such coexistence of elastic rebound and inelastic compaction has been widely reported in groundwater-related subsidence studies. In tropical island environments, strong seasonal precipitation may further modulate groundwater levels and induce short-term deformation fluctuations superimposed on the long-term subsidence trend [32].

4.2. STL-Based Time-Series Signal Decomposition for Land Subsidence and Groundwater Levels

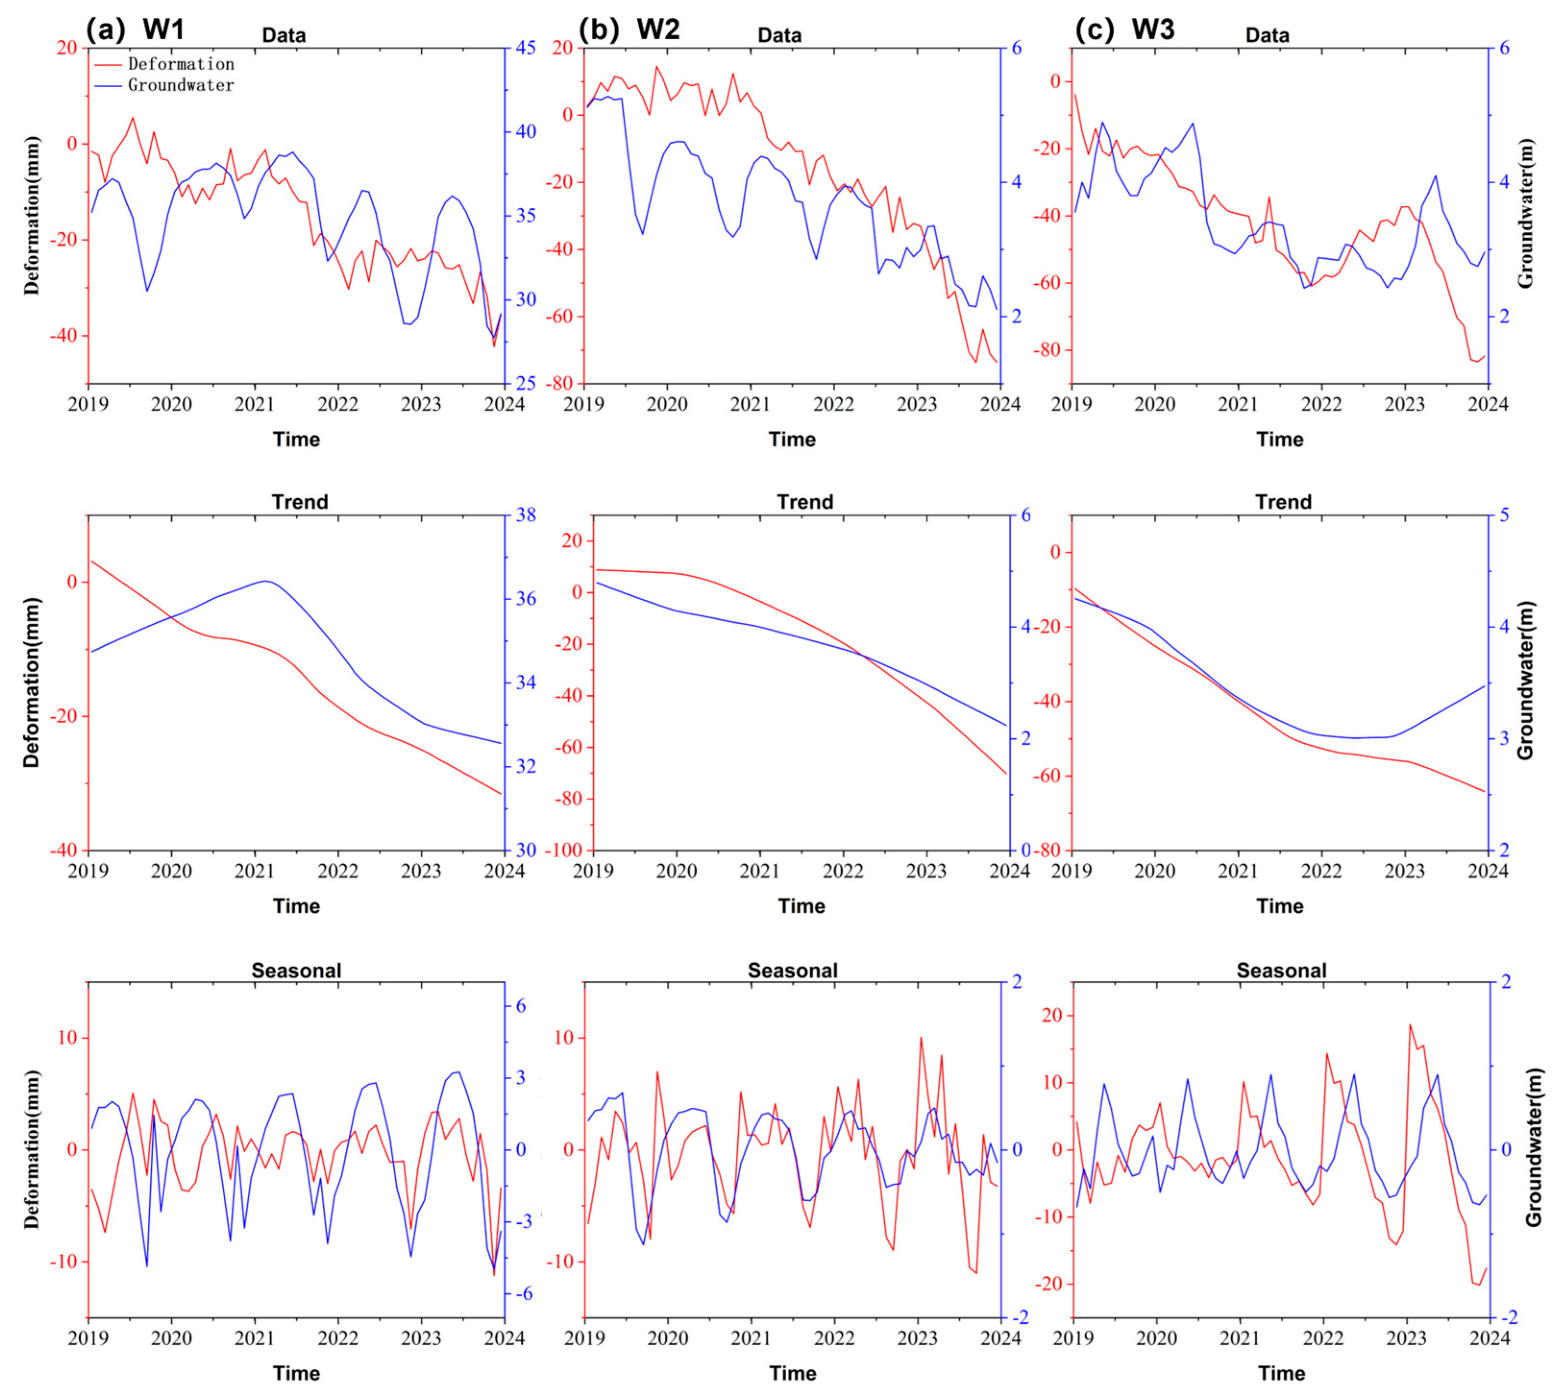
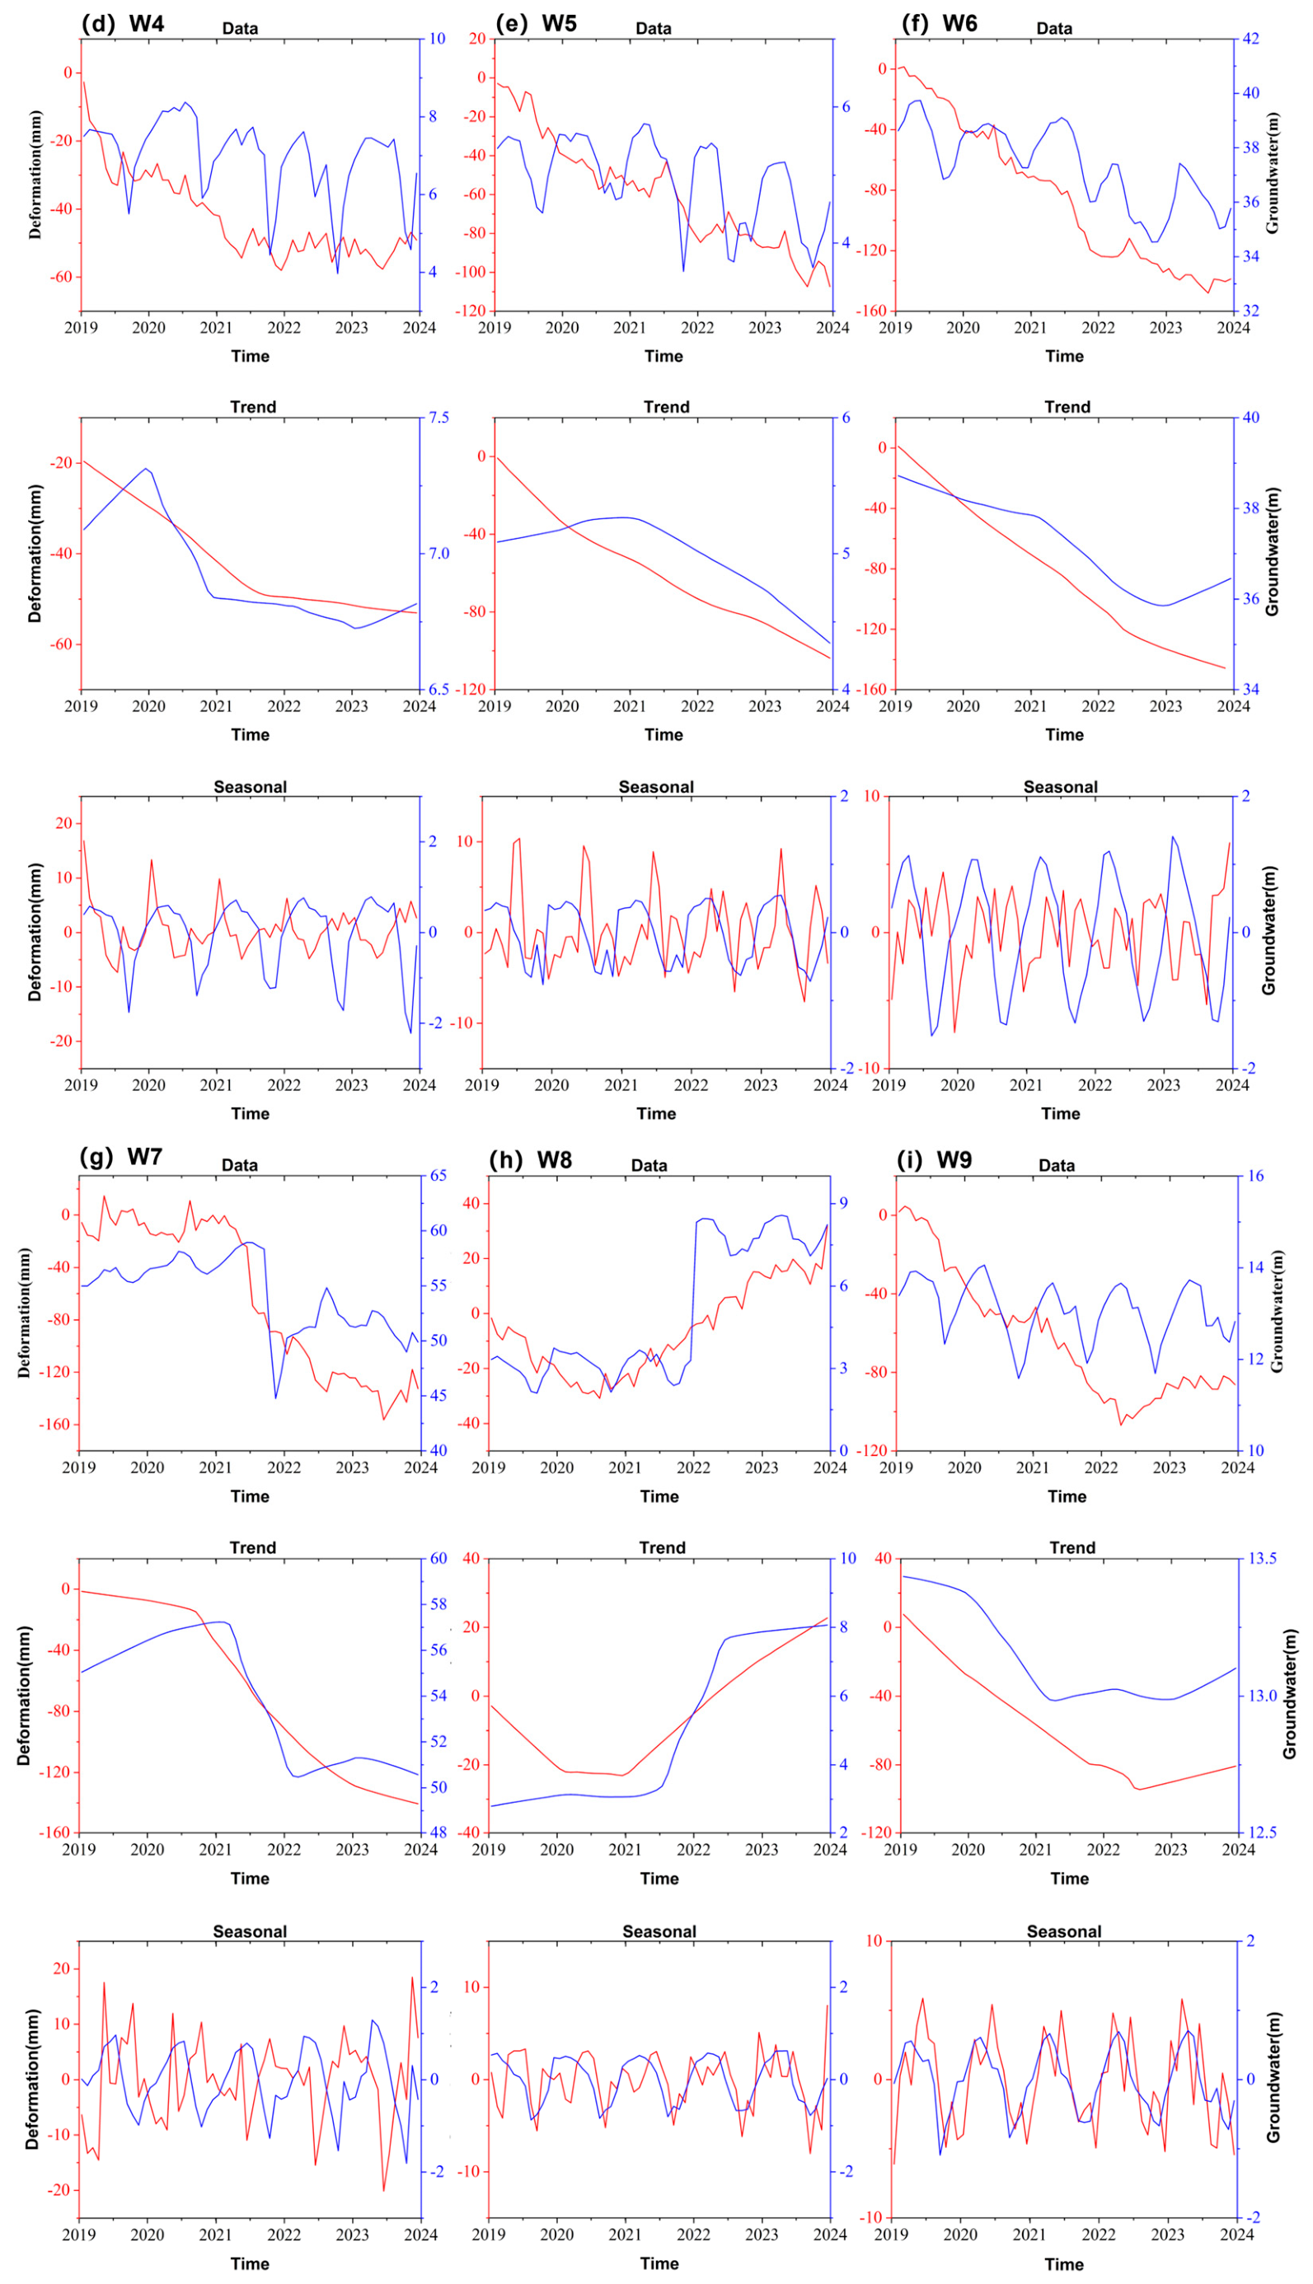
To characterize the multi-timescale variability of land subsidence and groundwater-level dynamics at representative monitoring sites, nine groundwater monitoring wells (W1–W9) covering typical hydrogeological units and major subsidence-sensitive areas were selected. Based on the InSAR-derived deformation time series extracted around each well and the corresponding groundwater-level observations from 2019 to 2023, the Seasonal and Trend decomposition using Loess (STL) method was applied to decompose each series into three components: the original series, the trend component, and the seasonal component. The decomposition results are presented in Figure 4a–i.
Analysis of the original time series indicates an overall correlation between land subsidence and groundwater levels at each monitoring well; however, notable spatial variability is observed. At most monitoring wells (e.g., W2, W4, and W6), groundwater levels exhibit a persistent declining trend, accompanied by progressively increasing subsidence, reflecting a typical response pattern of “groundwater decline–accelerated subsidence”. In contrast, several wells (e.g., W3 and W7) display phased fluctuations or abrupt variations, suggesting that these areas are influenced not only by groundwater extraction but also by precipitation recharge and localized anthropogenic disturbances. At a limited number of monitoring points (e.g., W8), groundwater levels show a recovery trend during the later stage of the study period, corresponding to a marked reduction in subsidence rates or even localized rebound. This behavior indicates that groundwater recovery can exert a mitigating effect on surface deformation. Overall, the superposition of long-term trends and short-term fluctuations in the original time series results in a complex relationship between the two variables, highlighting the necessity of time-series decomposition. This finding is consistent with previous studies showing that groundwater-related land subsidence usually contains both long-term cumulative deformation and short-term seasonal fluctuations. Direct correlation analysis based on raw time series may mix these signals and obscure the underlying groundwater–subsidence relationship. Therefore, separating the trend and seasonal components is necessary for distinguishing cumulative compaction from seasonal elastic responses [33].
The trend component analysis reveals a relatively stable relationship between groundwater levels and land subsidence at the long-term scale. At most monitoring points, groundwater levels exhibit a continuous decline, corresponding to the progressive development of subsidence (e.g., W2, W5, and W6), indicating that sustained groundwater depletion is an important factor controlling cumulative subsidence at these representative monitoring sites. The long-term correspondence between groundwater-level decline and cumulative subsidence can be explained by the increase in effective stress caused by groundwater withdrawal. When groundwater levels decline, pore-water pressure decreases and compressible aquifer-system sediments undergo gradual compaction, resulting in progressive land subsidence [34]. Similar long-term groundwater–subsidence relationships have been reported in many groundwater-extraction-induced subsidence regions, indicating that persistent groundwater depletion is a key factor controlling cumulative deformation in compressible sedimentary settings. In contrast, at several monitoring points (e.g., W1 and W3), groundwater levels remain relatively stable and subsidence rates are comparatively low, suggesting more stable hydrogeological conditions. At other locations (e.g., W8 and W9), groundwater levels show a recovery trend in the later stage of the study period, accompanied by a deceleration in subsidence or slight surface uplift, indicating a partial elastic or delayed response of the strata to groundwater recharge. The deceleration of subsidence or slight uplift following groundwater-level recovery suggests that part of the aquifer-system deformation is elastic or delayed elastic. However, long-term subsidence caused by compaction of fine-grained sediments may be partly irreversible. Therefore, the observed deformation reflects the combined effects of elastic rebound related to short-term groundwater recovery and inelastic compaction associated with long-term groundwater depletion [35]. In addition, the magnitude of trend variations differs significantly among monitoring points, reflecting strong spatial heterogeneity in subsidence development across the study area. Overall, the trend component demonstrates a clear long-term correspondence between groundwater-level decline and cumulative land subsidence.
The seasonal component further elucidates the periodic characteristics of both groundwater levels and land subsidence. All monitoring points exhibit relatively stable annual cycles with a period of approximately 12 months. Seasonal groundwater level variations are generally smooth and primarily controlled by precipitation recharge, typically showing an increase during the rainy season and a decline during the dry season. In tropical monsoon regions, seasonal precipitation recharge can cause periodic groundwater-level fluctuations, which further modulate aquifer-system deformation. During recharge periods, groundwater-level rise may reduce effective stress and induce elastic rebound or slow down subsidence, whereas groundwater-level decline during dry or intensive extraction periods may enhance compaction. This seasonal modulation explains why the subsidence time series contains cyclic signals superimposed on the long-term deformation trend [36]. In comparison, seasonal subsidence patterns are more complex. Nevertheless, at most monitoring points, subsidence exhibits a consistent relationship with groundwater fluctuations: deformation slows or even shows elastic rebound during periods of groundwater level rise, and intensifies during periods of groundwater decline. At certain monitoring wells (e.g., W6 and W9), the amplitude of seasonal variations is relatively large, indicating higher sensitivity to recharge processes or extraction intensity. Additionally, subsidence responses at some locations exhibit a temporal lag relative to groundwater variations, reflecting delayed consolidation and rebound processes within subsurface materials [37].

4.3. Response of Land Subsidence to Groundwater Time-Series Components

4.3.1. Trend Component Variation Characteristics and Correlation Analysis

The long-term trend component reflects the overall evolutionary behavior of land subsidence and groundwater levels at the selected monitoring wells. As shown in Figure 4, the trend components at each monitoring station exhibit a generally high degree of consistency, although localized discrepancies in their temporal evolution are evident.
To quantitatively evaluate the similarity between the two trend series, the dynamic time warping (DTW) algorithm was employed to identify the optimal alignment path between them. A smaller DTW distance indicates greater similarity. The results show that DTW distances for all nine monitoring wells are below 10, suggesting a high level of consistency in the long-term evolution of land subsidence and groundwater levels at the selected representative sites. In conjunction with the Pearson correlation coefficients (Table 2), a clear relationship is observed: stations with smaller DTW distances tend to exhibit higher correlation coefficients, indicating stronger synchronization between the two series. For example, the DTW distances at W2, W6, and W9 are all below 2, with corresponding correlation coefficients exceeding 0.94, demonstrating a near-synchronous relationship between subsidence and groundwater variations at these locations. In contrast, stations such as W1 and W7 exhibit relatively larger DTW distances and lower correlation coefficients, indicating a certain degree of temporal mismatch in their long-term evolution, which is likely related to differences in local hydrogeological conditions. The use of DTW complements Pearson correlation analysis because groundwater-level variations and land subsidence may not evolve synchronously at all times. DTW allows local stretching and compression of the time axis and can therefore capture similarity between two time series even when phase shifts or delayed responses exist [21].
From a temporal perspective, the trend components of land subsidence at all monitoring stations show continuously accumulated subsidence throughout 2019–2023, with no evident reversal, indicating strong persistence in the subsidence process. In comparison, groundwater level trends exhibit phased behavior: a relatively rapid decline during the early period (2019–2021), followed by a deceleration during the later period (2022–2023), with stabilization observed at some locations, although the overall trend remains downward. The persistence of cumulative subsidence despite the deceleration of groundwater-level decline suggests that aquifer-system compaction may continue after hydraulic head changes slow down. This delayed response is commonly associated with slow drainage and consolidation of fine-grained or low-permeability layers [38].
Overall, the consistently low DTW distances across the selected monitoring wells provide quantitative evidence of strong coupling between land subsidence and long-term groundwater-level variations at representative sites. These results not only corroborate the high degree of agreement observed in Figure 4 but also further confirm that long-term groundwater depletion is an important factor controlling the evolution of land subsidence at the selected representative monitoring sites. This interpretation is consistent with the established mechanism that groundwater-level decline reduces pore-water pressure, increases effective stress, and promotes compaction of compressible aquifer-system sediments [39].

4.3.2. Seasonal Component Periodic Characteristics and Lagged Correlation Analysis

Based on the STL time-series decomposition results, the seasonal components of both surface deformation and groundwater-level series were extracted, and lagged correlation analysis was conducted to characterize their response relationship at the annual cycle scale. Lagged correlation coefficients were calculated within the 1–6-month lag window, and Table 3 summarizes the optimal lag time and the corresponding signed correlation coefficient for each monitoring well. The optimal lag time was defined as the lag corresponding to the maximum absolute correlation coefficient within the predefined lag window, and the signed coefficient at this lag was retained to indicate whether the seasonal components of land subsidence and groundwater level were in phase or anti-phase after lag correction.
By integrating the spatial distribution of annual average deformation rates with the locations of the selected monitoring wells, it is evident that the response relationship between surface deformation and groundwater levels exhibits pronounced spatial heterogeneity among representative sites. Moreover, the spatial pattern of the lagged response is generally consistent with the regional distribution of land subsidence.
The seasonal components of both deformation and groundwater levels at the selected monitoring sites exhibit significant annual cyclic fluctuations. Overall, they are jointly controlled by seasonal driving factors such as precipitation recharge and groundwater exploitation intensity. However, marked differences exist in the correlation strength and phase relationship between the two variables. The signed correlation coefficient should therefore be interpreted from two aspects: its absolute value reflects the strength of seasonal coupling, whereas its sign reflects the phase relationship between groundwater-level fluctuations and vertical deformation. Therefore, the sign of the lagged correlation coefficient should be interpreted as an indicator of the seasonal phase relationship rather than as a simple measure of whether groundwater variations control subsidence. The separation of seasonal components is therefore essential for identifying short-term groundwater–subsidence responses that may be masked by long-term cumulative trends. In groundwater-related subsidence systems, seasonal recharge and extraction can induce elastic or delayed deformation signals superimposed on irreversible long-term compaction. The lagged correlation analysis of seasonal components provides a more targeted way to evaluate these short-term response processes [40].
The coexistence of positive and negative signed correlation coefficients indicates that the seasonal groundwater–subsidence response differs among the selected monitoring wells. Positive coefficients indicate an in-phase relationship between groundwater-level fluctuations and vertical deformation after lag correction. Under the sign convention used in this study, positive vertical deformation represents uplift or elastic rebound, whereas negative values represent subsidence. Therefore, positive correlations generally suggest that groundwater-level rise is accompanied by reduced subsidence or elastic rebound, while groundwater-level decline is associated with enhanced subsidence. This behavior reflects a relatively direct elastic response of the aquifer system to seasonal groundwater-level changes, especially at wells with short lag times such as W8 and W9 [41].
In contrast, negative coefficients indicate an anti-phase relationship between groundwater-level fluctuations and vertical deformation after lag correction. This does not imply that groundwater changes are unrelated to subsidence; rather, it suggests a more complex seasonal phase relationship. Such anti-phase behavior may be associated with delayed aquifer-system compaction and rebound, slow drainage of low-permeability layers, differences in recharge and extraction timing, or local hydrogeological conditions [42]. Therefore, the coexistence of positive and negative coefficients reflects spatial heterogeneity in aquifer structure, sediment compressibility, groundwater extraction intensity, and seasonal recharge processes among the selected monitoring wells. Consequently, both positive and negative coefficients are physically meaningful under different hydrogeological and seasonal forcing conditions.
Based on the optimal lag time and correlation characteristics summarized in Table 3, the monitoring sites can be classified into two typical response patterns. The first category is the medium-to-long lag response type, mainly including W1–W6, with optimal lag times concentrated between 3 and 6 months. These sites are generally associated with coastal plains and relatively severe subsidence areas, where thick unconsolidated sediments and low-permeability layers are more likely to develop. Such medium-to-long lag responses are consistent with consolidation processes, in which pore-pressure changes in fine-grained or low-permeability layers dissipate slowly, causing delayed compaction and surface deformation [38]. It should be noted that this group includes both negative and positive signed correlations, indicating that medium-to-long lag responses may occur under different seasonal phase relationships. The second category is the short-lag response type, comprising W7–W9, with an optimal lag time of approximately 1 month. These stations are mainly distributed in inland areas or regions with relatively weak subsidence, where aquifer structures are relatively stable and hydraulic connectivity is more favorable. As a result, groundwater-level changes can be transmitted more rapidly to surface deformation. Among them, W8 and W9 exhibit positive and relatively high correlation coefficients, suggesting a more direct elastic deformation response, whereas W7 shows a negative coefficient, indicating that local phase differences or hydrogeological conditions may still affect the seasonal response.
From a spatial distribution perspective, the deformation–groundwater response patterns vary significantly among the selected monitoring sites. In the central and inland peripheral zones, the aquifer structure is relatively stable, with thinner low-permeability layers or favorable permeability, and surface deformation generally responds rapidly to groundwater-level changes. In contrast, coastal plains and severe subsidence areas are characterized by gentle topography, thick Quaternary unconsolidated sediments, and the widespread development of multiple low-permeability layers. Long-term groundwater overexploitation has led to slow vertical drainage and delayed aquifer-system compaction, resulting in distinct lag characteristics in deformation responses.
Overall, the spatial variation in lag time and correlation sign among the selected monitoring sites is closely related to local geological conditions, sedimentary structures, aquifer–low-permeability layer assemblages, groundwater exploitation intensity, and seasonal recharge processes. Severe subsidence areas are predominantly concentrated in plain regions with well-developed unconsolidated sediments and intensive anthropogenic exploitation activities. Spatially, these areas gradually expand from local subsidence centers and develop into contiguous patches, further illustrating the complexity and spatial heterogeneity of groundwater–subsidence coupling processes. Similar spatially heterogeneous groundwater–subsidence responses have been reported in other coastal and deltaic regions, where variations in sediment thickness, aquifer architecture, groundwater extraction intensity, and recharge conditions jointly control deformation magnitude and response timing [22]. The results of this study therefore suggest that the groundwater–subsidence coupling in Hainan follows the general mechanism of aquifer-system compaction, while also exhibiting distinct tropical-island characteristics associated with monsoonal recharge and spatially variable hydrogeological settings [32].

4.4. Reliability and Uncertainty Discussion of SBAS-InSAR Results

Independent geodetic validation is important for evaluating the accuracy of InSAR-derived deformation results. However, no reliable contemporaneous leveling or GNSS observations covering the Sentinel-1A monitoring period from 2019 to 2023 were available for the study area. Therefore, direct validation using independent geodetic measurements could not be conducted in this study. Instead, a reliability and uncertainty discussion was provided to identify the main factors affecting the SBAS-InSAR-derived deformation results.
The uncertainty of the InSAR results mainly arises from reference point selection, residual atmospheric delay, phase unwrapping errors, orbital errors, temporal decorrelation, and the LOS-to-vertical conversion assumption [9,16]. In this study, the reference area was selected in the central mountainous region of Hainan Island. This region is dominated by exposed bedrock and relatively stable geomorphological conditions, is far from the main coastal subsidence centers, and contains relatively high-coherence pixels. No significant deformation was detected in this region during the monitoring period, making it suitable as a stable reference area for time-series deformation inversion. The reference area selection is also consistent with previous regional land subsidence monitoring experience, in which stable bedrock or mountainous areas are commonly used as reference zones for time-series InSAR analysis.
Atmospheric phase delay is another important source of uncertainty, especially in tropical island regions with strong water vapor variability. To reduce this effect, GACOS products were used for atmospheric phase correction [43]. Although residual atmospheric artifacts may remain for some acquisition dates, their influence on long-term deformation trends was reduced through time-series processing and multi-interferogram network inversion. In addition, low-coherence pixels and obvious anomalous deformation values were excluded to improve phase unwrapping reliability. Local uncertainties may still exist in coastal wetlands, vegetated areas, agricultural fields, and water-adjacent zones where temporal decorrelation is relatively strong.
Orbital errors were mitigated using precise orbit information and baseline refinement during interferometric processing. Residual orbital errors generally appear as long-wavelength spatial ramps and have limited influence on the identification of localized subsidence centers, although they may affect regional background deformation to some extent. Furthermore, because only single-view Sentinel-1A observations were used, the LOS displacement could not be decomposed into full three-dimensional displacement components [44]. The vertical deformation results were therefore derived under the assumption that horizontal motion is negligible compared with vertical compaction. This assumption is reasonable for groundwater-extraction-induced land subsidence, which is generally dominated by vertical consolidation of aquifer systems, but it may introduce additional uncertainty in areas where horizontal motion exists.
Although groundwater-level observations cannot replace independent leveling or GNSS validation, the temporal consistency between groundwater-level variations and InSAR-derived subsidence at the selected monitoring wells supports the physical plausibility of the deformation results. In particular, areas with long-term groundwater-level decline generally correspond to cumulative subsidence development, while groundwater-level recovery is associated with reduced subsidence rates or localized rebound at some monitoring sites. This consistency indicates that the InSAR-derived deformation results capture the main subsidence response related to groundwater dynamics.
Overall, although independent leveling or GNSS observations are not available for the 2019–2023 monitoring period, the uncertainty assessment based on reference point selection, atmospheric correction, coherence-based pixel screening, orbital error mitigation, LOS-to-vertical conversion considerations, and hydrogeological consistency supports the reliability of the SBAS-InSAR-derived deformation results for regional-scale land subsidence analysis in Hainan Province. Future work should incorporate independent geodetic observations, when available, to further validate and refine the InSAR-derived subsidence results.

5. Conclusions

Utilizing SBAS-InSAR-derived time-series deformation data and national groundwater monitoring well records, this study applied STL time-series decomposition, Pearson correlation analysis, dynamic time warping (DTW), and lagged correlation analysis to investigate the spatiotemporal evolution of land subsidence and the multiscale groundwater–subsidence response patterns in Hainan Province. This work improves the understanding of groundwater-related land subsidence mechanisms in tropical island environments and provides a scientific basis for regional groundwater resource management and geological hazard prevention and mitigation. The main conclusions are as follows:
(1)
Land subsidence in Hainan Province exhibits pronounced spatiotemporal heterogeneity, characterized by relatively stable central regions and concentrated coastal subsidence. From 2019 to 2023, subsidence was mainly distributed in coastal plain areas, including Haikou, Wenchang, and Danzhou, where multiple subsidence centers developed, with local average annual subsidence rates exceeding −50 mm/yr. The central mountainous region, dominated by bedrock landforms, shows no significant subsidence, and overall deformation remains stable.
(2)
At the selected representative monitoring wells, groundwater levels and land subsidence show strong consistency in their long-term trends. The trend components extracted via STL decomposition indicate that groundwater-level decline is closely synchronized with cumulative subsidence development. DTW distances for all selected monitoring wells are below 10, and Pearson correlation coefficients reach up to 0.98 or higher, indicating that groundwater depletion is an important factor controlling cumulative subsidence at the selected representative monitoring sites.
(3)
At the seasonal scale, land subsidence at the selected monitoring wells responds to groundwater-level fluctuations with a lag of 1–6 months, exhibiting significant spatial variability in both lag time and phase relationship. Coastal monitoring sites located in severe subsidence areas are characterized by medium- to long-lag responses of 3–6 months, whereas inland and low-subsidence monitoring sites are dominated by short-lag responses of approximately 1 month. These differences are closely related to aquifer structure, the distribution of low-permeability layers, groundwater extraction intensity, and seasonal recharge conditions.
(4)
The groundwater–subsidence response at representative monitoring sites is jointly controlled by long-term trends and seasonal variations. Long-term groundwater decline plays an important role in cumulative subsidence, while seasonal precipitation recharge and periodic groundwater extraction contribute to cyclic fluctuations in deformation. Soil consolidation and rebound processes exhibit evident time-lag effects. In some areas, subsidence decelerates or even shows slight rebound following groundwater-level recovery, reflecting both elastic and inelastic deformation behavior of the aquifer system.
(5)
The spatial heterogeneity of hydrogeological conditions strongly influences subsidence response patterns at the selected monitoring sites. In coastal plains, thick unconsolidated sediments and well-developed low-permeability layers result in slow groundwater flow and delayed deformation responses. In contrast, inland areas with relatively stable aquifer structures exhibit more rapid and sensitive deformation responses to groundwater-level variations. Collectively, these factors help explain the spatial variability of land subsidence response time lags in representative areas of Hainan Province.

Author Contributions

Conceptualization, H.W. and J.Y.; methodology, J.Y.; software, H.W., J.Y. and S.Z.; validation, H.W.; formal analysis, Z.C.; investigation, Z.C. and S.Z.; resources, B.C.; data curation, H.W.; writing—original draft preparation, J.Y. and Z.C.; writing—review and editing, K.L. and D.L.; visualization, J.Y. and Z.C.; supervision, B.C.; project administration, H.G.; funding acquisition, B.C. and H.G. All authors have read and agreed to the published version of the manuscript.

Funding

This research was funded by the National Natural Science Foundation of China (grant numbers 42371089, 42371081, and 42201081), the Beijing Outstanding Young Scientist Program (grant number BJJWZYJH01201910028032), and the Henan Provincial Land Subsidence Monitoring Network Construction Project (grant number 2311-410000-04-01-341516). The APC was funded by the authors.

Data Availability Statement

The data that support the findings of this study are available from the corresponding author upon reasonable request.

Conflicts of Interest

The authors declare no conflicts of interest.

References

  1. Galloway, D.L.; Burbey, T.J. Regional land subsidence accompanying groundwater extraction. Hydrogeol. J. 2011, 19, 1459–1486. [Google Scholar] [CrossRef] [Scilit]
  2. Herrera-García, G.; Ezquerro, P.; Tomás, R.; Béjar-Pizarro, M.; López-Vinielles, J.; Rossi, M.; Mateos, R.M.; Carreón-Freyre, D.; Lambert, J.; Teatini, P. Mapping the global threat of land subsidence. Science 2021, 371, 34–36. [Google Scholar] [CrossRef] [Scilit] [PubMed]
  3. Lin, Z.; Huili, G.; Xiaojuan, L.; Chaofan, Z.; Miao, Y.; Haigang, W.; Ke, Z.; Miaomiao, H. Research progress and prospect of land subsidence. Hydrogeol. Eng. Geol. 2024, 51, 167–177. [Google Scholar]
  4. An, Y.; Shen, Q.; Shum, C.; Gao, F.; Zhang, X.; Jiang, L.; Wang, H. TS-InSAR assessment of groundwater overexploitation-land subsidence linkage: Hengshui case study. J. Hydrol. Reg. Stud. 2025, 60, 102489. [Google Scholar]
  5. Zhang, R.; Wang, T.; Liu, G.; Shama, A.; Liu, A.; Wang, X.; Deng, L.; Mao, W. Ground subsidence evolution and groundwater variation in the middle route of south to north water diversion project. Sci. Rep. 2025, 15, 19220. [Google Scholar] [CrossRef] [Scilit] [PubMed]
  6. Meng, D.; Chen, B.; Gong, H.; Zhang, S.; Ma, R.; Zhou, C.; Lei, K.; Xu, L.; Wang, X. Land subsidence and rebound response to groundwater recovery in the Beijing Plain: A new hydrological perspective. J. Hydrol. Reg. Stud. 2025, 57, 102127. [Google Scholar] [CrossRef] [Scilit]
  7. Li, F.; Liu, G.; Gong, H.; Chen, B.; Zhou, C. Assessing land subsidence-inducing factors in the Shandong Province, China, by using PS-InSAR measurements. Remote Sens. 2022, 14, 2875. [Google Scholar] [CrossRef] [Scilit]
  8. Zebker, H.; Villasenor, J. Decorrelation in interferometric radar echoes. IEEE Trans. Geosci. Remote Sens. 1992, 30, 950–959. [Google Scholar] [CrossRef] [Scilit]
  9. Hanssen, R.F. Radar Interferometry: Data Interpretation and Error Analysis; Springer: Cham, Switzerland, 2001. [Google Scholar]
  10. Patra, S.R.; Chu, H.-J.; Tatas. Employing machine learning to document trends and seasonality of groundwater-induced subsidence. Nat. Hazards 2025, 121, 5007–5031. [Google Scholar]
  11. Chaussard, E.; Wdowinski, S.; Cabral-Cano, E.; Amelung, F. Land subsidence in central Mexico detected by ALOS InSAR time-series. Remote Sens. Environ. 2014, 140, 94–106. [Google Scholar] [CrossRef] [Scilit]
  12. Tomás, R.; Li, Z.; Lopez-Sanchez, J.M.; Liu, P.; Singleton, A. Using wavelet tools to analyse seasonal variations from InSAR time-series data: A case study of the Huangtupo landslide. Landslides 2016, 13, 437–450. [Google Scholar]
  13. Dong, D.; Tao, B.; Zhang, T.; Huang, X.; Yuan, D.; Chen, F.; Zhang, P.; Zhao, X. Analyzing the Spatiotemporal Dynamics and Driving Mechanisms of Island Tourism: A Case Study of Hainan Island, China. Sustainability 2026, 18, 3498. [Google Scholar] [CrossRef] [Scilit]
  14. Zeng, D.; Solangi, K.A.; Solangi, F.; Song, X.; Anwar, M.; Liu, L.; Zhang, J.; Zhang, D. Spatial Assessment of Soil Properties and Soil Quality Dynamics (SFI and SQI) on Hainan Island Using Field Observations and Remote Sensing Data. Agriculture 2026, 16, 762. [Google Scholar] [CrossRef] [Scilit]
  15. Tay, C.; Lindsey, E.O.; Chin, S.T.; McCaughey, J.W.; Bekaert, D.; Nguyen, M.; Hua, H.; Manipon, G.; Karim, M.; Horton, B.P. Sea-level rise from land subsidence in major coastal cities. Nat. Sustain. 2022, 5, 1049–1057. [Google Scholar] [CrossRef] [Scilit]
  16. Berardino, P.; Fornaro, G.; Lanari, R.; Sansosti, E. A new algorithm for surface deformation monitoring based on small baseline differential SAR interferograms. IEEE Trans. Geosci. Remote Sens. 2003, 40, 2375–2383. [Google Scholar]
  17. Mora, O.; Mallorqui, J.J.; Broquetas, A. Linear and nonlinear terrain deformation maps from a reduced set of interferometric SAR images. IEEE Trans. Geosci. Remote Sens. 2003, 41, 2243–2253. [Google Scholar] [CrossRef] [Scilit]
  18. Cleveland, R.B.; Cleveland, W.S.; McRae, J.E.; Terpenning, I. STL: A seasonal-trend decomposition. J. Off. Stat. 1990, 6, 3–73. [Google Scholar]
  19. Zhu, Z.; Woodcock, C.E. Continuous change detection and classification of land cover using all available Landsat data. Remote Sens. Environ. 2014, 144, 152–171. [Google Scholar] [CrossRef] [Scilit]
  20. Torrence, C.; Compo, G.P. A practical guide to wavelet analysis. Bull. Am. Meteorol. Soc. 1998, 79, 61–78. [Google Scholar] [CrossRef] [Scilit]
  21. Berndt, D.J.; Clifford, J. Using dynamic time warping to find patterns in time series. In Proceedings of the 3rd International Conference on Knowledge Discovery and Data Mining, Seattle, WA, USA, 31 July–1 August 1994; pp. 359–370. [Google Scholar]
  22. Erban, L.E.; Gorelick, S.M.; Zebker, H.A. Groundwater extraction, land subsidence, and sea-level rise in the Mekong Delta, Vietnam. Environ. Res. Lett. 2014, 9, 084010. [Google Scholar] [CrossRef] [Scilit]
  23. Chaussard, E.; Amelung, F.; Abidin, H.; Hong, S.-H. Sinking cities in Indonesia: ALOS PALSAR detects rapid subsidence due to groundwater and gas extraction. Remote Sens. Environ. 2013, 128, 150–161. [Google Scholar] [CrossRef] [Scilit]
  24. Wang, Y.; Peter, M.I.; Zhu, D.; Zhang, Y.; Tang, W. Coastal plain evolution in southern Hainan Island, China. Chin. Sci. Bull. 2001, 46, 90–96. [Google Scholar] [CrossRef] [Scilit]
  25. Borówka, R.K.; Miluch, J.; Maciąg, Ł.; Osadczuk, A.; Jiang, T.; Chen, H.; Harff, J.; Tomczak, M.; Osadczuk, K.; Bloom, K. Late Quaternary evolution of lower course river sections and coastal plains in the southwestern Hainan Island, South China Sea. Quat. Int. 2026, 759, 110144. [Google Scholar] [CrossRef] [Scilit]
  26. Poland, J.F. Guidebook to Studies of Land Subsidence Due to Ground-Water Withdrawal; UNESCO: Chelsea, MI, USA, 1984. [Google Scholar]
  27. Shirzaei, M.; Freymueller, J.; Törnqvist, T.E.; Galloway, D.L.; Dura, T.; Minderhoud, P.S. Measuring, modelling and projecting coastal land subsidence. Nat. Rev. Earth Environ. 2021, 2, 40–58. [Google Scholar]
  28. Li, L.; Lianjie, F.; Lixin, P.; Shengzhang, Z.; Yongsheng, L.; Rixin, D.; Zhe, W. Groundwater resources and environmental geologic problems on Hainan Island. Geol. China 2022, 51, 499–510. [Google Scholar]
  29. Li, G.; Feng, G.; Xiong, Z.; Liu, Q.; Xie, R.; Zhu, X.; Luo, S.; Du, Y. Surface deformation evolution in the Pearl River Delta between 2006 and 2011 derived from the ALOS1/PALSAR images. Earth Planets Space 2020, 72, 179. [Google Scholar] [CrossRef] [Scilit]
  30. Galloway, D.L.; Hudnut, K.W.; Ingebritsen, S.; Phillips, S.P.; Peltzer, G.; Rogez, F.; Rosen, P. Detection of aquifer system compaction and land subsidence using interferometric synthetic aperture radar, Antelope Valley, Mojave Desert, California. Water Resour. Res. 1998, 34, 2573–2585. [Google Scholar] [CrossRef] [Scilit]
  31. Yang, J.; Cao, G.; Han, D.; Yuan, H.; Hu, Y.; Shi, P.; Chen, Y. Deformation of the aquifer system under groundwater level fluctuations and its implication for land subsidence control in the Tianjin coastal region. Environ. Monit. Assess. 2019, 191, 162. [Google Scholar] [CrossRef] [Scilit] [PubMed]
  32. Wang, D.; Zhang, L.; Pei, L.; Li, X.; Yang, Y.; Chen, Z.; Liang, L. Chemical characteristics and controlling factors of shallow groundwater in the lower reaches of Changhua River basin, Hainan Island, China. Water 2023, 15, 3508. [Google Scholar] [CrossRef] [Scilit]
  33. Xu, J.; Cao, Y.; Liu, J.; Hou, J.; Yan, W.; Yi, C.; Jia, G. SBAS-InSAR Quantifies Groundwater–Urban Construction Evolution Impacts on Tianjin’s Land Subsidence. Geosciences 2026, 16, 57. [Google Scholar] [CrossRef] [Scilit]
  34. Hoffmann, J.; Leake, S.A.; Galloway, D.L.; Wilson, A.M. MODFLOW-2000 Ground-Water Model-User Guide to the Subsidence and Aquifer-System Compaction (SUB) Package; 2331-1258; US Geological Survey: Reston, VA, USA, 2003.
  35. Cao, Y.; Wei, Y.-n.; Fan, W.; Peng, M.; Bao, L. Experimental study of land subsidence in response to groundwater withdrawal and recharge in Changping District of Beijing. PLoS ONE 2020, 15, e0232828. [Google Scholar] [CrossRef] [Scilit] [PubMed]
  36. Tang, W.; Zhao, X.; Bi, G.; Chen, M.; Cheng, S.; Liao, M.; Yu, W. Quantifying seasonal ground deformation in Taiyuan basin, China, by Sentinel-1 InSAR time series analysis. J. Hydrol. 2023, 622, 129654. [Google Scholar] [CrossRef] [Scilit]
  37. He, Q.; Liu, H.; Wei, L.; Ding, J.; Sun, H.; Zhang, Z. Monitoring the Time-Lagged Response of Land Subsidence to Groundwater Fluctuations via InSAR and Distributed Fiber-Optic Strain Sensing. Appl. Sci. 2025, 15, 7991. [Google Scholar] [CrossRef] [Scilit]
  38. Sneed, M.; Galloway, D.L. Aquifer-System Compaction and Land Subsidence: Measurements, Analyses, and Simulations: The Holly Site, Edwards Air Force Base, Antelope Valley, California; US Department of the Interior, US Geological Survey: Reston, VA, USA, 2000.
  39. Li, P.; Wu, J.; Zhou, W.; LaMoreaux, J.W. Land Subsidence and Groundwater Seepage. In Hazard Hydrogeology; Springer: Cham, Switzerland, 2023; pp. 45–74. [Google Scholar]
  40. Zhao, X.; Tang, W.; Hao, G.; Zhao, H.; Xiong, W. Characterizing aquifer properties in the Taiyuan Basin, Northern China, using ground deformation from Sentinel-1 InSAR time series analysis. J. Hydrol. Reg. Stud. 2025, 58, 102313. [Google Scholar] [CrossRef] [Scilit]
  41. Wang, X.; Luo, Z.; Li, Z.; Zhao, Q.; Dai, J. The impact of groundwater recharge on land subsidence: A case study from the Cangzhou test area, Hebei Province, China. Hydrogeol. J. 2023, 31, 813–825. [Google Scholar] [CrossRef] [Scilit]
  42. Zhang, Y.; He, G.; Wu, J.; Zhu, Z.; Yan, X.; Yang, T. Experimental study on mechanism for pumping-induced land subsidence. Proc. Int. Assoc. Hydrol. Sci. 2020, 382, 387–390. [Google Scholar] [CrossRef] [Scilit]
  43. Yu, C.; Li, Z.; Penna, N.T.; Crippa, P. Generic atmospheric correction model for interferometric synthetic aperture radar observations. J. Geophys. Res. Solid. Earth 2018, 123, 9202–9222. [Google Scholar] [CrossRef] [Scilit]
  44. Fuhrmann, T.; Garthwaite, M.C. Resolving three-dimensional surface motion with InSAR: Constraints from multi-geometry data fusion. Remote Sens. 2019, 11, 241. [Google Scholar] [CrossRef] [Scilit]
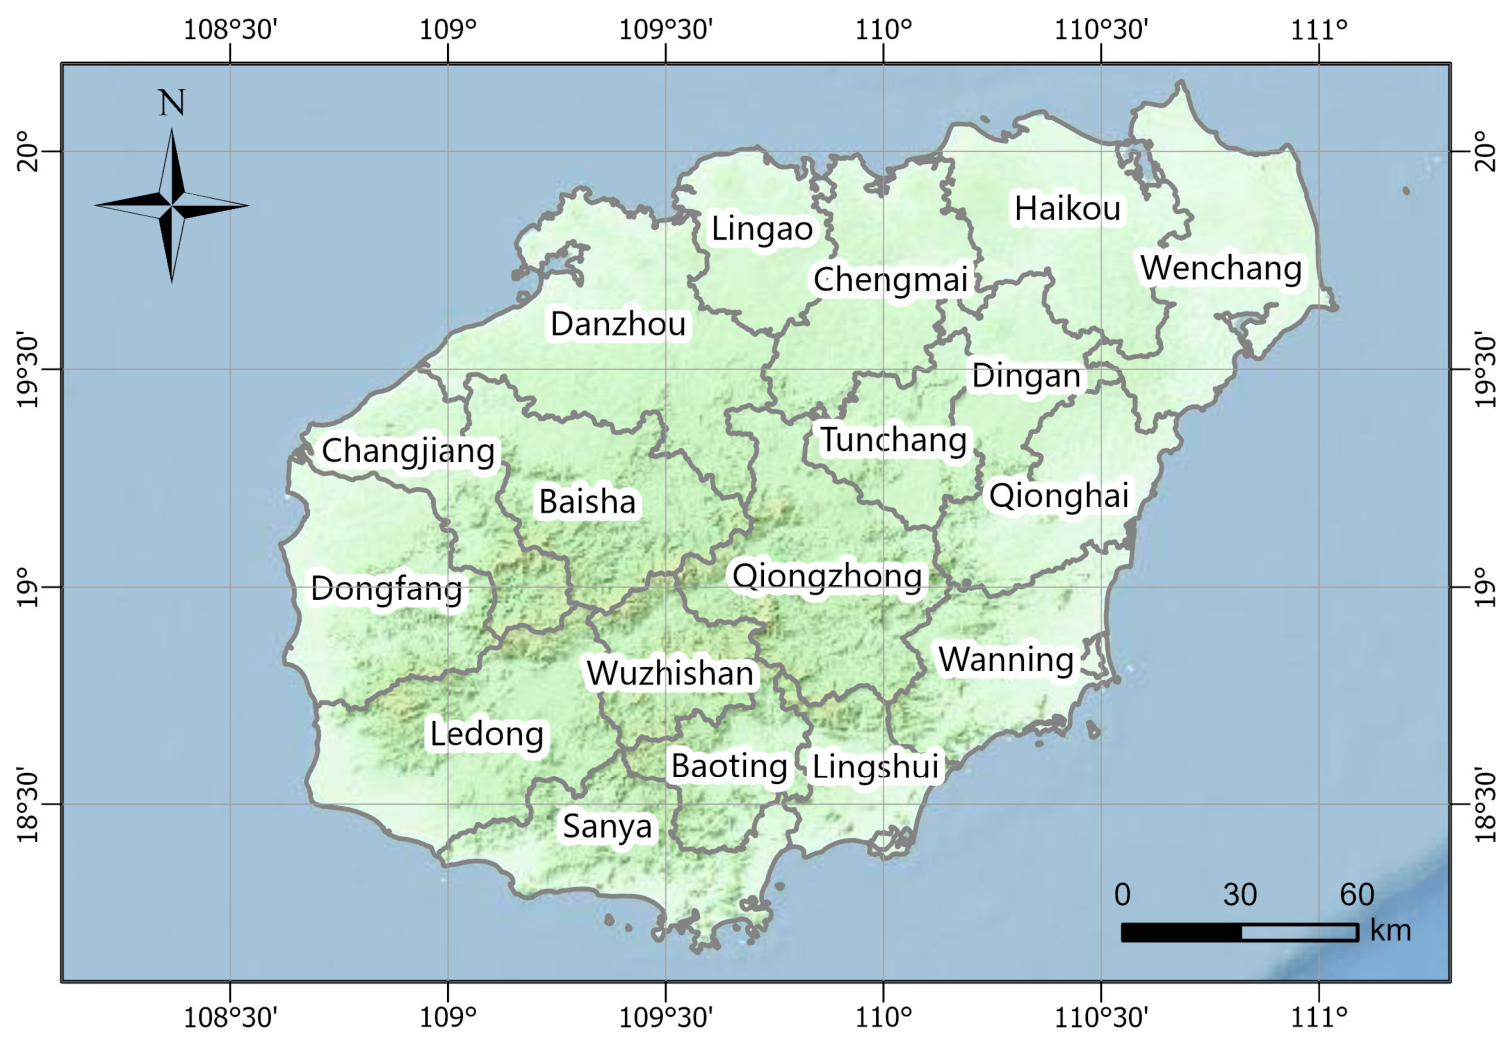
Figure 1. Overview map of the study area in Hainan Province, China. The map shows the boundary of the study area and the topographic characteristics of Hainan Island.
Land 15 01272 g001
Figure 2. Annual average vertical deformation rates in Hainan Province from 2019 to 2023. The LOS displacement was converted into vertical deformation using local incidence-angle correction under the assumption of negligible horizontal displacement. Negative values indicate land subsidence, whereas positive values indicate uplift.
Land 15 01272 g002
Figure 3. Temporal evolution of cumulative vertical deformation in Hainan Province from 2019 to 2023: (a) cumulative vertical deformation in 2019; (b) cumulative vertical deformation in 2020; (c) cumulative vertical deformation in 2021; (d) cumulative vertical deformation in 2022; and (e) cumulative vertical deformation in 2023. The deformation values were converted from Sentinel-1A LOS displacement into vertical displacement using local incidence-angle correction. Negative values represent land subsidence.
Land 15 01272 g003
Figure 4. STL decomposition results for land subsidence and groundwater-level time series at the selected monitoring wells. Subplots (ai) correspond to wells W1–W9, respectively. For each well, the three rows show the original series, trend component, and seasonal component, respectively.
Land 15 01272 g004aLand 15 01272 g004b
Table 1. Data Sources and Basic Parameters.
Data TypeSourceParameterInformation
SAR (Sentinel-1A)European Space Agency (ESA)Beam mode/WidthIW/250 km
PolarizationVV
Acquisition periodsJanuary 2019–December 2023
Number of scenes131
Monitoring wellChina Institute of Geo-Environment Monitoring (CIGEM)Number of monitoring wells9
Temporal resolutionMonthly
Acquisition periodsJanuary 2019–December 2023
Table 2. Pearson Correlation Coefficients and DTW Distances for Trend Components at Each Monitoring Well.
Well IDPearson rDTW Distance
W10.79344.652
W20.98820.4013
W30.90612.9695
W40.92723.1037
W50.76152.205
W60.96791.566
W70.91964.3751
W80.91853.8129
W90.94311.6102
Table 3. Optimal lag times and signed lagged correlation coefficients between the seasonal components of land subsidence and groundwater level at each monitoring well.
Well IDOptimal Lag (Months)Correlation r
W14−0.245
W26−0.409
W35−0.569
W44−0.412
W530.332
W640.334
W71−0.394
W810.47
W910.74
Disclaimer/Publisher’s Note: The statements, opinions and data contained in all publications are solely those of the individual author(s) and contributor(s) and not of MDPI and/or the editor(s). MDPI and/or the editor(s) disclaim responsibility for any injury to people or property resulting from any ideas, methods, instructions or products referred to in the content.