1. Introduction
The transition toward sustainable urban mobility stands as one of the defining governance challenges of the twenty-first century. Across Europe, cities are confronting a convergence of pressures of climate imperatives, ageing infrastructure, demographic change, and fiscal constraint that demand a fundamental rethinking of how people move through and access urban space. The 15-min city (15minC) concept has emerged as a prominent framework for rethinking the spatial organization of urban life in response to precisely these concerns [
1]. The model proposes that residents should be able to access six fundamental urban needs (i.e., living, working, provisioning, caring, learning, and enjoying) within a fifteen-minute walk or cycle from their homes [
2]. It represents a shift from the logic of urban planning toward the planning of urban life [
3], prioritizing neighbourhood-level interventions, human-scale environments, and the reduction in motorized travel, particularly in the most vulnerable areas and among the most disadvantaged populations.
This shift is especially relevant for metropolitan areas’ peripheries. They frequently combine high car dependency with inadequate public transport coverage, low-density spatial patterns that undermine the viability of active travel, and governance fragmentation that complicates coordinated intervention [
4]. At the same time, these conditions make suburban municipalities particularly resistant to the kinds of proximity-based strategies that have gained traction in denser, more centrally governed urban environments. Likewise, suburban areas are precisely where the social costs of mobility inequity are most acute. Residents who cannot drive or afford a vehicle (i.e., elderly people, young people, individuals with disabilities, and lower-income households) face a compounded disadvantage in which spatial distance, limited transport provision, and economic constraint mutually reinforce one another [
5,
6,
7]. Addressing these dynamics is not merely a technical planning problem; it is a question of social justice as well. Yet the dominant frameworks for sustainable mobility and proximity-based planning strategies have largely been developed in, and calibrated to, the conditions of dense, well-connected urban cores. Suburban and peripheral metropolitan territories, where the stakes are equally high and the structural obstacles far greater, have received comparatively little analytical attention.
Moreno, the creator of the 15minC concept, has likewise acknowledged the importance of considering a more flexible approach in contexts where car-centric planning has dominated (e.g., suburban areas characterized by urban sprawl). The need for context-specific planning and implementation policies leads to further developing the 15minC concept through the introduction of the 30-min territory [
1] or the X-minute city [
8,
9]. Even so, the transferability of the planning concept to the low-density, functionally dispersed, and socioeconomically heterogeneous conditions that characterize suburban peripheries remains theoretically underdeveloped and empirically underexplored [
10]. As stated, to advance towards sustainable and just transportation and spatial planning, one cannot only focus on large cities. Thus, in our understanding, this lack of research stems from the fact that it is significantly more difficult to transfer these concepts to such settings [
11].
A central yet insufficiently addressed dimension of this transferability from the core to the suburbs concerns spatial equity. Broadly defined as the fair distribution of urban resources, services, and opportunities across geographic space and social groups [
12,
13]. Spatial equity is a structural challenge in metropolitan areas shaped by dispersed development and socioeconomic residential sorting. In suburban contexts, inequity manifests not merely as uneven service distribution, but as a systemic condition in which the built environment itself constrains the mobility choices available to different population segments. When people cannot move freely and safely, their capacity to access job opportunities, education, and healthcare is diminished, producing what Lucas [
6] terms transport-related social exclusion, through which limited accessibility reinforces and deepens broader patterns of social disadvantage. Improving the urban environment to ensure that healthier choices are available to the whole population [
14], therefore, requires approaches that foreground mobility justice: dismantling the systemic, socioeconomic, and cultural barriers that prevent marginalized communities from safe and dignified movement [
15].
Accessibility, understood as the ease with which individuals can reach valued destinations within acceptable thresholds of time, cost, and effort, is simultaneously a function of land-use configuration, transport network performance, and individual socioeconomic capacity [
16]. Equivalent infrastructure can therefore produce profoundly unequal accessibility outcomes depending on residential location, car ownership, physical ability, and financial resources [
17,
18]. In low-density metropolitan peripheries, these dynamics are compounded by the legacy of speculative suburban expansion. Particularly in Southern European metropolitan areas, suburban development since the 1980s has frequently been driven by housing market pressures and infrastructure-lagged population growth rather than planned, transit-oriented urbanization [
19,
20], producing what amounts to a dual metropolitan structure in which peripheral areas absorb population without commensurate improvements in service or connectivity.
The distributional risks of proximity-based planning in such contexts are real and well-documented. Several scholars caution that 15minC strategies applied without explicit attention to equity may inadvertently function as instruments of gentrification, driving up land values in well-served areas and displacing lower-income residents toward more peripheral and less accessible locations [
3,
10,
21]. This concern is especially pertinent in the Madrid and Lisbon metropolitan areas, where tourism-driven displacement, short-term rental markets, and inward investment have already reshaped residential geographies and compressed housing affordability [
22,
23]. Ensuring equitable outcomes thus requires not only spatial reorganization of services and transport, but complementary instruments addressing housing affordability, targeted mobility subsidies, and the democratic governance of public space [
1].
Two further dimensions complete the analytical picture. First, the integration of digital technologies (e.g., Mobility as a Service platforms, real-time information systems, smart ticketing) holds genuine promise for improving suburban transport efficiency, but also introduces new axes of exclusion for elderly residents or those with limited digital literacy [
24,
25]. Second, citizen participation emerges as a critical mechanism for embedding equity in planning outcomes: participatory processes that genuinely engage diverse population groups consistently produce more equitable transport interventions than those driven predominantly by technical actors [
26,
27,
28].
Previous studies have primarily assessed equity within the 15minC framework through spatial accessibility metrics, measuring the proportion of residents able to reach essential services within a predefined travel-time threshold and comparing accessibility levels across neighbourhoods or socioeconomic groups (e.g., [
29,
30,
31]). These analyses typically rely on GIS-based accessibility indicators, cumulative-opportunity measures, or isochrone-based evaluations to quantify disparities in access to daily services. More recently, researchers have broadened the assessment of equitable outcomes by examining transport disadvantage, social inclusion, and the potential unintended consequences of proximity-based planning, including residential displacement and gentrification [
29,
32]. Nevertheless, most existing studies evaluate equity primarily through spatial or socioeconomic accessibility indicators, with comparatively limited attention given to governance, digital inclusion, and participatory dimensions.
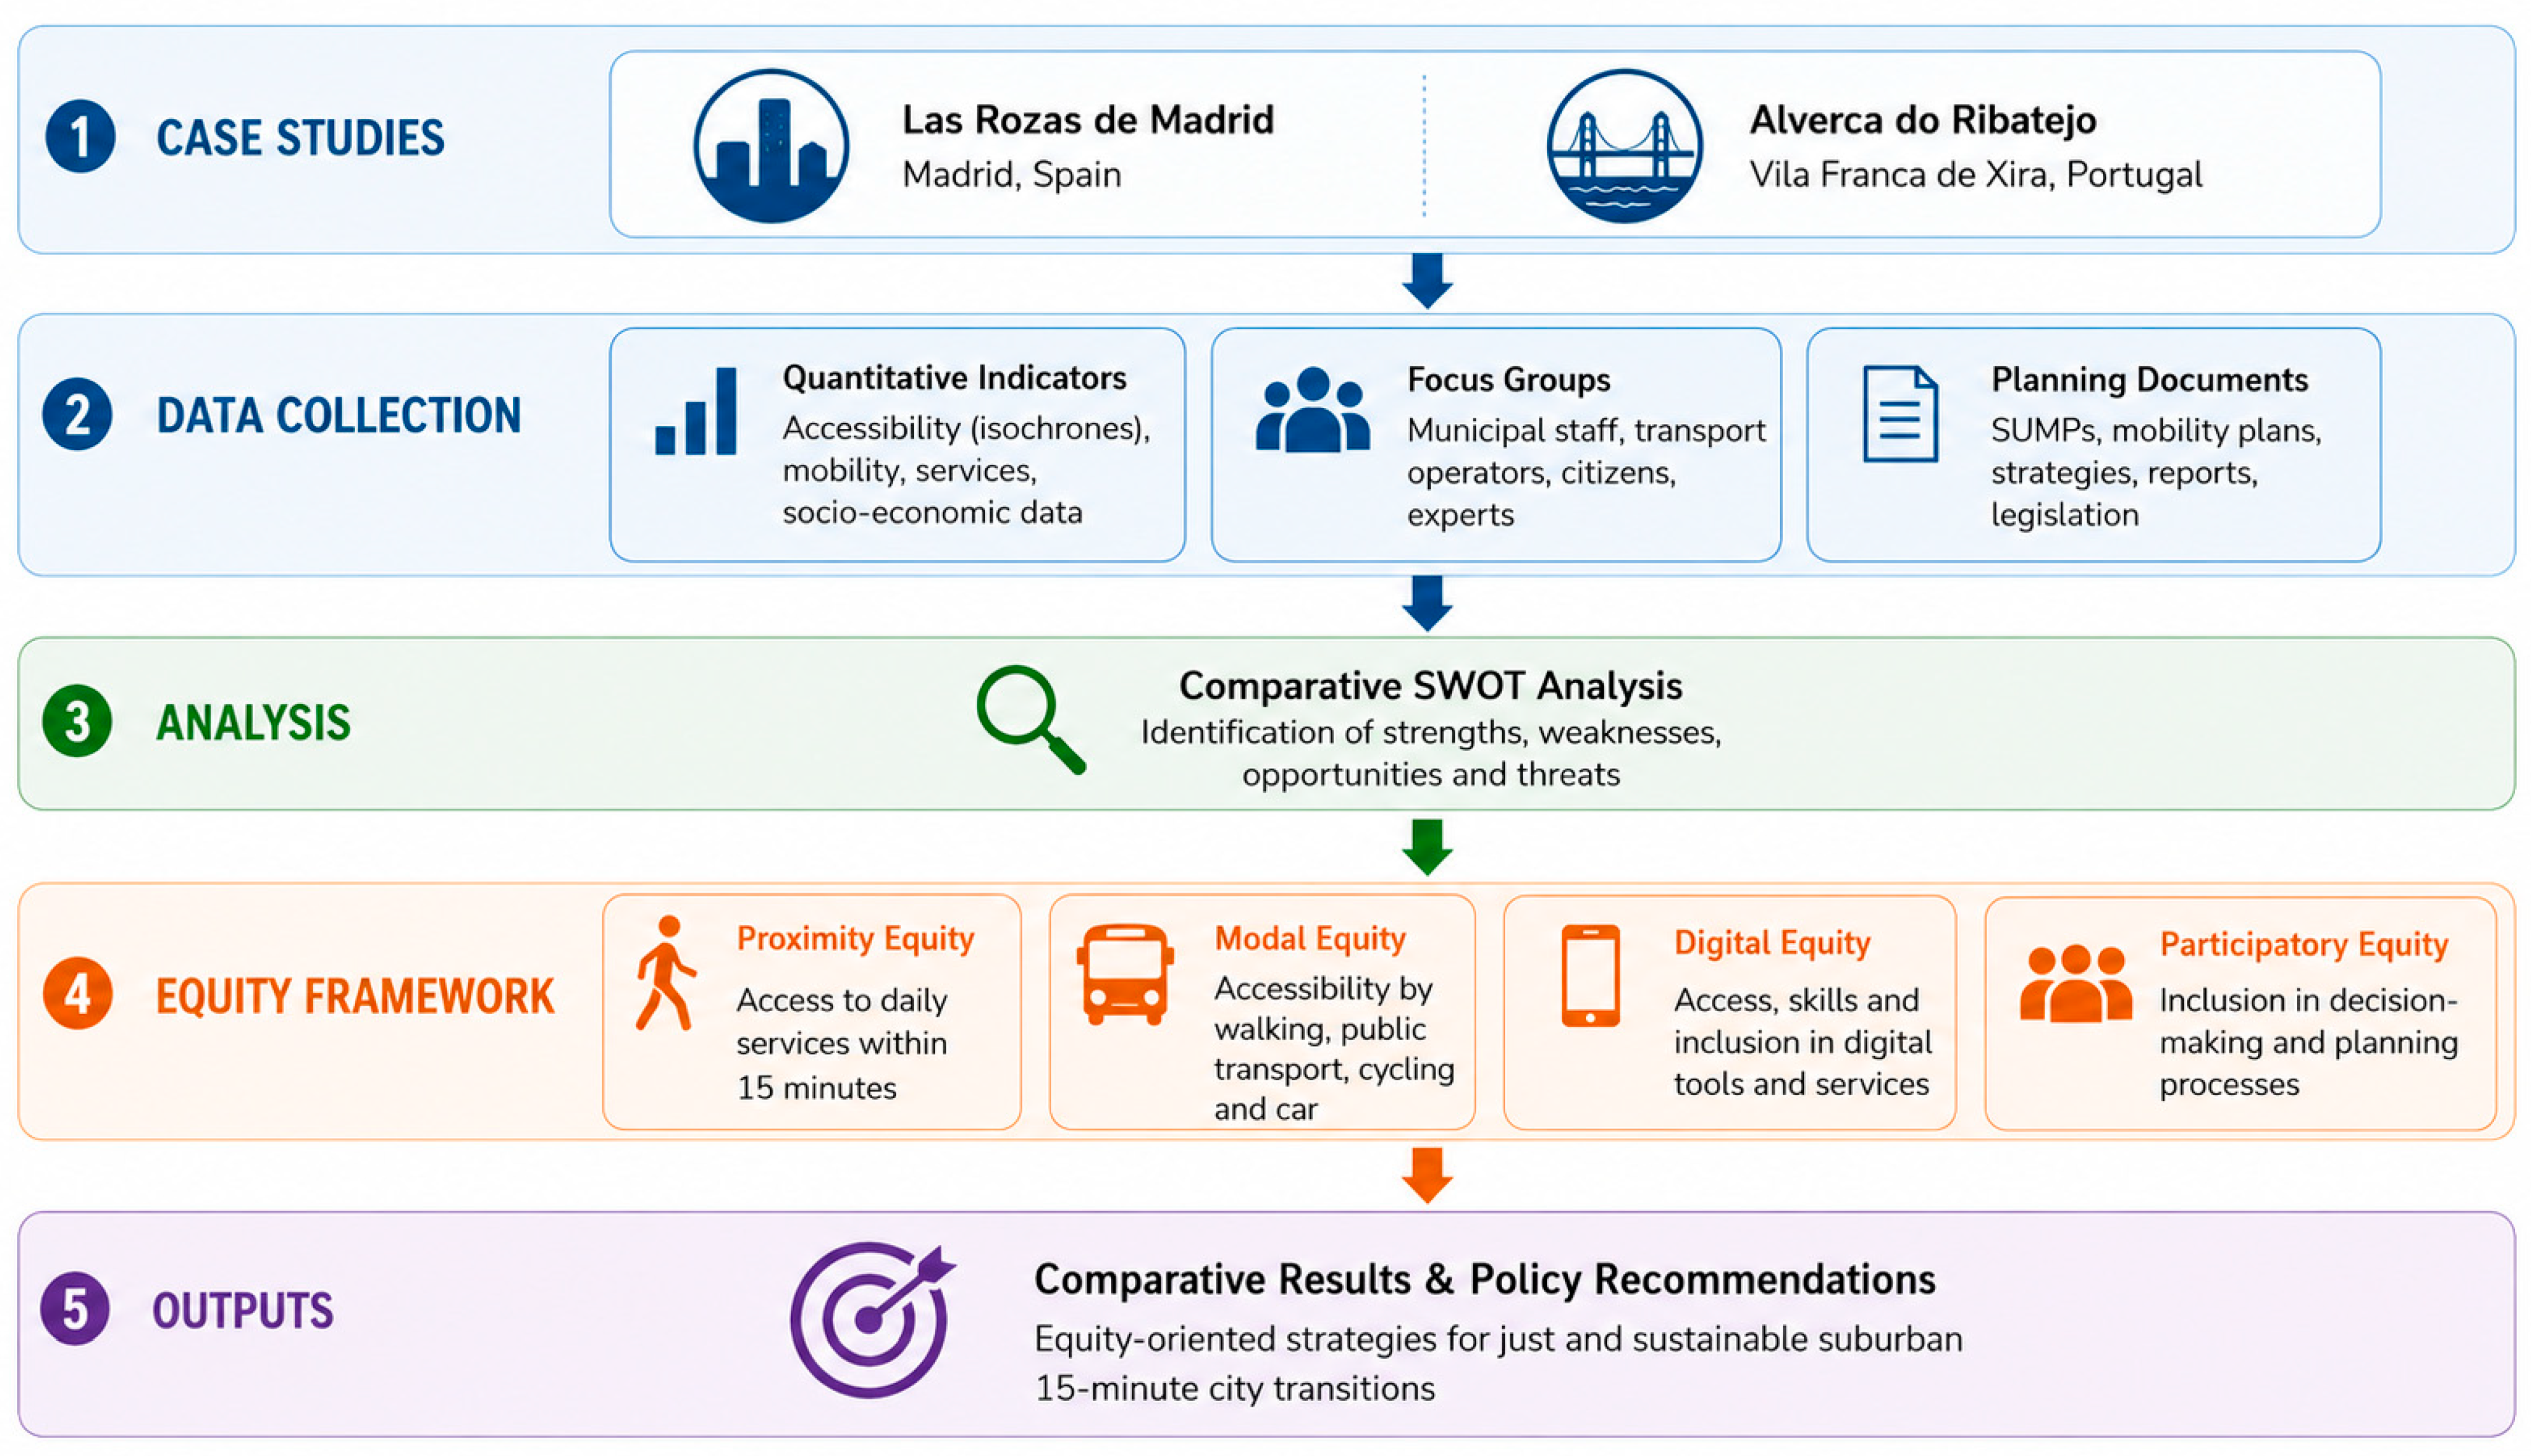
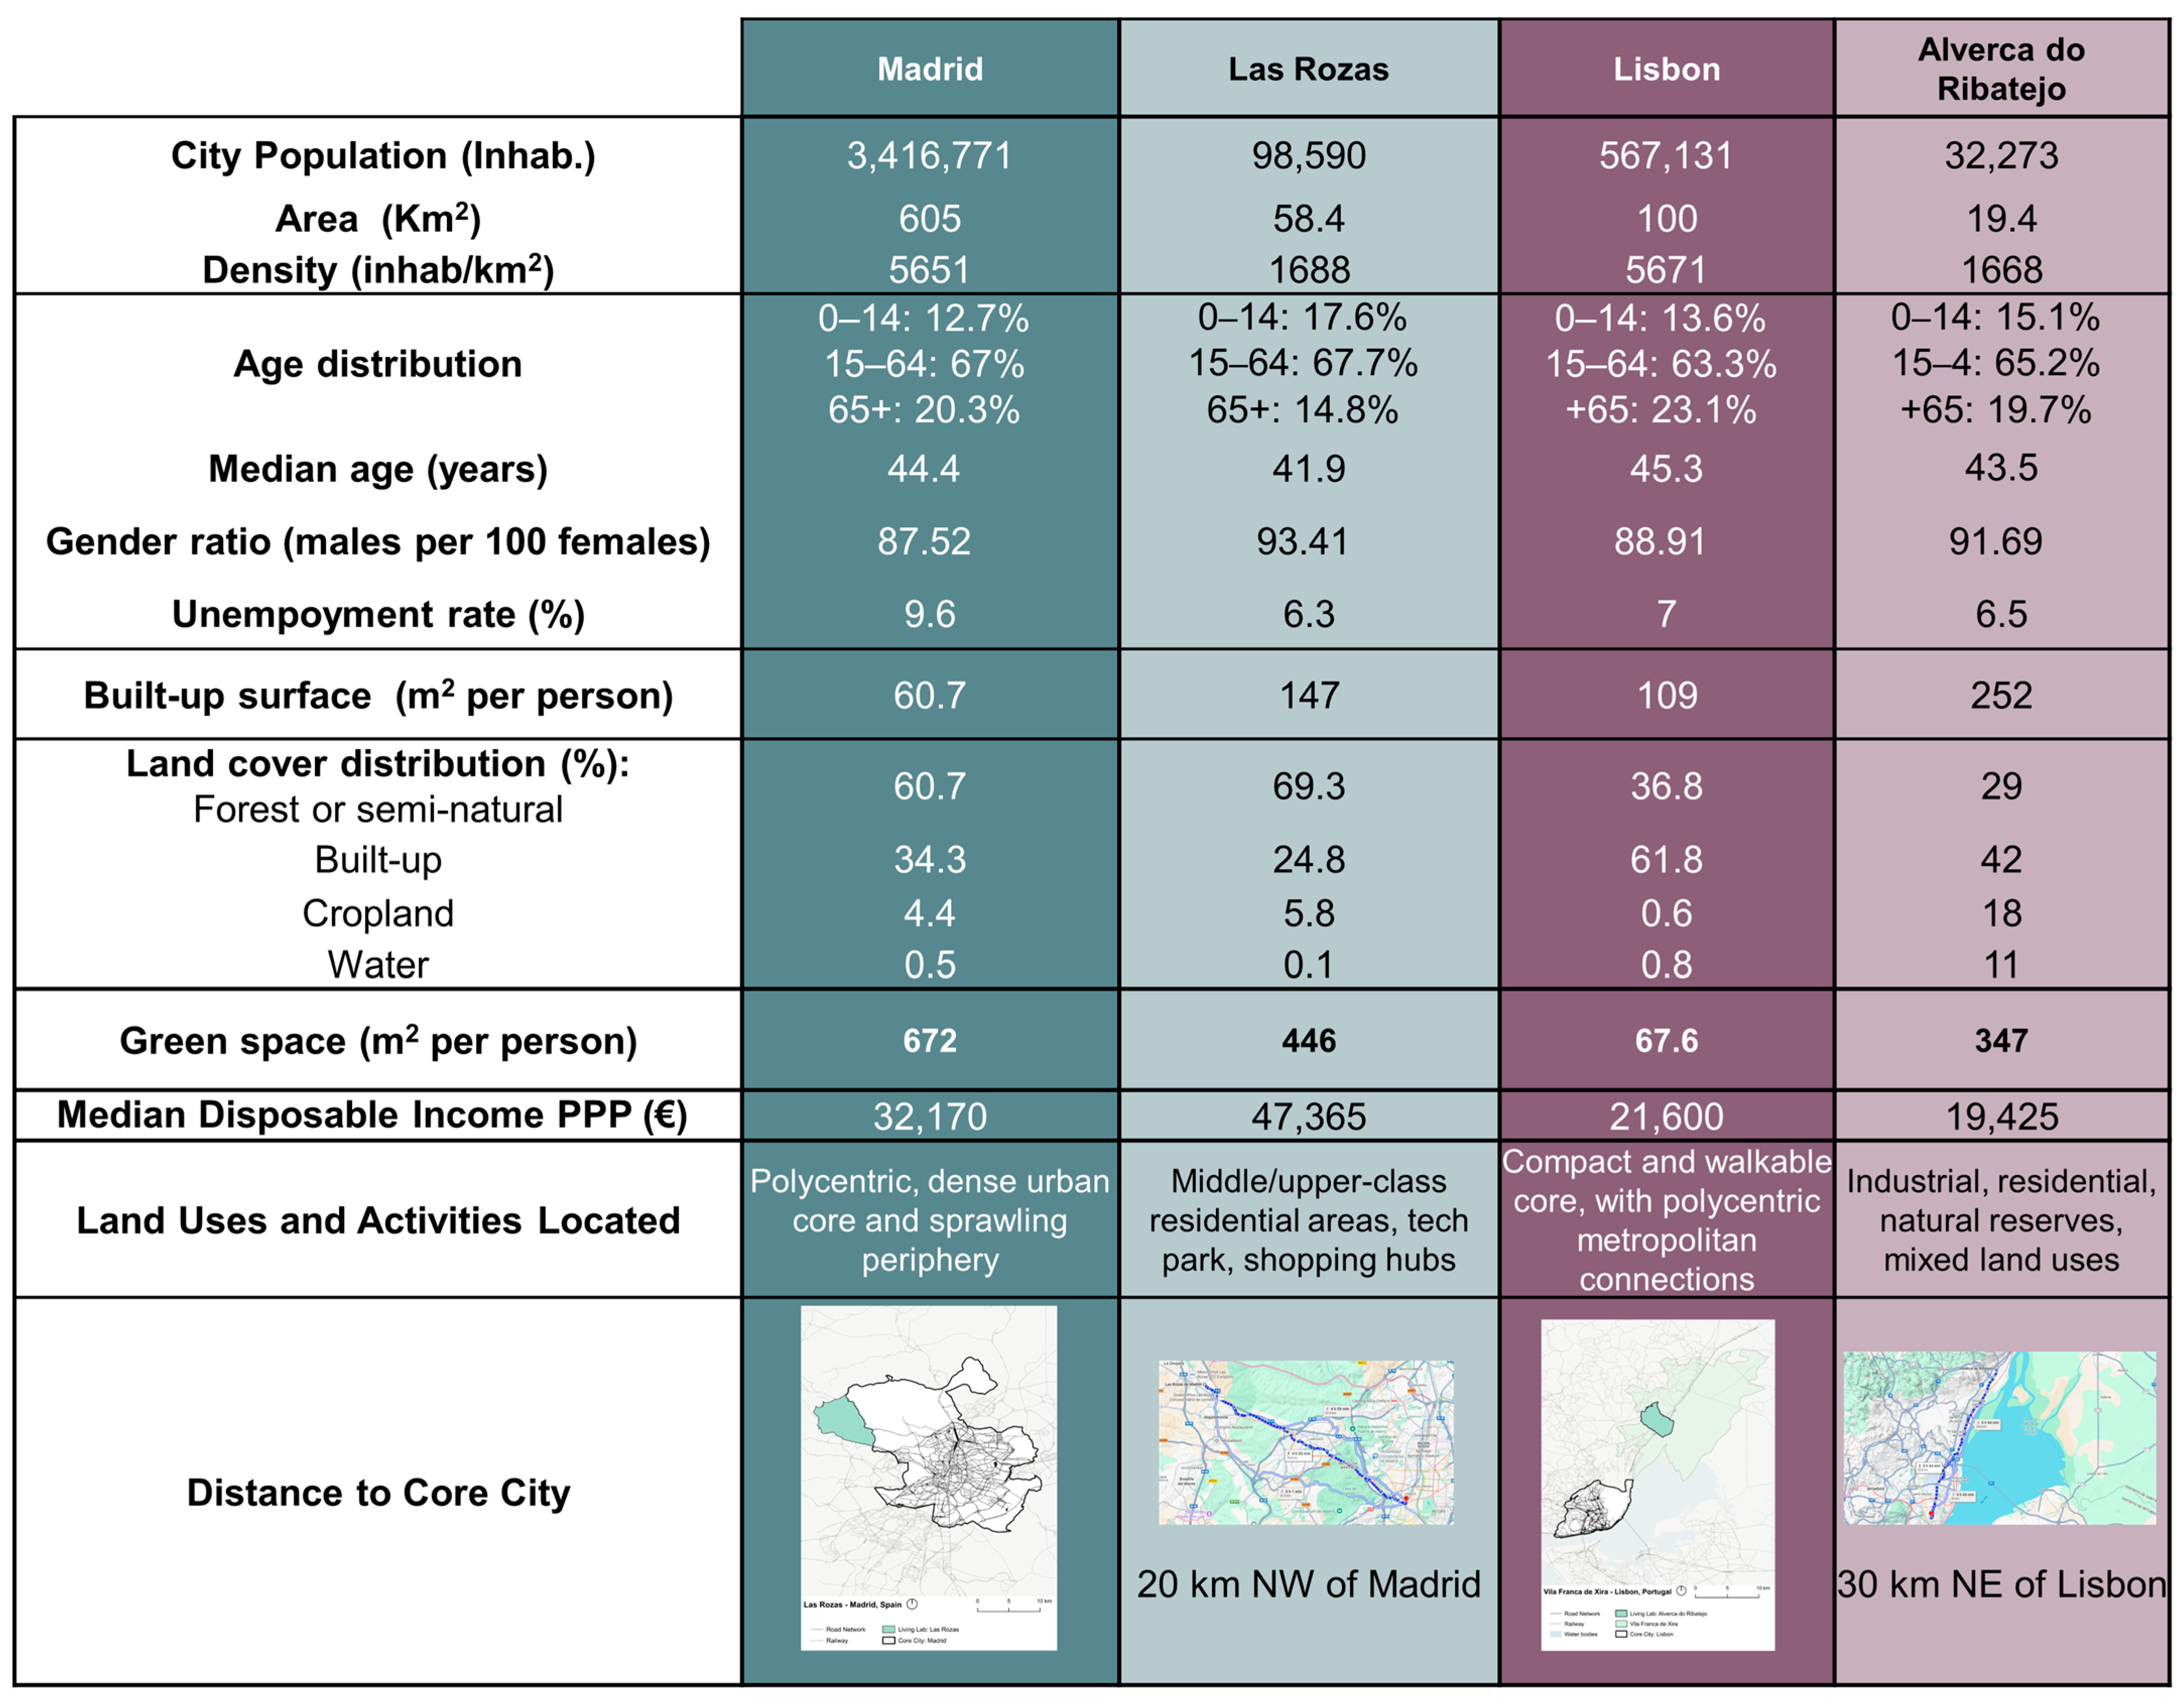
This study addresses this gap and all previous intersecting concerns by adopting a multidimensional framework that integrates proximity, modal, digital, and participatory equity into a single comparative assessment. To this end, this paper examines two European suburban case studies: Las Rozas de Madrid (Spain) and Alverca do Ribatejo within the municipality of Vila Franca de Xira (Portugal). These cases represent contrasting yet structurally comparable suburban typologies, an affluent, digitally innovative commuter suburb and a structurally fragmented, post-industrial peripheral municipality, respectively. Beyond the individual characteristics of the two municipalities, the comparative design contributes to the international debate on the transferability of the 15minC concept beyond compact urban centres. While existing research has predominantly focused on dense metropolitan cores, considerably less attention has been devoted to suburban territories where dispersed land use, fragmented governance, and unequal accessibility present different planning challenges. By comparing two suburban municipalities with contrasting institutional and spatial characteristics, this study identifies both context-specific and transferable determinants of equitable proximity planning, thereby contributing to a more comprehensive understanding of how the 15minC framework can be adapted to diverse suburban settings.
The analysis draws on a SWOT (Strengths, Weaknesses, Opportunities and Threats) analysis of conditions under which the 15minC model can be adapted to suburban metropolitan peripheries while advancing spatial equity and urban accessibility. It integrates quantitative indicators and qualitative stakeholder evidence collected via focus groups (FGs) to argue that sustainable mobility transitions in suburban contexts cannot be achieved through proximity planning alone, but must be grounded in an explicit commitment to spatial equity addressing the distributional consequences of urban form, transport investment, digital integration, and governance design for all residents.
This study makes three principal contributions to the existing literature. First, it extends the assessment of the 15minC concept from predominantly compact urban centres to suburban environments, where accessibility challenges, governance arrangements, and mobility patterns differ substantially. Second, it proposes an integrated methodological framework that combines GIS-based accessibility analysis, comparative SWOT assessment, stakeholder engagement, and four complementary equity lenses (proximity, modal, digital, and participatory equity) to evaluate the social dimensions of proximity-based planning. Third, through a comparative analysis of two European suburban municipalities, the study identifies both context-specific and transferable factors influencing the equitable implementation of the 15minC concept, providing methodological and policy insights applicable to other metropolitan regions. The methodology is intended to support local and metropolitan authorities, transport planners, urban practitioners, and researchers in identifying accessibility inequalities, prioritizing planning interventions, and evaluating the implementation of proximity-based policies in diverse suburban settings.
The paper is structured as follows:
Section 2 presents the materials and methods;
Section 3 reports comparative results across the analytical dimensions;
Section 4 discusses cross-cutting issues of public transport underutilization, structural car dependency, and citizen participation; and
Section 5 draws conclusions and policy recommendations for equitable suburban 15minC implementation.
3. Results
3.1. SWOT Comparative Analysis
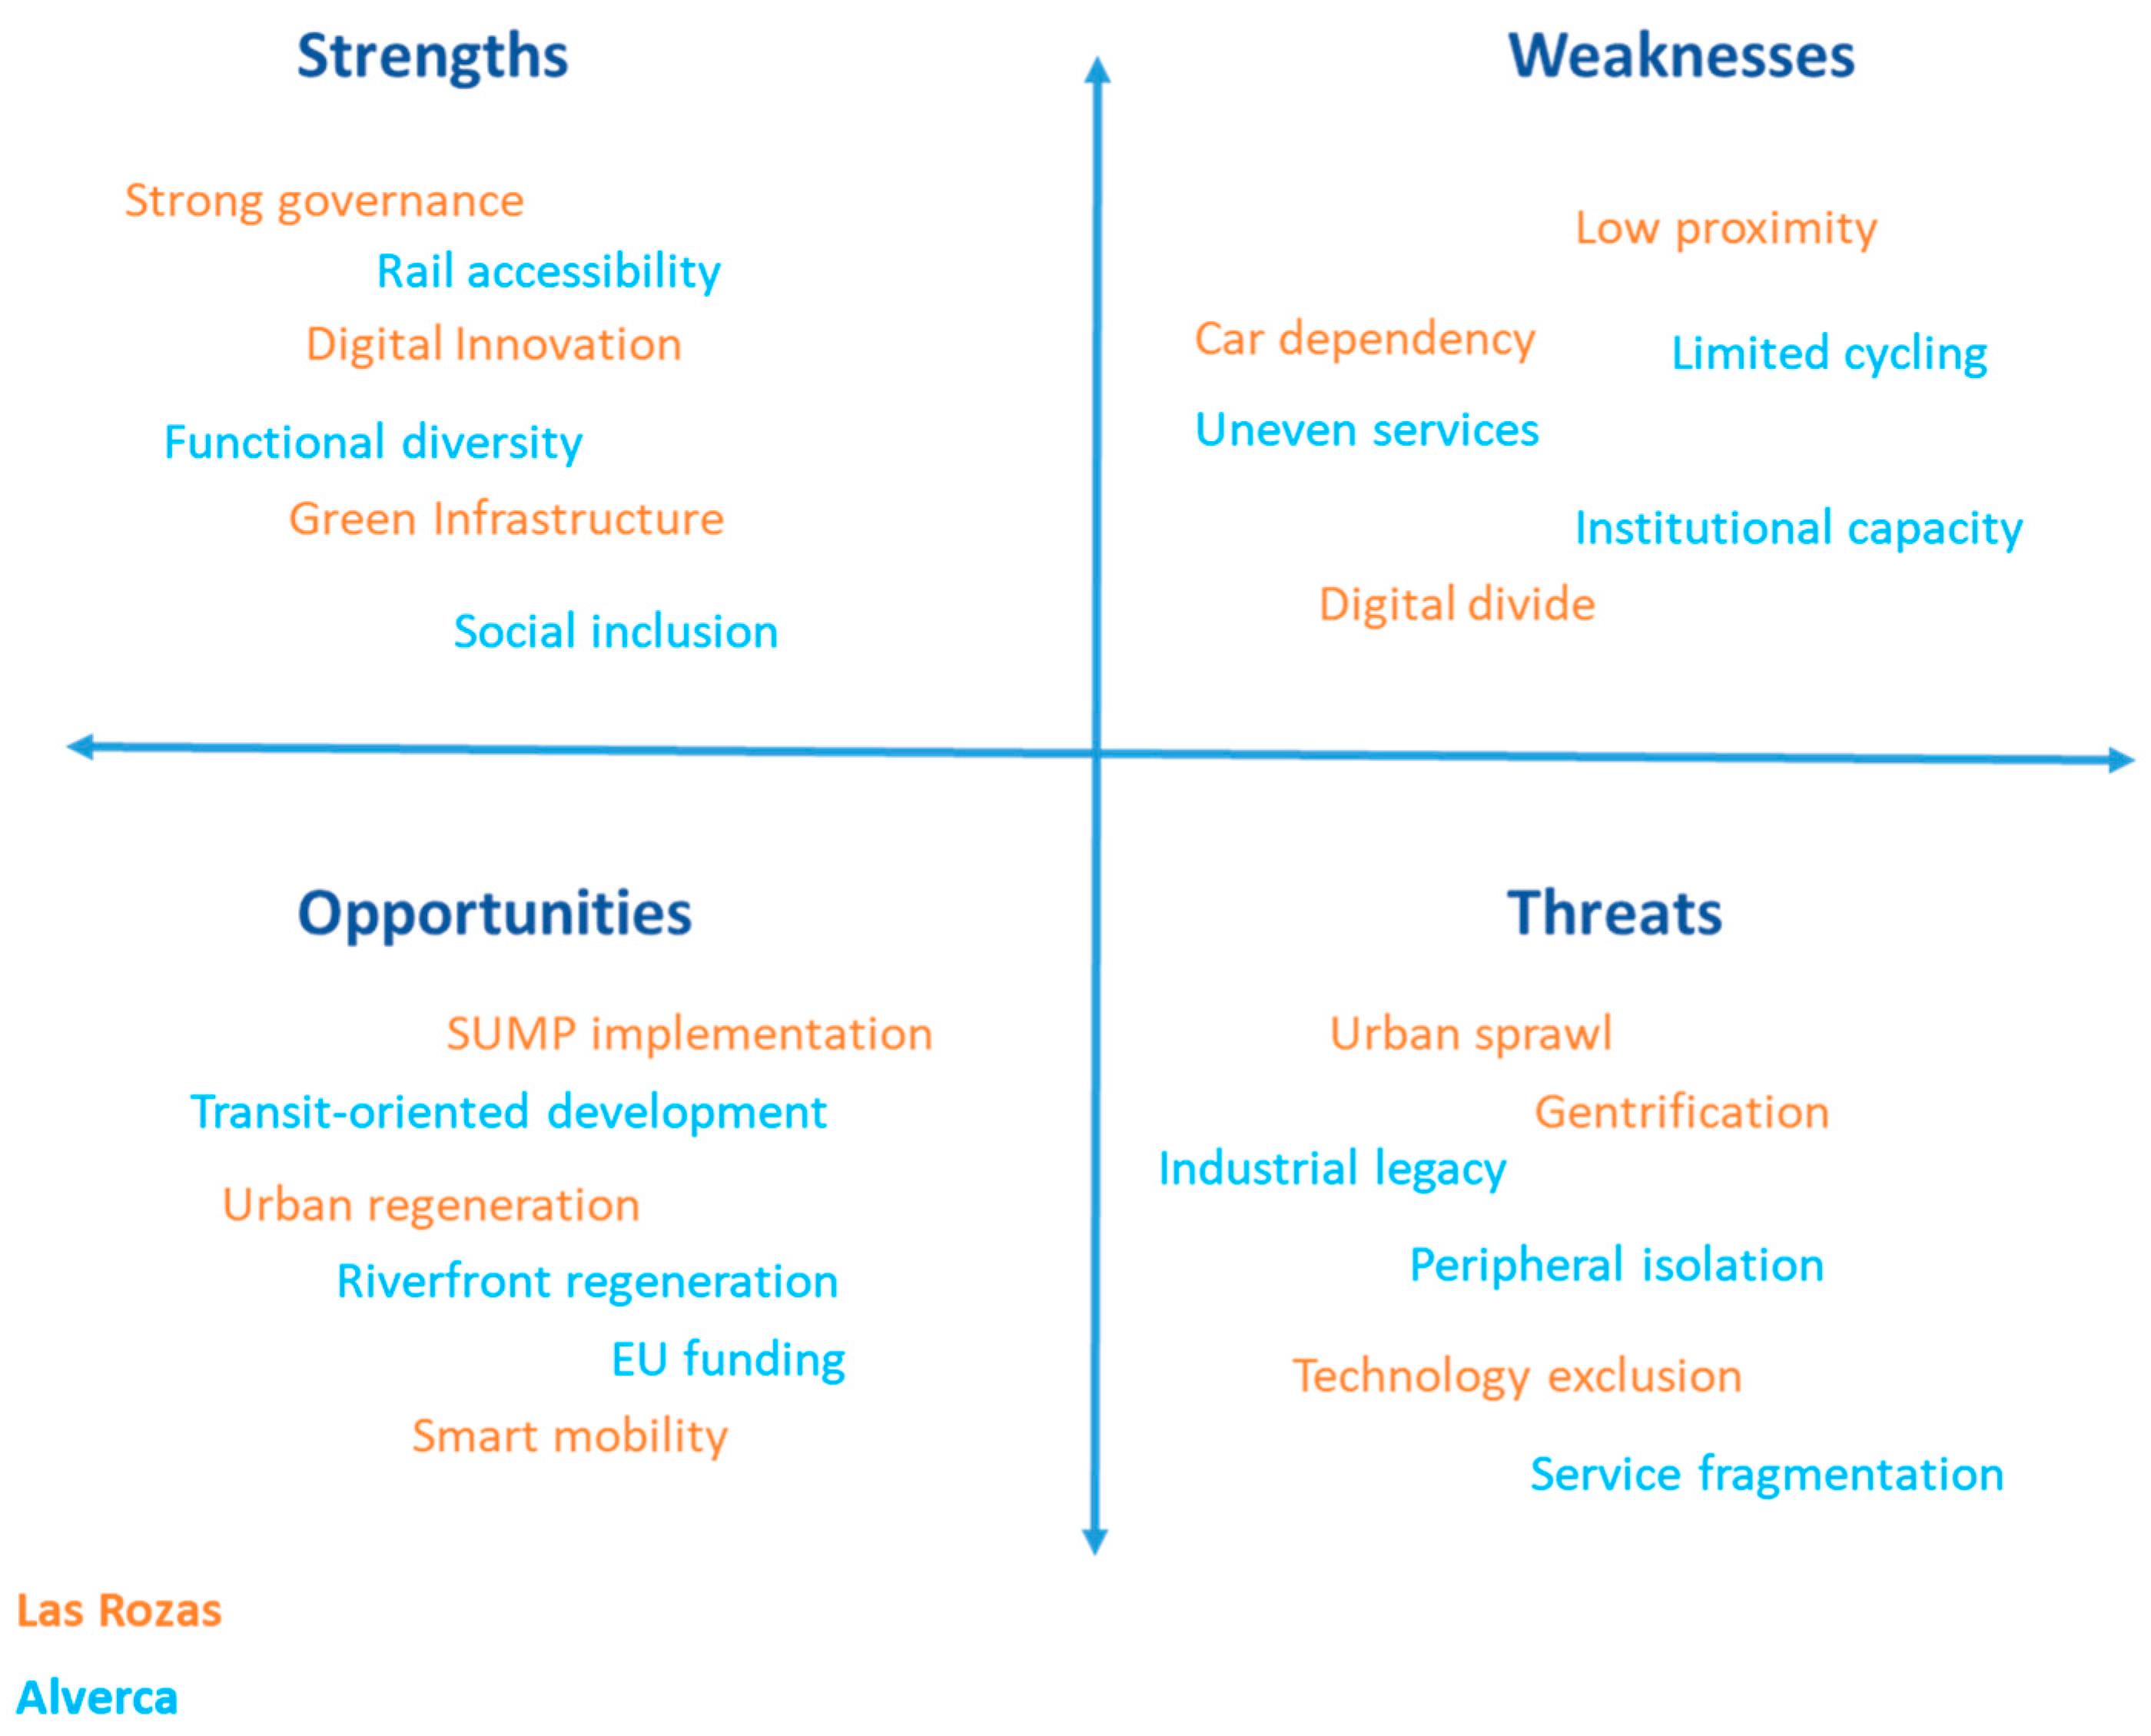
To present a general overview of the studied use cases, a structured SWOT analysis was conducted across multiple dimensions, drawing on the collected data as mentioned in
Section 2.2.1 (see
Table 2).
Figure 3, in parallel, illustrates the summary of the main outputs of
Table 2 in both case studies.
Las Rozas has generally good coverage of green areas and basic facilities within residential areas, but has large gaps in both work and getting to a higher education institution. The average distance to the nearest school (626 m) exceeds the significant and commonly used ‘walkable’ distance of 400 m, which means that people living there have to use a motor vehicle to get to these places to go to school every day. Alverca do Ribatejo provides good access to essential services and transportation hubs located in central areas of the city, along with active support for active mobility; however, there is unbalanced service provision in the city with more peripheral areas of the city (like Alverca) having inadequate service coverage and significant accessibility problems, especially for the elderly people.
With regard to land use and density, both living labs exhibit low-density development at their periphery that has a negative impact on public transport efficiency and proximity to services. In Las Rozas the residential morphology is dominated by sprawl, with higher-density areas encouraging walking and multiple uses, but recent expansions have long distances between uses. Alverca do Ribatejo has more heterogeneous land uses, such as denser urban centres, agricultural areas, industrial areas and natural areas; however, both areas have an inadequate density of infrastructure. The low density of population and reliance on automobiles are the primary characteristics of both living labs, and the densification pressures facing the labs will create further risks of gentrification and territorial imbalance.
According to social and functional diversity, Las Rozas is a largely mono-functional and socially and spatially divided city. Moreover, there continues to be socio-spatial in-equality resulting from limited access to services and socialization for different income and age groups. Alverca do Ribatejo has higher functional diversity, which improves community resiliency and richness of services; however, the lack of regulation of functional diversity has the potential for severe conflict, service overload and inequity between sectors. Both municipalities recognize that diversity is one of the critical elements for 15minC implementation and that this diversity will be complicated to govern.
Las Rozas and Alverca do Ribatejo are both at the early stage of digital transformation and smart city evolution regarding smart urban and digital issues. Las Rozas started moving forward using smart mobility tools such as participatory platforms and sensor networks. However, implementation remains inconsistent, and there is still a digital gap between the elderly and lower-income earners in the community. Alverca do Ribatejo appears to be benefiting from a strong, mature digital infrastructure provided through regional platforms in Lisbon that support smart transport coordination, e-services and telemedicine; however, there is still significant risk of digital exclusion, high infrastructure costs, issues surrounding cyber security, and reliance on technology. Both sites are interested in applying technology as a mechanism to increase access, rather than applying technology as an ultimate goal.
Municipalities in Alverca do Ribatejo and Las Rozas have car-based modal shares as their top project metric. There are large commuting distances in fringe areas of both cities, with Las Rozas having 70% of commuters using a private vehicle, 16% using public transit, 11% walking, and less than 1% biking, with 27 km of dedicated cycling infrastructure. Alverca do Ribatejo has a similar number of commuter modes (approximately 61% of commuters use a private vehicle, 18% use public transit, and 18% walk); however, they are limited to only 2.67 km of biking lanes. Both case studies support a strategic commitment to increasing the number of people that use alternative modes to private cars like public transport and active modes.
Sustainability and climate actions are two central issues for Las Rozas through improving green spaces, building active mobility infrastructure, establishing pilot projects (such as safe school routes), and establishing sustainability as an explicit strategic priority. Alverca do Ribatejo relates sustainability to improving efficiency in mobility, energy performance from buildings, and adapting to different types of climate risks (e.g., heat and flooding). Alverca do Ribatejo establishes national and EU funding sources for developing sustainability. Both living laboratories have a strong focus on climate-smart urban planning, but their capacity for implementation, as well as the rate at which they deploy green infrastructure, differs greatly.
Both case studies are conducted within a multi-level governance framework, which consists of three administrative levels: the national government; the province or other regional government, such as the Province of Madrid or the City of Madrid; and the municipality. Regionally, Las Rozas has proximity to Madrid, which provides access to long-established governing bodies like the Comunidad de Madrid (CMR) or the Consorcio Regional de Transportes de Madrid (CRTM) and a local innovation office, Las Rozas Innova. Vila Franca de Xira (with its part of Alverca do Ribatejo) relies on the Área Metropolitana de Lisboa (AML) and Transportes Metropolitanos de Lisboa (TML) to provide regional transportation coordination; however, the municipality has a poor organizational capacity to provide financial aid and service to its citizens. As both municipalities work towards completing the 15minC model, they agree that governance strengthening is essential in order to achieve this goal, particularly through improving metropolitical government coordination.
Las Rozas concentrates on developing local business and creating a circular economy through its local developmental efforts to help those businesses grow [
50]; however, the geographic spread of Las Rozas prevents it from developing sufficient high-quality local employment opportunities and the concentration of those providers. Alverca do Ribatejo gives top priority to economic development, focusing on providing employment opportunities close to residences and urban requalification through the regeneration of the local economy. Both municipalities have the shared goal of decreasing long-distance commuting while building strong local economic centres; however, they have diverging approaches to accomplish that goal with the businesses in Alverca do Ribatejo featuring manufacturing and logistics and those in Las Rozas highlighting advanced services and technology.
Ultimately, both of the case studies have recognized that there are accessibility issues for vulnerable groups—mostly senior citizens, disabled persons and low-income populations; however, neither has yet made equity a major focus within their overall strategy. Las Rozas has identified issues of accessibility in certain residential areas. The Municipality of Vila Franca de Xira also identifies challenges related to creating an integrated approach between communities of different cultural backgrounds and ensuring that all residents have equitable access to services throughout the municipality. Both case studies believe that the 15minC model can be used as a tool to promote social cohesion, but both agree that unless compensatory mechanisms, such as affordable housing and targeted mobility grant programmes, are created as part of their densification and regeneration strategies, densification and regeneration could worsen existing inequalities.
3.2. Equity-Centred Analysis
As provided in
Section 2.2.2, the equity analysis is represented through four lenses: proximity, modal equity, digital equity, and participatory equity.
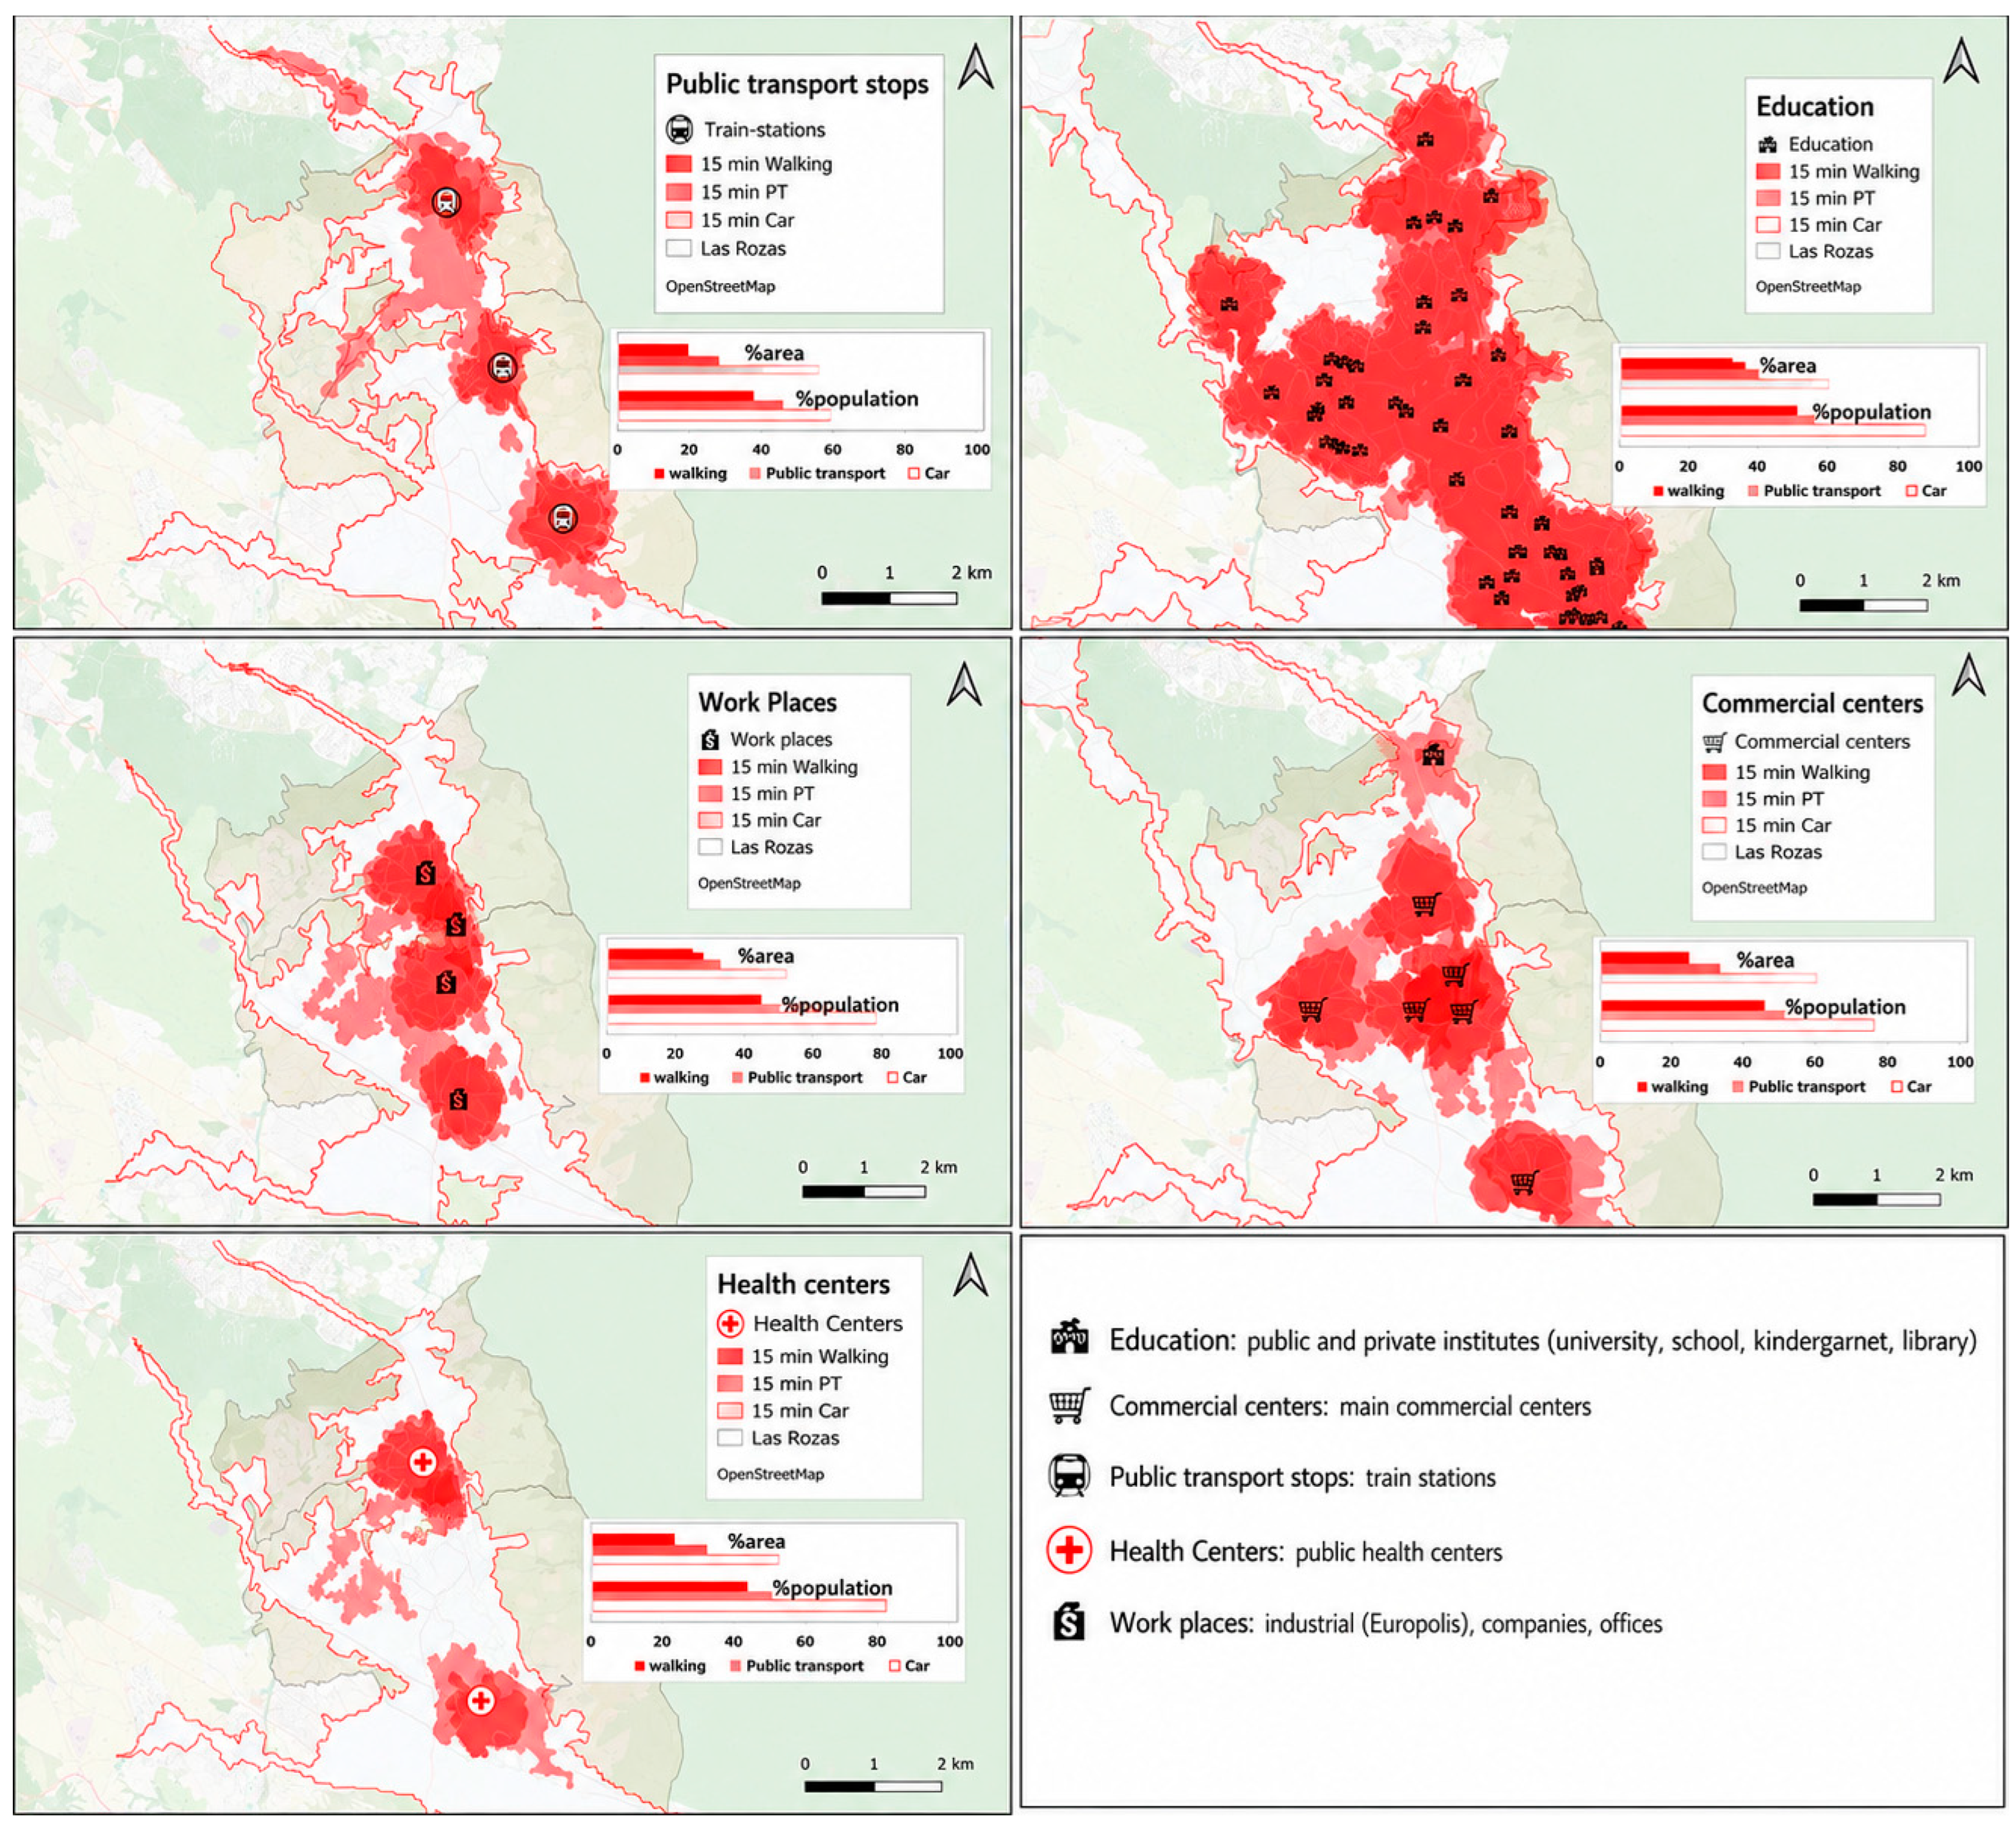
Figure 4 and
Figure 5 provide insight into the first two lenses, while other investigated information from case study municipalities represents the last two lenses.
3.2.1. Proximity Lens
The proximity maps are accompanied by bar charts that illustrate accessibility in terms of the percentage of territorial coverage (area) and population, where the right edge of the bar charts represents the value of 100%. Different geoprocessing tools were employed to calculate these values. Firstly, the Dissolve tool was used to refine travel time isochrones and then intersect them with the zone layer and census block data using the Intersect tool in order to have a layer with all attributes, to calculate the percentage of people accessed and the area covered in the 15 min polygons.
In Las Rozas (
Figure 4), the spatial distribution of essential services and transport infrastructure reveals notable patterns of unequal access depending on residential location. High-performance public transport stops, represented by train stations, cover only approximately 5–8% of the municipal area within a 15 min walk, rising to roughly 30% by public transport and around 80% by car. Population coverage follows a similar gradient, with walking catchments reaching approximately 15–20% of residents, compared to around 50% by public transport and over 90% by car.
Education facilities show the broadest spatial coverage among all service categories. Walking catchments cover approximately 20–25% of the municipal area and around 50% of the population, while public transport isochrones extend this to roughly 40% of the area and 75–80% of the population, which are the highest figures across all service types. Commercial centres display a more spatially concentrated pattern, with walking-distance area coverage remaining below 15%, though public transport catchments bring population coverage to approximately 55–60%. Workplaces present a more fragmented picture, with walking access covering roughly 10% of the area and 25–30% of the population. Health centres show the most restricted coverage, with walking catchments reaching only around 8–10% of the municipal area and approximately 20% of the population.
Across all categories, population coverage consistently and markedly exceeds area coverage for walking and public transport isochrones, indicating that denser residential zones tend to benefit from better proximity to services, while lower-density peripheral areas remain underserved on foot.
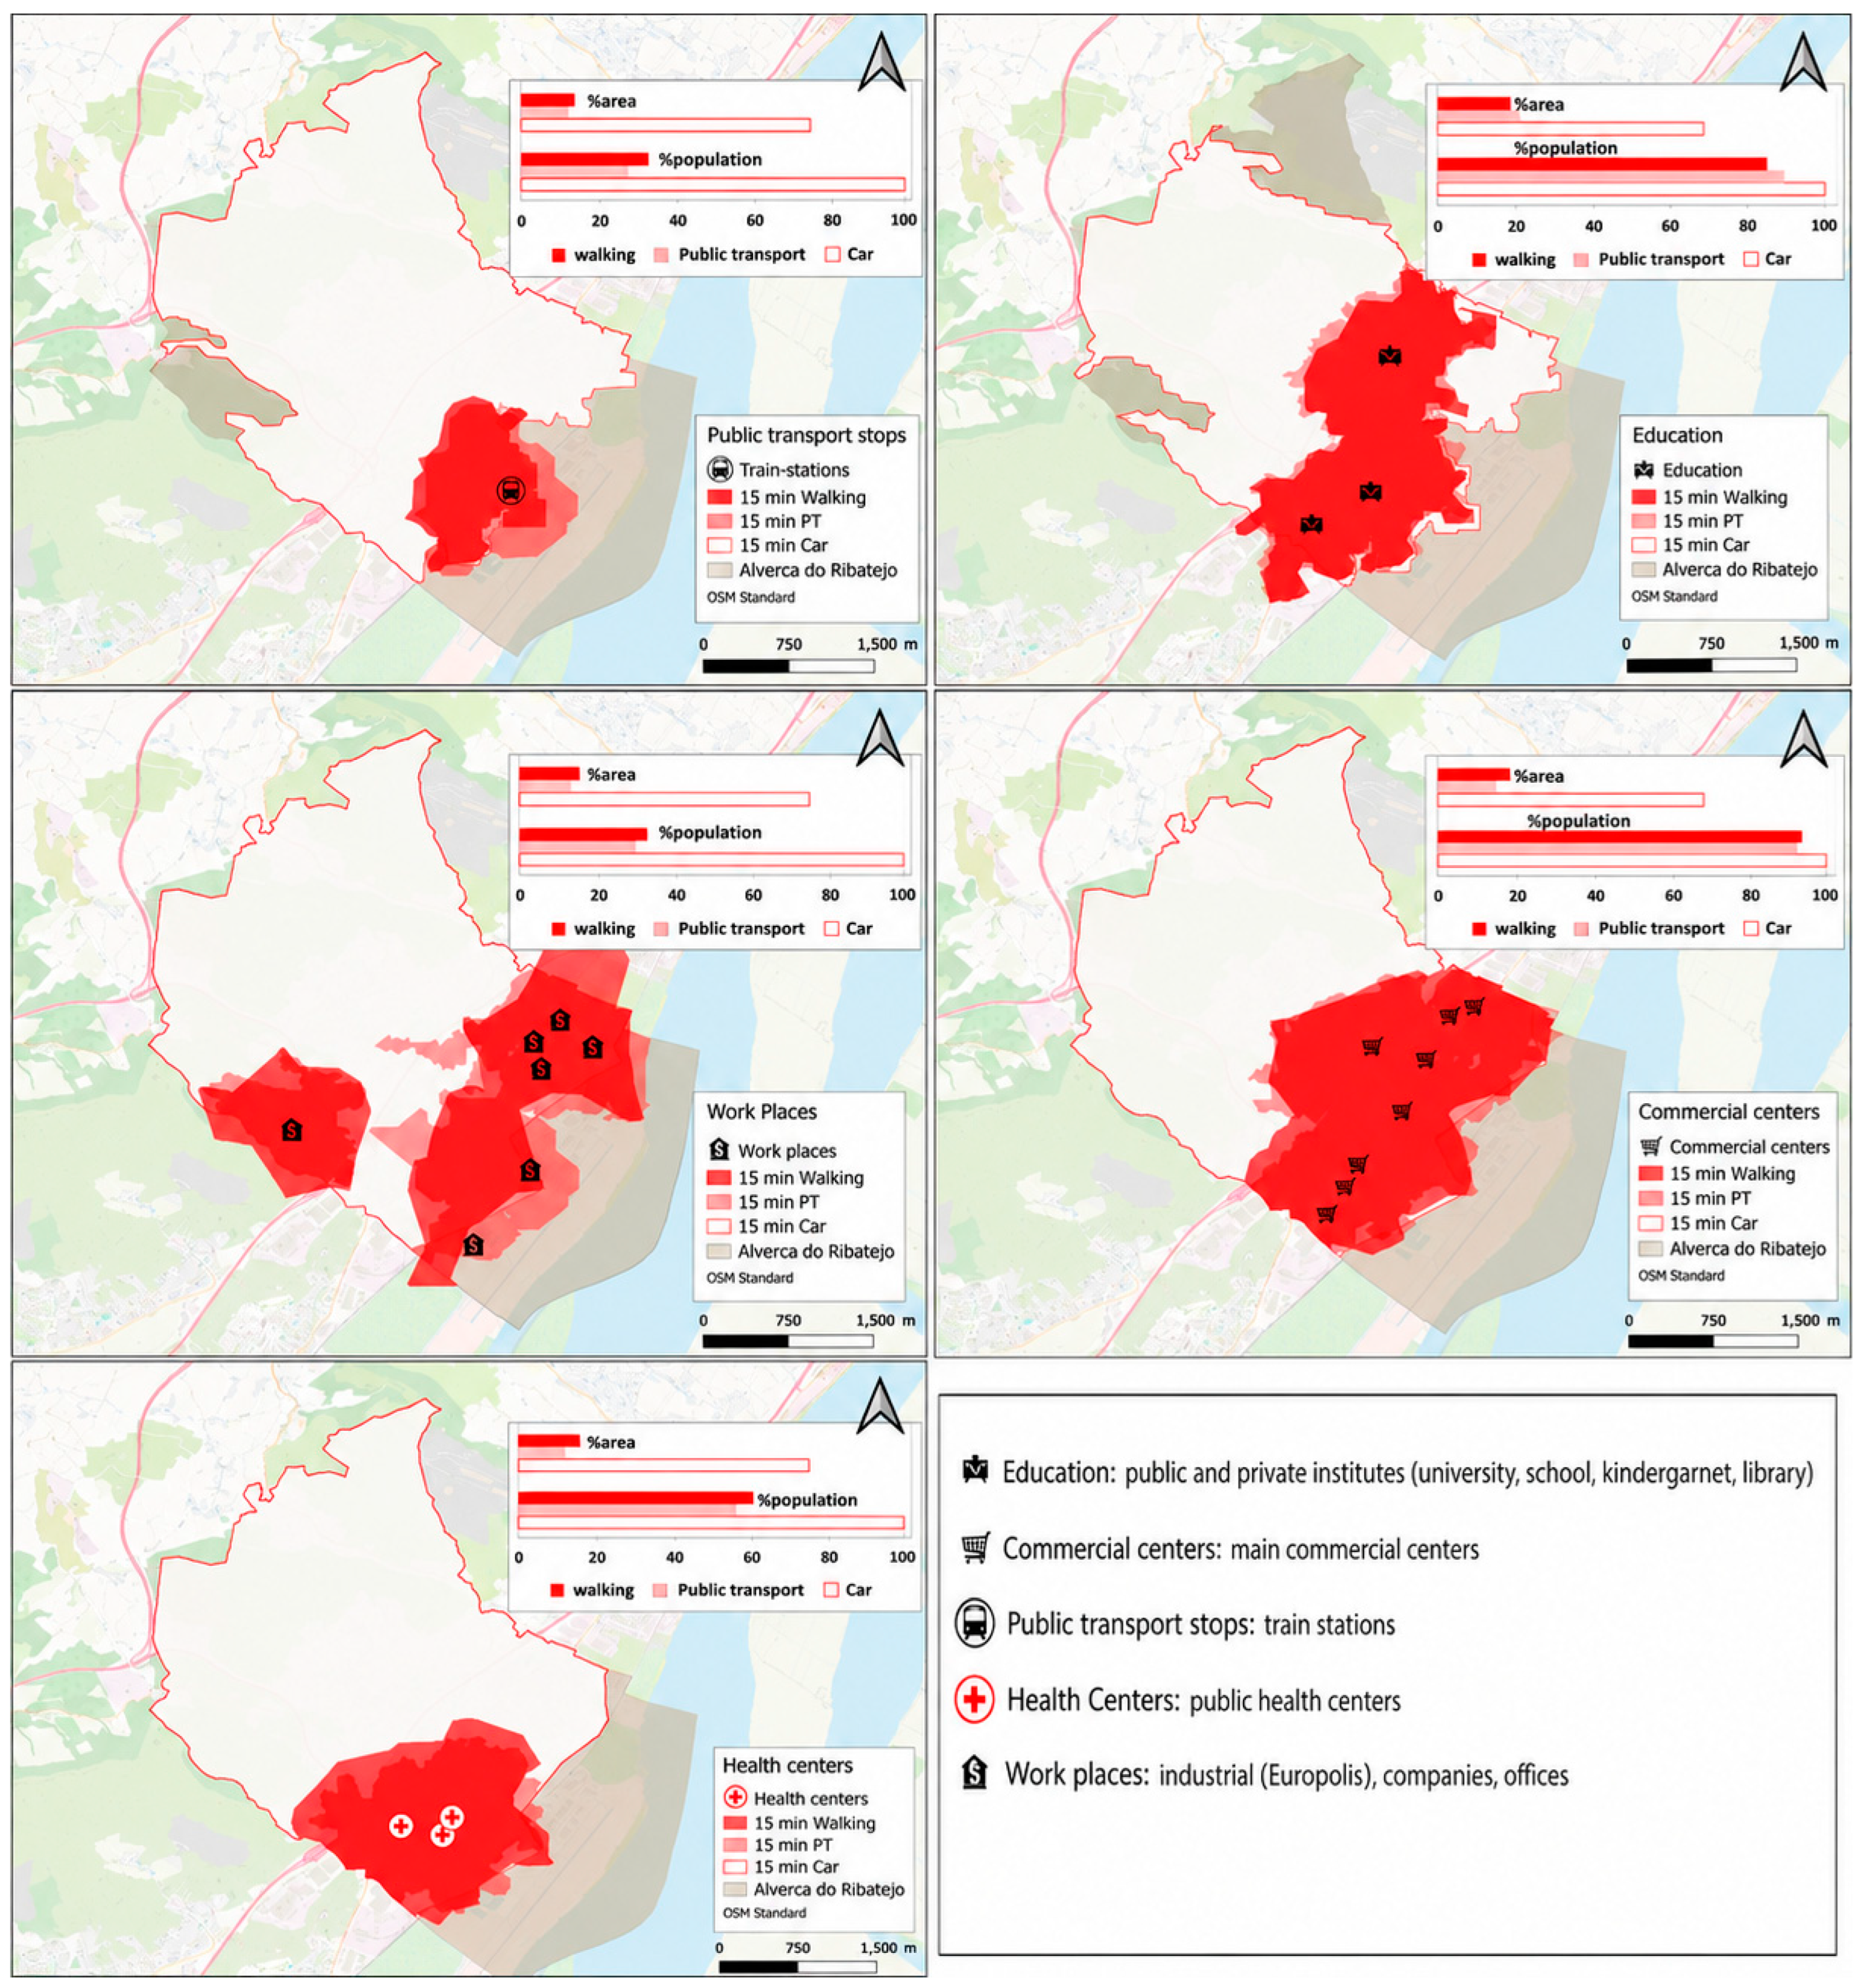
In Alverca do Ribatejo (
Figure 5), the spatial distribution of essential services and transport infrastructure reveals an urban area where walkable access is geographically concentrated but demographically meaningful, reflecting the more compact and denser urban fabric compared to Las Rozas.
High-performance public transport stops—represented by train stations—cover a relatively limited share of the municipal area within a 15 min walk, estimated at approximately 10–15%, rising to roughly 35–40% by public transport and approaching 75–80% by car. Population coverage follows a steeper gradient, with walking catchments reaching approximately 25–30% of residents, suggesting that the train station is embedded within a reasonably dense residential core. Public transport extends this to around 50–55%, while car-based coverage reaches over 85–90% of the population.
Education facilities show the broadest spatial coverage among all service categories, consistent with the pattern observed in Las Rozas. Walking catchments cover approximately 30–35% of the municipal area and around 60–65% of the population—the highest walking figures across all service types in Alverca—while public transport isochrones extend area coverage to roughly 50% and population coverage to approximately 80–85%. This reflects a relatively distributed provision of schools and educational institutions across the urban tissue.
Commercial centres display a moderately concentrated pattern, with walking-distance area coverage estimated at around 15–20%, though the population coverage by walking reaches approximately 40–45%, indicating that commercial nodes are located within or adjacent to denser residential zones. Public transport catchments bring population coverage to approximately 65–70%.
Workplaces present the most fragmented spatial picture, consistent with the presence of industrial and office clusters at the periphery of the residential fabric. Walking access covers roughly 20–25% of the area but with a notably dispersed, multi-cluster pattern, and population coverage by walking remains around 35–40%. This fragmentation reflects the structural separation between where people live and where employment concentrations are located.
Health centres show a spatially singular but demographically significant pattern, with one dominant catchment zone in the more densely populated southwestern area. Walking catchments reach approximately 15–20% of the municipal area but cover around 45–50% of the population, suggesting that health infrastructure is strategically located within the highest-density residential area, even if geographic coverage of the full municipality remains limited.
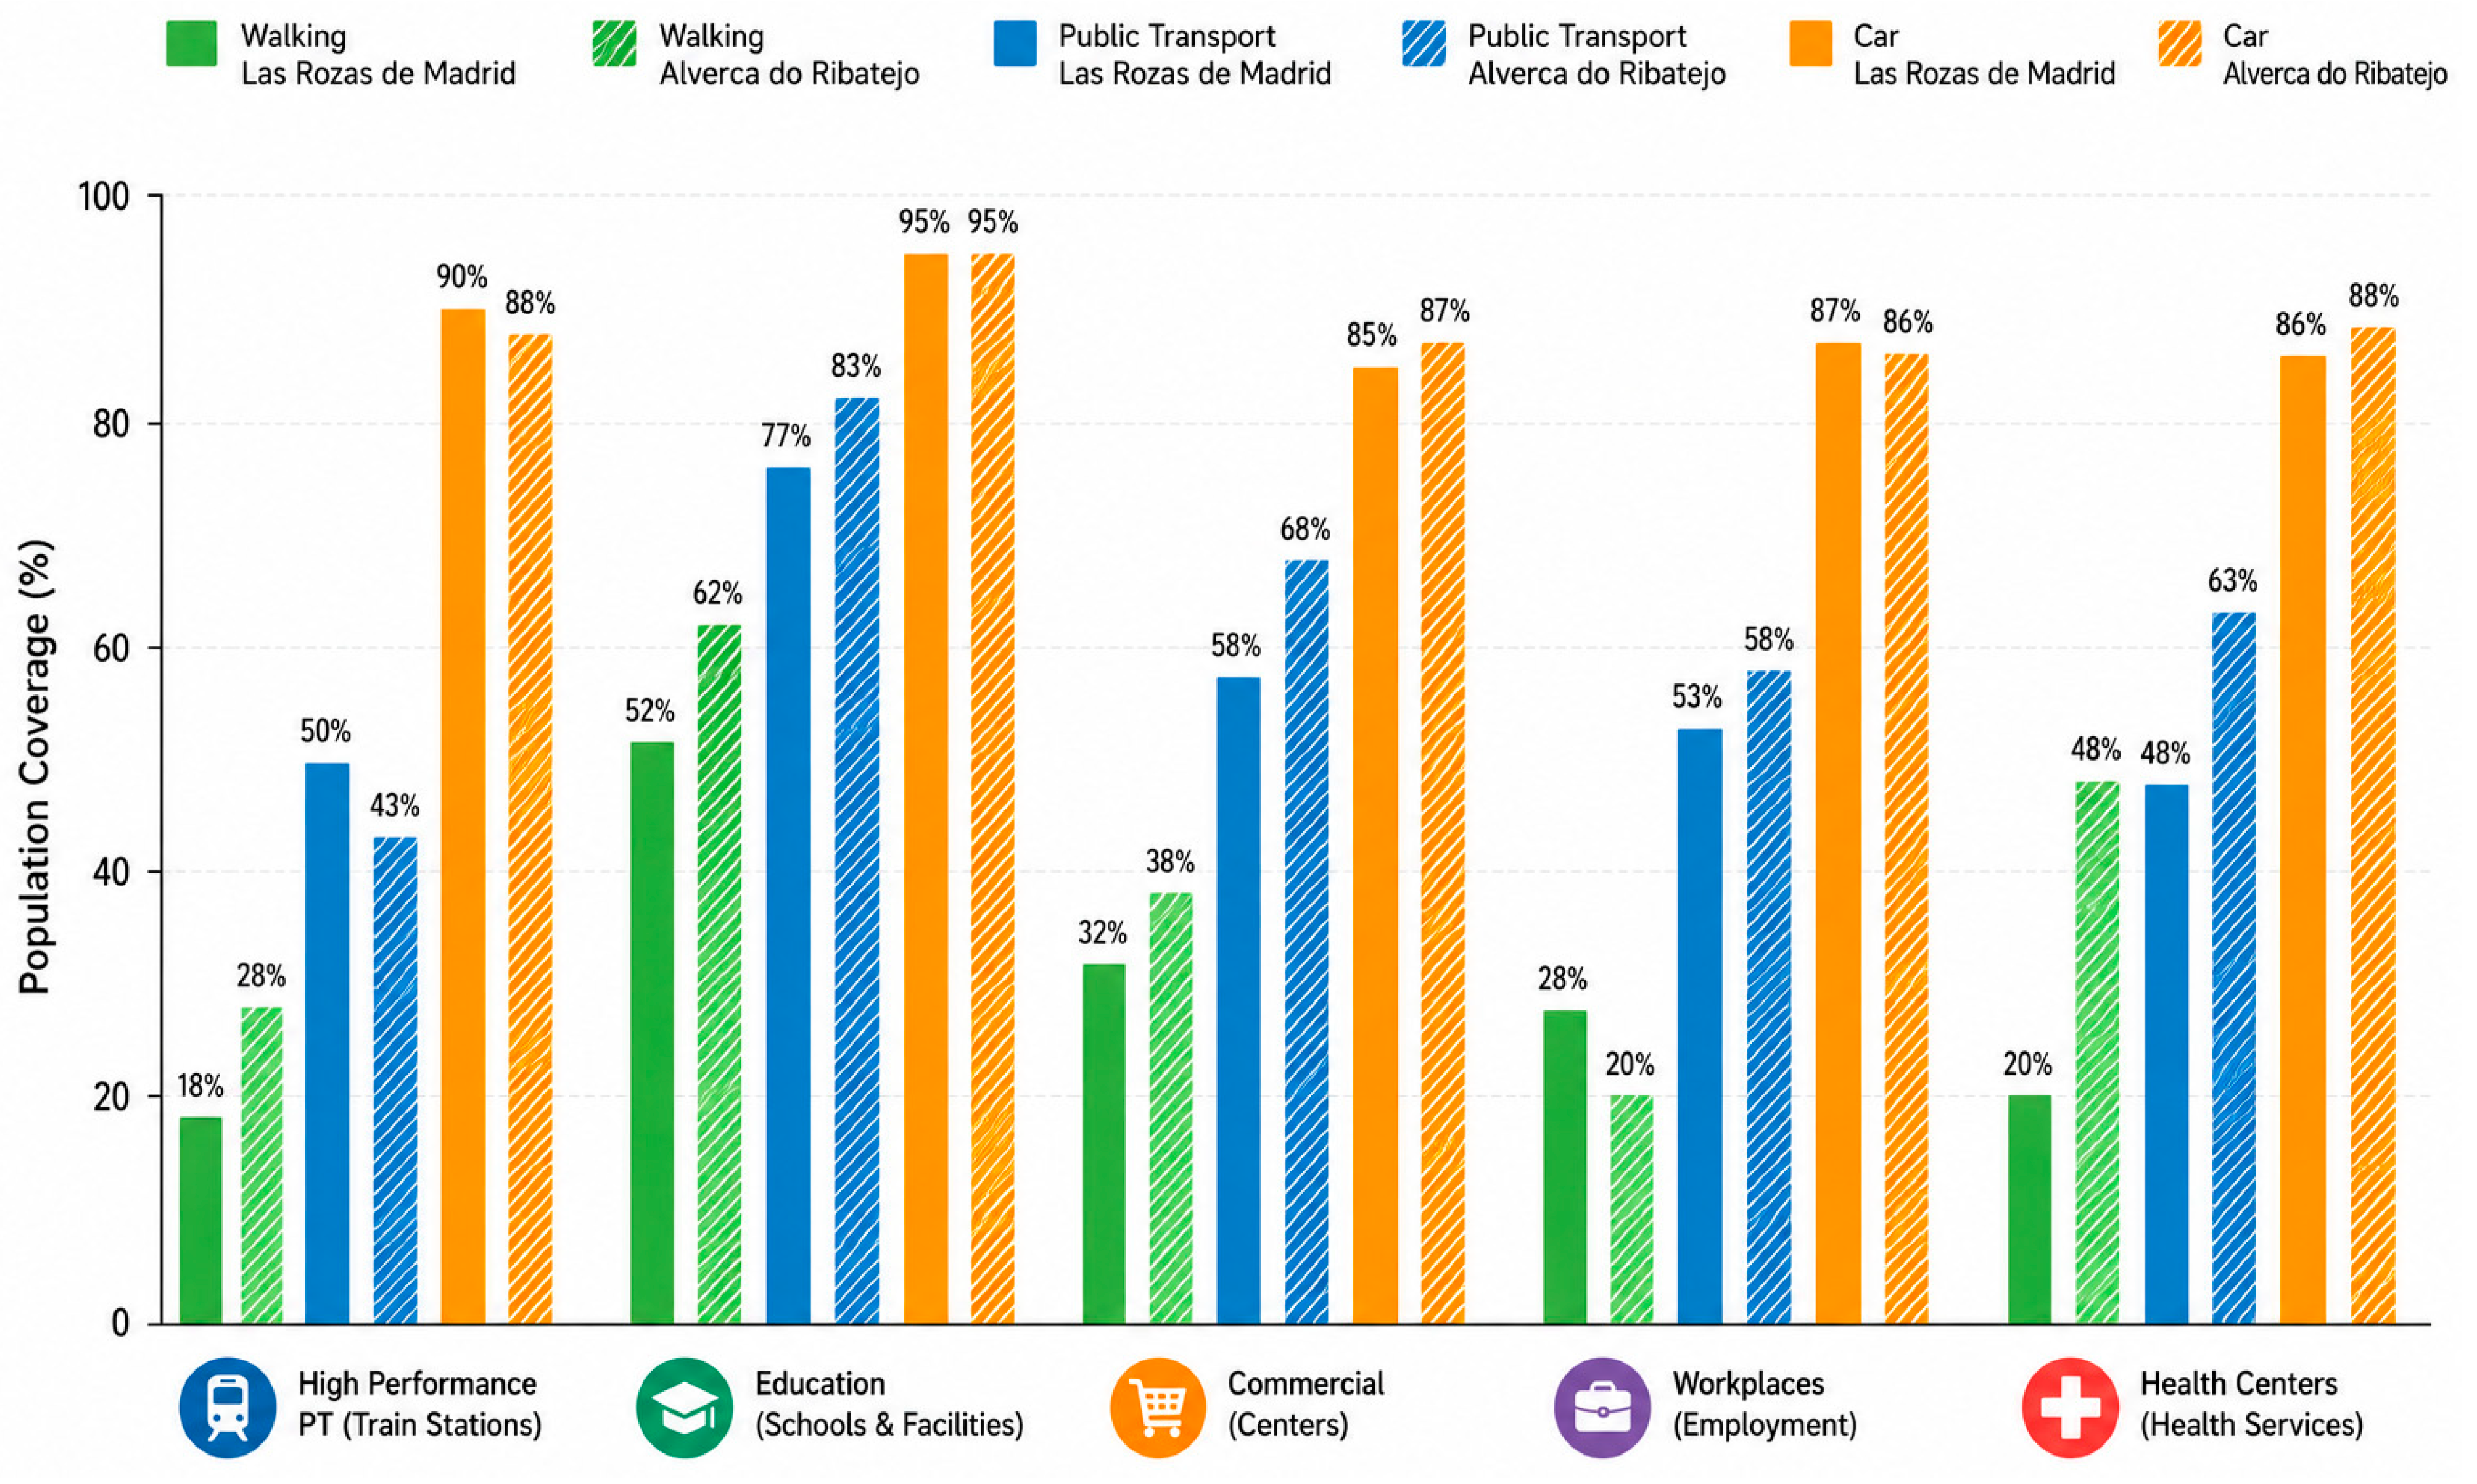
The comparison of population coverage (see
Figure 6) under the proximity equity lens reveals notable differences between the two living labs, particularly for services that support everyday activities. Alverca consistently achieves higher population coverage for walking accessibility across most service categories, including education, commercial centres, and health services, indicating a more compact urban structure and a greater concentration of essential services within residential areas. In contrast, Las Rozas exhibits lower pedestrian accessibility despite its higher socioeconomic profile, reflecting the dispersed, low-density urban form characteristic of suburban development. Although both case studies provide high levels of accessibility by private car, the substantial gap between walking and car accessibility in Las Rozas highlights the persistence of spatial inequities, where access to daily opportunities remains highly dependent on motorized travel. These findings suggest that proximity alone is strongly influenced by urban morphology and land-use distribution, reinforcing the need for mixed-use development and improved local service provision in suburban environments.
3.2.2. Modal Equity Lens
The comparison of walking, public transport, and car catchments in Las Rozas (
Figure 4) reveals a persistent and structurally significant modal gap across all five service categories. For every service type, car-based 15 min isochrones cover substantially more of both municipal area and population than walking or public transport equivalents, underscoring the degree to which the municipality’s spatial organization privileges private vehicle use.
This gap is particularly pronounced for workplaces and commercial centres. For workplaces, walking population coverage reaches approximately 25–30%, public transport around 50%, and driving over 85–90%, resulting in a difference of roughly 60 percentage points between walking and driving. For commercial centres, a similarly wide gap is observed between walking (~30% population) and driving (~85%). Health centres present the starkest modal disparity in area terms, where walking covers under 10% of the territory compared to car-based access reaching approximately 70–75%. The implication is that residents without access to a private vehicle (e.g., elderly individuals, young people, lower-income households) face structural barriers to reaching key destinations within comparable time budgets. Public transport catchments do improve coverage relative to walking alone, yet consistently fall 30–40 percentage points short of car-level reach, confirming that the current network does not fully compensate for the absence of private motorization among transport-disadvantaged groups.
The comparison of walking, public transport, and car catchments in Alverca do Ribatejo (
Figure 5 and
Figure 6) reveals a persistent modal gap across all five service categories, though the absolute magnitude of this gap is somewhat narrower than in Las Rozas, reflecting the more compact territorial scale and higher residential density of the municipality.
For every service type, car-based 15 min isochrones cover substantially more of both municipal area and population than walking or public transport equivalents, confirming that private vehicle access remains the dominant determinant of spatial reach. However, the gap between walking and driving is compressed relative to Las Rozas, particularly in population terms, because Alverca’s built environment places more residents within a walkable distance of at least some services.
This gap is most pronounced for workplaces. Walking population coverage reaches approximately 35–40%, public transport around 55–60%, and driving over 85–90%, producing a difference of roughly 50 percentage points between walking and driving. The fragmented, peripheral location of employment clusters means that even public transport does not fully bridge the gap, leaving car-free residents with structurally constrained access to employment within a 15 min budget. Commercial centres present a similarly notable disparity, with a walking population coverage of around 40–45% versus car-based access exceeding 85%, a gap of approximately 40–45 percentage points.
Health centres present the starkest modal disparity in area terms, where walking covers approximately 15–20% of the territory compared to car-based access reaching around 70–75%, a pattern closely mirroring Las Rozas despite the difference in municipal scale. Public transport improves coverage meaningfully, yet still falls approximately 25–30 percentage points short of car-level reach in population terms across most service categories.
The implication is structurally comparable to Las Rozas: residents without access to a private vehicle (i.e., elderly individuals, younger populations, and lower-income households) face systematic barriers to reaching key destinations within equivalent time budgets. In Alverca’s case, the denser urban core partially mitigates this for centrally located residents, particularly regarding education and health access by walking. However, the peripheral location of workplaces and the uneven distribution of commercial nodes mean that the modal disadvantage remains structurally embedded for those dependent on walking or public transport, particularly in reaching employment and commercial destinations. Public transport catchments improve upon walking access but consistently fall short of car-level coverage, confirming that the network does not fully compensate for the absence of private motorisation among transport-disadvantaged groups.
3.2.3. Digital Equity Lens
Las Rozas with its explicit strategic priorities within its Sustainable Urban Mobility Plan (SUMP) [
35] and broader innovation agenda is one of the more digitally advanced suburban municipalities in the Madrid region, real-time traffic sensors, a Digital Twin for its Low Emission Zone, and partial smart ticketing. However, focus group participants identified several structural challenges that they perceived as undermining the effectiveness and equity of this digital push. Participants consistently highlighted the digital divide as an important concern, suggesting that older residents and lower-income households with limited access to smartphones or digital skills may face greater barriers to using app-based transport services, potentially creating a two-tier mobility system.
“There are generations in which everybody now works with applications… and there are other generations that still have a hard time with all that.”
While some participants believe there are improvements in digital uptake among older users, others caution against complacency. This tension reflects the literature’s distinction between access and meaningful use—when possession of a device does not equate to confident, autonomous digital participation.
“Many older people already have and use applications now.”
“Yes, the digital divide is gradually decreasing.”
Furthermore, the digitalisation of transport systems brings about a new kind of infrastructural vulnerability for users who depend greatly on the use of their mobile phones. In case of any technological failure, those users who lack digital literacy skills have no other option, deepening rather than resolving transport inequity.
“But if your battery dies, then you’re left with nothing. That happened to me once with car-sharing: suddenly my phone battery died, and I had to figure things out another way.”
In another dimension, the Digital Twin is delayed and underutilized. Its integration into actual planning decisions remains limited, reducing its real-world impact on emissions and mobility patterns. Finally, digital investment has outpaced analogue basics. Pedestrian infrastructure, cycling facilities, bus stop shelters, and signage, which are the foundations that allow anyone to use sustainable transport without a smartphone, have not kept pace with the tech investments. The core risk is that Las Rozas is prioritizing technological sophistication over accessibility breadth, widening the gap between digitally capable and non-digitally capable residents rather than improving mobility for all.
Alverca do Ribatejo and Vila Franca de Xira municipalities in general sit at a considerably less advanced point on the digital mobility spectrum than Las Rozas. The main digital asset available to residents is the Navegante integrated fare card, introduced alongside the 2023 Carris Metropolitana reform [
42], which offers a single ticketing interface across rail, metro, and bus, as well as subsidized access for low-income households, elderly residents, students, and unemployed persons. In this respect, Navegante is arguably a more equity-conscious digital tool than the MaaS platforms emerging in wealthier suburban contexts, precisely because its design incorporates social inclusion from the outset.
Beyond Navegante, however, the digital transport offer in the municipality is thin. Real-time information displays are largely absent from bus stops across the case study, and based on the focus group insights, journey planning apps for local bus services are unreliable and poorly covered compared to equivalent rail tools. This creates an informational asymmetry that further advantages rail, already the most accessible option, while leaving local bus services, used disproportionately by elderly and lower-income residents in peripheral areas, with minimal digital support.
“The app works fine for the train. For the local bus it is always wrong, or it does not even show the route. It is like the bus does not exist digitally.”
The digital divide here is structurally deeper than in Las Rozas, shaped by the municipality’s lower median income, higher inequality, and older population, with nearly one in five residents aged 65 or over. Participants perceived that a significant share of the population, including older residents and first-generation immigrant communities, may have limited smartphone access and low digital literacy, meaning that app-based solutions risk being out of reach for the very people most dependent on public transport and with the fewest mobility alternatives. This is what might be described as a digital-mobility paradox: those least able to engage with digital tools have the greatest need for the improvements those tools are meant to deliver.
This risk of exclusion is compounded by the municipality’s reliance on metropolitan-level platforms that are designed for the broader Lisbon region rather than for the specific needs of peripheral suburban residents. While metropolitan integration brings genuine efficiency benefits, it increases the risk of local gaps being addressed through generic tools rather than tailored ones. Focus group participants consistently highlighted the absence of locally adapted digital information, particularly for short local trips and first-mile connections to rail stations, as an important unmet need, especially for elderly residents still adjusting to service changes following the 2023 Carris Metropolitana reorganization.
“Older people here rely on the bus entirely but they are also the ones least able to navigate uncertainty. If there is no information, they simply do not go out.”
An analysis of both case studies through the lens of digital equity shows a digital investment paradox: the richer and technologically developed municipality, Las Rozas, has a digital equity problem, as a result of the gap between advanced technology tools and digital capabilities of the most disadvantaged groups in the area; Alverca do Ribatejo, on the other hand, lacking in digital tools, has used an equity-driven tool (the Navegante social pass) and has shown results of enhanced accessibility for poorer and older users without being dependent on their digital skills. The above finding implies that digital equity in suburban mobility systems is not determined by the magnitude or level of technology use, but rather depends on the extent to which technology is designed for the purpose of enhancing accessibility.
The two case studies are distinguished by an underlying structure whereby the digital transport infrastructure has been better incorporated for longer metro distances, such as commuter rail applications, ticketing systems, and regional trip planners, rather than shorter-distance journeys, which, indeed, represent the exact kind of journey that can be done by foot or other transport modalities according to the principles of the 15minC. This gap between metropolitan digital integration and local digital accessibility constitutes a shared vulnerability that proximity planning frameworks must explicitly address if digital tools are to contribute to rather than undermine spatial equity in suburban contexts.
3.2.4. Participatory Equity Lens
Citizen participation in mobility planning in Las Rozas has been shaped primarily through conventional consultation mechanisms such as public exhibitions, statutory comment periods, and council deliberations [
35,
51]. This replicates at the participatory level the same patterns of digital exclusion seen in transport tool deployment, with participants considering that elderly residents, lower-income households, and those without higher education may be systematically underrepresented, and pointing out there is no structured mechanism for incorporating their perspectives into the SUMP’s strategic priorities.
“everything is QR, everything is QR. That’s great. But there are generations that still have a hard time with that”
The consequences for planning equity are significant. When participatory processes are dominated by technically proficient, car-owning, and digitally engaged stakeholders, the resulting policy priorities naturally reflect their preferences. In Las Rozas, this dynamic might reinforce a planning culture oriented toward technological innovation at the expense of the pedestrian infrastructure, local bus coverage, and cycling routes that would most benefit car-independent residents.
So, focus group discussions showed very limited attention to the specific barriers facing participatory equity. The expression about the need for safe school route initiatives stands as a partial exception, engaging parents, school communities, and children around the mobility needs of a specific underserved group. However, it could be an isolated case rather than a sign of an institutional commitment to equity-centred participation.
At the municipal level, participation in Alverca do Ribatejo relies on conventional methods, such as parish council forums, community surveys, public meetings, and statutory consultations without the digital participation infrastructure available in larger metropolitan municipalities. This limits reach and excludes residents unable or unwilling to attend in person, including working-age people with time pressures, homebound elderly individuals, and younger residents more accustomed to digital engagement. Municipal planning participants acknowledged that those who do engage in formal consultation processes tend to be older, more established community members.
The 2023 Carris Metropolitana reorganization [
42] serves as a particularly instructive case study in the equity consequences of inadequate participation. As the reorganization is designed primarily to improve network efficiency and reduce costs at the metropolitan level, it produced service changes that disadvantaged peripheral parts of Alverca, especially elderly residents reliant on local routes that were modified or cut. Focus group participants identified the absence of a robust local mechanism for communicating the specific accessibility impacts on vulnerable residents to metropolitan planners before implementation as a clear governance failure with direct equity consequences.
“Nobody asked us anything before they made the decision. We only found out when the service changed… and by then it was too late to say anything.”
“If there had been any real consultation, someone would have caught this. But consultation means actually listening, and that didn’t happen”.
“The younger, healthier people can just adapt. But the ones who really suffer are the elderly, the disabled and their voices never reach the planners.”
On balance, however, Alverca do Ribatejo’s participatory process showed a stronger and more consistent equity orientation than its Las Rozas counterpart. Participants repeatedly framed mobility challenges in terms of their differential impacts on specific population groups, reflecting the greater socioeconomic diversity of the municipal population, which makes the distributional consequences of transport policy more visible and politically salient. Finally, the tradition of community-based planning in Spanish and Portuguese municipal governance is present and strong; however, Madrid’s context reflected more technocratic planning culture.
Collectively, the findings serve to support the fundamental argument presented by Lucas et al. [
27] and Arnstein [
26] that genuine participatory equity in transport planning depends not only on the existence of participation tools, but also on the involvement of those citizens who are most affected by the current pattern of urban development and transport. It would be helpful for both case studies to establish strategies of reaching out to elderly citizens, people with disabilities, disadvantaged groups, and citizens from peripheral neighbourhoods—those segments of the population that need to be integrated into the vision of the 15minC the most.
To summarize the results from the four studied lenses,
Table 3 points out the equity evaluation besides the main message extracted among lenses in the case studies.
The comparative assessment across the four equity lenses reveals that, despite differences in governance, urban structure, and innovation capacity, both suburban case studies face persistent challenges in achieving equitable implementation of the 15-min city concept. Proximity equity remains constrained by the limited accessibility of peripheral neighbourhoods, particularly in Las Rozas, highlighting the influence of dispersed suburban development on service provision, confirming previous studies that identify dispersed suburban development and uneven land-use distribution as major barriers to achieving equitable proximity (e.g., [
5,
9]). Similarly, modal equity is the weakest-performing dimension in both municipalities. This finding is consistent with research demonstrating that accessibility continues to rely heavily on private vehicles and that sustainable transport alternatives remain insufficient to ensure equitable mobility [
62]. In contrast, the digital equity assessment supports recent arguments that successful digital transformation depends less on the level of technological innovation than on its inclusiveness and user-oriented design [
63], with Alverca achieving comparatively stronger social outcomes despite lower technological maturity. Finally, participatory equity emerged as a common weakness, as vulnerable and underrepresented groups remain insufficiently involved in planning and decision-making processes, despite its recognized importance for inclusive planning. All together, these findings suggest that advancing equitable proximity planning in suburban contexts requires an integrated approach that combines improvements in spatial accessibility and sustainable mobility with inclusive digital strategies and participatory governance, rather than focusing solely on the spatial distribution of services.
4. Discussion
Although the 15-min city concept was originally conceived for compact urban environments, its underlying objective (ensuring equitable access to essential daily services through sustainable mobility) is equally relevant to suburban territories. However, rather than replicating the compact urban model, recent research increasingly argues that proximity-based planning should be adapted to the specific spatial, functional and governance characteristics of suburban areas [
64,
65,
66]. European suburbs are particularly diverse, encompassing compact secondary centres, mixed-use neighbourhoods, historic settlements and transit-oriented developments alongside lower-density residential areas. Consequently, evaluating the applicability of proximity planning requires moving beyond simple density thresholds and considering how accessibility, mobility systems and governance interact to influence equitable outcomes.
The comparative assessment presented in this study demonstrates that implementing proximity-based planning in suburban environments requires addressing multiple interconnected dimensions of equity rather than focusing exclusively on the spatial distribution of services. Despite their different governance structures, socioeconomic conditions and urban development trajectories, Las Rozas and Alverca exhibit remarkably similar structural challenges, including uneven accessibility in peripheral neighbourhoods, persistent dependence on private vehicles, limited participation of vulnerable groups and contrasting levels of digital inclusion. These findings reinforce recent literature arguing that accessibility inequalities emerge from the interaction between urban form, transport provision, institutional capacity and governance rather than from any single planning dimension [
64,
65,
66].
According to Sennett [
67], the built environment is one thing; how people dwell in it is another. This perspective is particularly relevant in suburban contexts, where inequality cannot be understood solely as the uneven distribution of services but as the product of interactions between urban morphology, mobility opportunities and individual socioeconomic characteristics. Consequently, accessibility should be interpreted as a multidimensional concept that depends simultaneously on land-use patterns, transport performance, governance arrangements and the ability of different population groups to benefit from available opportunities.
4.1. Mobility
A comparative analysis of Las Rozas in Madrid and Alverca do Ribatejo reveals that car dependence is a structural feature of suburban environments, although it is shaped by different socioeconomic and territorial dynamics. In Las Rozas, dependence on private cars is closely linked to high purchasing power, low-density urban sprawl and cultural preferences that perceive public transport as less attractive. In contrast, in Alverca do Ribatejo, car dependency stems mainly from structural constraints, such as a fragmented urban layout, infrastructure barriers and a limited provision of services.
These findings are consistent with previous studies showing that suburban accessibility remains strongly conditioned by automobile availability and that lower-density environments frequently struggle to provide competitive public and active transport alternatives [
5,
68]. Similar conclusions have been reported in recent assessments of suburban proximity planning, which identify modal inequality as one of the principal barriers to achieving equitable accessibility outside compact urban centres [
64,
65,
66]. Our results further demonstrate that modal inequity is not solely determined by infrastructure provision but vary significantly according to individual socioeconomic conditions, spatial location and physical capabilities [
17,
18].
This results in a persistent ‘modal split’, in which accessibility by car far exceeds that offered by walking or public transport, disproportionately affecting vulnerable groups such as older people, young people, people with disabilities and low-income households. This dynamic contributes to forms of transport-related social exclusion, in which limited mobility reinforces broader socioeconomic disadvantages [
6].
Furthermore, certain policy measures aimed at improving sustainability can have unintended consequences that may generate new forms of inequity. For example, in Las Rozas, high-occupancy vehicle (HOV) lanes have improved bus service performance but have also encouraged continued car use through induced demand. Similarly, smart ticketing systems, whilst improving system efficiency, introduce risks of digital exclusion, particularly for populations with limited digital access or literacy [
25]. These findings suggest that sustainable mobility policies should be evaluated not only according to transport performance but also according to their distributive impacts across different population groups.
4.2. Spatial Configuration
The analysis confirms that urban morphology remains a fundamental determinant of accessibility and equity in suburban environments. Both municipalities are characterized by low-density, sprawling urban development, particularly in the most recently developed areas. This spatial configuration contributes to high infrastructure costs, inefficient service delivery and greater reliance on private cars. Similar observations have been reported in previous research, which concludes that suburban accessibility is shaped as much by urban structure as by transport provision itself [
64,
65].
Transport infrastructure illustrates this duality particularly well. While motorways and rail corridors act as key connectors at the metropolitan level, they simultaneously function as physical barriers at the local level, fragmenting the urban fabric and discouraging active modes of transport. These physical barriers disproportionately affect vulnerable users with lower mobility capacity, thereby amplifying existing inequalities in accessibility.
The findings, therefore, support recent literature arguing that the principles of the 15-min city should be adapted rather than directly transferred to suburban contexts. Unlike compact city centres, suburban municipalities require differentiated proximity strategies that acknowledge dispersed settlement patterns, multiple activity centres and metropolitan commuting dynamics. At the same time, the results highlight potential unintended consequences associated with proximity-based planning. If accessibility improvements are concentrated in already attractive neighbourhoods without complementary housing and social policies, increases in land values may contribute to residential displacement and new forms of spatial inequality [
69]. Spatial configuration must therefore be understood as a key determinant of accessibility and equity, which requires integrated planning approaches that combine considerations of land use, mobility and social policies [
10].
An important distinction between the two case studies concerns their land-use structure, which helps explain several of the observed differences in accessibility and equity. Las Rozas is predominantly characterized by low-density residential development with commercial activities concentrated in specific centres, generating longer travel distances for many daily activities and reinforcing dependence on private vehicles. In contrast, Alverca do Ribatejo retains a more heterogeneous urban structure, where residential areas coexist with industrial, commercial and employment functions. Although the presence of industrial land creates physical barriers and environmental constraints in some parts of the municipality, it also contributes to a greater spatial mix of activities and employment opportunities, reducing the need for longer metropolitan trips for certain population groups. These differences demonstrate that land-use composition is a critical determinant of proximity and accessibility, influencing not only travel behaviour but also the feasibility of implementing proximity-based planning strategies in suburban contexts.
4.3. Governance
Governance emerged as another critical dimension influencing equitable implementation of proximity-based planning. Both municipalities retain powers in the areas of urban planning and local mobility, but they remain heavily dependent on metropolitan and regional authorities for the provision and coordination of transport systems. This institutional framework creates a governance mismatch, which limits local capacity for policy innovation whilst reinforcing centre-periphery dynamics, in which development trajectories are largely determined by decisions taken at higher administrative levels [
58,
70].
Citizen participation processes further illustrate this challenge. In Las Rozas, participation mechanisms rely heavily on digital platforms, which tend to favour younger members of the population with greater digital literacy. In contrast, in Alverca do Ribatejo, traditional participatory formats, such as public meetings, often fail to engage the working-age population. In both cases, the limited inclusivity of participatory processes can lead to planning outcomes that do not sufficiently reflect the needs of groups with mobility difficulties. These observations are consistent with broader planning literature highlighting that participatory mechanisms often fail to adequately include populations most affected by accessibility inequalities [
28].
Encouragingly, initiatives of experimental governance tools, such as living labs, offer opportunities to address these shortcomings. Initiatives such as the Alverca do Ribatejo living lab demonstrate the potential of locally rooted experimentation, supported by data collection and citizen participation, to inform broader metropolitan policies and foster inter-municipal learning while supporting more adaptive and inclusive forms of metropolitan governance.
4.4. Methodological and Policy Implications
Beyond the empirical findings, this study contributes methodologically by demonstrating the value of integrating quantitative accessibility analysis with qualitative stakeholder assessment within a unified equity framework. This framework provides a more comprehensive understanding of how accessibility inequalities emerge in suburban environments. The combination of GIS-based accessibility analysis, SWOT assessment and stakeholder engagement enables both objective spatial evaluation and contextual interpretation of institutional and social factors influencing equitable accessibility. As such, the methodology represents a transferable framework that can support comparative analyses in other metropolitan and suburban contexts, provided that local spatial characteristics, governance structures and stakeholder composition are appropriately considered.
From a policy perspective, the findings indicate that successful implementation of proximity-based planning requires coordinated interventions across mobility, land use and governance. Reducing modal inequalities will require improvements to public transport quality, active mobility infrastructure and demand-management measures that discourage excessive car dependence while maintaining accessibility for vulnerable populations. This requires not only improvements in the coverage and frequency of public transport, but also the implementation of measures, such as dynamic pricing, stricter access criteria for priority lanes and the development of park-and-ride facilities. At the same time, digital mobility solutions must be complemented by non-digital alternatives to ensure inclusivity.
Land-use planning plays a key role in addressing the structural challenges of suburban areas. Policies should therefore promote urban densification, mixed-use development and tailored, proximity-based models that reflect suburban realities. These strategies must be accompanied by measures to prevent displacement, including affordable housing policies and specific mobility support [
1]. At the same time, priority should be given to adapting existing infrastructure through the introduction of pedestrian crossings, cycle networks and green infrastructure, to mitigate fragmentation and improve local accessibility [
8].
At the institutional level, governance mechanisms need to be significantly strengthened to ensure effective coordination between the local and metropolitan levels. This involves enhancing multi-level governance mechanisms, improving fiscal redistribution and strengthening the role of outlying municipalities in decision-making processes. At the same time, participation frameworks must be restructured to allow for the effective inclusion of groups with mobility difficulties, going beyond merely symbolic or exclusively digital approaches [
63].
Changes in suburban transport must be understood within a regulatory framework centred on equity and justice. As highlighted by ETI Urban Mobility (2025) [
48], placing justice at the heart of planning is essential to achieving transport systems that are not only efficient and decarbonised, but also socially inclusive and territorially balanced.
5. Conclusions
A comparative assessment of two European suburban case studies (Las Rozas de Madrid and Alverca do Ribatejo (Vila Franca de Xira)) reveals both the potential and the structural limits of the 15minC framework as an instrument of equitable suburban mobility. Despite representing contrasting suburban typologies, both municipalities share persistent structural challenges: low-density urban sprawl, high car dependency, and accessibility deficits that bear disproportionately on the most vulnerable population groups.
Modal equity analysis demonstrates that those without access to a private vehicle (i.e., elderly individuals, low-income families, young people, and individuals with disabilities) face systematic accessibility disadvantages across all key service categories. Modal gaps of 40–60 percentage points between walking and car-based reach confirm that existing public transport networks do not adequately compensate for the absence of private motorization. This finding underscores that car dependency in these contexts is a structural condition embedded in spatial organization and governance legacies, not a freely chosen behavioural preference.
Digital equity analysis reveals a further paradox: in Las Rozas, greater technological investment has widened rather than narrowed the gap between digitally capable and non-digitally capable residents, as analogue mobility foundations (e.g., pedestrian infrastructure, bus stop provision, legible signage) have not kept pace with smart city ambitions. In Alverca, the equity-by-design logic of the Navegante social fare card demonstrates that inclusive outcomes depend less on the sophistication of digital tools than on whether their design explicitly centres accessibility for the most mobility-dependent users.
Participatory equity remains the least developed dimension in both contexts. Consultation mechanisms in Las Rozas skew toward technically proficient and digitally active stakeholders, while Alverca’s reliance on conventional in-person formats excludes working-age and younger residents. In both cases, the populations whose mobility needs are most acute (i.e., peripheral residents, elderly individuals, lower-income households) are systematically underrepresented in the processes that determine planning priorities. The 2023 Carris Metropolitana reorganization illustrates the concrete equity costs of this deficit, producing service changes that disadvantaged the very groups absent from the decision-making process.
Taken together, these findings support a central argument: the 15minC cannot deliver equitable outcomes in suburban peripheries through proximity planning alone. Spatial equity must function as a foundational organizing principle rather than a secondary consideration, demanding redistributive transport investment in underserved zones, land-use policies that prevent gentrification-driven displacement, hybrid digital–analogue service design, and participatory frameworks that actively reach mobility-disadvantaged groups.
Beyond the findings of the two case studies, the proposed methodological framework demonstrates considerable potential for application in other suburban and metropolitan contexts. Local municipalities, metropolitan planning authorities, public transport agencies, and policymakers can apply the framework to evaluate the equity implications of proximity-based planning, identify underserved populations and neighbourhoods, and prioritize investments that improve accessibility through sustainable and inclusive mobility. The integration of GIS-based accessibility analysis, comparative SWOT assessment, and an equity-centred evaluation framework provides a systematic approach for assessing the implementation of proximity-based planning while explicitly considering social equity. The four equity lenses also offer a flexible analytical framework that can be expanded or refined to reflect local planning priorities and governance structures.
This integrated perspective extends existing approaches to evaluating the 15-min city by moving beyond purely spatial indicators and placing equity at the centre of suburban planning assessment. Nevertheless, the transferability of the methodology should be considered alongside several constrains. Differences in data availability, spatial resolution, transport network quality, and governance arrangements may influence the level of detail and comparability that can be achieved across study areas. Similarly, local interpretations of the 15-min city concept and variations in planning objectives may require context-specific adaptation of the selected indicators.
This study is subject to limitations. The focus group evidence reflects invited stakeholder panels rather than representative population samples. Future studies should include all population groups in their analysis. Isochrone-based accessibility analysis approximates rather than measures individual travel behaviour. Future research should integrate longitudinal equity indicators, revealed mobility data, and participatory action research methodologies capable of more directly centering the voices of transport-disadvantaged residents. Extending the comparative framework to Northern and Eastern European suburban contexts would further test the transferability of these findings. The 15minC remains a valuable conceptual instrument, but its transformative potential in peripheral suburban settings depends on the institutional commitment to make spatial equity its operational foundation.




 ,
,