Article

Concurrent Assessment of Land-Use Transition and Industrial Spatial Redistribution in an Airport Economic Zone Using Multi-Source Remote Sensing and Geospatial Data

1
College of Geoscience and Surveying Engineering, China University of Mining & Technology, Beijing 100083, China
2
China-Mozambique Belt and Road Joint Laboratory on Smart Agriculture, Zhejiang Normal University, Jinhua 321004, China
3
School of Cyber Science and Engineering, Ningbo University of Technology, Ningbo 315211, China
4
Faculty of Agronomy and Forest Engineering, Eduardo Mondlane University, Maputo 257, Mozambique
*
Author to whom correspondence should be addressed.
Land 2026, 15(7), 1214; https://doi.org/10.3390/land15071214
Submission received: 25 May 2026 / Revised: 1 July 2026 / Accepted: 2 July 2026 / Published: 7 July 2026

Abstract

The rapid development of airport economic zones has significantly reshaped regional land-use structures and industrial spatial organization. Taking the Nanjing Airport Economic Zone as the study area, this study integrates multi-source geospatial data, including land-use data, enterprise registration records, Points of Interest (POIs), transportation networks, nighttime light intensity, population, topography, and ecological-environmental variables for 2013, 2018, and 2023. Land-use transition matrices, spatial autocorrelation analysis, standard deviation ellipse analysis, Geodetector, and Multiscale Geographically Weighted Regression (MGWR) models were employed to examine land-use transition, industrial spatial restructuring, and their influencing factors from 2013 to 2023. The results show that: (1) Land-use change in the study area was mainly characterized by the decline of cropland, the expansion of impervious surfaces, and the shrinkage of water bodies. From 2013 to 2023, cropland decreased from 81.07 km2 to 70.12 km2, impervious surfaces increased from 10.98 km2 to 25.65 km2, and water bodies decreased from 5.50 km2 to 1.79 km2. The conversion from cropland to impervious surfaces was the dominant transition pathway, covering 14.67 km2. (2) Industrial space exhibited significant spatial clustering, with a Moran’s I value of 0.9639 in 2023. The standard deviation ellipse results indicate that industrial space expanded during 2013–2018 and contracted during 2018–2023, suggesting a shift from extensive outward expansion to relative agglomeration around the core area and major transport corridors. (3) Nighttime light intensity and distance to major transport access points were important explanatory factors for industrial spatial distribution, with q-values of 0.396 and 0.310, respectively. The interaction between slope and metro accessibility showed the strongest explanatory power, with a q-value of 0.6967. The MGWR results further revealed the spatial heterogeneity of the effects of transportation, economic activity, population concentration, and ecological constraints. Overall, land-use transition and industrial spatial restructuring in the Nanjing Airport Economic Zone were jointly shaped by transportation accessibility, economic vitality, population agglomeration, and ecological constraints. These findings provide a reference for land-use optimization and industrial spatial governance in airport economic zones.

1. Introduction

Land-use transition is an important manifestation of human activities reshaping surface spatial structures, resource allocation patterns, and ecological processes. In recent years, with the rapid development of the aviation economy, airport economic zones (AEZs) have gradually become important carriers of urban spatial expansion, industrial agglomeration, and regional coordinated development [1]. Relying on airport hubs, integrated transportation networks, and airport-oriented industrial systems, AEZs promote the agglomeration of logistics, manufacturing, business services, and related industries around airports, while also profoundly affecting regional land-use structures, industrial spatial organization, and ecological-environmental patterns [2,3]. In China, with the development of airport economy demonstration zones and the advancement of regional integration strategies, airport economic zones in hub cities such as Nanjing, Guangzhou, Shanghai, and Zhengzhou have become key areas for industrial upgrading, spatial restructuring, and regional linkage [4,5]. However, while airport-oriented development improves transportation accessibility and economic vitality, it may also lead to ecological and environmental pressures, such as cropland loss, construction land expansion, and the shrinkage of water bodies and green spaces. Therefore, systematically identifying the characteristics of land-use transition and industrial spatial restructuring in AEZs is of great significance for understanding the spatial effects of airport-led regional development, optimizing land resource allocation, and promoting sustainable spatial governance.
Existing studies have advanced research on the spatial evolution of airport economic zones mainly from the perspectives of spatial structure identification, industrial agglomeration mechanisms, and the application of multi-source spatial data. In terms of spatial structure, Freestone and Baker, based on the planning model of airport-driven urban development, suggested that airport-adjacent areas usually exhibit a composite spatial structure consisting of an airport core, transport corridors, and peripheral functional zones [6]. Bai and Feng, taking the Zhengzhou Airport Economic Zone as an example, further revealed the joint effects of airport functions, industrial layout, and transportation networks on spatial structure evolution [7]. Regarding industrial agglomeration and firm location choice, Jiang et al. showed, based on the Shanghai Hongqiao International Airport Economic Zone, that airport proximity, transportation accessibility, and urban functional linkages are important factors influencing the agglomeration of business service firms [8]. Wang et al., from the perspective of government–enterprise interaction, argued that policy guidance, firm behavior, and spatial resource allocation jointly affect the optimization of industrial layouts in airport economic zones [9]. Overall, industries that are highly dependent on air transportation and time-sensitive connections tend to cluster in the airport core, whereas manufacturing, logistics, and general service industries may expand outward along expressways, rail transit, and urban transport corridors. With the increasing use of multi-source geospatial data, such as remote-sensing land-use data, POIs, enterprise registration information, nighttime lights, road networks, and population grids, research on airport economic zones has gradually shifted from macro-level planning descriptions to refined spatial analysis. For example, Nie et al. revealed the impacts of airport-oriented development on regional ecological functions from the perspective of changes in ecosystem service value, and related studies on land-use optimization have also emphasized the coordination between industrial layout and land resource allocation [10].
Although existing studies provide an important foundation for understanding the spatial evolution of airport economic zones, several gaps remain. First, land-use transition and industrial functional restructuring are often discussed separately, and the relationship between them has not been sufficiently characterized [5,6]. Second, some studies still rely mainly on macro-level statistical data or a single spatial data source, with insufficient integration of remote-sensing land-use data, enterprise registration information, POIs, transportation networks, and socioeconomic indicators [11,12]. Third, analyses of influencing factors often remain at the global scale, with limited attention to the spatial differences in the effects of various factors across airport core areas, transport corridors, and peripheral ecological constraint zones [13,14]. Therefore, it is necessary to construct an integrated framework that combines land-use change detection, industrial spatial pattern characterization, and multi-scale influencing-factor analysis to reveal the spatial restructuring process of the land–industry–transportation–ecology system in airport economic zones.
The Nanjing Airport Economic Zone provides a representative case for this research. On the one hand, the region is located at an important node of the integrated transportation network in the Yangtze River Delta. Centered on Nanjing Lukou International Airport, it has developed composite functions including aviation logistics, airport-oriented manufacturing, modern services, and an integrated transportation hub, reflecting the spatial organization characteristics of airport economic zones under regional coordinated development [15]. On the other hand, from 2013 to 2023, the region experienced construction land expansion, transportation infrastructure improvement, industrial functional agglomeration, and ecological space adjustment, making land-use transition and industrial spatial restructuring particularly evident. In addition, the study area has a clearly defined boundary and good availability of multi-source data, including land-use data, enterprise registration information, POIs, road networks, nighttime lights, population, topography, and ecological-environmental variables, making it suitable for an integrated spatial analysis of the land–industry–transportation–ecology system [16].
Based on this context, this study takes the Nanjing Airport Economic Zone (NAEZ) as the study area and integrates multi-source geospatial data, including land-use data, enterprise registration information, POIs, road networks, nighttime lights, population distribution, topographic conditions, and ecological-environmental variables, to systematically analyze land-use transition, industrial spatial restructuring, and their potential influencing factors from 2013 to 2023. While previous work has separately documented land conversion and industrial dynamics in airport economic zones, studies that concurrently assess both processes within a unified spatial framework at the intra-metropolitan scale remain scarce. The present study addresses this gap by providing a joint spatial assessment of land-use transition and industrial spatial redistribution in the Nanjing Airport Economic Zone, without inferring direct causality between the two. The objectives are to (1) quantify land-use structural change and identify major conversion pathways from 2013 to 2023; (2) characterize the spatial patterns of industrial redistribution using enterprise density and spatial metrics; and (3) identify factors associated with the spatial heterogeneity of industrial distribution. How did the land-use structure of the NAEZ change from 2013 to 2023, and what were the main conversion pathways? Did industrial functional space show significant agglomeration, expansion, or directional migration? What relationships exist between economic vitality, transportation accessibility, natural ecological constraints, and industrial spatial restructuring, and do the strength and direction of these effects vary spatially?

2. Study Area and Data Preprocessing

2.1. Overview of the Study Area

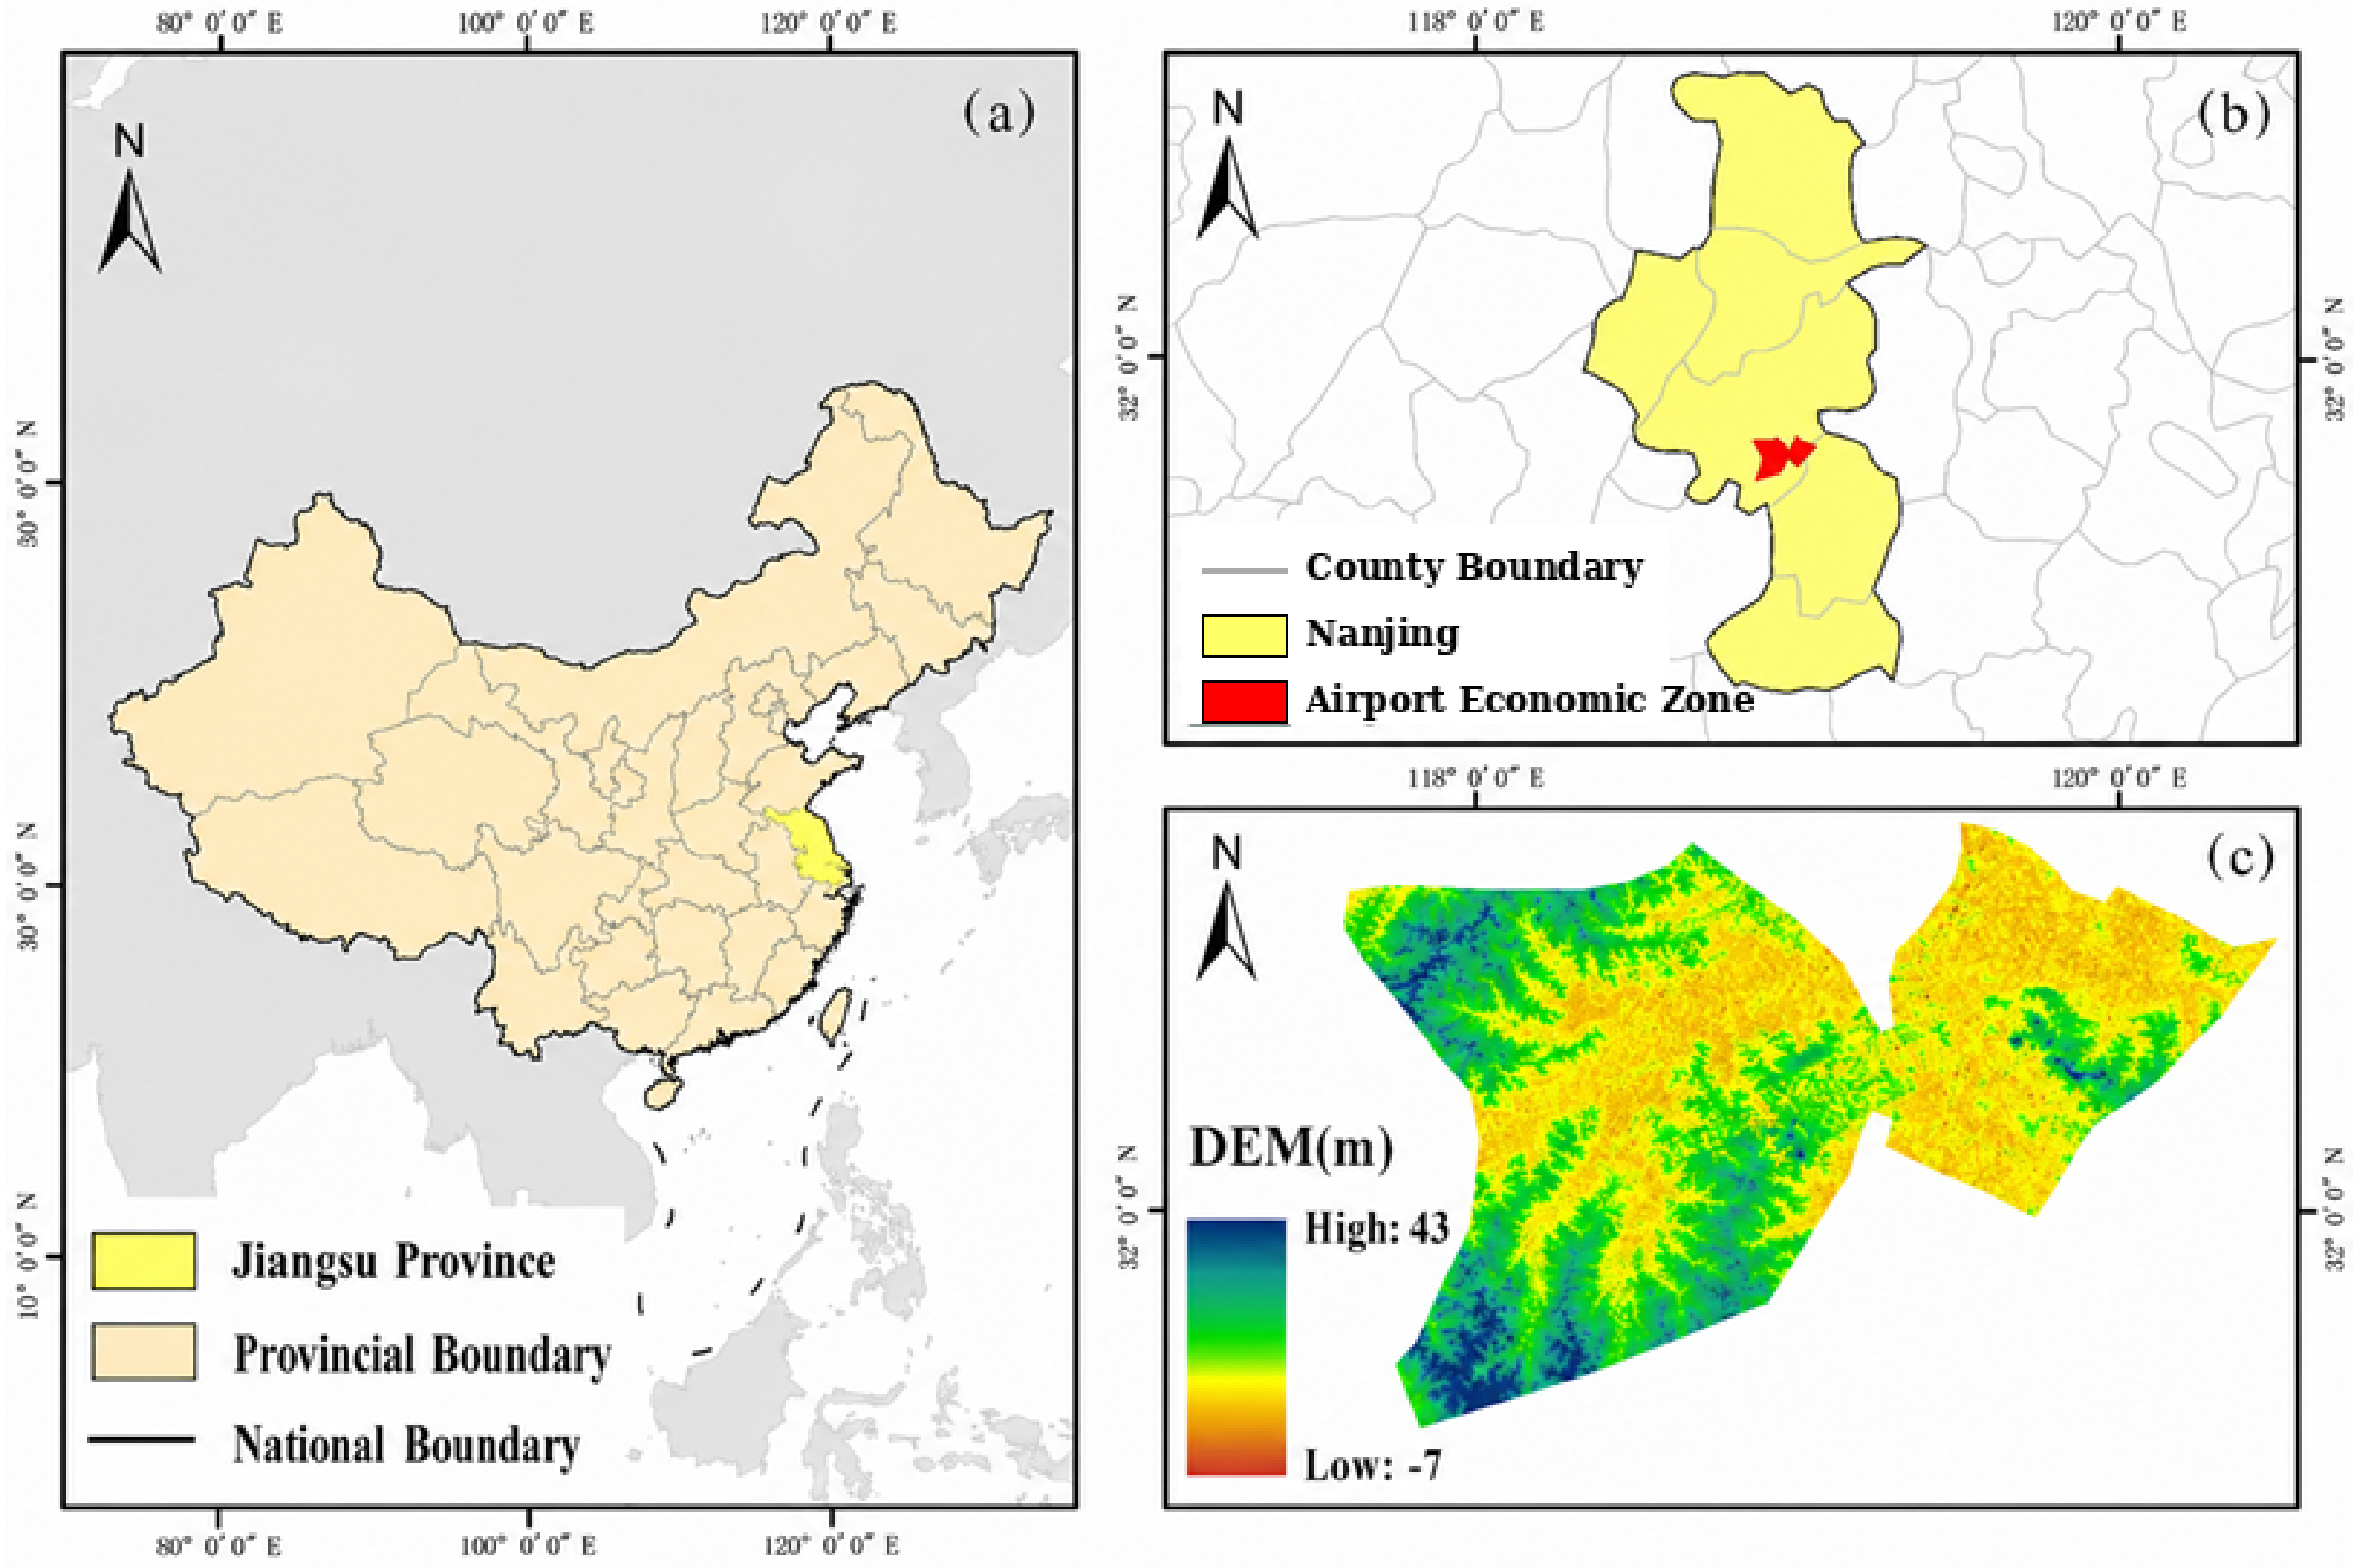
Nanjing Airport Economic Zone (NAEZ) is located in southern Nanjing and serves as an important area for the agglomeration of airport-oriented industries and integrated transportation functions around Nanjing Lukou International Airport. Centered on Nanjing Lukou International Airport, the study area has formed a spatial structure characterized by “one core, three corridors, and four clusters.” Its planned area extends eastward to Hengxi Subdistrict in Jiangning District, westward to Zhetang Subdistrict in Lishui District, and northward to the Lishui Economic Development Zone, covering a total area of approximately 98.4 km2 (Figure 1).
In terms of locational conditions, the NAEZ is situated at an important node of the integrated transportation network in the Yangtze River Delta. Supported by the airport, expressways, rail transit, and urban arterial roads, the area has strong regional connectivity and capacity for factor circulation. As an important component of the world-class airport cluster in the Yangtze River Delta, the NAEZ integrates functions such as air–rail intermodal transport, aviation logistics, airport-oriented manufacturing, and modern services, making it a key space for industrial organization and spatial development in southern Nanjing [17].
From the perspective of its development process, the NAEZ has gradually formed an industrial system dominated by aviation-related manufacturing, modern logistics, and high-end services under the background of regional integration strategies and the development of airport economy demonstration zones. Meanwhile, industrial agglomeration, transportation infrastructure construction, and the expansion of construction land have continuously reshaped the regional land-use structure, making the relationship between ecological spaces, such as cropland, water bodies, and green spaces, and industrial development spaces increasingly complex [18]. Therefore, the NAEZ exhibits clear characteristics of land-use transition and industrial spatial restructuring, providing a representative case for analyzing the spatial evolution of airport economic zones and their influencing factors.

2.2. Data Sources and Index System

To analyze land-use transition, industrial spatial restructuring, and their influencing factors in the Nanjing Airport Economic Zone, this study constructed a multi-source geospatial dataset for three time points: 2013, 2018, and 2023. According to their analytical purposes, the datasets were classified into four categories: land-use and ecological-environmental data, enterprise and POI data, transportation and locational data, and socioeconomic and natural-constraint data. The indicator system and data sources for spatial evolution and influencing factors are shown in Table 1.
Land-use and ecological-environmental data were mainly used to characterize changes in land-use structure and ecological space. The land-use data were obtained from the 30 m land-use product of Wuhan University and included cropland, woodland, grassland, water bodies, bare land, and impervious surfaces. These data were used to calculate changes in land-use area, the dynamic degree of land-use change, and land-use transition matrices. Water-system and green-space data were derived from the National Platform for Common Geospatial Information Services and land-use extraction results, and were used to represent water-body proximity, green-space density, and ecological spatial constraints.
Enterprise and POI data were mainly used to identify the spatial distribution and evolution of industrial functions. Enterprise registration information was collected from the Aiqicha platform using Python (3.7.6) web scraping, including enterprise name, registered address, registration time, operating status, industry category, and business scope. POI data were obtained from OpenStreetMap and the Gaode Map API to supplement the identification of industrial, commercial, and service functional spaces. After address geocoding, spatial filtering, and industrial functional classification, enterprise and POI data were aggregated into a unified spatial grid to calculate indicators such as enterprise density, POI density, the number of industrial types, and the proportion of industrial types.
Transportation and locational data were used to characterize transportation accessibility and locational conditions in the study area. Airport location, metro stations, major transport access points, and road network data were obtained from the Gaode Map API, OpenStreetMap, and related basic geospatial datasets. Based on these data, Euclidean distance was used to calculate distances to the airport, metro stations, and major transport access points, while line density analysis was used to calculate road network density, thereby representing the influence of airport hubs, rail transit, and road networks on industrial spatial layout.
Socioeconomic and natural-constraint data were used to explain the external environmental conditions of industrial spatial patterns. Nighttime light data were used to represent economic vitality and development intensity, while population grid data were used to characterize population concentration and potential market demand. DEM data were obtained from the National Platform for Common Geospatial Information Services and used to describe topographic conditions and constraints on construction and development. Together with transportation, locational, and ecological-environmental variables, these indicators formed the explanatory variable system for the subsequent Geodetector and MGWR analyses.
To ensure the comparability of multi-source datasets, all data were transformed into the WGS_1984_UTM_Zone_50N coordinate system and clipped to the boundary of the study area. For datasets with different spatial resolutions, resampling, spatial joining, grid-based statistics, or area-proportion calculation was used to unify them into the same spatial analytical units, ultimately forming a gridded database. The time-series data for 2013, 2018, and 2023 were mainly used to characterize land-use transition and the evolution of industrial spatial patterns. In the influencing-factor analysis, enterprise density in 2023 at the grid-cell level was used as the dependent variable Y to represent the intensity of industrial spatial distribution, while locational, transportation, economic, population, topographic, and ecological-environmental variables were selected as explanatory variables to examine the main influencing factors and spatial heterogeneity of the current industrial spatial pattern.

2.3. Data Preprocessing and Integration

Enterprise registration records for the Nanjing metropolitan area were initially collected from the Aiqicha platform using Python web scraping, yielding approximately 498,000 raw records. After removing duplicate entries, filtering out enterprises with invalid operating status (e.g., canceled or revoked registration), and excluding records with missing or un-geocodable addresses, a total of [X] records for 2013, [Y] for 2018, and [Z] for 2023 were retained within the study area boundary. These figures represent a substantial reduction from the raw dataset and reflect the strict spatial and temporal filtering necessary for a focused analysis of the Nanjing Airport Economic Zone. To ensure the comparability of multi-source data in terms of temporal, spatial, and attribute characteristics, this study conducted unified preprocessing of land-use data, enterprise registration information, POIs, transportation and locational data, socioeconomic data, and natural-ecological data, and integrated them into the same spatial analysis units.
First, enterprise registration information was cleaned and filtered. The original enterprise data were collected from the Aiqicha platform using Python web scraping and included fields such as enterprise name, registered address, registration time, operating status, industry category, and business scope. To ensure consistency with the study period, enterprise records corresponding to 2013, 2018, and 2023 were selected for analysis. During data cleaning, duplicate records, records with missing registered addresses or failed geocoding, records located outside the study area, and enterprises with invalid operating status, such as canceled or revoked registration, were removed. Finally, enterprise samples with valid operating status and registered addresses within the NAEZ were retained.
Second, enterprise and POI data were spatialized and classified. Enterprise registered addresses were geocoded using the Gaode Map API to obtain point coordinates. POI data were filtered according to their type fields to supplement the identification of industrial, commercial, and service functional spaces. All point data were transformed into the WGS_1984_UTM_Zone_50N coordinate system and spatially overlaid with the study area boundary to remove samples outside the boundary. Industrial functional classification was mainly based on enterprise industry categories, business-scope keywords, and POI type fields, while also considering the industrial characteristics of airport economic zones.
Third, unified spatial analysis units were constructed. The study area was divided into regular grids, and enterprise and POI points were aggregated into each grid cell through spatial joining. Indicators such as enterprise density, POI density, the number of industrial types, and the proportion of industrial types were then calculated. Among them, enterprise density at the grid-cell level in 2023 was used as the dependent variable Y to represent the intensity of industrial spatial distribution in the Geodetector and MGWR analyses. Enterprise and POI data for 2013, 2018, and 2023 were used to characterize the staged evolution of industrial spatial patterns.
Finally, spatial alignment was conducted for data from different sources and with different resolutions. Land-use data, nighttime light data, population grids, slope, water systems, green spaces, and road networks were clipped to the study area and unified into the model analysis grid. Continuous raster variables were processed using resampling and grid-based mean statistics, categorical variables were processed using reclassification and dominant-area statistics, and vector variables were extracted into grid cells using Euclidean distance, line density analysis, or area-proportion methods. Through these procedures, a gridded database containing the dependent variable Y and various explanatory variables was established, providing the data basis for land-use transition analysis, industrial spatial pattern identification, Geodetector analysis, and MGWR modeling. The explanatory variables were selected through a combination of theory-driven and empirical approaches. Aerotropolis planning theory and industrial location theory guided the initial choice, supplemented by a review of empirical studies on Chinese airport economic zones. Data availability at the required spatial resolution then determined the final set of nine indicators. The expected directions of their associations with enterprise density are as follows. Distance to the airport (B1) is expected to be negative, as aviation-dependent firms tend to cluster around airports to minimize transport time and logistics costs. Distance to metro stations (B2) is expected to be negative, especially for service-oriented sectors, because metro accessibility facilitates labor pooling and customer access. Population density (B3) is expected to be positive, representing labor supply and market demand; however, it may be simultaneously determined with enterprise location, and its potential endogeneity is acknowledged. Nighttime light intensity (B4) serves as a proxy for economic vitality and is expected to be positive, though it may also be endogenous with enterprise density. Road network density (B5) is expected to be positive, as a denser road network reduces transport costs. Distance to major transport access points (B6) is expected to be negative, reflecting the locational advantage of proximity to highway interchanges. Slope (B7), based on land-suitability theory, is expected to have a negligible or negative effect because steeper terrain increases construction costs. The expected signs for distance to water systems (B8) and green space density (B9) are ambiguous; both factors may act as ecological constraints that deter development, or as environmental amenities that attract certain types of firms. All of the above expectations should be regarded as exploratory, and the resulting coefficients are interpreted as descriptive spatial associations rather than causal effects.

3. Methods

3.1. Research Framework

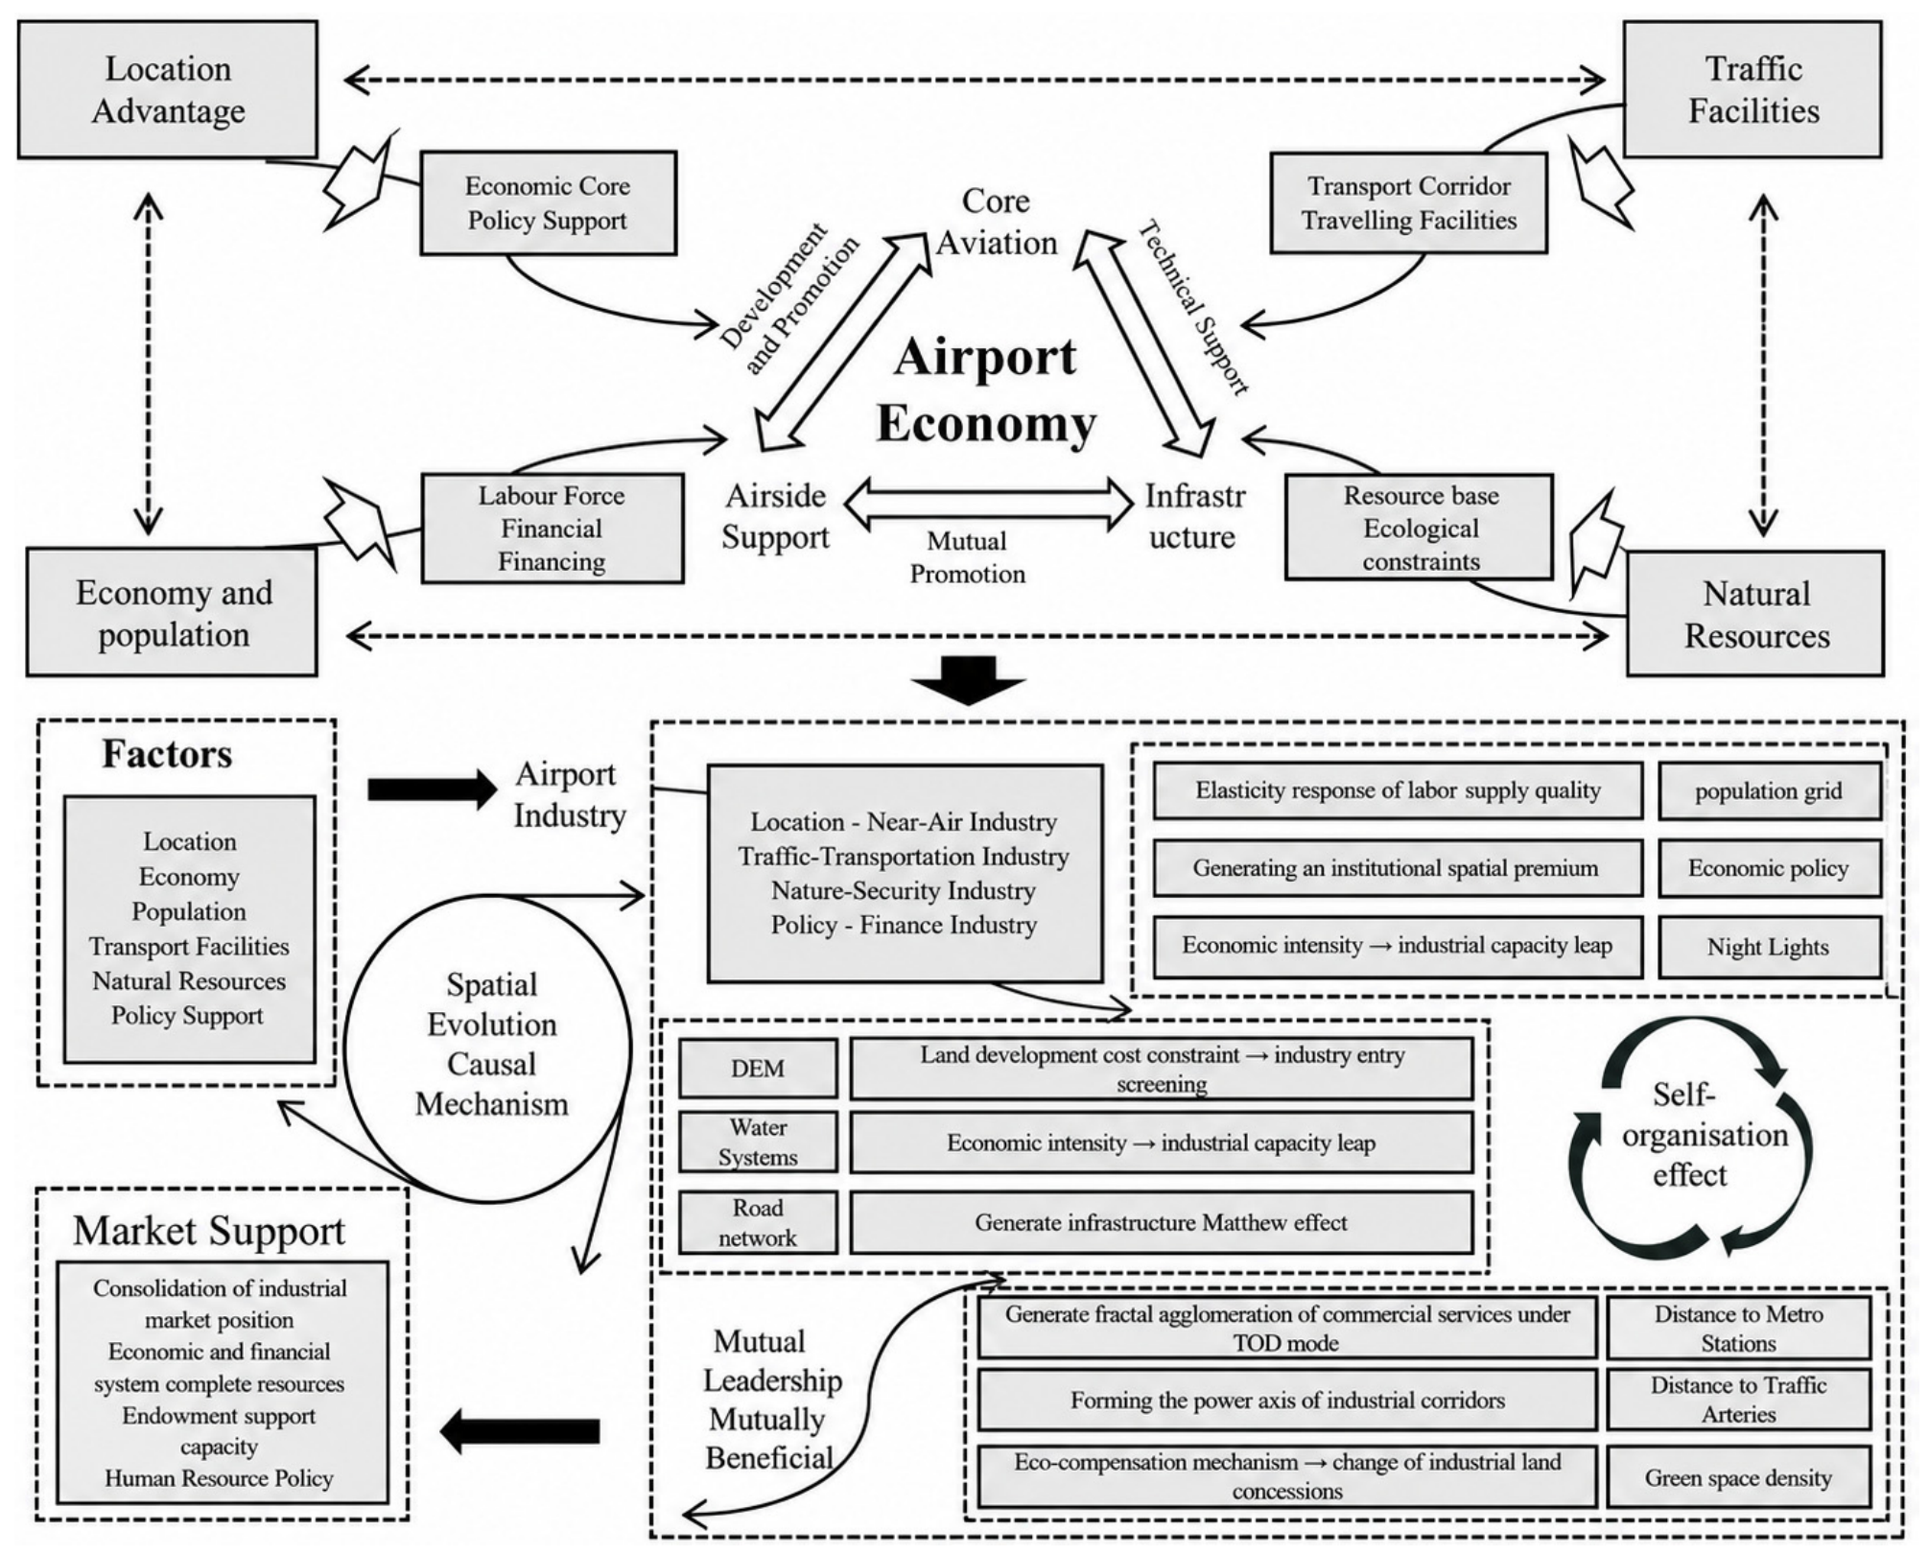
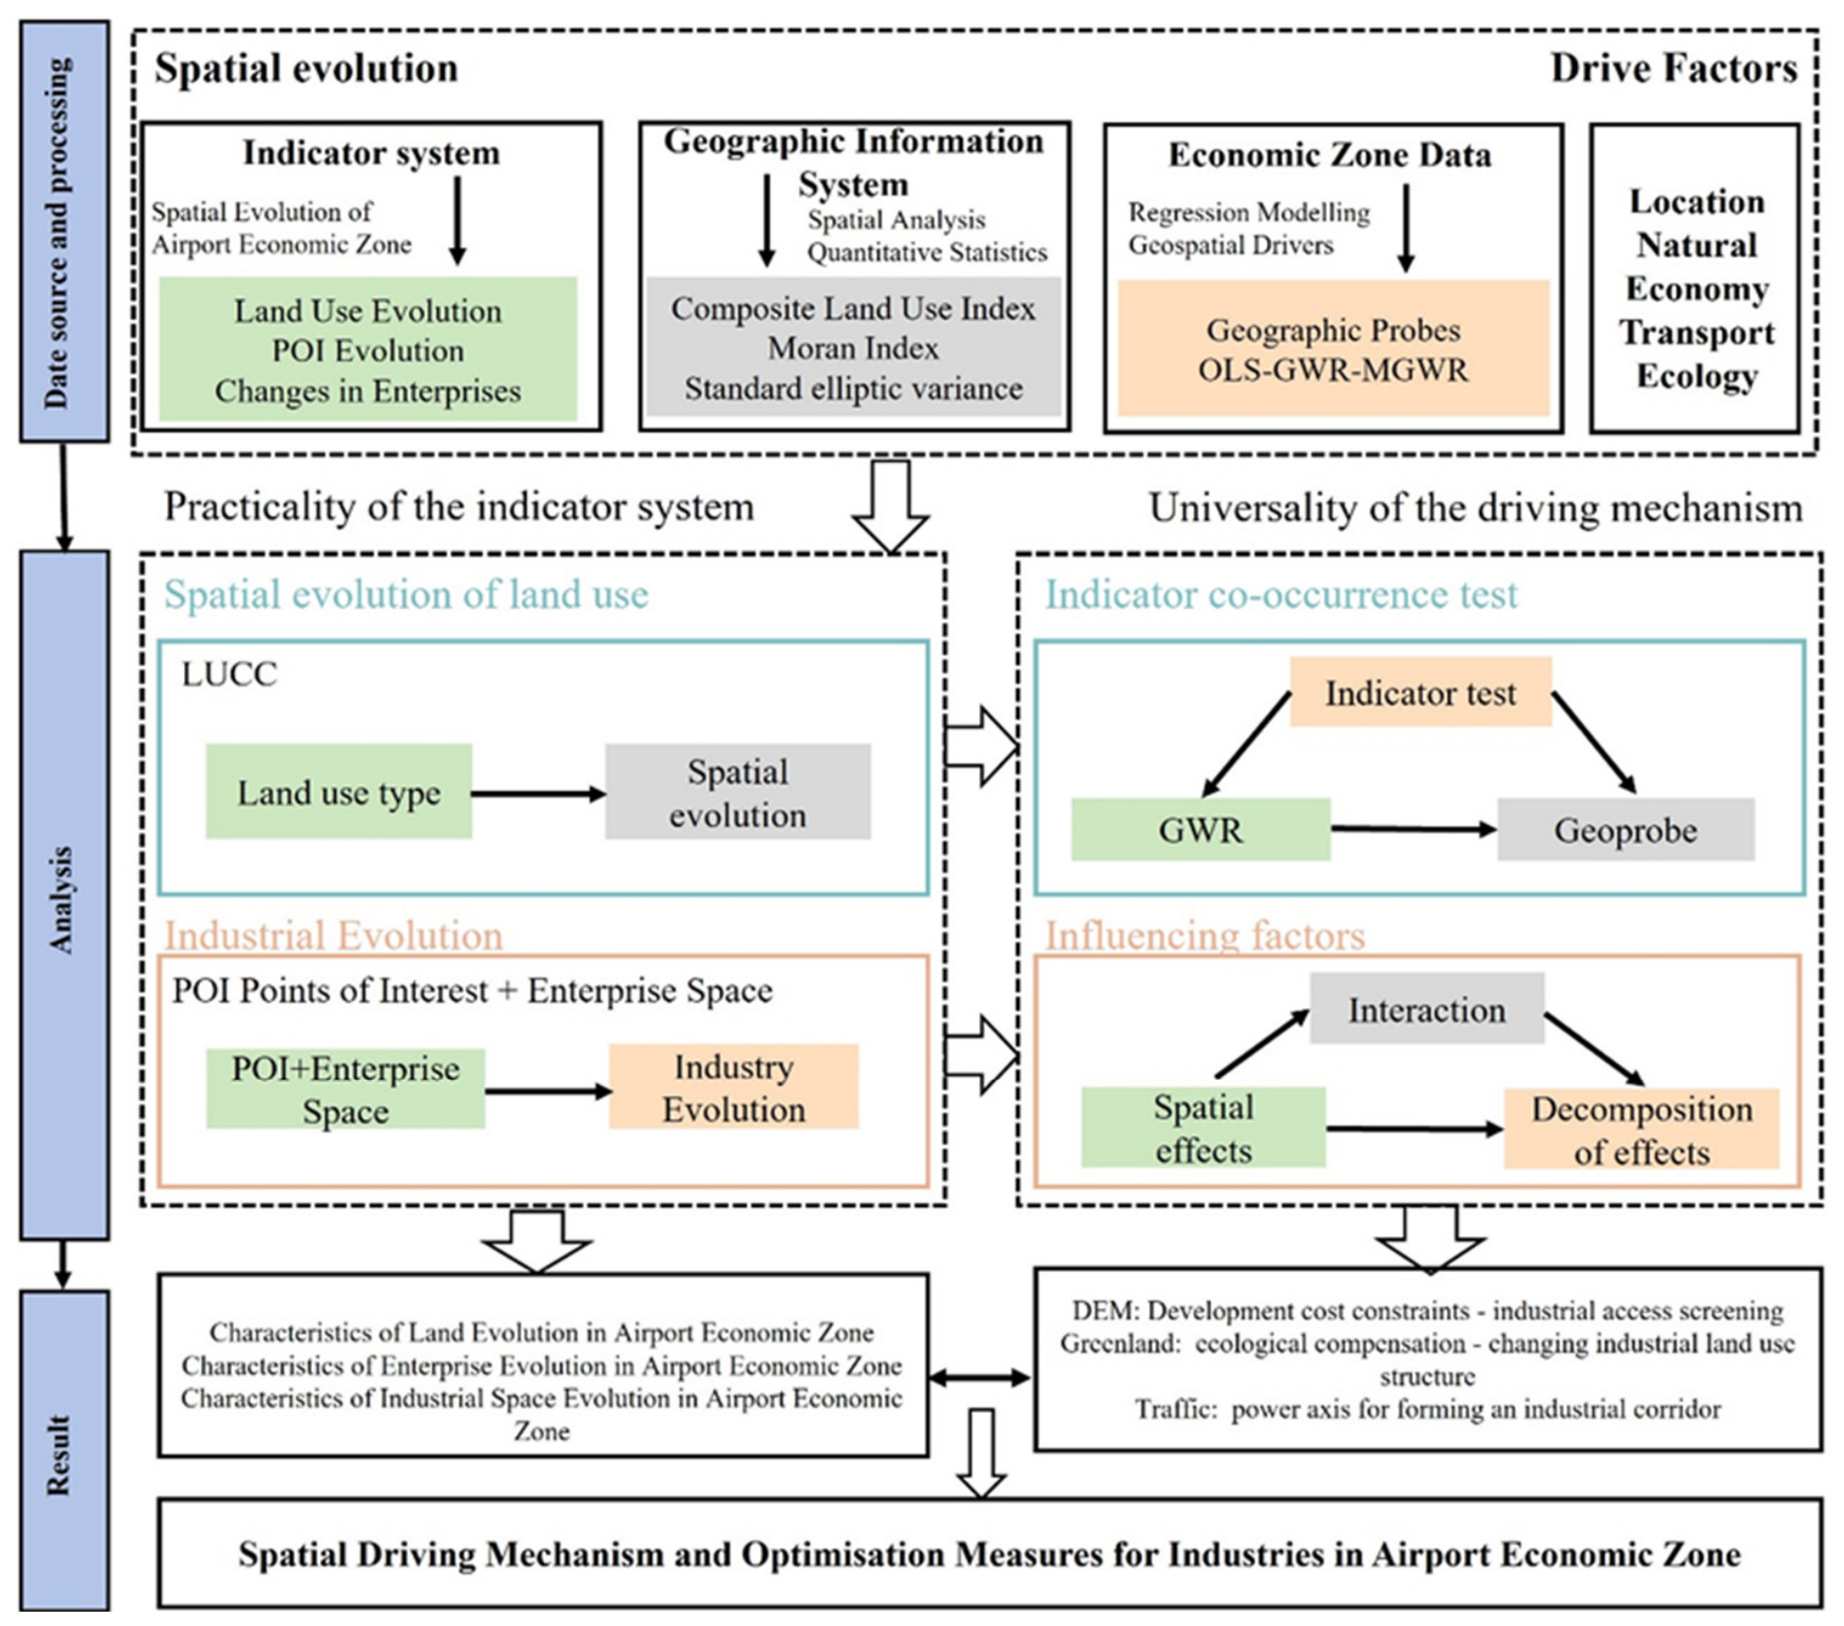
This study constructed an integrated research framework that combines land-use change identification, industrial spatial pattern characterization, and influencing-factor analysis, as shown in Figure 2. Based on multi-source geospatial data, including land-use data, enterprise registration information, POIs, transportation networks, nighttime light intensity, population, slope, water systems, and green spaces for 2013, 2018, and 2023, this study analyzed land-use transition, industrial spatial restructuring, and their potential influencing factors in the Nanjing Airport Economic Zone.
The research framework consists of three stages. First, based on land-use data, the dynamic degree of land-use change and land-use transition matrix were used to quantify changes in land-use structure and identify major conversion pathways across different years, including impervious surface expansion, cropland loss, and changes in ecological space. Second, based on enterprise registration information and POI data, kernel density estimation, spatial autocorrelation analysis, and standard deviation ellipse analysis were applied to characterize industrial spatial agglomeration, expansion, contraction, and directional migration. Third, using enterprise density at the grid-cell level in 2023 as the dependent variable Y to represent the intensity of industrial spatial distribution, explanatory variables related to transportation and location, socioeconomic conditions, and natural-ecological factors were selected. Geodetector, OLS, GWR, and MGWR models were then employed to identify the main explanatory factors of industrial spatial distribution and reveal their spatial heterogeneity. Based on these empirical results, planning recommendations for industrial spatial optimization and coordinated land-use development in the Nanjing Airport Economic Zone were proposed.

3.2. Research Methods

3.2.1. Measurement of Land-Use Transition

Measurement of land-use transition was used to answer how the land-use structure of the Nanjing Airport Economic Zone changed from 2013 to 2023 and how the main land-use types were converted. Based on land-use data for 2013, 2018, and 2023, this study calculated the areas of cropland, woodland, grassland, water bodies, bare land, and impervious surfaces. The dynamic degree of land-use change and land-use transition matrix were then used to analyze the intensity, direction, and major pathways of land-use change.
(1)
Dynamic degree of land-use change
The dynamic degree of land-use change was used to characterize the rate of change in a specific land-use type during a given period [19]. It reflects differences in the intensity of change among different land-use types. The formula is as follows:
K = U b U a U a × 1 T × 100 %
where K is the dynamic degree of a specific land-use type; U a and U b represent the area of that land-use type at the beginning and end of the study period, respectively; and T is the length of the study period. This indicator was mainly used to quantify the rate and intensity of area change for different land-use types.
(2)
Land-use transition matrix
The land-use transition matrix was used to describe the transfer-in and transfer-out relationships among land-use types in different periods [20]. It can reveal the conversion direction and scale among land-use types such as cropland, water bodies, woodland, and impervious surfaces. The expression is as follows:
S = ( S i j ) n × n ,               i , j = 1,2 , , n
where S i j represents the area converted from land-use type i at the initial stage to land-use type j at the final stage, and n is the number of land-use types. Through the land-use transition matrix, the sources of impervious surface expansion, the directions of cropland loss, and the transition pathways of water bodies and ecological spaces can be identified [21]. It should be noted that the dynamic degree of land-use change and the land-use transition matrix are mainly used to quantify the magnitude and direction of land-use change, and they cannot independently explain the causal mechanisms of land-use change.

3.2.2. Identification of Industrial Spatial Restructuring Characteristics

Characterization of industrial spatial restructuring was used to determine whether enterprise distribution and industrial functional space exhibited agglomeration, expansion, contraction, or directional migration. Based on enterprise registration information and POI data, this study employed kernel density estimation, spatial autocorrelation analysis, and standard deviation ellipse analysis to characterize the evolution of industrial space from three aspects: spatial agglomeration intensity, spatial correlation, and directional change.
(1)
Kernel density estimation
Kernel density estimation was used to identify spatial agglomeration hotspots of enterprise and POI point data, reflecting the distribution intensity of industrial activities in the airport core area, transport corridors, and peripheral areas [22,23]. The formula is as follows:
f ( x ) = 1 n h i = 1 n K ( x x i h )
where f(x) is the kernel density estimate at spatial location x; n is the number of sample points; h is the search radius; K is the kernel function; and x i is the location of the i-th enterprise or POI point. The kernel density results were used to compare the industrial agglomeration centers and their expansion or contraction trends in 2013, 2018, and 2023.
(2)
Spatial autocorrelation analysis
Spatial autocorrelation analysis was used to examine whether enterprise density or industrial functional distribution exhibited significant spatial clustering [24]. Global Moran’s I was used to determine whether the overall spatial pattern showed clustering, dispersion, or random distribution. The formula is as follows:
I = n w i j · i j ( x i x ¯ ) ( x j x ¯ ) i ( x i x ¯ ) 2
where I denotes the global Moran’s I index; n denotes the number of spatial units; x i and x j denote the attribute values of spatial units i and j, respectively; x ¯ denotes the mean attribute value; and w i j denotes the spatial weight matrix. I > 0 indicates positive spatial autocorrelation, suggesting that similar values tend to cluster spatially; I < 0 indicates negative spatial autocorrelation; and I close to 0 indicates a random spatial distribution.
(3)
Standard deviation ellipse
The standard deviation ellipse was used to characterize the center of gravity, dominant direction, and dispersion degree of industrial spatial distribution. In this study, the standard deviation ellipse was used to analyze the directional changes and spatial expansion or contraction trends of enterprise and industrial functional space in 2013, 2018, and 2023. The center coordinates of the ellipse are calculated as follows:
X ¯ = i = 1 n x i n
Y ¯ = i = 1 n y i n
where X ¯ and Y ¯ denote the coordinates of the spatial distribution center; x i and y i denote the coordinates of the i-th enterprise or POI point; and n denotes the number of point features. The major and minor axes of the standard deviation ellipse reflect the primary and secondary dispersion directions of the spatial distribution, while the rotation angle indicates the dominant direction of industrial spatial distribution [25]. By comparing changes in ellipse centers, major and minor axes, and orientation angles across different periods, the migration of industrial spatial centers, changes in dispersion range, and directional characteristics of spatial organization can be identified.

3.2.3. Identification of Dominant Explanatory Factors

Identification of dominant explanatory factors was used to determine which factors were more closely associated with the industrial spatial distribution in the Nanjing Airport Economic Zone. In this study, enterprise density at the grid-cell level in 2023 was used as the dependent variable Y, while transportation and locational, socioeconomic, and natural-ecological variables were selected as explanatory variables. These variables included distance to airport, distance to metro station, distance to major transport access points, road network density, population density, nighttime light intensity, slope, distance to water system, and green space density.
(1)
Construction of the indicator system and variable selection
The influencing-factor indicator system was mainly constructed from three dimensions: transportation and location, socioeconomic conditions, and natural ecology. Transportation and locational factors were used to represent airport proximity, rail transit accessibility, road transport supply, and accessibility to major transport nodes. Socioeconomic factors were used to represent population concentration, economic vitality, and development intensity. Natural-ecological factors were used to represent topographic relief, water-system proximity, and green-space supply. Among them, slope was extracted from DEM data and used to characterize topographic relief and its constraints on construction development and industrial layout.
It should be noted that the influencing-factor analysis in this study focused on explaining the spatial differences in industrial distribution intensity in 2023, rather than directly explaining the causal process of enterprise number changes from 2013 to 2023. Therefore, the dependent variable was defined as enterprise density at the grid-cell level in 2023:
Y i = E i A i
where Y i denotes the enterprise density of the i-th grid cell; E i denotes the number of enterprises in the i-th grid cell in 2023; and A i denotes the area of the grid cell.
(2)
Geodetector
Geodetector was used to identify the explanatory power of different explanatory variables for the spatial differences in industrial distribution. The factor detector module uses the q-statistic to measure the extent to which an explanatory variable explains the spatial stratified heterogeneity of the dependent variable. The formula is as follows:
q = 1 h = 1 L N h σ h 2 N σ 2
where q denotes the explanatory power indicator, with a value ranging from 0 to 1; h denotes the stratification of the explanatory variable; L denotes the number of strata; N h and N denote the sample sizes of stratum h and the entire study area, respectively; and σh2 and σ2 denote the variances of the dependent variable in stratum h and the entire study area, respectively. A larger q-value indicates stronger explanatory power of the factor for the spatial differences in industrial distribution.
Interaction detection was used to analyze whether the joint effect of two explanatory variables enhanced or weakened their explanatory power for the dependent variable. By comparing the q-values of single factors, q(X1) and q(X2), with the q-value of the interaction factor, q(X1 ∩ X2), it is possible to determine whether the relationship between variables shows bivariate enhancement, nonlinear enhancement, independence, or weakening effects. It should be noted that Geodetector reflects the statistical association and explanatory power between explanatory variables and the spatial differentiation of the dependent variable, but it does not represent strict causal proof.

3.2.4. Modeling Spatial Heterogeneous Relationships

Modeling of spatial heterogeneity relationships was used to determine whether the strength and direction of the same influencing factor varied across different locations. In this study, OLS, GWR, and MGWR models were applied in a stepwise comparison. The OLS model assumes that the effects of explanatory variables on industrial spatial distribution remain constant across the entire study area and can therefore serve as a global benchmark model. The GWR model introduces spatial location into the regression process, allowing regression coefficients to vary across space and thereby capturing local spatial heterogeneity. The MGWR model further allows different explanatory variables to have different spatial bandwidths, making it more suitable for analyzing the inconsistent spatial scales of factors such as transportation and location, economic vitality, population concentration, and natural-ecological constraints in airport economic zones.
(1)
OLS model
The OLS model was used to estimate the global linear relationship between explanatory variables and industrial spatial distribution. Its expression is as follows:
Y i = β 0 + k = 1 p β k X i k + ε i
where Y i denotes the enterprise density of the i-th grid cell; X i k denotes the k-th explanatory variable of the i-th grid cell; β 0 denotes the intercept term; β k denotes the global regression coefficient of the k-th explanatory variable; p denotes the number of explanatory variables; and ε i denotes the random error term.
(2)
GWR model
The GWR model introduces spatial location based on the OLS model, allowing regression coefficients to vary with spatial position. Its expression is as follows:
Y i = β 0 ( u i , v i ) + k = 1 p β k ( u i , v i ) X i k + ε i
where ( u i , v i ) denote the spatial coordinates of the i-th grid cell; β 0 ( u i , v i ) denotes the local intercept at spatial location i; and β k ( u i , v i ) denotes the local regression coefficient of the k-th explanatory variable at spatial location i.
(3)
MGWR model
The MGWR model further allows different explanatory variables to have different bandwidths based on the GWR model, thereby characterizing the multi-scale spatial effects of different factors. Its expression is as follows:
Y i = β b w 0 ( u i , v i ) + k = 1 p β b w k ( u i , v i ) X i k + ε i
where β b w k denotes the optimal bandwidth corresponding to the k-th explanatory variable; and β b w k ( u i , v i ) denotes the local regression coefficient estimated under the variable-specific bandwidth. A smaller bandwidth indicates that the variable mainly operates at a local scale, whereas a larger bandwidth suggests that the variable has a more stable regional effect.
During the modeling process, multicollinearity among explanatory variables was first tested, and the variance inflation factor was used to determine whether serious multicollinearity existed. OLS, GWR, and MGWR models were then constructed separately, and indicators such as adjusted R2, AICc, and residual spatial autocorrelation were compared to evaluate model fitting performance and spatial explanatory ability. MGWR can reveal spatial differences in the direction and strength of different influencing factors, but its results are sensitive to variable selection, bandwidth setting, and local coefficient interpretation. Therefore, in this study, the MGWR results were interpreted as spatially heterogeneous associations between influencing factors and industrial spatial distribution, rather than strict causal effects.

4. Results

4.1. Evolution of Industrial Land Use Structure

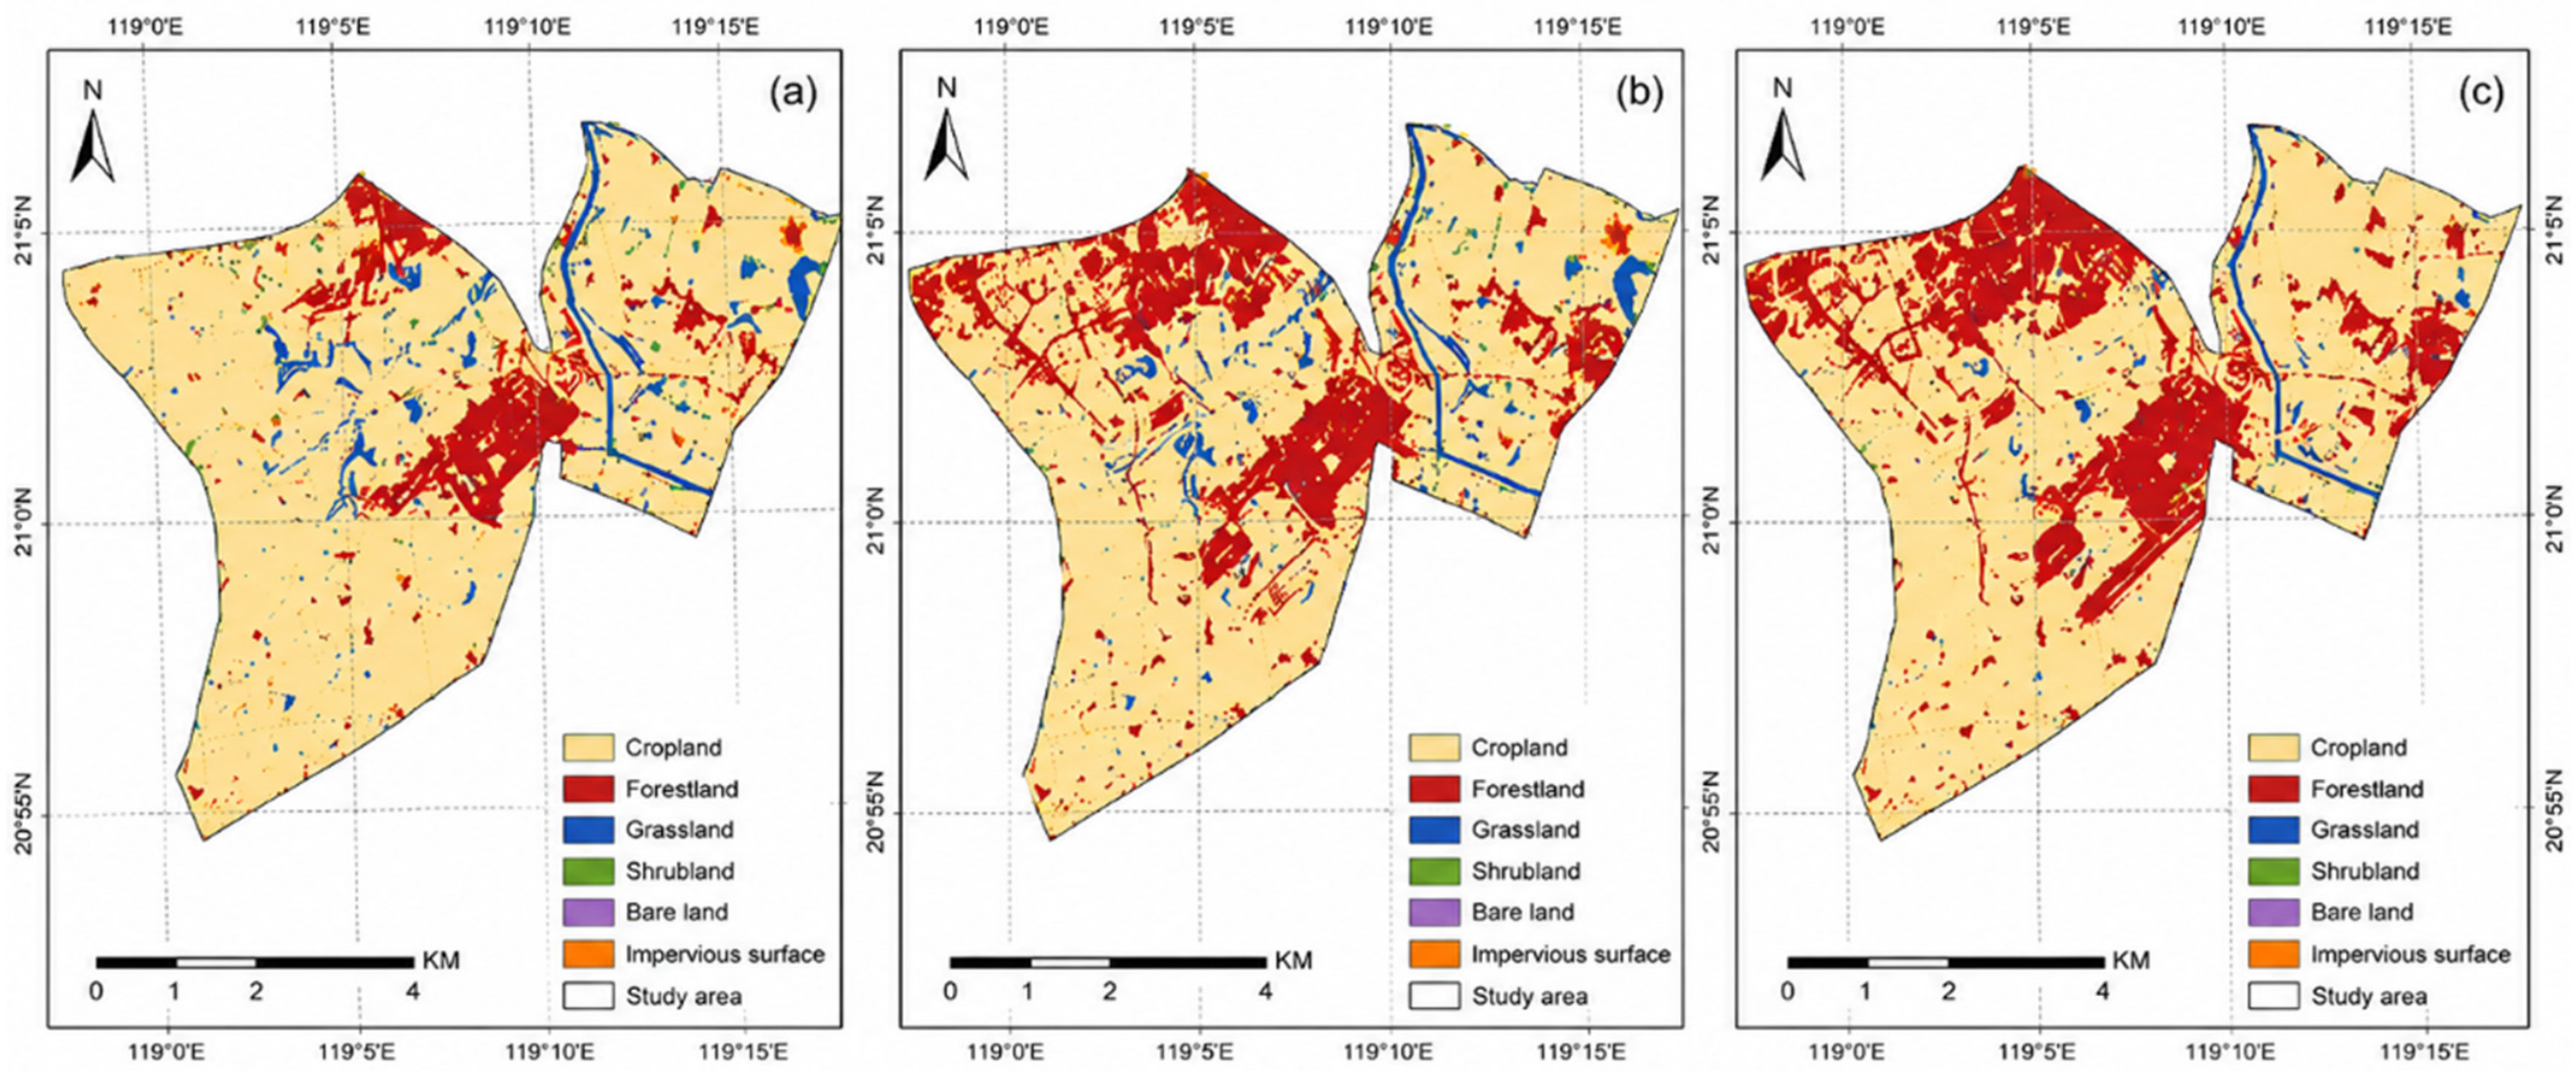
From 2013 to 2023, the land-use structure of the Nanjing Airport Economic Zone changed markedly, mainly characterized by cropland loss, impervious surface expansion, and water-body shrinkage. As shown in Table 2, cropland was the dominant land-use type in 2013, covering 81.07 km2 and accounting for 83.00% of the total study area, while impervious surfaces covered 10.98 km2, accounting for 11.24%. By 2023, cropland had decreased to 70.12 km2, with its proportion declining to 71.79%, whereas impervious surfaces had increased to 25.65 km2, with their proportion rising to 26.26%. During the same period, water bodies decreased from 5.50 km2 to 1.79 km2, and their proportion declined from 5.63% to 1.83%. Woodland, grassland, and bare land occupied relatively small areas and had limited influence on the overall land-use structure of the study area. As shown in Figure 3, the spatial distribution of land-use types in 2013, 2018, and 2023 further indicates that impervious surface expansion mainly occurred around the airport, transport corridors, and industry-related development areas.
In terms of staged changes, 2013–2018 was a period of rapid impervious surface expansion. As shown in Table 3, impervious surfaces increased from 10.98 km2 to 20.18 km2, with an average annual dynamic degree of 8.39%, while cropland decreased from 81.07 km2 to 72.58 km2, with an average annual dynamic degree of −1.05%. Land-use change during this period was mainly characterized by the rapid increase in construction land and the continuous decrease in agricultural land. From 2018 to 2023, impervious surfaces continued to expand to 25.65 km2, but the average annual dynamic degree decreased to 2.71%, indicating a slowdown in the expansion rate of construction land. During the same period, the rate of cropland loss narrowed, with an average annual dynamic degree of −0.34%, while water bodies continued to decline, with an average annual dynamic degree of −6.30%. As shown in Figure 4, land-use change in the study area gradually shifted from rapid construction expansion in the earlier period to relatively moderate spatial adjustment in the later period, although impervious surfaces continued to increase.
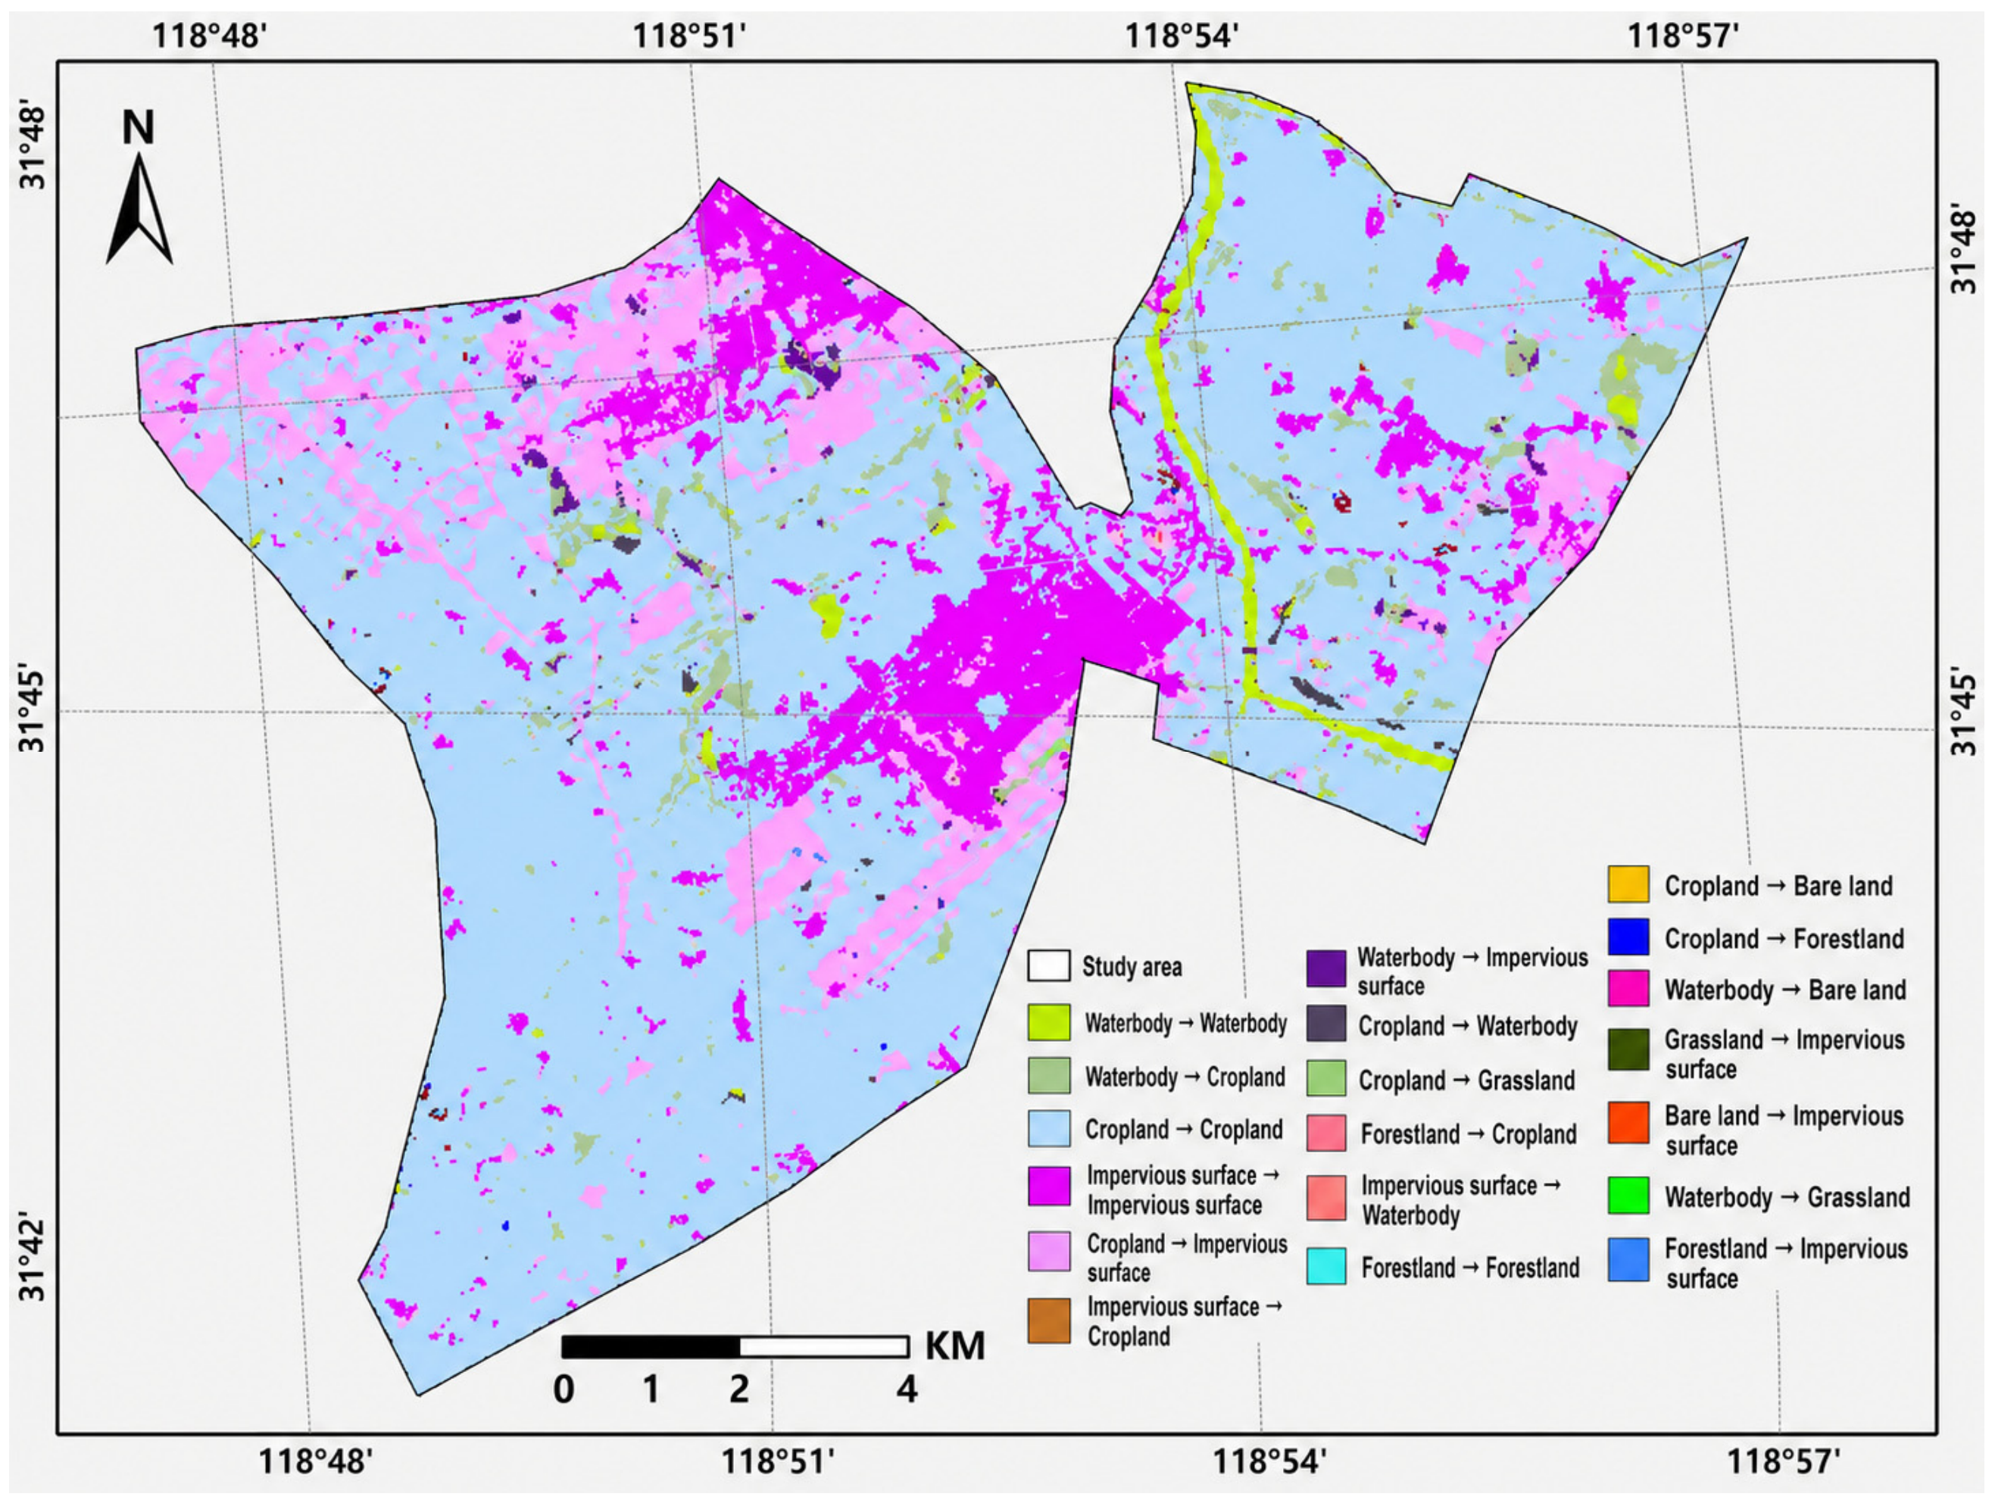
The land-use transition results further show that the conversion from cropland to impervious surfaces was the dominant pathway of land-use transition in the study area from 2013 to 2023. As shown in Figure 5, the area converted from cropland to impervious surfaces reached 14.67 km2, accounting for 85.4% of all land-use conversions, and was mainly distributed around the airport core area, transport corridors, and industry-related development areas. In contrast, the reverse conversion from impervious surfaces to agricultural or ecological land, such as cropland, was limited, with an area of approximately 0.50 km2, accounting for only 2.9%. This indicates that land-use change during the study period was generally dominated by construction land expansion, while the reverse restoration process was relatively limited.
Overall, land-use transition in the Nanjing Airport Economic Zone from 2013 to 2023 exhibited a basic pattern of “cropland loss–impervious surface expansion–water-body shrinkage.” Changes were more pronounced during 2013–2018, while the expansion rate declined during 2018–2023; however, construction land continued to increase. It should be noted that the dynamic degree of land-use change and land-use transition matrix are mainly used to reveal the quantitative characteristics and conversion directions of land-use change, and they cannot independently prove the causal effects of policy, transportation construction, or industrial development on land-use change. The related driving mechanisms need to be further discussed in combination with subsequent analyses of industrial spatial patterns, influencing-factor detection, and spatial heterogeneity.

4.2. Characteristics of Industrial Spatial Patterns

In 2023, the industrial spatial distribution of the Nanjing Airport Economic Zone exhibited significant spatial clustering. The global spatial autocorrelation results show that Moran’s I was 0.9639, with a z-value of 95.5462 and a p-value close to 0, indicating that the industrial spatial distribution in the study area significantly deviated from a random pattern and showed strong positive spatial autocorrelation. This suggests that high-density industrial activities tended to cluster in adjacent spatial units, while low-density areas also showed a certain degree of spatial continuity. Therefore, the industrial spatial pattern of the Nanjing Airport Economic Zone was not homogeneous but formed relatively distinct agglomeration cores and peripheral low-density areas.
As shown in Figure 6, the industrial spatial pattern of the Nanjing Airport Economic Zone experienced a staged change from expansion to convergence during 2013–2023. In 2013, high-density industrial areas were mainly concentrated around the airport, indicating a clear airport-proximity agglomeration characteristic in the early stage. By 2018, the range of high-density areas had expanded, and new agglomeration patches appeared in peripheral areas, suggesting that industrial space expanded outward from the airport core area to surrounding regions. By 2023, high-density industrial areas became further concentrated in the core area and major transport-connected areas, while peripheral low-density patches decreased. This indicates that industrial space gradually shifted from early-stage diffusion to a relatively concentrated spatial organization pattern.
The standard deviation ellipse results further reveal changes in the distribution range and direction of industrial space (Table 4). From 2013 to 2018, the major axis of the ellipse increased from 4.93 km to 5.29 km, the minor axis increased from 2.78 km to 2.96 km, and the ellipse area increased from 43.22 km2 to 49.18 km2, indicating an outward expansion trend of industrial space during this period. From 2018 to 2023, the major axis shortened to 4.59 km, the minor axis shortened to 2.20 km, and the ellipse area decreased to 31.65 km2, indicating that the distribution range of industrial space contracted and the spatial pattern became more intensive. Meanwhile, the ellipse orientation angle changed from 93.29° in 2013 to 89.76° in 2018 and then adjusted to 99.72° in 2023, suggesting that the dominant direction of industrial space generally remained near an east–west orientation, although some directional adjustment occurred. The ellipse centers in all three periods remained stable near 118.86° E and 31.76° N, indicating that the airport-adjacent area consistently served as the main center of industrial spatial organization.
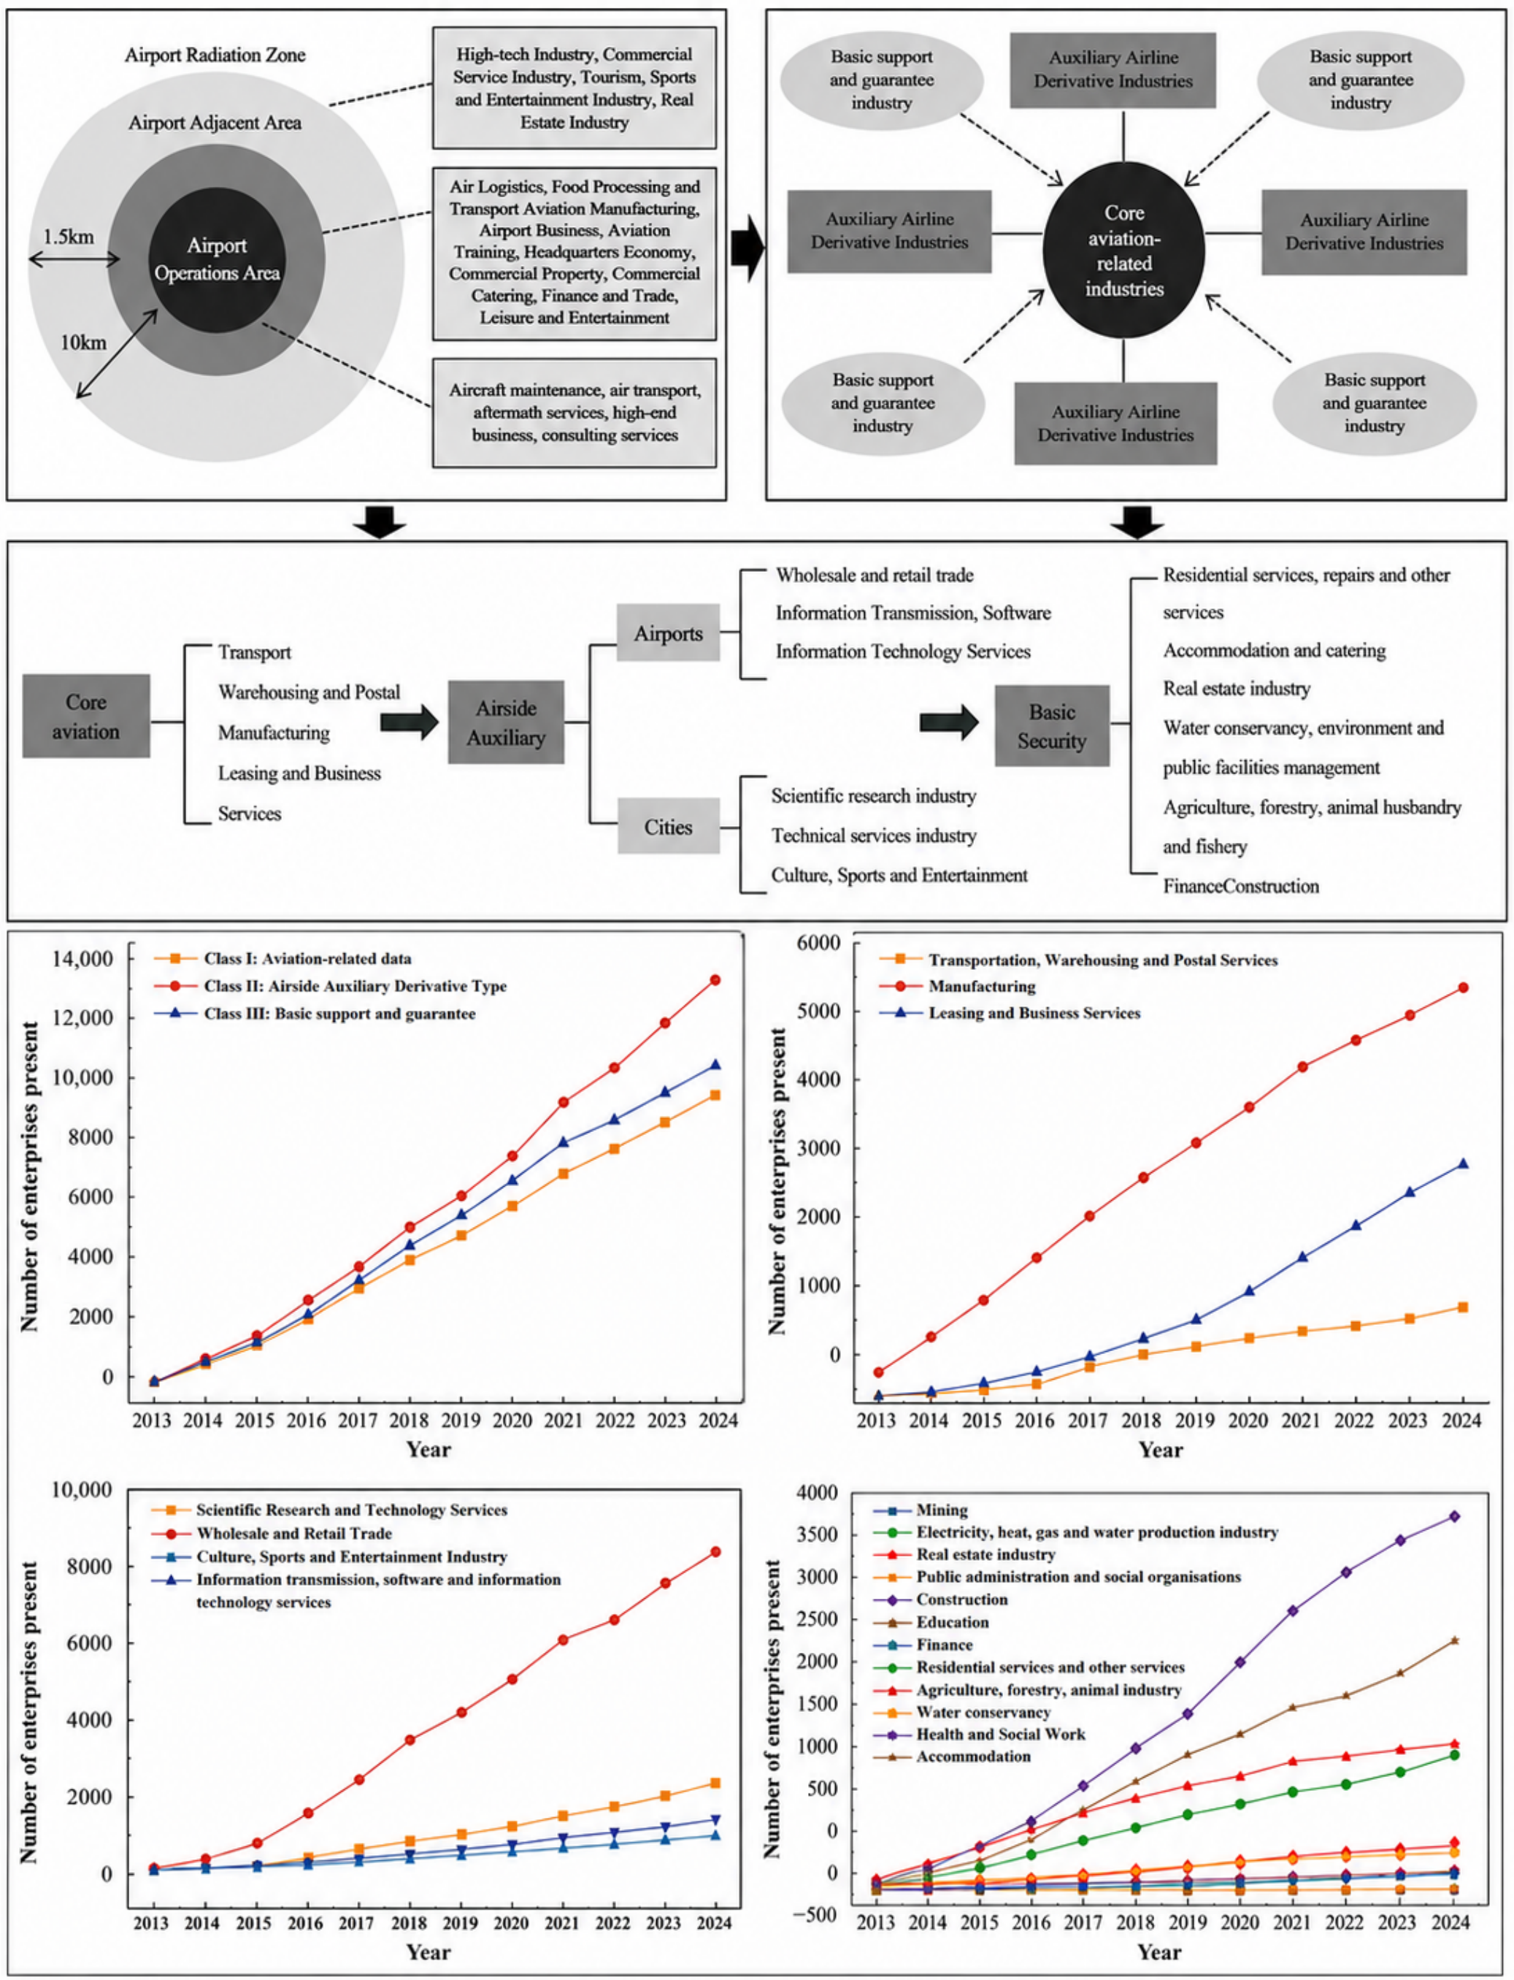
In terms of changes in industrial types, as shown in Figure 7, the industrial system of the Nanjing Airport Economic Zone showed continuous growth and functional differentiation from 2013 to 2023. Aviation-related industries, airport-adjacent supporting industries, and basic supporting industries all increased to varying degrees, although their growth rates differed. Among them, aviation-related industries mainly reflected support for the core airport functions; airport-adjacent supporting industries were more closely associated with logistics, warehousing, and business services; and basic supporting industries reflected the enhancement of the region’s comprehensive service capacity. Overall, the industrial spatial pattern of the study area exhibited an evolutionary process of “airport-core agglomeration–staged peripheral expansion–later spatial convergence,” indicating that industrial spatial organization gradually shifted from early-stage diffusion-oriented growth to relatively concentrated functional restructuring.

4.3. Driving Factors of Spatial Evolution

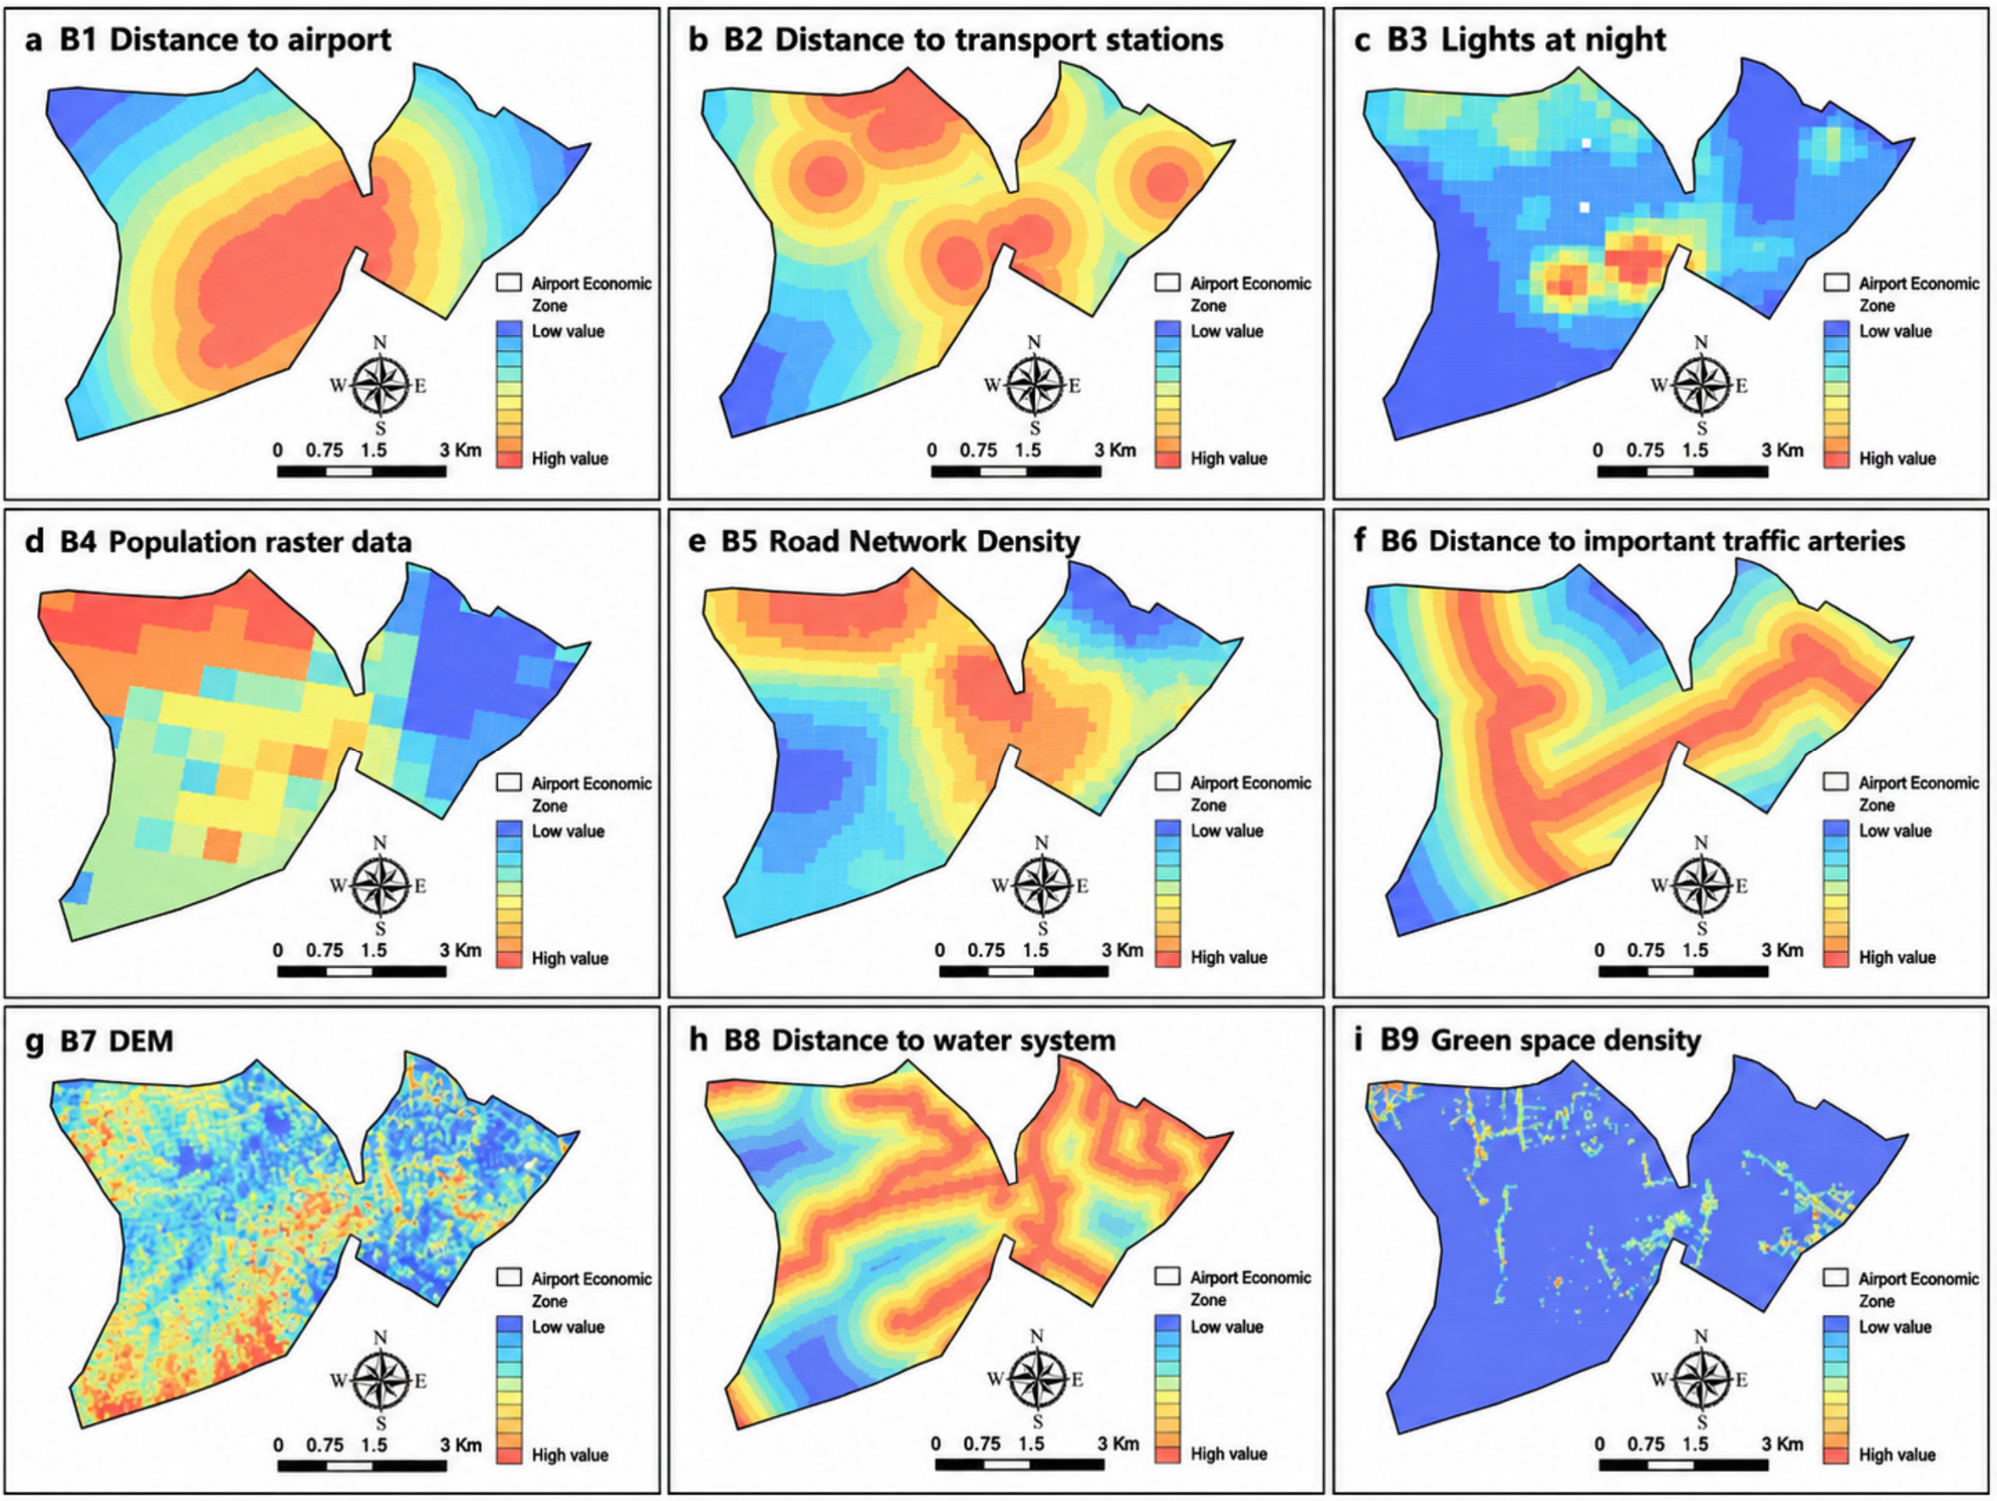
Before presenting the results, it is useful to clarify the complementary logic between the Geodetector and the MGWR model adopted in this study. The Geodetector is first applied to identify which factors exhibit significant explanatory power for the spatial heterogeneity of enterprise density and to detect whether factor interactions enhance this explanatory power. On this basis, the MGWR model is then employed to explore how the effects of these salient factors vary across space, i.e., the spatial heterogeneity in both the direction and magnitude of their local coefficients. This two-step strategy allows us not only to screen the dominant driving forces from a pool of candidate variables but also to capture the spatially nuanced relationships that are particularly relevant in an airport economic zone characterized by strong core–periphery gradients. To identify the main influencing factors of industrial spatial distribution in the Nanjing Airport Economic Zone, this study constructed an explanatory variable system including transportation and locational, socioeconomic, and natural-ecological variables. As shown in Figure 8, the explanatory variables included distance to airport (B1), distance to metro station (B2), population density (B3), nighttime light intensity (B4), road network density (B5), distance to major transport access points (B6), slope (B7), distance to water system (B8), and green space density (B9). Based on enterprise density at the grid-cell level in 2023, the Geodetector model was further applied to identify the explanatory power of each factor for differences in industrial spatial distribution.
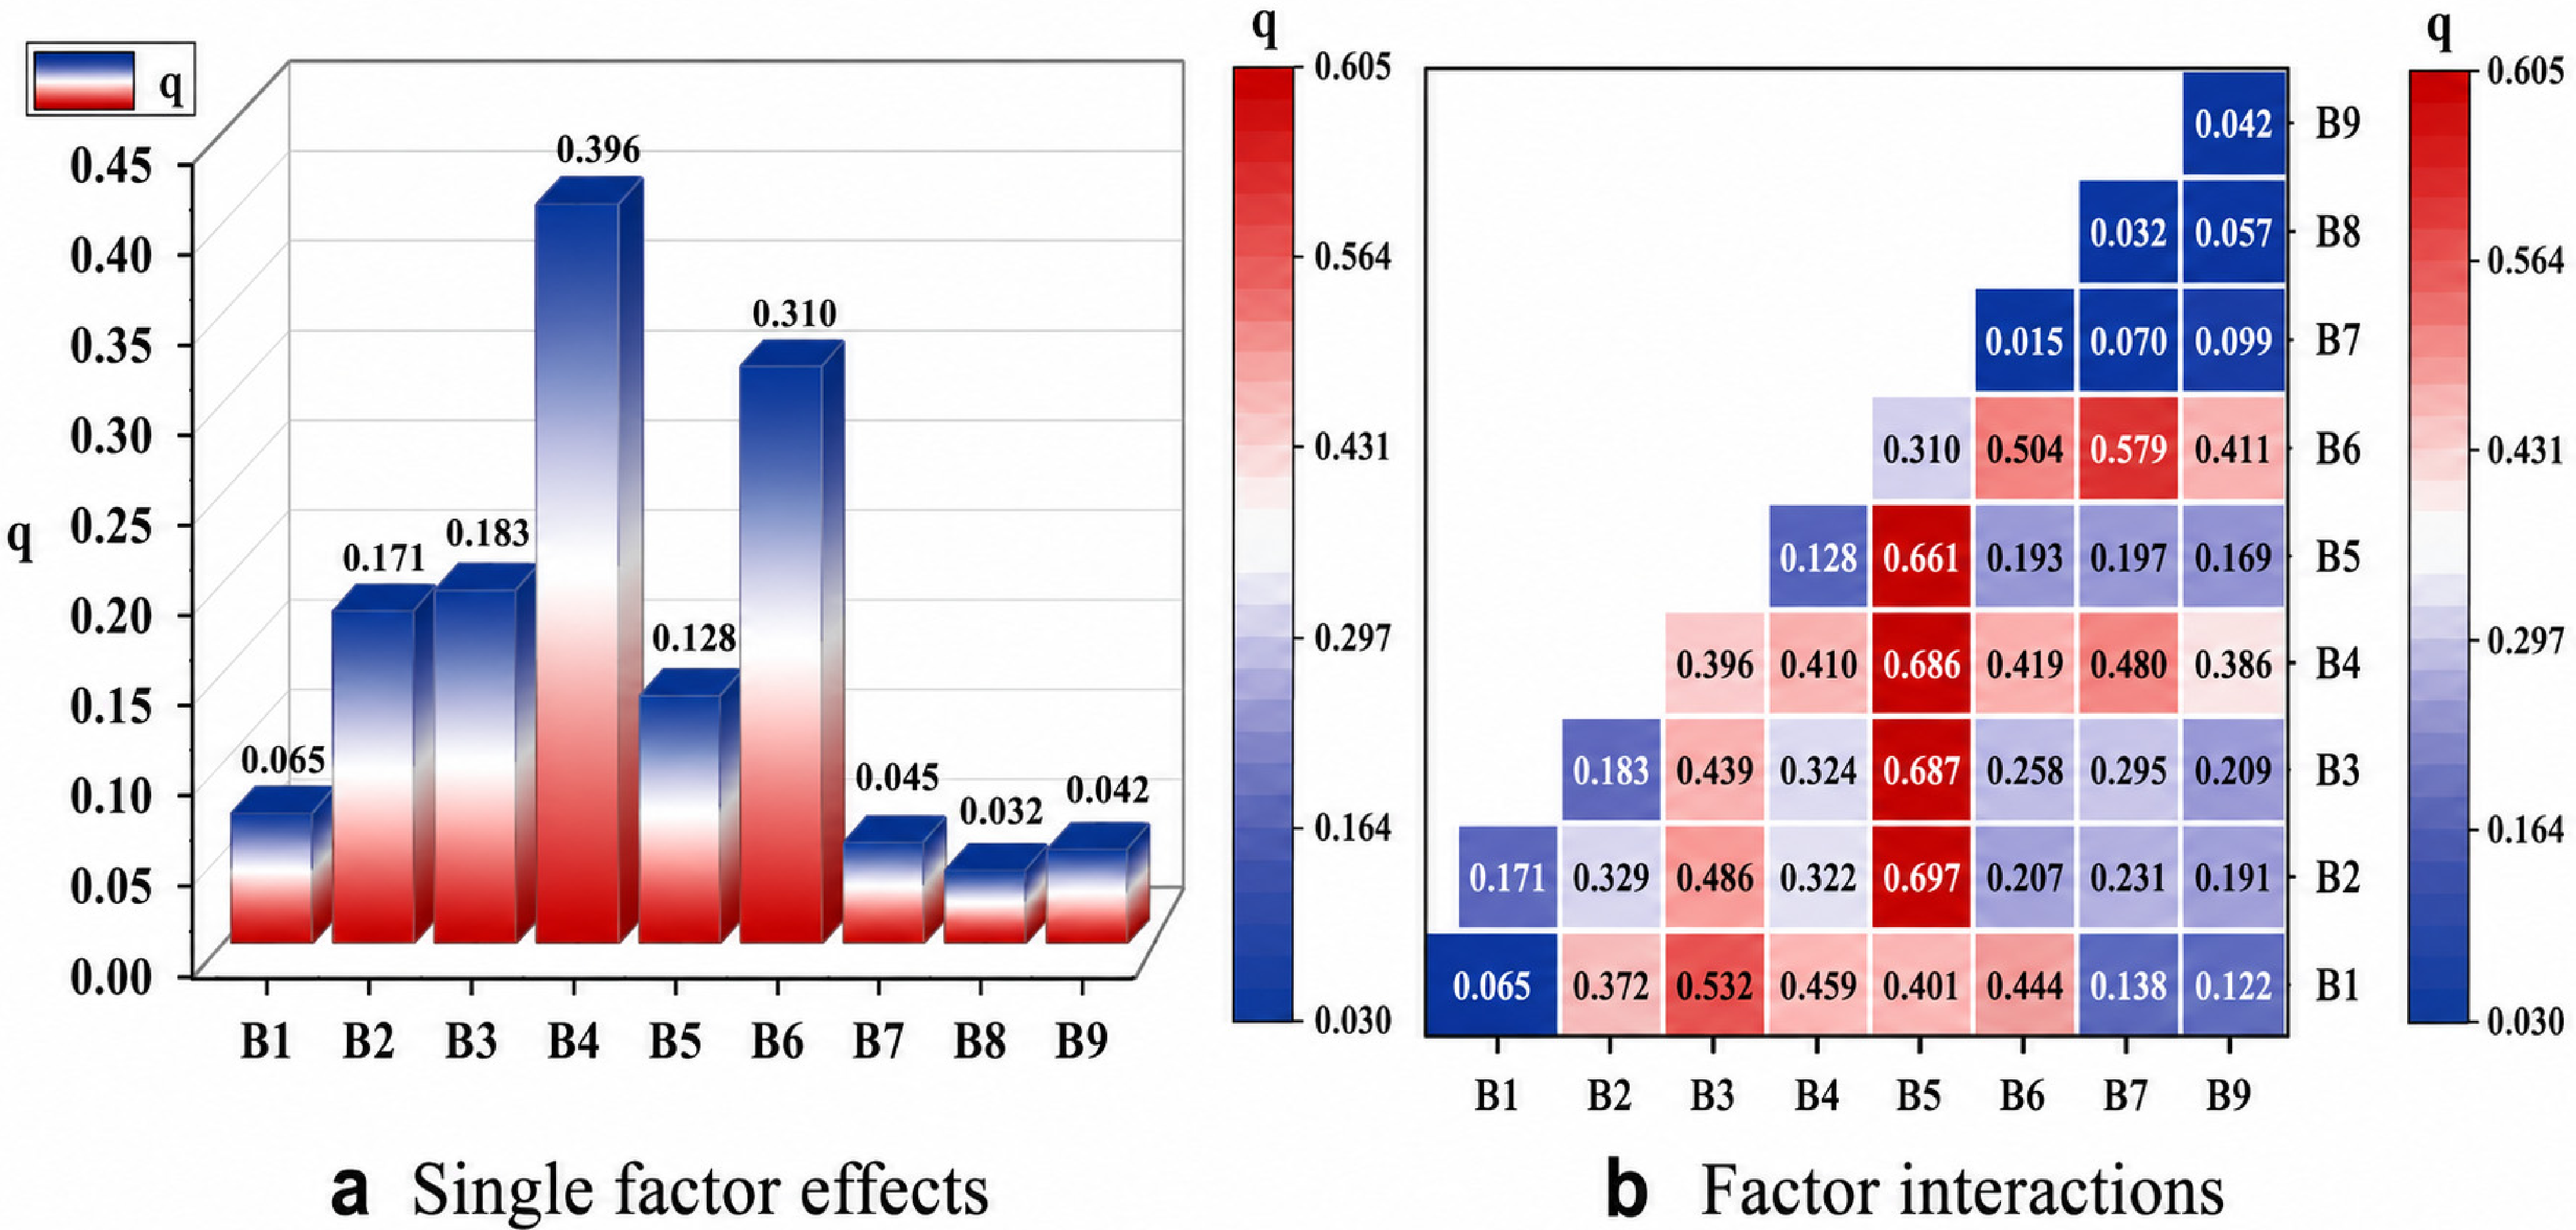
The factor detection results show that the explanatory power of different variables for industrial spatial distribution varied considerably (Figure 9). Among them, nighttime light intensity (B4) had the highest explanatory power, with a q-value of 0.396, indicating that economic vitality and development intensity were strongly associated with industrial spatial agglomeration. Distance to major transport access points (B6) ranked second, with a q-value of 0.310, suggesting that accessibility to transport nodes was an important factor influencing industrial spatial distribution. Population density (B3) and distance to metro station (B2) had q-values of 0.183 and 0.171, respectively, indicating that population concentration and rail transit accessibility were also associated with industrial spatial distribution. In contrast, natural-ecological variables had relatively lower explanatory power. The q-values of slope (B7), distance to water system (B8), and green space density (B9) were 0.045, 0.031, and 0.041, respectively, suggesting that natural environmental factors exerted certain constraints on industrial spatial distribution, although their single-factor explanatory power was lower than that of economic and transportation factors.
The interaction detection results further indicate that most variable combinations had stronger explanatory power than single variables, suggesting that industrial spatial distribution was influenced by the joint effects of multiple factors (Figure 9). Among them, the interaction between slope (B7) and distance to metro station (B2) had the highest q-value, reaching 0.6967, which was much higher than the explanatory power of either single factor. This indicates that the combination of topographic conditions and rail transit accessibility significantly enhanced the explanation of differences in industrial spatial distribution. In addition, combinations such as nighttime light intensity (B4) and slope (B7), as well as population density (B3) and road network density (B5), also showed strong interaction enhancement effects. These results suggest that industrial spatial distribution was not dominated by a single factor, but was formed under the combined effects of economic vitality, transportation accessibility, population concentration, and natural constraints.
To further analyze the spatial heterogeneity of the effects of influencing factors, OLS, GWR, and MGWR models were compared (Table 5). In terms of model fitting results, the R2 values of the OLS, GWR, and MGWR models were 0.839, 0.885, and 0.897, respectively, while the adjusted R2 values were 0.837, 0.880, and 0.894, respectively. Compared with the OLS and GWR models, the MGWR model showed slightly higher R2 and adjusted R2 values, indicating that model explanatory power improved after introducing multiscale spatial heterogeneity. However, the improvement of MGWR over GWR was limited and should not be interpreted as a substantial leap in model performance. Meanwhile, the AICc results show that the OLS model had the lowest AICc value, whereas GWR and MGWR had higher AICc values, indicating that the spatial models increased model complexity while improving explanatory power. Therefore, the main purpose of using MGWR in this study was not to simply prove its overall optimal fit, but to reveal spatial differences in the strength and direction of different influencing factors through local regression coefficients. The coefficients of socioeconomic variables (B3, B4) should be interpreted with caution, as their associations with enterprise density may reflect bidirectional relationships rather than unidirectional effects.
The summary statistics of MGWR regression parameters indicate that local regression coefficients varied considerably among different variables (Table 6). Variables such as distance to airport (B1), distance to metro station (B2), population density (B3), distance to major transport access points (B6), and green space density (B9) showed relatively wide coefficient ranges, indicating that the direction and strength of their effects differed across spatial locations. Among them, the local coefficients of B1 and B2 included both positive and negative values, reflecting spatial differences in the effects of airport proximity and rail transit accessibility on industrial spatial distribution across different areas. The local coefficients of B3 and B6 also varied markedly, suggesting that population concentration and transport-node accessibility had strong local effects on industrial spatial distribution. In contrast, the coefficient range of slope (B7) was relatively small, indicating that its overall effect was limited, although it may still exert certain constraints in local areas. Table 5 compares the performance of OLS, GWR, and MGWR using R2, adjusted R2, and AICc. AICc (corrected Akaike Information Criterion) is a widely used metric that balances model fit against model complexity; a lower AICc generally indicates a more parsimonious model with comparable explanatory power. The OLS model yielded the lowest AICc (537.53), suggesting that the global model is the most parsimonious given the present data. The MGWR model, however, achieved the highest adjusted R2 (0.894) at the cost of increased complexity (AICc = 764.12). Because the primary objective of this study is not to identify a single best-fitting model but to explore the spatial heterogeneity of driving factors, we report the MGWR results for their ability to reveal local variations in coefficient magnitude and direction, while acknowledging that the goodness-of-fit improvement over GWR is modest.
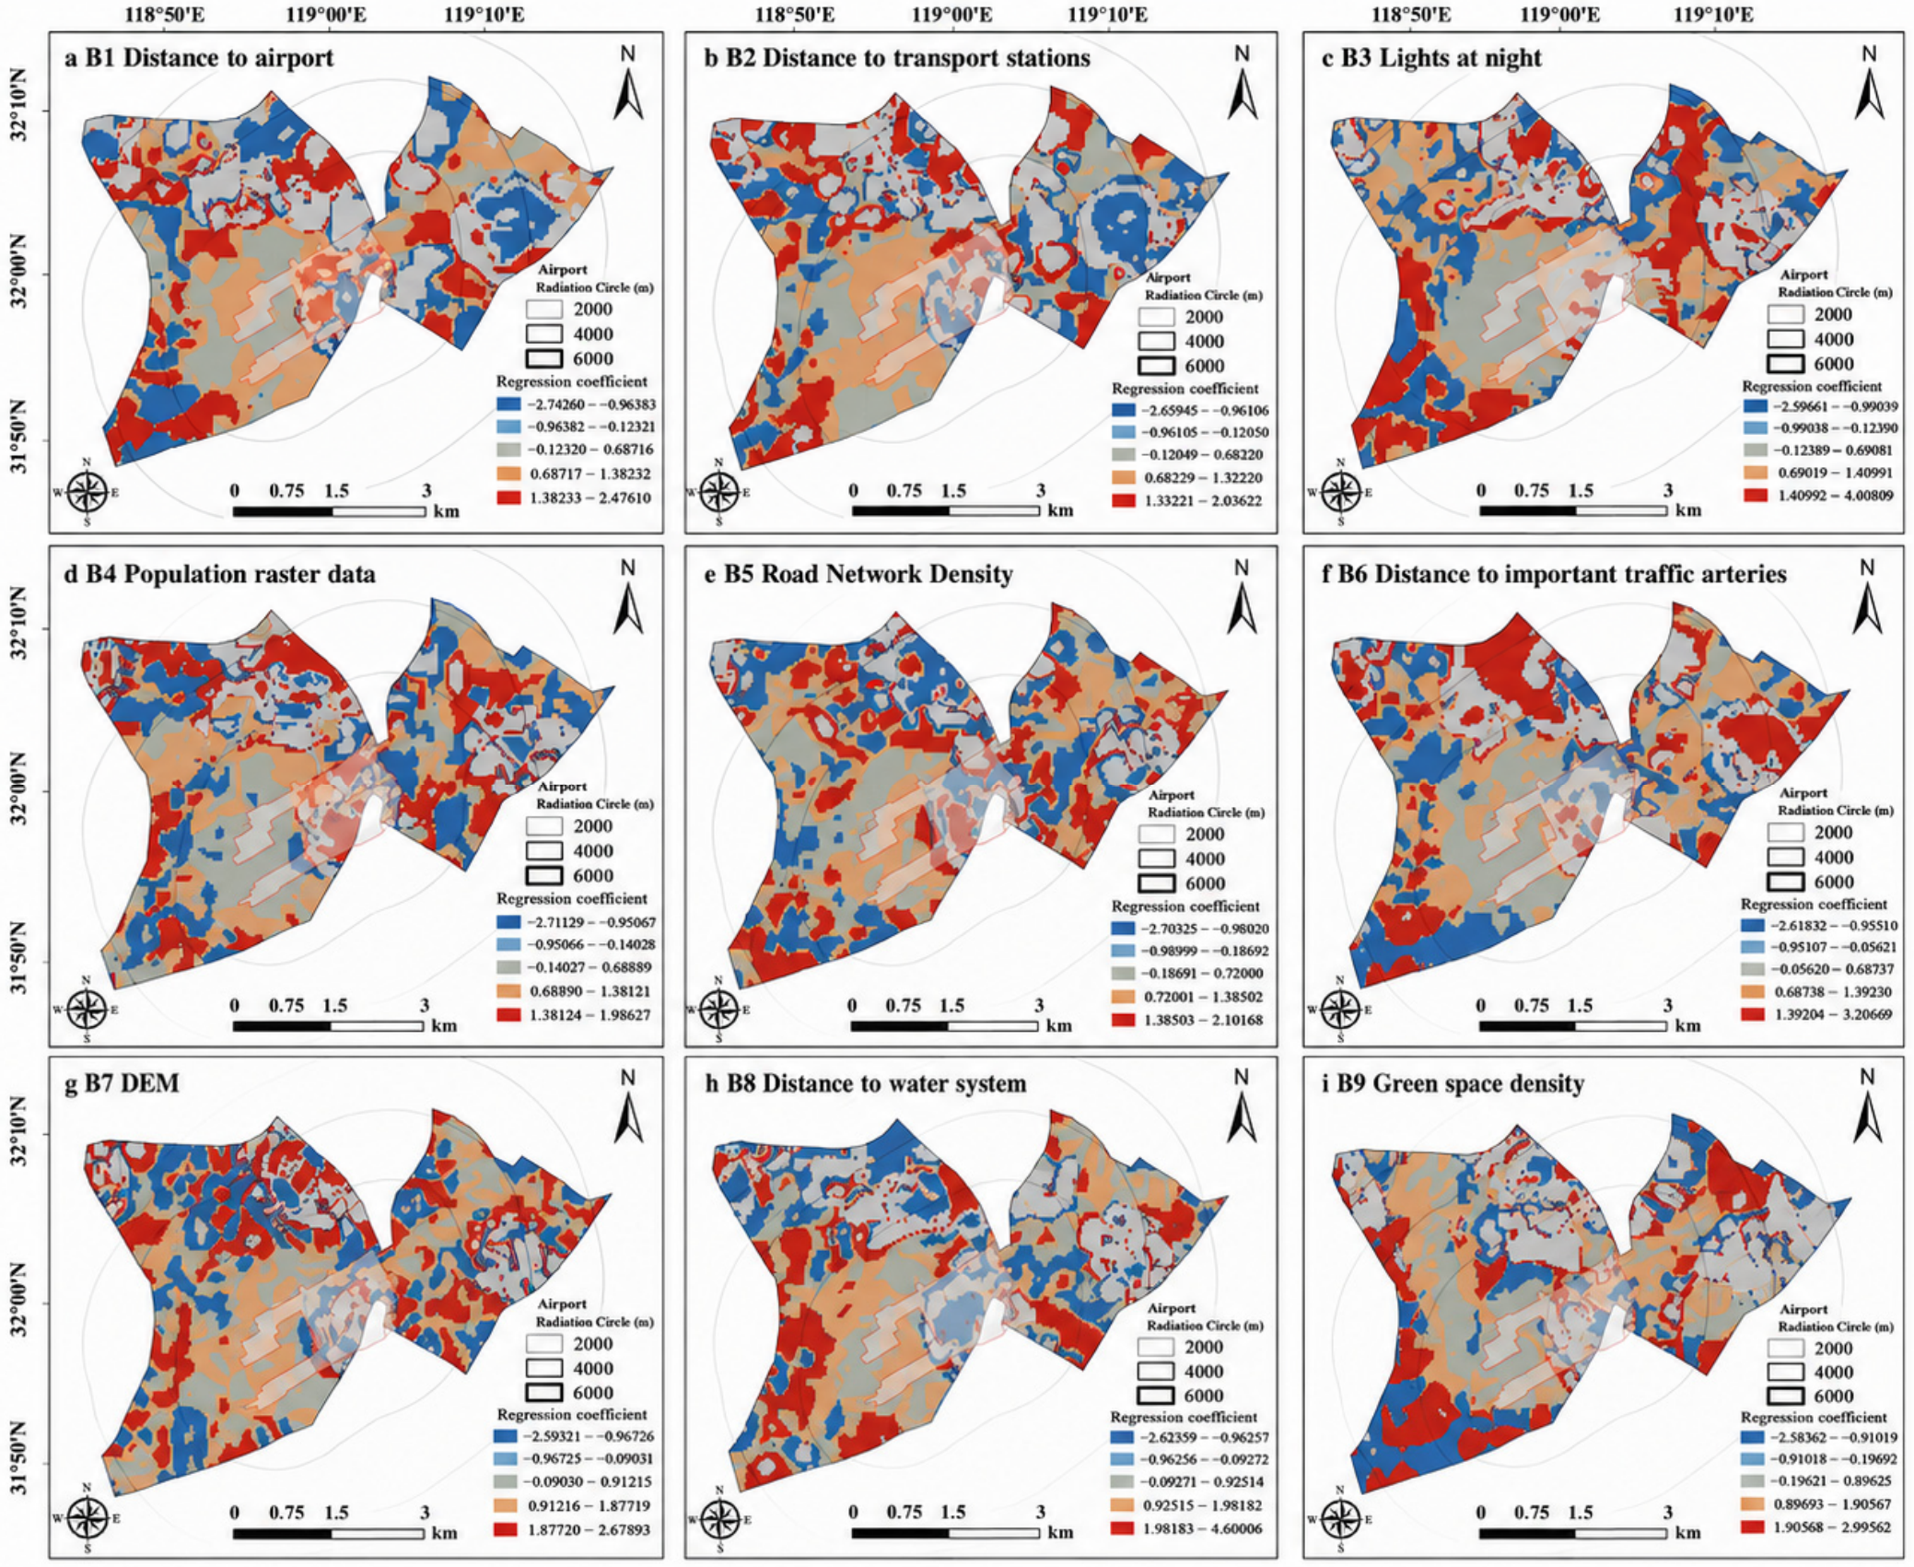
As shown in Figure 10, the spatial distribution of MGWR regression coefficients further reveals the spatial heterogeneity of the effects of different influencing factors. Transportation and locational variables showed relatively clear local effects around the airport and major transport-connected areas, indicating that transportation accessibility had spatially selective effects on industrial agglomeration. The high-coefficient areas of socioeconomic variables corresponded to some extent with areas of dense industrial activity, suggesting a strong spatial association between economic vitality, population concentration, and industrial spatial distribution. The effects of natural-ecological variables were mainly reflected as local constraints, with their intensity varying across different areas. Overall, the spatial evolution of industrial space in the Nanjing Airport Economic Zone was jointly influenced by transportation accessibility, economic vitality, and population concentration, while also being locally constrained by natural-ecological factors such as topography, water systems, and green spaces.

4.4. Spatial Co-Occurrence of Land Conversion and Enterprise Growth

To investigate whether the spatial footprints of land-use transition and industrial redistribution overlap, we compared the hotspots of cropland-to-impervious conversion (Figure 3) with the enterprise density increase map (Figure 6). A visual inspection reveals that the areas of most intensive cropland loss—predominantly surrounding Nanjing Lukou International Airport and extending along the north–south transport corridors—correspond closely with the zones where enterprise density grew most markedly. For example, the high-density enterprise clusters in the airport core and adjacent metro corridors (Figure 6, 2023 panel) are situated within the same general area that experienced the highest proportions of cropland conversion (Figure 3, 2013–2023 comparison). This spatial coincidence is also evident along the primary road networks radiating from the airport, where both impervious expansion and enterprise agglomeration are pronounced.
However, this descriptive overlay does not constitute a statistical test or causal demonstration. It merely indicates that, at a coarse spatial scale, the two processes have occurred in overlapping locations. The temporal resolution of our land-use data (three time points) and the spatial uncertainty of enterprise addresses prevent a formal coupling analysis. Consequently, the observed co-location should be interpreted as a contextual observation rather than evidence of a direct land–industry linkage.

5. Discussion

5.1. Land-Use Transition and Airport-Oriented Development

This study shows that land-use transition in the Nanjing Airport Economic Zone from 2013 to 2023 was closely associated with the process of airport-oriented development. During the study period, cropland decreased from 81.07 km2 to 70.12 km2, impervious surfaces increased from 10.98 km2 to 25.65 km2, and water bodies decreased from 5.50 km2 to 1.79 km2, indicating that the construction of the airport economic zone and the expansion of related industrial space had a continuous impact on the regional land-use structure [4]. In particular, during 2013–2018, the average annual dynamic degree of impervious surfaces reached 8.39%, indicating rapid expansion of construction land in this stage, with land-use change mainly characterized by the conversion from cropland to impervious surfaces. From 2018 to 2023, impervious surfaces continued to increase, but their average annual dynamic degree declined to 2.71%, suggesting that the pace of land development slowed and regional spatial evolution gradually shifted from extensive expansion to relatively intensive spatial adjustment.
This process is generally consistent with the common spatial development logic of airport economic zones. As a regional transportation hub and core of industrial organization, an airport usually promotes surrounding land development through improved transportation accessibility, strengthened logistics functions, and industrial chain agglomeration. In the Nanjing Airport Economic Zone, the concentrated conversion from cropland to impervious surfaces mainly occurred around the airport, transport corridors, and industry-related development areas, indicating that the airport core area and transport-connected corridors played important roles in land-use transition [26]. Meanwhile, the reduction in water bodies and some ecological spaces also suggests that airport-oriented development may exert certain pressure on regional ecological space while promoting industrial agglomeration and construction land expansion [27].
From the perspective of staged characteristics, the Nanjing Airport Economic Zone experienced a transition from rapid expansion to more intensive spatial adjustment. During 2013–2018, the major axis, minor axis, and area of the standard deviation ellipse of industrial space all increased, indicating an outward expansion trend of industrial activities. During 2018–2023, however, the ellipse area decreased from 49.18 km2 to 31.65 km2, showing that the distribution range of industrial space contracted and became more concentrated. The synchronous changes in land use and industrial spatial patterns indicate that the early development of the airport economic zone was mainly characterized by construction land expansion and industrial spillover, while the later stage gradually showed strengthened core-area agglomeration and spatial organization optimization [28].
Therefore, land-use transition in the Nanjing Airport Economic Zone can be understood as the result of the combined effects of airport-oriented industrial development, transportation infrastructure improvement, and spatial resource constraints. Compared with a traditional monocentric expansion pattern, the spatial evolution of airport economic zones is reflected not only in the increase in construction land, but also in the re-coordination among industrial functions, transport corridors, and ecological constraints. This finding suggests that, in the context of rapid urbanization and regional integration, land-use management in airport economic zones should not focus solely on construction land supply, but should also emphasize the balance among industrial spatial efficiency, transportation organization, and ecological space protection.

5.2. Driving Mechanisms of Industrial Spatial Restructuring

Industrial spatial restructuring in the Nanjing Airport Economic Zone was not dominated by a single factor, but was formed through the combined effects of transportation and location, economic vitality, population concentration, and natural-ecological constraints. The preceding results show that nighttime light intensity and distance to major transport access points had relatively high explanatory power, indicating that the intensity of economic activity and accessibility to transport nodes were important factors associated with industrial spatial distribution. Meanwhile, population density and metro accessibility also showed certain explanatory power, suggesting that industrial spatial agglomeration depended not only on the locational advantages of the airport itself, but also on urban functional linkages, labor accessibility, and the integrated transportation network [29,30].
From the perspective of industrial organization, the industrial system of the Nanjing Airport Economic Zone can be summarized into three levels: core aviation industries, airport-adjacent supporting industries, and basic supporting industries. Core aviation industries mainly rely on the hub function of the airport and are usually highly dependent on air transportation, time-sensitive connections, and high-level transportation accessibility. Airport-adjacent supporting industries include modern logistics, warehousing and distribution, business services, research and development, and financial services, whose locations are more likely to be influenced by transport corridors, industrial chain linkages, and market demand. Basic supporting industries mainly provide support for regional production, daily life, and industrial operation [31]. Different industrial types vary in their dependence on airports, roads, rail transit, and urban service functions, thereby promoting an industrial spatial organization that extends from the airport core area to transport corridors and peripheral functional zones.
The interaction detection results from Geodetector further indicate that industrial spatial distribution had clear multi-factor coupling characteristics. Among them, the interaction between slope and metro accessibility was the strongest, suggesting that natural topographic conditions and rail transit accessibility jointly affected industrial spatial differentiation [32]. Variable combinations such as nighttime light intensity and slope, as well as population density and road network density, also showed strong interaction enhancement effects. This indicates that industrial spatial restructuring was not the result of transportation, economic, or natural factors acting independently, but rather the result of multiple factors being superimposed under different spatial conditions.
The MGWR results further revealed the spatial heterogeneity of the effects of driving factors. Transportation and locational variables showed relatively clear local effects around the airport and major transport-connected areas, indicating that transportation accessibility had spatially selective effects on industrial agglomeration [33]. The high-coefficient areas of socioeconomic variables corresponded to areas with relatively dense industrial activities, suggesting a strong spatial association between economic vitality, population concentration, and industrial spatial distribution. In contrast, natural-ecological variables such as slope, distance to water system, and green space density had relatively weak single-factor explanatory power, but their local coefficient variations suggest that natural-ecological factors may still constrain industrial layout in specific areas. Therefore, industrial spatial restructuring in the Nanjing Airport Economic Zone can be summarized as a comprehensive process of “transportation accessibility guidance–economic vitality enhancement–population agglomeration support–ecological condition constraint” (Figure 11).

5.3. Policy Implications and Spatial Optimization Recommendations

Based on the results of land-use change, industrial spatial patterns, and influencing-factor analysis, future spatial optimization of the Nanjing Airport Economic Zone should focus on three aspects: transportation–industry coordination, renewal of existing developed land, and control of ecological constraints.
First, coordination between transportation accessibility and industrial layout should be strengthened. The Geodetector results show that distance to major transport access points and road network density were closely associated with industrial spatial distribution, indicating that transport nodes and road networks remain important conditions affecting industrial agglomeration [34]. Therefore, future planning should optimize industrial functional layouts around the airport, rail transit stations, major road access points, and logistics corridors, and enhance spatial linkages among aviation logistics, airport-oriented manufacturing, and modern services. In areas with clear transportation advantages, priority should be given to industrial functions with high requirements for time efficiency and transport organization, so as to avoid spatial mismatch between industrial land and transportation facilities.
Second, renewal of existing developed land in the core area and high-density development zones should be promoted. The land-use results indicate that impervious surfaces continued to expand in the Nanjing Airport Economic Zone from 2013 to 2023, while cropland and water bodies decreased, suggesting that new construction space exerted certain pressure on agricultural and ecological spaces. In the future, development should not continue to rely solely on outward expansion. Instead, more attention should be paid to the renewal of existing construction land, redevelopment of inefficient industrial land, and multifunctional use of industrial space. For areas around the airport and major industrial agglomeration zones, industrial space should be promoted to shift from scale expansion to quality improvement by improving land-use efficiency, enhancing public services, and strengthening industrial chain coordination.
Third, ecological space constraints and development boundary control should be strengthened. Although natural-ecological variables such as slope, distance to water system, and green space density showed relatively weak single-factor explanatory power, the MGWR results indicate that their effects had certain local differences, suggesting that natural-ecological factors may still constrain industrial layout in some areas. Considering the land-use change characteristics of water-body shrinkage and impervious surface expansion, clearer ecological buffers and development control boundaries should be established around water systems, concentrated green spaces, and topographically sensitive areas in the future, so as to avoid further compression of ecological space by high-intensity industrial development [33].
Fourth, differentiated industrial spatial governance should be implemented. The MGWR results show that the direction and strength of different influencing factors varied markedly across space, indicating that a uniform development strategy is not suitable for the Nanjing Airport Economic Zone. The airport core area should focus on improving aviation logistics, airport-oriented services, and high-value-added industrial functions. Areas along transport corridors should strengthen coordination among logistics, manufacturing, and business services. Ecologically sensitive areas or areas with limited development conditions should control development intensity and prioritize ecological connectivity and spatial buffering functions. Through differentiated governance, a more balanced spatial development pattern can be formed among industrial agglomeration, land-use efficiency, and ecological protection.

5.4. Limitations and Future Research

Several limitations of the present study must be acknowledged. First, the analytical design examines land-use transition and industrial spatial redistribution in parallel rather than through an integrated statistical model. Consequently, no causal relationship between the two processes can be established from the current data. Future research should employ firm-level longitudinal panel data and land parcel transaction records, combined with causal inference methods such as difference-in-differences or instrumental variable approaches, to disentangle the directionality of land–industry interactions. Second, enterprise registration addresses may differ from actual operating locations, introducing spatial uncertainty. Ground-truthing or mobile-phone signaling data could help verify enterprise locations in future work. Third, the land-use data consist of only three temporal snapshots (2013, 2018, 2023), which limits the ability to track continuous land conversion trajectories. Annual land-use time series, if available, would permit more dynamic analyses. Fourth, the present study characterizes changes in the spatial distribution of enterprises but does not measure changes in their functional composition (see response to Comment 5). Fifth, some socioeconomic variables (e.g., nighttime light intensity, population density) may exhibit endogeneity with enterprise density; their coefficients in the MGWR models are therefore interpreted as associations rather than causal effects. Future studies should consider instrumental variable approaches to address these endogeneity concerns. Despite these limitations, the concurrent spatial assessment presented here offers a useful baseline for understanding land-use and industrial dynamics in airport economic zones.

6. Conclusions

This study took the Nanjing Airport Economic Zone as the study area and integrated multi-source data, including land-use data, enterprise registration information, POIs, transportation networks, nighttime light intensity, population, topography, and ecological-environmental variables, to analyze land-use transition, industrial spatial restructuring, and their influencing factors from 2013 to 2023. The results show that the Nanjing Airport Economic Zone experienced significant land-structure adjustment and industrial spatial reorganization during the study period, and airport-oriented development had a continuous impact on regional land use and industrial spatial organization.
First, land-use transition in the Nanjing Airport Economic Zone from 2013 to 2023 was mainly characterized by cropland loss, impervious surface expansion, and water-body shrinkage. Among these changes, the conversion from cropland to impervious surfaces was the dominant land-use transition pathway, indicating that construction development and industrial spatial expansion around the airport had a clear impact on the original agricultural space. Land-use change was more pronounced during 2013–2018, while the expansion rate of construction land slowed during 2018–2023. However, impervious surfaces continued to increase, suggesting that land development in the study area gradually shifted from rapid outward expansion to relatively intensive spatial adjustment.
Second, the industrial spatial pattern of the Nanjing Airport Economic Zone showed significant agglomeration characteristics and experienced a staged transition from expansion to convergence. The Moran’s I results indicate that industrial spatial distribution had strong positive spatial autocorrelation. The standard deviation ellipse results further show that the distribution range of industrial space expanded during 2013–2018, whereas the ellipse area contracted during 2018–2023. This indicates that industrial space gradually shifted from early-stage diffusion to agglomeration around the core area and major transport-connected areas. The airport core area, transport corridors, and industry-related development areas were important carriers of industrial spatial restructuring.
Third, the influencing-factor analysis shows that economic vitality and transportation accessibility were important explanatory factors for industrial spatial distribution in the Nanjing Airport Economic Zone. The Geodetector results indicate that nighttime light intensity and accessibility to major transport nodes had relatively high explanatory power, while population density, rail transit accessibility, and road network density were also associated with industrial spatial distribution. The interaction detection results suggest that industrial spatial distribution was not determined by a single factor, but by the joint effects of transportation, economic, population, and natural-ecological conditions. The MGWR results further reveal that the strength and direction of different influencing factors varied across space, indicating that industrial spatial restructuring in the Nanjing Airport Economic Zone had clear spatial heterogeneity.
This study still has several limitations. First, enterprise registration information was based on registered addresses, which may differ from the actual operating locations of enterprises. Second, the spatial resolution of land-use data remains limited for identifying fine-scale land conversion. Third, policy factors, enterprise investment intensity, employment scale, and logistics flow were not fully quantified. Future studies could further incorporate high-resolution remote-sensing images, enterprise output and employment data, traffic flow and logistics flow data, and scenario simulation methods to assess the long-term impacts of different planning policies and industrial development pathways on land use and industrial spatial evolution in airport economic zones.


Author Contributions

Y.S.: data curation, formal analysis, methodology, writing—original draft, writing—review and editing. N.Y.: methodology, conceptualization, supervision, writing—review and editing. M.A.: investigation, writing—review and editing. J.H.: investigation, data curation, software. Y.T.: investigation, software. All authors have read and agreed to the published version of the manuscript.

Funding

This work was supported by the National Key Research and Development Program of China (Grant No. 2024YFE0214000).

Data Availability Statement

The original contributions presented in the study are included in the article. Further inquiries can be directed to the corresponding author.

Conflicts of Interest

The authors declare no conflicts of interest.

References

  1. Xu, Q.; Huang, K.; Zhao, X.; Jiang, Y. Service-led growth in airport economic zones: A multi-period DID analysis of China’s asymmetric policy impacts. J. Air Transp. Manag. 2025, 125, 102781. [Google Scholar]
  2. Yingnan, N.; Gaodi, X.; Yu, X.; Keyu, Q.; Shuang, G.; Jingya, L. Spatial and Temporal Changes of Ecosystem Service Value in Airport Economic Zones in China. Land 2021, 10, 1054. [Google Scholar] [CrossRef]
  3. Baofeng, H.; Mengqiu, G. How Does an Aerotropolis Integrate? A Case from Zhengzhou Airport Economy Zone. Logistics 2021, 5, 26. [Google Scholar] [CrossRef]
  4. Zhao, D.; Dongmei, X.; Wei, D. Research on Port-Industry-City Integration and its Spatial Spillover Effects: Empirical Evidence from the Bohai Sea Rim Region. Appl. Spat. Anal. Policy 2024, 17, 1653–1679. [Google Scholar]
  5. Tang, K.; Wang, J.H.; Wang, N. The Relationship between the Airport Economy and Regional Development in China. Emerg. Mark. Financ. Trade 2022, 58, 812–822. [Google Scholar]
  6. Freestone, R.; Baker, D. Spatial Planning Models of Airport-Driven Urban Development. J. Plan. Lit. 2011, 26, 263–279. [Google Scholar] [CrossRef]
  7. Bai, Y.; Feng, S. Spatial structure of Zhengzhou Airport Economy Zone: Its evolution and drivers. Arab. J. Geosci. 2021, 14, 888. [Google Scholar] [CrossRef]
  8. Jiang, Y.; Ng, A.K.Y.; Wang, Y.; Wang, L.; Yu, B. Locational Characteristics of Firms in the Business Service Industry in Airport Economic Zones: Case of Shanghai Hongqiao International Airport. J. Urban Plan. Dev. 2018, 144. [Google Scholar] [CrossRef]
  9. Wang, D.; Zhao, X.; Yang, Z. Optimization of industrial layout in airport economic zone through government-enterprise interaction. Sustain. Cities Soc. 2024, 116, 105905. [Google Scholar] [CrossRef]
  10. Dalian Maritime University. Design of industrial clusters and optimization of land use in an airport economic zone. Land Use Policy 2018, 77, 288–297. [Google Scholar] [CrossRef]
  11. Liang, Z.; Chao, Y. More sprawl than agglomeration: The multi-scale spatial patterns and industrial characteristics of varied development zones in China. Cities 2023, 140, 104416. [Google Scholar] [CrossRef]
  12. Dong, L. Study on Spatial Distribution of Employment in Shenyang. J. Comput. Theor. Nanosci. 2015, 12, 5236–5241. [Google Scholar] [CrossRef]
  13. Chao, Y.; Tian, G.; Wang, X.; Gu, Y. Economic Effect and Disparity of Airport Economic Zones Utilizing the Synthetic Control Method. Transp. Res. Rec. 2024, 2678, 482–498. [Google Scholar] [CrossRef]
  14. Yi, R.; Yuan, T.; Xue, X. Spatial effects of transportation infrastructure on the development of urban agglomeration integration: Evidence from the Yangtze River Economic Belt. J. Transp. Geogr. 2022, 104, 103431. [Google Scholar] [CrossRef]
  15. Koo, T.; Halpern, N.; Papatheodorou, A.; Graham, A.; Arvanitis, P. Air transport liberalisation and airport dependency: Developing a composite index. J. Transp. Geogr. 2016, 50, 83–93. [Google Scholar] [CrossRef]
  16. Zhao, J.; Hu, C.; Li, Z.; Zhang, M.; Fan, H.; Li, K.; Yuan, R. Investigating the quantitative impact of the vegetation indices on the urban thermal comfort based on machine learning: A case study of the Qinhuai River Basin, China. Sustain. Cities Soc. 2025, 125, 106357. [Google Scholar] [CrossRef]
  17. Ning, H.; Enjian, Y.; Yang, X. Roles of accessibility and air-rail intermodality in shaping mobility patterns in mega-city regions: Behavioural insights from China. Cities 2023, 143, 104591. [Google Scholar]
  18. Zhu, Z.; Zhang, A.; Zhang, Y. Connectivity of intercity passenger transportation in China: A multi-modal and network approach. J. Transp. Geogr. 2017, 71, 263–276. [Google Scholar]
  19. Wang, B.; Hu, C.; Zhang, Y. Multi-Scenario Simulation of the Impact of Land Use Change on the Ecosystem Service Value in the Suzhou-Wuxi-Changzhou Metropolitan Area, China. Chin. Geogr. Sci. 2024, 34, 79–92. [Google Scholar]
  20. Hu, C.; Zhang, M.; Huang, G.; Li, Z.; Sun, Y.; Zhao, J. Tracking the impact of the land cover change on the spatial-temporal distribution of the thermal comfort: Insights from the Qinhuai River Basin, China. Sustain. Cities Soc. 2024, 116, 105916. [Google Scholar] [CrossRef]
  21. Dongqi, S.; Chunguang, H.; Yu, W.; Ziyi, W.; Jingxiang, Z. Examining Spatio-Temporal Characteristics of Urban Heat Islands and Factors Driving Them in Hangzhou, China. IEEE J. Sel. Top. Appl. Earth Obs. Remote Sens. 2021, 14, 8316–8325. [Google Scholar] [CrossRef]
  22. He, C.; Yan, Y.; Rigby, D. Regional industrial evolution in China. Pap. Reg. Sci. 2018, 97, 173–198. [Google Scholar] [CrossRef]
  23. Boschma, R.; Coenen, L.; Frenken, K.; Truffer, B. Towards a theory of regional diversification: Combining insights from Evolutionary Economic Geography and Transition Studies. Reg. Stud. 2017, 51, 31–45. [Google Scholar] [CrossRef]
  24. Ziyi, W.; Dongqi, S.; Chunguang, H.; Yu, W.; Jingxiang, Z. Seasonal Contrast and Interactive Effects of Potential Drivers on Land Surface Temperature in the Sichuan Basin, China. Remote Sens. 2022, 14, 1292. [Google Scholar] [CrossRef]
  25. Chunguang, H.; Ziyi, W.; Jiaming, L.; Huan, L.; Dongqi, S. Quantifying the Temporal and Spatial Patterns of Ecosystem Services and Exploring the Spatial Differentiation of Driving Factors: A Case Study of Sichuan Basin, China. Front. Environ. Sci. 2022, 10, 927818. [Google Scholar] [CrossRef]
  26. Higano, Y. The Spatial Economy: Cities, Regions, and International Trade. Am. J. Agric. Econ. 2004, 86, 283–285. [Google Scholar] [CrossRef]
  27. Zhou, J.; Ain, Q.u.; Yousaf, T.; Zhong, K. Glowing Indicators: Nighttime Luminosity as a Tool for Assessing SDG-8 Progress in Emerging Economies. Sustain. Dev. 2025, 33, 4909–4921. [Google Scholar]
  28. Cesario, F.J. Linear and Nonlinear Regression Models of Spatial Interaction. Econ. Geogr. 2016, 51, 69–77. [Google Scholar]
  29. Getis, A. A history of the concept of spatial autocorrelation: A geographer’s perspective. Geogr. Anal. 2008, 40, 297–309. [Google Scholar]
  30. Yue, Y.; Yongsheng, Q.; Junwei, Z.; Xuting, W.; Minan, Y. Walkability Measurement of 15-Minute Community Life Circle in Shanghai. Land 2023, 12, 153. [Google Scholar] [CrossRef]
  31. Liu, Z.; Zhang, S.; Fan, W.; Huang, L.; Zhang, X.; Luo, M.; Wang, S.; Yang, L. Associations between Surface Deformation and Groundwater Storage in Different Landscape Areas of the Loess Plateau, China. Land 2024, 13, 184. [Google Scholar] [CrossRef]
  32. Chunguang, H.; Gaoliu, H.; Zhiyong, W. Exploring the seasonal relationship between spatial and temporal features of land surface temperature and its potential drivers: The case of Chengdu metropolitan area, China. Front. Earth Sci. 2023, 11, 1226795. [Google Scholar] [CrossRef]
  33. Zhu, H.; Wang, A.; Wang, P.; Hu, C.; Zhang, M. Spatiotemporal Dynamics and Response of Land Surface Temperature and Kernel Normalized Difference Vegetation Index in Yangtze River Economic Belt, China: Multi-Method Analysis. Land 2025, 14, 598. [Google Scholar] [CrossRef]
  34. Huang, G.; Feng, S.; Hu, C. A Study of the Spatiotemporal Evolution Patterns and Coupling Coordination between Ecosystem Service Values and Habitat Quality in Diverse Scenarios: The Case of Chengdu Metropolitan Area, China. Sustainability 2024, 16, 3741. [Google Scholar] [CrossRef]
Figure 1. (ac) Location of the study area.
Land 15 01214 g001
Figure 2. Methodological framework.
Land 15 01214 g002
Figure 3. Spatial distribution of land-use types in the Nanjing Airport Economic Zone in different years: (a) 2013; (b) 2018; (c) 2023.
Land 15 01214 g003
Figure 4. Overall land-use evolution in the Nanjing Airport Economic Zone: (a) 2013; (b) 2018; (c) 2023.
Land 15 01214 g004
Figure 5. Major land-use conversion types in the Nanjing Airport Economic Zone from 2013 to 2023.
Land 15 01214 g005
Figure 6. Spatial distribution characteristics of industrial activities in the Nanjing Airport Economic Zone: (a) 2013; (b) 2018; (c) 2023.
Land 15 01214 g006
Figure 7. Changes in industrial types and development trends in the Nanjing Airport Economic Zone from 2013 to 2023.
Land 15 01214 g007
Figure 8. Spatial distribution of influencing-factor indicators.
Land 15 01214 g008
Figure 9. Factor detection and interaction detection results from Geodetector.
Land 15 01214 g009
Figure 10. Spatial distribution of local regression coefficients from the MGWR model.
Land 15 01214 g010
Figure 11. Framework of driving mechanisms for industrial spatial restructuring in the Nanjing Airport Economic Zone.
Land 15 01214 g011
Table 1. Indicator system and data sources for spatial evolution and influencing factors.
IndicatorCalculation MethodPurposeSpatial Resolution/Analysis ScaleTime PeriodData Source
Spatial evolutionLand-use changeLand-use reclassification, area statistics, and transition matrixTo analyze land-use changes and conversion pathways from 2013 to 202330 m; unified grid scale2013, 2018, 2023Wuhan University 30 m land-use product
Industrial spatial distribution (Y)Geocoding, spatial filtering, and density statisticsTo characterize the evolution of industrial spatial patterns; enterprise density in 2023 was used as the dependent variable YUnified grid scale2013, 2018, 2023Aiqicha enterprise registration information; OpenStreetMap; Gaode Map API
Transportation and locational factorsDistance to airport (B1)GIS-based Euclidean distanceTo represent airport proximityUnified grid scale2023Gaode Map API
Distance to metro station (B2)GIS-based Euclidean distanceTo represent rail transit accessibilityUnified grid scale2023Gaode Map API; OpenStreetMap
Distance to major transport access points (B6)GIS-based Euclidean distanceTo represent accessibility to major transport nodesUnified grid scale2023OpenStreetMap; Gaode Map API
Road network density (B5)GIS-based line density analysisTo represent road transport supplyUnified grid scale2023OpenStreetMap road network data
Socioeconomic factorsPopulation density (B3)Raster resampling and grid-based mean statisticsTo represent population concentration500 m; unified grid scale2023Population grid data, original resolution of 500 m × 500 m
Nighttime light intensity (B4)Raster resampling and grid-based mean statisticsTo represent economic vitality and development intensity500 m; unified grid scale2023Nighttime light data, original resolution of 100 m × 100 m
Natural and ecological factorsSlope (B7)DEM-based slope extraction and grid-based statisticsTo represent topographic relief and development constraints30 m; unified grid scaleStatic variableDEM data from the National Platform for Common Geospatial Information Services
Distance to water system (B8)GIS-based Euclidean distanceTo represent water-system proximity and ecological constraintsUnified grid scale2023Water-system data from the National Platform for Common Geospatial Information Services
Green space density (B9)Area proportion method/neighborhood statisticsTo represent green-space supply and ecological constraintsUnified grid scale2023National Platform for Common Geospatial Information Services; land-use data
Table 2. Changes in land-use structure in the Nanjing Airport Economic Zone from 2013 to 2023.
Type201320182023
Area (KM2)Percentage (%)Area (KM2)Percentage (%)Area (KM2)Percentage (%)
Cropland81.072983.001%72.582374.308%70.118171.786%
Woodland0.12690.130%0.04680.048%0.0360.037%
Grassland0.00180.002%0.01890.019%0.07020.072%
Water5.4995.630%4.82314.938%1.78561.828%
Bare ground0.00090.001%0.02520.026%0.01710.018%
Impervious surface10.975511.237%20.180720.661%25.6526.260%
Table 3. Dynamic degree of land-use change in the Nanjing Airport Economic Zone from 2013 to 2023.
Type2013–20132018–20232013–2023
Cropland−1.05%−0.34%−0.68%
Woodland−6.31%−2.31%−3.58%
Grassland95.00%27.14%190.00%
Water−1.23%−6.30%−3.38%
Bare ground270.00%−3.21%90.00%
Impervious surface8.39%2.71%6.69%
Table 4. Standard deviation ellipse parameters of industrial space in the Nanjing Airport Economic Zone from 2013 to 2023.
YearCentre Point x-CoordinateCentre Point y-CoordinateEllipse x-Axis Length/kmLength of Ellipse y-Axis/kmAzimuth Angle/(°)Ellipse Circumference/kmArea of Ellipse/km2
2013118.8631.764.932.7893.2933.6343.22
2018118.8631.765.292.9689.7636.2649.18
2023118.8631.764.592.2099.7230.7231.65
Table 5. Comparison of OLS, GWR, and MGWR model fitting results.
Comparison of Regression Models
ModelR2Adjusted R2AICc
OLS0.8390.837537.532
GWR0.8850.88749.073
MGWR0.8970.894764.121
Table 6. Summary statistics of local regression coefficients from the MGWR model.
VariablesDescriptionMeanSTDMinMedianMax
InterceptIntercept term0.0080.334−4.3600.0013.411
B1Distance to airport−0.0041.740−25.7420.00316.539
B2Distance to metro station−0.0581.249−29.371−0.00415.144
B3Population density0.0500.923−19.6530.0075.689
B4Nighttime light intensity0.0360.290−3.8890.0014.121
B5Road network density−0.0350.316−4.310−0.0011.744
B6Distance to major transport entrance0.1190.707−6.7790.00611.840
B7Slope0.0020.059−0.8360.0001.477
B8Distance to water system−0.0470.293−6.085−0.0021.609
B9Green space density−0.0580.987−16.0340.00122.170
Disclaimer/Publisher’s Note: The statements, opinions and data contained in all publications are solely those of the individual author(s) and contributor(s) and not of MDPI and/or the editor(s). MDPI and/or the editor(s) disclaim responsibility for any injury to people or property resulting from any ideas, methods, instructions or products referred to in the content.