Article

Impact of Extreme Climate Events on Community Planning and Flood Risk Management in Giant Panda National Park


1
Department of Landscape Architecture, School of Architecture, Southwest Jiaotong University, Chengdu 611756, China
2
Department of Urbanism, Faculty of Architecture and the Built Environment, Delft University, Julianalaan 134, 2628 BL Delft, The Netherlands
3
Institute for Disaster Management and Reconstruction, Sichuan University, Chengdu 610200, China
4
Institute of Artificial Intelligence, Shaoxing University, 508 West Huancheng Road, Yuecheng District, Shaoxing 312000, China
*
Author to whom correspondence should be addressed.
Land 2026, 15(7), 1201; https://doi.org/10.3390/land15071201
Submission received: 6 May 2026 / Revised: 5 June 2026 / Accepted: 18 June 2026 / Published: 4 July 2026

Abstract

Extreme rainfall events intensify flood-related hazards in mountainous national parks and their surrounding communities, where complex terrain and coupled hazard processes create major challenges for spatial risk management. This study focuses on the Tangjiahe district of the Giant Panda National Park and develops an integrated framework for flood-related multi-hazard identification and zoning. The 100-year flood process was simulated using Hydrologic Engineering Center’s River Analysis System (HEC-RAS), runoff retention was assessed using the Integrated Valuation of Ecosystem Services and Tradeoffs (InVEST) model, and slope stability risk zoning was conducted using the Analytic Hierarchy Process (AHP). Based on multi-source spatial overlay, Integrated Flood-Related Multi-Hazard Risk Zoning was generated. Spatial statistical analyses, including Global Moran’s I, Local Indicators of Spatial Association (LISA), and Getis-Ord Gi*, supported the identification of clustered high-risk areas and hotspot zones. In parallel, Disaster Prevention and Control Zoning was established, classifying the study area into multiple management-oriented zones to support differentiated spatial governance and targeted management. The proposed framework provides a practical approach for integrating multi-hazard processes into spatial planning and disaster risk management in mountainous protected areas.

1. Introduction

Over the past century, mountain protected areas and national parks worldwide have maintained mutually supportive relationships with their surrounding communities and downstream cities through watershed processes. Upstream habitat fragmentation can affect hydrological processes, increase downstream flood risk and water resource instability, and directly threaten the safety and development of downstream human communities [1,2,3,4]. According to the Intergovernmental Panel on Climate Change (IPCC) Sixth Assessment Report (2021), climate change has led to continuous increases in both the frequency and intensity of extreme precipitation events, resulting in a sharp rise in the probability of extreme disasters threatening human settlements [5,6,7,8,9,10]. In addition, the coupled effects of climate change and human activities have been recognized as a key driver of disaster risk evolution, jointly influencing hydrological processes, land-use patterns, and ecosystem stability across multiple spatial scales [11,12]. Under this context, disaster risks faced by mountain protected areas and their surrounding human communities are intensifying, and conducting systematic monitoring and risk mitigation for human safety in and around mountain protected areas and national parks has become an urgent issue [13]. Meanwhile, existing studies have pointed out that national parks and mountainous protected areas are continuously exposed to multiple types of natural hazards, and extreme disaster events have become a critical factor affecting ecosystem stability and the safety of surrounding communities [14,15].
In international research, substantial work has been conducted on flood-related issues in mountainous regions and areas surrounding national parks. For example, in Huascarán National Park in Peru, glacial lake outburst floods originating from upstream have long posed a threat to the downstream city of Huaraz. In the Bow River basin in Canada, hydrological processes in the upstream Banff National Park continuously influence the downstream city of Calgary and led to an extreme flood event with an approximate 80-year return period in 2013. Research on Huascarán National Park in Peru and its gateway city, Huaraz, has focused on glacial lake outburst floods. By coupling processes such as ice avalanches, lake outbursts, and flood propagation, these studies simulate the entire disaster chain and generate corresponding inundation extents and hazard distribution results [16]. Some studies further incorporate multi-source data and scenario-based approaches to simulate hazard processes under different magnitudes and probabilities, producing spatial outputs to support risk identification and management. These studies show that, under climate warming, glacier retreat and glacial lake expansion increase the uncertainty of flood occurrence, while the growth of downstream population and infrastructure further increases risk exposure [17]. In addition, geospatial approaches have been used to integrate exposure, sensitivity, and adaptive capacity, enabling comprehensive assessments of flood risk and further advancing flood risk analysis from single-hazard perspectives to multi-dimensional representations [18]. The Bow River basin in Canada provides another typical case. Studies have shown that floods in the upstream Banff region are mainly driven by snowmelt and rain-on-snow processes and that large-scale precipitation combined with snowpack conditions constitutes a key mechanism for the occurrence of extreme floods [19]. On this basis, studies focusing on Calgary have further simulated flood processes and inundation extents using hydrodynamic models and analyzed channel morphology changes and sediment transport under extreme flood conditions, providing a basis for flood regulation and river management [20].
Meanwhile, some studies have incorporated data-driven methods to predict flood processes, continuously improving the simulation of flood evolution [21]. Other research has coupled Hydrologic Engineering Center’s River Analysis System (HEC-RAS) with Simulation of Urban Mobility (SUMO) models to simulate traffic responses under flood and rainfall conditions, showing that floods not only cause direct inundation but also trigger indirect and cascading effects through road disruptions, thereby reducing transportation system efficiency [22]. At the same time, studies from a social perspective have found that flood impacts are not purely physical processes, as residents’ risk perception and their trust in management measures can influence disaster response [23].
Beyond these typical cases, international research on disaster risk in national parks and other types of protected areas and their surrounding regions has continued to develop, with a gradual shift from flood process analysis to multi-factor integrated assessment. Some studies have focused on identifying the vulnerability of national parks under climate change from the perspective of natural resources and ecosystems to support adaptive management [24], while others have extended risk analysis to tourism and human activities, assessing the overall risk and resilience of protected area systems [25]. In terms of methods, remote sensing and Geographic Information System (GIS) combined with multi-criteria evaluation have been widely used for the spatial identification of flood risk [26]. Hydrodynamic models such as HEC-RAS have also been introduced and applied in different regions, demonstrating stable performance in simulating flood processes and their impacts, and have been used for flood simulation and risk analysis in mountainous catchments lacking observed discharge data [27]. Some studies have further simulated flood processes and their ecological impacts to analyze the effects on key species habitats, such as gazelles in the Mond Protected Area, in support of conservation actions [28]. On this basis, related studies have progressively integrated multi-source data and models, and incorporated multi-algorithm combinations, composite indicator evaluation, and decision-support approaches to spatially characterize and model disaster risk [29]. At the same time, some research has expanded the focus to infrastructure and social systems, examining the impacts of floods on related facilities and their cascading effects [30], and has pointed out gaps between institutional arrangements and actual management practices [31].
Despite these developments, existing studies have expanded from flood process simulation to ecological impacts, infrastructure, and social systems; however, different types of research are often conducted separately, typically focusing on hydrodynamic processes, ecological responses, or traffic impacts, with limited integration within a unified analytical framework. Existing flood risk zoning studies are mainly concentrated in urban or lowland areas, emphasizing infrastructure exposure and population distribution, whereas in the specific context of national parks and their surrounding communities, research that integrates natural terrain, hydrological processes, and community activity characteristics for spatial zoning remains limited, particularly lacking comprehensive identification of differences among different types of communities in terms of spatial structure, population, and activity intensity.
To address the above gaps, this study develops an integrated disaster risk identification framework for national parks and their surrounding communities by integrating flood process simulation, runoff retention assessment, and slope stability risk zoning at a unified spatial scale. First, hydrodynamic modeling is used to identify flood inundation extent and hazard intensity under extreme rainfall scenarios. Second, the Urban Stormwater Retention model of Integrated Valuation of Ecosystem Services and Tradeoffs (InVEST) is applied to estimate annual rainfall–runoff retention and surface runoff output based on land use, soil type, and precipitation data, thereby characterizing runoff retention capacity and its spatial variation under different land cover conditions. Meanwhile, considering that integrated risk identification involves multiple heterogeneous factors, including topography, geology, hydrology, and human activities, and that these different types of indicators are difficult to represent within a single model, a unified weighting framework is required. Therefore, the Analytic Hierarchy Process (AHP) is employed to assign weights to different risk factors and conduct slope stability risk zoning across the entire study area. Based on these results, a comprehensive flood risk pattern is constructed through multi-source risk overlay, and spatial statistical methods, including Global Moran’s I, Local Indicators of Spatial Association (LISA), and Getis-Ord Gi*, are used to identify spatial clustering characteristics and hotspot areas. These analyses further support the development of a community-scale risk classification and disaster prevention zoning scheme, providing an analytical framework for disaster risk governance and spatial planning in national parks and their surrounding communities.
In July 2024, an extreme flood event with a return period of one hundred years occurred in the Tangjiahe district of the Giant Panda National Park (hereafter referred to as the Tangjiahe district). The Tangjiahe district is one of the areas within the Giant Panda National Park with the highest biodiversity, the best habitat quality, and among the most advanced community management systems [32]. The occurrence of such an extreme flood event under these conditions reflects the vulnerability of mountain national parks to disasters under extreme climate conditions, as well as existing shortcomings in disaster monitoring and prevention. In addition to this event, historical records indicate that the Tangjiahe district has experienced multiple types of hazards, including landslides, collapses, and flood-related processes, reflecting the complexity of disaster risks in the area (Table 1). Therefore, it is necessary to focus on a representative national park and its surrounding communities, integrate flood processes, slope instability risks, runoff regulation capacity, and human activity factors within a unified analytical framework, and conduct comprehensive risk identification of floods and related hazards, as well as further develop disaster prevention zoning, in order to provide scientific support for community planning and disaster risk reduction.
The main contributions of this study are as follows:
(a)
Integrating flood inundation simulation, runoff retention assessment, and slope stability risk zoning across the entire study area within a unified analytical framework, thereby extending analysis from single-hazard assessment to comprehensive risk identification;
(b)
Introducing spatial statistical methods, including Global Moran’s I, Local Indicators of Spatial Association (LISA), and Getis-Ord Gi*, based on composite risk overlay to identify spatial clustering patterns and hotspot areas, thus enhancing the spatial interpretability of risk identification;
(c)
Establishing a dual system of “risk classification–disaster prevention zoning,” which further translates disaster risk identification into disaster prevention and control zoning to support disaster risk reduction and planning management for national parks and their surrounding communities.
The remainder of this paper is organized as follows. Section 2 introduces the study area and datasets. Section 3 describes the methodology in detail, including flood simulation, runoff retention assessment, slope stability risk zoning across the entire study area, composite risk overlay, spatial autocorrelation and cluster identification, and the construction of disaster prevention zoning. The results and analysis are then presented, followed by the conclusions and management implications.

2. Study Area and Data Sources

2.1. Study Area

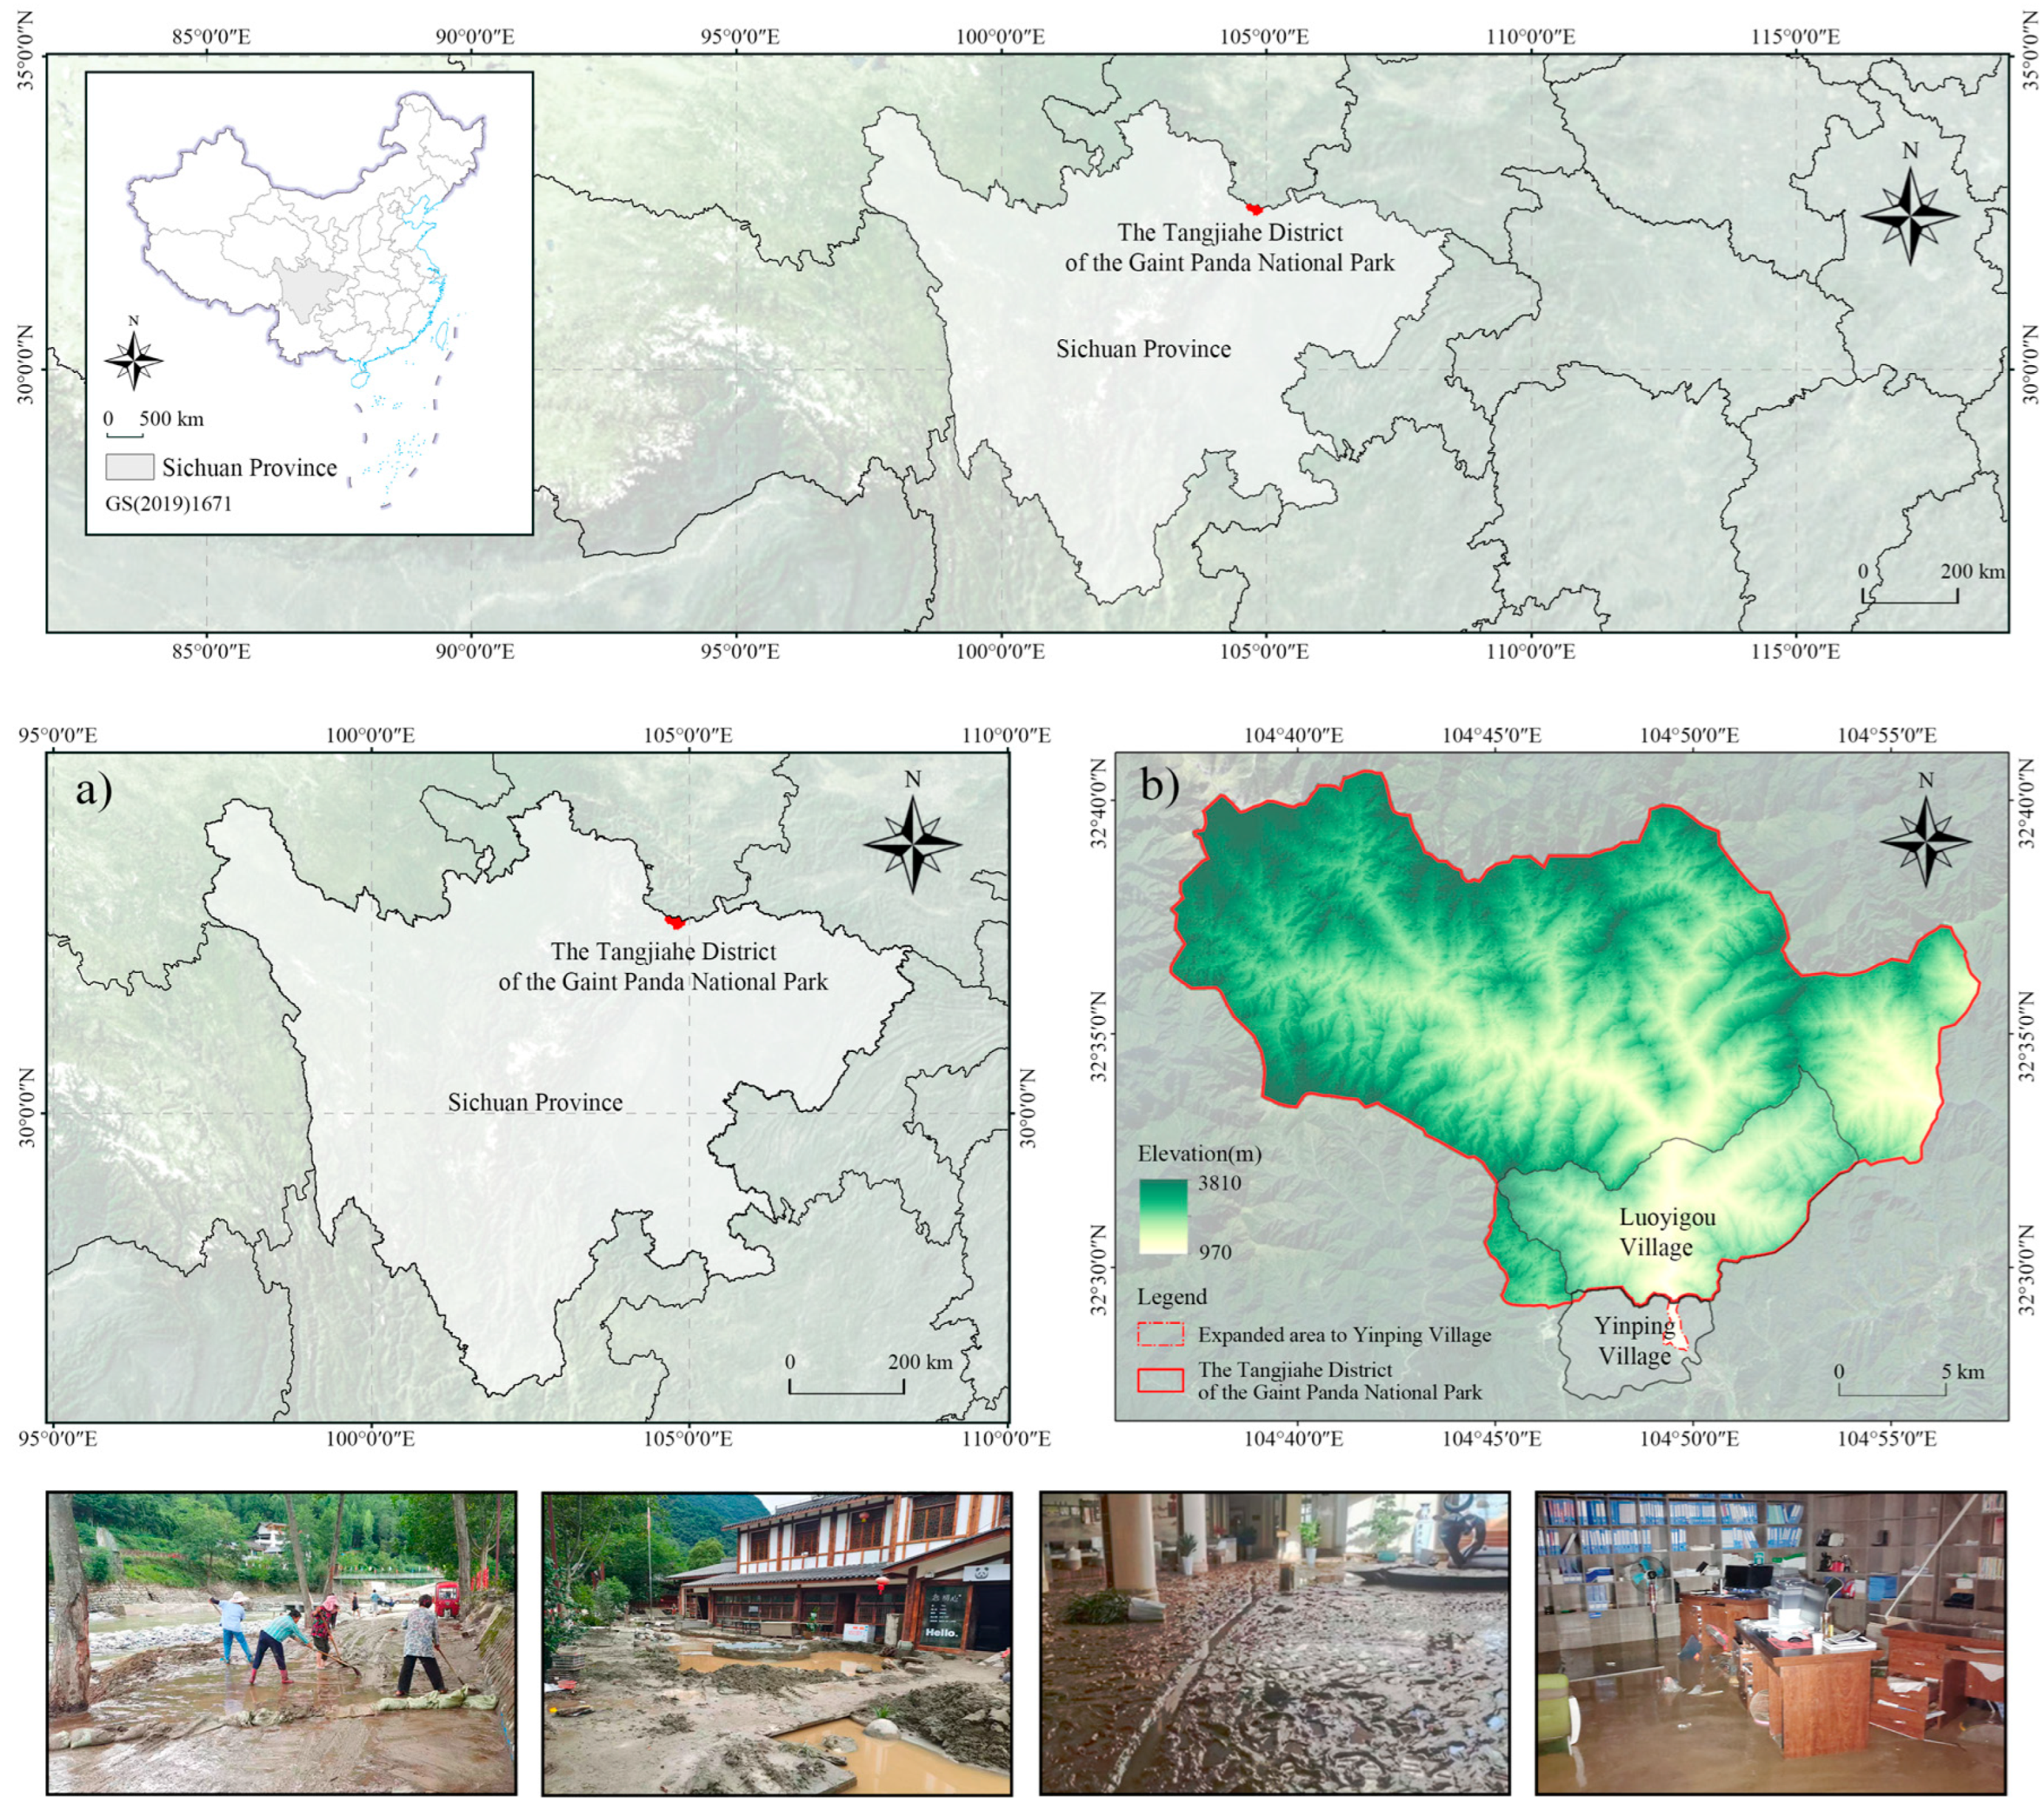
The Tangjiahe district of the Giant Panda National Park (hereafter referred to as the Tangjiahe district) is located in Qingchuan County, Guangyuan City, Sichuan Province, China, at the intersection of the Minshan Mountains and the Longmen Mountains. The boundary of this study covers the entire Tangjiahe district and is partially extended to include the area of Yinping Village (104.612–104.955° E, 32.470–32.678° N) (Figure 1). The area was included because it lies beyond the Giant Panda National Park boundary. Given its status as a permanent residential zone, it has experienced significant impacts from the 100-year flood event. This region is a high-mountain canyon area transitioning from the Northwest Sichuan Plateau to the Sichuan Basin. The elevation ranges from 970 m to 3810 m, with a relative height difference of 2840 m. Affected by deep river valleys and steep slopes, the hydrological process in this area responds quickly to rainfall. According to 29 questionnaires conducted with local residents (aged 26 to 89), it was confirmed that a “once-in-a-century” flood occurred in the region from 23 to 24 July 2024. The flash floods and secondary disasters resulted in extensive damage to transportation routes and infrastructure.
Luoyigou and Yinping Villages were specifically selected as the primary study units. From the perspective of flood risk, these two administrative villages exhibit the most prominent and severe disaster history compared to other villages in the Tangjiahe sector of the Giant Panda National Park, making them highly representative cases for flood risk management research. Yingping Village, as a gateway community of the area, has a relatively large spatial extent and a concentrated population, and is dominated by tourism activities, with high visitor flows and intensive daily activities, resulting in relatively high exposure and a broader potential impact range during flood events. In contrast, Luoyigou Village, located within the protected area, is more spatially dispersed, with some buildings distributed along river valleys and slopes, and is more likely to be directly affected under the combined influence of floods and secondary hazards such as landslides and debris flows. These differences lead to distinct patterns in disaster impacts and risk distribution among communities, which cannot be adequately captured by single-scale or uniform analytical approaches [33,34].

2.2. Data Collection and Preprocessing

The data utilized in this study primarily include the following (Table 2): The Digital Elevation Model (DEM) was provided by the Administration of Tangjiahe National Nature Reserve [35], with a spatial resolution of 30 × 30 m. Rainfall intensity and duration data were obtained from the Qingchuan Meteorological Station (Station No. 57204) in Guangyuan City, Sichuan Province, China. Remote sensing imagery was sourced from the ESRI platform (https://www.esri.com/; accessed on 9 October 2024).
Land Use and Land Cover (LULC) data and the Normalized Difference Vegetation Index (NDVI) were derived from United States Geological Survey (USGS) Landsat 8 satellite imagery (Product ID: LC09_L1TP_128036_20241231_20241231_02_T1) available via the USGS EarthExplorer (https://earthexplorer.usgs.gov/; accessed on 18 April 2025). Specifically, LULC was performed through supervised classification in ArcGIS 10.8, and NDVI was calculated using Environment for Visualizing Images (ENVI) 5.3, both at a spatial resolution of 30 × 30 m. Spatial distribution of lithology and fault structures were extracted from the 1:2,500,000 Digital Geologic Map Spatial Database of China [36]. Soil texture data, based on the United States Department of Agriculture (USDA) classification system, were obtained from the Geographic Data Sharing Infrastructure, global resources data cloud (http://www.gis5g.com/; accessed on 8 May 2025). Road network data were retrieved from OpenStreetMap (https://www.openstreetmap.org/; accessed on 17 September 2025).
River networks, water bodies, building footprints, and cropland were digitized by the authors based on high-resolution remote sensing imagery. During the data preprocessing stage, following rigorous geometric correction, registration, and projection transformation, all raster and vector datasets were unified into the WGS_1984_UTM_Zone_48N coordinate system. Furthermore, the spatial resolution of all datasets was standardized to 30 × 30 m using the resampling technique.

3. Methods

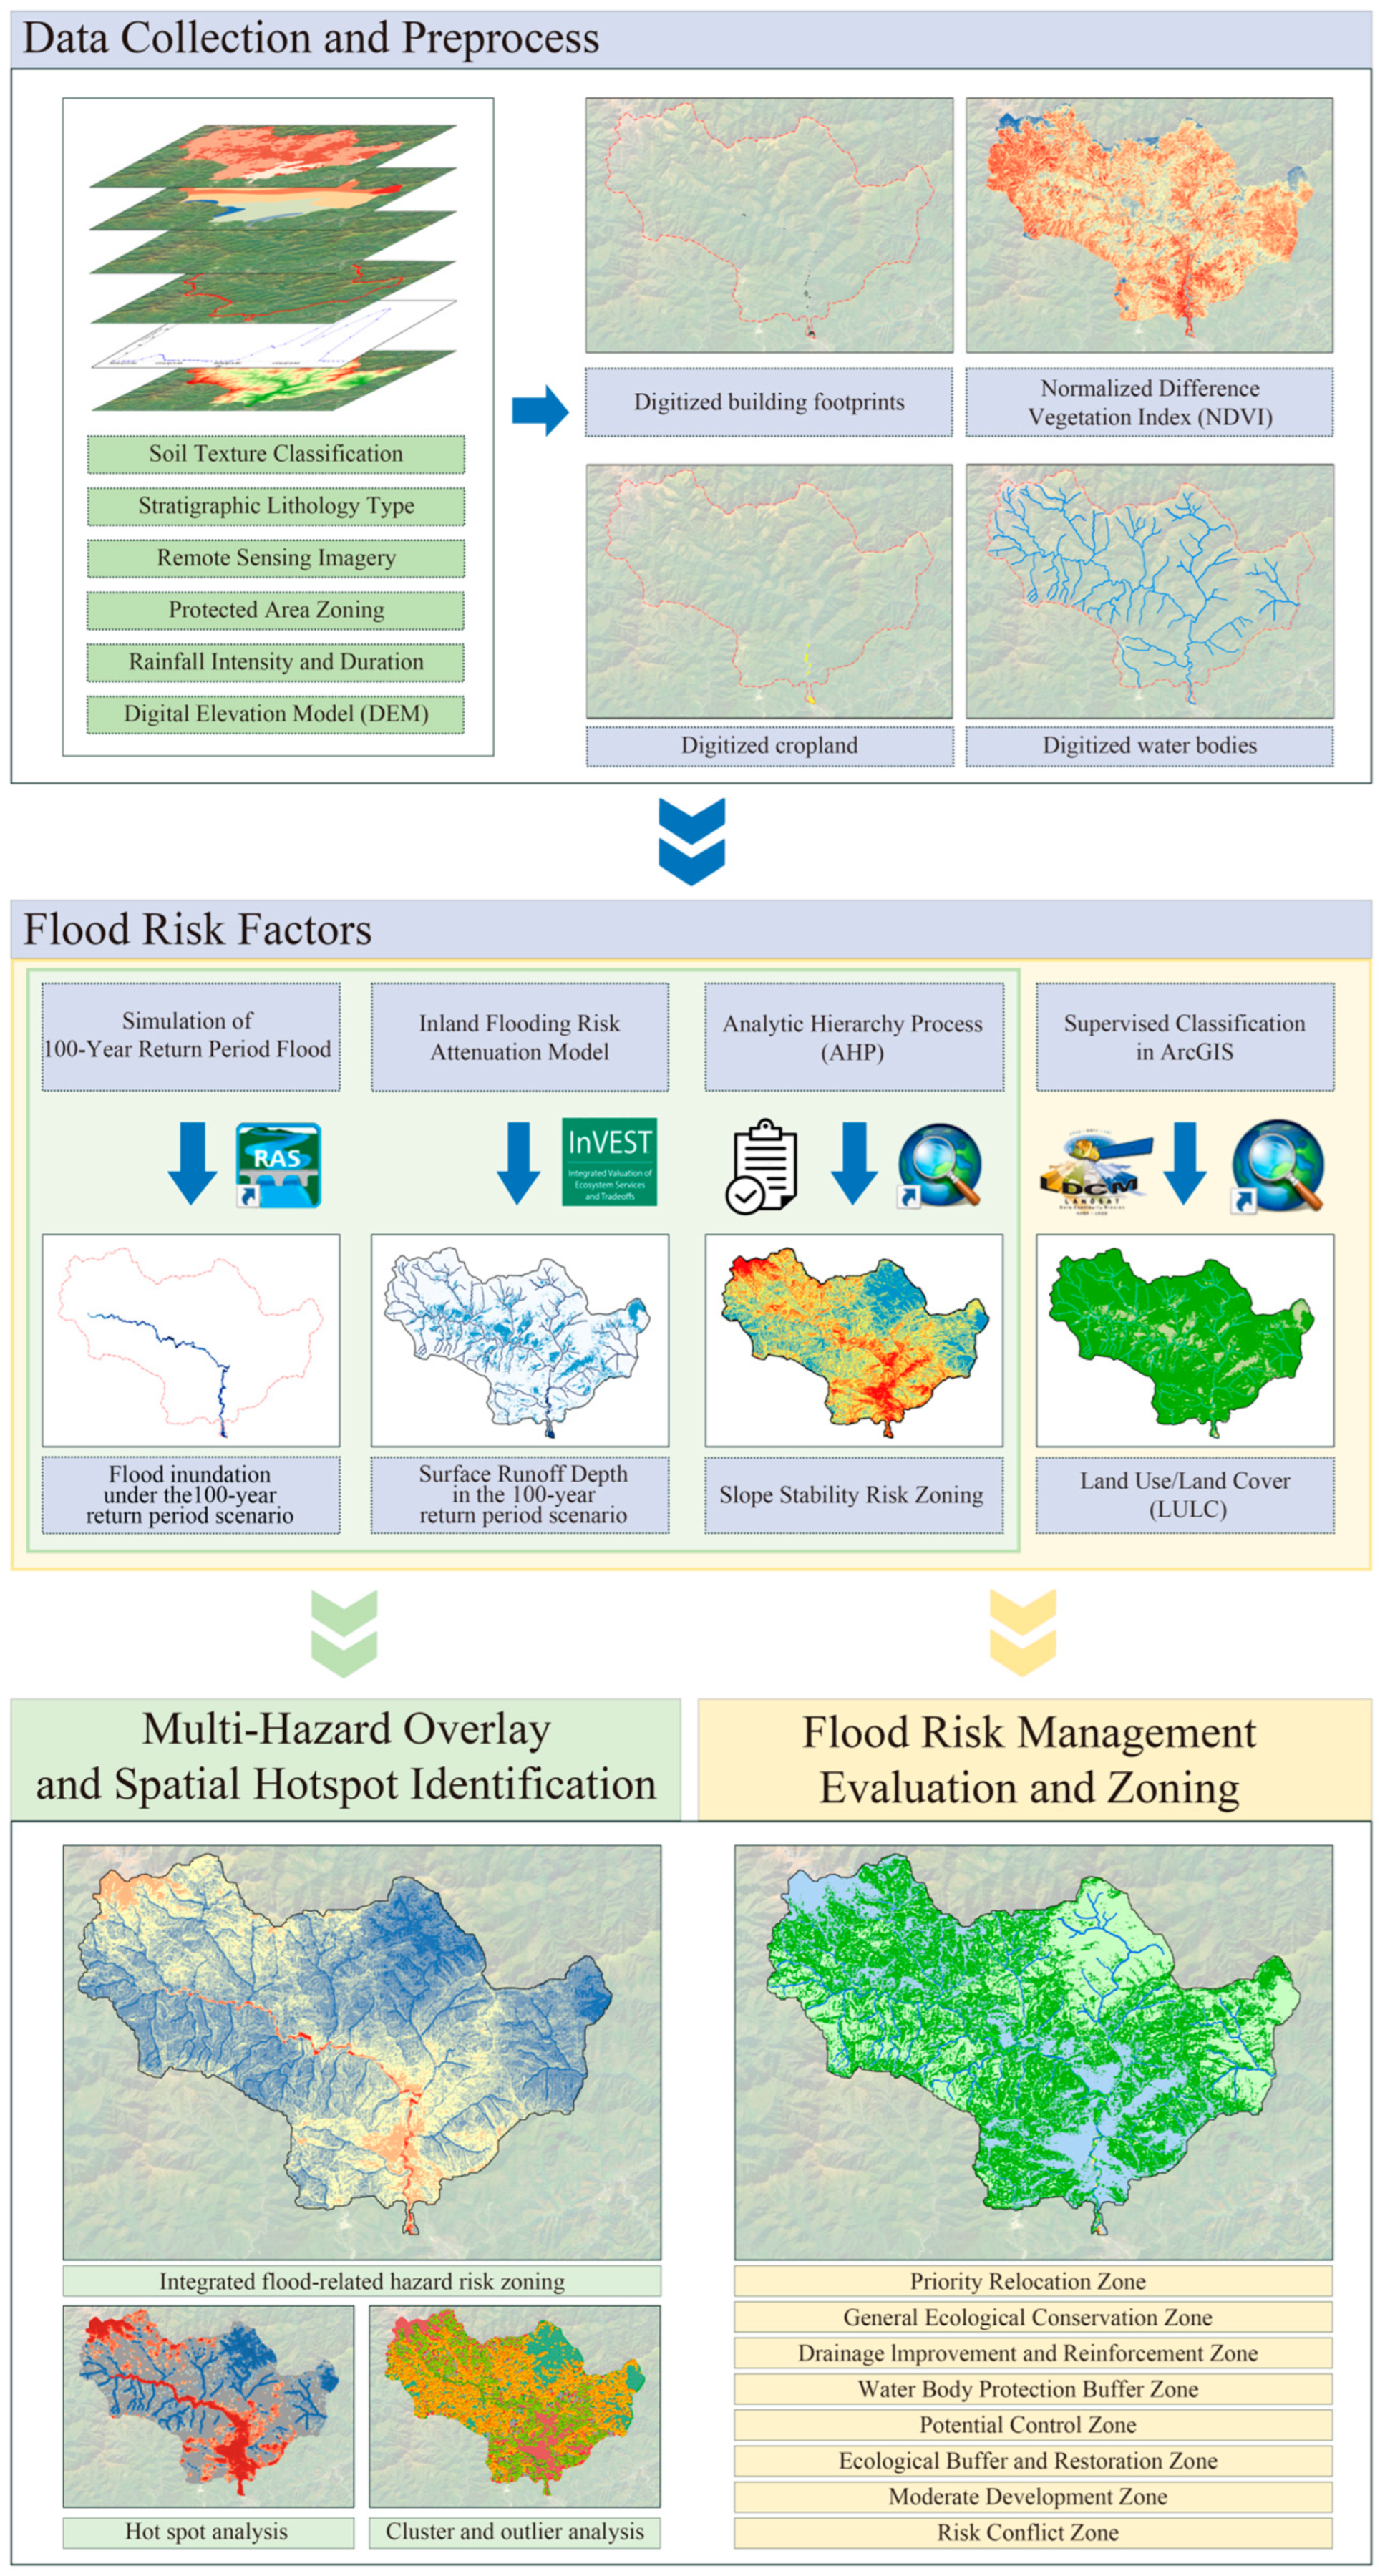
This study develops a complete analytical framework for identifying and zoning flood and related hazard risks in national park communities under extreme climate conditions based on multi-source data. First, HEC-RAS is used to simulate flood processes under the 100-year rainfall scenario, generating the spatial distribution of flood inundation extent and water depth in the study area. At the same time, the Urban Flood Risk Mitigation module of InVEST is applied to evaluate runoff regulation capacity under different land-cover conditions, from which runoff retention volume and runoff retention index are derived. Second, the AHP, combined with GIS, is employed to integrate and weight multiple conditioning factors, including topographic, geological, hydrological, vegetation-ecological, and anthropogenic variables, in order to conduct Slope Stability Risk Zoning across the study area. On this basis, the flood inundation results, Slope Stability Risk Zoning results, and runoff regulation capacity results are spatially overlaid to construct a comprehensive hazard risk identification model, which is further examined using spatial statistical methods, including Global Moran’s I, LISA, and Getis-Ord Gi*, to detect clustering patterns and hotspot areas. Finally, by integrating land-use types, comprehensive risk levels, and differentiated management requirements, an integrated risk zonation and disaster prevention zoning framework is established at the community scale. The flow chart of this research is shown in Figure 2.
This study implemented two parallel spatial management frameworks: the integrated flood-related multi-hazard risk classification and the disaster prevention and control zoning. The former, derived from the Spatial Overlay Analysis of HEC-RAS, AHP, and InVEST models, aims to quantitatively assess the physical attributes of natural hazards and identify areas under higher threat under natural conditions. In contrast, the disaster prevention and control zoning is an independent management system constructed based on land-use classification and predefined planning standards. This zoning system does not utilize the raster outputs of the hazard assessment; instead, it is delineated directly through a screening logic that integrates land-use attributes with specific management requirements. Its primary objective is to define “which specific management actions (e.g., relocation, conservation, consolidation, or control) should be implemented based on land-use characteristics.” This dual-zoning strategy establishes a multi-layered disaster management framework from two distinct dimensions: natural risk diagnosis and land-use governance response.

3.1. Flood Simulation and Risk Mapping

Owing to the abruptness and substantial destructiveness of regional floods, numerical simulation serves as a pivotal approach for assessing potential inundation risks in disaster prevention and mitigation. This study employed HEC-RAS 6.6 software for hydraulic modeling. First, the river geometry was extracted based on a DEM with a spatial resolution of 30 × 30 m to construct a geometric model encompassing the centerline, bank lines, flow paths, and cross-sections. Given the alpine-canyon topography of the study area and the 30 × 30 m DEM resolution, cross-sections were deployed at an average interval of 200 m to capture variations in river gradients and channel morphology. Manning’s roughness coefficients (n) were assigned to different regions based on LULC types, as shown in Table 3 [37,38,39,40,41,42].
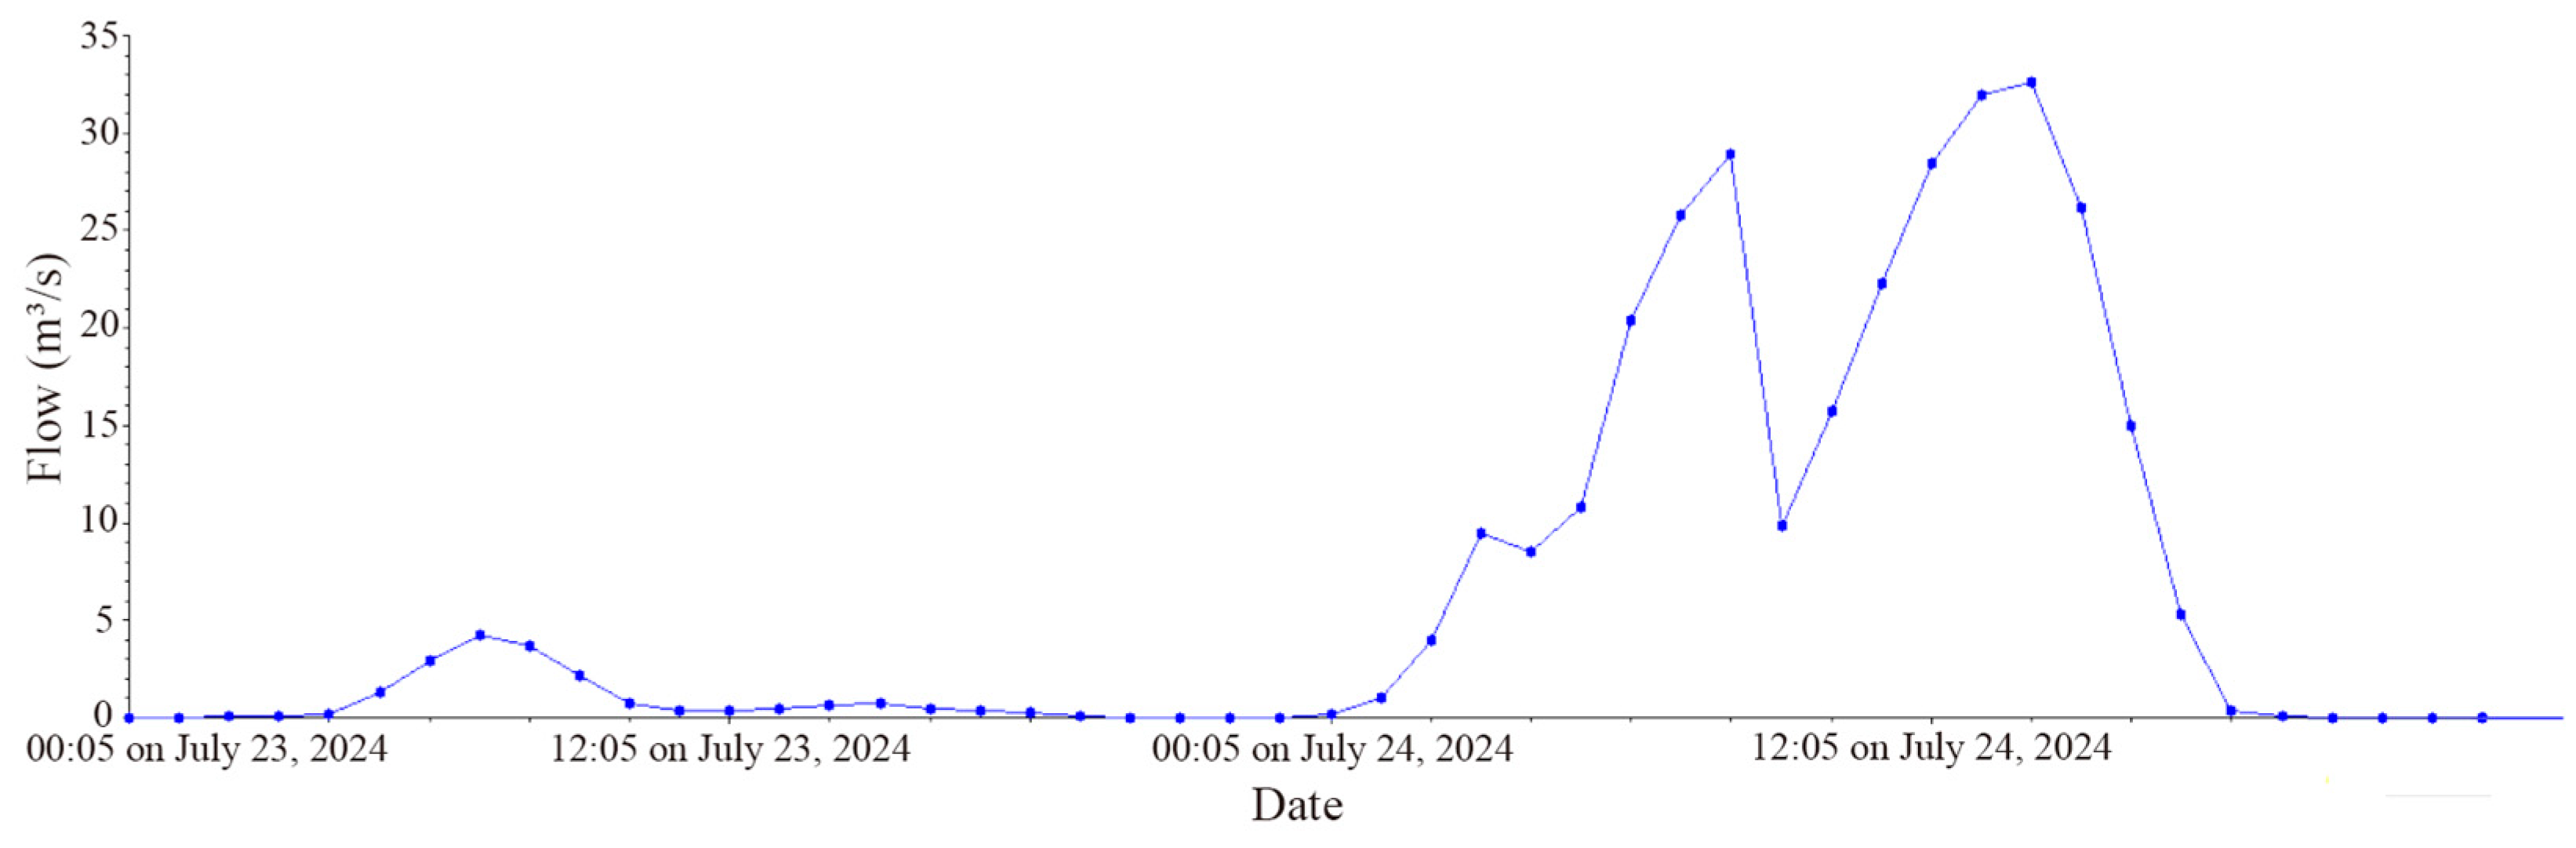
To evaluate disaster intensity under extreme weather conditions, this study focused on a “100-year return period” flood scenario. In the simulation, the upstream boundary condition was defined by a 100-year design flood hydrograph. This hydrograph was derived from hourly rainfall records spanning from 0:00 on 23 July to 23:00 on 24 July 2024 (UTC+8). The rainfall-runoff conversion, resulting in a peak discharge of 32.6 m3/s, was implemented using the empirical formulas specified in the Manual for Storm Flood Calculation in Small and Medium-sized Basins of Sichuan Province (1984). The resulting inflow hydrograph used for the upstream boundary condition is shown in Figure 3. The downstream boundary condition was set as a Flow Hydrograph. Utilizing the Unsteady Flow module of HEC-RAS 6.6, spatially continuous data on inundation extent and depth were generated.
Furthermore, to quantitatively assess the regulatory capacity of terrestrial ecosystems on rainfall-runoff at the watershed scale, the Urban Flood Risk Mitigation module of InVEST 3.15.0 was utilized. Based on the Soil Conservation Service Curve Number (SCS-CN) method from the United States Department of Agriculture (USDA), this model evaluates the interception effects of various land covers on design rainfall through spatialized computational units. The key steps in model construction were as follows:
Rainfall Data Input: The design rainfall (P) under the 100-year flood scenario was set to 164.4 mm.
Following the recommendations of the InVEST User Guide, the model integrated Hydrologic Soil Groups (HSG) with LULC data. Based on the LULC map with a spatial resolution of 30 × 30 m (derived via supervised classification in ArcGIS 10.8) and the NRCS TR-55 technical manual (provided by the USDA Natural Resources Conservation Service), the Curve Number (CN) matrix was constructed to reflect the specific characteristics of the study area. CN values were assigned according to the combination of LULC classes and Hydrologic Soil Groups (HSG) based on the NRCS TR-55 guidelines and relevant previous studies. In this process, the soil was categorized into four HSG according to its inherent infiltration capacity and runoff potential (Table 4) [43,44]:
CN_A: Soil Group A, representing high permeability and low runoff potential;
CN_B: Soil Group B, characterized by moderate permeability;
CN_C: Soil Group C, characterized by low permeability;
CN_D: Soil Group D, representing very low permeability and high runoff potential.
Runoff Retention Calculation: The model first calculated the potential maximum retention (S) for each pixel, followed by the derivation of the direct runoff depth (Q) incorporating an initial abstraction coefficient.
Two pivotal indicators were derived and analyzed: Runoff Retention Volume, which quantifies the absolute volume of stormwater intercepted by the ecosystem per pixel during a discrete rainfall event (m3); and Runoff Retention Index, a dimensionless metric that encapsulates the efficiency of terrestrial interception relative to total precipitation. The above indicators were computed based on the SCS-CN framework implemented in the InVEST model, as detailed below.
For each pixel i , defined by a land use type and soil characteristics, we estimate runoff Q (mm) with the Curve Number method:
Q p , i = ( P     λ S m a x i ) 2 P   +   1     λ S m a x , i i f P > λ · S m a x , i 0 o t h e r w i s e
where P is the precipitation in mm. S m a x , i is the retention potential in mm. λ S m a x is the rainfall depth needed to initiate runoff, also called the initial abstraction, λ = 0.2. S m a x (calculated in mm) is a function of the curve number, C N , an empirical parameter that depends on land use and soil characteristics (NRCS 2004):
S m a x , i = 25400 C N i 254
The model then calculates the fraction of runoff retention per pixel R i as:
R i = 1 Q p , i P
and runoff retention volume per pixel R m 3 i as:
R m 3 i = R i · P · p i x e l . a r e a · 10 3
with p i x e l . a r e a in m 2 .
Runoff volume (also referred to as “flood volume”) per pixel Q m 3 i is also calculated as:
Q m 3 i = Q p , i · p i x e l . a r e a · 10 3
Based on the above, after running the model with the required inputs, the InVEST 3.15.0 software generated raster files for runoff retention (%) and runoff (mm).

3.2. AHP-Based Regional Slope Stability Risk Zoning

This study applies the AHP, supported by a geographic information system (GIS), to conduct regional slope stability risk zoning across the entire study area. Considering the elevation difference of up to 2840 m and the complex hazard-prone environment within the region, an AHP-based evaluation framework was established, and spatial mapping of regional slope stability risk zoning was achieved through systematic weight allocation. The evaluation system consists of 12 key driving factors [45,46,47,48,49,50,51,52], geological factors (lithology, distance to faults, soil type), hydrological factors (distance to water bodies, rainfall runoff, hydraulic hazard intensity), vegetation and ecological factors (NDVI), and human activity factors (road network density, distance to settlements). Details of the indicator system are provided in Table 5.
All spatial data layers were processed following standardized procedures to ensure computational accuracy at a spatial resolution of 30 m. Topographic factors (slope, aspect, elevation) and hydrological factors (rainfall runoff) were derived from a 30 m resolution DEM and outputs from the InVEST model, respectively. For geological factors, the pairwise comparison matrix and weight allocation for lithology are presented in Table 6, while the processing of soil factors is shown in Table 7. The scoring criteria were based on the Engineering Rock Mass Classification Standard issued by the Ministry of Natural Resources of the People’s Republic of China.
For fault zones, water bodies, and community settlements, Euclidean distance was used to model the attenuation of their spatial influence. To characterize human activity disturbance, road network density was calculated based on a 300 × 300 m fishnet grid. In addition, NDVI was derived through supervised classification using ENVI 5.3 and used as a vegetation and ecological factor to represent the reinforcing effect of vegetation roots on slope structure. To further verify the mathematical robustness of the AHP model, consistency tests were conducted on all judgment matrices, and the results showed that all consistency ratios (CR) were below 0.1, meeting the requirement of logical consistency. Finally, all standardized factors were integrated using a weighted summation method, and the calculation formula is expressed as:
S = i = 1 n w i x i
where S represents the composite evaluation value of regional slope stability risk zoning, w i denotes the weight of the i t h factor and x i represents its normalized score. The results were then classified into five categories—Very low, Low, Moderate, High, and Very high—using the Natural Breaks method to generate the regional slope stability risk zoning map, which provides a standardized spatial basis for subsequent integrated flood risk overlay analysis.
Pairwise comparisons were conducted according to the relative importance of each factor in influencing flood-related multi-hazard risks within the study area. The comparison process considered both the environmental characteristics of the Tangjiahe district and expert knowledge of hazard formation, ecological conservation, spatial planning, and community development. Pairwise comparison scores were assigned using the Saaty 1–9 scale. A total of nine evaluation questionnaires were collected through the SPSSPRO online survey platform. The participants included professors and researchers with expertise in alpine ecosystem evolution, national park management, landscape restoration, mountain hazard risk assessment, ecological conservation, ecosystem integrity assessment, sustainable landscape planning, and rural sustainable development. An independent judgment matrix was constructed for each questionnaire and subjected to a consistency test. Only matrices satisfying the consistency requirement (CR < 0.1) were retained for weight calculation. For each criterion, weights were calculated from the valid matrices, and the final weights were obtained by averaging the weights derived from all valid responses.

3.3. Multi-Hazard Overlay and Spatial Hotspot Identification

This study constructed a composite risk assessment model via Spatial Overlay Analysis to analyze the coupled characteristics of disaster risks under extreme climate conditions within the study area. To achieve synergistic analysis of multi-source data within a unified evaluation framework, all raw raster datasets of varying dimensions were initially subjected to a standardized normalization process. The model utilized three foundational risk layers as inputs: the flood inundation depth and extent grid simulated via HEC-RAS, the slope stability risk zoning evaluated across the study area using AHP, and the runoff retention assessment grid generated by the Urban Flood Risk Mitigation module of the InVEST model. During the factor weighting phase, a judgment matrix was constructed through pairwise comparisons to determine the weights for weighted overlay (Table 8). The spatial importance weights for the factors were established as follows: 0.64 for flood inundation depth and extent, 0.27 for slope stability risk, and 0.09 for runoff retention capacity. The consistency test indicated a Consistency Ratio (CR) of 0.05107, which satisfies the logical consistency requirement of CR < 0.1. Based on these parameters, the spatial datasets were aggregated using the Weighted Overlay tool within the ArcGIS platform, resulting in the generation of a integrated flood-related multi-hazard risk classification map. This layer integrates hydrological dynamic processes, geological slope stability, and vegetation interception effects, effectively delineating the spatial intersection of inundation, geohazards, and runoff sensitivity across the study area, thereby providing a physically based spatial dataset for disaster management planning.
Building upon the physical overlay, spatial autocorrelation models were introduced to quantitatively verify the spatial clustering characteristics of composite risks and to exclude random distribution errors. This analytical approach aims to isolate local anomalies in risk distribution from a statistical perspective, thereby ensuring the robustness of the assessment results. First, the Global Moran’s I was calculated to measure the overall spatial association of the composite risk index within the study domain. The analysis yielded a Moran’s Index of 0.74, with a corresponding z-score of 2659.57 (p < 0.01). These statistics demonstrate that disaster risks in the study area exhibit a significant positive spatial autocorrelation pattern. Furthermore, Local Indicators of Spatial Association (LISA) analysis were utilized to detect statistically significant “High-High” risk clusters through a LISA Cluster Map. By calculating the risk correlation between local units and their surrounding neighborhoods, this process precisely extracted the core spatial units characterized by high-value risk clusters. Concurrently, Hotspot Analysis conducted using the Getis-Ord Gi* statistic quantified the severity of the composite risk by identifying core hotspot areas within the significant confidence interval. Through these spatial statistical processes, this study identified the disaster risk classification of the study area; these findings, alongside the independently delineated disaster prevention and control zones based on land-use attributes and differentiated management strategies, constitute the comprehensive spatial framework for disaster management.
In flood and related hazard risk assessments, classification schemes are commonly used to visually represent spatial differences in risk. Previous studies typically divide risk into a series of ordinal categories to reflect the spatial heterogeneity of disaster risk and to support decision-making [53,54,55]. In landslide and flood risk mapping, five-level classifications ranging from low to high have been widely adopted and are considered a relatively mature and commonly used approach [56,57]. However, in mountainous national park settings and their surrounding communities, such as the Tangjiahe district, complex terrain conditions lead to more pronounced spatial variability in risk, while the availability of safe areas for settlements is limited. The results of the spatial overlay analysis model in this study also indicate that the overall risk level in the study area is relatively high, and conventional five-level classifications are insufficient to capture subtle spatial differences among different areas. Therefore, to improve the resolution of risk identification and to better represent spatial heterogeneity, this study expands the classification scheme from five levels to seven levels (Very low, Low, Moderately low, Moderate, Moderately high, High, Very high) based on existing classification approaches.

3.4. Integrated Risk Zonation and Community Analysis

This study constructed an integrated risk zonation framework to address the governance requirements regarding “which specific management strategies should be implemented in response to varying disaster risk characteristics and land attributes.” By integrating multi-source spatial data, this framework systematically couples physical natural disaster hazard assessment results with current land-use status to identify distinct spatial zones with differentiated management implications.
The zonation process utilized four primary data sources: (1) flood inundation extent and depth grids simulated via HEC-RAS; (2) slope stability risk zoning evaluated across the study area using AHP; (3) runoff retention grids generated by the InVEST Urban Flood Risk Mitigation module; and (4) land-use classification grids derived from supervised GIS classification. To ensure logical consistency in multi-indicator spatial analysis, the physical hazard indices were initially reclassified into three levels (low, medium, and high) using the Jenks Natural Breaks method. Subsequently, these reclassified hazard grids were integrated with the land-use classification grid within the GIS platform to generate a comprehensive spatial dataset containing both composite risk attributes and land-use characteristics.
Based on the risk classification results, studies commonly further divide the study area into functional spatial units to translate risk outcomes into zoning schemes oriented toward management and disaster mitigation. In flood risk management, areas are often categorized according to spatial planning needs into different types, such as risk control zones, development restriction zones, and adaptive use zones, to support planning regulation and decision-making [58]. In risk zoning studies based on remote sensing and spatial modeling, regions are further classified according to risk levels and system resilience characteristics into different combined types, such as different combined risk categories, high-risk–medium-resilience zones, and low-risk–low-resilience zones, reflecting the coupling between hazard intensity and system response capacity [59]. At the community scale, some studies integrate vulnerability and adaptive capacity when conducting risk zoning, resulting in differentiated categories such as high-, medium-, and low-vulnerability zones, which reflect variations in disaster coping capacity [60]. In addition, in mountainous protected areas, zoning is further linked with hazard response and community adaptation, where risk identification and zoning are used to provide a basis for local disaster prevention measures [61].
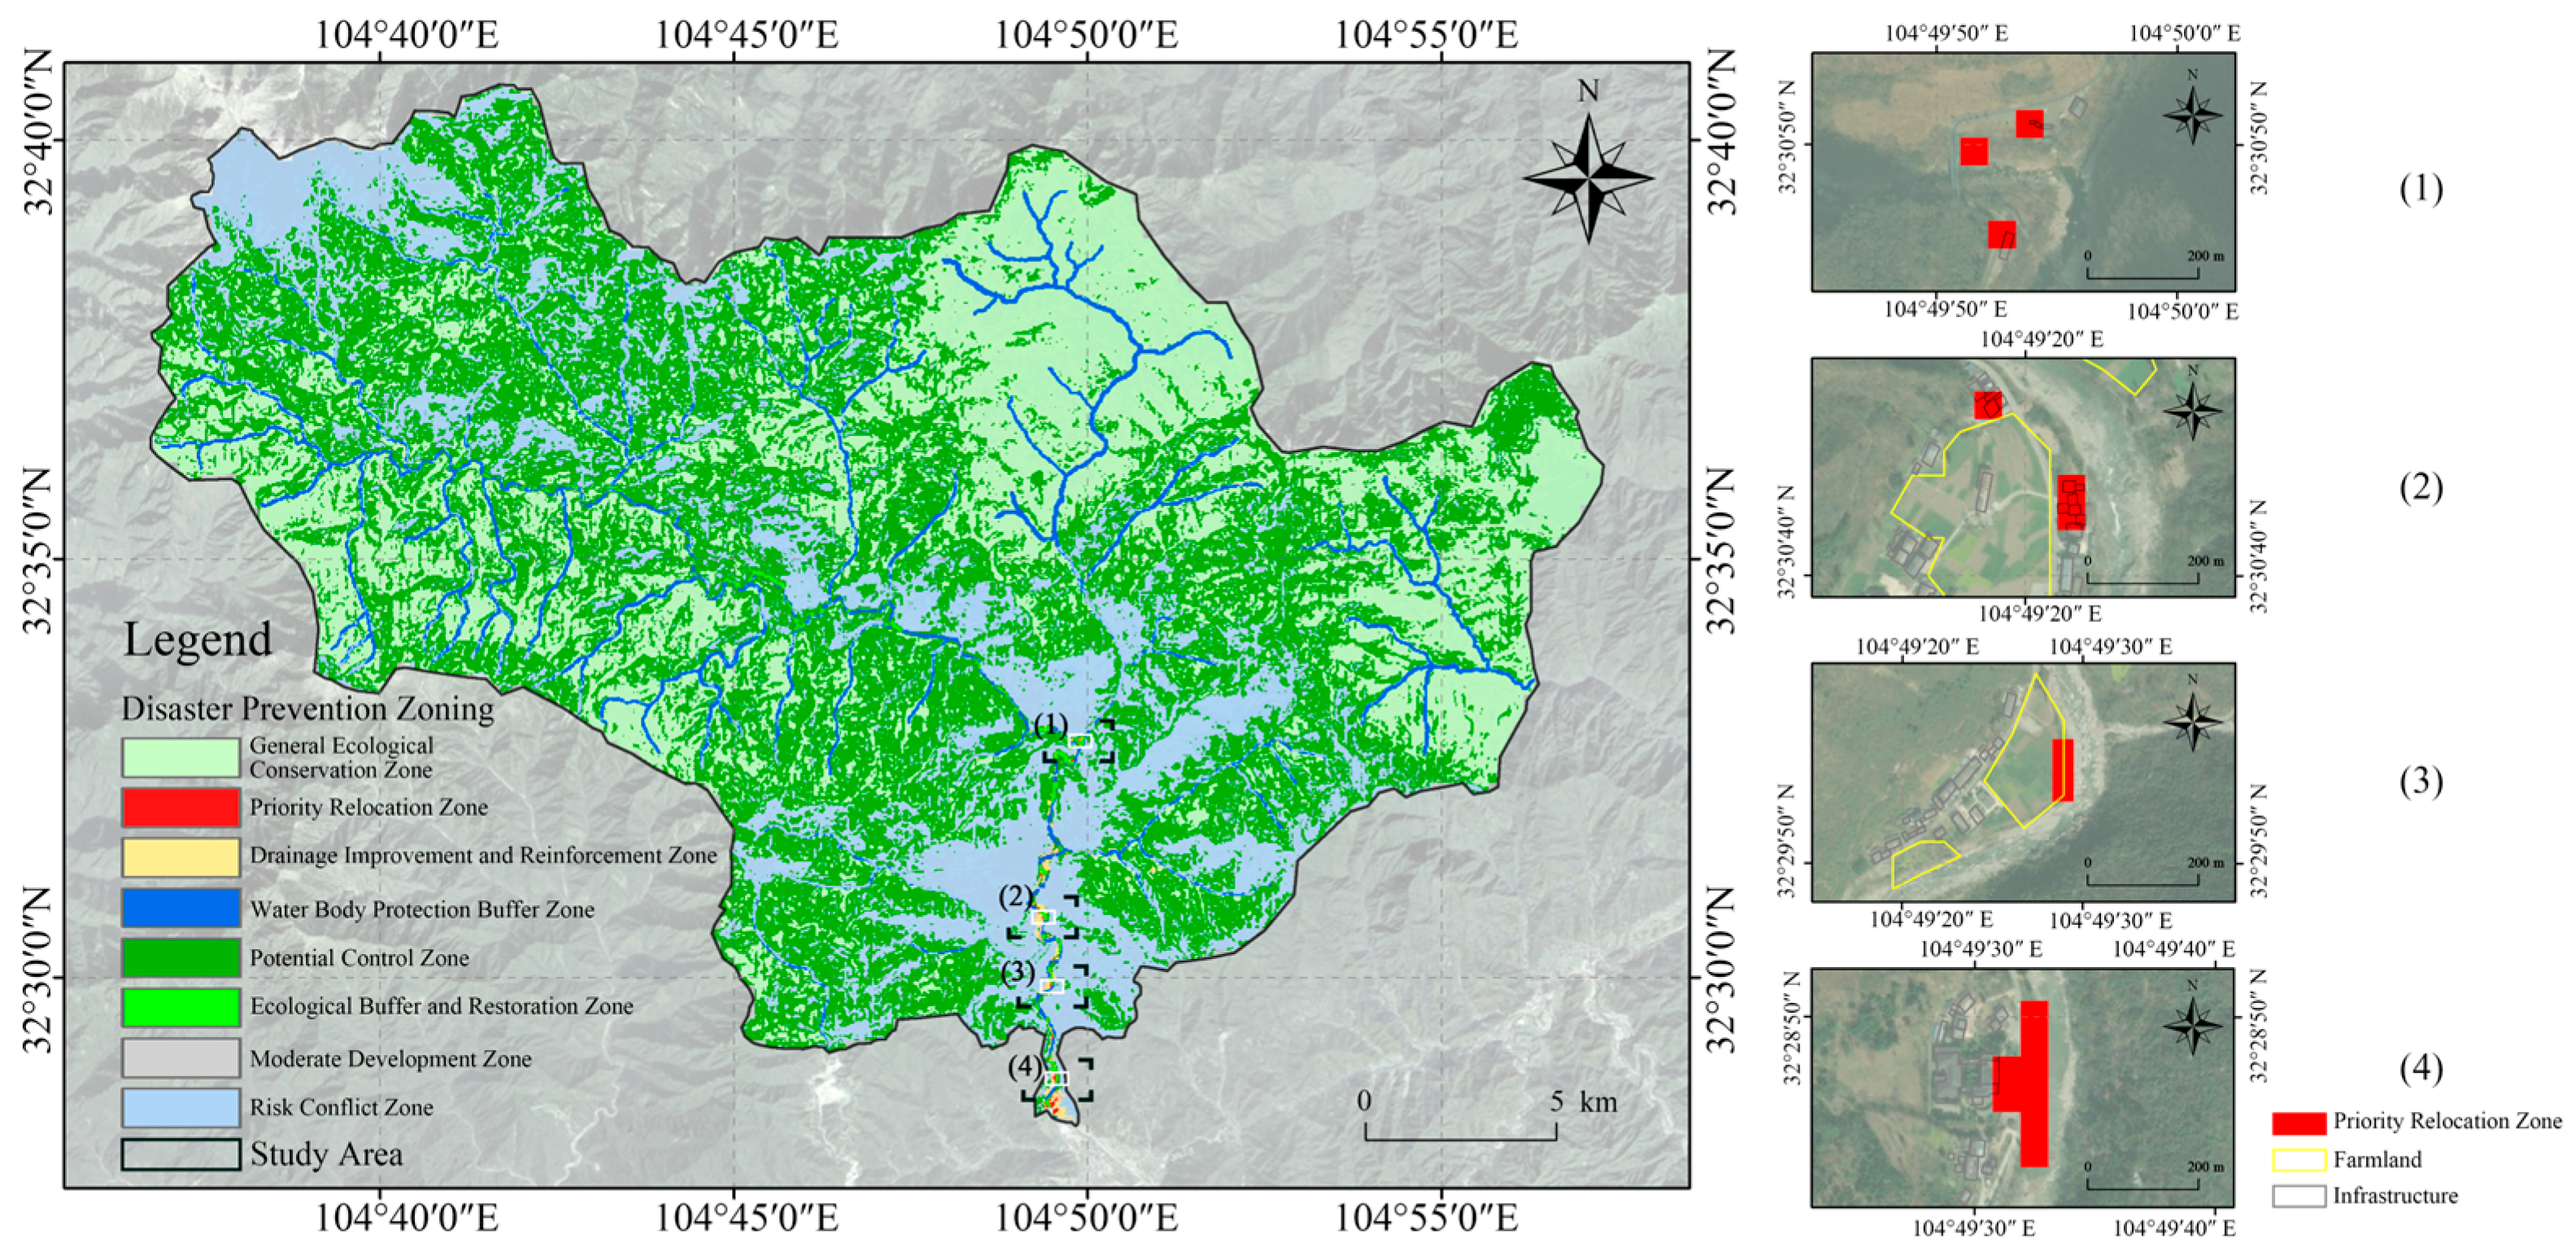
In defining the zonation rules, this study implemented a hierarchical priority screening mechanism to address complex combinations of risk characteristics and land-use types. Given that a single spatial unit might simultaneously satisfy multiple selection criteria, a strict priority sequence was executed to ensure that each grid unit is assigned to exactly one exclusive management zone. The priority sequence of zonation, descending from high to low, is as follows:
Priority Relocation Zones: high landslide risk + high flood risk + built-up land + low runoff retention capacity;
Risk Conflict Zones: high landslide risk + low flood risk, or low landslide risk + high flood risk;
Ecological Restoration Zones: high landslide risk + high flood risk + forest/grassland/water body;
Drainage Improvement and Consolidation Zones: medium-high landslide risk + medium-high flood risk + cropland/built-up land + high runoff retention capacity;
Potential Controlled Zones: medium-high risk areas + forest/grassland/water body.
For the remaining grid units that did not meet the aforementioned high-priority screening criteria, supplementary classifications were conducted based on land-use attributes: water body grids were designated as water protection buffer zones; cropland and built-up land grids were defined as moderate development zones; and forest and grassland grids were categorized as general ecological conservation zones. These spatial zonation results effectively delineate core areas characterized by multi-hazard exposure (particularly the Priority Relocation Zones) and clarify the path for differentiated actions ranging from disaster defense to ecological conservation, thereby providing a robust spatial execution framework for regional disaster management decisions.

4. Results

4.1. Flood Inundation Simulation Results

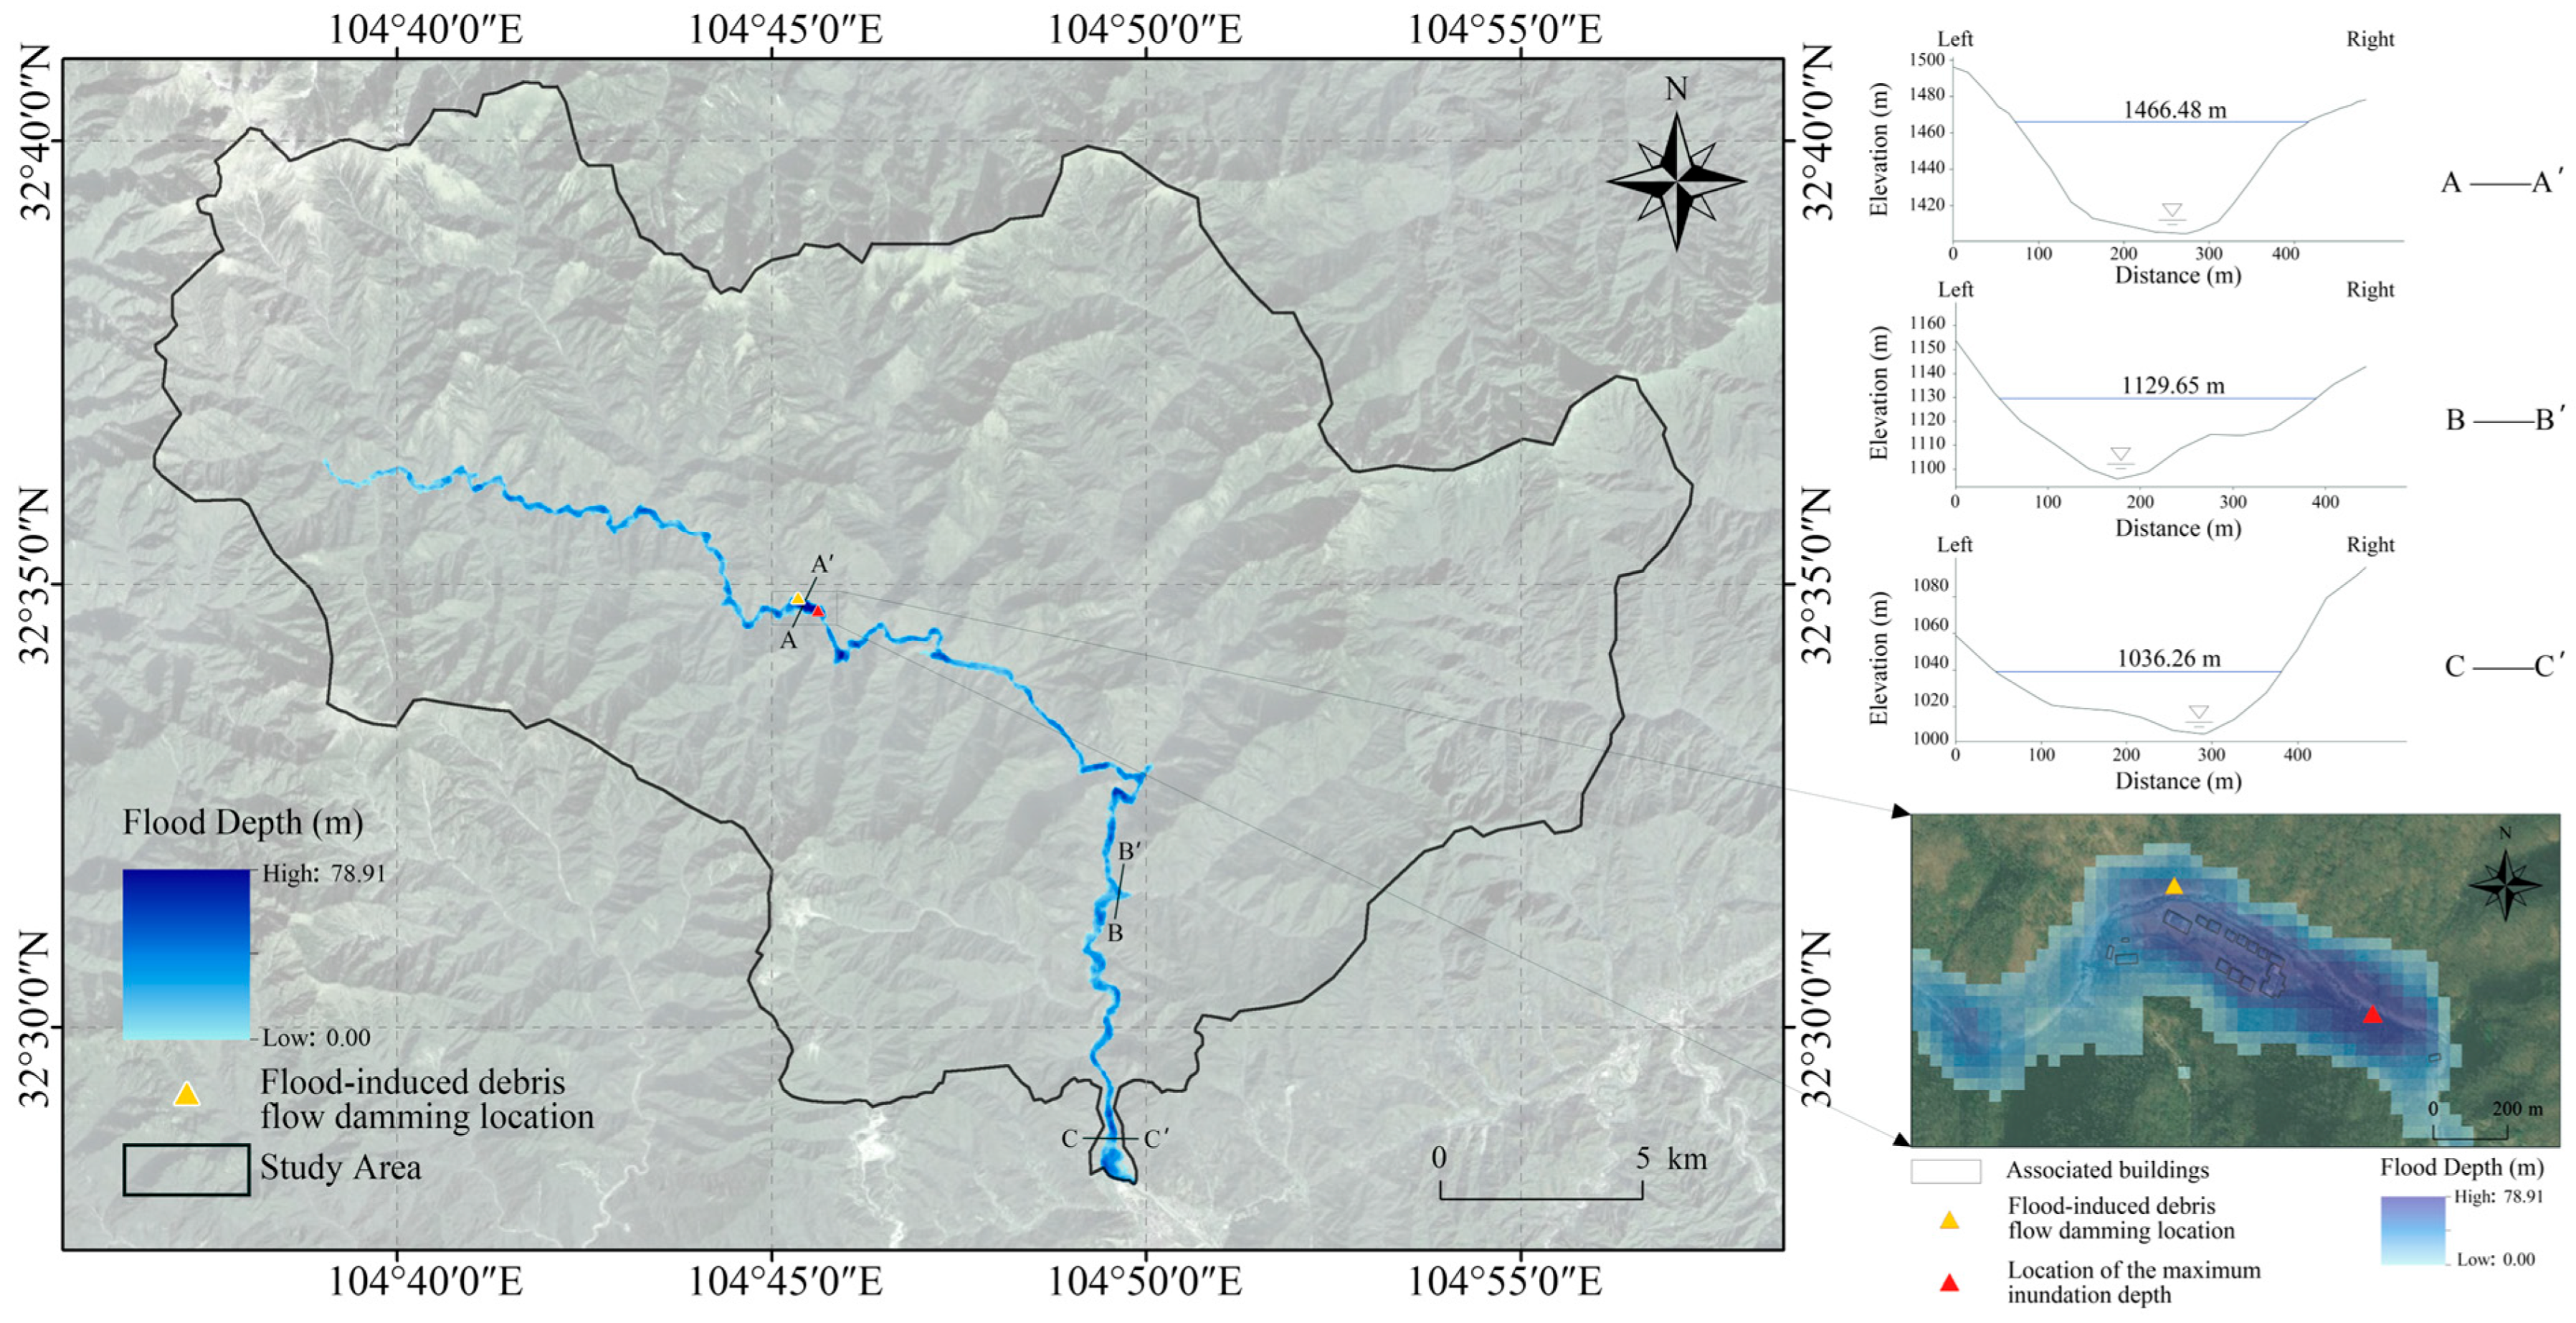
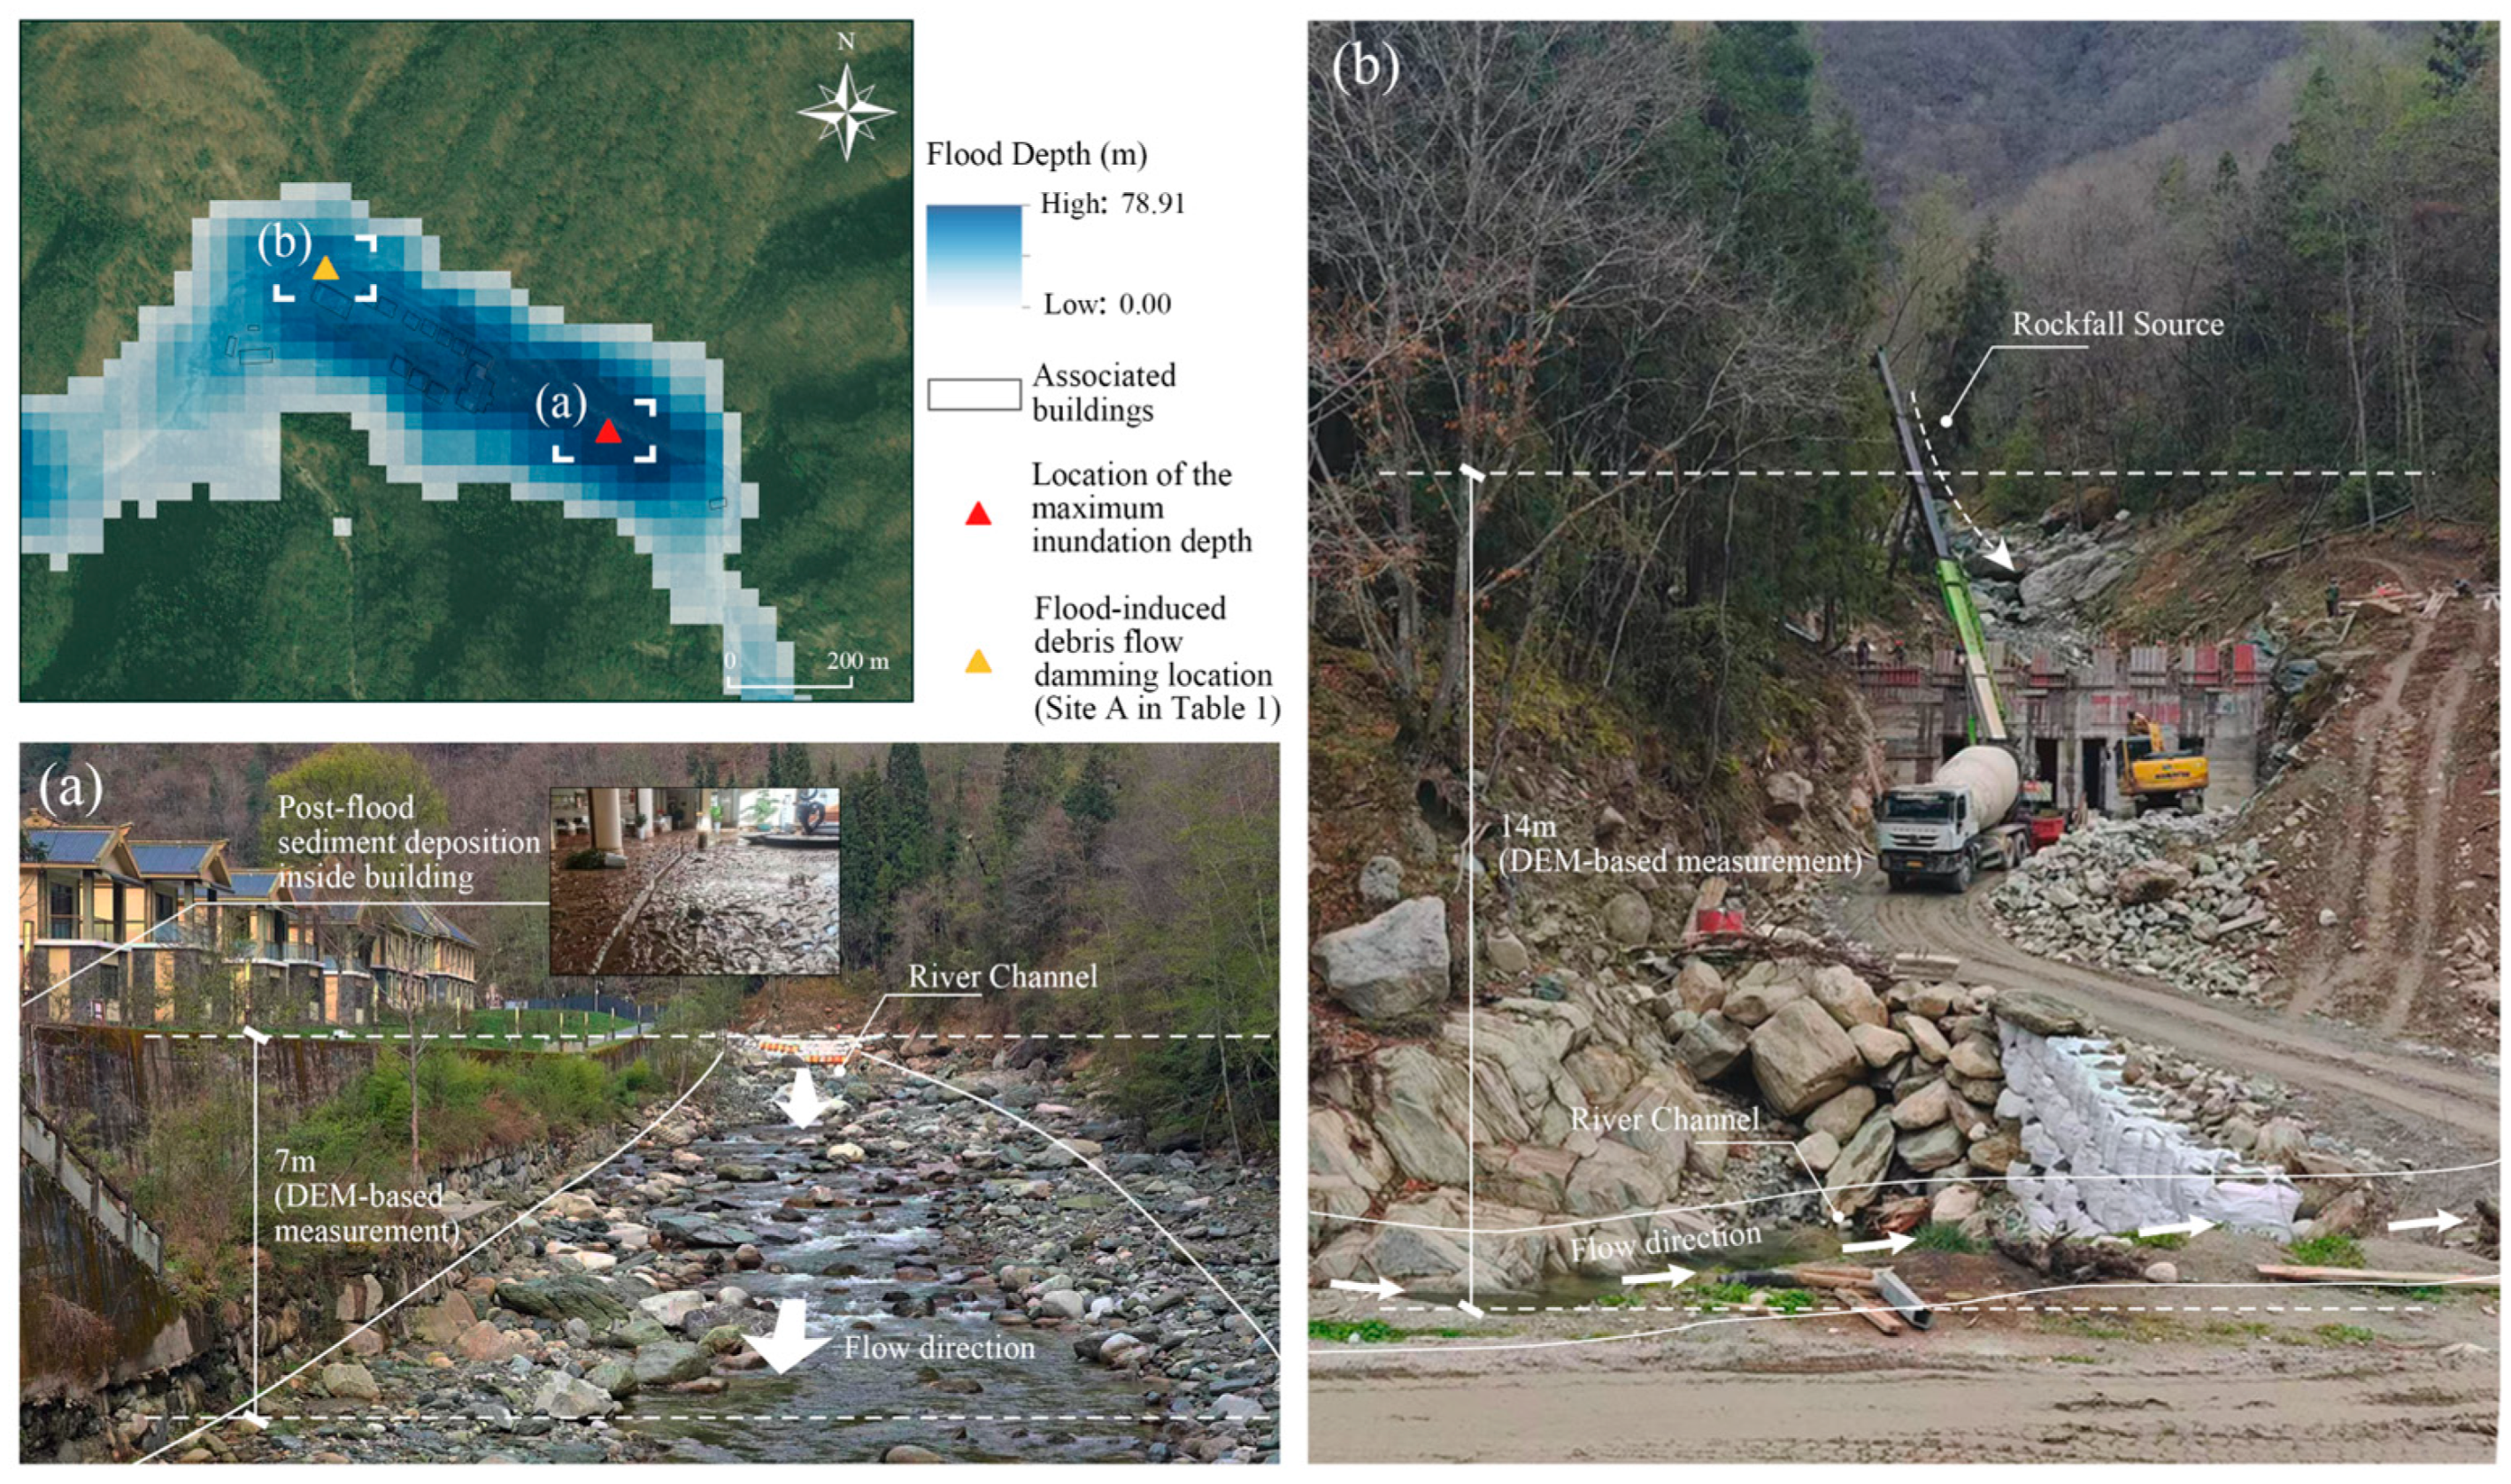
Hydrodynamic simulation was conducted for the 100-year return period precipitation scenario to assess flood inundation in the Tangjiahe district and its surrounding communities (Figure 4). Under 48 h of continuous rainfall, the total inundated area reached 8,497,800 m2. Flooding was mainly concentrated along the main river channel and valley bottoms, where runoff rapidly converged under the steep mountainous terrain. The maximum simulated inundation depth reached 78.91 m. As shown in Figure 4, this value occurred at the location of a flood-induced debris-flow dam. During the flood event, debris flows entered and blocked the river channel, forming a temporary dammed-lake system. The accumulated debris reduced the channel conveyance capacity and caused local water impoundment, resulting in an exceptionally high inundation depth at this location.
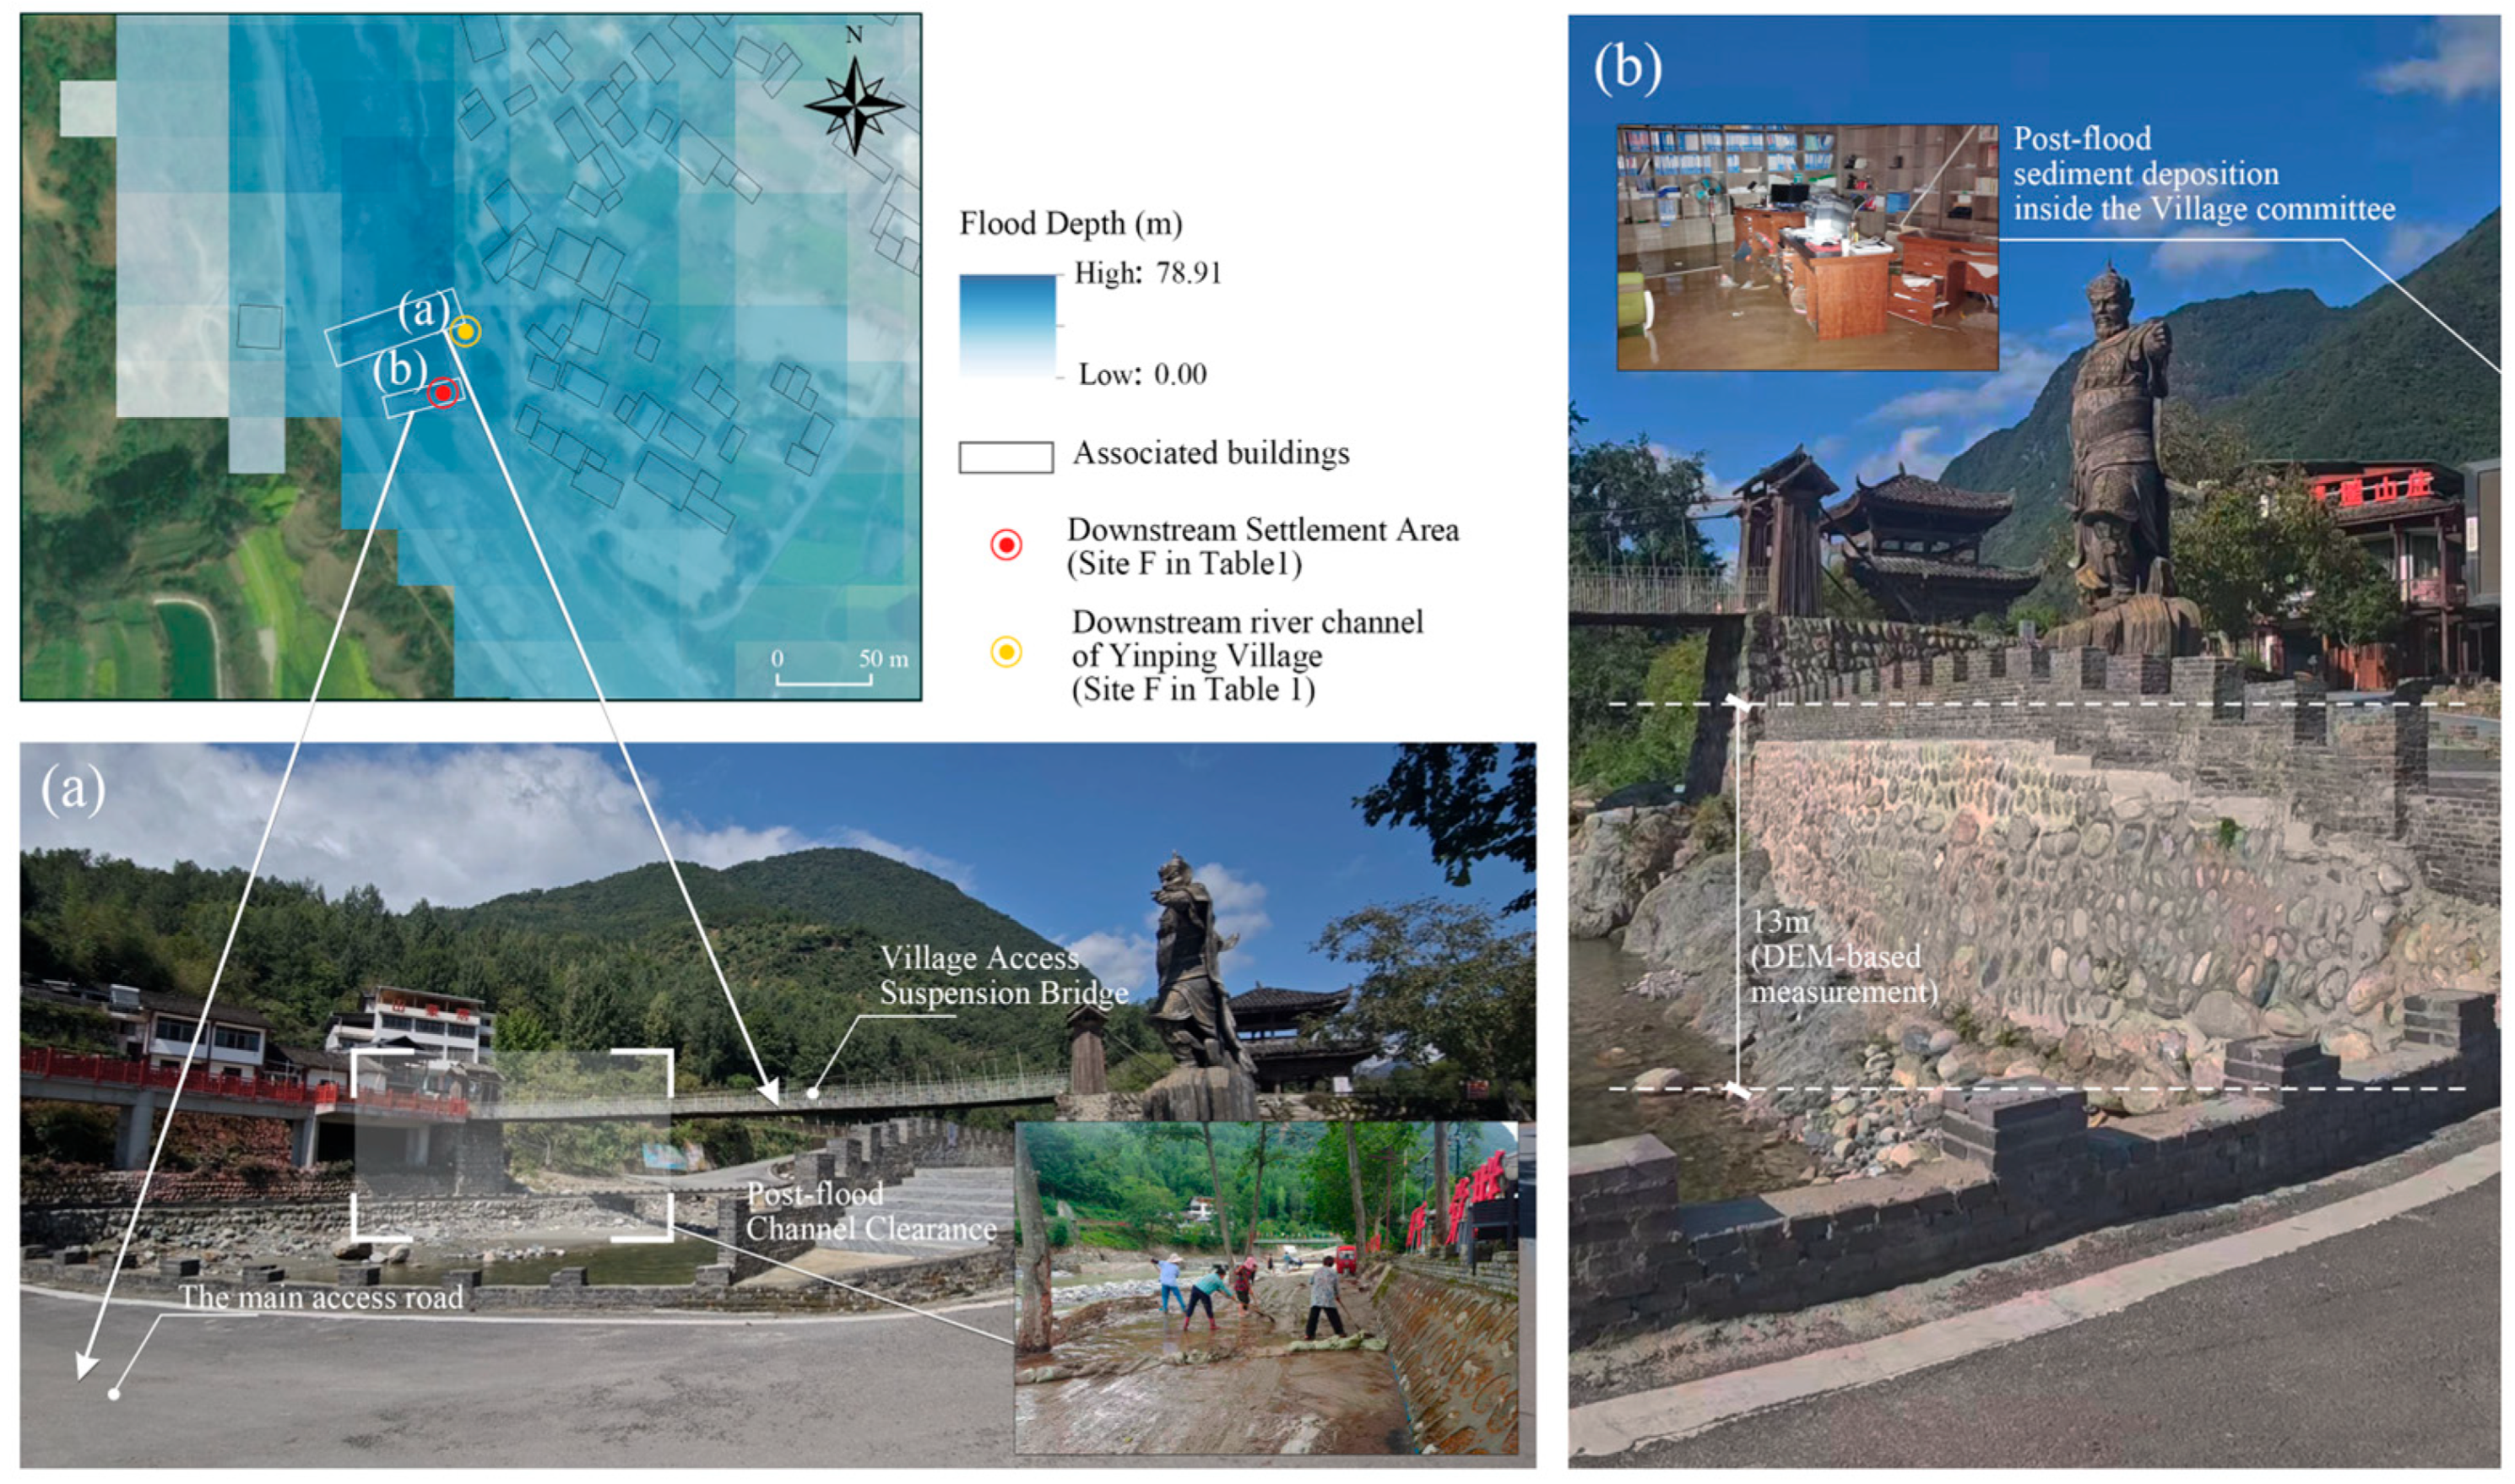
Luoyigou Village experienced an inundated area of 2,238,300 m2, accounting for 26.34% of the total inundated area. Residential areas, farmland, roads, and bridges near the river were affected by flooding. Yinping Village recorded an inundated area of 821,700 m2, accounting for 9.67% of the total. Flooding was mainly concentrated in low-lying areas, including the Village Committee, village squares, sports grounds, and parts of the public facilities. The main access road and the bridge connecting the village to surrounding areas were affected under the simulated flood scenario.
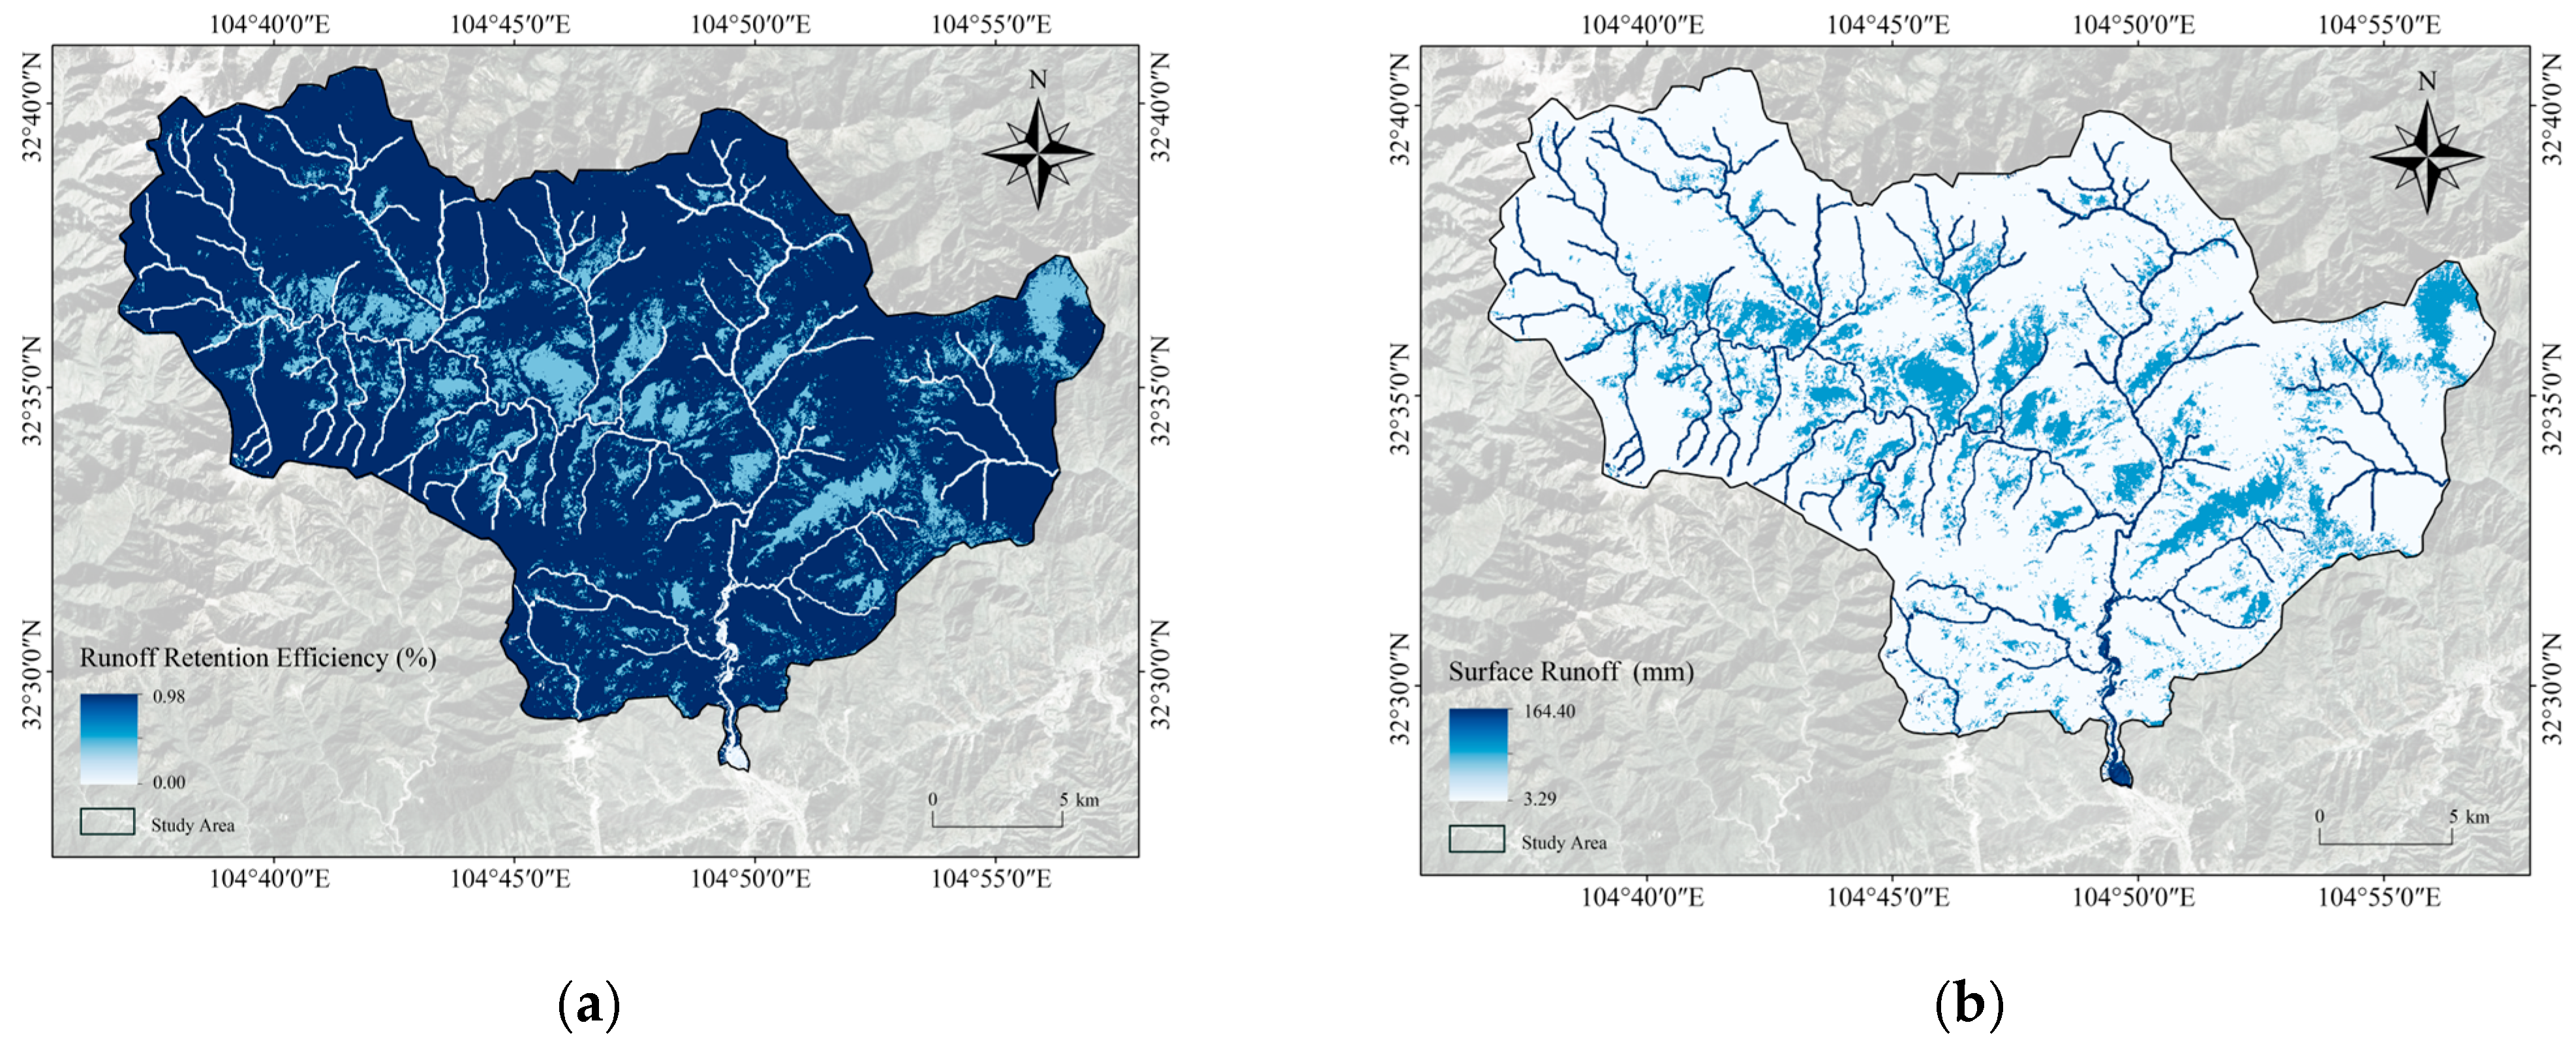
To evaluate runoff retention capacity under the 100-year return period scenario, the Urban Flood Risk Mitigation module of the InVEST model was applied (Figure 5). The mean runoff retention volume was 127.58 m3, with a standard deviation of 39.07 m3. The maximum retention volume reached 145.00 m3 and was mainly distributed in forested areas. In contrast, low retention values were concentrated in steep mountainous areas, where runoff was rapidly transferred downslope under extreme rainfall conditions.
The Runoff Retention Index showed clear spatial variation (Figure 5a). Forested areas surrounding Luoyigou Village generally exhibited retention index values above 0.8, whereas infrastructure and built-up areas commonly recorded values below 0.2. Areas with lower runoff retention capacity were mainly distributed around villages and other locations with intensive human activities. These areas showed substantial spatial overlap with flood-prone zones identified by the hydrodynamic simulation.

4.2. Regional Slope Stability Risk Zoning Results

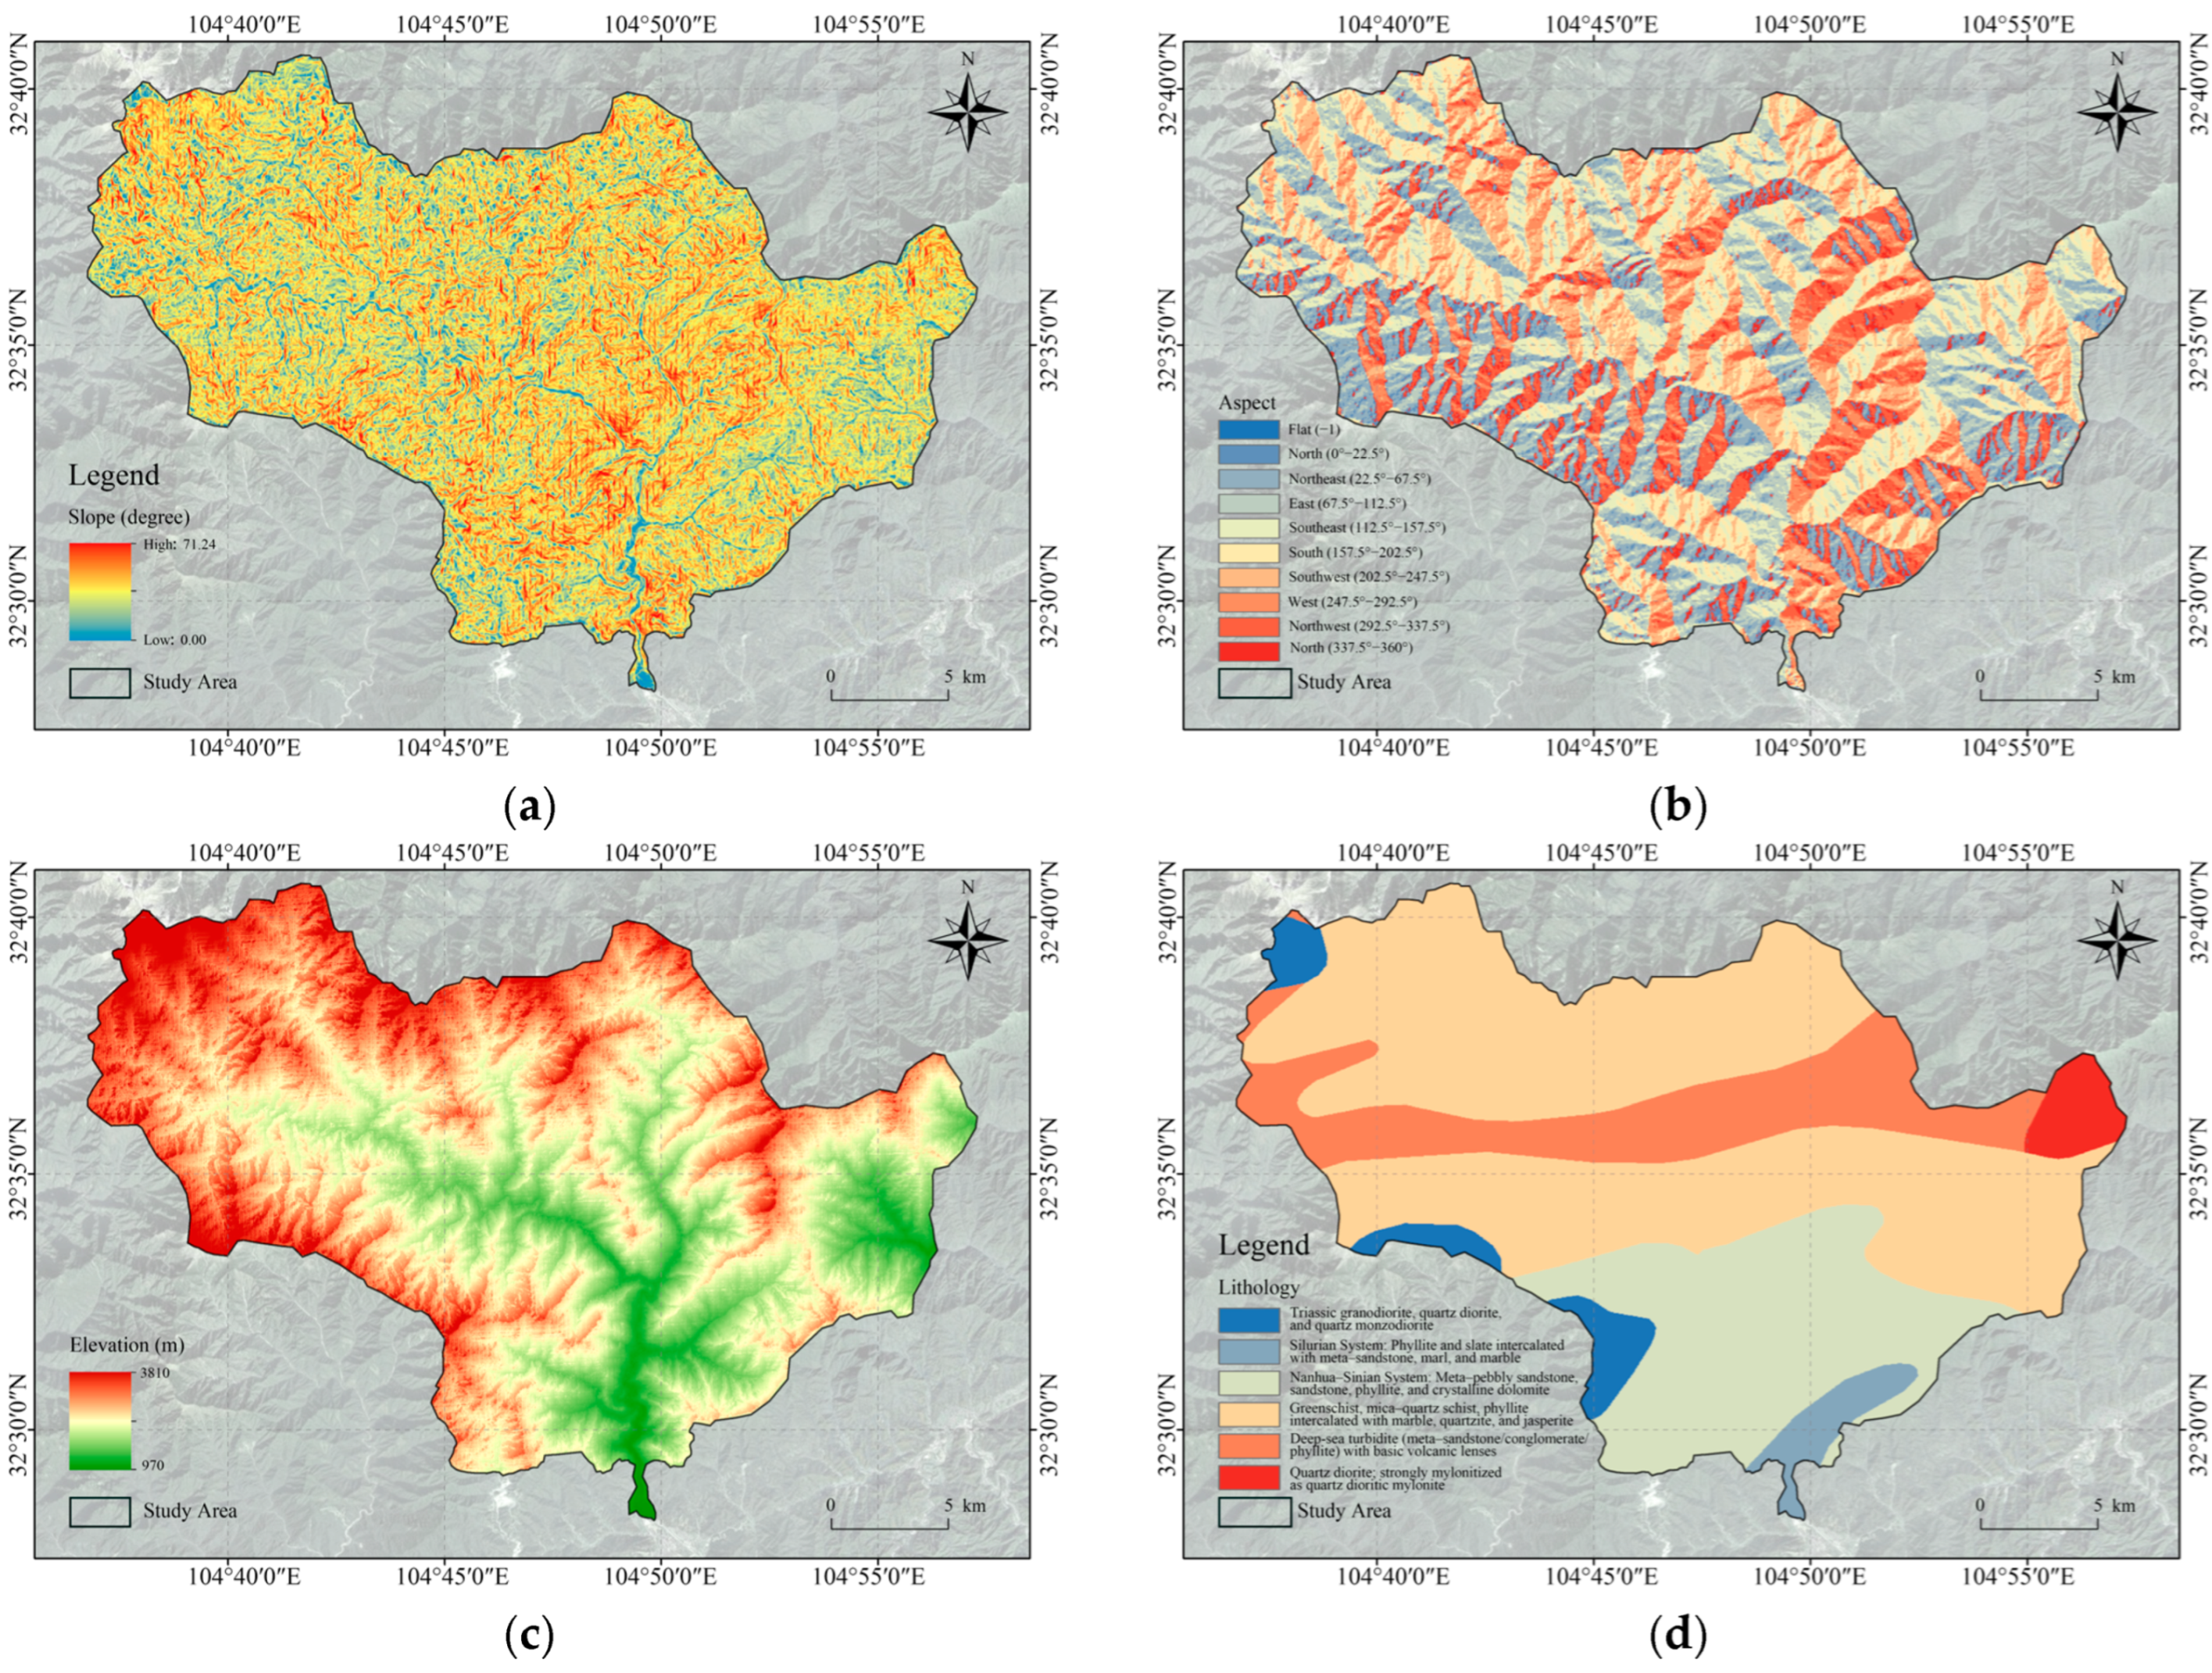
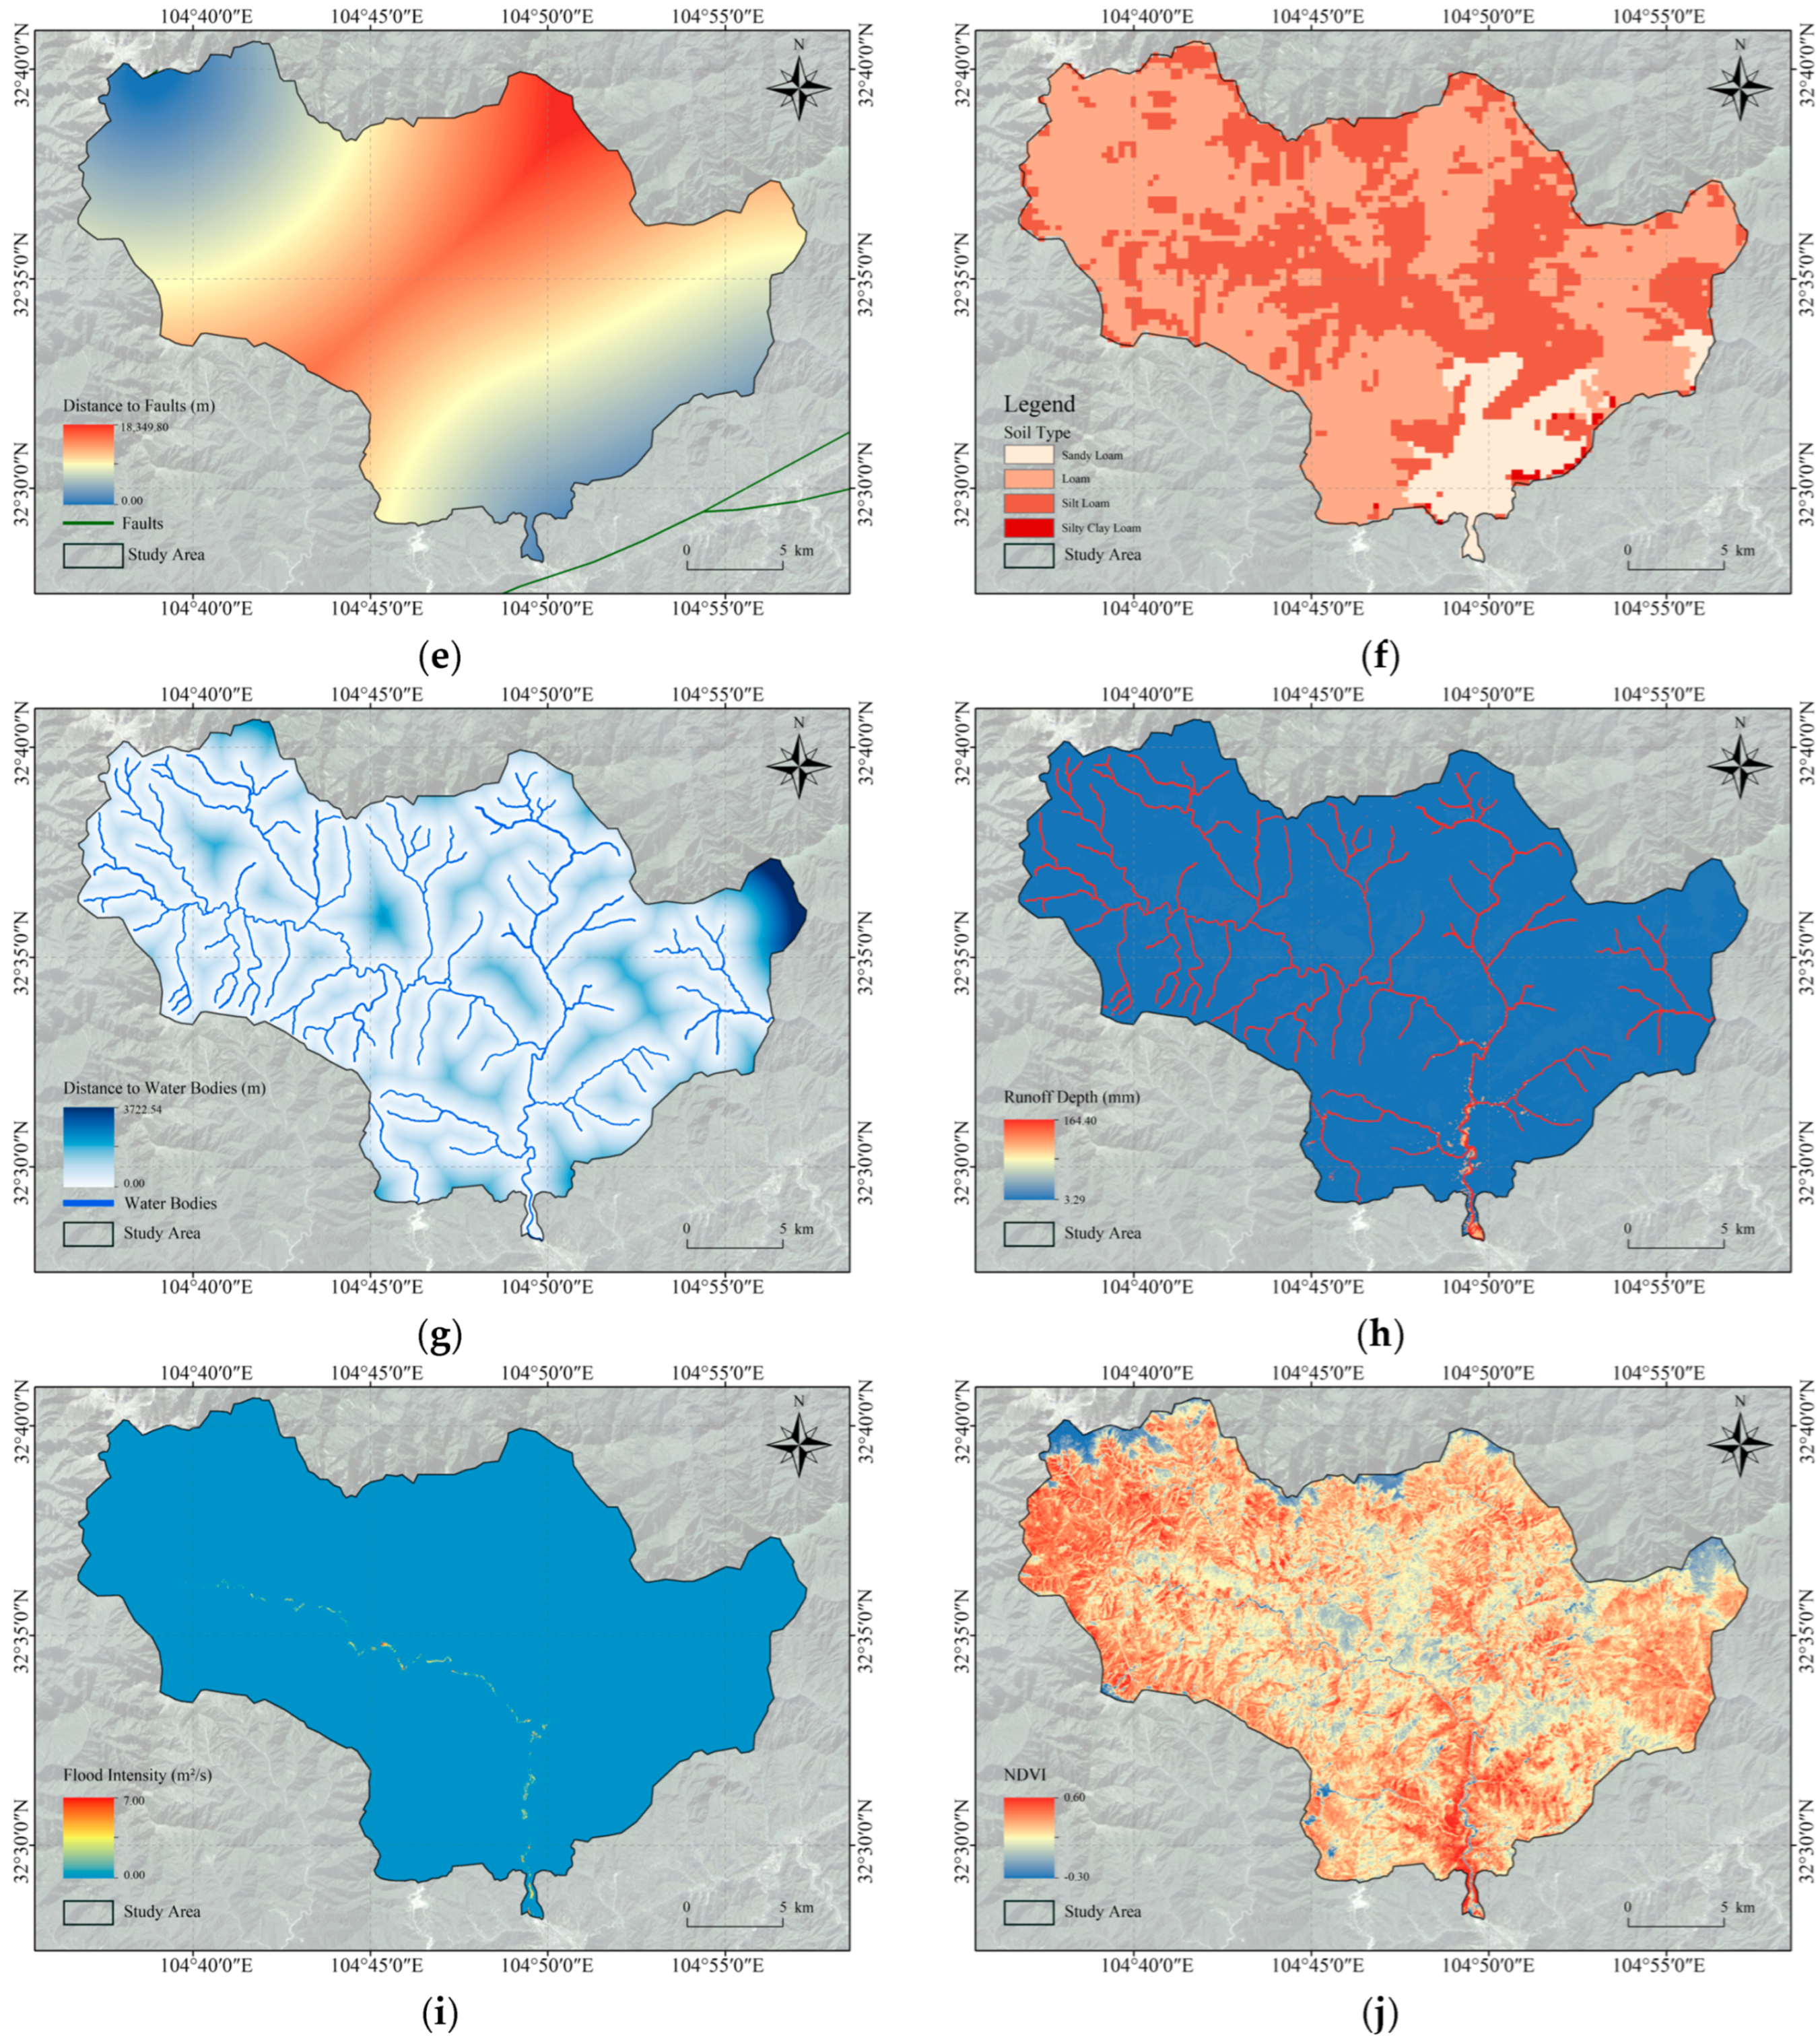
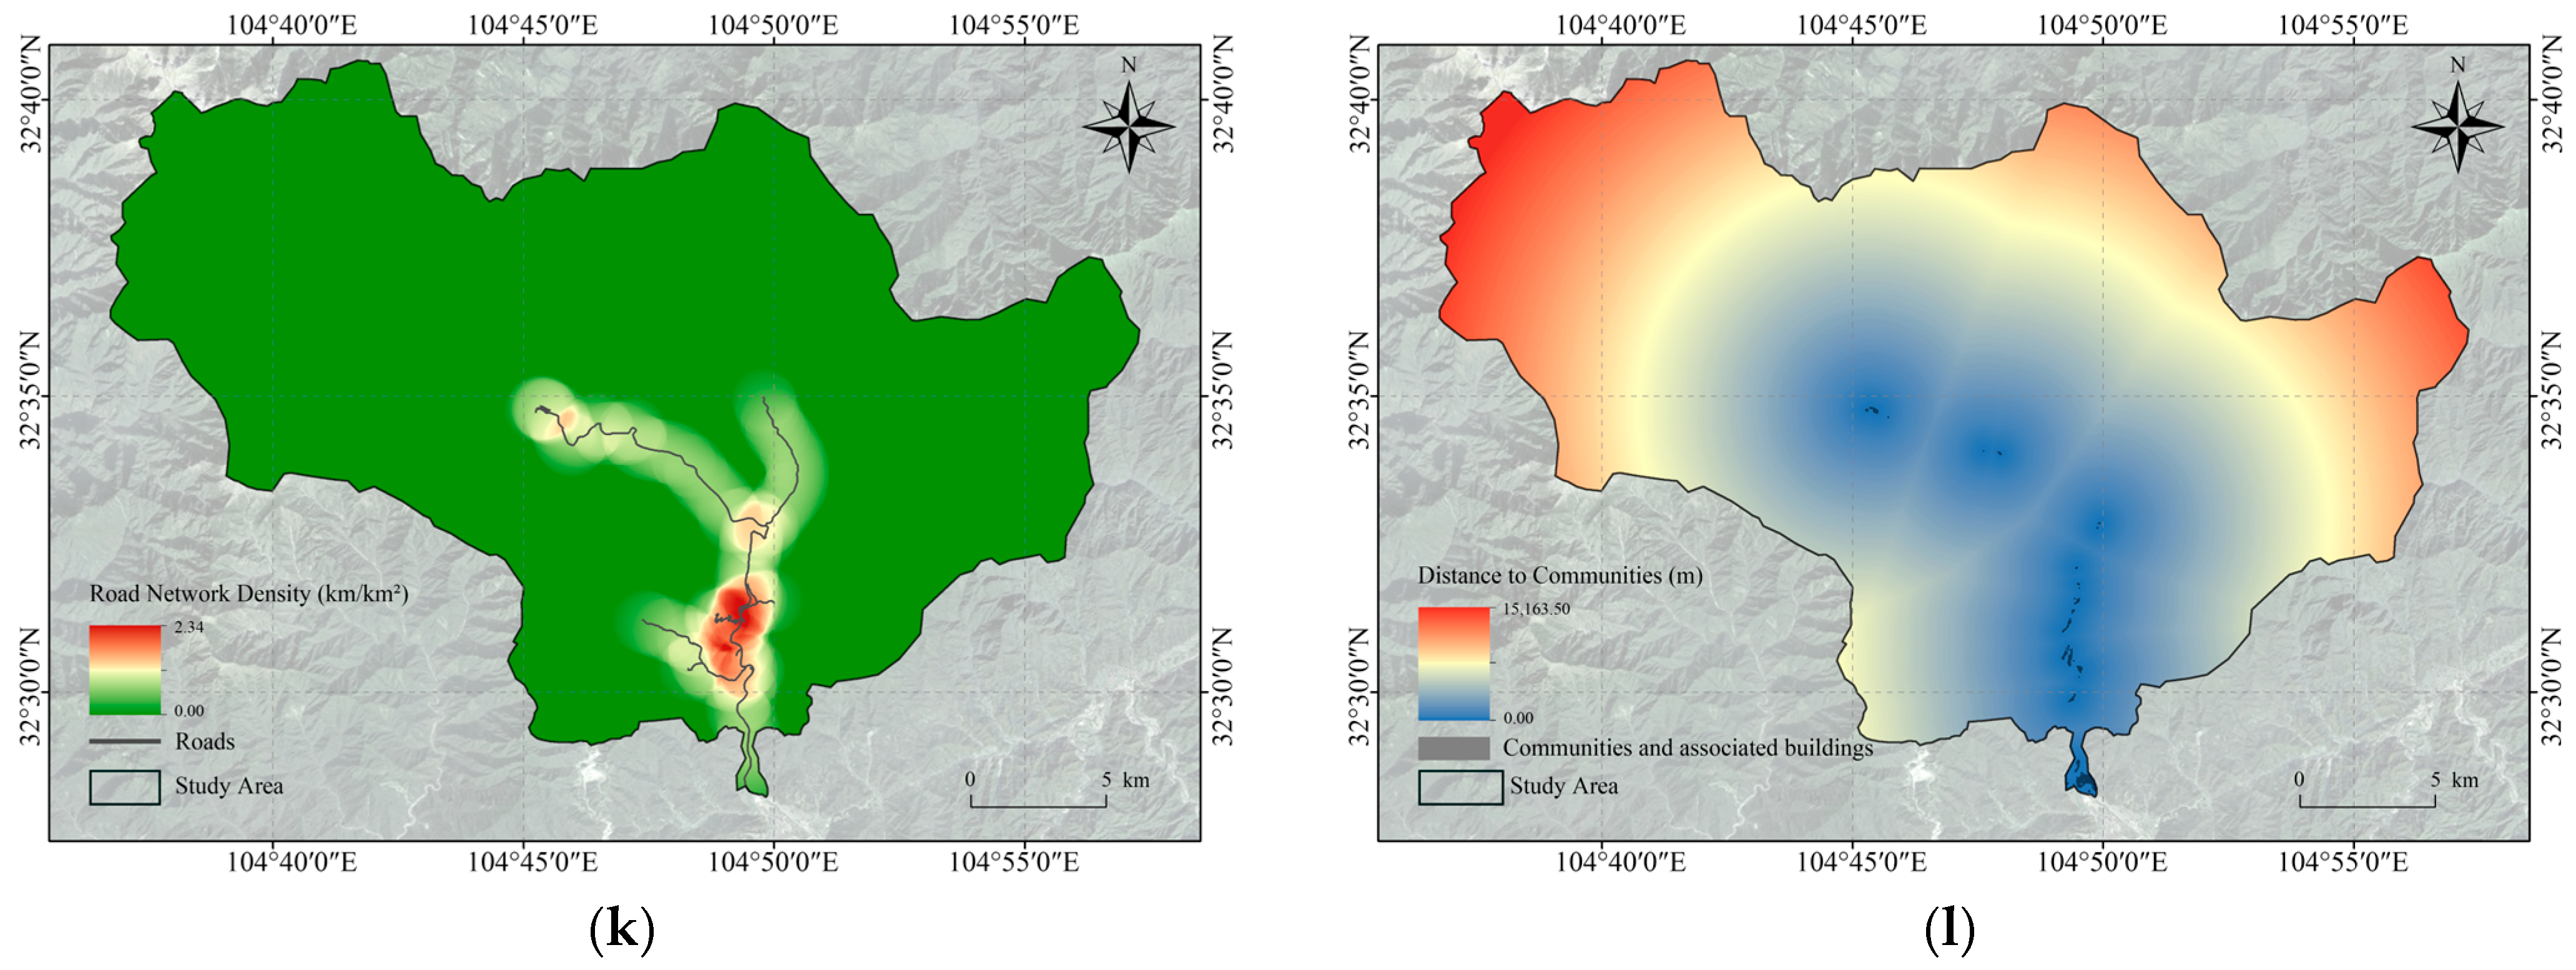
Regional slope stability risk zoning was generated by integrating multi-source conditioning factors using the AHP within a GIS framework. The spatial distribution of all input factors, including topographic, geological, hydrological, ecological, and anthropogenic variables, is presented in Figure 6.
As shown in Figure 6, the conditioning factors exhibit clear spatial heterogeneity across the study area. Topographic, geological, hydrological, ecological, and anthropogenic variables display distinct spatial patterns, reflecting the complex environmental conditions of the mountainous landscape. Hydrological factors are mainly concentrated along river corridors, whereas anthropogenic factors are primarily distributed around settlements and transportation networks.
According to the weighting results, geological conditions (29.80%) and topographic factors (24.97%) contributed most to the regional slope stability assessment, followed by anthropogenic factors (17.82%), hydrological factors (13.95%), and ecological factors (13.45%). Among the secondary indicators, distance to faults, slope, road network density, lithology, and distance to communities received relatively high weights.
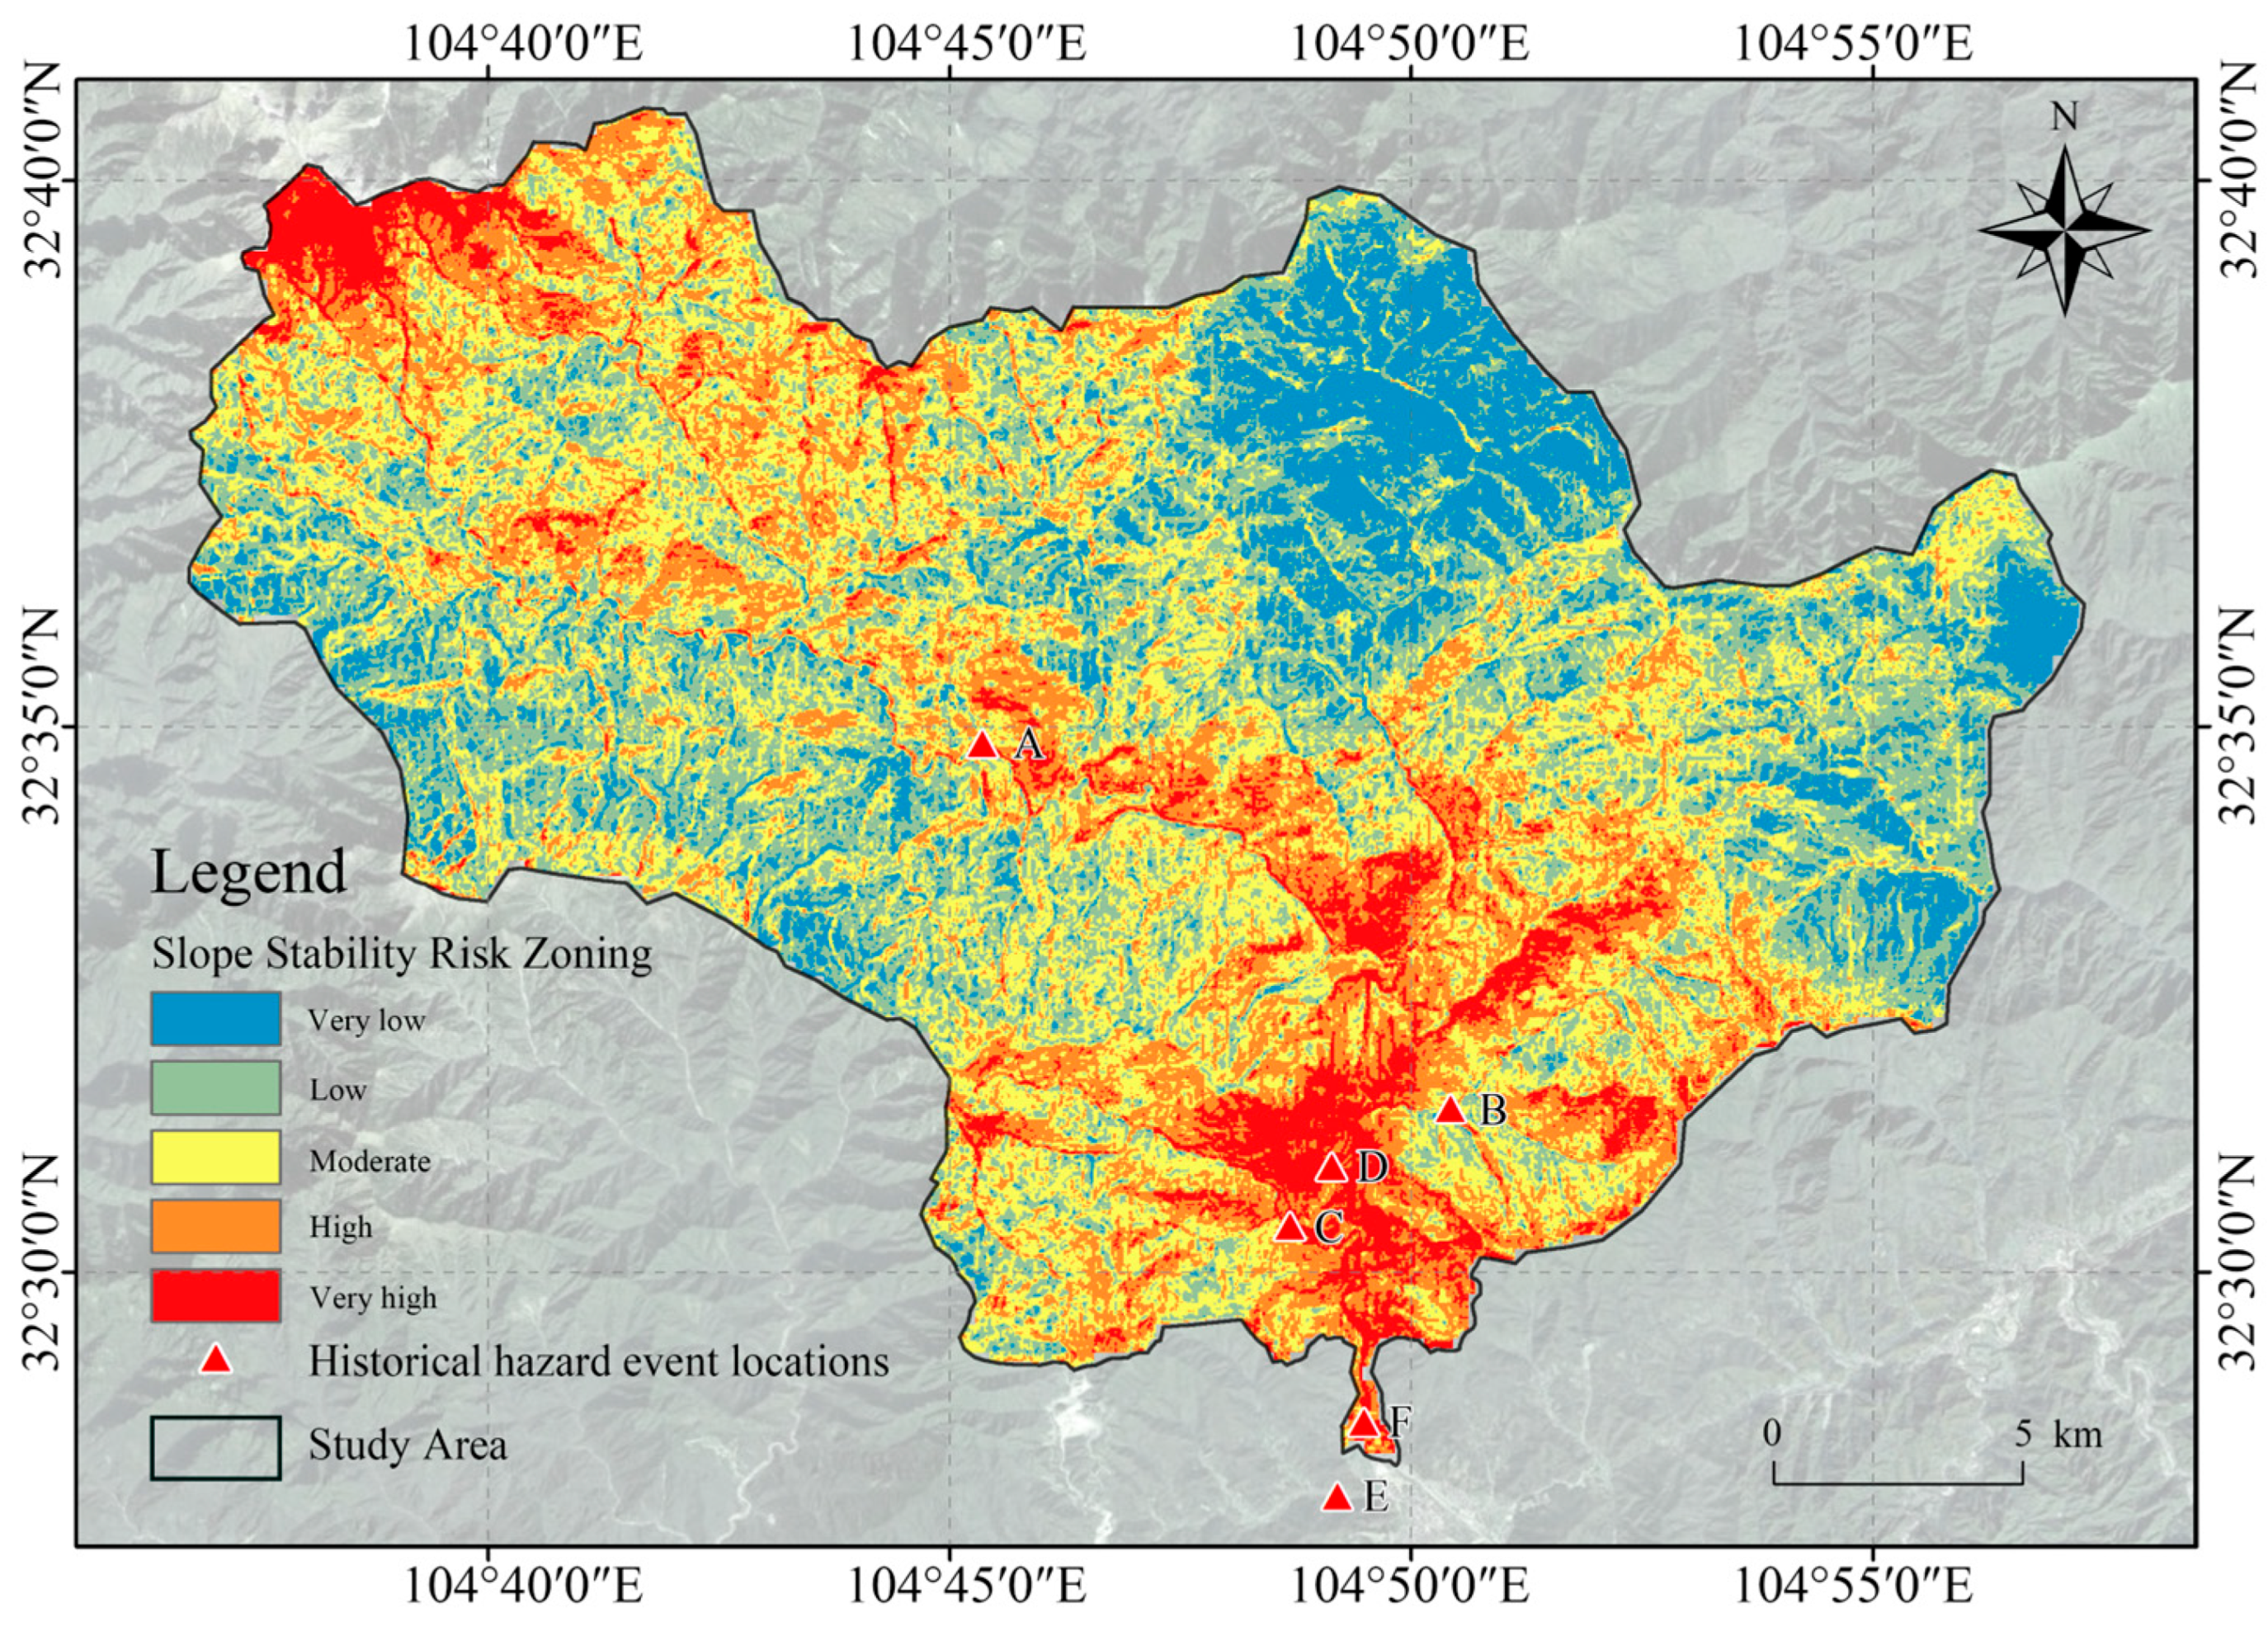
Based on the weighted overlay results, slope stability risk was classified into five categories: Very low, Low, Moderate, High, and Very high (Figure 7). High and very high risk zones are mainly distributed in the central-southern part of the study area and in areas characterized by steep slopes and complex geological conditions, forming relatively continuous clusters. Moderate risk zones occur in transitional areas between high- and low-risk regions, whereas low and very low risk zones are primarily located in the northern and northeastern parts of the study area. All recorded historical hazard sites within the study area are located in moderate, high, or very high risk zones, indicating good agreement between the zoning results and the observed hazard distribution.

4.3. Spatial Aggregation Patterns and Multi-Hazard Hotspot Distribution

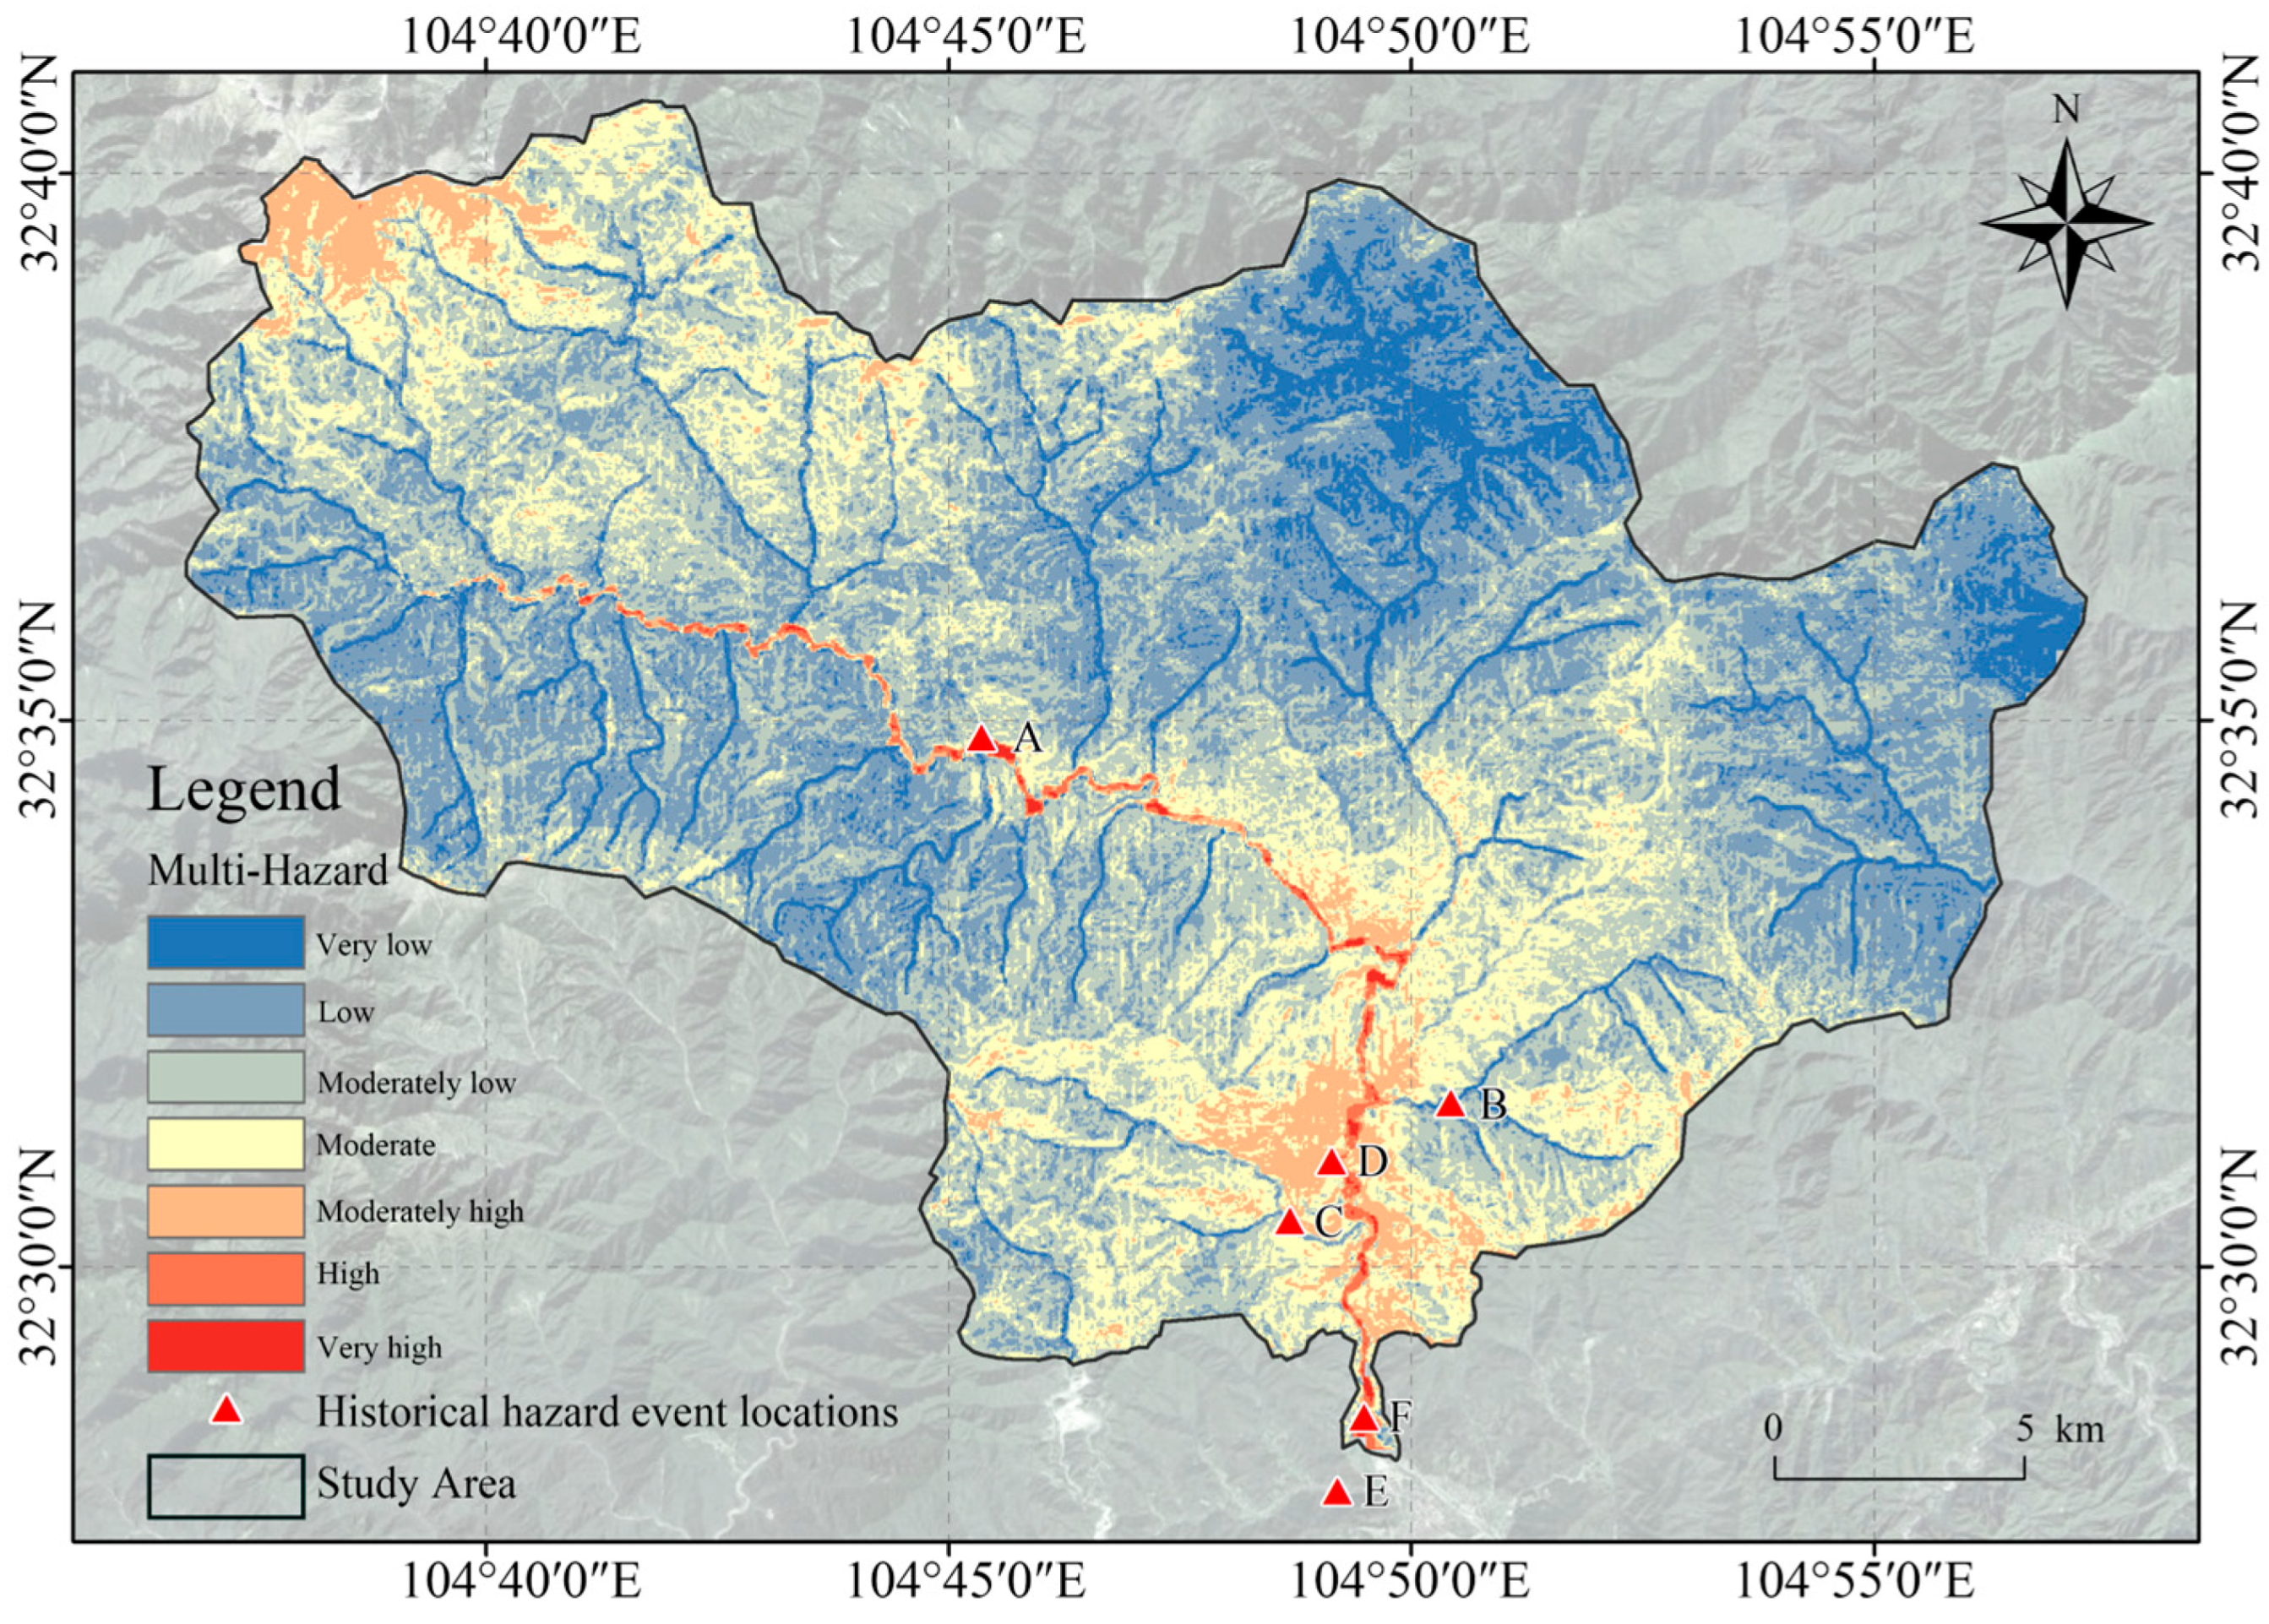
Based on the multi-source factor overlay analysis, integrated flood-related multi-hazard risk was classified into seven levels: Very low, Low, Moderately low, Moderate, Moderately high, High, and Very high (Figure 8). High and very high risk areas are mainly distributed along the main river channel, downstream confluence zones, and the southern valley area. Moderate and moderately high risk areas extend from the river corridors toward adjacent slopes, whereas low-risk areas are mainly located in the northern and northeastern parts of the study area. Most historical hazard sites are located within areas classified as Moderately high and above, showing clear spatial agreement with the integrated risk zoning results.
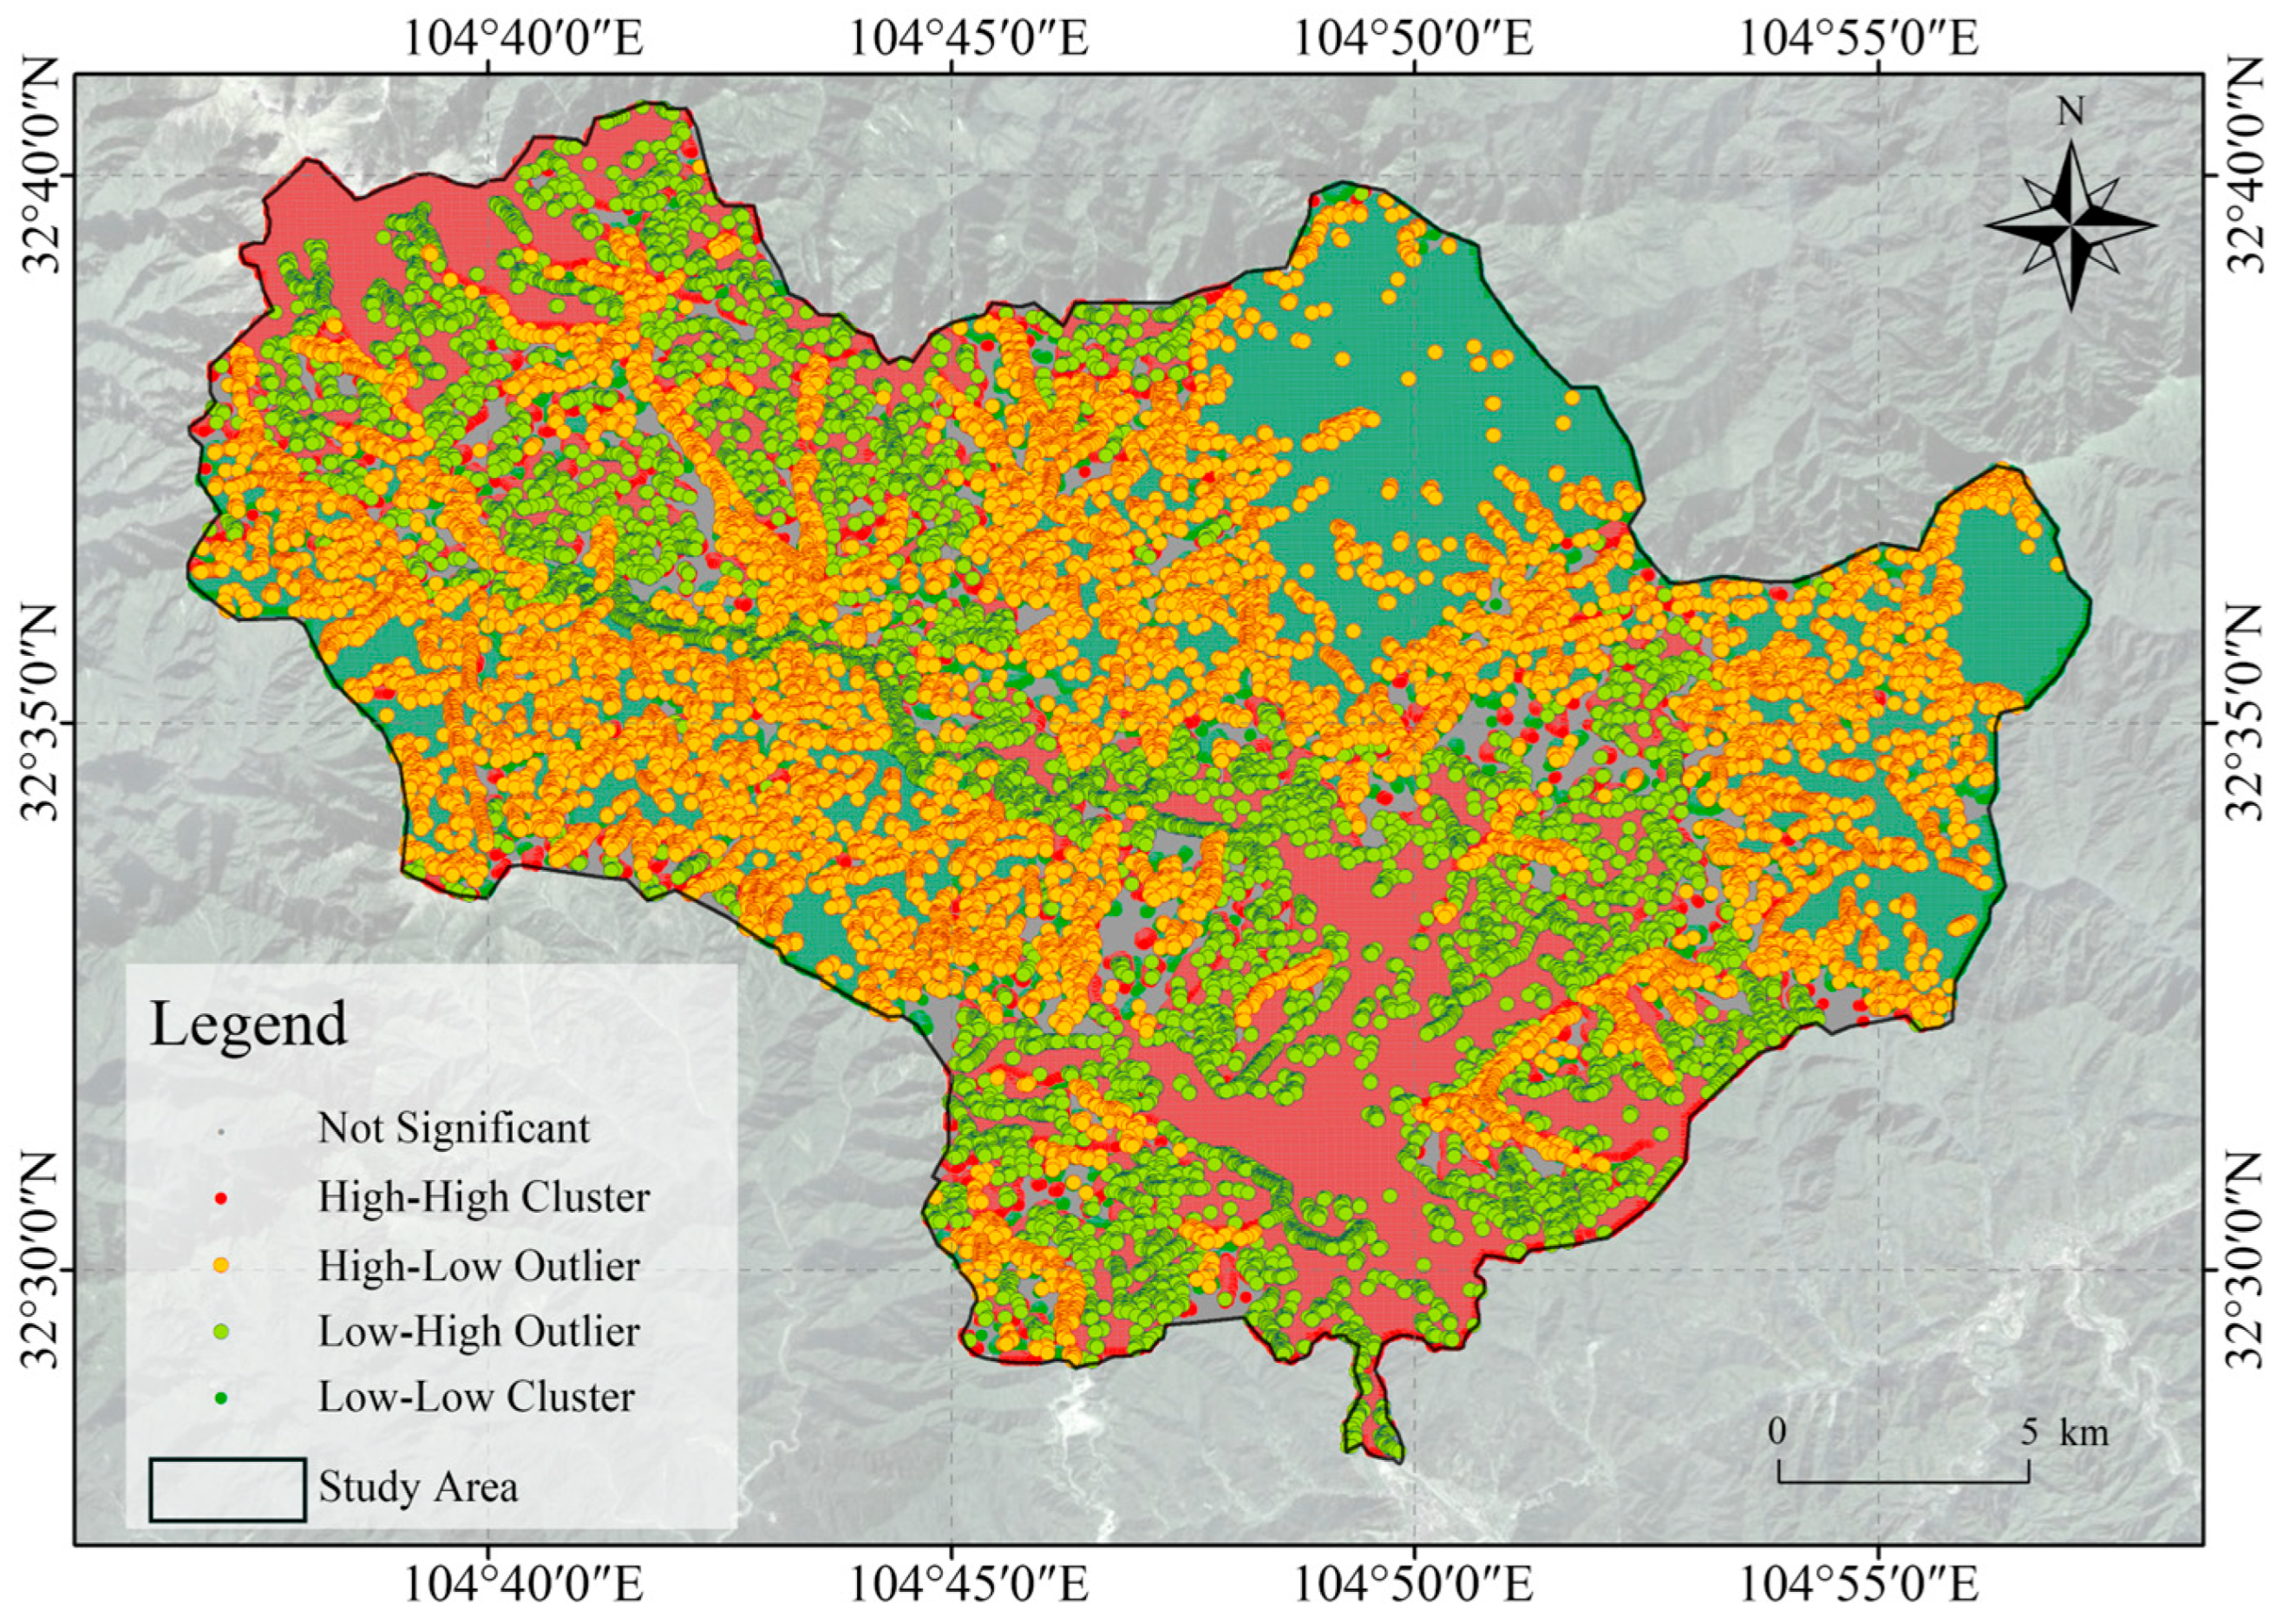
Spatial autocorrelation and hot spot analyses further confirmed the clustered pattern of integrated risk. The global Moran’s I value was 0.74, with a Z-score of 2659.57 and a p-value of 0.00, indicating significant positive spatial autocorrelation. The Anselin Local Moran’s I results show that High–High clusters are concentrated along the main river channel and southern valley area, while Low–Low clusters are mainly distributed in the northern and northeastern regions (Figure 9).
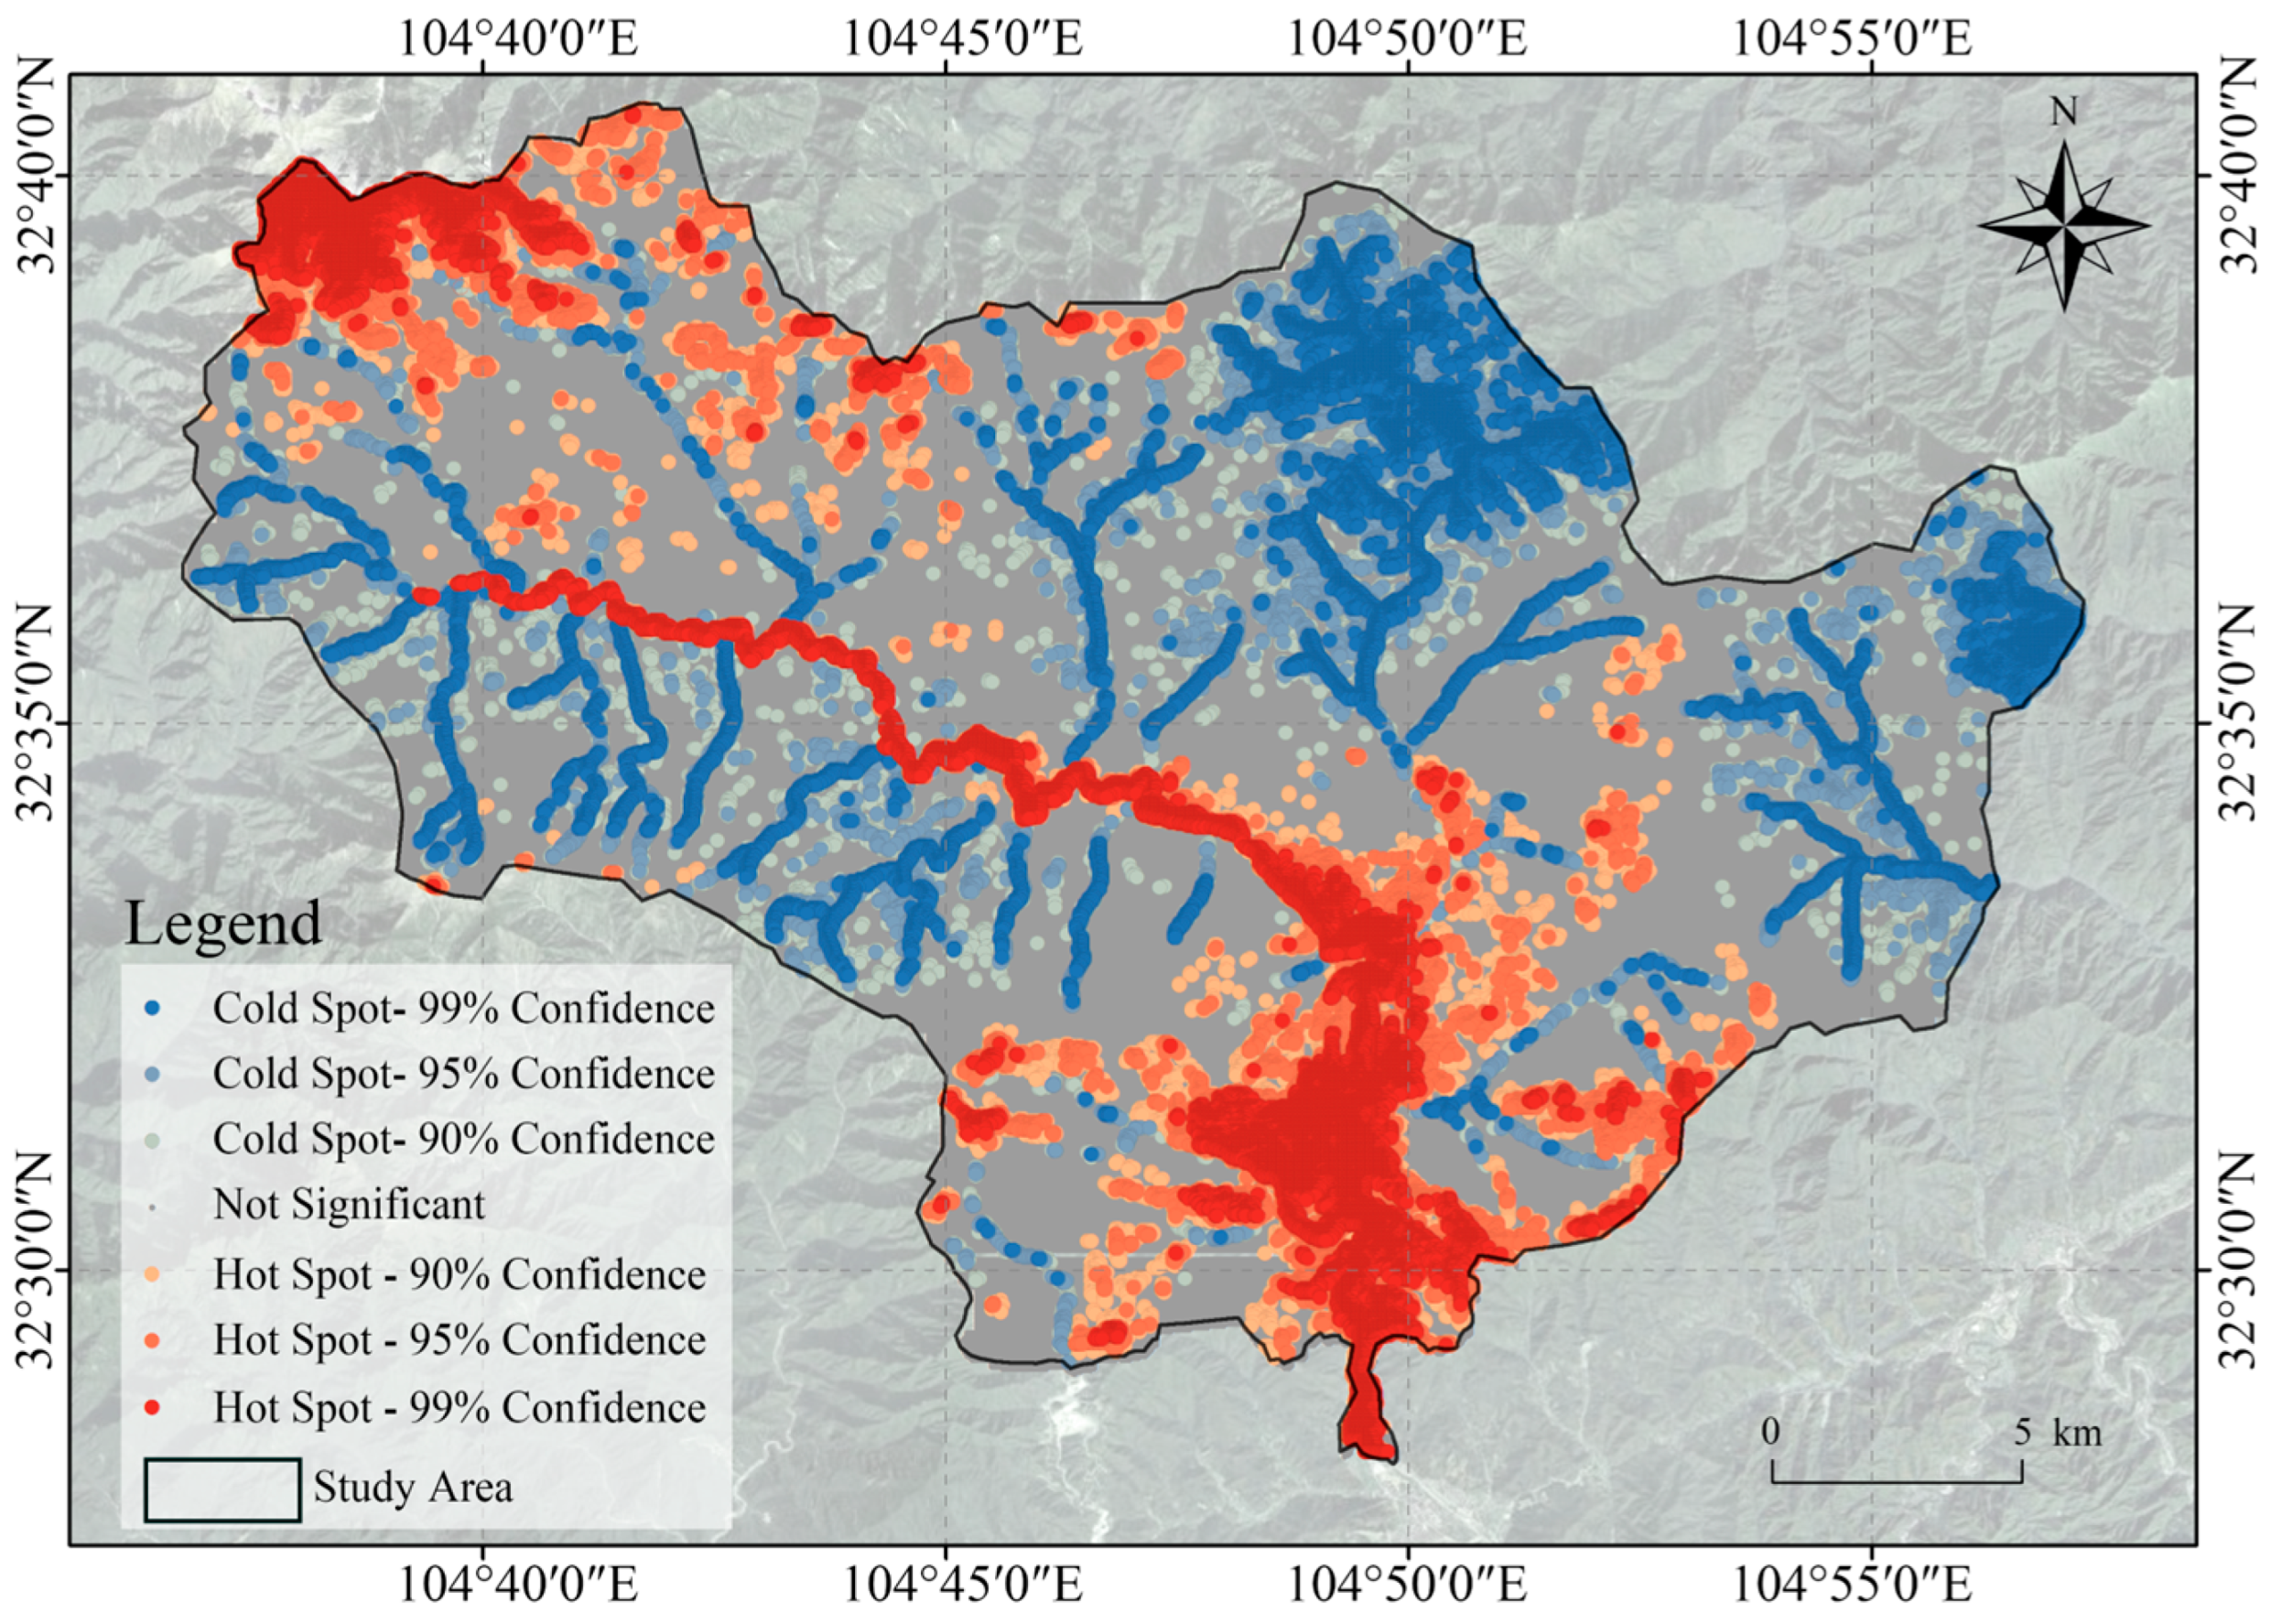
The Getis–Ord Gi* results show that high-confidence hot spots are concentrated in the southern and south-central valley regions and extend along major river channels (Figure 10). Cold spots are mainly distributed in the northern and eastern parts of the study area. Overall, the integrated risk pattern shows higher risk in the south and lower risk in the north, with high-risk clusters and hot spots concentrated along river valleys.

4.4. Multi-Hazard Exposure of Communities

Based on the disaster prevention and control zoning results, the study area exhibits clear spatial differentiation among zoning categories (Figure 11). River channels, valley bottoms, and adjacent low-lying areas form the main transition zones between different prevention and control categories, whereas the surrounding mountainous slopes are dominated by ecological conservation and control-oriented zones.
Priority Relocation Zones are highly concentrated along the main river channel and several constricted valley sections. The enlarged panels in Figure 11 show that these zones are closely associated with village settlements and residential areas distributed near the river. In several locations, individual buildings and building groups are directly adjacent to flood-prone river sections, indicating a high degree of exposure to integrated flood-related hazards.
Drainage Improvement and Consolidation Zones are mainly distributed in valley bottoms, river confluence areas, and locations adjacent to settlements. Water Protection Buffer Zones form continuous linear belts along the river network. Ecological Restoration Zones, Potential Controlled Zones, and General Ecological Conservation Zones occupy most of the surrounding mountainous terrain. Moderate Development Zones are mainly distributed in existing cropland and built-up areas, whereas Risk Conflict Zones are scattered across areas characterized by contrasting flood and landslide risk levels.

5. Discussion

5.1. Model Validation and Reliability Assessment

To evaluate the reliability of the flood simulation results, post-event flood-mark validation was conducted at two representative locations: the flood-induced debris-flow damming site (Site A in Table 1; Figure 12) and the downstream settlement area of Yinping Village (Site F in Table 1; Figure 13). These two sites represent distinct flood-impact environments and provide an opportunity to assess whether the simulated inundation patterns are consistent with observed flood evidence.
At Site A, the observed flood marks are consistent with the simulated area of maximum inundation depth. Field investigations showed that debris and rockfall accumulated within the channel during the flood event, causing temporary blockage and the formation of a landslide-dammed lake. This channel obstruction likely contributed to the localized increase in inundation depth identified by the simulation through upstream backwater effects. Such processes are characteristic of mountainous watersheds, where rainfall–runoff dynamics are governed by complex interactions among precipitation, infiltration, and flow routing, ultimately influencing peak discharge and flood propagation [62]. Flood-control retaining wall construction was already underway when the photographs were taken, indicating ongoing efforts to reduce future flood risk.
At Site F, flood-related sediment deposition was observed inside buildings within the village committee area, while field evidence also indicated substantial channel sediment accumulation and subsequent post-flood clearance activities along the adjacent river. These observations confirm that the downstream settlement area experienced significant impacts during the July 2024 flood event. The consistency between observed impacts and simulated inundation patterns suggests that the model reasonably represented the flood influence within settlements. Previous studies have shown that extreme rainfall can rapidly increase surface runoff in mountainous gullies and trigger coupled flash flood–debris flow processes, with strong interactions between hydrological and geomorphic responses [63]. The agreement between the field observations at Site F and the simulated inundation results, together with the correspondence between the channel blockage identified at Site A and the predicted high-inundation area, further supports the accuracy of the modelling framework in capturing the key flood processes during the July 2024 event.
The agreement between simulated inundation characteristics and observed flood marks indicates that the model successfully captured the major hydrological and geomorphic processes associated with the July 2024 event. While local geomorphic changes and post-event channel adjustments inevitably introduce uncertainty, the validation results indicate that the model provides a reliable basis for subsequent integrated flood-related multi-hazard risk zoning and disaster prevention planning.
In addition to the flood-mark validation, the reliability of the land use and land cover (LULC) dataset was evaluated through an accuracy assessment based on reference samples. A total of 300 validation points were randomly selected and interpreted using high-resolution imagery. The classified results were then compared with the reference classes to construct a confusion matrix (Table 9). The assessment yielded an Overall Accuracy (OA) of 82.67% and a Kappa coefficient of 0.7681, indicating good agreement between the classified map and the reference data. Previous research has indicated that both climate change and land-use patterns significantly influence runoff generation and water retention, with built-up areas typically producing higher runoff while vegetated surfaces enhance infiltration and storage capacity [64]. Given that LULC data were used as an input for the runoff retention assessment in this study, the classification accuracy may influence the spatial distribution of the resulting runoff retention estimates. The obtained OA and Kappa values indicate that the classified dataset is generally consistent with the reference data and is suitable for supporting the subsequent analyses.

5.2. Model Reliability Assessment

Uncertainty in the applied methods and results may arise from the adopted datasets, model inputs, and methodological assumptions. In the LULC classification process, water bodies, infrastructure, and farmland were manually delineated from satellite imagery. In some locations, local inaccuracies may occur due to vegetation cover, terrain shadows, image occlusion, and interpretation uncertainty. These factors may influence the classification results and subsequently affect the flood simulation outputs.
The study area is located in a mountainous region, and a large proportion of the area lies within the Giant Panda National Park, where hydrological monitoring stations are limited and access to certain environmental and infrastructure information is restricted due to management and data-security requirements. The inflow hydrograph used in the HEC-RAS simulation was derived from rainfall–runoff conversion based on empirical hydrological methods, which introduces additional uncertainty associated with the rainfall–runoff estimation process.
Dataset resolution may also influence the representation of terrain and land-surface characteristics. In this study, the DEM, LULC, and NDVI datasets were all available at a spatial resolution of 30 × 30 m, and all spatial datasets were standardized to this resolution during preprocessing to ensure consistency among model inputs. This resolution has been widely applied in regional-scale flood and hazard assessment studies and is consistent with the spatial resolution adopted in previous research [13,26,29]. The 30 × 30 m resolution is appropriate for the scale of this study, although some fine-scale terrain and landscape features may not be fully captured.

5.3. Implications for Community Planning and Disaster Risk Reduction

Previous studies have shown that rural communities often exhibit higher vulnerability to flood hazards due to the combined effects of hazard-forming environments, exposure conditions, and limited disaster response capacity [65]. The results of this study further indicate that flood-related multi-hazard risks vary considerably among communities in the Tangjiahe district. Although Luoyigou Village and Yingping Village are both located in a mountainous environment, differences in settlement patterns, infrastructure distribution, and the spatial distribution of residents’ activities result in distinct characteristics of risk exposure and potential disaster impacts.
Luoyigou Village is located within the national park, where settlements are relatively dispersed and residential buildings, roads, and cultivated land are mainly distributed along both sides of rivers and within valley areas. Under the extreme rainfall scenario, this spatial pattern exposes some settlements simultaneously to flood inundation, hillslope runoff concentration, and slope instability. The risk zoning results of this study further show a clear spatial clustering pattern of risk exposure among residential buildings in Luoyigou Village. High-risk residential buildings are mainly distributed near rivers and in low-lying areas, showing a high degree of overlap with flood inundation zones and areas with relatively steep slopes. During extreme rainfall events, residential buildings, roads, bridges, and residents’ activities within high-risk areas are more likely to be affected by floods and secondary hazards, thereby adversely affecting daily life, transportation access, and emergency response. Studies based on geospatial assessment have also emphasized that the spatial distribution of flood-affected houses reflects localized exposure variability, particularly in areas with limited infrastructure and planning capacity [66]. In light of these findings, risk management in Luoyigou Village should focus on high-risk settlements and their surrounding areas through targeted development control, road safety protection, and risk avoidance measures in key locations, thereby reducing the impacts of extreme weather events on normal community functioning.
Yingping Village exhibits risk characteristics different from those of Luoyigou Village. Public service facilities, public activity spaces, and the main roads and bridges connecting the village with surrounding areas are all located close to river channels. Existing research indicates that residential buildings located in flood-prone areas are highly exposed to flood impacts, with housing conditions and spatial proximity to river systems playing a critical role in shaping community-level risk exposure [67]. In this type of community, risk is mainly reflected in damage to public facilities and disruption of transportation, which can further affect emergency evacuation, material transportation, and external accessibility. In Yingping Village, for example, the 100-year flood inundated the village committee office, damaged part of its archived materials, and caused varying degrees of damage to doors, windows, and associated facilities. Considerable resources were subsequently required for sediment removal and facility restoration. Therefore, priority should be given to improving drainage facilities, enhancing the flood protection capacity of public facilities, ensuring the safety of roads and bridges, and improving drainage measures in low-lying areas.
The above analysis indicates that communities differ substantially in terms of risk sources, exposed elements, and potential losses. These differences require corresponding responses through spatial governance. Therefore, it is necessary to further integrate the results of the integrated risk zoning and disaster prevention zoning, clarify the functional positioning and management priorities of different areas, and translate risk identification results into targeted planning and risk reduction measures, thereby providing a spatial basis for future disaster prevention and mitigation practices.
Based on the results of the integrated risk zoning and disaster prevention zoning, corresponding planning and management strategies can be proposed for different areas. Priority Relocation Zones are characterized by relatively high integrated risk levels and may require gradual optimization of settlement layouts and land-use adjustment in accordance with community development needs. Ecological Restoration Zones should prioritize ecological restoration and slope stabilization measures to reduce the probability of future hazard occurrence. Drainage Improvement and Consolidation Zones should focus on improving drainage systems and flood-control infrastructure in order to enhance resilience to extreme rainfall events. Potential Controlled Zones can maintain overall safety through development control and ecological protection measures.
The implementation of these planning measures requires the joint participation of local governments, community residents, and national park management authorities. Community-based flood risk management approaches emphasize that effective mitigation strategies often rely on the coordination between local stakeholders and spatially explicit planning frameworks, which helps translate risk information into actionable measures [68]. The risk zoning and disaster prevention zoning results developed in this study can provide a basis for spatial planning and risk management and support the translation of risk information into specific management measures.
At the same time, empirical studies have demonstrated that perceived flood risk severity and response capacity significantly influence relocation intentions in flood-prone areas, with socioeconomic conditions further shaping the feasibility of such adaptation strategies [69]. Therefore, when implementing relocation, functional adjustment, or risk avoidance measures, it is also necessary to consider residents’ risk perception, economic conditions, and response capacity, while strengthening communication with village committees and village representatives to avoid formulating measures solely from engineering or spatial perspectives.
Research on flood-prone settlements has shown that long-term flood mitigation effectiveness is closely linked to the integration of spatial planning, infrastructure systems, and adaptive land-use arrangements within a coordinated framework [70]. For communities surrounding the national park, disaster risk reduction, ecological conservation, and community development need to be coordinated within the same framework. The integrated risk zoning and disaster prevention zoning framework developed in this study can provide spatial references for planning and risk management by relevant authorities and support decision-making for communities surrounding mountain national parks in responding to future extreme rainfall events.

6. Conclusions

This study focuses on the Tangjiahe area of the Giant Panda National Park and its surrounding disaster-affected communities. Under the context of extreme climate conditions, it addresses the identification of comprehensive flood-related disaster risk and its translation into spatial governance. A multi-model coupling framework was developed by integrating hydrodynamic simulation, slope risk assessment, and ecological runoff regulation capacity analysis. Based on this framework, spatial overlay analysis and zoning approaches were employed to generate both a comprehensive flood-related disaster risk classification and a disaster prevention and control zoning system. These results enabled a systematic analysis of disaster risk in mountainous national park communities from the dual perspectives of natural process identification and spatial governance response.
The results indicate that, under complex terrain conditions, comprehensive flood-related disaster risk exhibits a clear spatial organization. In mountainous national park environments, disaster risk is primarily governed by hydrodynamic processes and shaped through the combined influence of multiple factors. Flood processes play a dominant role in determining the overall spatial pattern, with high-risk areas forming continuous distributions along the main river channel and its confluence zones and showing greater intensity in locally constricted valley sections and confluence nodes. Slope safety structure conditions and runoff regulation capacity further reinforce or regulate risk across different spatial locations, resulting in a pattern characterized by the superposition of multiple processes within valley spaces.
The key contribution of this study lies in integrating multi-source model outputs into a unified spatial framework, enabling a transition from single-hazard analysis to comprehensive risk identification. At the same time, by establishing a dual system of “risk classification–prevention zoning,” the study links natural process analysis with spatial governance needs, allowing the results to directly support practical management. This approach demonstrates strong applicability in the complex context of mountainous national parks and provides a reference for similar studies on disaster risk identification and spatial planning.
Several limitations should also be noted. The flood simulation is based on specific scenario conditions and does not account for uncertainties associated with multiple extreme rainfall combinations. Some weight assignments rely on expert judgment and may influence the results. Although the disaster prevention and control zoning provides a spatial basis, its implementation still requires further refinement in relation to socio-economic conditions and management systems. Future research could incorporate multi-scenario simulations and dynamic data to improve model adaptability and further develop targeted governance strategies in combination with local community conditions.
Overall, this study establishes a framework for comprehensive flood-related disaster risk identification and spatial governance in mountainous national parks and their surrounding communities under extreme climate conditions. The findings show that, under complex terrain and multi-process interactions, valley spaces constitute the core zones of risk concentration. Through spatial zoning, risk information can be effectively translated into actionable governance pathways, providing a useful reference for disaster prevention and spatial planning in similar regions.

Author Contributions

Conceptualization, J.Q., L.Q., Y.Z. and S.Z.; methodology, J.Q. and L.Q.; software, J.Q. and L.Q.; validation, J.Q.; formal analysis, J.Q.; investigation, J.Q.; resources, L.Q. and S.Z.; data curation, J.Q.; writing—original draft preparation, J.Q.; writing—review and editing, C.Z., L.Q., Y.Z., S.Z. and S.P.; visualization, J.Q.; supervision, C.Z., L.Q., Y.Z., S.Z. and S.P.; project administration, L.Q. and S.Z.; funding acquisition, L.Q. and S.Z. All authors have read and agreed to the published version of the manuscript.

Funding

This research was funded by the National Natural Science Foundation of China (Youth Program): Construction of Ecological Security Pattern in the Transition Zone of Nature Reserves along the Sichuan-Tibet Railway (Western Sichuan Section) [Grant No. 51908470].

Data Availability Statement

The data used to support the findings of this study are available from the corresponding author upon reasonable request.

Conflicts of Interest

The authors declare no conflicts of interest.

Abbreviations

The following abbreviations are used in this manuscript:
HEC-RASHydrologic Engineering Center’s River Analysis System
InVESTIntegrated Valuation of Ecosystem Services and Tradeoffs
AHPAnalytic Hierarchy Process
IPCCIntergovernmental Panel on Climate Change
SUMOSimulation of Urban Mobility
GISGeographic Information System
LISALocal Indicators of Spatial Association
the Tangjiahe districtthe Tangjiahe district of the Giant Panda National Park
DEMDigital Elevation Model
LULCLand Use and Land Cover
NDVINormalized Difference Vegetation Index
USGSUnited States Geological Survey
ENVIEnvironment for Visualizing Images
USDAUnited States Department of Agriculture

References

  1. Nepal, S.; Flügel, W.-A.; Shrestha, A.B. Upstream-Downstream Linkages of Hydrological Processes in the Himalayan Region. Ecol. Process. 2014, 3, 19. [Google Scholar] [CrossRef]
  2. Dixon, S.J.; Sear, D.A.; Odoni, N.A.; Sykes, T.; Lane, S.N. The Effects of River Restoration on Catchment Scale Flood Risk and Flood Hydrology. Earth Surf. Process. Landf. 2016, 41, 997–1008. [Google Scholar] [CrossRef]
  3. Temesgen, H.; Ketema, H.; Kebede, G.; Woldemariyam, F.; Tesfaye, G. The Golden Afromontane Ecosystems at Cross-Road: Wetland-Based Upstream-Downstream Linkage in Genale Dawa River Basin. Heliyon 2025, 11, e41658. [Google Scholar] [CrossRef] [PubMed]
  4. Mo, H.; Xiao, Z. A Systematic Review and Synthesis of Trade Offs and Synergies among Watershed Ecosystem Services. Discov. Environ. 2026, 4, 27. [Google Scholar] [CrossRef]
  5. Legg, S. IPCC, 2021: Climate Change 2021—The Physical Science Basis. Interaction 2021, 49, 44–45. [Google Scholar] [CrossRef]
  6. Li, Z.; Gao, S.; Chen, M.; Gourley, J.J.; Liu, C.; Prein, A.F.; Hong, Y. The Conterminous United States Are Projected to Become More Prone to Flash Floods in a High-End Emissions Scenario. Commun. Earth Environ. 2022, 3, 86. [Google Scholar] [CrossRef]
  7. Michalak, J.L.; Lawler, J.J.; Gross, J.E.; Agne, M.C.; Emmet, R.L.; Hsu, H.-W.; Griffey, V. Climate-change vulnerability assessments of natural resources in U.S. National Parks. Conserv. Sci. Pract. 2022, 4, e12703. [Google Scholar] [CrossRef]
  8. Palazzo Corner, S. The Sixth Major IPCC Assessment Report and Its Implications: 15 September 2021. Weather 2022, 77, 70–71. [Google Scholar] [CrossRef]
  9. Gao, D.; Yin, J.; Wang, D.D.; Yang, Y.; Lu, Y.; Chen, R. Modelling and validation of flash flood inundation in drylands. J. Geogr. Sci. 2024, 34, 185–200. [Google Scholar] [CrossRef]
  10. Zheng, J.; Yao, Z.; Liao, X.; Huang, G.; Chen, X. Responses of Urban Flood Resilience to Climate Change and Its Multi-Level Enhancement Pathway. Landsc. Archit. Front. 2026, 14, 260004. [Google Scholar] [CrossRef]
  11. Merchán, L.; Martínez-Graña, A.M.; Nieto, C.E.; Criado, M. Natural Hazard Characterisation in the Arribes Del Duero Natural Park (Spain). Land 2023, 12, 995. [Google Scholar] [CrossRef]
  12. Zhu, Q.; Wangdwei, M.; Yang, W.; Baimu, S.; Qian, L. Remote Sensing-Enhanced Structural Equation Modeling for Evaluating the Health of Ancient Juglans regia L. in Tibetan Traditional Villages. Forests 2025, 17, 56. [Google Scholar] [CrossRef]
  13. Li, Y.; Wang, P.; Zhai, B.; Villa, D.; Luigi, S.; Xiao, C.; Huang, C.; Xu, Y.; Angelo, L. Multi-Scale Remote Sensing Analysis of Terrain–Resilience Coupling in Mountainous Traditional Villages: A Case Study of the Qinba Mountains, China. Land 2025, 14, 2299. [Google Scholar] [CrossRef]
  14. Qian, L.; Fu, Y. Disaster risk at the world heritage in mountains: Huascarán. Landsc. Archit. 2019, 26, 100–104. [Google Scholar] [CrossRef]
  15. Qian, L.; Zhao, S.; Morales Gonzalez, J.A.; Yang, R. An analysis of the control “disaster” type natural phenomena in national parks. Landsc. Archit. 2023, 40, 39–47. [Google Scholar] [CrossRef]
  16. Somos-Valenzuela, M.A.; Chisolm, R.E.; Rivas, D.S.; Portocarrero, C.; McKinney, D.C. Modeling a Glacial Lake Outburst Flood Process Chain: The Case of Lake Palcacocha and Huaraz, Peru. Hydrol. Earth Syst. Sci. 2016, 20, 2519–2543. [Google Scholar] [CrossRef]
  17. Frey, H.; Huggel, C.; Chisolm, R.E.; Baer, P.; McArdell, B.; Cochachin, A.; Portocarrero, C. Multi-Source Glacial Lake Outburst Flood Hazard Assessment and Mapping for Huaraz, Cordillera Blanca, Peru. Front. Earth Sci. 2018, 6, 210. [Google Scholar] [CrossRef]
  18. Sarker, S.; Jahan, I.; Wang, X.; Azad, A. Geospatial Approach to Assess Flash Flood Vulnerability in a Coastal District of Bangladesh: Integrating the Multifaceted Dimension of Vulnerabilities. ISPRS Int. J. Geo-Inf. 2025, 14, 194. [Google Scholar] [CrossRef]
  19. Whitfield, P.H.; Pomeroy, J.W. Changes to Flood Peaks of a Mountain River: Implications for Analysis of the 2013 Flood in the Upper Bow River, Canada. Hydrol. Process. 2016, 30, 4657–4673. [Google Scholar] [CrossRef]
  20. Yu, Q.; Rennie, C.D.; Slaney, J.M. Gravel-Bed River Morphodynamic Processes throughout a Large Flood with an 80-Year Return Period from Numerical Modeling: Implications for Flood Regulation Strategies. J. Hydrol. 2025, 660, 133463. [Google Scholar] [CrossRef]
  21. Costa Rocha, P.A.; Oliveira Santos, V.; Scott, J.; Van Griensven Thé, J.; Gharabaghi, B. Application of Graph Neural Networks to Forecast Urban Flood Events: The Case Study of the 2013 Flood of the Bow River, Calgary, Canada. Int. J. River Basin Manag. 2025, 23, 469–486. [Google Scholar] [CrossRef]
  22. Rebally, A.; Valeo, C.; Saidi, S.; He, J.J. Assessing the Temporal Qualities of Indirect Impacts of Flooding on Traffic. Int. J. Disaster Risk Reduct. 2026, 135, 106035. [Google Scholar] [CrossRef]
  23. Tanner, A.; Árvai, J. Perceptions of Risk and Vulnerability Following Exposure to a Major Natural Disaster: The Calgary Flood of 2013. Risk Anal. 2018, 38, 548–561. [Google Scholar] [CrossRef] [PubMed]
  24. Chikodzi, D.; Nhamo, G.; Dube, K.; Chapungu, L. Climate Change Risk Assessment of Heritage Tourism Sites within South African National Parks. Int. J. Geoheritage Park. 2022, 10, 417–434. [Google Scholar] [CrossRef]
  25. Shah, R.K.; Shah, R.K. Geospatial technique based flood hazard assessment and mapping: A case study of Orang National Park, Assam, India. In Applications of Geospatial Technology and Modeling for River Basin Management; Modern Cartography Series; Elsevier: Amsterdam, The Netherlands, 2024; Volume 12, pp. 143–169. [Google Scholar] [CrossRef]
  26. Ajin, R.S.; Krishnamurthy, R.R.; Jayaprakash, M.; Vinod, P.G. Flood hazard assessment of Vamanapuram River Basin, Kerala, India: An approach using remote sensing and GIS techniques. Adv. Appl. Sci. Res. 2013, 4, 263–274. [Google Scholar]
  27. Garrote, J.; Díez-Herrero, A.; Bodoque, J.; Perucha, M.; Mayer, P.; Génova, M. Flood Hazard Management in Public Mountain Recreation Areas vs. Ungauged Fluvial Basins. Case Study of the Caldera de Taburiente National Park, Canary Islands (Spain). Geosciences 2017, 8, 6. [Google Scholar] [CrossRef]
  28. Abbasi, E.; Etemadi, H.; Krzyszczak, J. Habitat suitability and flood risk modeling for Gazella conservation actions in Mond protected area. Int. J. Disaster Risk Reduct. 2024, 113, 104816. [Google Scholar] [CrossRef]
  29. Mohanty, S.; Mustak, S.; Singh, D.; Van Hoang, T.; Mondal, M.; Wang, C.-T. Vulnerability and Risk Assessment Mapping of Bhitarkanika National Park, Odisha, India Using Machine-Based Embedded Decision Support System. Front. Environ. Sci. 2023, 11, 1176547. [Google Scholar] [CrossRef]
  30. Dube, K.; Nhamo, G.; Chikodzi, D.; Chapungu, L. Mapping and Evaluating the Impact of Flood Hazards on Tourism in South African National Parks. J. Outdoor Recreat. Tour. 2023, 43, 100661. [Google Scholar] [CrossRef]
  31. Park, H.; Nam, K.; Egawa, S. The gaps between institutional and practical disaster risk management measures on coastal flood risks in South Korea’s coastal communities. Int. J. Disaster Risk Sci. 2024, 15, 594–607. [Google Scholar] [CrossRef]
  32. Tangjiahe National Nature Reserve Administration. General Introduction to the Tangjiahe Area of Giant Panda National Park. Available online: https://www.tjhnr.cn/web/square/detail/458/30189/468 (accessed on 2 October 2025).
  33. Liang, Y. Research on Landscape Planning Strategies of the Entrance Community of Giant Panda National Park from the Perspective of Natural Education: A Case Study of Luoyigou Village in Tangjiahe District. Master’s Thesis, Chongqing University, Chongqing, China, 2024. [Google Scholar]
  34. Zhang, Y.; Chen, Q.; Zhang, Y.; Du, C. Assessing perceived equity in community management in Giant Panda National Park and its regulatory mechanisms. Chin. Landsc. Archit. 2024, 40, 93–98. [Google Scholar] [CrossRef]
  35. Administration of Tangjiahe National Nature Reserve. Available online: https://www.tjhnr.cn/ (accessed on 19 December 2025).
  36. Ye, T.; Huang, C.; Deng, Z. Spatial database of 1:2,500,000 digital geologic map of People’s Republic of China. Geol. China 2017, 44, 24–31. [Google Scholar] [CrossRef]
  37. Su, Y.; Zhao, Q.; Jin, M.; Liang, M. Study on parameters of runoff concentration and confluence parameter in special small watershed in Southwest China. Electr. Power Surv. Des. 2019, S1, 73–76. [Google Scholar] [CrossRef]
  38. Gao, Y.; Zhao, S.; Deng, J.; Yu, Z.; Rahman, M. Flood Assessment and Early Warning of the Reoccurrence of River Blockage at the Baige Landslide. J. Geogr. Sci. 2021, 31, 1694–1712. [Google Scholar] [CrossRef]
  39. Zhang, H. Study on Application of River Regulation Scheme in Mountainous Area Based on MIKE21FM. Master’s Thesis, North China University of Water Resources and Electric Power, Zhengzhou, China, 2021. [Google Scholar]
  40. Sun, Y.; Guo, X.; Chen, X.; Zhang, J. Uncertainty analysis of hydrological model in the application of small watershed in Wenchuan earthquake disaster area. J. Nat. Disasters 2022, 31, 226–237. [Google Scholar] [CrossRef]
  41. Liu, F.; Huang, N. Application of HEC-RAS in flood inundation map drawing of Caizi River Basin. Sichuan Water Resour. 2025, 46, 128–131. [Google Scholar]
  42. Sun, Z.; Jia, Y.; Wu, Q.; Jiang, J.; Zheng, L.; Cui, Z.; Fabris, L.M.F. Simulation and assessment of rainstorm flood risk in mountainous rural settlements under climate change scenarios. Landsc. Archit. Front. 2025, 13, 94–108. [Google Scholar] [CrossRef]
  43. Quagliolo, C.; Comino, E.; Pezzoli, A. Experimental Flash Floods Assessment Through Urban Flood Risk Mitigation (UFRM) Model: The Case Study of Ligurian Coastal Cities. Front. Water 2021, 3, 663378. [Google Scholar] [CrossRef]
  44. Azadgar, A.; Nyka, L.; Salata, S. Advancing Urban Flood Resilience: A Systematic Review of Urban Flood Risk Mitigation Model, Research Trends, and Future Directions. Land 2024, 13, 2138. [Google Scholar] [CrossRef]
  45. Li, J.; Zhou, C. Appropriate Grid Size for Terrain Based Landslide Risk Assessment in Lantau Island, Hong Kong. J. Remote Sens. 2003, 7, 86–92. [Google Scholar] [CrossRef]
  46. Wang, X.; Luo, Y.; Fu, J. Geological hazard susceptibility assessment based on GIS in water source area of Bailongjiang river water diversion project. South-North Water Transf. Water Sci. Technol. 2022, 20, 1231–1239. [Google Scholar] [CrossRef]
  47. Zhang, C. Application of information value method based on GIS in landslide susceptibility assessment: A case study of Pucheng, Fujian. Environ. Vis. 2022, 5, 90–92. [Google Scholar]
  48. Chelariu, O.-E.; Minea, I.; Iațu, C. Geo-Hazards Assessment and Land Suitability Estimation for Spatial Planning Using Multi-Criteria Analysis. Heliyon 2023, 9, e18159. [Google Scholar] [CrossRef] [PubMed]
  49. Jia, L.; Chen, S. Geological Hazard Susceptibility Evaluation Based on AHP and GIS in Zhouqu County, Gansu. Northwest. Geol. 2024, 57, 23–33. [Google Scholar] [CrossRef]
  50. Fazilova, D.; Magdiev, K.; Makhmudov, M.; Fazilov, A. A Multi-Criteria GIS Model for Geohazard Assessment in the Charvak Reservoir Area, Uzbekistan. Egypt. J. Remote Sens. Space Sci. 2025, 28, 587–596. [Google Scholar] [CrossRef]
  51. Cui, P.; Bazai, N.A.; Qiang, Z.; Jiao, W.; Yan, W.; Xu, Q.; Yu, L.; Bo, Z. Flood Risk Assessment with Machine Learning: Insights from the 2022 Pakistan Mega-Flood and Climate Adaptation Strategies. npj Nat. Hazards 2025, 2, 42. [Google Scholar] [CrossRef]
  52. Li, Q.; Huang, X.; Pan, F.; Hu, Q.; Xu, X. Land-Use and Flood Risk Assessment Under Uncertainty: A Monte Carlo Approach in Hunan Province, China. Land 2026, 15, 541. [Google Scholar] [CrossRef]
  53. Ramamurthy, A.; Chundeli, F.A.; Srikonda, R. Flood Risk Assessment, Mapping and Planning by GIS-Decision Support Systems: A Case Study in Kerala State, India. OIDA Int. J. Sustain. Dev. 2024, 17, 47–66. [Google Scholar]
  54. Nasiri Khiavi, A.; Vafakhah, M.; Kim, D.; Jun, C.; Bateni, S.M. Integrating Remote Sensing, Machine Learning, and Local Knowledge for Innovative Flood Susceptibility and Vulnerability Mapping. J. Flood Risk Manag. 2025, 18, e70149. [Google Scholar] [CrossRef]
  55. Ma, Y.; Li, X.; Yang, Y.; He, S.; Guo, H.; Liu, B. A Multi-Indicator Hazard Mechanism Framework for Flood Hazard Assessment and Risk Mitigation: A Case Study of Rizhao, China. Land 2025, 15, 82. [Google Scholar] [CrossRef]
  56. Mehrpouya, M.R.; Ghavimipanah, M.H. Identifying Effective Factors and Landslide Risk Zoning Using the Maximum Entropy Method (Case Study: Chalus Watershed). Water Soil Manag. Model. 2024, 5, 247–264. [Google Scholar] [CrossRef]
  57. Yang, W.; Ge, Q.; Tao, Z.; Xu, D.; Wang, Y.; Hao, Z. Landslide Susceptibility on the Qinghai-Tibet Plateau: Key Driving Factors Identified through Machine Learning. J. Geogr. Sci. 2026, 36, 199–218. [Google Scholar] [CrossRef]
  58. Nwogu, N.; Victoria, M.F.; Salman, H.; Oyetunji, A.K. Integrating GIS into Flood Risk Management: A Global South Perspective on Resilience, Planning, and Policy. Water 2025, 17, 3149. [Google Scholar] [CrossRef]
  59. Liu, D.; Zhang, J.; Wang, X.; Peng, J.; Wang, R.; Huang, X.; Li, D.; Shao, L.; Hao, Z. Synergizing Multi-Temporal Remote Sensing and Systemic Resilience for Rainstorm–Flood Risk Zoning in the Northern Qinling Foothills: A Geospatial Modeling Approach. Remote Sens. 2025, 17, 2009. [Google Scholar] [CrossRef]
  60. Hermon, D. Community-Based Adaptive Sustainability and Flood Vulnerability Zoning Using Social Resilience Indicators in Kampar Regency, Indonesia. GEOMATE J. 2026, 30, 21–30. [Google Scholar] [CrossRef]
  61. Byers, A.C.; Rinzin, S.; Byers, E.; Wangchuk, S. Evolution of a Potentially Dangerous Glacial Lake on the Kanchenjunga Glacier, Nepal, Predictive Flood Models, and Prospective Community Response. Water 2025, 17, 1457. [Google Scholar] [CrossRef]
  62. Attar, M.I.; Khan, J.N.; Altaf, Y.; Alsubih, M.; Naseer, S.; Kumar, R.; Bhat, O.A.; Bangroo, S.A.; Sharma, M.K. Design Storm Estimation for Flood Risk Assessment in the Temperate Himalayan Basin Using Hydrological Modelling. Sci. Rep. 2025, 15, 33358. [Google Scholar] [CrossRef] [PubMed]
  63. Ma, J.; Gao, H.; Xu, C.; Qi, S. Characterization and Formation Mechanism of the Catastrophic Flash Flood-Debris Flow Hazard Triggered by the July 2023 Extreme Rainstorm in Hantai Gully of Beijing, China. Landslides 2025, 22, 877–893. [Google Scholar] [CrossRef]
  64. Irani, T.; Abghari, H.; Rasouli, A.A. Comparative Analysis of the Effects of Climate Change and Land Use on Runoff and Its Prediction in a Mountainous Watershed in Northwestern Iran. Water Soil Manag. Model. 2025, 5, 181–198. [Google Scholar] [CrossRef]
  65. Gong, J.; Kong, F.; Li, F. Better Understanding Flood Resilience in Rural China: A Review Integrating Regional Disaster Systems and 4R Theory. Nat. Hazards 2026, 122, 235. [Google Scholar] [CrossRef]
  66. Belenguer-Plomer, M.A.; Mendes, I.; Lazzarini, M.; Barrilero, O.; Saameño, P.; Albani, S. Estimating Flood-Affected Houses as an SDG Indicator to Enhance the Flood Resilience of Sahel Communities Using Geospatial Data. Remote Sens. 2025, 17, 2087. [Google Scholar] [CrossRef]
  67. Wang, J.; Li, J. To Move or Not to Move? An Investigation of the Phenomenon of Relocation of Settlements in the Lower Yellow River Floodplain Area. Nat. Hazards 2026, 122, 98. [Google Scholar] [CrossRef]
  68. Lin, C.A. Participatory Flood Risk Management and Environmental Sustainability: The Role of Communication Engagement, Severity Beliefs, Mitigation Barriers, and Social Efficacy. Sustainability 2025, 17, 2844. [Google Scholar] [CrossRef]
  69. Al Mamun, A.; Masukujjaman, M.; Radhakrishnan, M.; Reza, M.N.H.; Hussain, W.M.H.W. Perceived Flood Risk Severity and Response Efficacy Affect Migration Intentions in Flood-Prone Regions of Klang Valley in Malaysia. Commun. Earth Environ. 2025, 6, 597. [Google Scholar] [CrossRef]
  70. An, Q.; Ochiai, C. Planning Heritage in Flood-Prone Zones: Planning Responses and Urban Morphological Evolution in the Ancient City of Linhai, China. Clim. Risk Manag. 2026, 51, 100798. [Google Scholar] [CrossRef]
Figure 1. Geographical location ((a) Hierarchical location of the study area; (b) Regional location of the study area).
Land 15 01201 g001
Figure 2. Flow chart of this research.
Land 15 01201 g002
Figure 3. Inflow hydrograph under the 100-year return period rainfall scenario.
Land 15 01201 g003
Figure 4. Flood inundation under the 100-year return period scenario.
Land 15 01201 g004
Figure 5. (a) Runoff retention index in the 100-year return period scenario; (b) Surface runoff depth in the 100-year return period scenario.
Land 15 01201 g005
Figure 6. Spatial distribution of conditioning factors used for slope stability risk zoning (a) slope; (b) aspect; (c) elevation; (d) lithology; (e) distance to faults; (f) soil type; (g) distance to water bodies; (h) runoff depth; (i) flood intensity; (j) NDVI; (k) road network density; (l) distance to communities.
Land 15 01201 g006aLand 15 01201 g006bLand 15 01201 g006c
Figure 7. Slope stability risk zoning results in the study area. Uppercase letters (A–F) indicate the locations of the representative hazard events listed in Table 1.
Land 15 01201 g007
Figure 8. Integrated flood-related multi-hazard risk zoning. Uppercase letters (A–F) indicate the locations of the representative hazard events listed in Table 1.
Land 15 01201 g008
Figure 9. Cluster and outlier analysis of multi-hazard risk (Anselin Local Moran’s I).
Land 15 01201 g009
Figure 10. Hot spot analysis of multi-hazard risk (Getis–Ord Gi*).
Land 15 01201 g010
Figure 11. Disaster prevention and control zoning for integrated flood hazards in the study area.
Land 15 01201 g011
Figure 12. Post-event flood-mark validation at the flood-induced debris-flow damming location (Site A in Table 1). (a,b) Photographs taken by the author on 31 March 2026.
Land 15 01201 g012
Figure 13. Post-event flood-mark validation in the downstream settlement area of Yinping Village (Site F in Table 1). (a,b) Photographs taken by the author on 24 September 2025.
Land 15 01201 g013
Table 1. Summary of hazard event records in the Tangjiahe district.
Hazard
ID
DateHazard TypeAdjacent Administrative VillageSpecific LocationHazard Description
A23 July 2024Flood-induced debris flow with dammed-lake formation/Zhejiang–Sichuan Research and Education CenterFlood processes triggered a debris flow that resulted in channel blockage and the formation of a debris dam, accompanied by the accumulation of large volumes of slope-derived materials. Engineering remediation for this site has been initiated by the reserve administration.
B2025LandslideLuoyigou VillageMaliushuThe landslide occurred in a forested area and caused no casualties or damage to infrastructure; the landslide body was approximately 10 m wide and 20–30 m high
CSince 2023, recurring during the rainy seasons of 2024 and 2025Rainfall-induced recurrent landslideLuoyigou VillageBackslope of houses in the Dafenlin direction, Group 2The landslide has recurred since its initial occurrence in 2023 and reactivated again during the rainy season of 2024; it occurred once more in 2025, with displaced material entering the house and causing sediment accumulation indoors; residents have now been relocated and the house has been abandoned
D2019CollapseLuoyigou VillageMajiadiThe collapse was subsequently treated with engineering measures, and a retaining wall had been completed by 2021
E2016 or 2017Prolonged rainfall-induced landslideYingping VillageUnknownApproximately 40 days of continuous rainfall triggered the landslide, posing a threat to houses at the slope toe; engineering treatment has since been implemented through retaining-wall construction
F24 July 2024Flood-induced channel water-level riseYingping VillageDownstream river channel and village committee areaFloodwater rose in the river channel, and floodwater together with sediment entered the village committee building
Table 2. Data sources.
DataSourceResolution
Digital Elevation Model (DEM)Provided by the Management Office of Tangjiahe National Nature Reserve, Sichuan Province30 × 30 m
Nature Reserve BoundaryNational Specimen Information Infrastructure (https://www.nsii.org.cn/2017/home.php; accessed on 8 May 2025)
Administrative Village BoundariesOpen Street Map
Rainfall Intensity and DurationQingchuan National Basic Meteorological Station (Station No. 57204), Qingchuan County, Guangyuan City, Sichuan Province, China
Remote Sensing ImageESRI Imagery (https://www.esri.com/; accessed on 9 October 2024)
Land Use/Land Cover, LULCUSGS Landsat8 (https://earthexplorer.usgs.gov/; accessed on 18 April 2025)
Supervised Classification via ArcGIS 10.8
File Name: LC09_L1TP_128036_20241231_20241231_02_T1
30 × 30 m
Normalized Difference Vegetation Index (NDVI)USGS Landsat8 (https://earthexplorer.usgs.gov/; accessed on 18 April 2025)
Supervised Classification via ENVI 5.3
File Name: LC09_L1TP_128036_20241231_20241231_02_T1
30 × 30 m
Spatial Distribution of LithologyGeological map database [36]
Fault StructureGeological map database [36]
Soil Texture Type (USDA Classification)Geographic Data Sharing Infrastructure, Global Resources Data Cloud (www.gis5g.com; accessed on 8 May 2025)
RoadsOpen Street Map
Water bodiesDigitized by the author based on high-resolution satellite imagery
Building footprintsDigitized by the author based on high-resolution satellite imagery
CroplandDigitized by the author based on high-resolution satellite imagery
Table 3. Manning’s roughness coefficient (n) values.
Surface MaterialManning’s Roughness Coefficient (n)
Water bodies0.035
Cropland0.035
Grass0.05
Forest0.25
Infrastructure0.012
Table 4. Curve number (CN) values.
CodeDescriptionCN_ACN_BCN_CCN_DSW_TypeEMC
1Water bodies10010010010070000
2Cropland6778858970000
3Infrastructure7785909270000
4Forest3055707770000
5Grass4969798470000
Table 5. Evaluation indicator system and weight allocation for regional slope stability risk zoning in the study area.
Target
Layer
Criterion Layer (Weight)Indicator FactorIndexLocal WeightGlobal Weight
Slope Stability Risk IndexTopographic Factors
(24.97%)
SlopeA148.94%12.22%
AspectA219.42%4.85%
ElevationA331.64%7.90%
Geological Conditions
(29.80%)
LithologyB130.25%9.01%
Distance to FaultsB246.03%13.72%
Soil TypeB323.72%7.07%
Hydrological Factors
(13.95%)
Distance to Water BodiesC114.65%2.04%
Runoff DepthC234.45%4.81%
Flood IntensityC350.90%7.10%
Ecological Environment
(13.45%)
NDVID1100%13.45%
Anthropogenic Factors
(17.82%)
Road Network DensityE155.45%9.88%
Distance to CommunitiesE244.55%7.94%
Table 6. Pairwise comparison matrix and normalized weights for lithology categories.
LithologyL1L2L3L4L5L6Weight
L1 11325790.42
L2 21/311/23450.18
L3 31/2212340.21
L4 41/51/31/21230.1
L5 51/71/41/31/2120.06
L6 61/91/51/41/31/210.04
1 Triassic granodiorite, quartz diorite, and quartz monzodiorite; 2 Nanhua–Sinian Muzuo and Shuijing Formations, comprising metamorphic pebbly sandstone, sandstone, phyllite, and crystalline dolomite; 3 Silurian Maoxian Group, consisting of phyllite and slate interbedded with metasandstone, marl, and marble; 4 Green/gray-green greenschist (metamorphosed basic volcanic rocks), mica-quartz schist, and phyllite interbedded with marble, quartzite, and jasper; 5 Deep-sea to bathyal turbidites composed of gray metasandstone, metaconglomerate, phyllite, and metasiltstone, with minor basic volcanic lenses; 6 Quartz diorite and quartz-dioritic mylonite with strong mylonitization.
Table 7. Pairwise comparison matrix and relative weights for soil types.
Soil TypeS1S2S3S4Weight
S1 71.0002.0004.0006.0000.49
S2 80.5001.0003.0005.0000.30
S3 90.2500.3331.0002.0000.13
S4 100.1670.2000.5001.0000.08
7 Silty clay loam; 8 Silt loam; 9 Loam; 10 Sandy loam.
Table 8. Pairwise comparison matrix for the evaluation factors.
FactorsC1C2C3Weight
C1 111360.64
C2 121/3140.27
C3 131/61/410.09
11 Flood Inundation; 12 Slope stability risk; 13 Runoff Retention.
Table 9. Confusion matrix and accuracy assessment results of the LULC classification.
ClassWater BodiesCroplandGrassForestInfrastructureTotalU_AccuracyKappa
Water bodies520070590.88140
Cropland0301040.750
Grass0021030.66670
Forest2012181152190.82650
Infrastructure000510150.66670
Total72421952730000
P_Accuracy0.72220.7510.92820.370400.82670
Kappa00000000.7681
Disclaimer/Publisher’s Note: The statements, opinions and data contained in all publications are solely those of the individual author(s) and contributor(s) and not of MDPI and/or the editor(s). MDPI and/or the editor(s) disclaim responsibility for any injury to people or property resulting from any ideas, methods, instructions or products referred to in the content.