Article

Exploring the Relationships Between Residential Green Spaces and Childhood Allergic Diseases in Chengdu, China


1
Urban and Rural Planning Department, School of Architecture, Southwest Jiaotong University, Chengdu 611756, China
2
Dermatology Department, West China Hospital, Sichuan University, Chengdu 610041, China
*
Author to whom correspondence should be addressed.
Land 2026, 15(7), 1186; https://doi.org/10.3390/land15071186
Submission received: 23 April 2026 / Revised: 15 June 2026 / Accepted: 25 June 2026 / Published: 1 July 2026

Abstract

Studies on the association between green spaces and childhood allergic diseases are limited and have yielded inconsistent results across different regions. Furthermore, this relationship remains underexplored in Chengdu, China. In this study, we aimed to investigate the association between the residential greening rate, Normalized Difference Vegetation Index (NDVI), proportion of allergenic plants (proportion of allergenic woody plants, proportion of allergenic herbaceous plants), the closeness-to-nature characteristics of children’s playgrounds, and childhood allergic diseases in Chengdu. Seven representative neighborhoods were selected based on a 2018 database of pediatric patients from West China Hospital of Sichuan University. Through questionnaires in 2025, data on allergic diseases (e.g., atopic dermatitis and allergic rhinitis) were collected for 210 children aged 0–6 years. Logistic regression models were employed to analyze the data. The results indicate that in the overall sample, residential greening rate, NDVI, proportion of allergenic plants and closeness-to-nature characteristics of children’s playgrounds showed no significant association with allergic diseases. However, subgroup analyses revealed that greening rate was positively associated with allergy risk among children aged 0–3 years, whereas the proportion of allergenic woody plants was negatively associated with allergy risk in this age group; residential NDVI was significantly negatively associated with allergy risk in low-to-medium-housing-price neighborhoods (<19,000 CNY/m2), but positively associated in high-housing-price neighborhoods (≥19,000 CNY/m2); the proportion of allergenic herbaceous plants was significantly negatively associated with allergy risk in children only in high-housing-price neighborhoods. The presence of children’s playgrounds, accessibility of natural elements, integration of sites and facilities into the landscape, and use of natural materials in playgrounds and facilities showed a negative trend with allergy risk in low-to-medium-housing-price neighborhoods; the integration of sites and facilities into the landscape was significantly positively associated with allergy risk in high-rise neighborhoods. Collectively, these associations vary based on individual and neighborhood characteristics. Targeted green space planning and design interventions should be context-specific, synergistically optimizing vegetation coverage and plant composition, while enhancing the closeness-to-nature characteristics of children’s playgrounds within neighborhoods. Our results provide empirical evidence that may offer insights into the development of healthy and child-friendly cities.

1. Introduction

Allergic diseases have come to be one of the most common conditions of the 21st century, affecting approximately 40% of the global population [1] and ranking among the top three diseases impacting children worldwide [2]. Over the past three decades, the prevalence of childhood allergic diseases has increased globally [3]. Consistent with trends in Western developed countries, the prevalence of childhood allergic diseases in China has been increasing. For instance, data suggest that the prevalence of childhood atopic dermatitis in China increased from 3.07% in 2002 to 12.94% in 2014 [4]. Allergic diseases not only hinder healthy growth and development in children but can also impair their quality of life, become life-threatening, and impose a heavy economic burden on society [5,6,7].
The hygiene [8], “old friends” [9], biodiversity [10], and microbiome rewilding [11] hypotheses and related studies [12,13] collectively highlight the critical association between natural environments, such as green spaces, and allergic diseases. In the context of urbanization, changes in environment and lifestyle have reduced human contact with natural environments such as green spaces. This reduction has led to decreased exposure to microbial diversity, which in turn has impeded immunoregulatory circuits, contributing to a sharp increase in the incidence of allergic diseases. Restoring urban green spaces can facilitate appropriate environmental microbial exposure and potentially reduce the incidence of these diseases. Since the first empirical study illustrating the association between natural environments and childhood allergic diseases in 2012 [14], empirical research in this domain has rapidly developed. It has emerged as an increasingly important field of study, designed to elucidate the role of green spaces in childhood allergic diseases.
However, existing research exploring the relationship between green spaces and allergic diseases has predominantly focused on developed countries [15]. In China, a developing country experiencing a rapid upward trend in childhood allergy incidence, studies investigating this association remain scarce. Concurrently, previous empirical studies have mostly focused on the greening rate (defined as the ratio of the vertical projection area of greening vegetation—including trees, shrubs, vines, and lawns—to the total land area within a defined scope), and the macroscopic Normalized Difference Vegetation Index (NDVI, a key remote sensing indicator that reflects surface vegetation growth conditions and estimates vegetation coverage) [16,17,18], paying limited attention to plant composition, and green space characteristics within and surrounding playgrounds. Plant composition is also closely associated with allergy, and a higher proportion of allergenic plants may increase allergy risk in children [19]. Residential children’s playgrounds are the most frequently used spaces for children’s daily activities, providing vital opportunities for contact with nature [20]. Differences in closeness-to-nature characteristics, such as landscape types within and surrounding children’s playgrounds in residential neighborhoods and accessibility of natural elements in these playgrounds, may lead to variations in children’s exposure to residential green spaces [21], thereby influencing their allergy outcomes. To some extent, the closeness-to-nature characteristics of playgrounds reflect the ecological quality of green spaces, which is not strictly equivalent to the overall scale of green spaces. Further research is needed to explore the distinct health benefits offered by each of these factors. Furthermore, current research results on the association between green spaces and childhood allergic diseases vary considerably across different contexts. Some studies have found a negative association between NDVI and allergic diseases, whereas others have reported no association or even a positive one. For example, a study conducted by Cavaleiro Rufo et al. in Porto, Portugal, found that NDVI was negatively associated with allergic diseases and asthma at ages 4 and 7 [22]. Conversely, research by Dadvand et al. in Sabadell, Spain, discovered no association between NDVI and childhood asthma or allergic rhinitis [23]. In contrast, an investigation by Sandra et al. based in Kaunas, Lithuania, indicated that an increase in NDVI was associated with an elevated risk of childhood asthma [24]. In addition, some studies have observed significant differences in allergic diseases across socioeconomic strata [7]. Therefore, the protective or detrimental effects of green spaces on childhood allergic diseases may vary depending on individual and neighborhood characteristics [25], underscoring the need to explore the differential association patterns between green spaces and childhood allergic diseases.
To address the gaps in existing research, this study was focused on China, a developing nation, and we selected Chengdu—a city with a high incidence of childhood allergic diseases [4]—as the study area. By focusing on residential green spaces, which children interact with most frequently in their daily lives, we utilized residential greening rate, NDVI, proportion of allergenic plants and the green space characteristics of children’s playgrounds to conduct an empirical investigation. To the best of our knowledge, this is the first study in Chengdu, China, to evaluate the association between residential green space characteristics and allergic diseases in children aged 0–6 years. Utilizing individual- and neighborhood-level data, we investigated the association between objectively estimated residential greening rate, NDVI, proportion of allergenic plants, closeness-to-nature characteristics of children’s playgrounds, and childhood allergy status (categorized as allergic or non-allergic based on questionnaire surveys). Demographics (gender, age, family monthly income, maternal education), family genetics (family history of allergic diseases), lifestyle (mode of delivery, feeding pattern, hygiene habits), and neighborhood characteristics (construction year, average housing price, location) were included as covariates. The research framework is illustrated in Figure 1.
This study incorporated not only the greening rate and NDVI metric to ensure comparability with existing research but also refined field-survey-based indicators for the proportion of allergenic plants and closeness-to-nature characteristics of children’s playgrounds. Furthermore, subgroup analyses were conducted to examine the associations between these indicators and childhood allergic diseases across various individual and neighborhood characteristics. This approach was designed to reveal the impact of micro-scale residential green spaces on childhood allergic diseases. The research question is: What associations exist among residential green space accessibility, plant composition, the closeness-to-nature characteristics of children’s playgrounds, and childhood allergy risk? Ultimately, these findings can provide an evidence base for identifying specific residential green space characteristics that influence allergic diseases, while offering empirical references for formulating residential planning policies and interventions aimed at mitigating childhood allergy risk.

2. Materials and Methods

2.1. Study Site and Design

We selected Chengdu as the research area. The first city in China to initiate the “Park City” strategy, Chengdu is a major urban center in Southwest China recognized for its rich biodiversity [26]. With the qualitative and quantitative improvement in urban green spaces, urban biodiversity has been increasingly enriched. However, the city also features a large number of neighborhoods built in different eras [27], which exhibit significant characteristics in terms of the scale and quality of their green spaces [28]. Furthermore, in a 2016 nationwide study in China, Chengdu reported a relatively high prevalence of childhood allergic diseases. Notably, the prevalence of atopic dermatitis (AD), a sensitivity disease of the skin, ranked highest among the 12 cities included in the study [25].
The neighborhoods targeted in this study were selected based on their typicality from a database of pediatric patients in Chengdu and their corresponding neighborhood environments, derived from clinical records at West China Hospital of Sichuan University in 2018. The sample selection process was conducted as follows:
There were a total of 1732 clinical records of residents diagnosed with allergic diseases. After excluding 1665 individuals due to incomplete address information, imprecise geolocation, duplicate records, or age over 7 years, records for 67 children aged 0–6 years were retained. Based on their address, they were spatially localized across 67 different neighborhoods in Chengdu. Finally, this study adopted a multistage stratified random sampling method to determine the study sample. First, construction year (pre-2000, 2000–2010, post-2010) and spatial location (city center, transition zone, inner suburb) were used as primary stratification variables to form the base layer. Second, secondary stratification was applied based on development intensity (high, medium, low density) and residential function (commercial housing, employee housing, etc.). On this basis, further stratification was conducted according to green space baseline conditions (classified as high, medium, or low greening rate levels) to ensure sufficient heterogeneity among the sampled neighborhoods. The purpose of stratification was to guarantee appropriate representation of neighborhoods with different characteristics in the study sample and to reduce the possibility of over-concentration or omission of certain types of neighborhoods due to random sampling. After stratification, simple random sampling was used to select study units within each final stratum, with appropriate adjustments made based on the feasibility of field investigation. Ultimately, seven representative residential neighborhoods were selected as the study subjects.
Based on the actual activity range and exposure scenarios of children aged 0–6 years, this study defined a neighborhood as a gated residential community within the property management red line. The land use of a neighborhood mainly included residential land, public green space, road land, and land for ancillary public service facilities (including property management buildings).
Regarding the delineation of spatial unit boundaries for neighborhoods, existing studies generally adopted two approaches: first, administrative boundaries or property management red lines; second, buffers delineated around the neighborhood centroid. The latter was more widely used. To align with international studies in spatial boundary delineation, ensure the reproducibility and comparability of the research, and guarantee uniform statistical boundaries across the seven neighborhoods, this study distinguished between internal and external green space exposure within and around neighborhoods. The specific statistical boundaries were set as follows:
Neighborhood green space indicator (greening rate): The statistical boundary was the gated residential community boundary defined by the property management red line.
NDVI buffer: Taking the geometric centroid of each neighborhood as the center and using the median radius of the seven neighborhoods (150 m) as the baseline, a 250 m circular buffer was formed by extending outward by 100 m. This scale was widely adopted in international studies on neighborhood green space and health [17,23,29].
Closeness-to-nature characteristics of children’s playgrounds: The statistical boundary was a 5 m outward extension from the playground boundary line, based on field observations that this range covered the green space exposure areas involved in children’s activities.
Among these, the greening rate reflected green space exposure within the property management red line of the neighborhood, representing the exclusive green space that children could directly access and use. NDVI captured exposure to ecosystem services provided by green spaces reachable via short walking distances around the neighborhood (e.g., parks, street trees, roadside green spaces), and this exposure was not affected by the artificial division of the neighborhood red line.
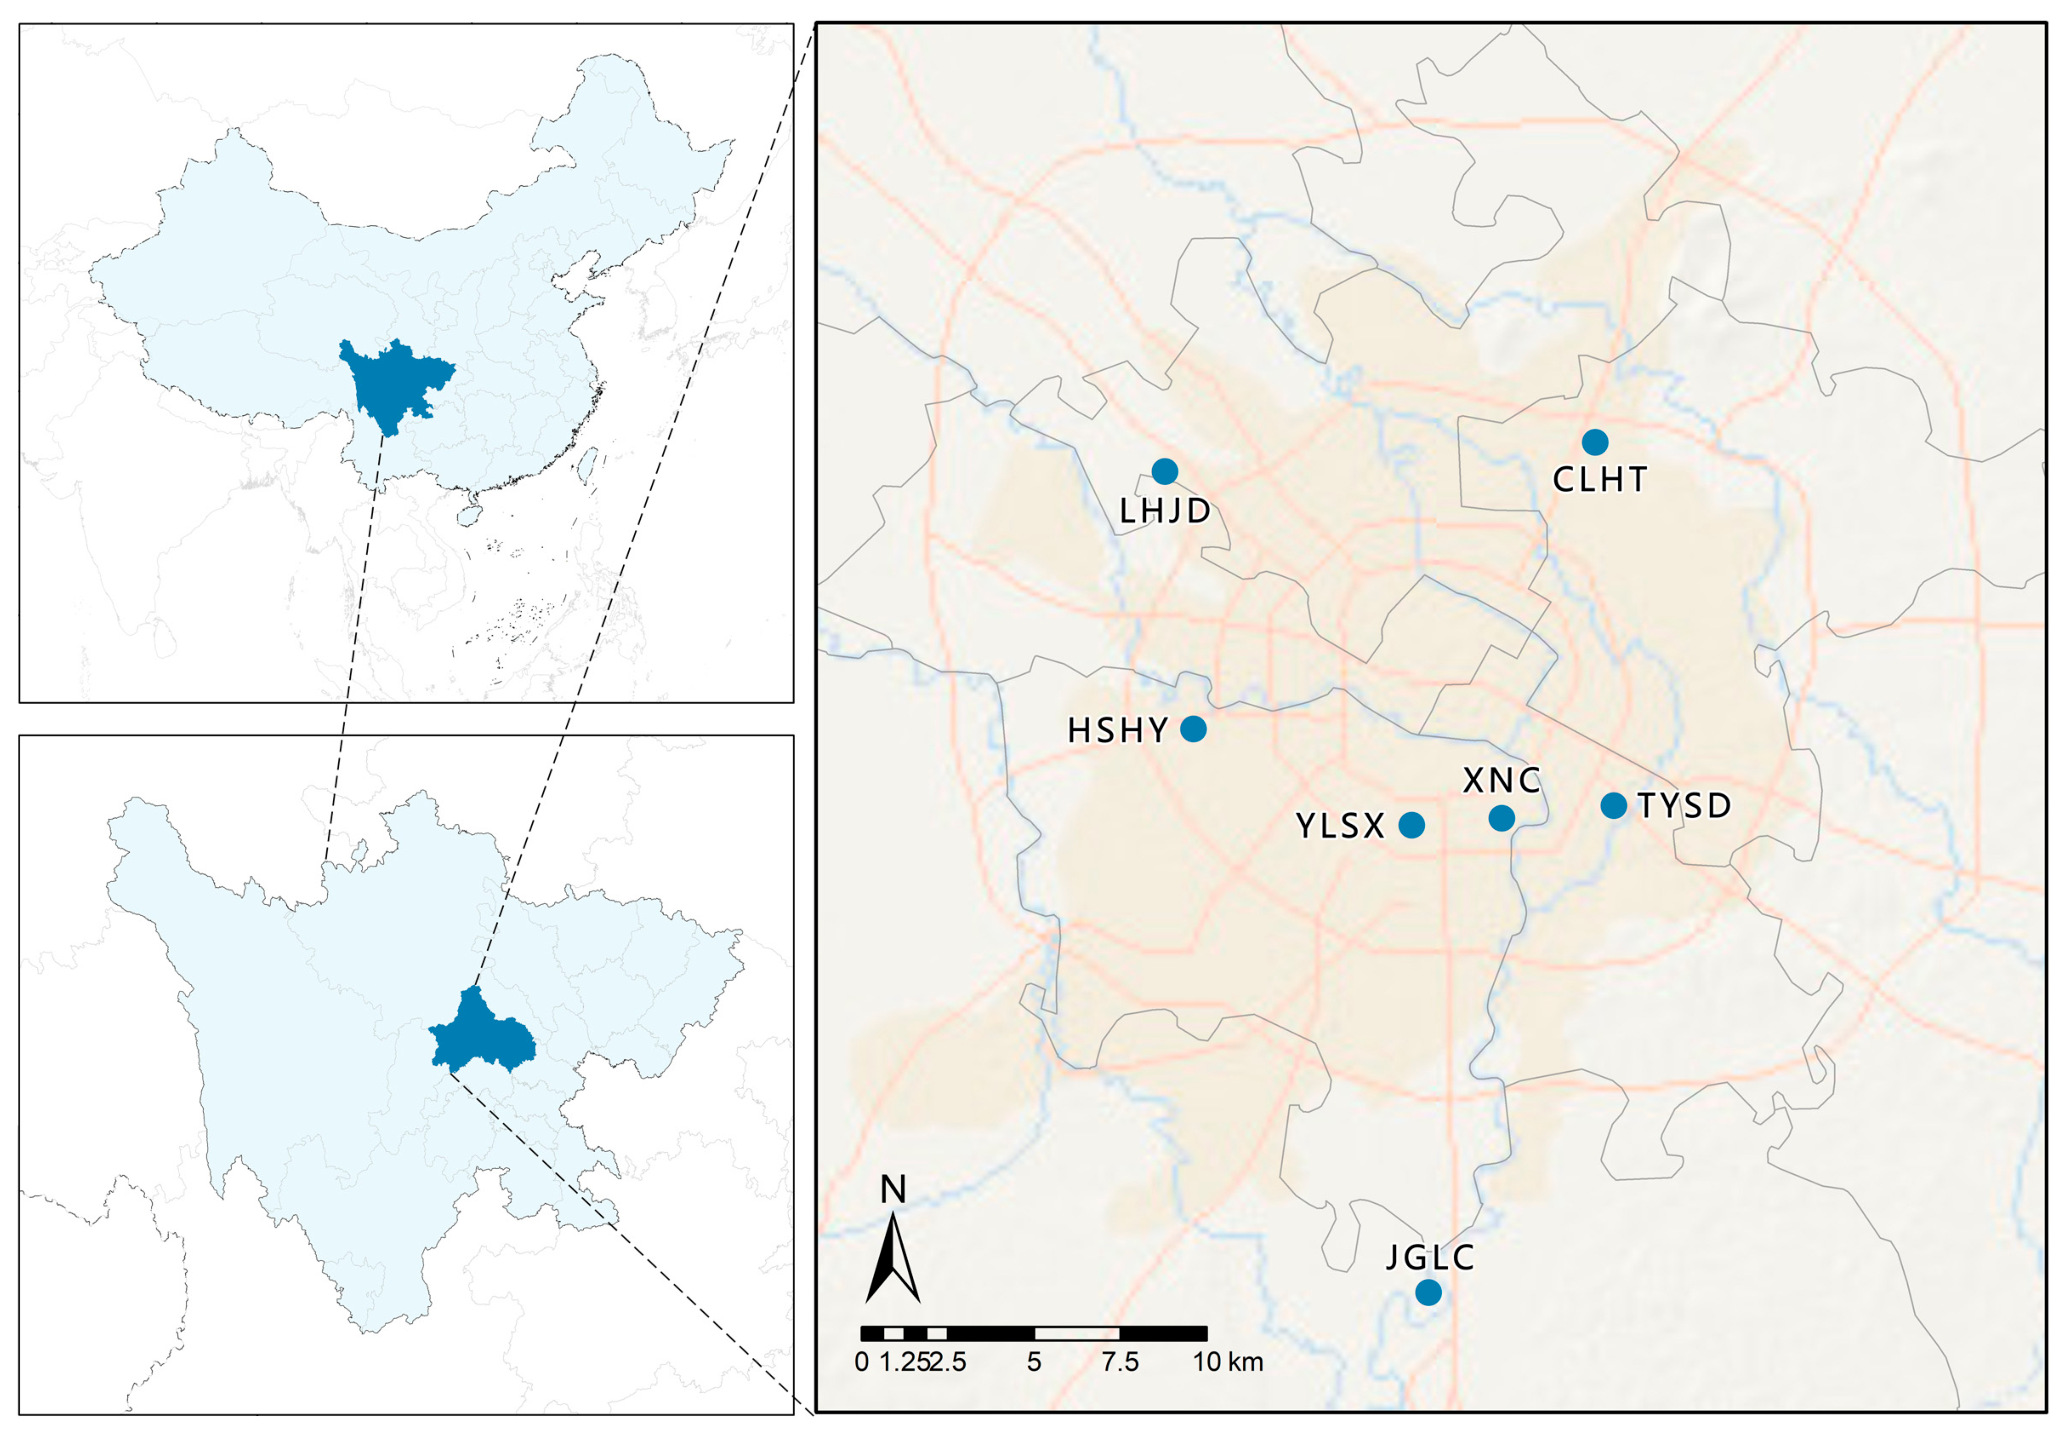
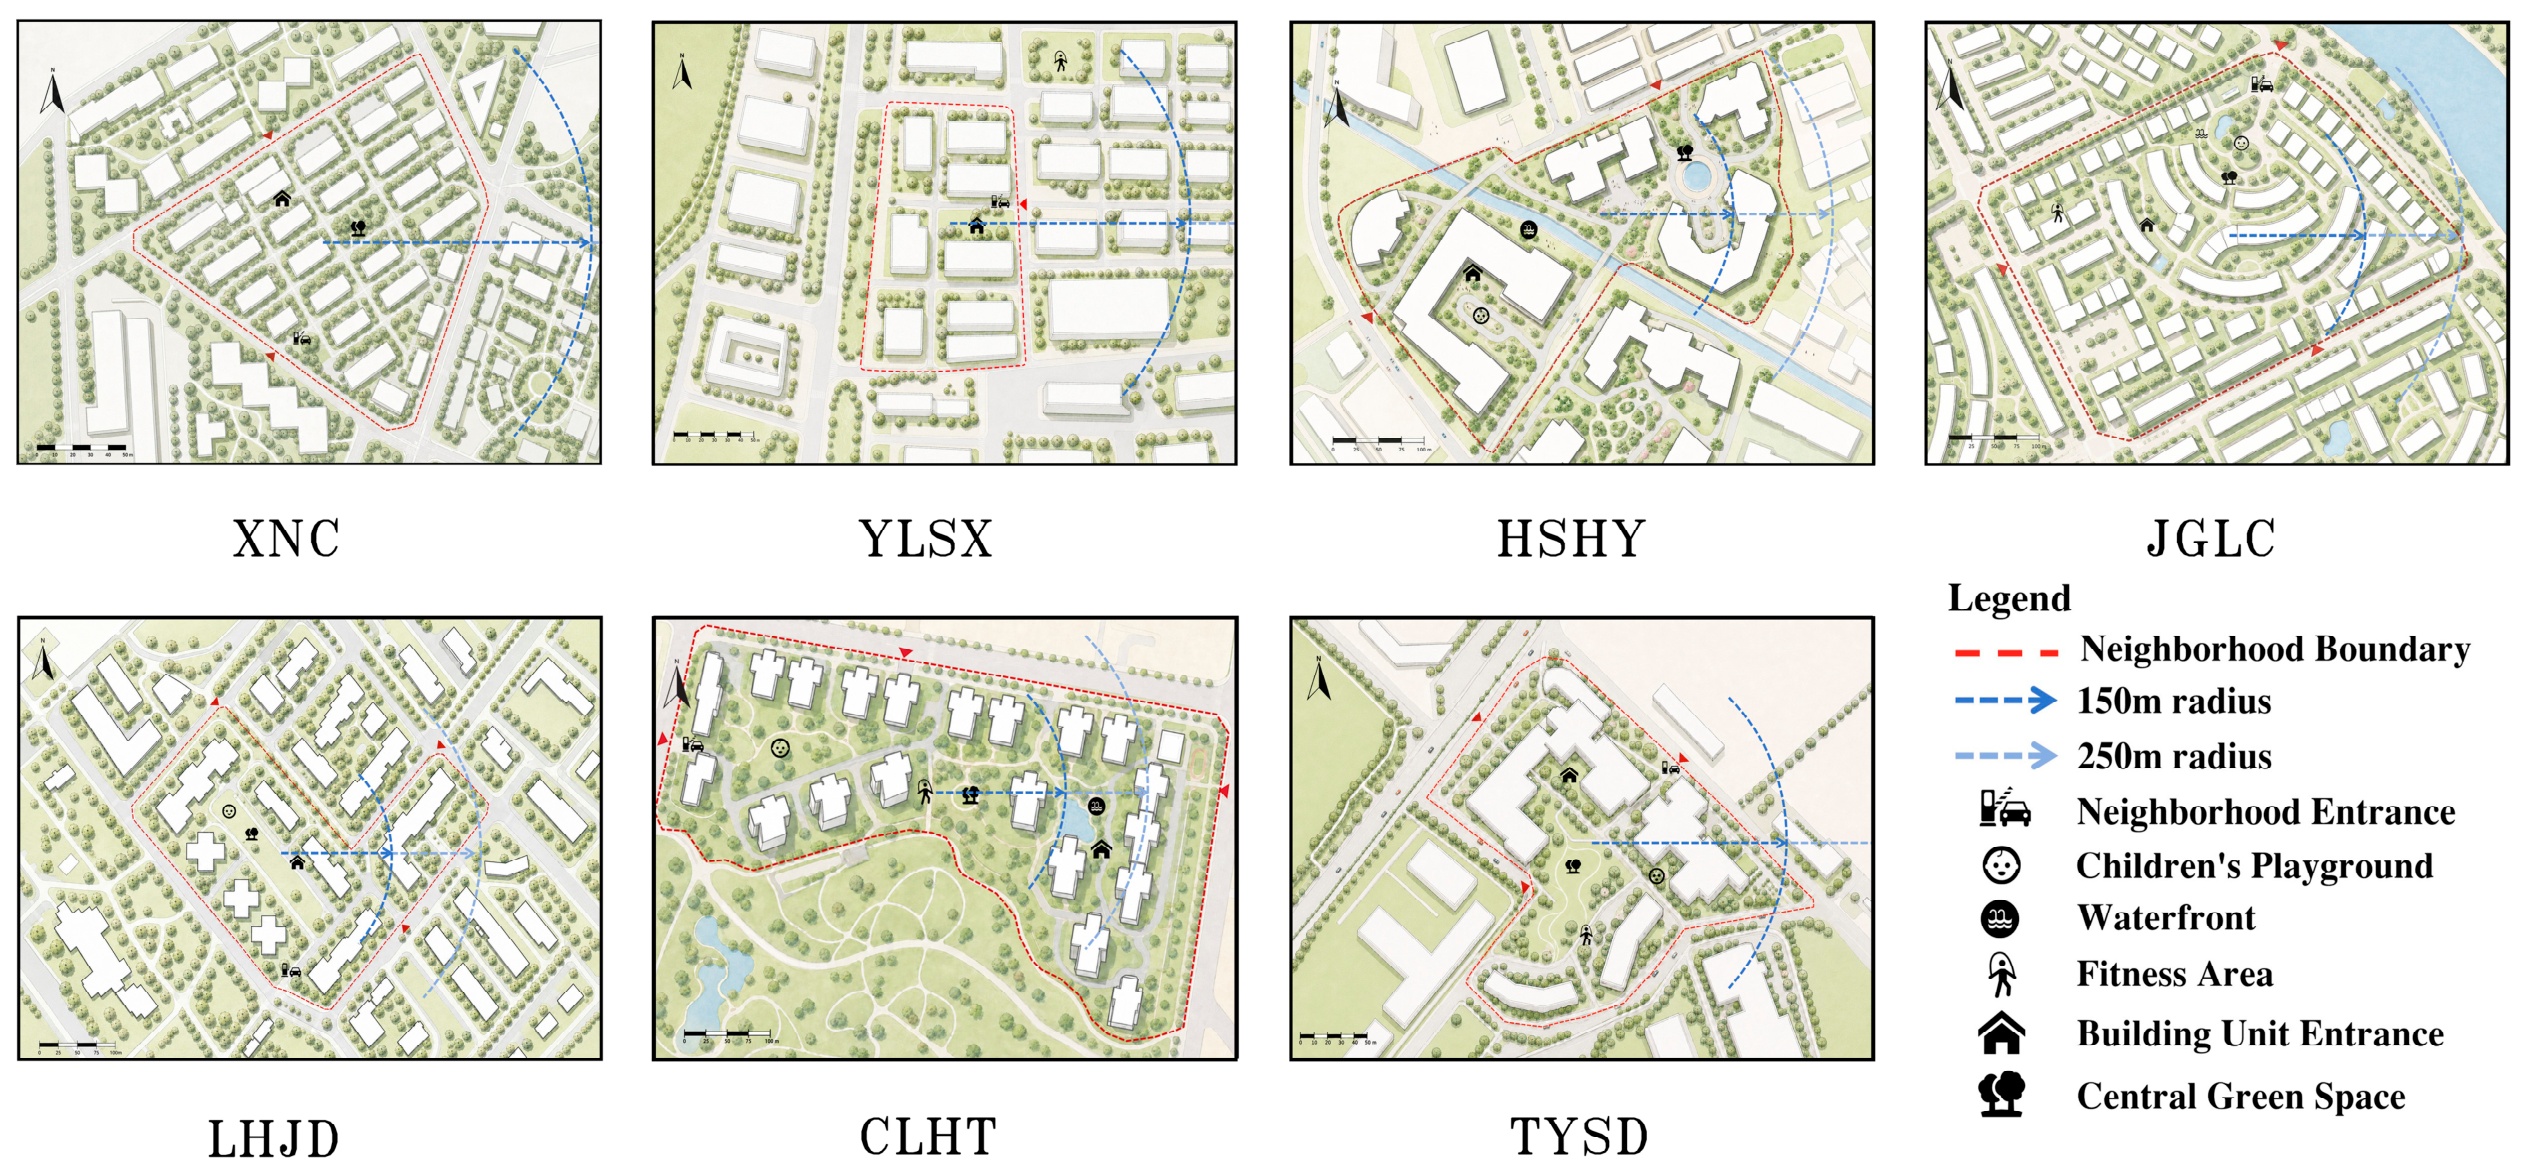
The spatial distribution and basic characteristics of the seven sample neighborhoods are shown in Figure 2 and Table 1. Overall, they exhibit notable differences in construction year, location, development intensity, green cover, population size, and total green space cover, providing an effective basis of spatial heterogeneity for exploring the association between green space exposure and childhood allergic diseases. The specific layout plan and key nodes of each neighborhood are presented in Figure 3.
Given the difficulty of tracking children who visited hospitals in 2018, this study adopted a cross-sectional design. NDVI was extracted from 2022, while greening rate data were extracted from real estate listing websites in 2025 and verified through public data from Chengdu property management departments and field investigations. Micro-scale green space characteristics (e.g., plant composition, closeness-to-nature characteristics of children’s playgrounds) and childhood allergic disease outcomes were collected through a concurrent survey in 2025. NDVI reflects green space exposure prior to the health survey, whereas greening rates and micro-scale characteristics, obtained through field investigation, accurately capture the immediate environment that children currently encounter in their daily activity spaces. Furthermore, field investigation confirmed that none of the seven sample neighborhoods underwent construction changes between 2022 and 2025, indicating stable characteristics of green space exposure.
In addition, given that the objective in this study was to investigate the effects of neighborhood green spaces on childhood allergic diseases, the age was restricted to under 7 years to eliminate potential confounding effects from school-related exposure to green space.

2.2. Assessment of Childhood Allergic Diseases

The questionnaire items were developed with reference to the International Study of Asthma and Allergy in Childhood (ISAAC) [30]. The questionnaires were completed by the guardians of children aged 0–6 years.
The survey was distributed in the 7 neighborhoods between April and May 2025. To ensure a balanced age distribution, 32 to 34 questionnaires were distributed in each area, with 16 to 17 sets allocated, respectively, to guardians of children in the 0–3 and 4–6 age groups. Specifically, allergy status was assessed by asking whether the child had been diagnosed by a physician. The questionnaire additionally included specific types of allergic diseases (allergic rhinitis, asthma, eczema, atopic dermatitis, food allergy, and others), family history of allergic diseases, and allergic reactions to certain environmental factors (pollen, dust mites, pet dander, mold, and others). As medical research indicates that allergic diseases exhibit significant comorbidity [31], the study included all types of allergic diseases.
To control for confounding factors, the survey also collected information with reference to the influencing factors in childhood allergic diseases [32]. These covariates included the child’s age and gender, maternal education, family monthly income, mode of delivery, feeding pattern, and hygiene practices maintained by guardians during childcare. The study was approved by the Medical Ethics Committee of Southwest Jiaotong University (Approval Number: SWJTU-2503-NSFC 005).

2.3. Assessment of Greening Rate and NDVI

We used greening rate and Normalized Difference Vegetation Index (NDVI) to objectively assess participants’ exposure to neighborhood surrounding greenness. We first used GIS software (ArcGIS Desktop 10.7, Environmental Systems Research Institute, Redlands, CA, USA) to geocode the address of each participant based on their administrative district, sub-district, and neighborhood. Regarding the assessment of greening rate, the greening rate of each neighborhood was obtained from public information on the Anjuke real estate website and verified through field investigation. Then, to maximize the characterization of participants’ exposure to greenness, we selected satellite images collected by Landsat 8 Operational Land Imager (Collection 2 Level-2 data, U.S. Geological Survey, Reston, VA, USA) (30 m × 30 m) for August 2022 (a period of high vegetation growth) as the primary data for NDVI. The median equivalent radius of the seven neighborhoods was 150 m. The circular buffer formed by this radius covered an area 78.5 times the area of a single pixel of the 30 m resolution satellite image, providing sufficient pixels within the circle. The 30 m resolution avoided individual pixels spanning multiple neighborhoods, ensured accurate spatial positioning, and had clear advantages in data availability. NDVI could reflect green space exposure prior to the health survey. Furthermore, field investigation confirmed that the green spaces of the seven sample neighborhoods underwent no construction changes between 2022 and 2025; therefore, this NDVI data could reflect the current characteristics of green spaces in the sample neighborhoods. Accordingly, based on the median radius of the 7 sampled neighborhoods, we created a 100 m buffer distance around the median radius (150 m) and abstracted mean NDVI values for a 250 m buffer.
The mean NDVI value of the buffer was calculated to represent the children’s green space exposure level within and outside neighborhoods at the corresponding scale. The NDVI is based on land surface reflectance of the visible red (VIS) and near-infrared (NIR) bands of the spectrum, using the following formula:
N I R V I S N I R + V I S
The basic principle is that healthy green vegetation typically absorbs radiation in the red band (630–690 nm) while reflecting it in the NIR band (760–900 nm), effectively determining vegetation density and distribution. The NDVI value ranges from −1 to 1, with higher positive values indicating stronger vegetation coverage and better growth [33].

2.4. Assessment of the Proportion of Allergenic Plants in Neighborhoods

This study conducted a field community survey in 2025. The typical plot method was adopted, with plot placement considering both community representativeness and spatial coverage. (1) A stepwise arrangement method was used to select sample sites and quadrats. First, based on the research team’s previous field experience on plant diversity in neighborhoods in Chengdu and with reference to existing studies [34,35], the total number of sample sites was determined according to the total land area of each neighborhood: 1–4 sample sites for land area ≤ 5 hm2, 5–8 sample sites for 5–10 hm2, and 9–12 sample sites for 10–15 hm2. Next, the number of quadrats within each sample site was determined based on the specific sample site area: 2 quadrats for area ≤ 200 m2, 3 quadrats for 200–400 m2, 4 quadrats for 400–800 m2, and 5 quadrats for >800 m2. Quadrat locations were selected within each type of sample site to ensure spatial coverage representativeness. (2) Plant species investigation and recording. The 1 m × 1 m quadrat position was framed using a quadrat pipe, photographed and geolocated using the “Two Steps Road” app (2bulu Outdoor Assistant v7.9.11, Shenzhen 2bulu Information Technology Co., Ltd., Shenzhen, China), and plant species were identified using the “Xingse” app (Xingse v3.36, Hangzhou Ruiqi Software Co., Ltd., Hangzhou, China). Measuring tape, range finder, and other tools were used to investigate and record plant species, number, cover, and other information within each quadrat. (3) Indicator calculation. Based on the basic data obtained from the above field investigation and existing research findings on allergenic plant types [36], allergenic woody and herbaceous plant species within the sample plots were identified, and their respective proportions were calculated using the following formulas.
PAW—Proportion of allergenic woody plants: measures the proportion of allergenic woody plants in the community relative to the total number of woody plants. The formula is as follows:
PAW = SAW/S
where S represents the total number of all woody plants in the surveyed quadrats; SAW represents the number of allergenic woody plants in the surveyed quadrats.
PAH—Proportion of allergenic herbaceous plants: measures the proportion of allergenic herbaceous plant cover relative to the total cover of herbaceous plants in the community. The formula is as follows:
PAH = SAH/S
where S represents the total cover of all herbaceous plants in the surveyed quadrats; SAH represents the cover of allergenic herbaceous plants in the surveyed quadrats.

2.5. Closeness-to-Nature Characteristic Assessment for Children’s Playgrounds in Neighborhoods

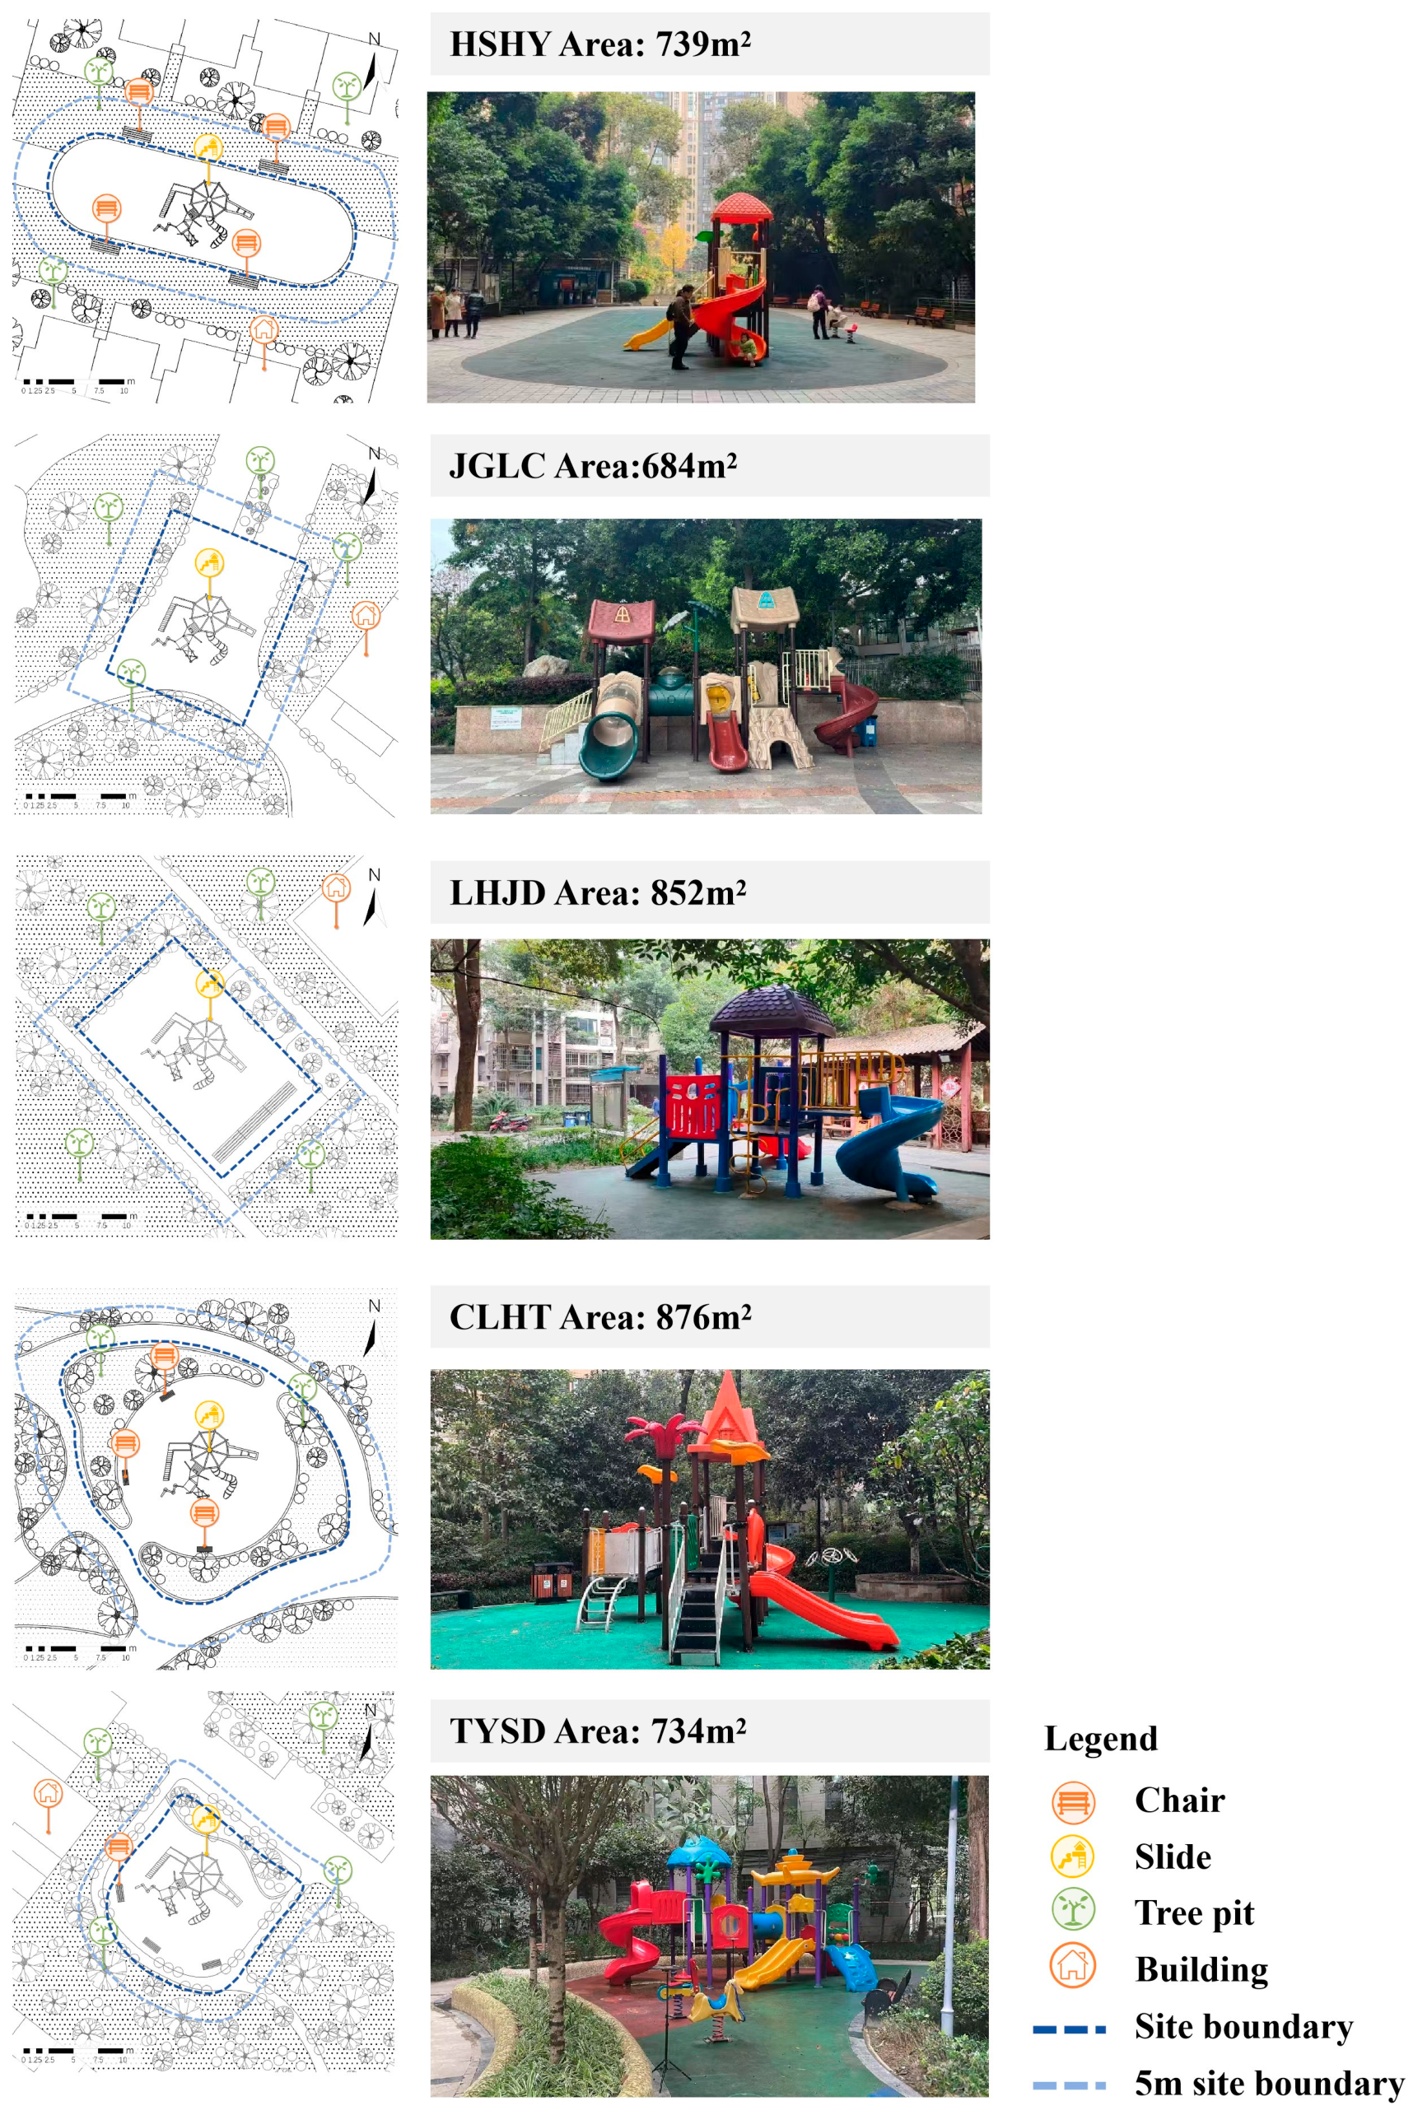
Children’s playgrounds are the most frequently used spaces for daily activities within neighborhoods, providing critical opportunities for children to interact with green spaces. To evaluate the natural characteristics of these playgrounds, we specifically focused on the characteristics of green spaces within and surrounding these playgrounds (Figure 4). Drawing on existing research regarding the natural characteristics of children’s playgrounds [37,38] and based on a field survey, we defined children’s playgrounds as spaces equipped with facilities for children’s recreation and rest, including slides, swings, sandpits, and other features within neighborhoods. Consequently, the following five variables were selected. The first two variables were acquired by the investigators via a survey and counting, and the latter three indicators via scoring.
(1)
Presence of children’s playgrounds: We used a binary variable (yes/no) to indicate whether at least one playground existed within the neighborhood.
(2)
Landscape type: The specific types included I. lawns; II. flower bed/borders; III. shrubs; IV. small trees (typically flowering species); V. trees–shrubs; VI. trees–lawn; VII. shrubs–lawn; VIII. trees–shrubs–lawn; IX. trees with hardened pavement; X. water.
(3)
Accessibility of natural elements: The scoring criteria for this variable considered two aspects: i. touchablility of natural elements; ii. the number of accessible areas. Accessible areas were classified into four categories: I. accessible lawns; II. undergrowth with hardened pavement; III. accessible woodlands with natural underlying surfaces (e.g., sand, soil, or turf); IV. others (dense forests and wilderness landscapes combining trees, shrubs, and grasses, referring to poorly maintained landscape types). The scoring criteria were as follows: touchable flowers and plants with 3–4 accessible areas were scored 4 points, those with touchable flowers and plants and 1–2 accessible areas were scored 3 points, those with touchable flowers and plants but no accessible areas were scored 2 points, and those with untouchable flowers and plants and no access were scored 1 point.
(4)
Integration of children’s playgrounds and facilities into the landscape: The scoring criteria were defined as follows: I (4 points), vegetation was integrated into it (e.g., tree pits or planting beds set into the site); II (3 points), there was no vegetation within it, but vegetation occurred along the site edge: III (2 points), there was no vegetation within or along the edge, but vegetation was located in the immediate surroundings (within 5 m); IV (1 point), there was no vegetation in any of the specified areas.
(5)
Use of natural materials in playgrounds and facilities: Materials such as wood, wood chips, soil, and sand were defined as natural materials, whereas plastic, rubber, asphalt, concrete, and paved surfaces were defined as non-natural materials. The scoring criteria were as follows: I (4 points), both the playground and its facilities were constructed using natural materials; II (3 points), the playground used natural material, but the facilities used non-natural materials; III (2 points), the playground used non-natural material, but the facilities used natural materials; IV (1 point), neither the playground nor the facilities used natural materials.

2.6. Statistical Analysis

2.6.1. Data Preprocessing and Descriptive Statistics

Prior to formal analysis, we conducted rigorous quality control and preprocessing. Missing value analysis indicated a data completeness rate of 92.1% among the 228 participants, resulting in 210 valid questionnaires. To improve the normality of the distribution, all continuous variables were standardized using Z-score transformation.
Descriptive statistical methods were applied to summarize the characteristics of the participants. Continuous variables are presented as mean ± standard deviation (SD), while categorical variables are expressed as frequencies (percentages).

2.6.2. Multicollinearity Diagnosis

To ensure the stability of the regression models, multicollinearity among the variables was checked using the variance inflation factor (VIF). Finally, the greening rate, NDVI, proportion of allergenic plants and closeness-to-nature characteristics of children’s playgrounds with low collinearity (VIF < 10) [39] were subsequently included in the models. All indicators passed the multicollinearity test, which was incorporated into the subsequent model analysis.

2.6.3. Logistic Regression Models

Given the hierarchical structure of the data, with individual children (Level 1) nested within neighborhoods (Level 2), we employed multilevel logistic regression models to assess the associations between exposure to neighborhood green space and childhood allergic diseases. We specified a random intercept for neighborhoods to account for clustering effects and unmeasured neighborhood-level confounders. The Intraclass Correlation Coefficient (ICC) was calculated to evaluate the clustering of childhood allergic diseases at the neighborhood level. Next, we constructed both crude and adjusted models to examine the relationships between greening rate, NDVI, proportion of allergenic plants, closeness-to-nature characteristics of children’s playgrounds, and childhood allergic diseases. In the crude models, only greening rate, NDVI, proportion of allergenic plants, and closeness-to-nature characteristics of children’s playgrounds were included as independent variables, with childhood allergic diseases being the dependent variable. The adjusted models further controlled for several covariates, including demographics (gender, age, family monthly income, and maternal education), family genetics (family history of allergic diseases), lifestyle (mode of delivery, feeding pattern, and hygiene habits), and neighborhood characteristics (construction year, average housing price, and location).
Subsequently, subgroup models of green space characteristics and childhood allergic diseases were constructed based on age, gender, neighborhood building morphology, average housing price, location, and construction year. Due to the small sample size of the subgroup analysis, ordinary logistic regression was used.
The results are presented as odds ratios (ORs) with corresponding 95% confidence intervals (CIs). An OR > 1 indicates that characteristics of a green space are associated with an increased risk of childhood allergic diseases, whereas an OR < 1 indicates a protective effect.

2.6.4. Sensitivity Analysis and Test for Interaction Effects

To verify the robustness of the findings, we performed sensitivity analyses and test for interaction effects. Parametric tests were performed on the multilevel model results to confirm the necessity of accounting for neighborhood-level clustering. All statistical analyses were performed using Stata 18.0. (StataCorp LLC, College Station, TX, USA). All crude and adjusted models passed the multilevel modeling parameter tests (ICC > 0.059, p for LRT < 0.05). Detailed model parameters are provided in the Supplementary Material (Table S1). For the subgroup models, interaction effect tests were performed, and the p-values for the interaction terms are shown in the following sections. This study primarily focuses on the model results that passed the multilevel modeling parameter tests, as well as the subgroup model results that were significant and passed the interaction effect tests.

3. Results

3.1. Descriptive Statistical Analysis

Table 2 presents the statistical results for childhood allergic diseases, green spaces, individual characteristics, and neighborhood characteristics.
Presence of Allergic Diseases: Among the 210 surveyed children, 52 were reported to suffer from allergic diseases, corresponding to a prevalence of 24.762%. The remaining 158 children (75.238%) had no reported allergic diseases.
Exposure to Green Spaces: Regarding overall exposure to green spaces, the average greening rate of the neighborhoods was 29.429% ± 9.154 and the mean NDVI was 0.508 ± 0.060. Regarding the proportion of allergenic plants, the average proportion of allergenic woody plants was 0.335 ± 0.142, and the average proportion of allergenic herbaceous plants was 0.038 ± 0.055. In terms of the closeness-to-nature characteristics of children’s playgrounds, 71.4% of the neighborhoods were equipped with dedicated spaces. The mean number of landscape types was 4.990 ± 3.969. The score for accessibility of natural elements was 1.424 ± 1.176, the integration of playgrounds and facilities into the landscape was 1.857 ± 1.460, and the score for natural material usage was 1.143 ± 1.248.
Individual and Neighborhood Characteristics: The gender distribution of the participants was relatively balanced, with boys accounting for 47.143% and girls for 52.857%, and the mean age was 3.340 ± 1.903 years. A total of 10.476% of children had a family history of allergic diseases. Regarding birth and feeding patterns, 60.952% of children were delivered vaginally, and 40.476% were breastfed. In terms of hygiene habits, 47.619% of households reported having a “High level of cleanliness.”
As for socioeconomic status, maternal education was generally high, with 84.761% holding a bachelor’s degree or above (66.190% bachelor’s/associate degree and 18.571% master’s degree or higher). Family monthly income was predominantly concentrated in the range of 10,000–20,000 CNY (54.296%). Concerning neighborhood characteristics, 42.857% of the neighborhoods were constructed between 2001 and 2010, 42.857% were high-rise neighborhoods, and 57.143% had average housing prices exceeding 19,000 CNY per square meter. Geographically, 70.952% of the neighborhoods were located within the Third Ring Road of the central city, while 29.048% were situated outside the Third Ring Road.

3.2. Association Between Greening Rate, NDVI and Childhood Allergic Diseases

Table 3 presents the results of the crude, adjusted, and subgroup models regarding the impact of residential greening rate and NDVI on childhood allergic diseases. The crude model includes only residential greening rate and NDVI. The adjusted model controls for covariates including demographics, family genetics, lifestyle, and neighborhood characteristics. The subgroup models further explore heterogeneity in the association between greening rate, NDVI and childhood allergic diseases across different individual and neighborhood groups.
The validated logistic regression analyses indicate that residential greening rate and NDVI were not significantly associated with childhood allergic diseases in either the crude or adjusted models. However, for children aged 0–3 years, the greening rate of neighborhoods was significantly positively correlated with the allergy risk. For neighborhoods with average housing prices below 19,000 CNY per square meter, NDVI is significantly negatively associated with childhood allergy risk. For neighborhoods with average housing prices above 19,000 CNY per square meter, NDVI is significantly positively associated with childhood allergy risk.

3.3. Association Between the Proportion of Allergenic Plants and Childhood Allergic Diseases

Table 4 presents the crude models, adjusted models, and subgroup models for the effects of the proportion of allergenic woody plants and the proportion of allergenic herbaceous plants on childhood allergic diseases. The validated logistic regression analysis showed that neither the proportion of allergenic woody plants nor the proportion of allergenic herbaceous plants was significantly associated with childhood allergic diseases in either the adjusted or unadjusted models. For children aged 0–3 years, the proportion of allergenic woody plants was significantly negatively correlated with the risk of allergic diseases. For neighborhoods with an average housing price above 19,000 CNY/m2, the proportion of allergenic herbaceous plants was significantly negatively correlated with the childhood allergy risk.

3.4. Association Between Closeness-to-Nature Characteristics of Children’s Playgrounds and Childhood Allergic Diseases

Table 5 presents the crude, adjusted, and subgroup models for the impact of closeness-to-nature characteristics of children’s playgrounds on childhood allergic diseases. The validated logistic regression analyses indicated that the closeness-to-nature characteristics of children’s playgrounds showed no significant association with childhood allergic diseases in either the unadjusted or adjusted model.
In the subgroup analysis results, for children residing in neighborhoods with an average housing price below 19,000 CNY/m2, the presence of dedicated children’s playgrounds, higher scores for accessibility of natural elements, and higher integration of sites and facilities into the landscape showed an associated trend with lower childhood allergy risk, but none passed the interaction effect test. For children in high-rise neighborhoods, the integration of sites and facilities into the landscape was positively associated with allergy risk, and passed the interaction effect test.

4. Discussion

4.1. Heterogeneity in Associations and Potential Mechanism Analysis

The subgroup analysis results reveal marked heterogeneity in the associations between green spaces and childhood allergic diseases across age groups, neighborhood building morphology and average housing price strata. Specifically, greening rate was positively associated with allergy risk among children aged 0–3, whereas the proportion of allergenic woody plants was negatively associated with allergy risk in this age group. However, neither indicator was significantly associated with allergic diseases among children aged 4–6. At the neighborhood level, NDVI showed a protective association in low-to-medium-housing-price neighborhoods but a risk association in high-housing-price neighborhoods. The proportion of allergenic herbaceous plants showed a protective association only in high-housing-price neighborhoods. In addition, the closeness-to-nature characteristics of children’s playgrounds mainly showed a protective trend in low-to-medium-housing-price neighborhoods; however, in high-rise neighborhoods, the integration of sites and facilities into the landscape showed a risk association.
(1)
Individual level: analysis of age heterogeneity
Age-related heterogeneity may be related to differences in immune development and activity range across childhood stages. Children aged 0–3 are in a critical window of immune development, and their daily activity range is generally more confined to residential neighborhoods. They may therefore be more sensitive to allergen exposure within residential environments. Greening rate reflects overall vegetation coverage within neighborhood boundaries, but it does not distinguish vegetation type or canopy height. A higher greening rate is usually accompanied by greater overall coverage of trees, shrubs, and herbaceous plants. Such environments may provide favorable substrates on soil and leaf surfaces for allergenic fungi, including molds such as Alternaria and Cladosporium [40]. Because fungal spores may be released or resuspended close to the near-ground breathing zone of young children, actual inhalation exposure may be relatively high, thereby increasing the risk of allergic diseases.
For the proportion of allergenic woody plants, this study observed a seemingly contradictory negative association. One possible explanation is that pollen released by woody plants is mainly distributed around the canopy layer, which differs vertically from the breathing zone of children aged 0–3. Pollen needs to be transported and deposited before reaching the near-ground level [41], so the actual inhaled dose may be limited and may not reach the threshold required to trigger sensitization. In addition, a higher proportion of woody vegetation is often associated with richer soil and leaf-surface microbiomes. Early childhood is also a critical period for immune training. Exposure to diverse environmental microbiomes may promote immune regulation and the establishment of immune tolerance, thereby offsetting part of the allergic risk associated with single pollen sources [14,42]. Therefore, this indicator may not indicate a direct protective effect of allergenic species themselves. Rather, it may reflect the broader microbiome-related regulation provided by woody-plant-dominated ecosystems.
In contrast, children aged 4–6 have a more mature immune system and more diverse exposure sources after entering kindergarten. As a result, the relative contribution of residential greening to allergic diseases may weaken, and the above associations are no longer significant in this age group.
(2)
Neighborhood level: analysis of heterogeneity across average housing price strata and building morphology
(1) As a comprehensive proxy for neighborhood socioeconomic status and built environment quality, average housing price may reflect combined differences in species composition, maintenance and management patterns of green spaces, children’s activity duration and other factors. A comparison of the sample neighborhoods shows that, because NDVI was calculated within a 250-m open buffer around neighborhood centroids, the NDVI values of low-to-medium-housing-price neighborhoods and high-housing-price neighborhoods were very similar. In terms of species composition, the proportion of allergenic woody plants was relatively low in low-to-medium-housing-price neighborhoods. The proportion of allergenic herbaceous plants was extremely low in both groups, although it was even lower in the high-housing-price group. In terms of maintenance and management, green space maintenance in low-to-medium-housing-price neighborhoods was generally extensive, whereas that in high-housing-price neighborhoods was more intensive (Table 6).
Based on these differences, the protective association of NDVI defined by the open buffer in low-to-medium-housing-price neighborhoods, together with the protective trend of the closeness-to-nature characteristics of children’s playgrounds in these neighborhoods, may be explained by several mechanisms. First, this association may reflect children’s accessible exposure to ecological spaces, such as parks and water bodies, within and around residential neighborhoods, as well as close-to-nature microbiome exposure. Second, green spaces in low-to-medium-housing-price neighborhoods are more likely to retain native plants and are often maintained at a lower intensity. This may help preserve natural elements such as weeds, soil, and insects, thereby providing more opportunities for microbiome exposure and immune tolerance. In addition, children in these neighborhoods may experience less displacement of outdoor time by preschool academic activities, allowing more free outdoor activity and more sufficient exposure to natural environmental microbiomes.
In contrast, in high-housing-price neighborhoods, higher NDVI was positively associated with childhood allergic diseases. However, allergenic woody plants did not show a risk association, and the proportion of allergenic herbaceous plants, despite being extremely low, showed a protective association. This result suggests that the allergenic risk associated with higher NDVI may not be fully explained by exposure to allergenic plant pollen. Instead, it may be related to the intensive maintenance of landscaped green spaces, such as frequent weeding and irrigation, as well as moisture accumulation caused by dense vegetation [43]. These conditions may facilitate the enrichment of fungal spores and thereby increase the risk of childhood allergic diseases.
It is worth noting that, in the context of the sample neighborhoods, neither allergenic woody plants nor allergenic herbaceous plants in high-housing-price neighborhoods showed a risk association. This finding suggests that, under current urban greening management practices, pollen exposure from allergenic species may be controlled at relatively low levels. There may also be a dose–response pattern in which low-dose exposure contributes to immune tolerance. Meanwhile, the presence of these species may indicate higher ecological landscape management investment and higher biodiversity. Their apparent protective association with childhood allergic diseases is therefore more likely to be related to the biodiversity hypothesis, which emphasizes the role of diverse environmental microbiomes in shaping the human microbiome and immune regulation, rather than to pollen release by the species themselves.
In summary, housing price stratification may reflect comprehensive differences in species composition, green space management intensity, and children’s activity duration. Research on the health effects of urban green spaces should therefore consider these complex contextual factors. Similar vegetation volume or plant species may produce opposite immune-related associations under different socioeconomic and built environment contexts. Moreover, cumulative exposure to perennial non-pollen allergens, such as fungi and dust mites, may be more relevant to allergic diseases than seasonal pollen exposure. Further verification is needed through monitoring of microbiomes in green space microenvironments and more detailed identification of childhood allergic disease types.
(2) In high-rise neighborhoods, the positive correlation between the integration of sites and facilities into the landscape and allergic risk suggests that the combination of high-rise buildings and landscapes may lead to increased shading, which may cause excessive shading, poor ventilation, and persistent surface moisture in children’s playgrounds, thereby increasing allergy risk.

4.2. Comparison of Research Findings and Explanation of Differences

By comparing the findings of this study with existing empirical research on residential greening rate, NDVI and childhood allergic diseases, both consistencies and discrepancies were identified. In this study, we observed no significant association between residential greening rate, NDVI and childhood allergy risks in the full sample. This is consistent with the findings of Chen E et al. in Chicago, the United States [17], Dadvand P et al. in Sabadell, Spain [23], and Müller-Rompa SEK et al. in Bavaria, Germany [44], regarding the association between residential NDVI and childhood allergic diseases.
In the subgroup analyses, this study found a significant positive correlation between residential greening rate and allergy risk in children aged 0–3 years, which is consistent with the findings of Gernes R et al. in Ohio, the United States, on greening rate and allergic disease risk among newborns [45]. Given that existing studies have rarely analyzed the relationship between neighborhood green spaces and childhood allergic diseases through subgrouping based on housing prices and building morphology, nor have they examined the association between the closeness-to-nature characteristics of children’s playgrounds in neighborhoods and childhood allergic diseases, the applicability of our conclusions also requires confirmation through further comparisons with more empirical evidence.
The discrepancies between the findings based on the full sample of children and the subgroup analyses stratified by individual child characteristics and neighborhood attributes indicate that the inconsistent conclusions across studies on the relationship between green spaces and childhood allergic diseases may largely be attributed to differences in individual and neighborhood characteristics. Firstly, individual characteristics vary. The effects of green spaces on allergic diseases are influenced by a variety of individual traits. In addition to the control variables included in this study—children’s gender, age, family history of allergic diseases, mode of delivery, feeding pattern, daily hygiene habits, maternal education, and family monthly income—differences in family structure (i.e., whether the child was an only child) [29], lifestyle habits (e.g., pet ownership) [46], and frequency of green space exposure (e.g., frequent or occasional visits) [47] could also confound the research findings. Secondly, socioeconomic conditions, physical environments, and geographical regions differ. As well as the factors of neighborhood housing prices, location, and construction year examined in this study, various related factors could have resulted in divergent research conclusions, including regional socioeconomic development levels [48], physical environmental characteristics [46], urbanization degrees [49], and microbial community composition [50], seasonal variations [51], and other environment-related factors. Thirdly, the selection of control variables varies across studies. Differences in the control variables adopted across relevant studies, coupled with the confounding effects of the aforementioned individual traits, socioeconomic status, natural environments and geographical factors, may bias the research findings. Lastly, disparities in research design also play a vital role. Results from different study designs, including cohort, cross-sectional, and case–control studies, may vary due to inconsistencies between the cumulative process of green space exposure and the temporal sequence of allergy onset.

4.3. Strengths and Limitations

The strengths of this study are as follows. Firstly, using Chengdu, China, as a case study, this research integrates micro-scale indicators of the proportion of allergenic plants and the closeness-to-nature characteristics of children’s playgrounds based on field surveys—supplementing the widely used greening rate and NDVI metric. It thereby advances our empirical understanding of the relationship between neighborhood green spaces and childhood allergic diseases in urban contexts in developing countries while addressing the limitations of existing studies concerning plant composition and the green space characteristics of children’s playgrounds. Secondly, this study establishes direct linkages between residential greening rate, NDVI, the proportion of allergenic plants, the closeness-to-nature characteristics of children’s playgrounds, and childhood allergic diseases. It identifies a risk effect of greening rate on children aged 0–3, the differential impact of NDVI varying by housing price, and the protective effect trend of the proportion of allergenic plants and the closeness-to-nature characteristics of children’s playgrounds under specific contexts. These findings have certain guiding significance for increasing the synergy between the quantity and quality of residential green space, improving neighborhood ecological quality, and reducing childhood allergy risk. Finally, the results reveal that the associations between residential greening rate, NDVI, the proportion of allergenic plants, the closeness-to-nature characteristics of children’s playgrounds, and childhood allergic diseases are significant within specific subgroups defined by individual and environmental attributes and exhibit obvious differences across these groups.
The limitations of this study are as follows. Firstly, this is a cross-sectional study rather than a cohort one; thus, it does not allow for causal inference. Secondly, the sample size is relatively small, and data were collected from only seven neighborhoods in Chengdu, which imposes geographical constraints. Thirdly, childhood allergic diseases were determined through questionnaire surveys, introducing potential bias associated with subjective measurement. Fourthly, the differences in neighborhood comprehensive characteristics represented by the average housing price have not been precisely compared at this research stage. In addition to the maintenance quality of green spaces and children’s activity duration, the average housing price may also serve as a proxy for other factors (such as the scale and quality of green spaces surrounding the neighborhoods), and thus, the analysis of corresponding potential mechanisms may be incomplete. Fifthly, the study did not include spatial morphology factors such as building shading immediately adjacent to children’s playgrounds, which may affect the microclimate environment, or human activity factors such as green space use intensity, which may affect the microenvironment of soil dust and pathogen exposure levels, as control variables in the analysis. Lastly, mediating variables such as environmental microbiome, human microbiome, and children’s behavioral activities were not brought into the analysis. Empirical studies to support mechanistic explanations still need to be carried out.

4.4. Implications and Recommendations

Drawing upon the divergent roles of residential green space characteristics in allergic diseases across different contexts, this section presents corresponding planning implications and recommendations for future research. It should be pointed out that this study establishes a direct association between green spaces and children’s allergic diseases based on cross-sectional data, which is insufficient to reveal the causal relationship, as well as the specific causal mechanisms regarding to variables such as children’s age, building morphology, and the average housing price. Therefore, the corresponding planning implications should be understood as directional strategic recommendations based on existing evidence, more robust planning and design strategies remain to be further validated and refined in future research.

4.4.1. Planning Implications

(1)
We recommend vegetation cover regulation and plant species configuration optimization
The planning and design of green spaces should focus on increasing the synergy between quantity and quality. The findings that greening rate was a risk factor for allergic diseases among children aged 0–3, while NDVI was protective in low-to-medium-housing-price neighborhoods but risky in high-housing-price neighborhoods, suggest that vegetation coverage may have a baseline protective supply scale for reducing allergic disease risk, but more greening is not necessarily better. High-density greening should not be blindly increased in core activity areas for young children. Controlling overall vegetation volume may help reduce surface moisture accumulation and block the conditions that favor potential perennial non-pollen allergens, such as allergenic fungi.
In terms of plant species configuration, the spatial pattern of woody plants should be optimized to support microbiome-related regulation. The planting proportion of native woody tree species may be appropriately increased so that environmental microbiome exposure in woody ecosystems can help induce immune tolerance in early childhood. At the same time, the proportion of allergenic herbaceous plants should be controlled within a safe low threshold. Low-dose exposure may function as a natural immune stimulus that supports immune tolerance, whereas exposure above the sensitization threshold should be avoided.
(2)
We recommend focusing on the micro-environmental management of residential green spaces
The differences in the relationship between NDVI and children’s allergic diseases across subgroups with different average housing prices, along with the differences in the maintenance quality of green spaces between the two types of neighborhoods observed during field surveys, suggest the need to focus on the micro-environmental management of residential green spaces. Firstly, it is recommended to prioritize maintaining natural succession and low-intensity maintenance, and to avoid damaging the existing native ecological baseline through excessive artificial landscaping. Secondly, green space layout and canopy closure should be optimized based on monitoring of microenvironmental indicators such as sunlight, ventilation, and humidity, as well as analyses of sunlight, thermal-moisture, and wind environments. Vegetation density should be limited in shaded, narrow, and other highly susceptible areas to maintain good sunlight and ventilation and to avoid the enrichment of allergenic fungi such as molds. In addition, reasonable mowing and irrigation frequencies should be adopted. Allergenic vegetation should be pruned appropriately to maintain allergen release at a safe low-dose level and to reduce moisture accumulation and hidden exposure to perennial bioaerosols caused by improper maintenance.
(3)
We recommend enhancing the closeness-to-nature characteristics of children’s playgrounds within neighborhoods. In low-to-medium-housing-price neighborhoods, the closeness-to-nature characteristics of children’s playgrounds demonstrated a protective trend in mitigating allergy risk, underscoring the health resource value of green spaces for children of this socioeconomic status
It is recommended that dedicated children’s playgrounds be established within neighborhoods. Diverse landscape elements—incorporating arboreal, shrub, grassland, flower border, and water body elements—should be employed to enrich landscape types within and surrounding children’s playgrounds. Playground boundaries should be softened to allow lawns, understory vegetation, and flowering plants to be accessible as tangible natural elements rather than serving purely ornamental functions, thereby enhancing access to natural elements. The overall playground layout and children’s favored facilities such as slides and swings should be integrated into the landscape to increase the synergy between sites and facilities and landscaping. Particular attention should be given to selecting natural materials and routine maintenance: natural, environmentally friendly, and healthy materials should be prioritized where possible, with reasonable maintenance modalities and frequencies adopted to ensure ventilation and dryness in the material surroundings.
Furthermore, in high-rise neighborhoods, the integration of sites and facilities into the landscape showed a trend of increasing allergy risk, suggesting the need to pay attention to the shading conditions of children’s playgrounds. During site selection, layout, or renewal optimization, the layout and canopy closure of green spaces can be optimized based on the monitoring of micro-environmental indicators (such as sunlight, ventilation, and humidity) in the green spaces of children’s playgrounds, combined with analyses of sunlight, thermal–humidity, and wind environments. Vegetation density should be restricted in highly susceptible areas, such as shaded and narrow spaces, to maintain good sunlight and ventilation conditions and avoid the accumulation of allergenic fungi such as mold.

4.4.2. Recommendations for Future Research

For future research, firstly, given that the association between residential NDVI and childhood allergic diseases varies based on neighborhood housing price, further studies should expand the sample size and integrate case–control and cohort study designs to further explore the impacts of neighborhood comprehensive characteristics proxied by the average housing price (such as the maintenance and management of green spaces, children’s activity duration, and the scale and quality of green spaces surrounding the neighborhoods). This will help uncover the underlying mechanisms of divergent health outcomes, and subsequently propose refined strategies to verify the applicability of the conclusions of this study. Concurrently, the establishment of nonlinear relationships between residential NDVI and childhood allergic diseases should be considered to explore the differential effects of the vegetation coverage characteristics of green spaces under different socioeconomic and built environment contexts, and to determine whether threshold effects exist for green space scale. Secondly, more refined and comprehensive indicators of green space characteristics can be incorporated, such as green space type, structure, and plant diversity. In addition, mediating variables including environmental and human microbiota should be included in future research to further elucidate the full characteristics and impact pathways through which green spaces affect childhood allergic disease occurrence. Thirdly, regarding closeness-to-nature characteristics of children’s playgrounds, future research could further consider external environmental characteristics immediately adjacent to children’s playgrounds (such as surrounding building height and density and vegetation canopy closure) and human activity factors (such as the intensity of green space use). Finally, future studies could actively collaborate with public health departments to use professional disease monitoring data to systematically identify the specific disease types of children with allergic diseases and the spatial distribution patterns of green spaces. This would help overcome the limitations of questionnaire-reported data in accuracy and the limitations of clinical records in participant follow-up and temporal correspondence.

5. Conclusions

This study addresses the gap regarding the associations between residential green spaces and childhood allergic diseases in developing-country neighborhoods. Furthermore, it identifies differential associations between residential greening rate, NDVI, proportion of allergenic herbaceous plants, the closeness-to-nature characteristics of children’s playgrounds, and childhood allergic diseases across various individual and neighborhood characteristics. Overall, the association between the characteristics of green spaces and childhood allergic diseases varies depending on child age, and neighborhood building morphology and housing prices. Targeted green space planning and design interventions should be context-specific, synergistically optimizing vegetation coverage and plant composition, while enhancing the closeness-to-nature characteristics of children’s playgrounds within neighborhoods. These research findings may provide guidance for the development of healthy and child-friendly urban neighborhoods in Chinese urban planning.
Compared with existing studies on the association between green space NDVI and childhood allergic diseases, the results of this study demonstrate both consistencies and certain discrepancies. These discrepancies may be attributed to differences in geographical regions, individual characteristics, and the selection of control variables. Additionally, variations in study designs and green space exposure assessment methods may also play a contributing role.
Future research should delve deeper into the associations and causal relationships between more comprehensive green space exposure metrics and childhood allergic diseases. It is also necessary to investigate the underlying mechanisms mediated by factors such as microbiomes and human behaviors to facilitate the development of more targeted behavioral and environmental interventions.

Supplementary Materials

The following supporting information can be downloaded at https://www.mdpi.com/article/10.3390/land15071186/s1, Table S1: logistic regression test parameters.

Author Contributions

Conceptualization, S.L., L.B. and M.L.; methodology, S.L., J.H., L.B. and M.L.; software, validation, formal analysis, writing—original draft, S.L., J.H. and S.Y.; identification of high-risk populations and literature support, medical data provision, allergy diagnostic criteria and medical theoretical interpretation, M.L.; investigation, data curation and visualization, S.L. and J.H.; resources and funding acquisition, S.L. and L.B.; writing—review and editing, S.L., S.Y. and L.B. All authors have read and agreed to the published version of the manuscript.

Funding

This work was supported by National Natural Science Foundation of China (NSFC) Young Scientists Fund—“Influence Mechanism of Urban Green Space on Childhood Allergic Diseases from the Perspective of Microbial Diversity and Planning Intervention Pathway: A Case Study of Chengdu City” (Category C, Grant No. 52508085); National Natural Science Foundation of China (NSFC) General Program (Grant No. 5227081768); Sichuan Science and Technology Program (2026NSFSC1298); Fundamental Research Funds for the Central Universities (Grant No. 2682025CX177); Peking University-Lincoln Center Research Grant (2025–2026) (Grant No. FS03-20251001–LSY).

Data Availability Statement

Data will be available on request.

Acknowledgments

We sincerely acknowledge the generous support provided by Li Wei and Zhou Yanhong from West China Hospital, Sichuan University for this research. We also express our gratitude to Wang Siyu, Tu Xinyi, Cao Aozhuo, Li Guangcui, Wu Yue, Lan Yiman, and other students from the Eco-City Construction Research Team of Southwest Jiaotong University for their dedicated efforts in field surveys and data collation. Additionally, we would like to extend our heartfelt thanks to all child guardians who participated in the questionnaire survey from seven residential communities for their valuable support to this study.

Conflicts of Interest

The authors declare no conflicts of interest.

References

  1. Haahtela, T.; von Hertzen, L.; Makelä, M.; Hannuksela, M. Finnish allergy programme 2008–2018—Time to act and change the course. Allergy 2008, 63, 634–645. [Google Scholar] [CrossRef] [PubMed]
  2. Ruan, G.; Sun, Y.; Yu, Z.; Bai, X.; Yang, H.; Qian, J. Global, regional, and national burden of inflammatory bowel disease from 1990 to 2021: Findings from the Global Burden of Disease 2021. Gastroenterol. Rep. 2025, 13, goaf082. [Google Scholar] [CrossRef]
  3. Wang, R.K.; Liang, J.Q.; Han, W.; Wang, W.P.; Lu, Y.X.; Gu, Q.L. Prevalence of allergic rhinitis in Chinese children from 2001 to 2021: Meta analysis. Chin. J. Prev. Med. 2022, 56, 784–793. [Google Scholar]
  4. Guo, Y.; Li, P.; Tang, J.; Han, X.; Zou, X.; Xu, G.; Xu, Z.; Wei, F.; Liu, Q.; Wang, M.; et al. Prevalence of Atopic Dermatitis in Chinese Children aged 1–7 ys. Sci. Rep. 2016, 6, 29751. [Google Scholar] [CrossRef] [PubMed]
  5. Chuang, C.C.; Braham-Chaouche, L.; Thomas, R.; Mnif, T. Epidemiology and Burden of Pediatric Atopic Dermatitis in China. Dermatol. Ther. 2025, 15, 1319–1329. [Google Scholar] [CrossRef]
  6. Ng, C.S.Y.; Chan, C.H.Y.; Fung, Y.L.; Chau, P.S.Y.; Luk, D.C.K.; Cheng, J.W.C.H.; Tsang, Y.P.; Lam, Y.Y.; Chu, A.K.Y. Impact of comorbid allergic diseases on health-related quality of life of Hong Kong schoolchildren. Pediatr. Allergy Immunol. 2023, 34, e13953. [Google Scholar] [PubMed]
  7. GBD 2021 Asthma and Allergic Diseases Collaborators. Global, regional, and national burden of asthma and atopic dermatitis, 1990-2021, and projections to 2050: A systematic analysis of the Global Burden of Disease Study 2021. Lancet Respir. Med. 2025, 13, 425–446. [Google Scholar] [PubMed]
  8. Strachan, D.P. Hay fever, hygiene, and household size. BMJ 1989, 299, 1259. [Google Scholar] [CrossRef] [PubMed]
  9. Rook, G.A.W.; Martinelli, R.; Brunet, L.R. Innate Immune Responses to Mycobacteria and the Downregulation of Atopic Responses. Curr. Opin. Allergy Clin. Immunol. 2003, 3, 337–342. [Google Scholar] [CrossRef] [PubMed]
  10. von Hertzen, L.; Haahtela, T. Natural Immunity: Biodiversity Loss and Inflammatory Diseases Are Two Global Megatrends that Might Be Related. EMBO Rep. 2011, 12, 1089–1093. [Google Scholar] [PubMed]
  11. Elton, C.S. The Ecology of Invasions by Animals and Plants; Springer: Boston, MA, USA, 1958. [Google Scholar]
  12. Gong, H.L.; Zhai, J. Study on the History of Pollinosis and Landscape Strategies from the Perspective of Biodiversity. Chin. Landsc. Archit. 2022, 38, 111–116. [Google Scholar]
  13. Zhong, L.; Zuo, Z.T.; Zhao, Z.C.; Chen, S.Q. Biodiversity Impacts Human Health: Mechanism, Hypothesis, and Key Issues. Chin. Landsc. Archit. 2023, 39, 6–13. [Google Scholar]
  14. Hanski, I.; von Hertzen, L.; Fyhrquist, N.; Koskinen, K.; Torppa, K.; Laatikainen, T.; Karisola, P.; Auvinen, P.; Paulin, L.; Mäkelä, M.J.; et al. Environmental Biodiversity, Human Microbiota, and Allergy Are Interrelated. Proc. Natl. Acad. Sci. USA 2012, 109, 8334–8339. [Google Scholar] [CrossRef] [PubMed]
  15. Li, S.Y.; Hui, J.T.; Li, G.C.; Bi, L.L. A review on the impacts of green space and its biodiversity on allergic diseases. Landsc. Archit. 2026, 33, 29–38. [Google Scholar]
  16. Paciência, I.; Moreira, A.; Moreira, C.; Rufo, J.C.; Sokhatska, O.; Rama, T.; Hoffimann, E.; Santos, A.C.; Barros, H.; Ribeiro, A.I. Neighbourhood green and blue spaces and allergic sensitization in children: A longitudinal study based on repeated measures from the Generation XXI cohort. Sci. Total Environ. 2021, 772, 145394. [Google Scholar] [CrossRef] [PubMed]
  17. Chen, E.; Miller, G.E.; Shalowitz, M.U.; Story, R.E.; Levine, C.S.; Hayen, R.; Sbihi, H.; Brauer, M. Difficult Family Relationships, Residential Greenspace, and Childhood Asthma. Pediatrics 2017, 139, e20163056. [Google Scholar] [CrossRef] [PubMed]
  18. Fuertes, E.; Markevych, I.; Bowatte, G.; Gruzieva, O.; Gehring, U.; Becker, A.; Berdel, D.; von Berg, A.; Bergström, A.; Brauer, M.; et al. Residential greenness is differentially associated with childhood allergic rhinitis and aeroallergen sensitization in seven birth cohorts. Allergy 2016, 71, 1461–1471. [Google Scholar] [CrossRef] [PubMed]
  19. Aerts, R.; Bruffaerts, N.; Somers, B.; Demoury, C.; Plusquin, M.; Nawrot, T.S.; Hendrickx, M. Tree pollen allergy risks and changes across scenarios in urban green spaces in Brussels, Belgium. Landsc. Urban Plan. 2021, 207, 104001. [Google Scholar] [CrossRef]
  20. Yang, X.; Kuang, D. A Systematic Review on the Associations Between Playground Features and Children’s Physical Activity Levels. Landsc. Archit. Front. 2025, 13, 68–83. [Google Scholar]
  21. Gao, M.; Cheng, X.; Bao, Y.; Zhou, X. Beyond Green: Unveiling the Impact of Urban Park Quality and Greenery on Children’s Physical Activity. Environ. Plan. B Urban Anal. City Sci. 2024, 52, 1717–1734. [Google Scholar] [CrossRef]
  22. Cavaleiro Rufo, J.; Paciência, I.; Hoffimann, E.; Moreira, A.; Barros, H.; Ribeiro, A.I. The neighbourhood natural environment is associated with asthma in children: A birth cohort study. Allergy 2021, 76, 348–358. [Google Scholar] [PubMed]
  23. Dadvand, P.; Villanueva, C.M.; Font-Ribera, L.; Martinez, D.; Basagaña, X.; Belmonte, J.; Vrijheid, M.; Gražulevičienė, R.; Kogevinas, M.; Nieuwenhuijsen, M.J. Risks and Benefits of Green Spaces for Children: A Cross-Sectional Study of Associations with Sedentary Behavior, Obesity, Asthma, and Allergy. Environ. Health Perspect. 2014, 122, 1329–1335. [Google Scholar] [CrossRef] [PubMed]
  24. Andrusaityte, S.; Grazuleviciene, R.; Kudzyte, J.; Bernotiene, A.; Dedele, A.; Nieuwenhuijsen, M.J. Associations between neighbourhood greenness and asthma in preschool children in Kaunas, Lithuania: A case–control study. BMJ Open 2016, 6, e010341. [Google Scholar] [CrossRef] [PubMed]
  25. Donovan, G.H.; Gatziolis, D.; Longley, I.; Douwes, J. Vegetation diversity protects against childhood asthma: Results from a large New Zealand birth cohort. Nat. Plants 2018, 4, 358–364. [Google Scholar] [CrossRef] [PubMed]
  26. CitiesWithNature. Six Chinese “Charming Cities” Announced at COP15. ICLEI—Local Governments for Sustainability. 13 December 2022. Available online: https://citieswithnature.org/six-chinese-charming-cities-announced-at-cop15/ (accessed on 24 March 2026).
  27. Ministry of Housing and Urban-Rural Development of the People’s Republic of China. Chengdu: Constructing a Four-Level Planning Implementation System to Advance Urban Renewal in an Integrated Manner. 2026. Available online: https://www.mohurd.gov.cn/xinwen/dfxx/art/2026/art_2437fb02b36746c29d4674d132c67bdc.html (accessed on 24 March 2026).
  28. Liu, X.Y.; Chen, C.D.; Bi, L.L.; Wang, R.B.; Dong, J.W.; Zheng, Y.L.; Zeng, X.Y. Plant diversity and its value evaluation in old urban residential communities: Based on residents’ willingness to pay. Acta Ecol. Sin. 2026, 46, 367–378. [Google Scholar]
  29. Kamal Eldeirawi, R.; Colin Kunzweiler, M.S.; Zenk, S.; Finn, P.; Nyenhuis, S.; Rosenberg, N.; Persky, V. Associations of urban greenness with asthma and respiratory symptoms in Mexican American children—ScienceDirect. Ann. Allergy Asthma Immunol. 2019, 122, 289–295. [Google Scholar]
  30. Asher, M.I.; Montefort, S.; Bjorksten, B.; Lai, C.K.; Strachan, D.P.; Weiland, S.K.; Williams, H.; The ISAAC Phase Three Study Group. Worldwide time trends in the prevalence of symptoms of asthma, allergic rhinoconjunctivitis, and eczema in childhood: ISAAC Phases One and Three repeat multicountry cross-sectional surveys. Lancet 2006, 368, 733–743. [Google Scholar] [PubMed]
  31. Ren, H.L.; Sun, J.L.; Liu, G. Comorbidity and multimorbidity for allergic diseases. Chin. Med. J. 2022, 56, 735–739. [Google Scholar]
  32. Traidl-Hoffmann, C. Allergy-an environmental disease. Bundesgesundheitsblatt-Gesundheitsforschung-Gesundheitsschutz 2017, 60, 584–591. [Google Scholar] [PubMed]
  33. Tucker, C.J. Red and photographic infrared linear combinations for monitoring vegetation. Rem. Sens. Environ. 1979, 8, 127–150. [Google Scholar] [CrossRef]
  34. Zhang, D.; Luo, Y.; Zhang, L.; Fu, R.; You, X.; Yin, L. Research on several methods for biodiversity investigation of plant species in urban green spaces: A case study of Shanghai. Garden 2024, 41, 4–10+51. [Google Scholar]
  35. Li, J.; Zhuang, C.; Yang, F.; Lu, S.; Qiu, L.; Zhao, J. Characteristics of urban invasive plants and their effects on plant diversity in the built-up area of Shenzhen, China. Chin. J. Ecol. 2024, 43, 2295. [Google Scholar]
  36. Zong, H.; Cao, Z.M.; Li, M.X.; Tang, Q.; Chen, W.K.; Li, X. Morphological characteristics of allergenic pollen from 22 commonly used spring-flowering street tree species. Chin. J. Appl. Environ. Biol. 2024, 30, 759–766. [Google Scholar]
  37. Taylor, N.; Pringle, A.; Roscoe, C.M.P. Characteristics of the Outdoor Environment Affording Physical Activity, Motor Competence, and Social Interactions in Children Aged 3–7 Years: A Systematic Review. Children 2024, 11, 1491. [Google Scholar] [CrossRef] [PubMed]
  38. Shen, Y.; Tan, Q.; Sun, Z.Z. Theoretical exploration and practical path for systematic construction of children’s nature education space system: A case study of Changsha. Chin. Landsc. Archit. 2025, 41, 15–22. [Google Scholar]
  39. Hair, J.F.; Black, W.C.; Babin, B.J.; Anderson, R.E. Multivariate data analysis. In Multivariate Data Analysis; Pearson: London, UK, 2019. [Google Scholar]
  40. Lymperopoulou, D.S.; Adams, R.I.; Lindow, S.E. Contribution of vegetation to the microbial composition of nearby outdoor air. Appl. Environ. Microbiol. 2016, 82, 3822–3833. [Google Scholar] [CrossRef] [PubMed]
  41. Rojo, J.; Oteros, J.; Pérez-Badia, R.; Cervigón, P.; Ferencova, Z.; Gutiérrez-Bustillo, A.M.; Bergmann, K.-C.; Oliver, G.; Thibaudon, M.; Albertini, R.; et al. Near-ground effect of height on pollen exposure. Environ. Res. 2019, 174, 160–169. [Google Scholar] [CrossRef] [PubMed]
  42. Roslund, M.I.; Puhakka, R.; Grönroos, M.; Nurminen, N.; Oikarinen, S.; Gazali, A.M.; Cinek, O.; Kramná, L.; Siter, N.; Vari, H.K.; et al. Biodiversity intervention enhances immune regulation and health-associated commensal microbiota among daycare children. Sci. Adv. 2020, 6, eaba2578. [Google Scholar] [CrossRef] [PubMed]
  43. Yang, Y.; Cao, C.; Bogoev, I.; Deetman, C.; Dietz, G.; Hang, J.; Howard, L.; Huang, X.; Kendall, N.; Lai, J.; et al. Regulation of humid heat by urban green space across a climate wetness gradient. Nat. Cities 2024, 1, 871–879. [Google Scholar] [CrossRef]
  44. Müller-Rompa, S.E.K.; Markevych, I.; Hose, A.J.; Loss, G.; Wouters, I.M.; Genuneit, J.; Braun-Fahrländer, C.; Horak, E.; Boznanski, A.; Heederik, D.; et al. An approach to the asthma-protective farm effect by geocoding: Good farms and better farms. Pediatr. Allergy Immunol. 2018, 29, 275–282. [Google Scholar] [PubMed]
  45. Gernes, R.; Brokamp, C.; Rice, G.E.; Wright, J.M.; Kondo, M.C.; Michael, Y.L.; Donovan, G.H.; Gatziolis, D.; Bernstein, D.; LeMasters, G.K.; et al. Using high-resolution residential greenspace measures in an urban environment to assess risks of allergy outcomes in children. Sci. Total Environ. 2019, 668, 760–767. [Google Scholar] [CrossRef] [PubMed]
  46. Dzhambov, A.M.; Lercher, P.; Rüdisser, J.; Browning, M.H.; Markevych, I. Allergic symptoms in association with naturalness, greenness, and greyness: A cross-sectional study in schoolchildren in the Alps. Environ. Res. 2021, 198, 110456. [Google Scholar] [CrossRef] [PubMed]
  47. Yang, G.Y.; Yu, Z.W.; Zhang, J.G.; Liu, H.; Jin, G.; Ju, Y.; Hong, B.; Zhao, Z.; Zhang, L.; Yao, X.; et al. Research progress on the health benefits of greenspace exposure from the perspective of exposure ecology. Acta Ecol. Sin. 2024, 44, 5914–5924. [Google Scholar]
  48. Alcock, I.; White, M.; Cherrie, M.; Wheeler, B.; Taylor, J.; McInnes, R.; Kampe, E.O.I.; Vardoulakis, S.; Sarran, C.; Soyiri, I.; et al. Land cover and air pollution are associated with asthma hospitalisations: A cross-sectional study. Environ. Int. 2017, 109, 29–41. [Google Scholar] [CrossRef] [PubMed]
  49. Hsieh, C.-J.; Yu, P.-Y.; Tai, C.-J.; Jan, R.-H.; Wen, T.-H.; Lin, S.-W.; Tseng, C.-C. Association between the First Occurrence of Asthma and Residential Greenness in Children and Teenagers in Taiwan. Int. J. Environ. Res. Public Health 2019, 16, 2076. [Google Scholar] [CrossRef] [PubMed]
  50. Donovan, G.H.; Landry, S.M.; Gatziolis, D. The natural environment, plant diversity, and adult asthma: A retrospective observational study using the CDC’s 500 Cities Project Data. Health Place 2021, 67, 102494. [Google Scholar] [PubMed]
  51. Chen, H.; Meng, X.; Yu, Y.; Sun, J.; Niu, Z.; Wei, J.; Zhang, L.; Lu, C.; Yu, W.; Wang, T.; et al. Greenness and its composition and configuration in association with allergic rhinitis in preschool children. Environ. Res. 2024, 251, 118627. [Google Scholar] [CrossRef] [PubMed]
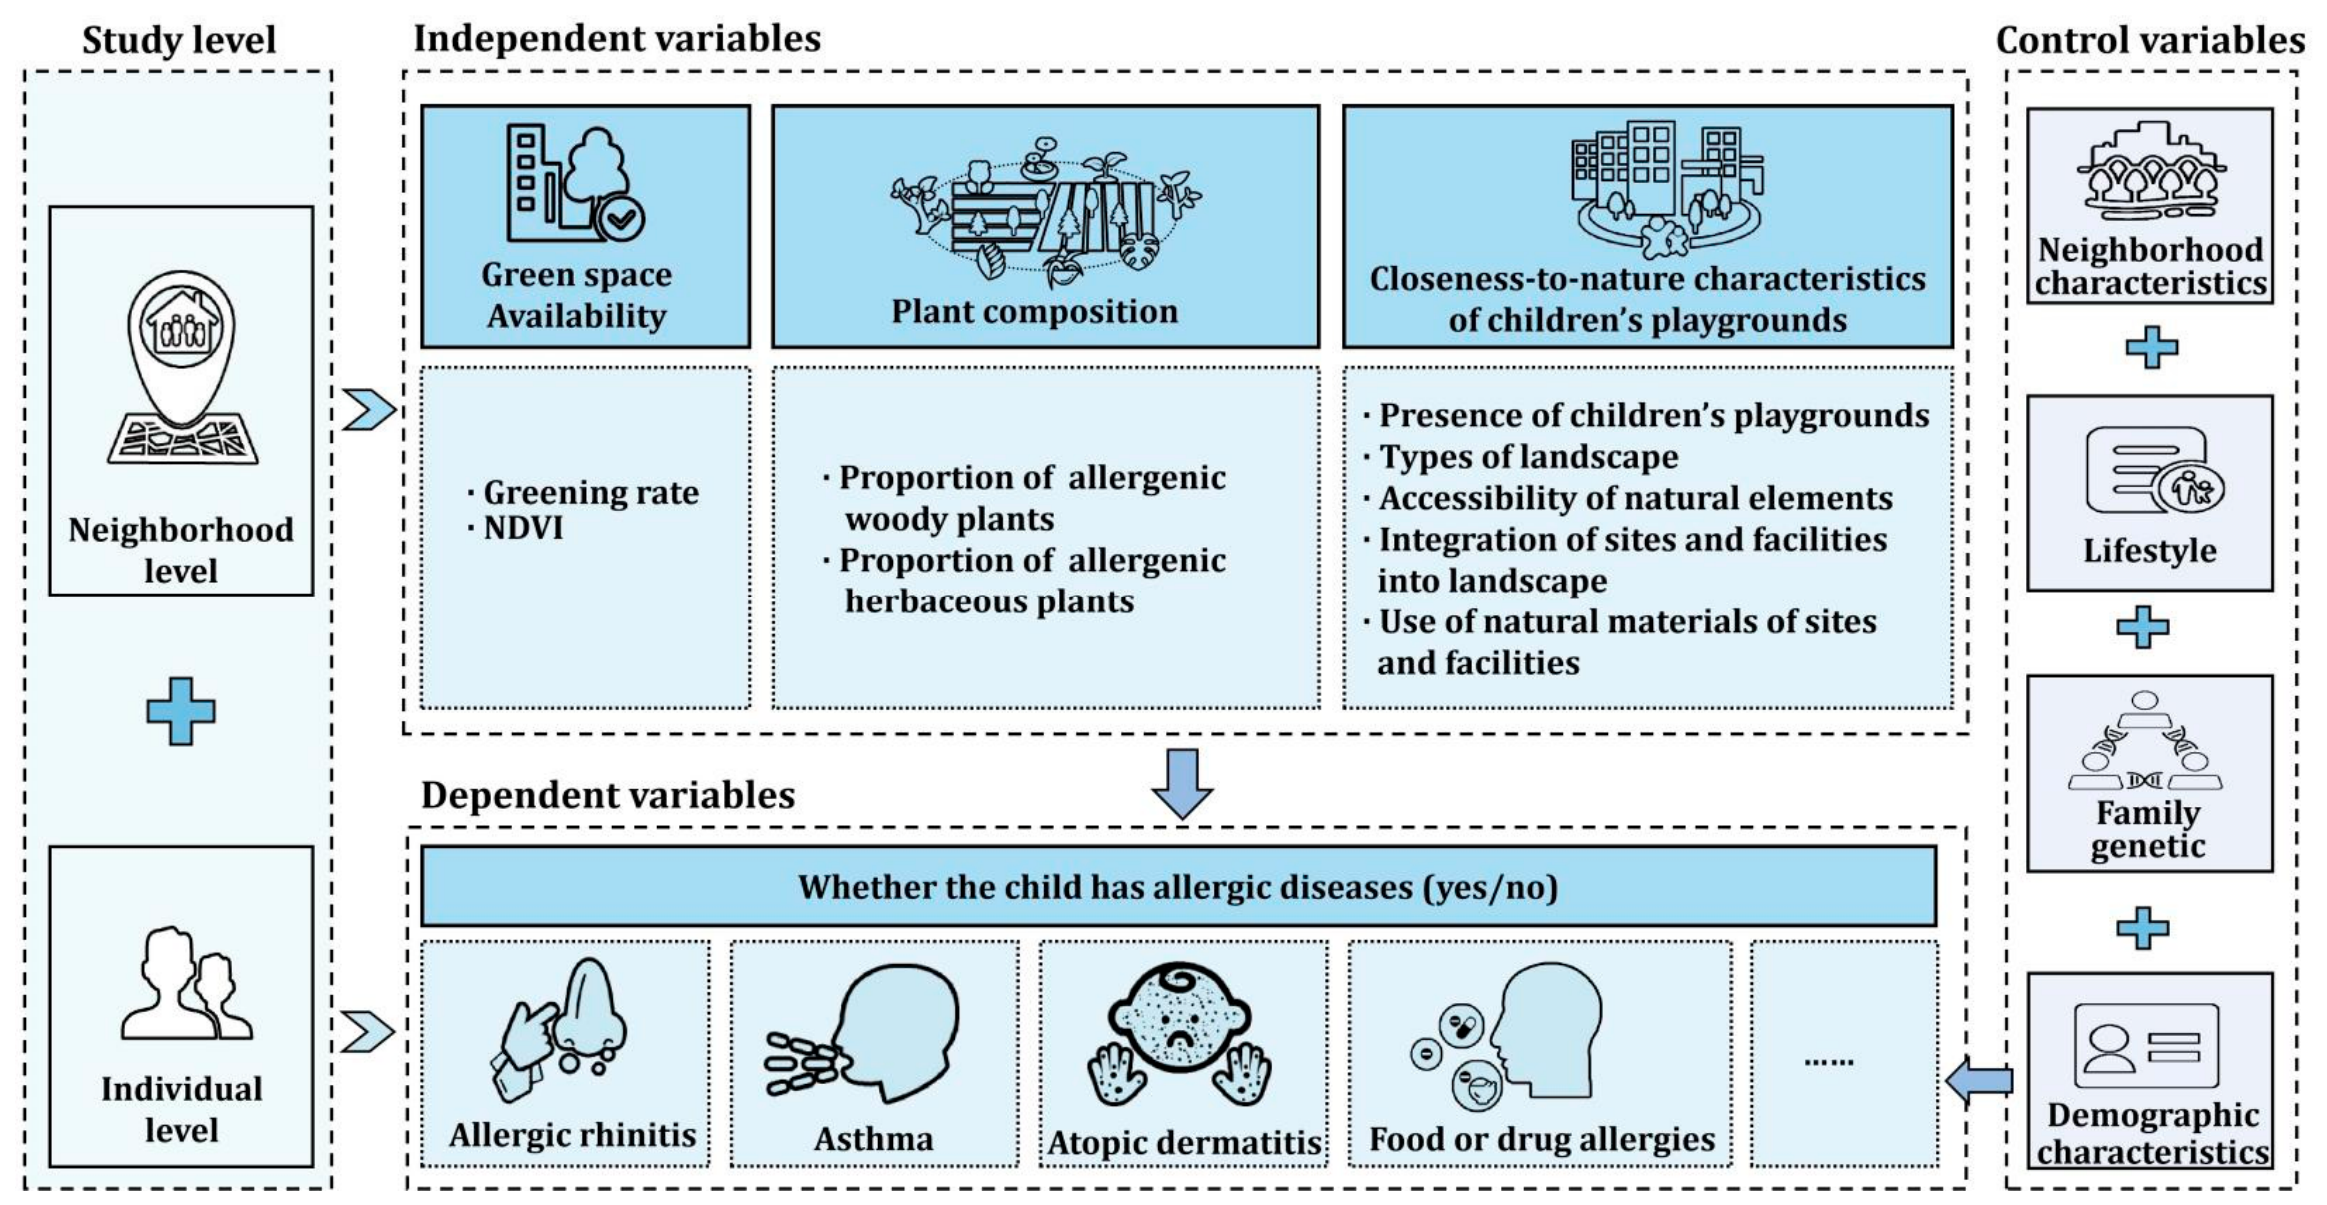
Figure 1. Theoretical framework illustrating the associations between residential green spaces and childhood allergic diseases.
Land 15 01186 g001
Figure 2. Spatial distribution of the seven typical neighborhoods in Chengdu.
Land 15 01186 g002
Figure 3. Layout of green spaces and distribution of key nodes in sample neighborhoods.
Land 15 01186 g003
Figure 4. Site plan and representative photographs of the five children’s playgrounds in the neighborhoods. Note: Two of the seven neighborhoods lack children’s playgrounds.
Land 15 01186 g004
Table 1. Basic information of the seven neighborhoods.
NeighborhoodConstruction YearLocationHousing Price (CNY/m2)Floor Area RatioGreening Rate (%)Area (hm2)HouseholdsSurrounding Land Use TypesResidential FunctionBuilding Type
XNC1994City center23,1961.2204.668897R, E, B, SStaff housingMulti-story building
YLSX1997City center11,0001.6150.67248R, G, B, SCommodity housingMulti-story building
HSHY2002Zone of transition21,1313.6363.5431397R, E, B, SCommodity housingMixed building
JGLC2006Suburban area12,3961.034513.632554R, G, SCommodity housingMulti-story building
LHJD2007Zone of transition11,3733.96305.5811915R, G, E, SCommodity housingHigh-rise building
CLHT2013Zone of transition19,3104306.5671290R, G, B, SCommodity housingHigh-rise building
TYSD2015Zone of transition33,3903.4303.242757R, G, E, SCommodity housingHigh-rise building
Note: ① Floor area ratio: total building floor area ÷ neighborhood land area. ② Greening rate: ratio of the vertical projection area of greening vegetation (trees, shrubs, vines, turf, etc.) to land area (%). ③ Construction year, housing price, floor area ratio, greening rate, and total number of households were obtained from public information on the Anjuke real estate website. Site area, floor area ratio, and greening rate were verified through public data from Chengdu property management departments and field investigations. Upon verification, such indicators were legally determined by the natural resources and planning departments during the regulatory planning stage and served as the legal basis for approval. Developers constructed, underwent acceptance inspections, and publicly displayed these indicators accordingly. The platform data shared the same source as the data from the planning department and the property management department. To verify data quality, we collected these indicators from the website of the Chengdu Property Management Association (http://zy.cdpma.cn/) and the property management departments of the neighborhoods. The results showed no significant differences in the remaining data, except that the floor area ratio of CLHT was corrected to 4.0. ④ Other information was derived from GIS (ArcGIS Desktop 10.7, Environmental Systems Research Institute, Redlands, CA, USA), Baidu Maps (Baidu Maps V21.3.0, Baidu Inc., Beijing, China), and verified through field investigation. ⑤ In the column for surrounding land use types, R = residential land, E = educational land, G = park green space, B = commercial land, S = road land.
Table 2. Results of descriptive statistical analysis.
VariablesMean (SD)/Frequency (%)
Dependent variable
    Presence of allergic diseases
Yes52 (24.762%)
No158 (75.238%)
Independent variables
Greening Rate29.429 (9.154)
NDVI0.508 (0.060)
Proportion of Allergenic Plants
Proportion of allergenic woody plants0.335 (0.142)
Proportion of allergenic herbaceous plants0.038 (0.055)
Closeness-to-nature characteristics of children’s playgrounds
    Presence of specialized children’s playgrounds
Yes150 (71.429%)
No60 (28.571%)
    Types of landscape4.990 (3.969)
    Accessibility of natural elements1.424 (1.176)
    Integration of sites and facilities into landscape1.857 (1.460)
    Natural material usage in playgrounds and facilities1.143 (1.248)
Covariates
Gender
    Male99 (47.143%)
    Female111 (52.857%)
Age3.340 (1.903)
Family history of allergic diseases
    Yes22 (10.476%)
    No188 (89.524%)
Mode of delivery
    Vaginal delivery128 (60.952%)
    Cesarean section82 (39.048%)
Feeding pattern
    Breastfeeding85 (40.476%)
    Formula feeding42 (20.000%)
    Partial breastfeeding83 (39.524%)
Hygiene habits
    High level of cleanliness100 (47.619%)
    Moderate level of cleanliness110 (52.381%)
Maternal education
    Primary school graduate or below2 (0.952%)
    Junior high school graduate6 (2.857%)
    Senior high school graduate24 (11.429%)
    Associate degree/bachelor’s degree139 (66.190%)
    Master’s degree or above39 (18.571%)
Family monthly income
    <5000 CNY5 (2.381%)
    5000–10,000 CNY55 (26.190%)
    10,000–20,000 CNY114 (54.296%)
    >20,000 CNY36 (17.143%)
Neighborhood construction year
    1990–2000s60 (28.571%)
    2001–2010s90 (42.857%)
    After 201060 (28.571%)
Building morphology
    high-rise90 (42.857%)
    multi-story120 (57.143%)
Average housing price
    <19,000 CNY/m290 (42.857%)
    ≥19,000 CNY/m2120 (57.143%)
Neighborhood location
    Within the Third Ring Road149 (70.952%)
    Outside the Third Ring Road61 (29.048%)
Table 3. Logistic regression results for the impact of greening rate, NDVI on childhood allergic diseases.
Greening RateNDVI
Crude model1.312 (0.509, 3.382)0.682 (0.320, 1.450)
ICC0.308 (0.090, 0.667)0.300 (0.090, 0.650)
p for LRT<0.001<0.001
Adjusted model1.220 (0.543, 2.739)0.683 (0.320, 1.459)
ICC0.236 (0.056, 0.615)0.231 (0.057, 0.599)
p for LRT<0.001<0.001
Gender
    Male (n = 99)1.034 (0.628, 1.704)0.900 (0.545, 1.484)
    Female (n = 111)1.296 (0.835, 2.010)0.720 (0.436, 1.189)
    p for interaction0.3130.429
Age
    0–3 years old (n = 105)2.214 (1.278, 3.835) **0.892 (0.494, 1.612)
    4–6 years old (n = 105)0.799 (0.507, 1.260)0.742 (0.477, 1.154)
    p for interaction0.002 **0.706
Year of construction
    1990s (n = 60)1.309 (0.117, 14.624)1.095 (0.486, 2.468)
    2000s and 2010s (n = 150)3.661 (1.904, 7.039) ***0.804 (0.522, 1.237)
    p for interaction0.2040.008 **
Building morphology
    high-rise (n = 90)0.756 (0.380, 1.505)
    multi-story (n = 120)1.275 (0.949, 1.714)1.375 (0.704, 2.685)
    p for interaction0.488
Average housing price
    <19,000 CNY/m2 (n = 90)1.459 (0.978, 2.176)0.258 (0.105, 0.635) **
    ≥19,000 CNY/m2 (n = 120)0.648 (0.331, 1.270)1.753 (1.010, 3.042) *
    p for interaction0.017 *0.001 ***
Settlement location
    Within the Third Ring Road (n = 150)0.737 (0.465, 1.166)1.303 (0.846, 2.007)
    Outside the Third Ring Road (n = 60)0.022 (0.001, 0.931) *
    p for interaction0.6490.627
The crude model is unadjusted. The adjusted model is adjusted for demographics, family genetics, lifestyle, and neighborhood characteristics. The remaining models represent subgroup analyses. Statistical significance is indicated by *: p < 0.05; **: p < 0.01; ***: p < 0.001. “—” indicates no valid calculation result.
Table 4. Logistic regression results for the impact of proportion of allergenic plants on childhood allergic diseases.
Allergenic Woody Plant ProportionAllergenic Herbaceous Plant Proportion
Crude model0.847 (0.315, 2.273)1.052 (0.386, 2.865)
ICC0.314 (0.091, 0.675)0.328 (0.100, 0.681)
p for LRT<0.001<0.001
Adjusted model0.883 (0.381, 2.049)1.027 (0.439, 2.402)
ICC0.238 (0.056, 0.622)0.249 (0.062, 0.626)
p for LRT<0.001<0.001
Gender
    Male (n = 99)0.917 (0.553, 1.521)0.964 (0.594, 1.564)
    Female (n = 111)0.761 (0.489, 1.185)0.855 (0.547, 1.337)
    p for interaction0.5030.891
Age
    0–3 years old (n = 105)0.527 (0.310, 0.895) *0.681 (0.399, 1.161)
    4–6 years old (n = 105)1.130 (0.730, 1.750)1.121 (0.737, 1.705)
    p for interaction0.020 *0.186
Year of construction
    1990s (n = 60)0.933 (0.499, 1.744)0.952 (0.615, 1.475)
    2000s and 2010s (n = 150)0.702 (0.445, 1.108)0.480 (0.160, 1.442)
    p for interaction0.0650.313
Building morphology
    high-rise(n = 90)5.231 (0.687, 39.822)3.902 (0.502, 30.361)
    multi-story(n = 120)0.693 (0.478, 1.004)0.784 (0.569, 1.080)
    p for interaction0.019 *0.194
Average housing price
    <19,000 CNY/m2 (n = 90)0.854 (0.569, 1.282)0.945 (0.652, 1.370)
    ≥19,000 CNY/m2 (n = 120)0.603 (0.298, 1.218)0.247 (0.071, 0.852) *
    p for interaction0.3560.030 *
Settlement location
    Within the Third Ring Road (n = 150)0.879 (0.536, 1.442)0.986 (0.680, 1.430)
    Outside the Third Ring Road (n = 60)
    p for interaction0.9240.096
The crude model is unadjusted. The adjusted model is adjusted for demographics, family genetics, lifestyle, and neighborhood characteristics. The remaining models represent subgroup analyses. Statistical significance is indicated by *: p < 0.05. “—” indicates no valid calculation result.
Table 5. Logistic regression analysis results for the impact of closeness-to-nature characteristics of children’s playgrounds on childhood allergic diseases.
Variables/SubgroupsPresence of Dedicated Children’s PlaygroundsLandscape TypeAccessibility of Natural ElementsIntegration of Playgrounds and Facilities into LandscapeUsage of Natural Materials in Playgrounds and Facilities
Crude model0.381 (0.109–1.333)0.693 (0.386, 1.244)0.641 (0.361, 1.138)0.643 (0.354, 1.169)1.029 (0.523, 2.023)
ICC0.313 (0.095, 0.664)0.325 (0.100, 0.676)0.263 (0.073, 0.618)0.296 (0.088, 0.647)0.313 (0.095, 0.664)
p for LRT<0.001<0.001<0.001<0.001<0.001
Adjusted model0.368 (0.111–1.222)0.653 (0.384, 1.111)0.657 (0.361, 1.198)0.653 (0.356, 1.199)1.066 (0.545, 2.085)
ICC0.233 (0.057, 0.606)0.243 (0.060, 0.618)0.196 (0.044, 0.567)0.223 (0.054, 0.593)0.233 (0.057, 0.606)
p for LRT<0.001<0.0010.001<0.001<0.001
Gender
Male (n = 99)0.430 (0.154–1.201)0.624 (0.373, 1.045)0.690 (0.412, 1.156)0.720 (0.437, 1.187)1.160 (0.722, 1.864)
Female (n = 111)0.380 (0.142–1.020)0.666 (0.413, 1.074)0.670 (0.409, 1.096)0.654 (0.404, 1.059)0.964 (0.592, 1.570)
p for interaction0.8070.4270.6480.8110.668
Age
    0–3 years old (n = 105)0.425 (0.136–1.327)0.603 (0.344, 1.056)0.819 (0.453, 1.481)0.750 (0.419, 1.340)1.202 (0.684, 2.112)
    4–6 years old (n = 105)0.402 (0.157–1.027)0.683 (0.433, 1.079)0.618 (0.392, 0.975) *0.662 (0.425, 1.030)1.029 (0.672, 1.578)
    p for interaction0.0730.025 *0.9230.4010.852
Year of construction
    1990s (n = 60)
    2000s and 2010s (n = 150)0.839 (0.469, 1.502)0.826 (0.459, 1.485)0.879 (0.477, 1.618)1.563 (1.054, 2.316) *
    p for interaction0.026 *
Building morphology
    high-rise (n = 90)0.373 (0.107, 1.304)10.698(1.301- 87.953) *2.038 (1.056, 3.932) *
    multi-story (n = 120)1.371 (0.636- 2.955)1.101 (0.800, 1.514)1.449 (0.587, 3.578)2.006 (0.999, 4.029)1.482 (0.568, 3.868)
    p for interaction0.002 **0.9840.040 *0.442
Average housing price
    <19,000 CNY/m2 (n = 90)0.229 (0.069, 0.766) *0.618 (0.336, 1.136)0.185 (0.065, 0.528) **0.327 (0.157, 0.681) **0.159 (0.035, 0.717) *
    ≥19,000 CNY/m2 (n = 120)0.496 (0.194, 1.269)0.663 (0.435, 1.012)0.784 (0.531, 1.158)0.859 (0.577, 1.280)1.089 (0.763, 1.555)
    p for interaction0.2290.020 *0.1880.5260.989
Settlement location
    Within the Third Ring Road (n = 150)0.557 (0.258, 1.198)0.683(0.465, 1.004)0.826 (0.619, 1.101)0.897 (0.707, 1.138)1.017 (0.787, 1.315)
    Outside the Third Ring Road (n = 60)
    p for interaction
The crude model is unadjusted. The adjusted model is adjusted for demographics, family genetic, lifestyle, and neighborhood characteristics. The remaining are subgroup models. Statistical significance is indicated by *: p < 0.05, **: p < 0.01. “—” indicates no valid calculation result. The logistic regression results for the association between the integration of sites and facilities into the landscape and allergy risk in high-rise neighborhoods showed a wide confidence interval, which might be due to the small sample size. However, the significant results from both the subgroup analysis and the interaction effect test indicated a significant positive risk trend for this indicator.
Table 6. Comparison of spatial characteristics between the low-to-medium-housing-price group and the high-housing-price group.
Characteristic DimensionsLow-To-Medium-Housing-Price Group (YLSX, JGLC, LHJD)High-Housing-Price Group (XNC, HSHY, CLHT, TYSD)Association with Childhood Allergic Diseases
Greening rateHigh, medium, and low levels coexistedMedium level
NDVI0.5070.508Protective in low-to-medium-housing-price group; risky in high-price group; significant heterogeneity
Proportion of allergenic woody plantsRelatively lowRelatively high
Proportion of allergenic herbaceous plantsExtremely low (≤0.164)Extremely low (≤0.051)protective association in high-housing-price group
Maintenance quality of green spacesExtensiveIntensive
Surrounding land use typesAdjacent to park green spacesPartially adjacent to park green spaces
Disclaimer/Publisher’s Note: The statements, opinions and data contained in all publications are solely those of the individual author(s) and contributor(s) and not of MDPI and/or the editor(s). MDPI and/or the editor(s) disclaim responsibility for any injury to people or property resulting from any ideas, methods, instructions or products referred to in the content.