1. Introduction
Major port investments are expected to do more than improve maritime access. They are also expected to widen market access [
1,
2], reorganize coastal urban systems [
3,
4], support corridor formation [
5,
6,
7], and generate economic opportunity beyond the waterfront [
8,
9,
10]. These expectations follow from the position of ports at the interface between maritime circulation and inland territory: ports function as gateways through which external connectivity is translated, unevenly and sometimes incompletely, into local and regional development [
11,
12,
13,
14,
15]. The unresolved question is whether those expected gains can actually be observed beyond the waterfront once a major port investment is underway.
In Africa, that question is especially difficult to answer empirically. Large port investments are routinely linked to claims about corridor integration, urban transformation, and broader regional opportunity [
7,
16,
17]. Those claims are plausible, but the spatial sequence behind them is hard to observe around treated ports. A project may intensify operations at the waterfront, widen built-space uptake in the immediate port zone, and still fail to generate the same response in nearby settlements, secondary centers, or population distribution [
18,
19]. Emerging work on belt and road infrastructure has begun to document land-use change around African port nodes such as Djibouti, yet still operates at the urban-landscape scale rather than tracing within-site spatial gradients [
20]. The central empirical question is therefore whether port-generated gains remain concentrated around a coastal node or begin to travel across the surrounding settlement field.
Existing studies illuminate parts of that question, but none resolve it on its own. Research on Chinese overseas infrastructure and development shows that transport projects can reshape local economic geography, yet ports are often treated as one element of a broader portfolio that also includes roads, railways, and power [
16,
21,
22,
23]. Research on ports, port cities, and hinterlands provides the richest conceptual language for gateways, interfaces, and inland accessibility, but it tends to emphasize traffic, competitiveness, and corridor organization rather than nearby spatial outcomes measured around treated sites [
3,
4,
5,
9,
11,
24]. Remote-sensing studies show that spatially uneven development can be observed consistently across large territories, but they rarely combine a port-only African project universe with within-site distance contrasts, settlement validation, and nearby agglomeration screens in a single design [
25,
26,
27,
28,
29,
30]. Recent continental-scale modeling of African urban expansion projects spatial patterns under alternative development scenarios, but remains at the national or city scale rather than resolving project-level treatment contrasts [
31]. These expectations are well founded, yet the spatial sequence around treated ports remains difficult to observe directly. The empirical gap is whether post-commitment gains stay locked at the coastal node or begin to spread across nearby settlements.
The contribution of this paper is to make that question directly observable within a bounded African universe of treated port infrastructure projects. Chinese-financed projects are chosen as the analytical universe for three practical reasons. First, the CPORTS 2.0 database (AidData, William & Mary, Williamsburg, VA, USA) provides the most complete geocodable record of port infrastructure commitments in Africa during the 2000–2020 window, with systematic temporal and spatial fields that are not uniformly available for other financing sources. Second, Chinese financing commitments supply a common temporal anchor—the recorded commitment year—that aligns projects around a comparable financing stage. Third, these projects span a wide range of scales, coastal settings, and host-country contexts, making them informative for observing spatial variation rather than for isolating a single country-specific mechanism [
32,
33]. The main analytical sample comprises 22 geocodable physical port infrastructure projects retained from a 58-unit African project universe. Chinese financing defines the project universe and the common temporal anchor, while the empirical design follows spatial change from the immediate port node into progressively wider surrounding fields; throughout, Chinese financing serves as a sampling frame and timing anchor rather than as an analyzed mechanism.
Against that background, the paper asks three linked questions. What changes first after a port infrastructure commitment: activity, built-space uptake, or population? Do these projects mainly intensify existing coastal nodes, or do they generate detached urban formations? And when gains extend beyond the immediate port zone, how far do they travel and through which response layer? The evaluation problem is whether observed gains remain locked at node performance or register as wider territorial transmission.
2. Materials and Methods
2.1. Study Universe and Project Sample
The study universe is drawn from the CPORTS 2.0 database (AidData, William & Mary, Williamsburg, VA, USA) CPORTS 2.0 database and its associated geocoded project infrastructure [
32,
33]. The African subset contains 88 records corresponding to 58 unique port–country units. These units define a bounded African project universe of Chinese-financed port activities rather than a census of African ports.
The main analytical sample applies four screens to that universe. It retains aggregate-eligible seaport units (58 to 41), implementation or completion cases (41 to 36), units with a usable geographic point (36 to 32), and physical port infrastructure rather than equipment-only records. After aggregation, this yields 22 geocodable physical port infrastructure projects in 14 countries (
Table 1).
Manual review checks whether units excluded at the coordinate and facility stages should re-enter the sample as single-site port works. In practice, the excluded cases are multi-site landing-site programs, planning-stage zone projects, or equipment-only entries, so the final main sample remains 22.
2.2. Event-Time Anchor and Timing Audit
Event time is anchored at the recorded Chinese financing commitment year. Commitment is used as a financing-window marker because it is the most consistently observed temporal field across the retained sample and is tied directly to the financing logic that defines it. The event-study contrasts therefore align projects around a comparable financing stage rather than a literal engineering start date [
34,
35,
36].
That choice is audited against recorded start and completion fields, supplemented where needed by manual external checks. Ports are grouped into timing-risk classes using natural-breaks (Jenks) classification applied to the commitment-to-completion gap. The breaks separate Class A (shorter gaps, 11 ports), Class B (intermediate gaps, 9 ports), and Class C (longer gaps or no usable completion record, 2 ports: Doraleh and Nacala). Because Class C is small and represents higher timing uncertainty, it is flagged explicitly in robustness checks. Commitment precedes completion by a median of 3 years in the retained sample, so it is retained as a usable financing-window anchor with bounded interpretation.
2.3. Spatial Units: Rings, Settlements, Agglomerations, and Subnational Fields
The first spatial layer is a port-centered ring system. Around each treated port, space is partitioned into 0–5 km, 5–10 km, 10–25 km, 25–50 km, and 50–100 km zones, with the outermost ring serving as the within-port benchmark. The 50–100 km ring serves as the within-site benchmark: it lies beyond the direct construction footprint but inside the same coastal sub-region, allowing common trends to be differenced out. The core comparison is therefore internal to each treated site rather than based on an external control location. Because rings are constructed independently around each port, nearby ports can produce overlapping rings; this does not bias the within-site inner–outer contrast, which is computed separately for each node; excluding one member of the closest pair (Djibouti, Table 3) leaves the result essentially unchanged. For outward diffusion diagnostics, space beyond the immediate port zone (0–10 km) is subdivided into a mid-field (10–50 km) and an outer-field (50–100 km) ring. A secondary center is defined as the nearest GHSL settlement polygon outside the immediate port zone whose centroid lies in the same or adjacent GLocal level-2 unit.
The second spatial layer draws on GHSL 2000 settlement polygons [
28] to describe agglomeration context.The core event-study analysis proceeds with the ring system described above.
The third layer extends beyond the immediate port field to nearby agglomerations and subnational units. Africapolis agglomerations [
37], GLocal level-2 units [
38], and a nearby secondary-center screen are used for wider-field summaries across the surrounding settlement field.
2.4. Outcomes
Two annual outcomes are extracted in Google Earth Engine [
39] for the core event-study layer: harmonized annual NPP-VIIRS-like product (henceforth ’VIIRS’) for 2000–2021 and WorldPop population density for 2000–2020 [
40,
41,
42]. Nighttime lights are used as an activity measure, and population is used as a demographic measure [
25,
26,
27]. Continental-scale detection of African urban growth from DMSP/OLS nighttime lights confirms that low-intensity lighting zones in the urban–rural transition expand most rapidly, consistent with the spatial gradient approach adopted here [
43]. GHSL built-up surface is added as a coarser built-environment screen and is referred to throughout as
built-space uptake [
28]. GHSL coverage is thinner than the lights and population layers in the retained sample, yielding an effective built-up sample of
; the five excluded cases are primarily lower-density or small-island settings where the GHSL layer does not resolve a usable built-up footprint. All ring values are spatial means of the underlying raster and enter the analysis after a
transformation; GHSL built-up surface is linearly interpolated from five-year epochs to annual values.
2.5. Empirical Design
The core estimator is a within-port event-study that compares annular rings around each treated port. For port
i in year
t, the spatial gap for ring
r relative to the outer 50–100 km benchmark is:
where
is the financing commitment year for port
i,
captures the event-study coefficients for each relative year
k and ring
r, and
captures ring-specific year effects. The relative year index runs over
; estimation omits
and re-centers coefficients on a
baseline. The interval is asymmetric because early commitments lack pre-2000 data coverage while build-out lags commitment by a median of three years. The base period
is omitted because financing announcements may induce anticipatory effects; the omitted category therefore represents the pre-commitment baseline averaged over years
to
. A positive
indicates that the inner–outer gap for ring
r widened in relative year
k compared with the pre-commitment baseline, consistent with activity (or population, or built-space) concentrating near the port node. Because
is a log difference,
can be read approximately as the proportional change in the inner–outer gap: a coefficient of 0.424 corresponds to an approximate 52.8% widening (
). Negative values would imply spatial de-concentration, but are not the dominant pattern in the retained sample.
The headline gap shift estimators average post-commitment years for each ring relative to the benchmark:
where the first term averages the inner–outer gap in the post-commitment window and the second term averages the same gap in the pre-commitment window. Standard errors are clustered at the port level. Equation (
2) provides the estimating framework for
Table 2. Because the design absorbs port fixed effects, each port contributes all of its observed pre- and post-commitment years; a fixed-window robustness check (
Table 3) confirms that this choice does not drive the headline result.
2.6. Outward Diffusion and Mechanism Screens
The outward diffusion screens summarize whether ports with stronger near-port activity also show stronger mid-field built-space uptake, population change, outer-field change, or nearby-center responses [
19,
44,
45]. These port-level summaries require non-missing catchment information and wider-field units that are not defined uniformly across all ports, so effective
N is reported with each estimate rather than carried over from the retained 22-project sample. Catchment-based summaries retain
Port of Cabinda as an explicit zero-catchment case rather than treating it as sample loss.
Definitions of the wider-field indicators used in the outward diffusion screens appear in
Appendix B. The mechanism screens assemble project form, agglomeration context, site logic, and road measures for later cross-port comparison. Road structure is measured in two layers: a coarse historical baseline from gROADS [
46] and a present-day paved/unpaved network from FRST [
47]. The first is used as a historical corridor baseline and the second as a current transmission structure. Throughout the paper,
diffusion is used as a descriptive label for outward movement in the diagnostics; it does not imply an identified causal mechanism.
3. Results
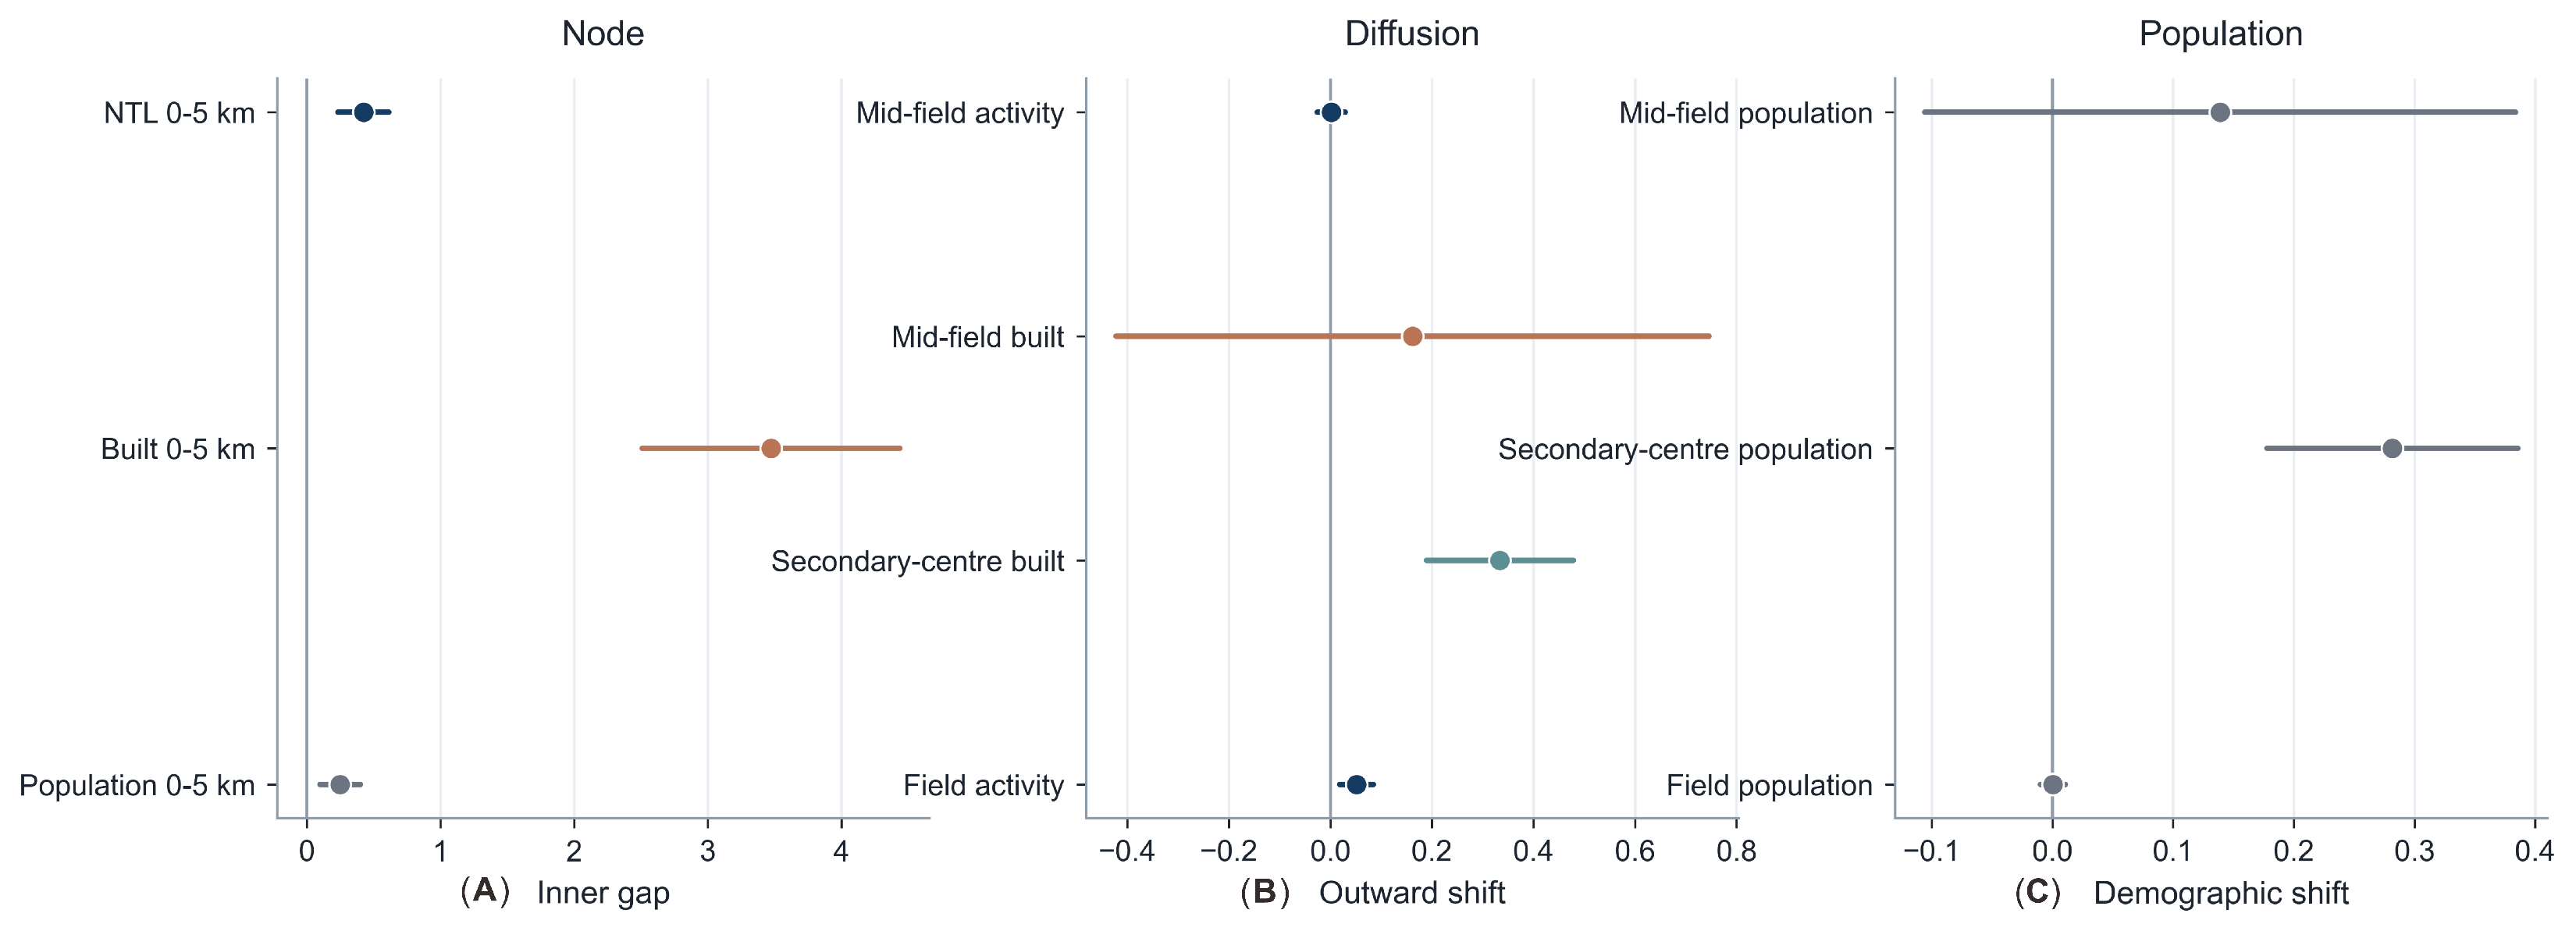
The core findings are previewed in
Figure 1, which summarizes the three response layers that structure the analysis. Panel A reports the inner–outer gap shifts in the immediate port zone (0–5 km) across nighttime lights, built-space, and population—the core specification behind the distance gradient results of
Section 3.1. Panel B summarizes outward-shift diagnostics across mid-field and secondary-center layers. Panel C reports demographic shifts, which are systematically smaller and less precisely estimated than the activity and built-space responses.
3.1. Spatial Concentration near the Port Node
The clearest post-commitment change appears in the immediate port zone around the node.
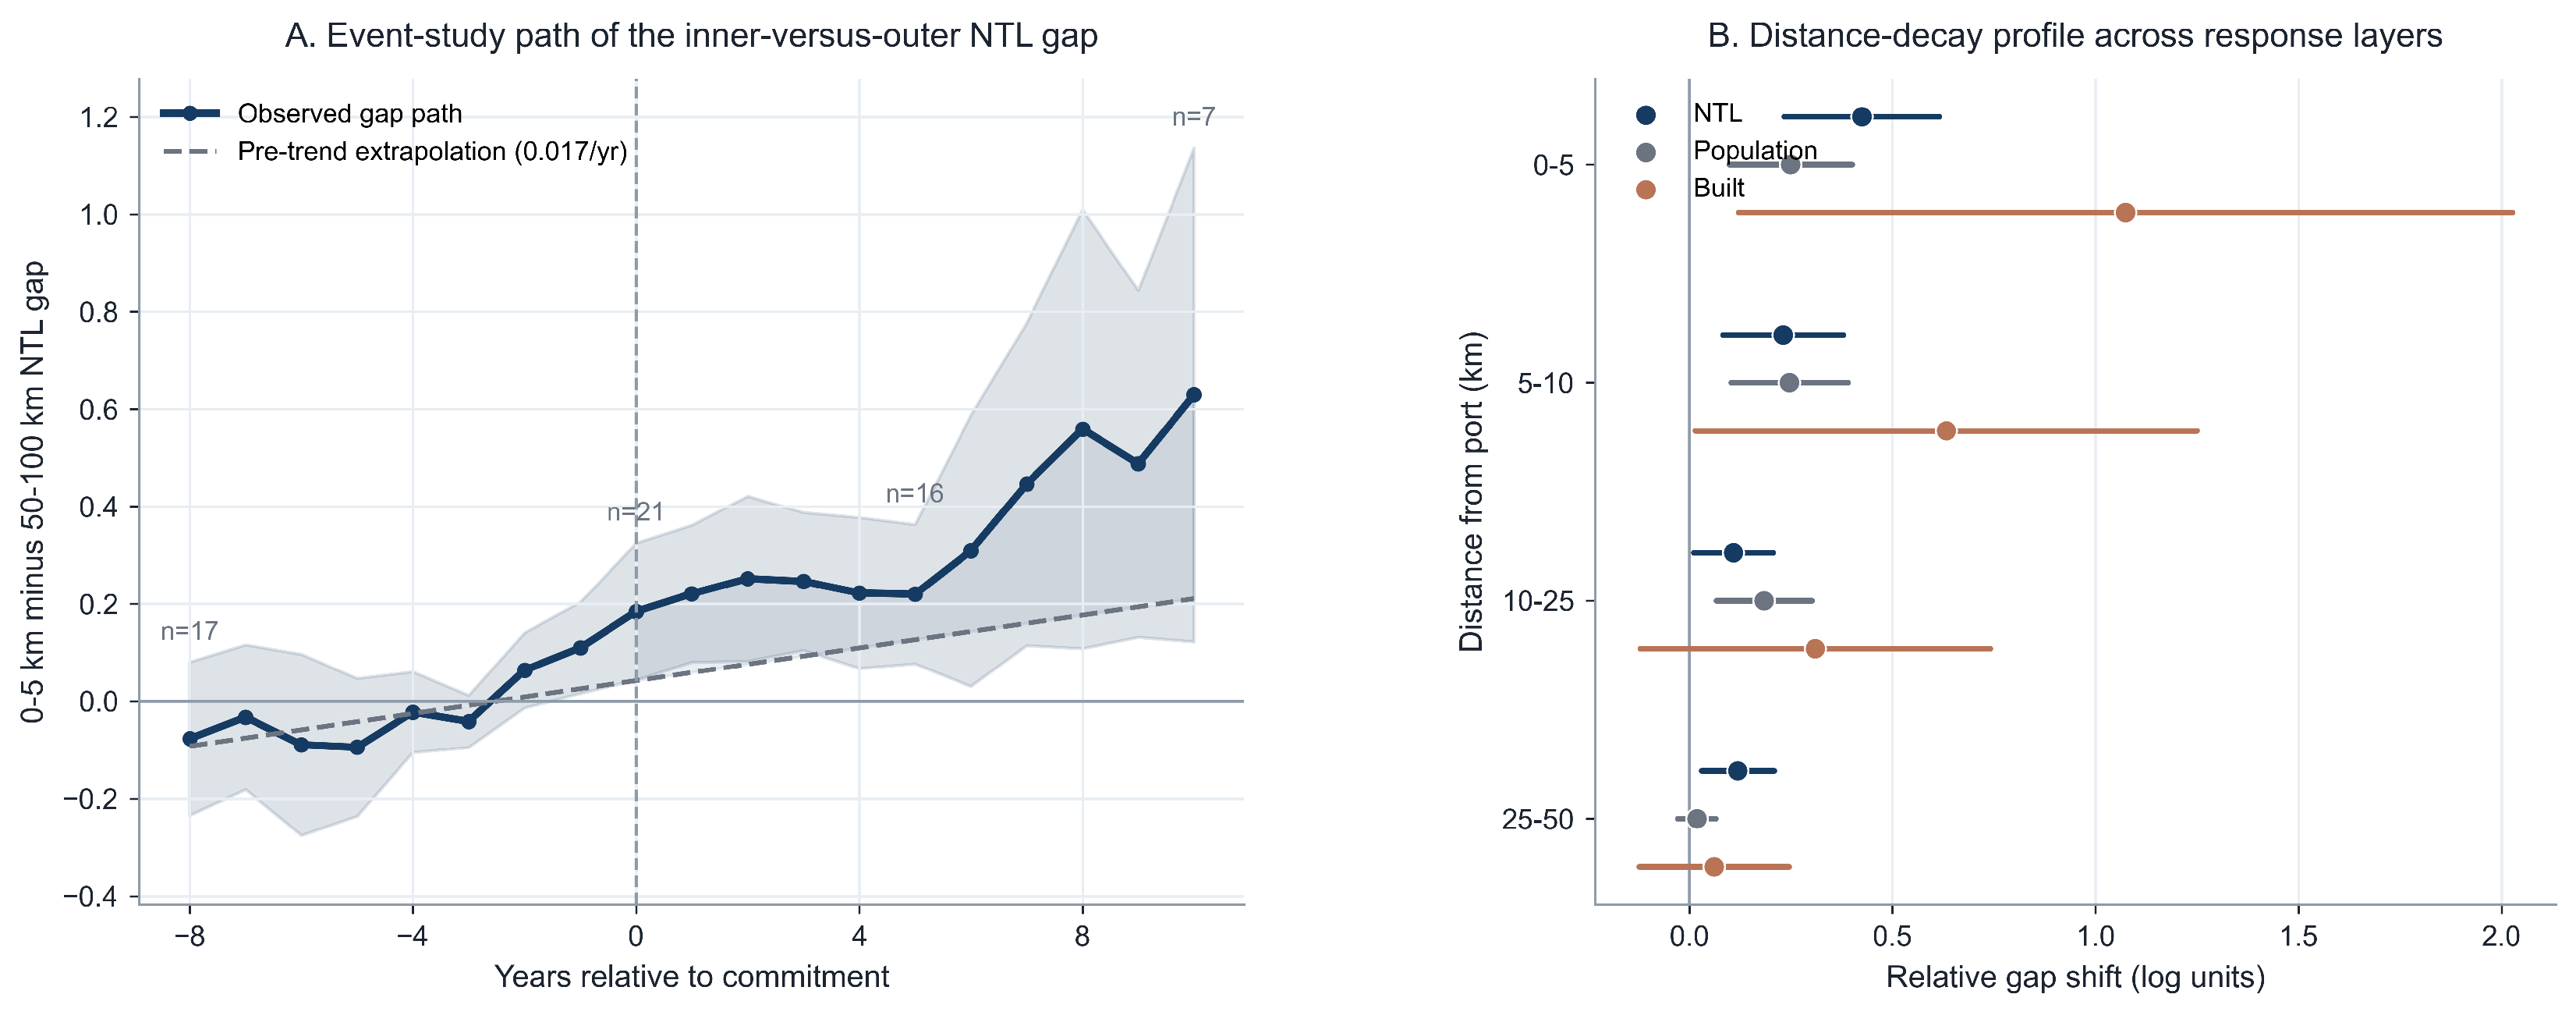
Figure 2A shows the inner-versus-outer gap path over the full supported window (
). A pre-commitment upward drift is visible—most treated ports were already growing and were selected partly because they were active coastal nodes. Two features of the design make the post-commitment widening informative despite this. The outcome is an inner-minus-outer gap, so common regional growth is differenced out. Coefficients are re-centered on a
baseline, measuring widening against the immediate pre-commitment gap. The 0–5 km nighttime lights series begins to pull away from the 50–100 km benchmark shortly after the financing anchor and remains above it through the later post period. The pattern is a clear distance gradient: the widening gap is largest in the inner bands, and the activity and built-space responses attenuate more sharply than the population response. The first result is therefore about spatial concentration around treated nodes, not about generalized growth across the wider surrounding field.
Table 2 shows how quickly that concentration weakens with distance. For nighttime lights, the inner–outer gap widens by 0.424 log points in the 0–5 km band, corresponding to an approximate 52.8% shift relative to the outer benchmark (
). The corresponding estimate for 5–10 km falls to 0.230 (25.9%,
), and the 10–25 km and 25–50 km coefficients are smaller still (0.108 and 0.119). The pattern is a clear distance gradient: gains are not absent beyond 10 km, but they weaken rapidly outside the immediate port zone.
Population responds differently. The 0–5 km and 5–10 km coefficients are 0.249 and 0.246, both positive and statistically significant, but the gradient is flatter than the lights gradient. Instead of a sharp node-centered concentration that falls away immediately, the population response is spread more evenly across the first three rings, with the 25–50 km contrast fading toward zero. Population remains present near ports, but it does not sharpen around the node in the same way that nighttime lights do.
The built-space screen points in the same direction as the lights. Relative to the outer benchmark, built-space uptake records the largest widening within 10 km of the node: 1.073 log points in the 0–5 km band (192.5%, ) and 0.632 in the 5–10 km band (88.2%, ). These estimates are based on a smaller effective sample and a coarser temporal layer than the annual light series, so they are treated as supportive rather than as the paper’s primary event-study outcome. Even so, they indicate that the strongest local response is not limited to an operational signal. Physical land uptake is also most visible close to the node.
The immediate port zone result is also robust to the paper’s main timing concerns.
Table 3 shows that excluding the higher-risk timing Class C cases (Doraleh and Nacala) or the geopolitically unusual Djibouti PLA-base context leaves the headline 0–5 km lights coefficient essentially unchanged, with estimates ranging from 0.408 to 0.412. This does not remove all timing uncertainty, but it does indicate that the local intensification result is not being carried by one or two problematic anchors.
The event-study, built-space, and robustness evidence all point to the same local pattern: the clearest early divergence is concentrated within 0–10 km of the port node, and it is sharper in activity and built-space uptake than in population. The next section turns to whether this pattern unfolds inside existing coastal urban formations or at more detached sites.
3.2. Agglomeration Embedding and Settlement Context
Most treated port infrastructure projects are embedded in, or lie immediately adjacent to, existing coastal urban formations.
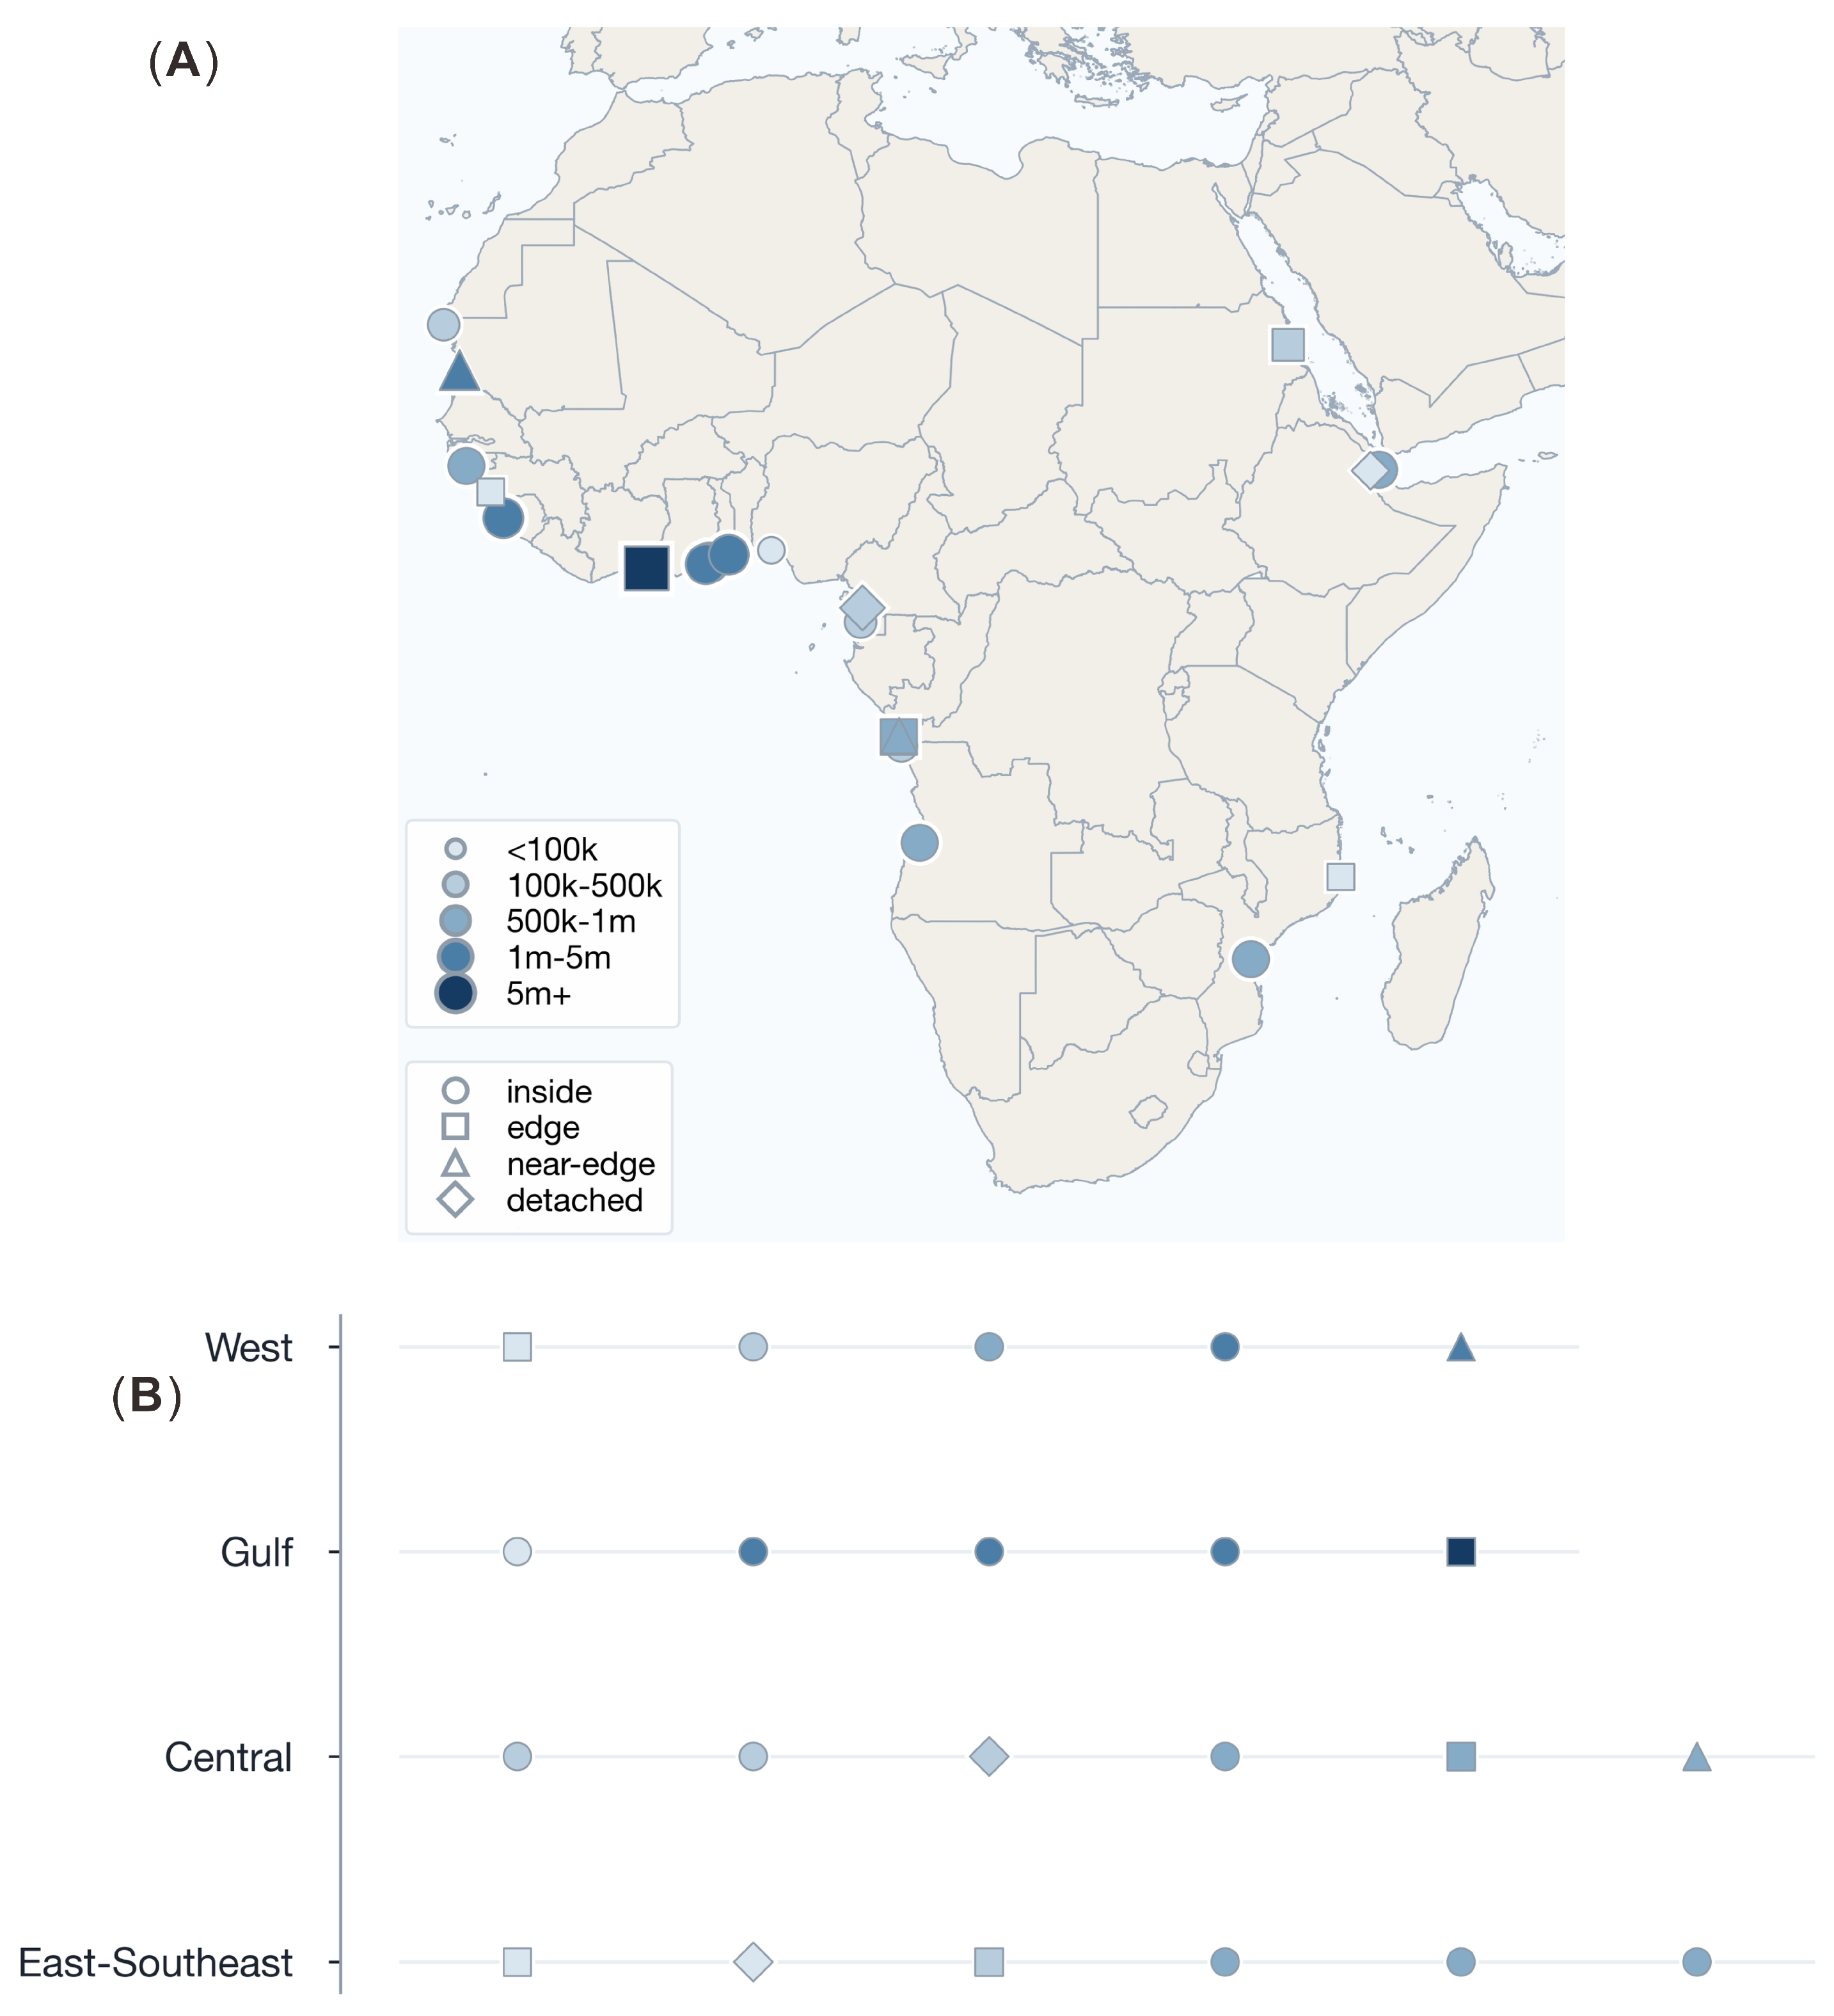
Figure 3 and
Table 4 summarize that context directly. By 2020, 13 of 22 treated ports fall inside an Africapolis agglomeration and another 7 lie within 5 km of one. Only Kribi and Goubet appear clearly detached in this descriptive screen. In other words, 20 of 22 treated ports are either already inside an agglomeration or close enough to one that near-port change is very likely to occur within a pre-existing coastal urban field, not along an empty shoreline.
Detached cases are rare, and most projects enter places where some settlement skeleton, urban edge, or local city system is already present. The near-port response documented in the previous section therefore usually occurs inside an existing coastal urban field.
Nor is this merely a megacity story.
Table 4 shows that 16 of 22 treated ports are associated with agglomeration contexts below 1 million population, and only one port is attached to a 5 million+ agglomeration. The sample is therefore not dominated by a handful of continental megacities. Much of the observed intensification is occurring in medium-sized and smaller coastal urban systems, where port infrastructure projects can thicken an existing node without necessarily producing metropolitan-scale expansion.
This section remains descriptive, with heterogeneity taken up in the next section. What it establishes is the spatial setting of the sample: most treated projects intensify existing coastal nodes, while detached new-city formation appears atypical.
3.3. Diffusion Hierarchy Across Response Layers
Beyond the immediate port zone, outward diffusion differs across response layers. It is more visible in activity and built-space uptake than in population.
Figure 4 first shows that pattern at the port level. Ports with stronger local nodes are also more likely to show wider built-space diffusion. In the port-level screen, stronger near-port VIIRS growth is strongly associated with stronger mid-field built-space growth (
,
,
). This is the clearest positive relationship in the wider-field diagnostics. It suggests that once ports begin to diverge in the strength of local port node intensification, they also begin to diverge in the physical reorganization visible across the surrounding settlement field.
The corresponding population relationships are much weaker. Near-port VIIRS growth is weakly negatively associated with mid-field population growth (, , ), and it has essentially no relationship with outer-field population growth (, , ). These estimates are comparative rather than substantive evidence of population decline: stronger local activity gains do not line up with equally strong demographic absorption across the surrounding settlement field.
The nearby city system screen points in the same direction. Ports with stronger near-node VIIRS growth tend to sit in wider secondary-agglomeration fields: near-port VIIRS is positively associated with the number of secondary agglomerations within 100 km (, , ).
Here too, the built-space signal is clearer than the population signal. Near-port VIIRS is directionally positively related to secondary-agglomeration built-space growth (, , ), while the corresponding relationship for secondary-agglomeration population growth is weak (, , ). These estimates are more modest than the mid-field built-up result, but they point in the same direction. The same port-level ordering that distinguishes stronger and weaker nodes therefore travels more clearly through nearby built-space uptake than through nearby demographic absorption.
The settlement field evidence adds a third layer to the same pattern.
Table 5 shows that nighttime light primacy declines by 0.052 on average (
,
), while population primacy is essentially unchanged (
,
,
). In practical terms, the activity field becomes less dominated by the single host settlement after the financing anchor, whereas the population field remains much more stable. This is consistent with visible activity spreading across the surrounding settlement field even where the residential hierarchy changes little.
The hierarchy is visible in the diagnostics themselves, not only in the narrative summary. In
Table 5, the nighttime light primacy row and the secondary-center count row capture outward activity reallocation; the mid-field and secondary-center built-space rows capture wider built-space uptake and restructuring of the surrounding settlement field; and the population primacy row together with the mid-field and secondary-center population rows show that demographic transmission is weaker and less systematic.
The port-level, nearby-center, and settlement field screens all point to a diffusion hierarchy across response layers. Node activity intensifies first. Built-space uptake, reduced activity primacy, and nearby-center uptake follow as signs of restructuring across the surrounding settlement field. Demographic absorption remains slower and less systematic.
These patterns suggest that wider diffusion is real but partial: some gains move beyond the immediate port zone, yet outward diffusion is more evident in activity and built-space uptake than in population. The next section examines cross-port variation in second-stage diffusion.
3.4. Cross-Port Divergence in Second-Stage Diffusion
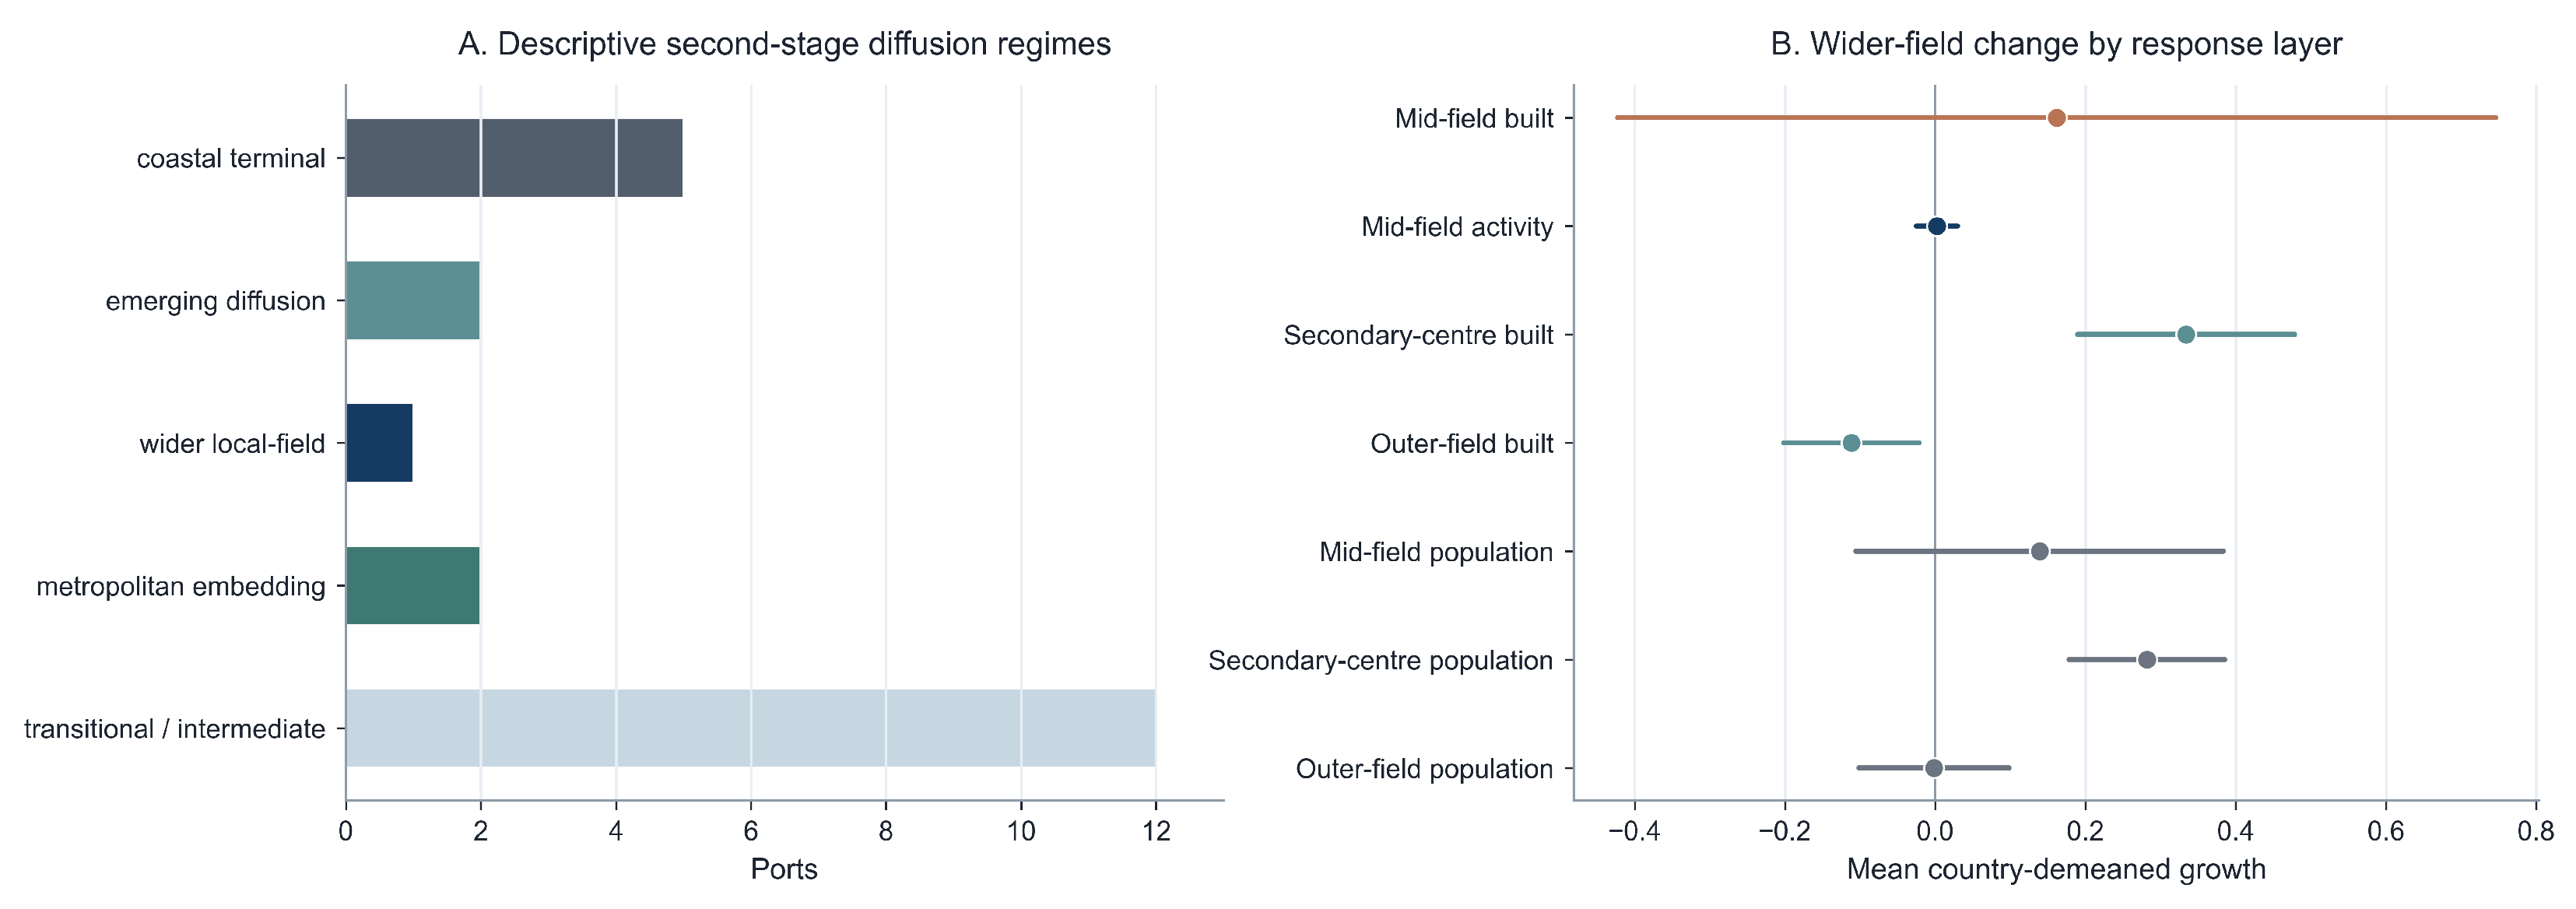
A descriptive typology summarizes the remaining variation in second-stage diffusion across the full sample.
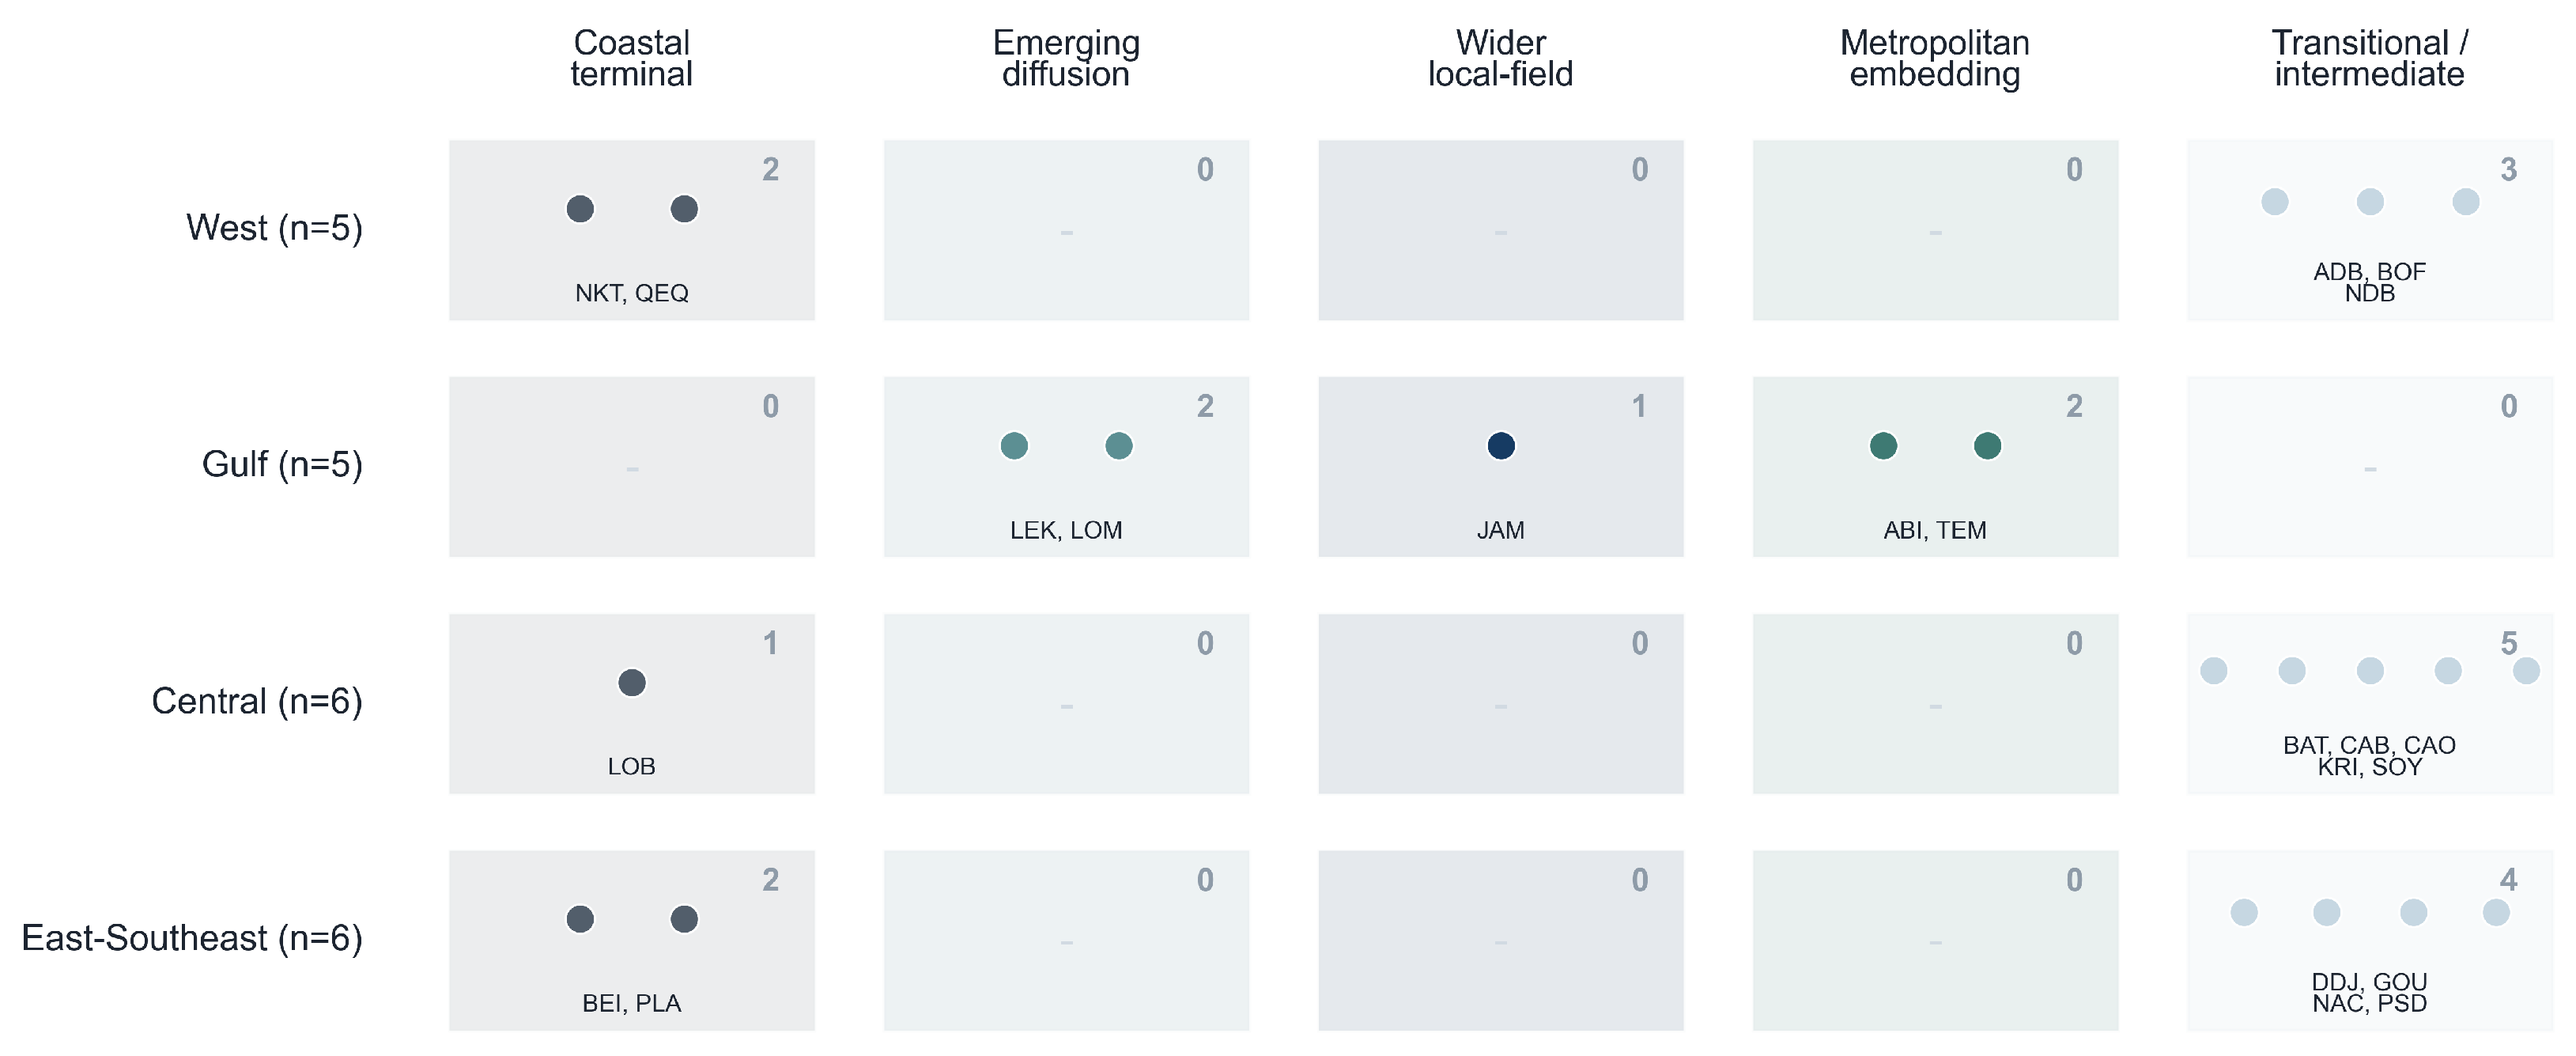
Table 6 lays out those patterns directly. The headline reading still focuses on coastal terminals, emerging diffusion cases, and wider local-field cases, but the table also reports metropolitan embedding and transitional cases. Under the current rule set, five ports read as coastal terminals, two as emerging diffusion cases, one as a wider local-field case, two as metropolitan embeddings, and the remaining 12 occupy the transitional middle. The internal composition of this group is itself diverse: some ports show measurable local intensification without any wider-field signal in the coarse remote-sensing screens, while others show a signal in one response layer without carrying through to built-space or secondary centers.
The rules are descriptive rather than algorithmic. Coastal terminals combine strong local activity with little or no mid-field built-space uptake and weak nearby-center uptake. Emerging diffusion cases show strong local activity with positive mid-field built-space uptake but not yet settled wider-field movement. Wider local-field cases combine strong local activity with clearer mid-field and outer-field or secondary-center built-space uptake. Metropolitan embeddings capture cases in which local thickening is absorbed inside a large, already multi-node urban field rather than appearing as clean outward spread from the port itself.
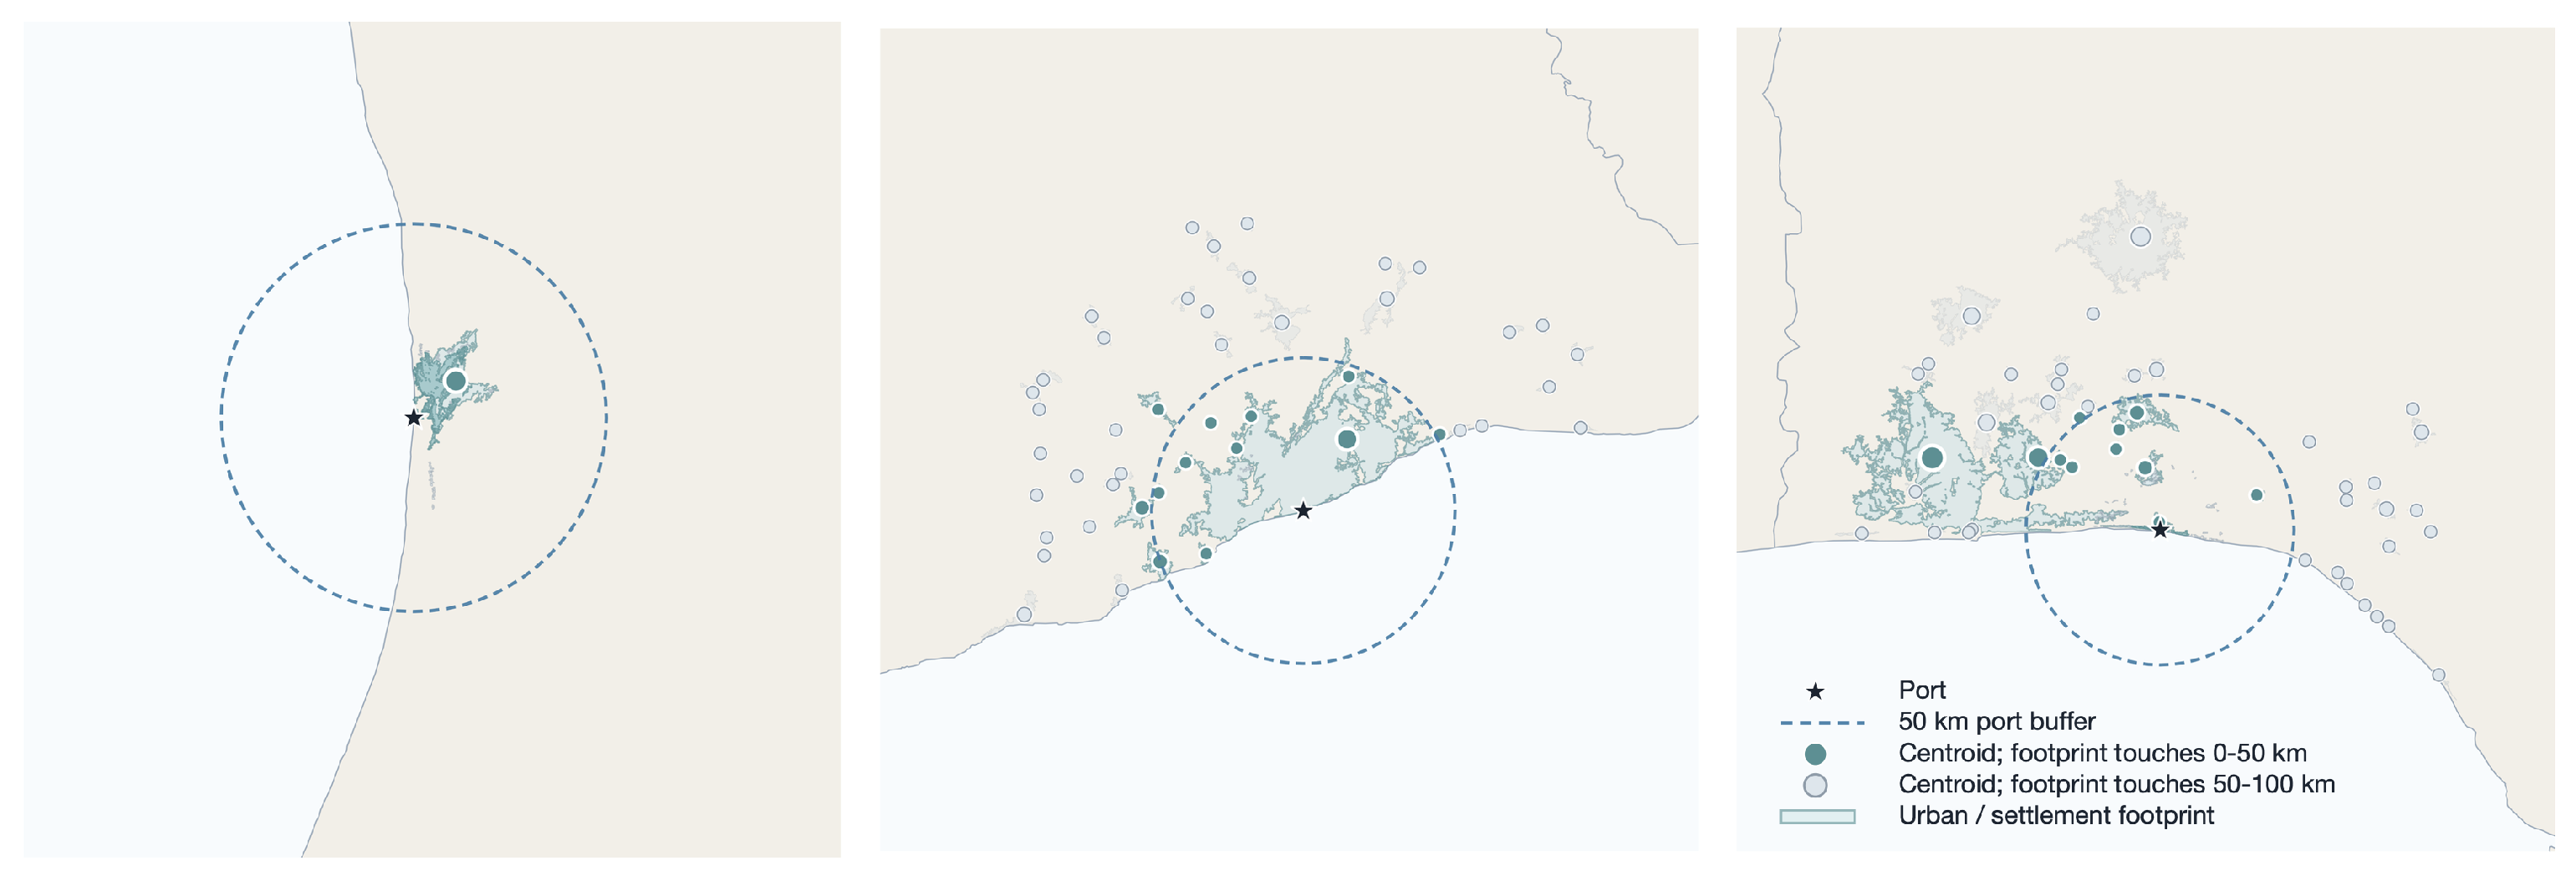
Figure 5 then gives those grouped readings a concrete spatial form. “Nouakchott” is the clearest coastal terminal profile: local activity is strong, but mid-field and secondary-center uptake remain thin. “Jamestown” is the clearest wider local diffusion profile: strong local activity is paired with stronger mid-field and secondary-center built-space uptake. “Lekki” sits between those poles as an emerging diffusion case, with mid-field outward movement but less settled outer-field transmission. “Abidjan” remains informative as a textual metropolitan side case because it shows how strong local thickening inside a large pre-existing urban field need not produce equally strong wider outward diffusion.
These cases illustrate the grouped patterns; the next screens describe how that same divergence lines up with project form, site logic, and transport context across the broader sample.
The typology remains descriptive. The next three screens provide bounded cross-port comparisons for project form, site logic, and transport context.
Project form is one descriptive screen. Descriptive patterns suggest that new-build projects tend to show larger 0–5 km built-space uptake than retrofit or equipment-only projects, although the small sample prevents formal testing.
Site logic is a second descriptive screen. Detached ports retain a stronger terminal-only profile, embedded single-edge ports show stronger nearby land uptake, and wider local-field settings show stronger activity thickening and concentration.
Figure 6 maps these diffusion regimes onto the coastal geography of the sample, showing that coastal terminals are not confined to a single region.
Road networks are the third and most bounded screen. The transport evidence is most informative when it is separated into a coarse historical corridor baseline and a present-day transmission structure. The historical gROADS layer is less informative about immediate node-side built-space uptake. Stronger near-field inherited road stock is instead associated with weaker 0–5 km built-space uptake (, ). It is more informative for second-stage spread: ports with stronger outer-field inherited corridor baselines show stronger later activity-footprint expansion (, ), and more outward historical road geometry also aligns with stronger later footprint growth (, ).
The FRST paved/unpaved screens sharpen that pattern. Among ports already showing strong local activity, higher near-port paved share is associated with stronger mid-field built-space diffusion (
,
) and stronger mid-field VIIRS diffusion (
,
), while more outward-radiating paved structure is associated with stronger outer-field built-space diffusion (
,
).
Table 7 groups that transport context across the retained 22-port sample, and
Appendix A lists the port abbreviations used there. Across these screens, local gains travel farther where they connect to stronger corridor baselines and more outward-facing present-day road fields, although the available road layers leave the timing of later road strengthening unresolved.
Project form, site logic, and road networks each capture a different aspect of heterogeneity in second-stage transmission. Project form is most informative for immediate built-space uptake, site logic for how gains are absorbed within the coastal field, and road networks for whether already-active gains remain locally locked or begin to travel outward. None of these screens identifies a single mechanism.
4. Discussion
4.1. Response Sequence Across Activity, Built-Space, and Population
The results reported above suggest a consistent sequencing across response layers. Node-centered activity intensifies first; built-space uptake and nearby-center growth follow as signs of land-use reorganization; demographic absorption remains the slowest and least systematic layer. Because most treated projects are embedded in pre-existing coastal urban fields, this intensification thickens an existing node instead of creating detached urban formations [
3,
4].
This ordering is most consistent with a transmission ladder that extends the regionalization logic familiar from port system research [
12,
13]: operational gains at the terminal precede spatial reorganization of the surrounding corridor, but that reorganization is not automatic. The gap between NTL-based activity and demographic change also aligns with earlier remote-sensing findings in which nighttime lights respond earlier and more sharply than population to local economic change [
26,
27]. For port project evaluation, these three layers carry distinct developmental meanings and should be assessed separately. A project can intensify node performance without reorganizing the surrounding settlement field, and visible near-port success—whether in activity or built-space—does not yet demonstrate that wider territorial change has taken hold.
This pattern matters especially for the African coastal context. Unlike Asian or European port expansion that often deepens already-mature urban-industrial corridors, most of the ports studied here enter medium-sized or smaller coastal urban systems where agglomerations often fall below one million population. In such settings, the transmission ladder’s three layers—activity, built-space, and population—can remain decoupled for longer, and the risk of reading near-port activity as evidence of wider territorial transformation is especially high [
20].
4.2. Agglomeration Embedding and Node Reinforcement
Most treated port infrastructure projects are embedded in, or lie immediately adjacent to, existing coastal urban formations. By 2020, 20 of 22 treated ports are either already inside an Africapolis agglomeration or within 5 km of one; only Kribi and Goubet appear clearly detached. The near-port response documented in
Section 3.1 therefore usually occurs inside a pre-existing coastal urban field.
Nor is this merely a megacity story: 16 of 22 treated ports are associated with agglomeration contexts below one million population, and only one port is attached to a 5 million+ agglomeration. Much of the observed intensification is occurring in medium-sized and smaller coastal urban systems, where port infrastructure projects can thicken an existing node without necessarily producing metropolitan-scale expansion.
Site logic distinguishes how these gains are absorbed. Detached ports retain a stronger terminal-only profile, embedded single-edge ports show stronger nearby land uptake, and wider local-field settings show stronger activity thickening and concentration, echoing the port–city interface literature that treats coastal morphology as a conditioning feature rather than a neutral backdrop [
3,
4]. Project form also matters descriptively: new-build projects tend to show larger immediate built-space uptake than retrofits, consistent with the physical footprint expected from greenfield construction, although the small sample prevents formal testing. The dominant pattern, however, is not greenfield urban creation but the thickening of existing coastal nodes.
4.3. Corridor Connectivity, Settlement Structure, and Diffusion Outcomes
The distance gradient itself confirms that port-led change is strongest at the node. The more revealing question is why the same node intensification is accompanied by wider diffusion in some settings but not in others.
Road networks provide the most informative screen. Outward diffusion is not associated with how much road stock sits immediately beside the node: inherited near-field road density is negatively related to 0–5 km built-space uptake (
) because already well-connected nodes were already built up before the investment. It is instead associated with outward-facing structure. Among ports that already intensified locally, a higher near-port paved share goes with stronger mid-field built-space (
) and activity (
) diffusion, more outward-radiating paved structure goes with stronger outer-field built-space diffusion (
), and stronger inherited outer-field corridors go with stronger later footprint expansion (
). The picture is consistent across the historical and present-day road layers: local gains tend to be associated with wider diffusion where corridor baselines are stronger, and tend to remain locally concentrated where they are weaker [
7,
14].
Settlement structure provides a second, complementary screen. Ports with stronger near-node activity tend to sit in fields with more secondary agglomerations within 100 km (), and the diffusion that does occur is clearer in built-space than in population. Mid-field built-space growth is strongly associated with near-port activity (), while the corresponding population association is weak and directionally negative (). Secondary-center built-space uptake shows a positive but more modest association (), while secondary-center population growth is essentially unrelated (). Consistent with this, ports whose surrounding fields contain more secondary agglomerations more often appear among the emerging-diffusion and wider-local-field cases, while ports facing an effectively empty shoreline tend to remain coastal terminals or transitional cases.
These patterns should be regarded as an exploratory and interpretive contribution rather than a conclusive explanation of the processes involved. Taken together, the road and settlement structure evidence points to a descriptive regularity: across these 22 ports, wider diffusion tends to appear where local intensification coincides with outward-facing corridor structure and an existing secondary-center skeleton, and tends to stall where those structures are absent [
5]. This is a descriptive pattern rather than a causal claim. The correlations are cross-port and cannot rule out that ports, corridors, and centers were all sited together for the same reasons [
21].
4.4. Scope and Implications
The within-site contrast removes region-wide trends but cannot partition the observed reconcentration among co-located infrastructure, resource extraction, or broader urbanization. The wider-field associations are therefore best read as the combined signature of a coastal investment complex rather than a port-only effect. Larger recorded commitments are directionally associated with stronger local intensification, but with only 18 ports reporting values, a genuine scale effect cannot be ruled out; operational data—throughput, cargo volumes, berth capacity—are unavailable on a comparable basis and remain a priority for data collection.
Chinese financing provides the bounded project universe and common temporal anchor for this analysis, not a claim about uniquely Chinese mechanisms [
16]. Stronger conclusions will require comparative project universes beyond a single financing source, throughput data beyond remote sensing, and time-varying road layers that distinguish inherited access from later improvement.
For port project evaluation in medium-sized African coastal systems, the findings carry a cautionary implication: visible near-port intensification—brighter lights, a thicker built edge—is the most common outcome of port investment and the least informative about wider territorial success. Impact assessment should track the conditional layers (mid-field built-space uptake, secondary-center growth) rather than relying on node-level activity alone. Port investments are more likely to generate wider diffusion when paired with corridor strengthening and when a candidate receiving center already exists.
5. Conclusions
Across the 22-project sample, the clearest post-commitment change is a concentrated node-level intensification within 0–10 km, followed by conditional and selective outward diffusion. Activity responds first and most sharply; built-space uptake follows with the largest physical footprint; population absorbs more slowly. Most projects thicken existing coastal nodes instead of generating detached urban formations. The observed sequencing—activity, then built-space, then population—carries distinct evaluative implications. For externally financed port projects in medium-sized African coastal systems, visible near-port success in activity or built-space does not demonstrate that wider territorial diffusion has taken hold.
Chinese financing is used here as a project universe and temporal anchor, not as a claim about country-specific mechanisms [
16]. Extending the analysis to comparative financing sources, operational throughput data, and time-varying road layers is the natural next step. The core finding is that port infrastructure projects are associated with spatial change moving at markedly different speeds, and that wider diffusion should not be assumed from local node performance alone.