Skip to Content
LandLand
  • Article
  • Open Access

27 June 2026

Uneven Efficiency Penalties of Industrial Land Bias: Evidence from Coastal and Border Cities in China


and
School of Public Administration and Policy, Renmin University of China, Beijing 100872, China
*
Author to whom correspondence should be addressed.

Abstract

Industrial land bias is a persistent outcome of China’s land allocation system, but why its efficiency penalty differs across cities remains insufficiently explained. This study examines this unevenness by linking land allocation, population density, and city type heterogeneity within a unified framework. Using panel data for 281 prefecture-level and above cities in China from 2010 to 2022, we combine two-way fixed effects estimation with robustness checks, dynamic panel analysis, transmission channel tests, subsample comparison, and interaction models. Results show that industrial land bias significantly reduces urban land economic efficiency, with the strongest penalty after a one-year lag. Population density is an important spatial transmission channel: industrial land bias lowers density mainly by expanding built-up land faster than population concentration. The penalty is the largest in border cities, smaller in coastal cities, and statistically insignificant in general cities. The negative effect weakens as the secondary industry share increases, suggesting that local production capacity helps absorb industrial land expansion. The contribution of this study is to explain why the same industrial land bias generates uneven efficiency penalties across coastal, general, and border cities, providing evidence for place-sensitive land supply policies.

1. Introduction

Urban land allocation is a major instrument through which local governments shape economic development. This role is especially pronounced in China, where public ownership of urban land and local control over land use rights make land supply closely connected with infrastructure financing, investment attraction, industrial expansion, and urban spatial development [1]. A persistent outcome is a dual-track land supply pattern. Industrial land is often supplied at relatively low prices to attract manufacturing investment, while commercial and residential land is more tightly supplied and priced at higher levels to generate fiscal revenue [2,3]. This arrangement helped support rapid industrialization, but it also created an efficiency problem. When scarce urban construction land is allocated disproportionately to industrial use, the relevant question is not only how much investment is attracted, but how much economic output is generated per unit of urban land.
The efficiency cost of distorted land allocation is now well documented. At broader urban and regional scales, land resource misallocation reduces productivity by distorting factor allocation, weakening innovation incentives, and slowing structural upgrading, with consequences for green total factor productivity, inclusive green growth efficiency, and industrial transformation [4,5,6]. Within the industrial land system, low-priced industrial land and industrial land dependence reduce efficiency by encouraging land-extensive expansion, weakening the disciplining role of land prices, and allowing less productive land users to remain in place [7,8,9]. These studies establish the average efficiency loss associated with land distortion. They also point to an unresolved issue: the magnitude of this loss varies with land market institutions, regional conditions, industrial structures, city types, and stages of development [10,11,12]. Yet this variation is often treated as a supplementary heterogeneity result. Less is known about why a specific and persistent form of land distortion—industrial land bias—is converted into different levels of economic efficiency loss across cities.
Explaining this unevenness requires attention to how industrial land is absorbed by the urban economy. Industrial land becomes productive only when it is effectively taken up by the local economy. Its economic return depends on the presence of firms, jobs, infrastructure, services, market demand, population concentration, and production linkages that can support its effective use. More broadly, the socioeconomic effects of land use change are shaped by regional functions, policy orientations, factor flows, and spatial linkages [13]. Where such absorptive capacity is weak, industrial land expansion may translate more into spatial expansion than into economic concentration. The efficiency cost of industrial land bias is therefore shaped not only by the industrial land share itself, but also by the spatial development context in which this land is converted into productive urban capacity.
The coastal–border contrast provides a useful setting for examining this issue. Coastal cities have long served as the main spatial carriers of China’s export-oriented industrialization, port-based growth, global market integration, and market-oriented urban development. They have also been central to studies of land finance, industrial land supply, and urban land efficiency. Border cities have received less attention, although they occupy an important position in national spatial governance. They are not only local economies, but also nodes of land border opening, cross-border exchange, ethnic region development, territorial security, and regional coordination. Their strategic functions may justify infrastructure investment, land preparation, and industrial platform construction. However, strategic importance does not necessarily create thick local markets, stable population concentration, or strong productive absorption. Border cities therefore provide a critical setting for examining when industrial land supply becomes productive urban capacity and when it becomes an efficiency burden.
This study examines the effect of industrial land bias on urban land economic efficiency across coastal, general, and border cities in China. The comparison is designed to capture how the same land supply bias operates under different spatial development contexts. Coastal cities represent market-integrated and agglomeration-based openness; border cities represent land border openness and strategic spatial functions; general cities provide a broader reference group with more mixed development trajectories. Using panel data for 281 prefecture-level and above cities from 2010 to 2022, the analysis first estimates the average efficiency penalty of industrial land bias, then examines population density as a spatial transmission channel, and finally compares how this penalty varies across city types and industrial structure conditions.
This study contributes to the literature in three ways. First, it moves the analysis of industrial land bias beyond the estimation of an average efficiency effect and treats the unevenness of this effect as the main object of explanation. Second, it links land allocation to the spatial organization of urban activity by examining population density as a transmission channel between industrial land bias and urban land economic efficiency. Third, it places coastal, general, and border cities in a unified framework, showing how the efficiency penalty of industrial land bias is differentiated by spatial development contexts and bringing border cities into the study of industrial land governance.

2. Theoretical Analysis and Research Hypotheses

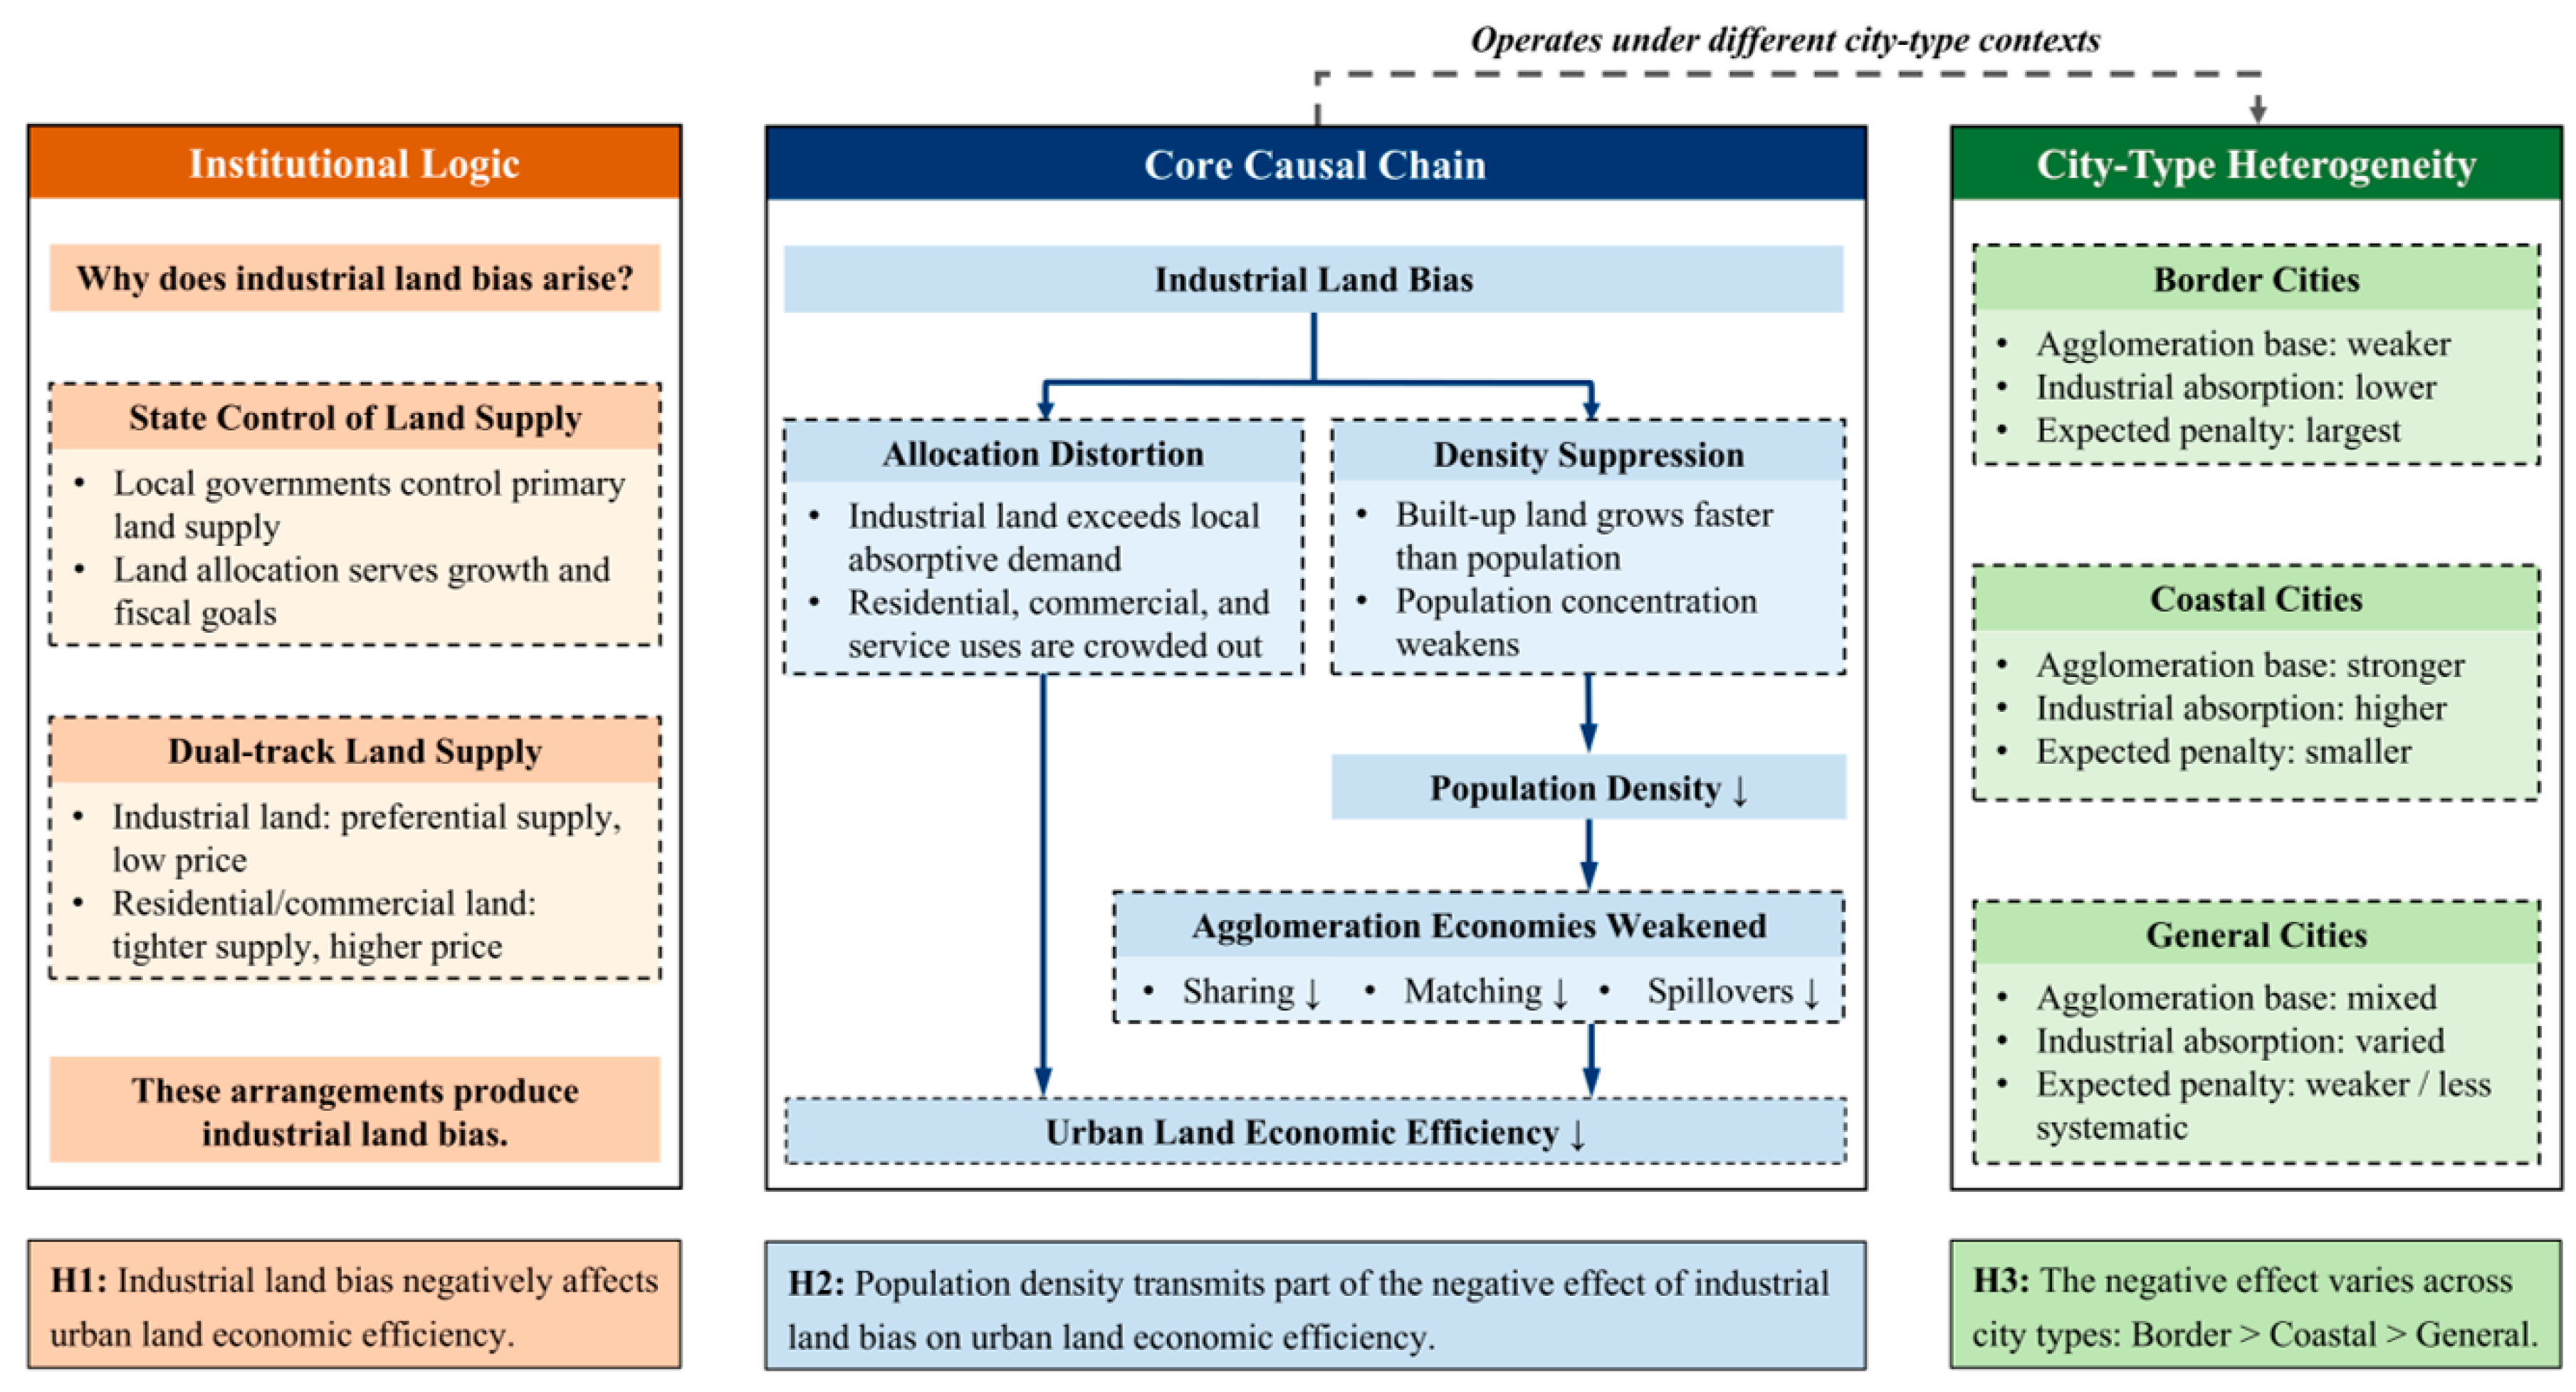
Land allocation affects urban economic efficiency because urban land is scarce and its productivity depends on how firms, workers, infrastructure, and market interactions are organized within limited space. This section develops the theoretical analysis in three steps. Section 2.1 explains why a land allocation pattern biased toward industrial uses may reduce urban land economic efficiency. Section 2.2 explains why population density can serve as a spatial transmission channel. Section 2.3 explains why this penalty may differ across coastal, general, and border cities. Figure 1 summarizes the conceptual framework.
Figure 1. Theoretical framework. Solid arrows indicate hypothesized directional pathways among the main analytical components. Downward arrows (↓) indicate expected decreases in the corresponding variables or mechanisms. The dashed arrow indicates that the proposed pathways operate under different city-type contexts. Source: drawn by the authors.

2.1. Industrial Land Bias and Urban Land Economic Efficiency

Urban land economic efficiency is first an allocation problem. Since construction land is scarce and different urban functions compete for locations, the economic return to land depends on whether valuable urban space is occupied by activities that can make productive use of accessibility, infrastructure, labor markets, suppliers, consumers, and other location-specific advantages. In a price-mediated land market, land rents capitalize these advantages and help allocate scarce space toward higher-valued uses [14].
This allocative discipline is weakened when land supply is shaped by administrative and fiscal incentives. In China, local governments control the primary market for urban land use rights and use land supply to attract investment, support industrialization, finance infrastructure, and sustain local growth. Low-priced industrial land and development zone construction have long been part of interjurisdictional competition for manufacturing investment [15]. Land finance further connects land leasing, infrastructure spending, local borrowing, and urban expansion into a self-reinforcing development cycle [1]. Industrial land transfers therefore reflect firms’ demand for production space, but they are also shaped by fiscal incentives, land price gaps, budget arrangements, and local development strategies [16].
Industrial land can raise land productivity when it is absorbed by productive firms and supported by supplier networks, skilled labor, capital investment, and technological spillovers. In this case, industrial agglomeration may improve urban land use efficiency through labor market pooling, input sharing, capital externalities, and knowledge diffusion [17]. The efficiency problem begins when industrial land supply grows beyond the local economy’s capacity to convert it into output, employment, and production linkages. Low-priced or administratively allocated industrial land can lower land use costs for land-extensive activities, weaken market selection, and allow low-productivity firms or low-end industries to occupy scarce urban space [6,18].
Industrial land bias may therefore reduce urban land economic efficiency by creating a mismatch between land allocation and productive demand. Construction land committed to weakly absorbed industrial uses is less available for residential, commercial, service, innovation, or mixed urban functions that may generate stronger economic interactions and higher returns. The penalty is larger where construction land is scarce and alternative uses have greater economic value. A more market-oriented industrial land allocation can partly restore price-based selection and improve land use efficiency, further indicating that biased industrial land supply may impose an allocative penalty [19]. This logic yields Hypothesis 1:
H1. 
Industrial land bias has a negative effect on urban land economic efficiency.

2.2. Population Density as a Spatial Transmission Channel

Industrial land bias may reduce land economic efficiency through the intensity with which urban space is used. A land use structure tilted toward industrial space often expands through development zones, industrial parks, and fringe area growth. These areas can support production, but they usually require large parcels and may remain weakly connected to housing, services, local consumption, and everyday urban interactions. When industrial land expansion does not generate comparable employment growth, residential settlement, or service provision, the urban land base expands faster than the concentration of people and activities.
This mechanism links industrial land bias to population density. Land use structures differ in their capacity to accommodate residents, jobs, services, and consumption, so changes in land use composition can reshape density dynamics [20]. Urban land expansion that outpaces population growth turns land growth into spatial dilution rather than urban concentration [21]. This issue is particularly relevant in China, where land consumption has often grown faster than population and land population coordination has become central to urban sustainability [22]. Density decline is closely tied to the relative growth of urban land, population, and economic activity, while land financialization can further encourage spatial expansion without equivalent population urbanization [23,24].
Population density matters because proximity is a condition under which agglomeration economies operate. Concentrated people and activities allow infrastructure and intermediate inputs to be shared more efficiently, deepen labor and supplier markets, improve matching, and facilitate knowledge transmission [25,26]. These mechanisms help convert urban concentration into productivity gains, although their magnitude varies across places and sectors [27]. If industrial land bias enlarges built-up space without generating comparable population and activity concentration, it weakens the density conditions that support land productivity.
Population density therefore provides a spatial channel linking industrial land bias to urban land economic efficiency. Industrial land bias may lower density by expanding the construction land base and by reducing the relative space available for land uses that support residence, services, and local interaction. Lower density can then weaken the agglomeration basis of land productivity. This spatial logic yields Hypothesis 2:
H2. 
Population density constitutes a spatial transmission channel linking industrial land bias to lower urban land economic efficiency.

2.3. Uneven Efficiency Penalties Across City Types

The efficiency penalty of industrial land bias depends on the spatial development context in which land allocation takes place. Industrial land can generate high economic returns when it is supported by labor markets, supplier networks, infrastructure, capital investment, and sustained demand. Its efficiency cost increases when land supply expands faster than the local economy’s capacity to transform industrial space into output, employment, production linkages, and population concentration.
This variation is closely related to the uneven strength of agglomeration economies. Urban concentration raises productivity through sharing, matching, and learning, yet the return to concentration changes with city size, industrial composition, firm characteristics, city hierarchy, and development zone conditions [28,29,30]. Cities with stronger labor pools, thicker markets, and denser production networks are better able to convert industrial land into operating economic activity. Cities with weaker agglomeration foundations face a greater risk that industrial expansion enlarges the built-up land base without forming comparable concentration of firms, workers, services, and local demand. In such settings, the efficiency loss comes from both land being tied to weakly productive uses and the erosion of the spatial concentration that supports urban productivity.
Industrial structure further shapes the strength of this penalty. Industrial land performs better when it is embedded in a production base capable of generating output, employment, supplier interaction, capital accumulation, and technological spillovers. When local industry is land-intensive, weakly diversified, or poorly connected to wider production networks, additional industrial land is more likely to remain weakly absorbed. The economic return to industrial land therefore depends on the local production structure and on the ability of the city to integrate land supply with industrial activity [17,31,32].
Coastal cities generally have stronger market access, larger labor pools, more developed production networks, and better infrastructure. These conditions strengthen their capacity to absorb industrial land into productive systems. At the same time, high land values increase the opportunity cost of excessive industrial land when it competes with residential, commercial, service, and innovation-related functions. Industrial land bias is therefore expected to impose an efficiency penalty in coastal cities, although their stronger agglomeration foundations may limit the magnitude of this penalty.
Border cities face a more constrained development context. Their strategic functions in land border opening, cross-border exchange, regional coordination, and territorial connectivity can encourage land preparation and industrial platform development. Yet many border cities have thinner markets, weaker population concentration, and narrower industrial bases. Industrial land expansion in these cities is more likely to precede the formation of firms, workers, services, and local demand. Under these conditions, additional industrial land may enlarge urban space without creating sufficient productive concentration, leading to a stronger efficiency penalty.
General cities are more internally diverse. Some are increasingly connected to expanding metropolitan regions and have improving industrial foundations, while others experience slower population growth, weaker market access, or land expansion ahead of economic activity. These mixed trajectories may offset one another in the average relationship, making the efficiency penalty weaker or less systematic than in coastal or border contexts. This reasoning leads to the following hypothesis:
H3. 
The negative effect of industrial land bias on urban land economic efficiency varies across city types, with the largest estimated penalty expected in border cities, a smaller penalty in coastal cities, and a weaker or less systematic penalty in general cities.

3. Research Design

3.1. Study Area and City Type Classification

This study uses prefecture-level and above cities in mainland China as the unit of analysis. To examine whether the efficiency penalty of industrial land bias varies across spatial development contexts, we distinguish three city types: coastal, general, and border cities.
The classification is based on official administrative standards. Coastal cities are identified according to HY/T 094—2022, Coastal Administrative Areas Classification and Codes, which provides the official classification of coastal administrative areas in China [33]. Border cities are identified from the official list of China’s land border counties, banners, county-level cities, and municipal districts [34]. General cities are defined as the remaining cities that are neither included in the coastal classification nor identified as border cities under this procedure.
A small number of prefecture-level cities have both coastal and land border attributes. To maintain a mutually exclusive classification, these cities are assigned according to their dominant spatial development orientation. Dandong and Fangchenggang are coded as coastal cities because they are included in HY/T 094—2022 and their development conditions are strongly linked to sea access, port functions, coastal logistics, and marine-oriented industrial activity [33]. Accordingly, the border city category refers to cities whose development context is shaped primarily by land border location.
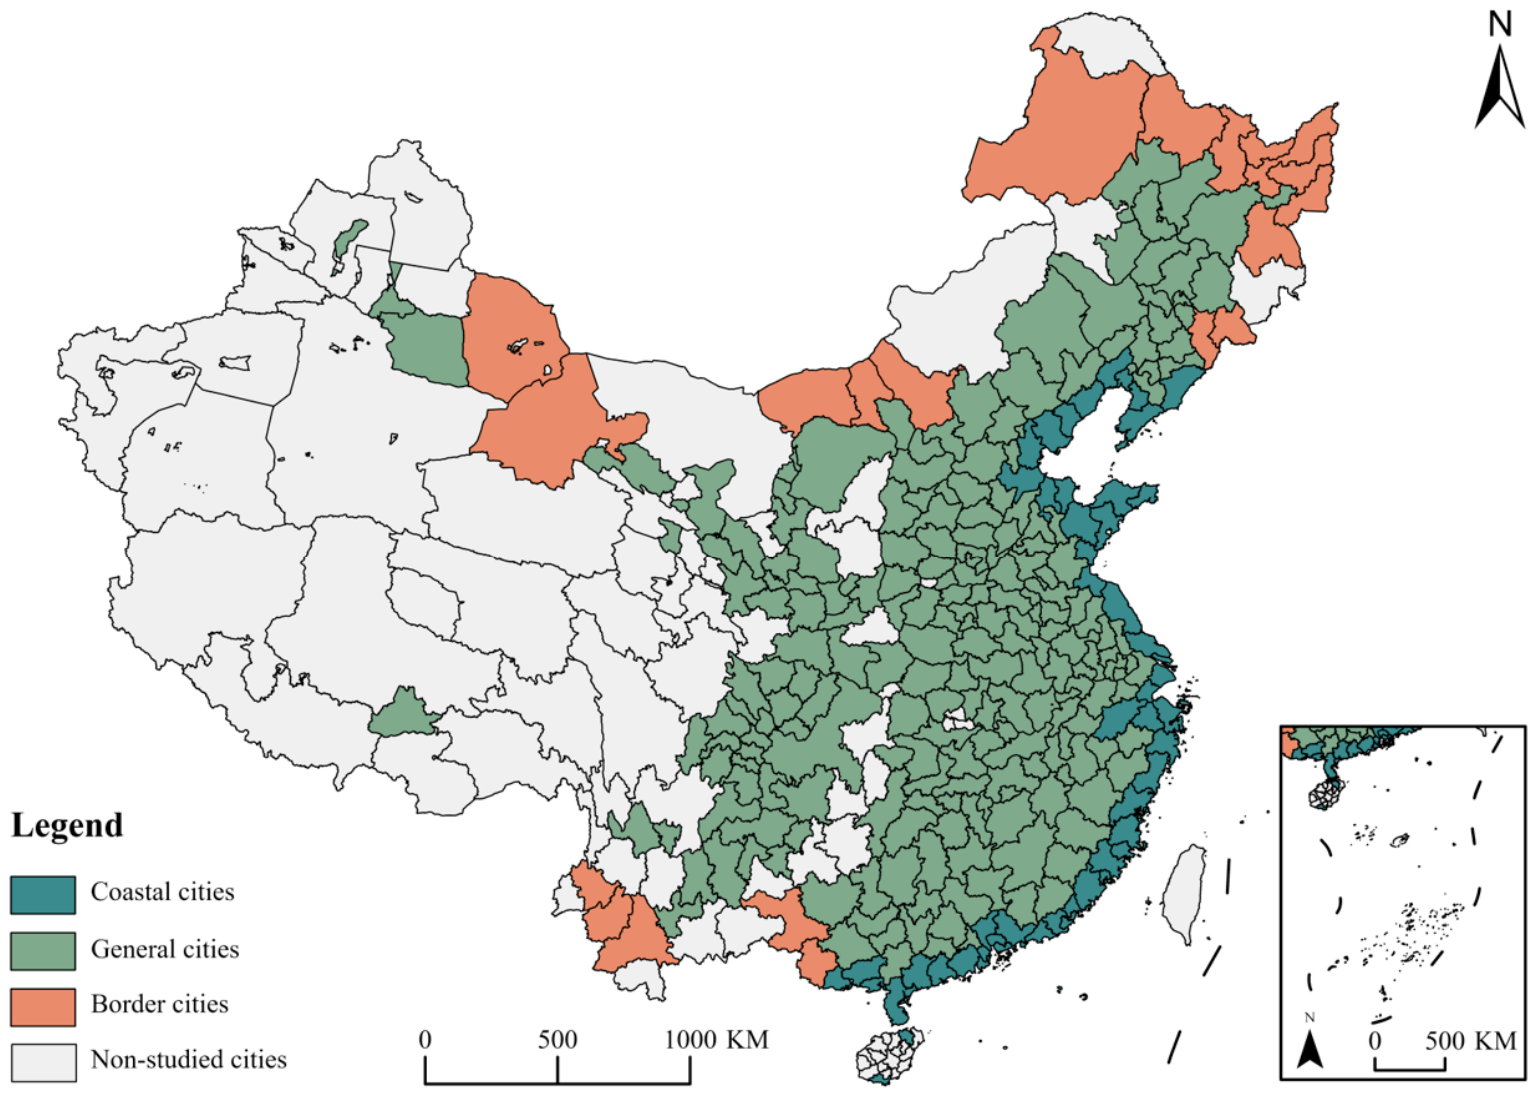
Figure 2 maps the final estimation sample by city type.
Figure 2. Final estimation sample and city type classification. Cities included in the estimation sample are classified as coastal, general, or border cities. Excluded cities are shown separately because they do not meet the data completeness and temporal continuity requirements. Source: drawn by the authors.

3.2. Variable Definition and Measurement

The theoretical framework motivates four key empirical measures: urban land economic efficiency, industrial land share, population density, and secondary industry share. This section defines these variables and explains how they are constructed from city-level statistical data. Detailed construction procedures, transformations, data sources, and descriptive statistics are reported in Table 1.
Table 1. Construction process and descriptive statistics of variables.

3.2.1. Dependent Variable: Urban Land Economic Efficiency (ULEE)

The dependent variable is urban land economic efficiency (ULEE), measured as real GDP per unit of urban construction land area [11,35,36]. This indicator links city-level economic output to the stock of urban construction land and captures the economic return generated by each unit of construction land. Throughout the empirical analysis, ULEE refers to the economic output intensity of urban construction land.

3.2.2. Core Explanatory Variable: Industrial Land Share (ILS)

The core explanatory variable is industrial land share (ILS), calculated as industrial land area divided by total urban construction land area [31]. It measures the share of construction land allocated to industrial use. A higher ILS indicates a more industrial-oriented land use structure and captures industrial land bias in the allocation of urban construction land.
The China Urban Construction Statistical Yearbook reports industrial land as a distinct category within urban construction land. The dataset distinguishes industrial land from other construction land categories, including residential land, commercial and service land, public facilities, roads, green space, logistics and warehousing land, and municipal utilities. The industrial land category itself is reported as an aggregate item and is not further disaggregated by industrial sector, technology intensity, pollution intensity, clean industry composition, or output generated on industrial land. In the empirical analysis, ILS is used to measure the share of construction land allocated to industrial use.

3.2.3. Transmission Channel Indicator: Population Density (PD)

Population density (PD) is measured as urban population per unit of built-up area. It captures the demographic intensity of built-up urban space and describes population concentration within the urban land base. Population density is commonly used to examine the relationship among demographic urbanization, urban land expansion, and land use structure [20]. It is also closely related to local demand, service provision, firm location, and density economies [37].
Since PD reflects both population scale and built-up land area, the density channel analysis further separates its population and land area components.

3.2.4. Moderating Variable: Secondary Industry Share (SecShare)

Secondary industry share (SecShare) is defined as the value added of the secondary industry divided by GDP. It measures the relative weight of secondary sector activity in the local economy. Production structures differ in land requirements, factor combinations, and output capacity, and these differences are closely associated with urban land use performance [38].
SecShare enters the interaction model to examine whether the estimated effect of ILS on ULEE varies with the relative weight of secondary industry. The variable captures the aggregate economic weight of secondary sector activity.

3.2.5. Control Variables

The benchmark regressions include city-level controls that may affect the economic productivity of urban construction land. These controls capture differences in market access, fiscal and institutional conditions, local demand, population scale, factor supply, financial resources, digital connectivity, and transport accessibility across cities [37,39].
Openness (OPEN) captures external economic connection. Government intervention (GI) reflects public expenditure relative to the size of the local economy. Consumption vitality (CV) captures local demand conditions. City size (CS) controls for population scale. Human capital (HC) captures the supply of higher-educated labor. Financial development (FD) reflects the availability of local financial resources. Digital economy (DE) captures the penetration of digital infrastructure, and transport infrastructure (TI) controls for intra-urban road provision.

3.2.6. Descriptive Statistics

Table 1 summarizes the variables used in the empirical analysis, including their definitions, construction procedures, data sources, and summary statistics.
Table 2 compares the initial conditions of coastal, general, and border cities in 2010. It reports group means and p-values from Welch’s t-tests for pairwise differences. The comparison shows that the three city types differ in several baseline characteristics, reflecting their distinct positions in China’s urban system and providing descriptive support for the subsequent city type heterogeneity analysis.
Table 2. Baseline characteristics by city type in 2010.

3.3. Model Specification

The empirical analysis follows the three hypotheses developed in Section 2. We first estimate the average effect of ILS on ULEE and then examine whether this effect is robust to alternative measurement, sample adjustment and dynamic panel estimation. We next examine PD as a spatial transmission channel and further separate this channel into its population and land area components. Finally, we assess whether the estimated effect varies across city types and whether it changes with the relative weight of secondary industry.
Throughout the empirical analysis, i and t index cities and years, respectively. In following equations, ULEE it and I L S i t denote city-year observations of ULEE and ILS. and X i t denotes the vector of previously defined control variables, while X i t D denotes the reduced control set used in the density channel specifications. The fixed-effects specifications include city and year effects, denoted by μ i and λ t , respectively. Standard errors are clustered at the city level.

3.3.1. Benchmark Model

To test Hypothesis 1, we begin with a two-way fixed effects model:
ULEE it = β 0 + β 1 ILS it + γ X it + μ i + λ t + ε it
The coefficient of interest is β 1 . It estimates how ULEE changes with ILS within cities after controlling for city fixed effects, year fixed effects, and time-varying city characteristics. Since ULEE is log-transformed and ILS is measured in percentage points, β 1 gives the approximate percentage change in ULEE associated with a one-percentage-point increase in ILS. A negative estimate of β 1 would be consistent with Hypothesis 1.
Industrial land may affect land economic efficiency with a delay, because supplied industrial land takes time to be developed, occupied by firms, and translated into production outcomes. We therefore replace current ILS with its one-, two-, and three-year lagged values to examine whether the estimated effect appears immediately or with a delay [40]. Year-specific marginal effects are further estimated by interacting ILS with year indicators.

3.3.2. Robustness and Dynamic Panel Checks

We conduct two robustness checks before addressing potential dynamic panel concerns. First, the dependent variable is replaced by real non-agricultural GDP per unit of built-up area, which changes both the output numerator and the land denominator [41]. Second, Beijing, Shanghai, Tianjin, and Chongqing are excluded from the sample to reduce the influence of potentially influential observations associated with centrally administered municipalities.
Potential endogeneity may arise if urban land economic efficiency is persistent over time, or if previous efficiency conditions influence subsequent industrial land allocation. To mitigate these concerns, we estimate a dynamic panel model using system GMM:
ULEE it = δ 0 + δ 1 ULEE i , t 1 + δ 2 ILS it + ψ X it + μ i + λ t + ζ it
The lagged dependent variable captures the dynamic adjustment of ULEE, while internal instruments generated from the panel structure are used to mitigate concerns about persistence and potential reverse causality. We report the Arellano–Bond tests for AR(1) and AR(2) serial correlation and the Hansen J test for instrument validity.

3.3.3. Population Density Channel

Hypothesis 2 proposes PD as a spatial transmission channel linking ILS to ULEE. The channel analysis proceeds in three steps. First, Equation (1) is re-estimated using the reduced control set X i t D , so that the main effect is evaluated under the same control structure used in the density channel specifications. Second, we estimate whether ILS affects PD:
P D i t = π 0 + π 1 I L S i t + π X i t D + μ i + λ t + u i t
Third, PD is added to the ULEE equation:
U L E E i t = ω 0 + ω 1 I L S i t + ω 2 P D i t + ω X i t D + μ i + λ t + ξ i t
The channel interpretation focuses on π 1 in Equation (3) and ω 2 in Equation (4). A negative estimate of π 1 indicates that ILS is associated with lower PD, while a positive estimate of ω 2 indicates that higher PD is associated with higher ULEE after controlling for ILS and the reduced control set. When PD is added to the ULEE equation, the coefficient on ILS captures the remaining effect after accounting for PD. This specification provides evidence on whether the empirical pattern is consistent with a density-based transmission channel.
Because PD is constructed from population and built-up area, we further separate the density response into its population-side and land area-side components. The component regressions are specified as:
Y i t = ρ 0 + ρ 1 I L S i t + ρ X i t D + μ i + λ t + e i t ,       Y i t { C S i t , B U A i t , S M D i t }
where B U A i t denotes log-transformed built-up area. S M D i t is defined as:
S M D i t = B U A i t C S i t
Since both BUA and CS are log-transformed, SMD measures the relative expansion of built-up area over population size. A larger SMD indicates that built-up urban space expands more strongly than the urban population, implying a lower degree of population concentration within the built-up land base. This decomposition helps identify whether the density response is driven mainly by population change or by built-up area expansion.

3.3.4. City Type Heterogeneity

To test Hypothesis 3, the benchmark model is estimated separately for coastal, general, and border cities:
U L E E i t = β 0 g + β 1 g I L S i t + γ g X i t + μ i + λ t + ε i t g ,       i g ,       g { c o a s t a l , g e n e r a l , b o r d e r }
The subsample estimates allow the coefficient on ILS and the effects of the control variables to vary across city types. This specification is used to compare how the estimated efficiency penalty of ILS appears under different spatial development contexts. As an additional check within each city type, we also interact year indicators with selected 2010 city characteristics to examine whether the subsample estimates are sensitive to group-specific initial condition paths.
We further examine whether the density channel pattern differs across city types. Equation (3) is estimated separately for coastal, general, and border cities to assess the response of PD to ILS within each subsample. We also estimate component regressions for CS and BUA by city type, which helps distinguish whether the density response is driven mainly by population change or by built-up area expansion. SMD is used in the full-sample decomposition as a compact summary of the relative movement between built-up area and population size, while the city type analysis reports CS, BUA, and PD directly.

3.3.5. The Role of Secondary Industry Share

SecShare is used to examine whether the estimated effect of ILS changes with the relative weight of secondary sector activity. Before constructing the interaction term, SecShare is mean-centered:
S e c S h a r e i t c = S e c S h a r e i t S e c S h a r e ¯
The interaction model is specified as:
U L E E i t = α 0 + α 1 I L S i t + α 2 Sec S h a r e i t c + α 3 ( I L S i t × Sec S h a r e i t c ) + θ X i t + μ i + λ t + ε i t
With mean-centered SecShare, α 1 represents the estimated effect of ILS when SecShare is at its sample mean. The interaction coefficient α 3 indicates how the estimated effect of ILS changes with SecShare. The conditional marginal effect of ILS is:
U L E E i t I L S i t = α 1 + α 3 S e c S h a r e i t c
A positive estimate of α 3 indicates that the negative effect of ILS becomes weaker as SecShare increases. To reduce concerns about contemporaneous correlation, we also replace current SecShare with its one-year lagged value.
Finally, PD and the ILS–SecShare interaction are included in the same specification:
U L E E i t = τ 0 + τ 1 I L S i t + τ 2 Sec S h a r e i t c + τ 3 ( I L S i t × Sec S h a r e i t c ) + τ 4 P D i t + τ X i t D + μ i + λ t + ε i t
This integrated specification places PD and the ILS–SecShare interaction in the same model to examine whether the conditional effect of ILS with respect to SecShare remains after accounting for the density channel. This helps distinguish the density-based transmission channel from the sectoral condition under which the efficiency penalty varies.

3.4. Data Sources and Processing

The data are compiled from the China City Statistical Yearbook and the China Urban Construction Statistical Yearbook. The former provides city-level socioeconomic indicators, while the latter provides urban construction, land use, built-up area, population, and infrastructure indicators. The two yearbook series are matched at the prefecture-level city-year level.
The sample covers 2010–2022, the period for which the variables required in the empirical analysis can be most consistently matched across the two yearbook series. Earlier years contain more missing observations for several urban construction and land use indicators, while post-2022 data do not yet provide comparable coverage for the full estimation sample. This sample window therefore provides the most complete and continuous panel for the empirical specifications used in this study.
The final sample includes 281 prefecture-level and above cities. Cities with severe missing values or major administrative boundary adjustments during the sample period are excluded to maintain temporal consistency. Nominal GDP and other monetary variables are converted to 2010 constant prices using provincial CPI indices. Short gaps in the data are filled by linear interpolation when adjacent observations are available. Continuous variables are winsorized at the 1st and 99th percentiles to reduce the influence of extreme values. The variable-level implementation of these procedures, including the transformations applied to each variable, is reported in Table 1.

4. Empirical Results

4.1. Benchmark Estimates

Table 3 reports the benchmark estimates from the two-way fixed effects specifications. Column (1) uses contemporaneous ILS. The coefficient on ILS is negative and statistically significant (−0.0031, p < 0.05), indicating a negative estimated effect of ILS on ULEE after controlling for city fixed effects, year fixed effects, and time-varying city characteristics.
Table 3. Benchmark estimates of the effect of industrial land share on urban land economic efficiency.
Columns (2)–(4) replace contemporaneous ILS with its one-, two-, and three-year lagged values. The coefficients remain negative and statistically significant across all lag specifications. The largest point estimate appears for the one-year lag (−0.0034, p < 0.01), followed by the two-year lag (−0.0031, p < 0.01) and the three-year lag (−0.0024, p < 0.05).
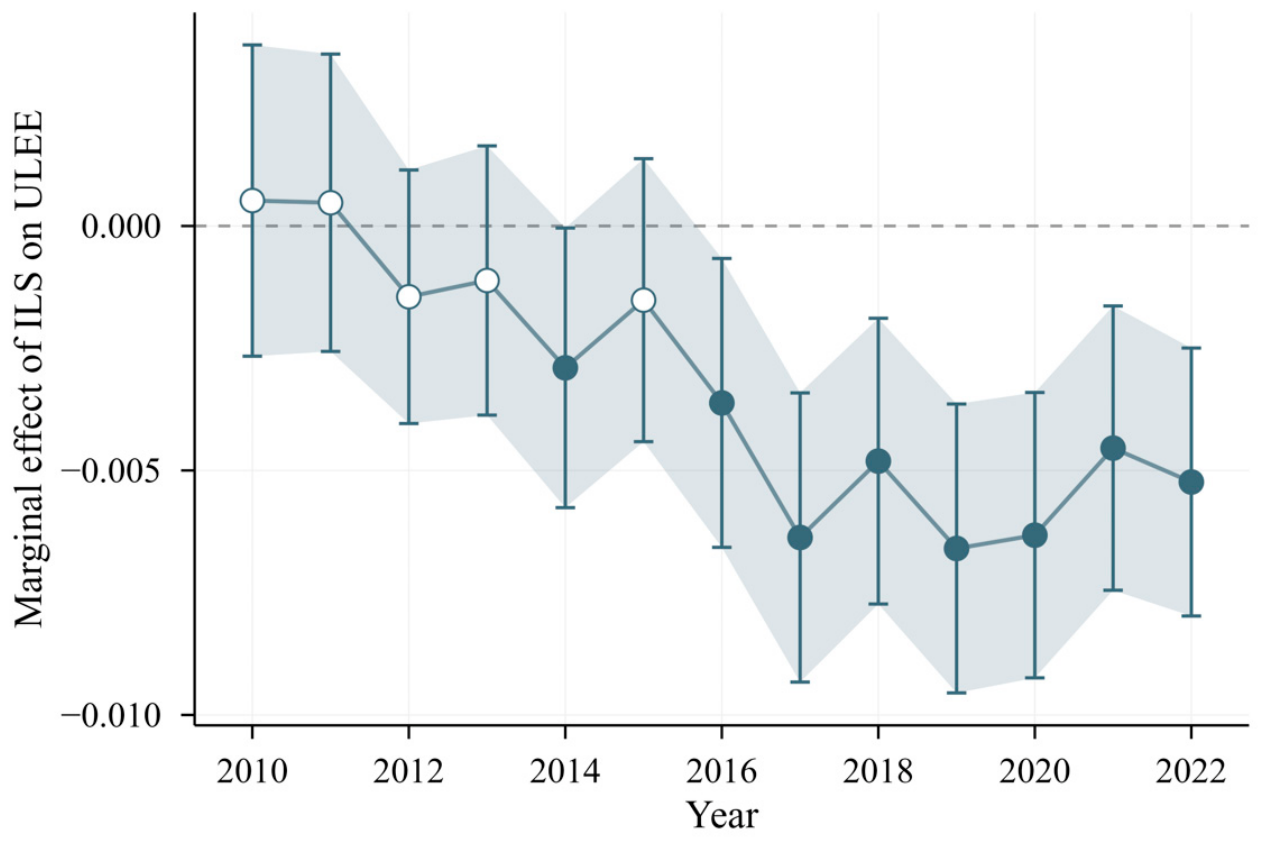
Figure 3 reports the year-specific marginal effects of ILS on ULEE. The estimates are close to zero and statistically insignificant in 2010 and 2011. They become negative from 2012 onward and are consistently negative and statistically significant from 2016 to 2022. The year-specific estimates therefore show a more stable negative pattern in the later years of the sample. These results support Hypothesis 1, which predicts a negative effect of industrial land bias on ULEE.
Figure 3. Year-specific marginal effects of industrial land share on urban land economic efficiency, 2010–2022. The figure reports the estimated marginal effects of ILS on ULEE by year, based on a two-way fixed effects model with year-specific ILS interactions. Vertical bars and the shaded band indicate 95% confidence intervals. Filled markers denote estimates statistically significant at the 5% level, while hollow markers denote estimates not statistically significant at the 5% level. The dashed horizontal line marks zero. Source: drawn by the authors.

4.2. Robustness Checks and Dynamic Panel Estimates

Table 4 reports the robustness and endogeneity checks. Columns (1) and (2) show the results after changing the outcome measure and adjusting the sample composition. Column (1) replaces the benchmark ULEE measure with real non-agricultural GDP per unit of built-up area. The coefficient on ILS remains negative and statistically significant (−0.0028, p < 0.05). Column (2) excludes Beijing, Shanghai, Tianjin, and Chongqing, and the coefficient remains negative (−0.0030, p < 0.10).
Table 4. Robustness checks and dynamic panel estimates.
Column (3) reports the system GMM estimate. The coefficient on lagged ULEE is positive and statistically significant, showing strong persistence in ULEE. The coefficient on ILS remains negative and statistically significant (−0.0025, p < 0.05). The Arellano–Bond tests indicate first-order but not second-order serial correlation, and the Hansen J test does not reject the validity of the instruments. Overall, the negative estimated effect of ILS is retained across alternative measurement, sample adjustment, and dynamic panel estimation.

4.3. Population Density Channel

Table 5 reports the population density channel estimates. Column (1) re-estimates the ULEE equation using the reduced control set. The coefficient on ILS remains negative and statistically significant (−0.0033, p < 0.05). Column (2) uses PD as the dependent variable. The coefficient on ILS is negative and statistically significant (−0.0026, p < 0.01). Column (3) adds PD to the ULEE equation. PD is positively associated with ULEE (0.5074, p < 0.01), while the coefficient on ILS becomes smaller in absolute value and statistically insignificant.
Table 5. Population density channel estimates.
Table 6 separates the density response into population and land area components. The coefficient on ILS is not statistically significant when CS is used as the dependent variable. By contrast, ILS is positively associated with built-up area (0.0030, p < 0.01) and SMD (0.0027, p < 0.01). The component estimates therefore point more clearly to the land area side than to the population size side. Taken together, the density channel and component estimates support Hypothesis 2.
Table 6. Components of the population density channel.

4.4. Subgroup Estimates by City Type

Table 7 reports the estimates by city type. In the benchmark subsample estimates, the coefficient on ILS is negative and statistically significant for coastal cities (−0.0058, p < 0.05) and border cities (−0.0149, p < 0.05), but statistically insignificant for general cities. After adding initial condition paths within each city type subsample, the coefficient remains negative and statistically significant for coastal cities (−0.0057, p < 0.05) and border cities (−0.0168, p < 0.05), while the estimate for general cities remains statistically insignificant. Across both specifications, the point estimate is largest in absolute value for border cities. These subsample estimates support Hypothesis 3. The negative effect of industrial land bias is largest in border cities, smaller in coastal cities, and statistically insignificant in general cities. The subsample estimates support the city type ordering predicted in Hypothesis 3.
Table 7. City type estimates of the effect of industrial land share on urban land economic efficiency.
Table 8 reports the density channel estimates by city type. For coastal cities, ILS is positively associated with built-up area and negatively associated with PD, while its coefficient on CS is statistically insignificant. For general cities, only the coefficient on built-up area is weakly significant. For border cities, ILS is negatively associated with PD, while its coefficients on CS and built-up area are statistically insignificant. The estimates show different density response patterns across the three city type subsamples.
Table 8. Components of the density channel by city type.

4.5. Moderating Role of Secondary Industry Share

Table 9 examines whether the estimated effect of ILS changes with SecShare. Because SecShare is mean-centered before constructing the interaction term, the coefficient on ILS refers to the estimated effect when SecShare is at its sample mean. Column (1) uses contemporaneous SecShare. The interaction term is positive and statistically significant (0.0004, p < 0.01). Column (2) replaces SecShare with its one-year lagged value, and the interaction term remains positive and statistically significant (0.0003, p < 0.01). Column (3) further includes PD. The interaction term remains positive and statistically significant (0.0002, p < 0.05), and PD is also positively associated with ULEE. The sign and significance of the interaction term are retained across the three specifications.
Table 9. Interaction between industrial land share and secondary industry share.
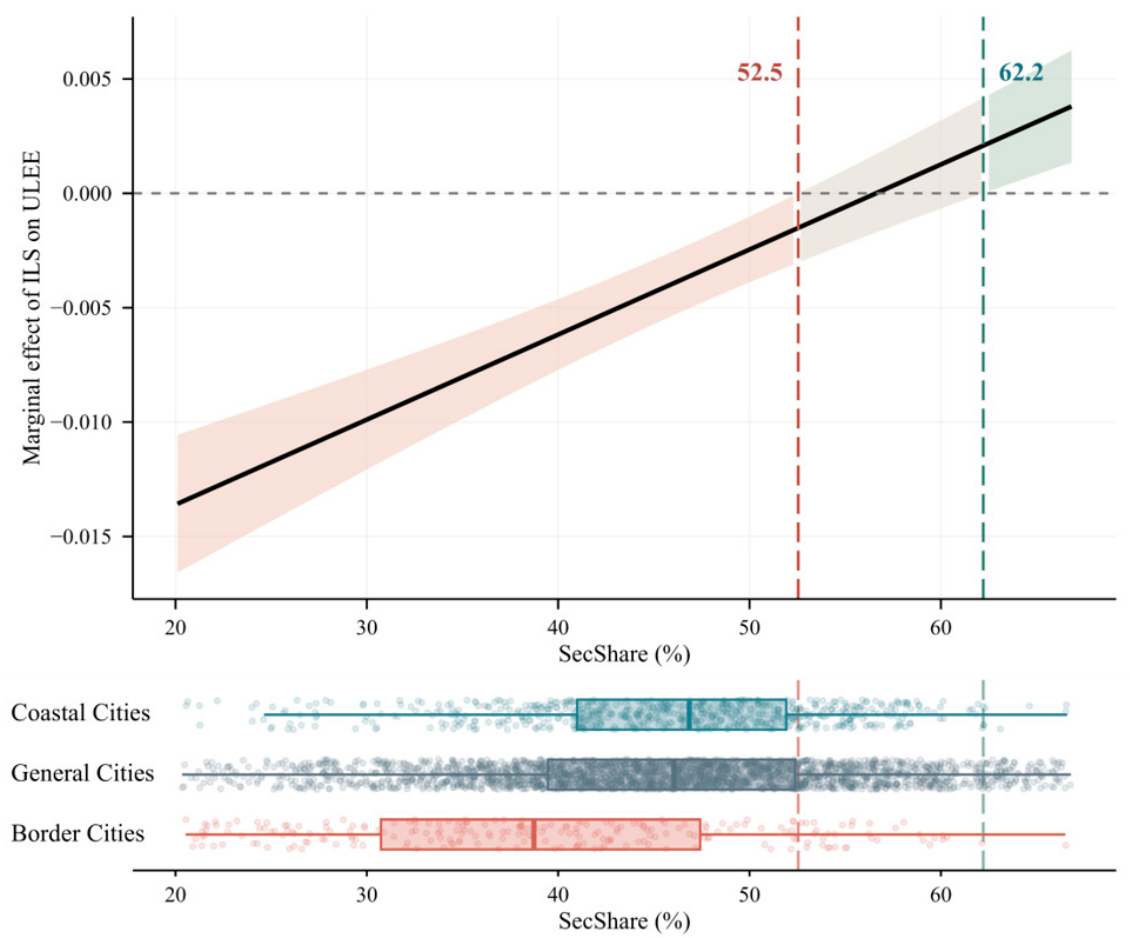
Figure 4 plots the conditional marginal effect of ILS across the observed range of SecShare and compares the distribution of SecShare across city types. The estimated effect is negative and statistically significant when SecShare is below 52.5%, statistically insignificant between 52.5% and 62.2%, and positive and statistically significant above 62.2%. Border cities are more concentrated in the lower range of SecShare, whereas coastal and general cities extend further into the intermediate and upper ranges.
Figure 4. Marginal effect of industrial land share across secondary industry share. The marginal effect plot reports the estimated marginal effect of ILS on ULEE from the interaction model with mean-centered SecShare, with SecShare displayed in its original percentage scale. The shaded area indicates the 95% confidence interval. The vertical dashed lines indicate the Johnson–Neyman thresholds of 52.5% and 62.2%. The distribution plot shows city-year observations and boxplots of SecShare by city type. Source: drawn by the authors.
Table 10 places PD and the ILS–SecShare interaction in the same model. Column (1) reports the main effect estimate using the reduced control set. Column (2) adds PD; the coefficient on PD is positive and statistically significant, while the coefficient on ILS becomes smaller and statistically insignificant. Column (3) includes the ILS–SecShare interaction, which is positive and statistically significant. Column (4) includes both PD and the interaction term. PD remains positive and statistically significant (0.4830, p < 0.01), and the interaction term remains positive and statistically significant (0.0002, p < 0.05). The coefficient on ILS remains negative and statistically significant (−0.0029, p < 0.05).
Table 10. Integrated estimates with population density and secondary industry share moderation.

5. Discussion

5.1. From Average Effects to Uneven Efficiency Penalties

At the average level, the results are in line with a broad literature on land misallocation. Existing studies have traced land misallocation to local government incentives and distorted land pricing [2,3] and have shown that it can constrain industrial upgrading and green productivity [4,6]. Our estimates give this conclusion a direct land economic reading: industrial land bias reduces the economic output generated by each unit of urban construction land.
A more distinctive issue is the unevenness of this penalty. Prior work has examined how industrial land use efficiency and land misallocation effects vary by region, city size, resource dependence, and land market conditions [9,42,43]. This study brings a less examined spatial background into the discussion by comparing coastal, general, and border cities. This classification links heterogeneity to cities’ positions in China’s urban development system, where market access, policy functions, and development conditions shape how industrial land supply is absorbed.
This interpretation connects the average efficiency loss, the density channel, and city type heterogeneity within a single explanation. The benchmark result establishes the average penalty of industrial land bias; the subsequent analyses show how this penalty operates through population density and why it differs across city types. The paper therefore moves from identifying an average efficiency loss to explaining the uneven penalties generated by the same land allocation bias.

5.2. Interpreting the Density Transmission Channel

The density results clarify what kind of efficiency penalty is being observed. The evidence does not suggest that industrial land bias lowers ULEE by reducing urban population size. The component tests point instead to the land side of the density ratio: ILS is not significantly associated with urban population size, but it is positively associated with built-up area and with built-up area scale relative to population size. The efficiency loss is therefore better understood as a process of spatial dilution. Industrial land bias enlarges the construction land base without a parallel increase in the concentration of people and economic activity, thereby lowering the economic output generated by each unit of urban construction land.
This interpretation adds a land use structure explanation to a broader pattern documented in the urban expansion literature. Existing studies have shown that urban land in China and other rapidly urbanizing contexts has often expanded faster than population, producing density decline and weakening land use performance [21,22,23,44]. Those studies establish the prevalence of land population mismatch. The present results identify one land allocation pathway through which such mismatch can arise. When construction land is increasingly directed toward industrial uses, urban space may expand in a form that does not generate comparable residential concentration, service demand, or local market thickness. The mismatch is thus not only a matter of how fast cities expand, but also of what kinds of land uses drive that expansion.
The result also qualifies the role of agglomeration economies in the interpretation of industrial land policy. Agglomeration theory emphasizes that density can raise productivity through labor market matching, input sharing, knowledge spillovers, and other forms of interaction [25,26,27]. These mechanisms, however, are not generated by land expansion itself. They depend on whether firms, workers, services, suppliers, and consumers are sufficiently concentrated within urban space. Industrial land bias can weaken this condition when it produces a larger but thinner built-up area. In this sense, density is not merely a background urban characteristic; it is a spatial condition through which land allocation decisions shape the productivity of urban land.
This spatial reading extends the existing literature on land misallocation by showing that density change is an important spatial process linking land allocation distortions to urban land economic efficiency. Prior studies have mainly explained the costs of land misallocation through distorted land prices, factor misallocation, industrial upgrading, innovation, green total factor productivity, and sustainable development [2,4,6]. The evidence in this study points to a more immediate spatial step in this process. Before industrial land bias is reflected in innovation performance, industrial upgrading, or green productivity, it can reduce ULEE by expanding the land denominator without generating a corresponding concentration of people and economic activity. For this reason, population density is treated here as a spatial transmission channel rather than as a strict mediation mechanism in a narrow causal sense.

5.3. Interpreting the Coastal–General–Border Pattern

Once the density channel is understood as spatial dilution, the city-type results can be interpreted more directly. The larger penalty in border cities does not imply that border location is intrinsically inefficient. Rather, it suggests that industrial land bias becomes more costly when land expansion runs ahead of the local economy’s capacity to absord it. In such contexts, additional industrial land is less likely to be converted smoothly into firms, employment, service demand, and productive linkages, and more likely to dilute the density conditions that support urban productivity. Density loss therefore helps explain the larger penalty in border cities, but it should be understood as part of a broader absorption problem. The key issue is not industrial land expansion itself, but whether the city has sufficient economic concentration and production capacity to turn that expansion into productive urban space.
The border city result is best understood through the gap between strategic land supply and local absorption capacity. Border cities often require port facilities, industrial platforms, and transport infrastructure to support land border opening, cross-border exchange, and territorial connectivity. These investments can expand the physical space for development, but they do not by themselves create productive urban density. Industrial land becomes economically effective only when port functions, industrial demand, urban services, and labor markets reinforce one another within the same local economy [45]. In many border regions, cross-border linkages remain selective and uneven, with stronger connections concentrated around a limited number of nodes [46]. Under these conditions, additional industrial land may increase the built-up area before firms, workers, suppliers, and services are sufficiently anchored.
The difficulty of absorption in border cities can be understood from three connected conditions. The first is a demand constraint. Many border cities have limited domestic market size and are relatively distant from major regional centers. Even when industrial platforms are connected to border ports or transport corridors, the surrounding producer-service base, supplier networks, and local consumption demand are often too thin to support rapid industrial occupation. The second is a factor mobility constraint. Population outflow, aging, and slower inflows of skilled labor and capital weaken the labor market pooling, service demand, and everyday urban interactions through which industrial land is converted into productive activity. The third is a cross-border uncertainty constraint. Cross-border openness may expand development opportunities, but trade flows are often affected by policy changes, customs procedures, geopolitical conditions, and demand fluctuations on both sides of the border. These three conditions mean that industrial land supply in border cities is more likely to be anticipatory rather than demand-led. Land, infrastructure, and industrial platforms may be prepared for strategic connectivity before firm occupation, employment density, supplier linkages, and urban services are fully in place. The larger penalty in border cities therefore does not reflect a simple disadvantage of border location. It reflects a conversion problem: strategic land preparation is more difficult to turn into dense, stable, and locally embedded economic activity.
The SecShare results add a production-side condition to this explanation. The positive interaction between ILS and SecShare indicates that the penalty of industrial land bias weakens where secondary industry has a stronger local weight. This does not imply that a higher secondary industry share is necessarily more advanced or more desirable. Rather, it suggests that industrial land is less costly when it is more closely aligned with the existing production base. Where the secondary sector is thinner, additional industrial land is more likely to be supplied ahead of effective demand and less likely to be converted into output-intensive use. Border cities are more exposed to this problem because many of them combine lower population density, weaker market thickness, and a less developed production base. Their larger penalty therefore reflects two connected forms of mismatch: built-up land expands faster than population concentration, and industrial land supply expands faster than the local production system can productively absorb.
The coastal result points to a different configuration. Coastal cities generally have deeper labor markets, stronger industrial networks, better infrastructure, and more diversified urban functions. These conditions help convert industrial land into output and explain why the estimated penalty is smaller than in border cities. Yet this should not be read as evidence that industrial land bias is harmless in coastal areas. Land scarcity and stronger competition among industrial, residential, commercial, service, and innovation uses raise the opportunity cost of allocating scarce construction land to industrial purposes [47]. The coastal case therefore reveals a different form of land allocation tension: stronger absorption capacity reduces the observed efficiency penalty, while higher land scarcity raises the cost of using scarce urban space for land-extensive industrial functions.
The insignificant estimate for general cities should also be interpreted cautiously. General cities are a broad residual category rather than a homogeneous spatial type. Some may have sufficient demographic and industrial bases to absorb additional industrial land, while others may experience land-extensive growth closer to the border city pattern. These divergent trajectories can offset one another in the average estimate. The result therefore does not show that industrial land bias is irrelevant in general cities. It shows that the penalty depends on whether industrial land expansion is accompanied by density formation, production system absorption, and productive urban functions.
Taken together, the coastal–general–border pattern refines the meaning of industrial land bias. The problem is not industrial land per se, but the conditions under which industrial land is supplied and absorbed. Industrial land bias becomes most costly where it expands the built-up urban base without generating the population concentration, production linkages, and urban functions needed to support land productivity. This place-sensitive interpretation extends existing studies on land misallocation by showing not only that industrial land bias reduces efficiency, but also why the same bias produces uneven penalties across different urban settings.

5.4. Policy Implications for Industrial Land Governance

The empirical results narrow the policy question. Industrial land bias becomes costly when industrial land expansion is weakly absorbed by local firms, workers, services, and production networks. Since this penalty varies across coastal, general, and border cities, industrial land policy should move beyond aggregate quotas or uniform price adjustment. The key margin is how land price, tenure, performance requirements, and renewal rules shape the conversion of industrial land into realized economic output and spatial value.
Industrial land pricing is the first point of adjustment. In China’s land finance system, low-priced industrial land has often supported investment attraction, while commercial and residential land has carried more fiscal returns [1,2]. This weakens price screening and allows land-extensive projects to obtain space before their productivity and local linkages are tested. Correcting excessive underpricing can strengthen land use efficiency, although the effect varies by city and weakens beyond certain thresholds [8]. Price reform should therefore work as a screening device, not as a uniform increase in industrial land prices. It should raise the cost of extensive land occupation while using flexible tenure to reduce the initial payment burden of firms with credible production and upgrading potential.
Recent supply reforms provide the complementary governance tools. Long-term leasing, lease-before-transfer, flexible-term transfer, and standard land transfer make industrial land supply more conditional [48,49]. Their main value is to reduce premature lock-in. Leasing and shorter tenure create an observation period before long-term land use rights are granted; standard land transfer specifies performance conditions at the point of supply. Investment intensity, output per unit of land, employment creation, tax contribution, innovation performance, energy use, environmental standards, and construction progress can then become enforceable conditions rather than formal indicators. This directly responds to the empirical pattern identified in this study: the efficiency cost emerges when expected investment is not converted into actual density and productivity.
The city type results indicate how this policy package should be applied. Border cities require the strongest ex ante demand test and the strictest staged allocation. Their larger efficiency penalty suggests that industrial platforms can expand faster than firms, labor markets, and urban services. For these cities, new industrial land should be supplied in smaller phases, preferably through leasing or lease-before-transfer, and conversion to longer-term land use rights should depend on verified firm occupation, employment density, land output intensity, labor retention, cross-border demand stability, and links with ports, logistics, and urban services. Industrial land prepared for strategic functions should not be evaluated only by its planned platform scale or connectivity role. It should also be assessed by whether it can generate sustained firm operation, local employment, service demand, and production linkages. Idle platform land, weakly occupied parks, and projects with low job creation should face delayed transfer, shortened tenure, performance-based adjustment, or withdrawal.
Coastal cities need a different discipline. Their stronger absorption capacity helps explain the smaller estimated penalty, but land scarcity makes every industrial parcel more costly in opportunity terms. Industrial land competes with housing, producer services, innovation space, public facilities, and ecological uses, and price gaps between industrial and commercial residential land can further distort land allocation under debt and scarcity constraints [47]. Policy should therefore focus on the existing stock. Low-output industrial parcels should be identified through regular performance audits; parcels that no longer meet land output, employment, innovation, or environmental standards should be renewed, consolidated, converted to higher-value industrial functions, or released for compatible urban uses. In coastal cities, industrial land governance is less about adding new industrial space than about ensuring that scarce industrial land remains occupied by firms whose productivity justifies its urban location.
General cities require internal sorting. The insignificant average effect does not provide a basis for a single policy rule. Some general cities still have active manufacturing demand, stable population support, and room for agglomeration; others retain industrial land from earlier expansion cycles with weak density and limited production linkages. The first group can use flexible tenure and standard land transfer to support upgrading firms while keeping performance conditions explicit. The second group should place new industrial land supply under stricter review and shift policy effort toward stock renewal, low-efficiency land redevelopment, and exit mechanisms [50,51,52]. A practical criterion is whether existing industrial land is already generating employment, output, and local linkages. Where it is not, additional industrial land supply is likely to reproduce the same efficiency loss.
The policy implication of this study is therefore a differentiated discipline of industrial land use. Border cities need demand verification before long-term allocation; coastal cities need opportunity cost control and stock renewal; general cities need diagnosis before expansion. Across these settings, industrial land should remain in productive use only when its occupation continues to generate economic output, employment, and spatial value within the urban system.

5.5. Limitations and Future Research

This study has several limitations that point to directions for future research.
First, the dependent variable captures the economic output intensity of urban construction land. By measuring ULEE as real GDP per unit of urban construction land, the analysis focuses on the economic productivity of scarce urban space. This choice is consistent with the land economic efficiency perspective of the paper, but it does not directly measure ecological performance, carbon emissions, social welfare, or inclusive growth. These dimensions are important components of sustainable land use, but they are not captured by the ULEE measure used here. Future research could incorporate undesirable outputs, green total factor productivity, carbon intensity, or distributional indicators to examine whether the uneven penalties identified in this paper also appear in broader assessments of sustainable urban development.
Second, ILS is measured as the share of urban construction land allocated to industrial use. This indicator captures the spatial bias of land allocation, but it cannot distinguish among different types and qualities of industrial land. Industrial parcels may differ in industrial composition, technological intensity, environmental performance, firm quality, operating status, and actual land use intensity. This limitation largely reflects the availability and comparability of city-level land use data. Future studies could link land use records with parcel-level transactions, firm-level output and employment, patent data, energy use, and emissions data to examine whether the efficiency penalty varies with the type, quality, and actual utilization of industrial land.
Third, the density channel is examined at the city level. While the component tests help distinguish the land and population components of density, they cannot reveal the intra-urban forms through which industrial land bias reshapes spatial intensity. Future research could use parcel-level industrial land data, gridded population data, building footprints, commuting flows, and public service accessibility measures to examine whether this process operates through industrial parks, fragmented development, jobs–housing separation, or the delayed redevelopment of old industrial parcels.
Fourth, the empirical strategy helps mitigate potential endogeneity concerns through fixed effects, lagged specifications, robustness checks, and dynamic panel estimation. These approaches strengthen the credibility of the results, although they do not fully replace identification based on clearly defined policy shocks. Such policy-based identification is difficult to implement in the present setting because many industrial land governance reforms have been introduced gradually, implemented with considerable local discretion, and observed over relatively short post-reform periods. Future research could exploit more mature policy settings, where implementation timing, treatment intensity, and pre-treatment trends can be observed more clearly, to provide stronger causal evidence on how industrial land allocation affects ULEE and population density.
Finally, the generalizability of the findings is shaped by China’s land governance system. The mechanisms examined in this study arise in a setting where local governments control the primary land market and have long used industrial land as an instrument for investment attraction, industrial development, and local growth. The results are therefore most directly relevant to institutional contexts in which public authorities play an active role in land allocation and industrial spatial planning. Comparative research across different land tenure regimes, fiscal systems, and planning institutions would help assess whether similar mechanisms operate beyond China.

6. Conclusions

This paper examines how industrial land bias affects the economic efficiency of urban construction land and why this effect differs across coastal, general, and border cities in China. Using panel data for 281 prefecture-level and above cities from 2010 to 2022, the results show that a higher share of industrial land is associated with lower urban land economic efficiency. The estimated penalty is most pronounced after a one-year lag and varies substantially across city types. It is the largest in border cities, smaller in coastal cities, and weaker or less systematic in general cities. These findings indicate that the efficiency cost of industrial land bias cannot be fully understood from the average effect alone.
The density results help explain this uneven pattern. Industrial land bias is associated with lower population density, and the component analysis shows that this relationship is driven more by built-up area expansion than by population decline. The central issue is therefore spatial dilution: industrial land expansion enlarges the urban land base without generating a comparable concentration of people, firms, services, and economic activity. The interaction results further suggest that the penalty is weaker where industrial land is more closely aligned with the existing production structure. Taken together, these findings refine the interpretation of industrial land bias. Its economic cost depends not only on how much land is allocated to industrial use, but also on whether that land can be absorbed into a functioning urban and industrial system.
The results point to a more selective approach to industrial land governance. Industrial land supply should be evaluated by its subsequent use, economic return, and contribution to productive urban concentration, rather than by expansion targets alone. Border cities require stricter demand verification and closer coordination between land preparation, firm entry, employment creation, and urban service provision. Coastal cities should place greater weight on land opportunity costs and the redevelopment of low-efficiency industrial sites. General cities require more differentiated diagnosis before further expansion or restriction. Future research could combine city-level land use data with parcel records, firm-level production and employment data, population mobility, and environmental indicators to examine whether the uneven economic penalties identified here also extend to broader sustainable land use outcomes.

Author Contributions

L.Z.: conceptualization, methodology, formal analysis, data curation, writing—original draft, writing—review and editing, visualization. D.L.: writing—review and editing, supervision, project administration, funding acquisition. All authors have read and agreed to the published version of the manuscript.

Funding

This research was funded by the National Natural Science Foundation of China, grant number 42476247.

Data Availability Statement

The data presented in this study are available on request from the authors.

Conflicts of Interest

The authors declare no conflicts of interest.

References

  1. Gyourko, J.; Shen, Y.; Wu, J.; Zhang, R. Land finance in China: Analysis and review. China Econ. Rev. 2022, 76, 101868. [Google Scholar] [CrossRef] [Scilit]
  2. Huang, Z.; Du, X. Government intervention and land misallocation: Evidence from China. Cities 2017, 60, 323–332. [Google Scholar] [CrossRef] [Scilit]
  3. Han, L.; Kung, J.K.-S. Fiscal incentives and policy choices of local governments: Evidence from China. J. Dev. Econ. 2015, 116, 89–104. [Google Scholar] [CrossRef] [Scilit]
  4. Xie, R.; Yao, S.; Han, F.; Zhang, Q. Does misallocation of land resources reduce urban green total factor productivity? An analysis of city-level panel data in China. Land Use Policy 2022, 122, 106353. [Google Scholar] [CrossRef] [Scilit]
  5. He, Q.; Du, J. The impact of urban land misallocation on inclusive green growth efficiency: Evidence from China. Environ. Sci. Pollut. Res. 2022, 29, 3575–3586. [Google Scholar] [CrossRef] [Scilit] [PubMed]
  6. Peng, S.; Wang, J.; Sun, H.; Guo, Z. How Does the Spatial Misallocation of Land Resources Affect Urban Industrial Transformation and Upgrading? Evidence from China. Land 2022, 11, 1630. [Google Scholar] [CrossRef] [Scilit]
  7. Yang, X.; Zhou, R. The Impact of Industrial Land Dependence on Industrial Land Use Efficiency and Its Heterogeneity: A Panel Test Based on 286 Cities in China. SAGE Open 2025, 15, 21582440251362973. [Google Scholar] [CrossRef] [Scilit]
  8. Qi, Y.; Lin, R.; Zhu, D. Impact of rising industrial land prices on land-use efficiency in China: A study of underpriced land price. Land Use Policy 2025, 151, 107490. [Google Scholar] [CrossRef] [Scilit]
  9. Wang, Q.; Wang, Y.; Chen, W.; Zhou, X.; Zhao, M. Factors affecting industrial land use efficiency in China: Analysis from government and land market. Environ. Dev. Sustain. 2021, 23, 10973–10993. [Google Scholar] [CrossRef] [Scilit]
  10. Liu, Y.; Zhang, Z.; Zhou, Y. Efficiency of construction land allocation in China: An econometric analysis of panel data. Land Use Policy 2018, 74, 261–272. [Google Scholar] [CrossRef] [Scilit]
  11. Liu, S.; Xiao, W.; Li, L.; Ye, Y.; Song, X. Urban land use efficiency and improvement potential in China: A stochastic frontier analysis. Land Use Policy 2020, 99, 105046. [Google Scholar] [CrossRef] [Scilit]
  12. Li, W.; Cai, Z.; Jin, L. Urban green land use efficiency of resource-based cities in China: Multidimensional measurements, spatial-temporal changes, and driving factors. Sustain. Cities Soc. 2024, 104, 105299. [Google Scholar] [CrossRef] [Scilit]
  13. Wang, M.; Huang, X.; Song, Y.; Sun, R. The spatial impacts of multifunctional farmland use transition on the urban-rural income gap: A major function-oriented zoning perspective. Cities 2025, 167, 106385. [Google Scholar] [CrossRef] [Scilit]
  14. Brueckner, J.K. The Structure of Urban Equilibria: A Unified Treatment of the Muth-Mills Model. In Handbook of Regional and Urban Economics; Nijkamp, P., Mills, E.S., Eds.; Elsevier: Amsterdam, The Netherlands, 1987; Volume 2, pp. 821–845. [Google Scholar]
  15. Tao, R.; Su, F.; Liu, M.; Cao, G. Land Leasing and Local Public Finance in China’s Regional Development: Evidence from Prefecture-level Cities. Urban Stud. 2010, 47, 2217–2236. [Google Scholar] [CrossRef] [Scilit]
  16. Cheng, G.; Shu, T.; Chau, K.W. Incentives behind local governments’ industrial land transfers: Evidence from China. Habitat Int. 2025, 162, 103460. [Google Scholar] [CrossRef] [Scilit]
  17. Zhang, W.; Wang, B.; Wang, J.; Wu, Q.; Wei, Y.D. How does industrial agglomeration affect urban land use efficiency? A spatial analysis of Chinese cities. Land Use Policy 2022, 119, 106178. [Google Scholar] [CrossRef] [Scilit]
  18. Yang, J.; Liu, C.; Liu, K. Land marketization and industrial restructuring in China. Land Use Policy 2023, 131, 106737. [Google Scholar] [CrossRef] [Scilit]
  19. Zhang, J.; Xu, R.; Chen, J. Does Industrial Land Marketization Reform Facilitate Urban Land Use Efficiency? Int. Rev. Econ. Financ. 2024, 96, 103609. [Google Scholar] [CrossRef] [Scilit]
  20. Song, X.; Feng, Q.; Xia, F.; Li, X.; Scheffran, J. Impacts of changing urban land-use structure on sustainable city growth in China: A population-density dynamics perspective. Habitat Int. 2021, 107, 102296. [Google Scholar] [CrossRef] [Scilit]
  21. Güneralp, B.; Reba, M.; Hales, B.U.; Wentz, E.A.; Seto, K.C. Trends in Urban Land Expansion, Density, and Land Transitions from 1970 to 2010: A Global Synthesis. Environ. Res. Lett. 2020, 15, 044015. [Google Scholar] [CrossRef] [Scilit]
  22. Wang, Y.; Huang, C.; Feng, Y.; Zhao, M.; Gu, J. Using Earth Observation for Monitoring SDG 11.3.1-Ratio of Land Consumption Rate to Population Growth Rate in Mainland China. Remote Sens. 2020, 12, 357. [Google Scholar] [CrossRef] [Scilit]
  23. Xu, G.; Jiao, L.; Yuan, M.; Dong, T.; Zhang, B.; Du, C. How does urban population density decline over time? An exponential model for Chinese cities with international comparisons. Landsc. Urban Plan. 2019, 183, 59–67. [Google Scholar] [CrossRef] [Scilit]
  24. Ji, Y.; Guo, X.; Zhong, S.; Wu, L. Land Financialization, Uncoordinated Development of Population Urbanization and Land Urbanization, and Economic Growth: Evidence from China. Land 2020, 9, 481. [Google Scholar] [CrossRef] [Scilit]
  25. Duranton, G.; Puga, D. Micro-foundations of urban agglomeration economies. In Handbook of Regional and Urban Economics; Elsevier: Amsterdam, The Netherlands, 2004; Volume 4, pp. 2063–2117. [Google Scholar]
  26. Jofre-Monseny, J.; Marin-Lopez, R.; Viladecans-Marsal, E. The mechanisms of agglomeration: Evidence from the effect of inter-industry relations on the location of new firms. J. Urban Econ. 2011, 70, 61–74. [Google Scholar] [CrossRef] [Scilit]
  27. Puga, D. The magnitude and causes of agglomeration economies. J. Reg. Sci. 2010, 50, 203–219. [Google Scholar] [CrossRef] [Scilit]
  28. Au, C.-C.; Henderson, J.V. Are Chinese Cities Too Small? Rev. Econ. Stud. 2006, 73, 549–576. [Google Scholar] [CrossRef] [Scilit]
  29. Shen, J.; Chen, C.; Yang, M.; Zhang, K. City Size, Population Concentration and Productivity: Evidence from China. China World Econ. 2019, 27, 110–131. [Google Scholar] [CrossRef] [Scilit]
  30. Wang, W. The heterogeneity of agglomeration effect: Evidence from Chinese cities. Growth Chang. 2021, 52, 392–424. [Google Scholar] [CrossRef] [Scilit]
  31. Nie, L.; Ren, Z.; Wu, Y.; Luo, Q. Urban industrial land misallocation and green total factor productivity: Evidence from China’s Yellow River Basin regions. Aust. Econ. Pap. 2024, 63, 646–666. [Google Scholar] [CrossRef] [Scilit]
  32. Li, G.; Shen, Z.; Song, M.; Vardanyan, M. The role of economic land use efficiency in promoting green industrial development: Evidence from China. Ann. Oper. Res. 2025, 347, 87–112. [Google Scholar] [CrossRef] [Scilit]
  33. HY/T 094—2022; Coastal Administrative Areas Classification and Codes. Standards Press of China: Beijing, China, 2022.
  34. China Institute for Vitalizing Border Areas and Enriching the People. List of China’s Land Border Counties (Banners), Cities (Districts). 2022. Available online: https://vbep.muc.edu.cn/info/1055/1622.htm (accessed on 29 May 2026).
  35. Han, W.; Zhang, Y.; Cai, J.; Ma, E. Does Urban Industrial Agglomeration Lead to the Improvement of Land Use Efficiency in China? An Empirical Study from a Spatial Perspective. Sustainability 2019, 11, 986. [Google Scholar] [CrossRef] [Scilit]
  36. Wu, C.; Wei, Y.D.; Huang, X.; Chen, B. Economic transition, spatial development and urban land use efficiency in the Yangtze River Delta, China. Habitat Int. 2017, 63, 67–78. [Google Scholar] [CrossRef] [Scilit]
  37. Kopczewska, K.; Kubara, M.; Kopyt, M. Population density as the attractor of business to the place. Sci. Rep. 2024, 14, 22234. [Google Scholar] [CrossRef] [Scilit] [PubMed]
  38. Wang, Z.; Fu, H.; Liu, H.; Liao, C. Urban development sustainability, industrial structure adjustment, and land use efficiency in China. Sustain. Cities Soc. 2023, 89, 104338. [Google Scholar] [CrossRef] [Scilit]
  39. Xue, D.; Yue, L.; Ahmad, F.; Draz, M.U.; Chandio, A.A.; Ahmad, M.; Amin, W. Empirical investigation of urban land use efficiency and influencing factors of the Yellow River basin Chinese cities. Land Use Policy 2022, 117, 106117. [Google Scholar] [CrossRef] [Scilit]
  40. He, Z.; Nelson, S.; Su, Y.; Zhang, A.L.; Zhang, F. Land Misallocation and Local Public Finance in China; NBER Working Paper 2025; National Bureau of Economic Research: Cambridge, MA, USA, 2025. [Google Scholar]
  41. He, S.; Yu, S.; Li, G.; Zhang, J. Exploring the influence of urban form on land-use efficiency from a spatiotemporal heterogeneity perspective: Evidence from 336 Chinese cities. Land Use Policy 2020, 95, 104576. [Google Scholar] [CrossRef] [Scilit]
  42. Liu, K.; Du, R.; He, J. Fluctuating Development Traits of Industrial Land Mismatch and Its Influence on Urban Ecological Modernization. Land 2025, 14, 1035. [Google Scholar] [CrossRef] [Scilit]
  43. Liu, S.-C.; Lin, Y.-B.; Ye, Y.-M.; Xiao, W. Spatial-temporal characteristics of industrial land use efficiency in provincial China based on a stochastic frontier production function approach. J. Clean. Prod. 2021, 295, 126432. [Google Scholar] [CrossRef] [Scilit]
  44. Chen, H.; Yu, Q.; Bakker, M.M.; Fan, L.; Liang, S.; Wu, W.; Yang, P.; Carsjens, G.J. Divergent patterns of settlement expansion and population growth in China. J. Land Use Sci. 2026, 21, 76–94. [Google Scholar] [CrossRef] [Scilit]
  45. Dong, M. Exploring spatial development and planning in border port cities through the lens of port-industry-city interaction. Mod. Urban Res. 2026, 41, 33–38, 45. [Google Scholar] [CrossRef]
  46. Li, Y.; Zhang, P.; Chu, N.; Liu, W.; Yang, Q. Evolution of economic linkage network structure in China-Russia border regions. Sci. Geogr. Sin. 2023, 43, 1921–1933. [Google Scholar] [CrossRef]
  47. Tian, C.; Luan, W.; Wang, X.; Jin, X. Land price, government debt, and land-use efficiency in the coastal cities of China under the constraint of land scarcity. J. Environ. Manag. 2024, 371, 123144. [Google Scholar] [CrossRef] [Scilit] [PubMed]
  48. Ministry of Natural Resources of the People’s Republic of China. Notice on Improving Industrial Land Supply Policies to Support the Real Economy; Natural Resources Development No 201 [2022]; Ministry of Natural Resources of the People’s Republic of China: Beijing, China, 2022. Available online: https://app.www.gov.cn/govdata/gov/202212/22/495480/article.html (accessed on 5 June 2026). (In Chinese)
  49. Beijing Municipal Commission of Planning and Natural Resources. Notice on Issuing the Guidelines on Lease-Before-Transfer Supply of Industrial Land in Beijing (Trial Version). Available online: https://ghzrzyw.beijing.gov.cn/zhengwuxinxi/zcwj/gfxwj/202405/t20240513_3677901.html (accessed on 5 June 2026). (In Chinese)
  50. Zhang, S.; Cao, X. Redevelopment policy of inefficiently used land and high-quality development of urban economy: An empirical study based on double machine learning. J. Shanxi Univ. Financ. Econ. 2025, 47, 1–13. (In Chinese) [Google Scholar] [CrossRef]
  51. Lu, H.; Zhu, L.; Yan, Y.; Zhu, B.; Jiang, C. A research on new industrial land planning: The perspective of policy design. Urban Plan. Forum 2020, 5, 39–46. (In Chinese) [Google Scholar] [CrossRef]
  52. Zeng, P.; Li, J. Study on the active mechanism and optimization path of the policy system in stock industrial land regeneration. Mod. Urban Res. 2020, 7, 67–74. (In Chinese) [Google Scholar] [CrossRef]
Disclaimer/Publisher’s Note: The statements, opinions and data contained in all publications are solely those of the individual author(s) and contributor(s) and not of MDPI and/or the editor(s). MDPI and/or the editor(s) disclaim responsibility for any injury to people or property resulting from any ideas, methods, instructions or products referred to in the content.

Article Metrics

Citations

Article Access Statistics

Multiple requests from the same IP address are counted as one view.