


Abstract
Soil erosion in arid watersheds poses a significant threat to land productivity, water resources, and long-term sustainability, necessitating spatially explicit and data-driven prioritization frameworks for targeted conservation. This study developed an integrated GIS-based multi-criteria decision-making (MCDM) framework to assess soil erosion susceptibility and prioritize twelve sub-basins (SB) of the Wadi Numan basin (683 km2), Makkah Region, Saudi Arabia. Morphometric analysis was conducted using sixteen parameters derived from a 10 m Digital Elevation Model (DEM), and Land Use/Land Cover (LULC) data were obtained from the Esri Sentinel-2 10 m dataset. Four MCDM techniques—additive ratio assessment (ARAS), complex proportional assessment (COPRAS), multi-objective optimization by ratio analysis (MOORA), and technique for order preference by similarity to ideal solution (TOPSIS)—were applied under the criteria importance through inter-criteria correlation (CRITIC) objective weighting, and their consistency was evaluated using the Spearman correlation coefficient test (SCCT) and the Kendall Tau correlation coefficient test (KTCCT). MOORA achieved the highest consistency for morphometric analysis (SCCT: 0.982; KTCCT: 0.958), while TOPSIS performed best for LULC analysis (SCCT: 0.800; KTCCT: 0.731). The final combined prioritization used MOORA for morphometric analysis and TOPSIS for LULC analysis, with proportional weighting of 72.7% and 27.3%, respectively. The scheme categorized the sub-basins into five levels of soil erosion priority. The composite ranking classified SB-9 and SB-1 under very high priority (25.94%); SB-2 and SB-3 under high priority (6.40%); SB-5, SB-6, and SB-10 under medium priority (36.37%); SB-4 and SB-8 under low priority (18.11%); and SB-11, SB-12, and SB-7 under very low priority (13.18%). This integrated method provides a practical decision-support tool for identifying and managing sub-basins susceptible to soil erosion, thereby promoting the long-term sustainability of land and water resources.
1. Introduction
Soil erosion constitutes a major environmental concern that reduces soil fertility, threatens agricultural sustainability, and endangers water resources in arid regions [1,2]. The productive capacity of these already fragile landscapes may decline rapidly under the combined influence of intense and irregular rainfall, rugged terrain, and unsustainable land-use practices such as overgrazing and deforestation [3,4]. The implications extend beyond agricultural degradation, as they lead to increased sediment transport, reservoir siltation, and a broader decline in watershed condition [5,6].
The prioritization of sub-basins for conservation intervention therefore becomes necessary in areas with limited data availability and restricted resources for large-scale mitigation efforts.
The Wadi Numan basin, located near Makkah in Saudi Arabia, represents such conditions. The basin shows high susceptibility to active sheet, rill, and gully erosion due to its mountainous topography and frequent short-duration rainfall events that generate flash floods [7]. The delineation of erosion-prone zones remains a key concern for environmental planners and water resource managers, as these natural drivers are further intensified by anthropogenic pressures linked to urban expansion and agricultural activities. Recent hydrological investigations reveal the complex basin response to precipitation events, indicating the need for an extensive assessment of erosion susceptibility [8,9,10,11].
In large and difficult-to-access terrains, conventional field-based erosion assessment often proves impractical [12]. The integration of Geographic Information Systems (GIS) and remote sensing (RS) has therefore gained importance [13]. Morphometric parameters derived from Digital Elevation Models (DEMs), such as slope, drainage density, and relief, provide valuable information on watershed hydrological behavior and inherent erosion susceptibility [14]. Horton [15] and Strahler [16,17] established the quantitative basis for such analyses, which remains in use in modern erosion studies [18]. Likewise, Land Use and Land Cover (LULC) patterns exert a direct influence on surface runoff and soil stability and act as key covariates in erosion risk assessment [19,20,21,22].
Multi-Criteria Decision-Making (MCDM) frameworks provide a strong capability for the integration of these diverse spatial datasets into actionable outputs [23,24]. Through the inclusion of multiple factors, MCDM methods establish a systematic and objective approach for ranking sub-basins based on their relative susceptibility. Recent advances have seen the application of methods such as Additive Ratio Assessment (ARAS), Multi-Objective Optimization by Ratio Analysis (MOORA), Complex Proportional Assessment (COPRAS), and Technique for Order Preference by Similarity to Ideal Solution (TOPSIS) in a number of geographical conditions [25]. These four methods were deliberately selected because they represent methodologically distinct algorithmic approaches—MOORA, ARAS, COPRAS, and TOPSIS—enabling a meaningful comparison of how different decision-making logic handles the same spatial dataset [24,25]. The scientific gain of such a comparison lies in identifying which method produces the most consistent and statistically reliable prioritization for each data type (morphometric parameters vs. LULC), thereby providing an evidence-based basis for method selection rather than an arbitrary choice [9,26]. For instance, Shekar et al. [26] utilized these four methods with CRITIC (Criteria Importance Through Intercriteria Correlation) weighting in the Narangi basin, demonstrating the reliability of ensemble MCDM approaches for erosion prioritization.
Similarly to the current study, research in different circumstances established the usefulness of ARAS [27] and TOPSIS [28] for mapping erosion susceptibility, and more extensive uses of MCDM in erosion assessment are still being developed [29,30]. However, selecting a single MCDM method can introduce subjectivity, often challenging the reliability of the resulting prioritization. Although previous research has effectively employed individual MCDM methods for watershed prioritization, the comparative consistency and reliability of different MCDM models within the same complex, arid environment have yet to be explored [31,32,33].
Diakoulaki et al. [34] introduced the CRITIC approach, which minimizes subjective bias and provides an objective method for assessing weights. More recent sensitivity analyses have shown that CRITIC produces more stable weights than entropy-based methods when data is modified, which renders it suitable for erosion studies in data-scarce regions. Studies in arid environments have effectively utilized CRITIC and ARAS for erosion assessment under changing land use conditions, which demonstrates their suitability for use [35].
This study aims to develop an integrated GIS-based MCDM framework for soil erosion susceptibility assessment and sub-basin prioritization in the Wadi Numan basin. The literature reveals two key research gaps: (1) no previous study has systematically compared the consistency of MOORA, TOPSIS, ARAS, and COPRAS under CRITIC objective weighting within the same arid-basin context; and (2) independent validation of MCDM-based erosion prioritization against observed sediment or erosion data remains limited in data-scarce arid regions. This study addresses the first gaps directly and contributes the second by explicitly examining the implication validation limitations in data-scare arid environment. The main contributions are the following:
- A comprehensive GIS-based ensemble MCDM framework was developed integrating morphometric analysis and LULC data for Wadi Numan.
- Four MCDM techniques were applied and systematically compared under CRITIC objective weighting;
- SCCT and KTCCT non-parametric tests were used to identify the best-performing method for each data type.
- A proportionally weighted composite prioritization map was produced to guide soil conservation planning;
- Methodological limitations, including the absence of field validation, are explicitly acknowledged, and future research directions are identified. The remainder of this paper is organized as follows: Section 2 describes the study area, data sources, and methodology; Section 3 presents the results; Section 4 discusses the findings in relation to the literature and methodological limitations; and Section 5 provides conclusions and recommendations.
2. Materials and Methods
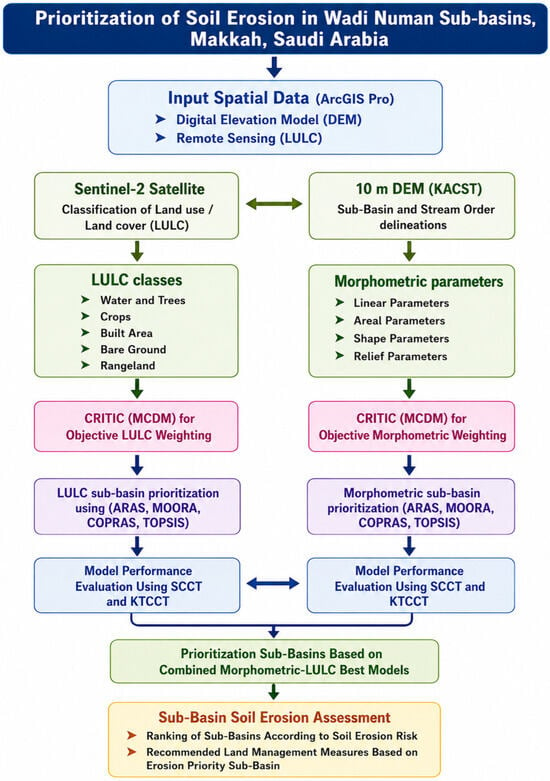
This study assessed soil erosion susceptibility in the Wadi Numan basin, Makkah, Saudi Arabia, via an integrated GIS and multi-criteria decision-making (MCDM) framework. The strategy was divided into four major stages: (1) data collection and preprocessing of morphometric and land use/land cover (LULC) parameters; (2) objective weighting of criteria using the CRITIC method; (3) application of four MCDM techniques (ARAS, MOORA, COPRAS, and TOPSIS) to prioritize sub-basins; and (4) the non-parametric tests SCCT and KTCCT were then used to assess the models’ performance. A composite erosion risk map was produced by integrating the models that perform well based on SCCT and KTCCT evaluation of model consistency and output integration to generate a composite erosion risk map. Figure 1 presents the whole methodological workflow.
Figure 1.
Flowchart of the study methodology.
2.1. Study Area
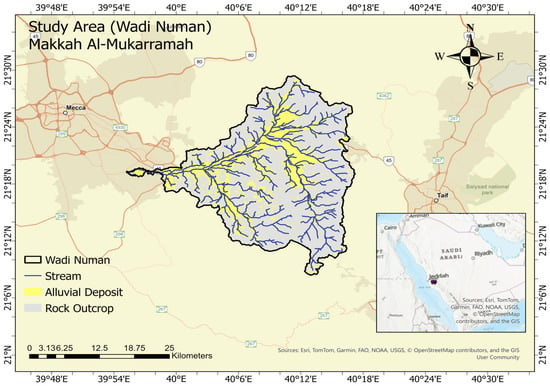
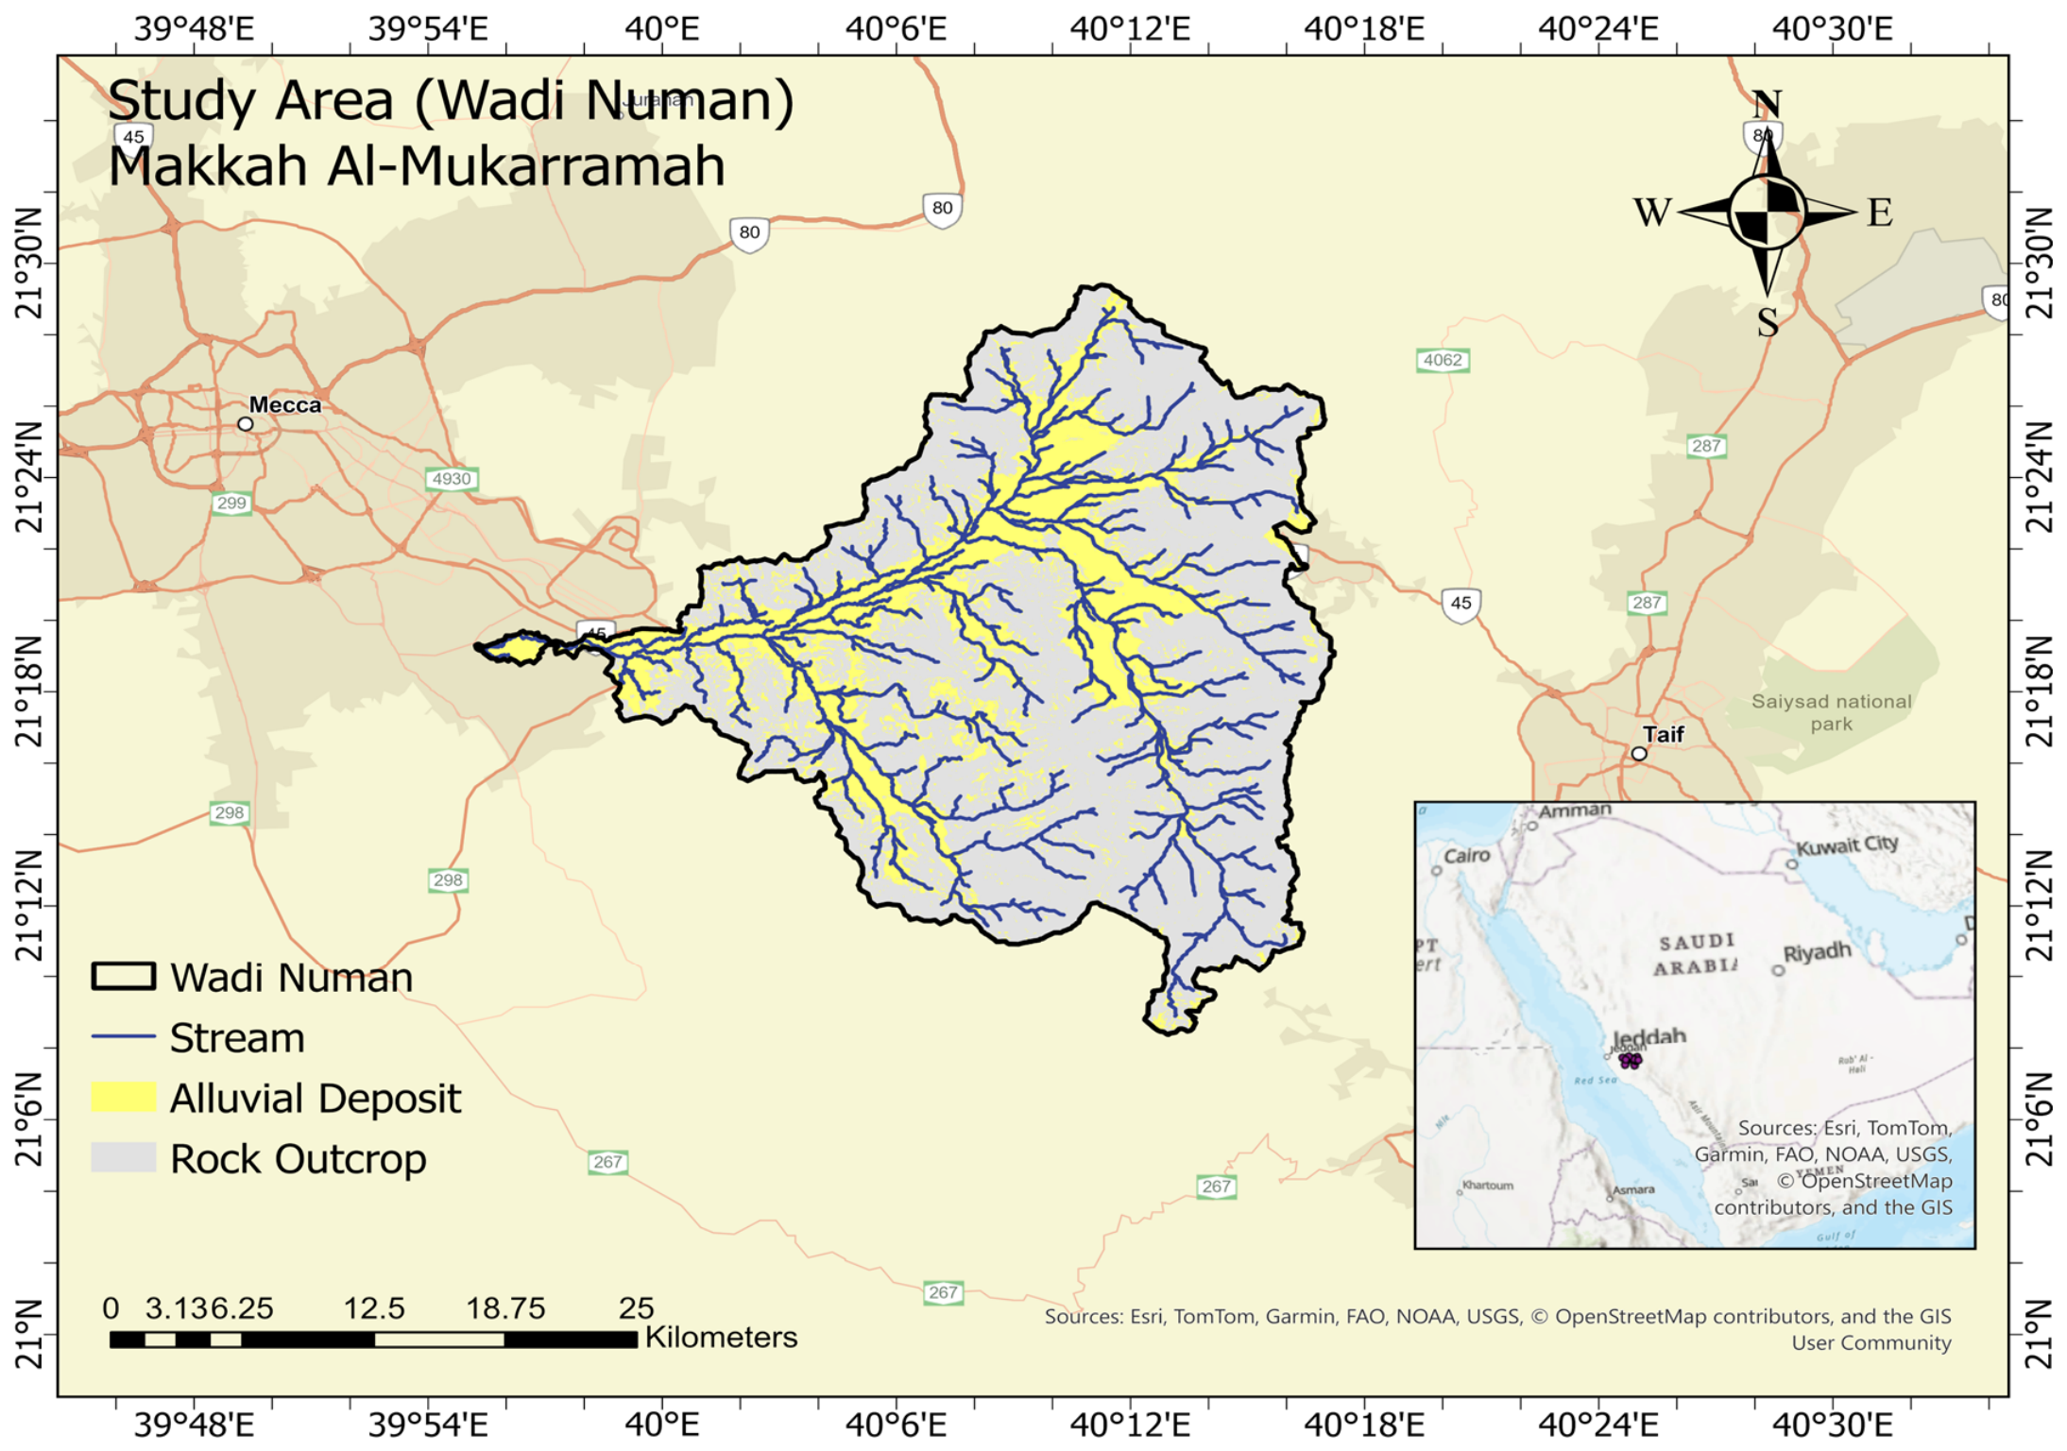
In the western Saudi Arabian province of Makkah, Wadi Numan is situated about 20 km east of Makkah City. The wadi covers a total drainage area of roughly 683 km2 and is located between latitudes 21°10′51.65″ N and 21°34′56.67″ N and longitudes 39°49′47.29″ E and 40°15′12.50″ E (Figure 2).
Figure 2.
Location map of study area.
The region has an arid to hyper-arid climate, with mean annual rainfall of less than 100 mm, concentrated in sporadic, high-intensity convective storms in the winter and spring [7]. Despite the overall aridity, these short-duration, intense rainfall events produce flash floods with high runoff velocities, which makes the basin extremely prone to sheet, rill, and gully erosion. Temperatures vary greatly seasonally and diurnally, exceeding 40 °C in summer and dropping to around 10 °C in winter, which promotes mechanical weathering and sediment production [7].
The wadi is ephemeral in nature, flowing only in response to rainfall events. Because of the combination of high-intensity rainfall, sparse vegetation cover, and large areas of bare, low-permeability bedrock and shallow soils, infiltration-excess overland flow dominates runoff generation [17]. There is no baseflow, and transmission losses from alluvial channel fills are quite high, especially in the lower reaches. These hydrological characteristics make the basin particularly susceptible to flash-flood generation and increase erosion risk during storm events.
2.2. Data Acquisition and Preprocessing
2.2.1. Digital Elevation Model (DEM)
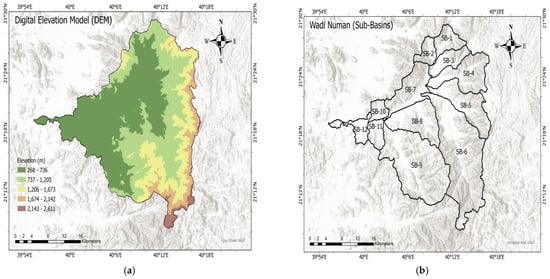
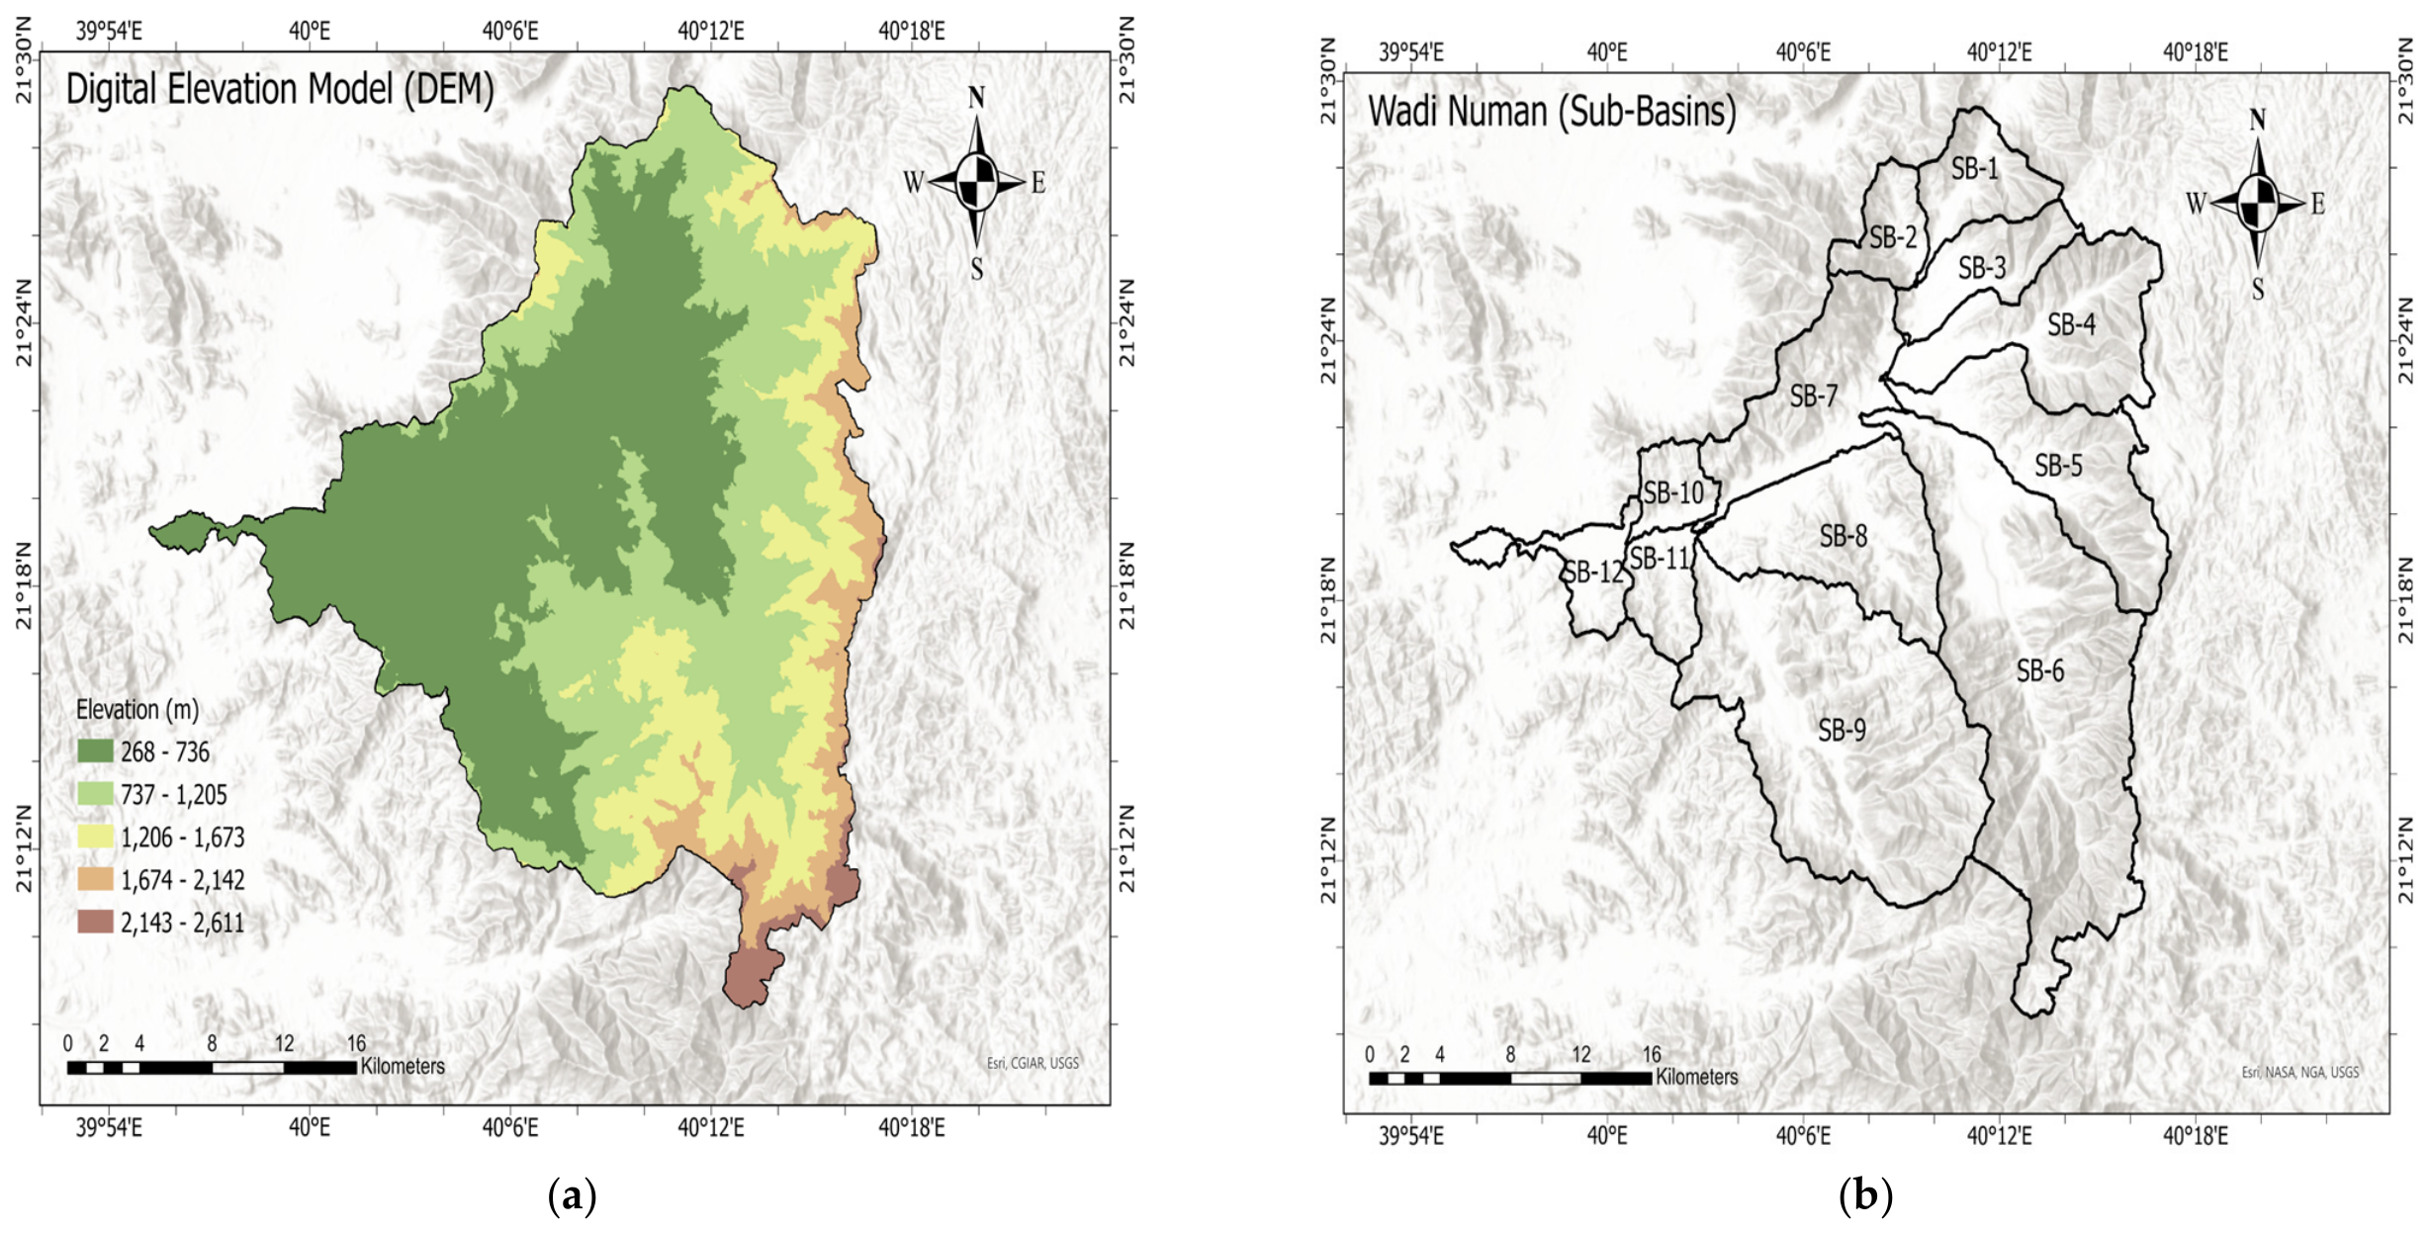
Using the hydrologic tools in ArcGIS Pro 3.5, topographic drainage divides were derived from the 10 m DEM acquired. The DEM was obtained from the King Abdulaziz City for Science and Technology (KACST) through its National Digital Elevation Model Portal (https://www.kacst.gov.sa, accessed on 5 June 2025).The DEM was derived from high-resolution satellite stereo imagery and validated against ground control points across the Kingdom. Elevation ranges from approximately 2611 m above mean sea level at the mountainous headwaters in the east to approximately 268 m at the basin outlet in the west, resulting in a high relative relief that strongly influences erosion dynamics and hydrological processes (Figure 3a). The DEM was also used to delineate the Wadi Numan basin into twelve sub-basins for subsequent analysis.
Figure 3.
(a) Elevation map of the Wadi Numan basin and (b) sub-basin numbers and names.
To remove local depressions that could disrupt flow routing, sink filling was performed using the Fill tool. Flow direction was determined using the D8 algorithm [16], followed by flow accumulation. In accordance with standard watershed delineation procedures, sub-basin boundaries were defined by locating pour points at significant stream confluences and extracting contributing areas upstream of each outlet [18,31]. These twelve sub-basins provide the spatial framework for all subsequent morphometric analysis and erosion susceptibility assessments. Table 1 provides an overview of Wadi Numan’s basin characteristics, while Figure 3b illustrates the number and name of the sub-basins.
Table 1.
Basin characteristics of Wadi Numan basin.
2.2.2. Stream Order and Morphometric Parameters
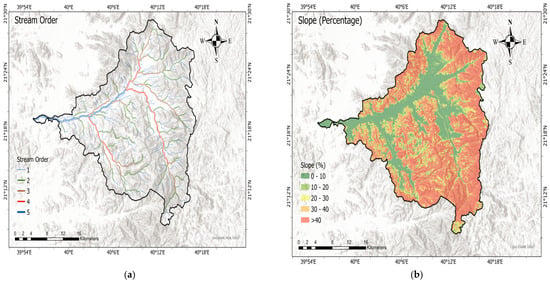
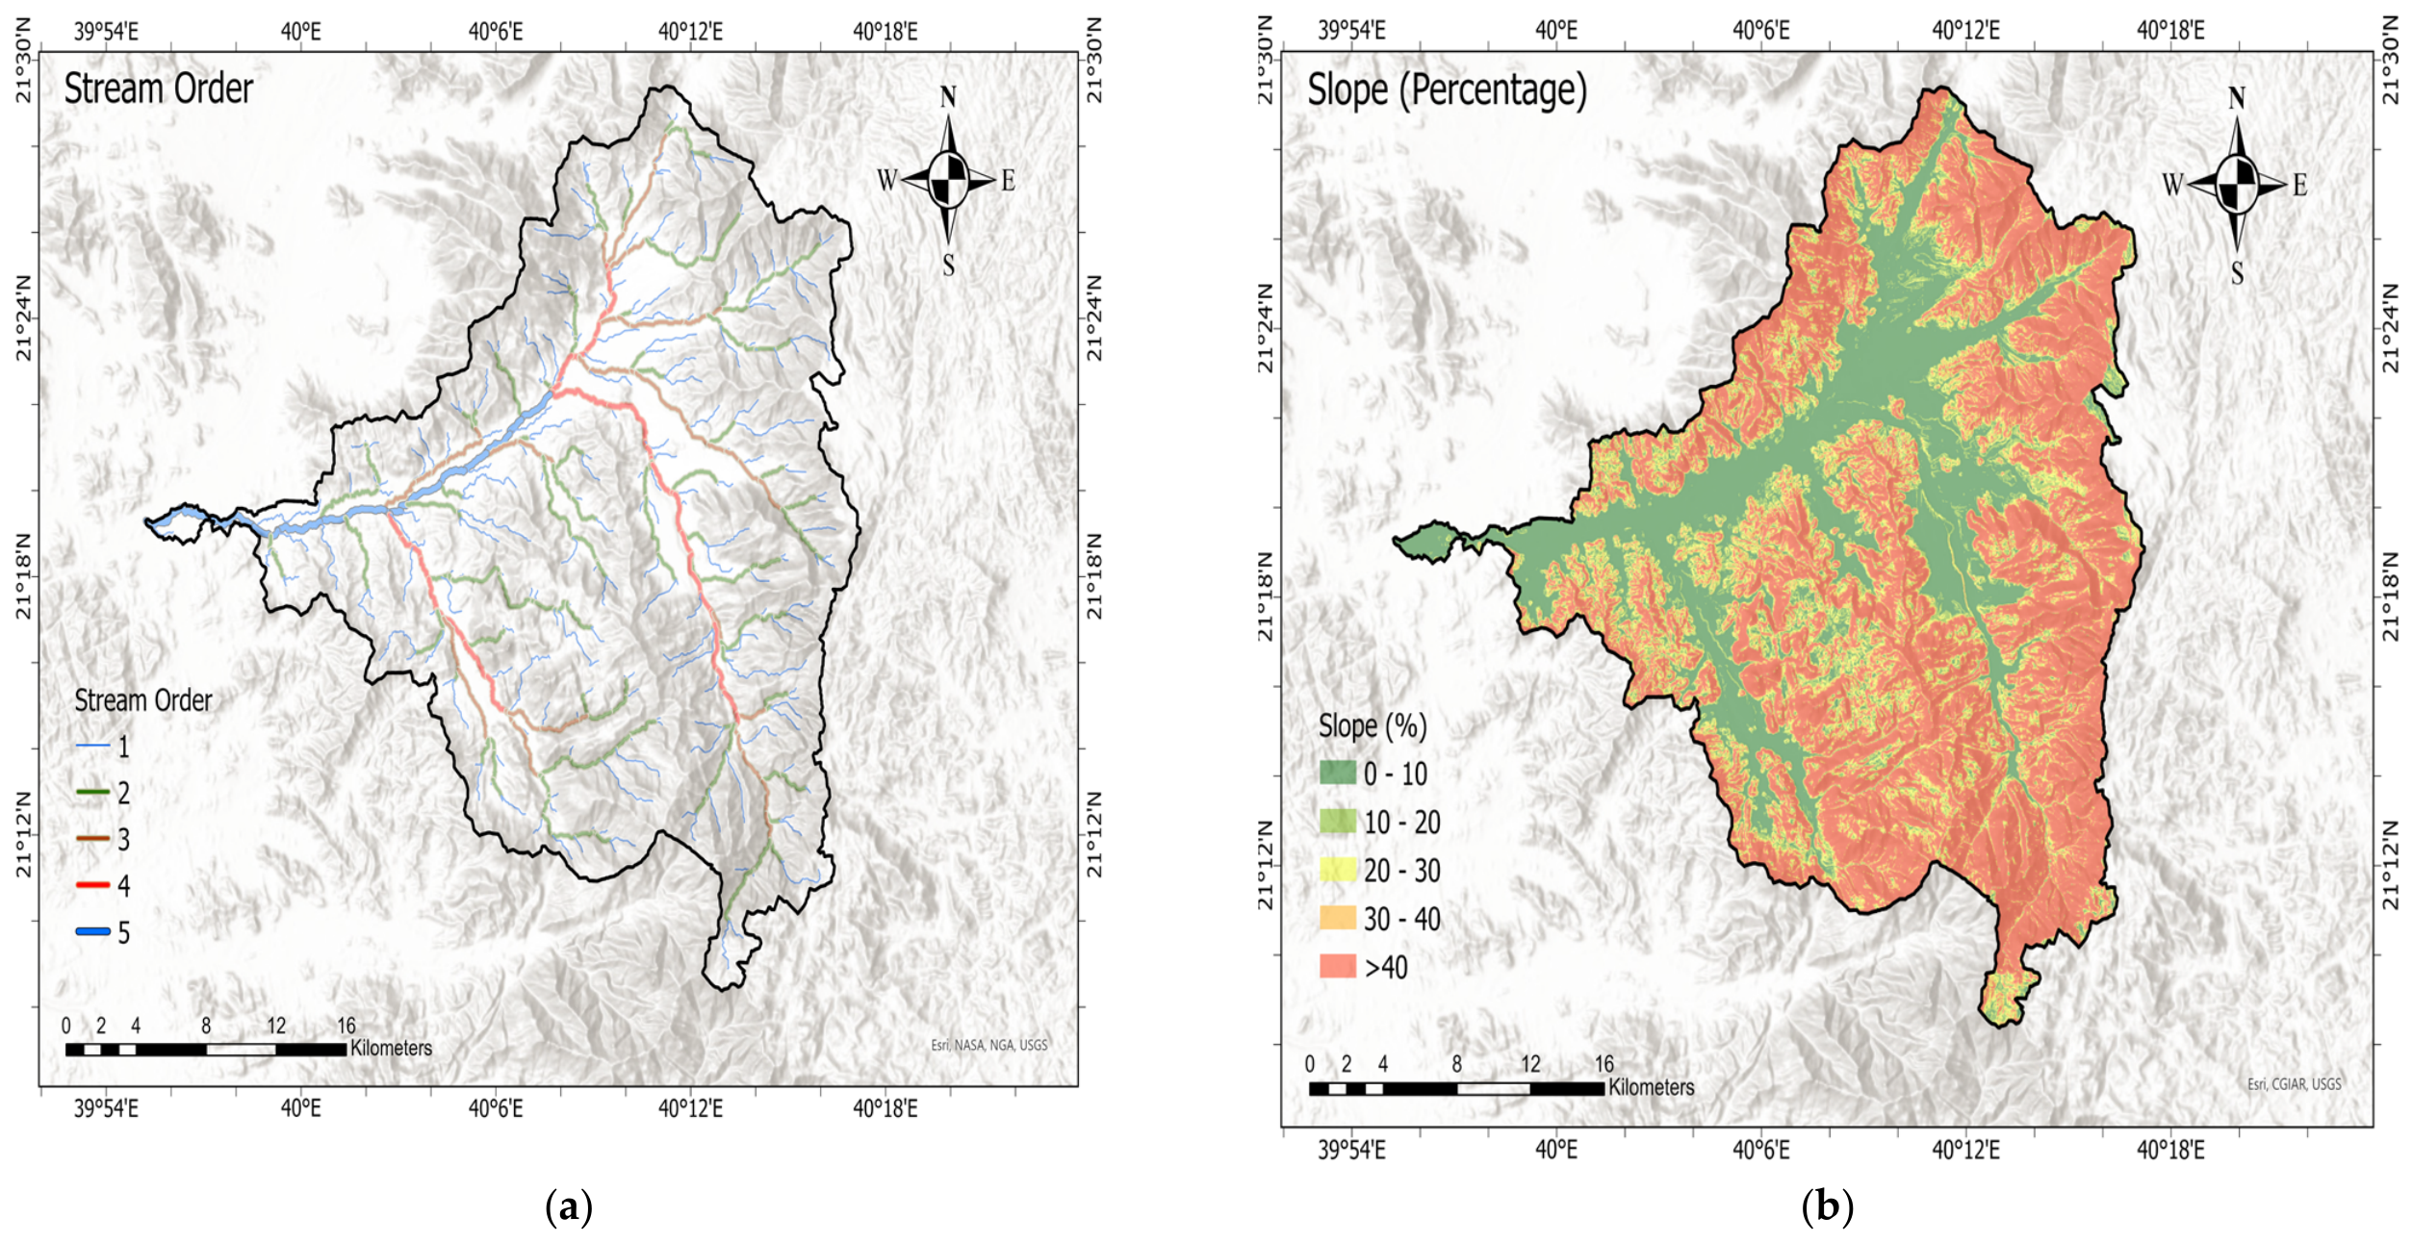
Stream networks were defined by a threshold of 200 accumulated cells. This value was selected through iterative comparison of resulting stream networks against topographic characteristics of the basin and is consistent with thresholds applied in comparable arid-region watershed studies in Saudi Arabia [7,18]. Lower thresholds produced excessive stream fragmentation, while higher thresholds omitted significant first-order channels. The 200-cell value produced a stream network that best reflected the visible drainage pattern and was consistent with the spatial resolution of the 10 m DEM. The Strahler method [18,31] was used to assign stream order, with first-order streams being headwater channels with no tributaries and increasing as two streams of the same order joined. Using the topographic characteristics of the Wadi Numan basin as a guide, outlets for each sub-basin were manually defined based on the confluence points where streams left the study area or joined the main channel (Figure 4a).
Figure 4.
(a) Stream order maps of Wadi Numan basin and (b) Slope in percentage.
A watershed tool was employed to define a total of 12 sub-basins. A quantitative framework for interpreting drainage basin features and their impact on hydrological behavior and erosion susceptibility can be obtained by morphometric analysis. Standard geomorphological formulas were used to calculate sixteen morphometric parameters for each of the twelve defined sub-basins in the Wadi Numan basin [16,18,31].
Wadi Numan’s twelve sub-basins have basin slopes from 13% (SB-12) to 46% (SB-6), reflecting the watershed’s severe topography (Figure 4b). The slope map shows that the >40% class dominates the basin, especially the eastern escarpments and upper sub-basins, while the 0–10% class is limited to the valley floor and key channel corridor. The 10–20%, 20–30%, and 30–40% classes are transitional zones between the flat valley bottom and steep terrain. Six sub-basins—SB-1 (43%), SB-2 (39%), SB-4 (41%), SB-5 (42%), SB-6 (46%), and SB-9 (38%)—had very steep average slopes above 35%, which is strongly associated with accelerated surface runoff, reduced infiltration, and high sediment transport potential [15,16]. SB-3 (34%), SB-7 (33%), SB-8 (28%), SB-10 (28%), and SB-11 (27%) are steep (25–35%), showing considerable yet moderate erosion susceptibility. Given its location in the lower valley and lower erosion susceptibility ranking in the final prioritizing, SB-12’s average slope of 13% was moderate (10–20%). Most of Wadi Numan’s slopes surpass 40%, indicating its geomorphological propensity to surface erosion and flash floods, especially during Makkah’s short-duration, high-intensity rainfall episodes [7,36].
A total of sixteen morphometric parameters were determined for each sub-basin, including the following linear parameters: mean bifurcation ratio (Rbm), drainage density (Dd), stream frequency (Fs), texture ratio (Tr), overland flow length (Lo), infiltration number (If), and channel maintenance constant (Ccm); shape (areal) parameters: form factor (Ff), shape factor (Sf), elongation ratio (Re), compactness coefficient (Cc), and circulatory ratio (Rc); and relief parameters: relative relief (RR), relief ratio (Rr), ruggedness number (Rn), and basin slope (S). All computations were carried out using standard geomorphological formulas, as presented in Table 2. Based on their established relationship with soil erosion processes [9,26], the parameters were classified into benefit and cost criteria. Parameters exhibiting a direct relationship with erosion susceptibility—where higher values indicate greater runoff potential, terrain steepness, and drainage efficiency—were treated as benefit criteria. These are Rbm, Dd, Fs, Tr, Lo, If, RR, Rn, S, Rr, and Sf. Conversely, parameters showing an inverse relationship with erosion susceptibility—where lower values correspond to runoff concentration, reduced infiltration, or less compact basin geometry—were considered cost criteria. These include Ccm, Ff, Re, Cc, and Rc.
Table 2.
Morphometric parameter equations.
2.2.3. Land Use and Land Cover (LULC)
The LULC data were not classified from raw Sentinel-2 imagery. Instead, the pre-classified Sentinel-2 10 m Land Use/Land Cover Time Series product, produced by Esri and Impact Observatory in partnership with Microsoft and available through ArcGIS Living Atlas of the World within ArcGIS Pro, was used. This product was generated using a deep learning classification model trained on billions of human-labeled pixels curated by the National Geographic Society. The product carries a documented overall accuracy of 86% for the initial 2020 release and an assessed average accuracy exceeding 75% across the annual time series [37].
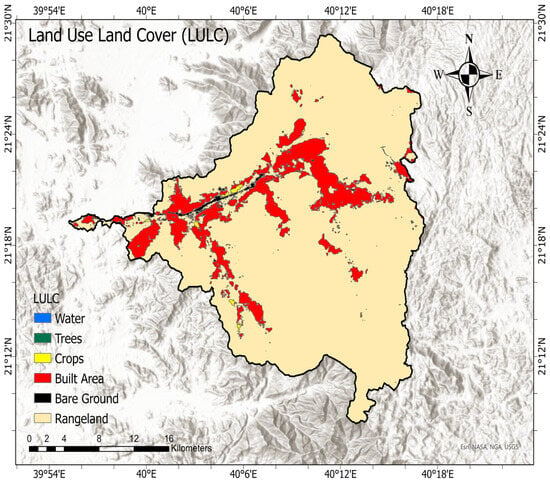
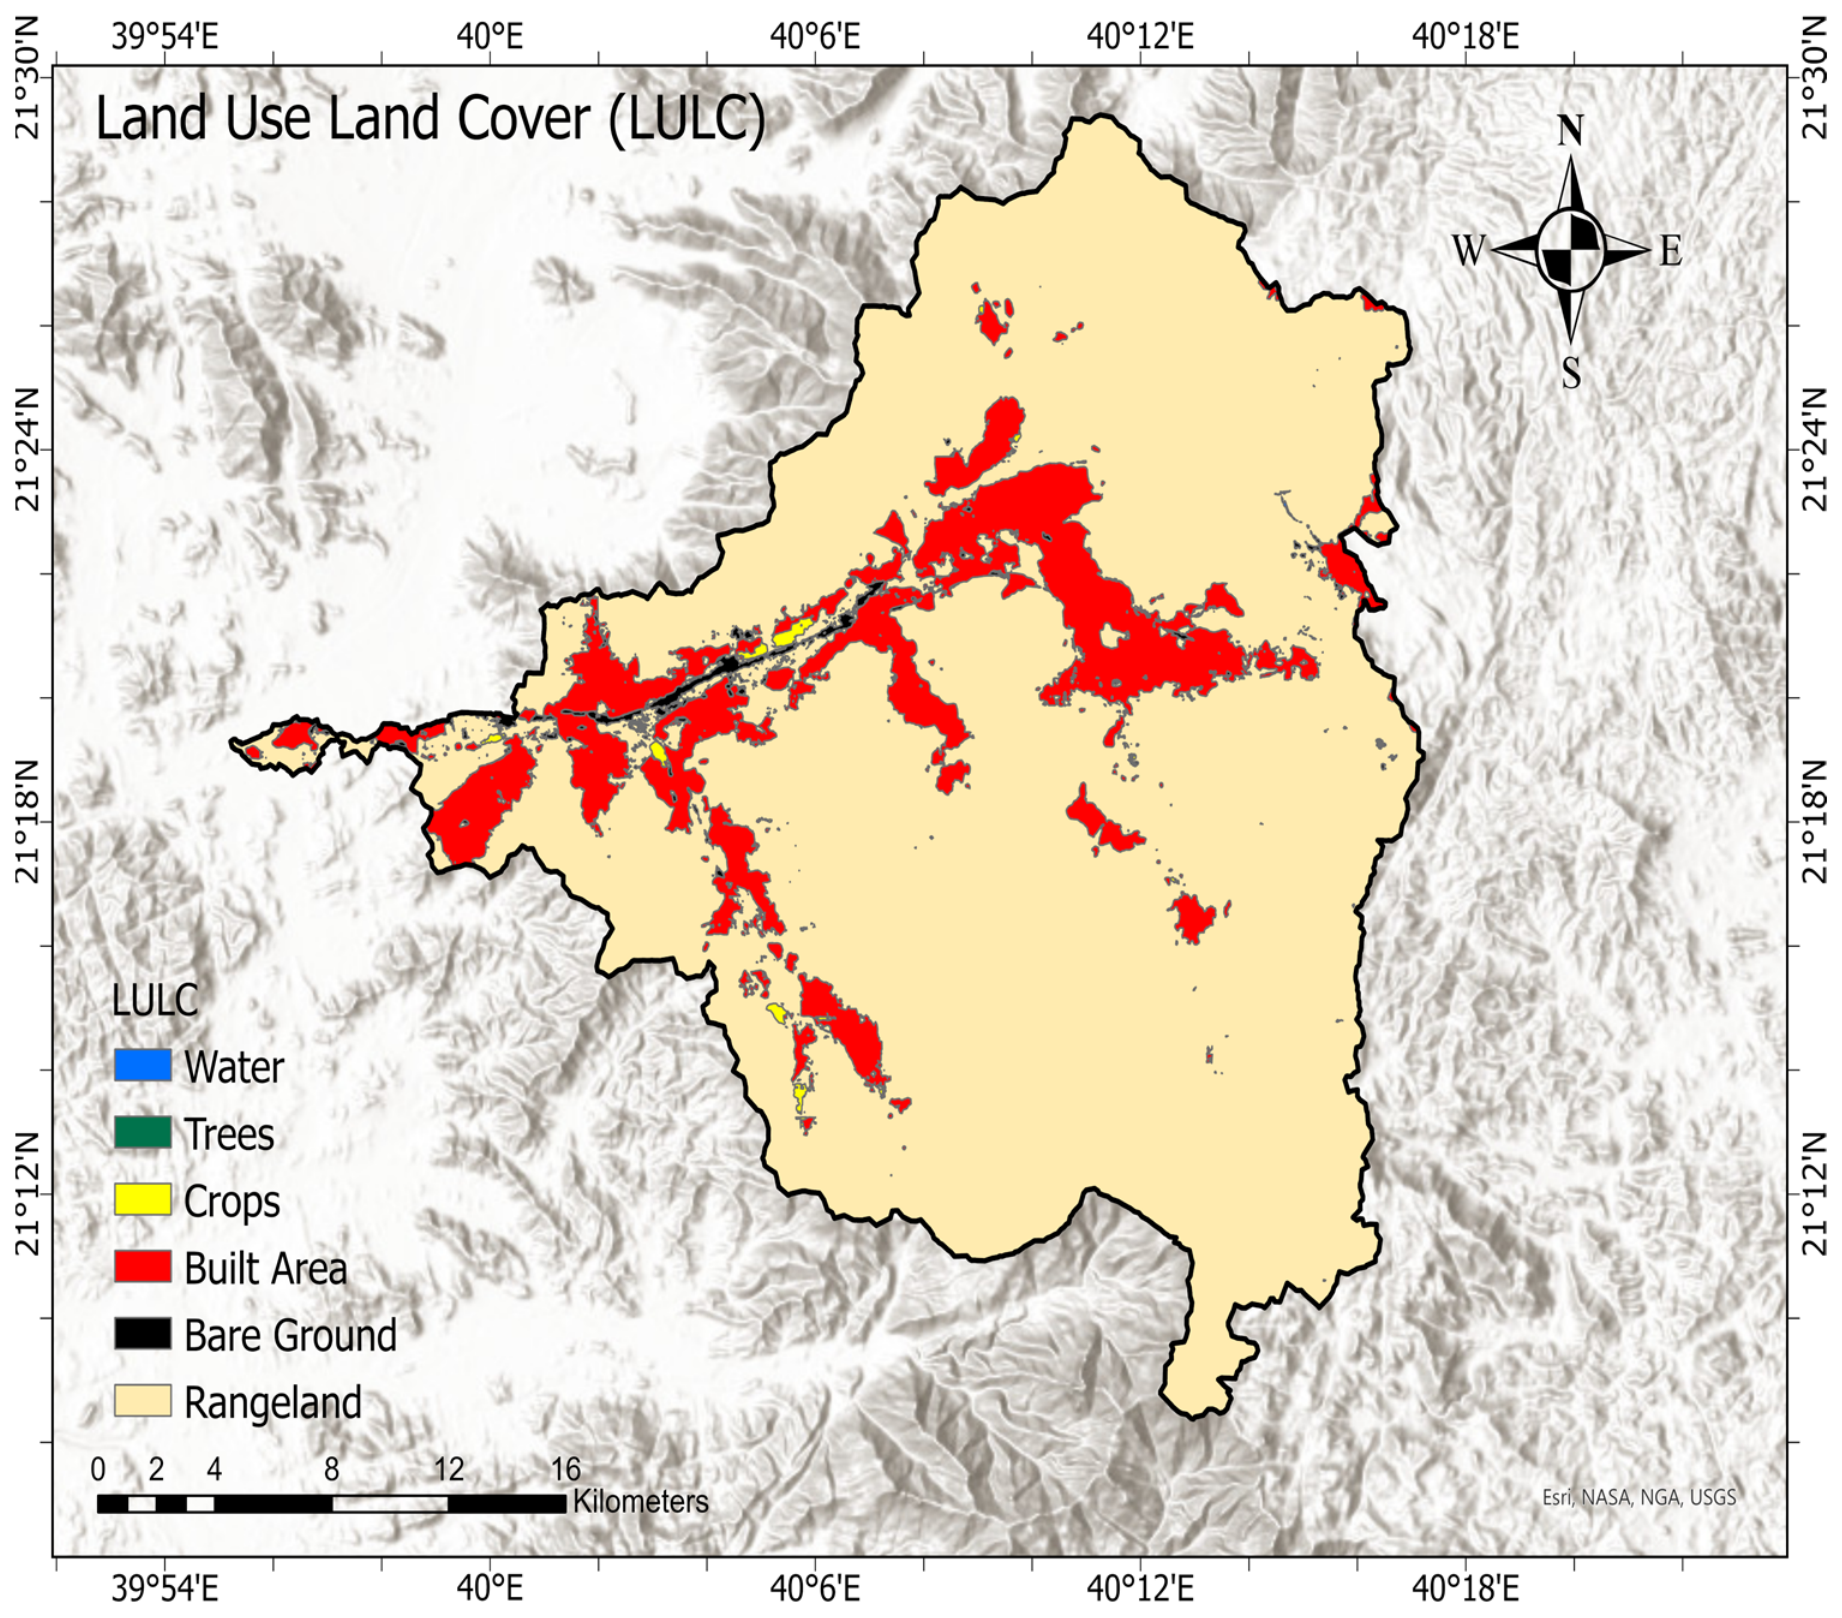
The Wadi Numan basin was classified into six distinct LULC classes based on imagery interpretation and field knowledge (Figure 5). Water, representing perennial and ephemeral bodies, which includes wadi channels with visible water; bare ground, referring to exposed soil, rock, sand, or surfaces with minimal vegetation cover; rangeland, consisting of open areas with natural grasses, shrubs, and sparse vegetation; trees, defined as tall, dense woody vegetation with a closed canopy, including scattered trees and small patches; crops, representing agricultural areas under cultivation, including irrigated and rainfed farming; and built-up areas, referring to man-made impervious surfaces such as buildings, roads, settlements, and infrastructure. Water and Trees occupy only a very small proportion of the basin area and therefore appear as small patches at the basin scale.
Figure 5.
Land use and land cover map of study area.
The “Zonal Histogram” tool was used to calculate the percentage area of each LULC class for each of the 12 delineated sub-basins. This tool tabulates the number of pixels per class within each sub-basin and converts these counts to percentage areas.
The LULC classes’ distinct hydrological and erosional responses directly affect their classification as either cost (lower values indicate greater erosion susceptibility) or benefit (higher values indicate greater erosion susceptibility). The established connections between land cover and erosion processes in arid environments serve as the foundation for this classification [9,26]. Bare ground is classified as a benefit because exposed soil lacks vegetation protection, resulting in high susceptibility to raindrop impact, sheet erosion, and rill formation. Higher percentages of bare ground directly increase erosion potential. Built-up areas are classified as a benefit because impervious surfaces increase runoff and hydrological connectivity, indirectly elevating erosion risk in adjacent areas through concentrated flow [7]. Rangeland is classified as cost because vegetation cover, even when sparse, provides soil protection through root systems and canopy interception compared to bare ground. Higher rangeland percentages indicate greater soil stability and reduced erosion risk [3].
Crops were classified as a cost criterion in Wadi Numan because structured irrigated agricultural plots with soil preparation, water retention features, and partial vegetation cover reduce surface runoff and sediment detachment compared to bare ground and built-up surfaces. Trees were classified as a cost criterion due to their ability to protect soil through dense root networks, canopy interception, and organic matter accumulation. Water bodies were similarly treated as cost criteria, as they represent zones of sediment deposition rather than sediment source areas, and therefore do not contribute to upland erosion in the sub-watershed prioritization framework [9].
This benefit/cost classification was used generally in the CRITIC weighting and MCDM ranking procedures, with bare ground and built-up areas being the only LULC classes treated as beneficial. Rangeland leads most sub-basins (55–99%), indicating low erosion potential from land cover alone, whereas elevated built-up percentages in SB-5, SB-8, SB-10, SB-11, and SB-12 indicate areas where land use change may indirectly increase hydrological connectivity and erosion risk. Table 3 represents the summary of all morphometric parameters and LULC classes.
Table 3.
Summary of criteria used in the MCDM framework with criterion type, units, and expected relationship with erosion susceptibility.
2.3. Multi-Criteria Decision-Making (MCDM) Methods
The 12 sub-basins were ranked according to their susceptibility to erosion using four MCDM techniques: MOORA, TOPSIS, ARAS, and COPRAS. Prior to estimating scores for each method, the normalized decision matrix was subjected to objective weights obtained from the CRITIC method. Three iterations of each method were performed: (1) with morphometric criteria alone (16 parameters), (2) with LULC criteria alone (6 classes), and (3) with morphometric and LULC criteria combined.
2.3.1. Criteria Importance Through Inter-Criteria Correlation (CRITIC)
The CRITIC method is an objective, data-driven approach to weighting criteria based on their variability and relationships to other factors. Unlike subjective methods like the Analytic Hierarchy Process (AHP), CRITIC derives weights directly from data, which makes it ideal for situations where expert judgment is unavailable [34]. The method takes into account both the contrast intensity of each criterion, measured by standard deviation, and the conflict between criteria, measured by correlation, with higher independence, indicating greater importance [35]. In soil erosion mapping, CRITIC effectively assesses the information content and redundancy of morphometric and land-use factors.
The CRITIC analysis was performed using a systematic approach. The decision matrix was first normalized using min–max normalization, which transformed all values to a [0, 1] scale while applying the benefit and cost formulas. Second, the standard deviation (σj) of each normalized criterion was calculated to determine its contrast intensity. A higher standard deviation indicates greater discriminatory power. Third, a correlation matrix (rjk) was created between all criterion pairs using the Pearson correlation coefficient to assess the linear relationships between criteria. Forth, the conflict measure (Cj) was calculated for each criterion by adding its dissimilarity to all others, expressed as Σ (1 − rjk). Fifth, by combining contrast intensity and unique information, the information quantity (Ij) for each criterion was calculated as the product of its standard deviation and conflict measure (σj × Cj). In order to enable comparative analysis across the three MCDM scenarios, CRITIC weights were computed separately for morphometric parameters alone (16 criteria) and LULC classes alone (6 criteria). The objective weight (wj) for each criterion was then obtained by normalizing the information quantities (Ij/Σ Ij), ensuring all weights sum to 1.0. The mathematical formulation of the CRITIC weighting method is provided in Table 4.
Table 4.
Equations used in the MCDM methods.
2.3.2. Multi-Objective Optimization by Ratio Analysis (MOORA)
MOORA applied to generate a balanced ranking through the comparison of advantageous and disadvantageous elements [24]. The method normalizes each alternative’s performance in comparison to all alternatives for a given criterion, then computes a net score as the difference between the summed benefit and cost criteria [38]. The following steps were used.
Initially, the decision matrix was normalized using vector normalization. Second, CRITIC weights were applied to the normalized values, resulting in a weighted normalized matrix. Third, for each sub-basin, the weighted normalized values for benefit and cost criteria were calculated separately. Fourth, the total performance score for each alternative was calculated as the difference between the benefit and cost sums. Finally, sub-basins were ranked in descending order by net score, with higher scores indicating greater erosion susceptibility. The mathematical formulation of the MOORA technique is summarized in Table 4.
2.3.3. Additive Ratio Assessment (ARAS)
The ARAS approach ranks alternatives based on their weighted performance in comparison to an ideal optimal value [39]. The method computes the degree of optimality, which corresponds to the relative efficiency of each alternative. The procedure described below was carried out in Microsoft Excel. First, vector normalization was applied to the decision matrix. Second, CRITIC weights were used with normalized values to generate a weighted normalized matrix. Third, an optimal alternative was determined by taking the weighted normalized matrix and determining the maximum value for benefit criteria and the minimum value for cost criteria [40]. Fourth, the total performance value for each sub-basin was calculated by adding the weighted normalized values. Fifth, the degree of optimality for each alternative was determined by comparing its total efficacy to that of the optimal alternative. Finally, sub-basins were ranked in descending order of optimality, with values closer to 1.0 indicating higher erosion susceptibility. The computational framework of the ARAS method is summarized in Table 4.
2.3.4. Complex Proportional Assessment (COPRAS)
Zavadskas et al. [41] developed COPRAS, which assesses alternatives by comparing their relative significance to the ideal solution, taking both benefit and cost criteria into proportion [35]. The method was carried out using a systematic procedure in Microsoft Excel. First, vector normalization was applied to the decision matrix. Second, CRITIC weights were applied to normalized values to generate a weighted normalized matrix. Third, for each sub-basin, the sum of weighted normalized values for benefit and cost criteria were calculated. Fourth, the relative significance of each alternative was calculated by combining the benefit sum with a term that included the minimum cost sum and the inverse of the cost sum across all alternatives. Fifth, the utility degree for each alternative was calculated as the percentage difference between its relative significance and the maximum relative significance among all alternatives. Finally, sub-basins were ranked in descending order of utility degree, with higher percentages indicating increased erosion susceptibility. The mathematical expressions of the COPRAS method are presented in Table 4.
2.3.5. Technique for Order Preference by Similarity to Ideal Solution (TOPSIS)
TOPSIS, developed by Hwang et al. [42], employs Euclidean distances to determine the alternative that is closest to the positive ideal solution and farthest from the negative ideal solution. The following steps were taken to implement the method. First, the decision matrix was initially normalized using vector normalization. Second, CRITIC weights were applied to the normalized values to create a weighted normalized matrix. Third, the positive and negative ideal solutions were determined by choosing maximum values for benefit criteria and minimum values for cost criteria for the positive ideal and vice versa for the negative ideal solutions. Fourth, the Euclidean distances between each alternative and the positive and negative ideal solutions were calculated. Finally, sub-basins were ranked according to their closeness coefficient, with values closer to 1.0 indicating greater erosion susceptibility. The mathematical procedure of the TOPSIS method is presented in Table 4.
2.4. Non-Parametric Test for Comparing MCDM Techniques
The Spearman rank correlation coefficient test (SCCT) and the Kendall Tau rank correlation coefficient test (KTCCT) were selected to evaluate the degree of agreement among the four MCDM model rankings for both morphometric and LULC datasets. These non-parametric tests were chosen for three specific reasons. First, they assess ordinal agreement between ranked outputs without requiring assumptions of normality or interval-level measurement, which makes them appropriate for the small sample size of this study (n = 12 sub-basins) [42,43]. Second, both tests are widely established in the MCDM consistency evaluation literature as robust tools for comparing the rank-order outputs of competing decision-making methods [9,25]. Third, using two complementary tests—SCCT, which is sensitive to large rank differences, and KTCCT, which penalizes all inversions equally—provides a more comprehensive and reliable assessment of inter-method agreement than either test alone [43]. The formulas and mathematical derivations of both tests follow Szmidt and Kacprzyk [43] and are consistent with their application in Arabameri et al. [9].
The prioritization results from the best-performing techniques identified through the consistency assessment were combined to create the final composite ranking. Following that, a proportional weighting scheme was used, giving LULC classes a weight of 27.3% (based on 6 classes) and morphometric parameters a weight of 72.7% (based on 16 parameters). Sub-basins were categorized into five susceptibility categories—very low, low, moderate, high, and very high—after the weighted scores for each sub-basin were determined. This composite ranking provides a useful framework for specific soil conservation planning in the Wadi Numan basin and corresponds to the consensus erosion susceptibility assessment resulting from the most reliable MCDM approaches.
3. Results
3.1. Stream Network and Drainage System of Study Area
According to Strahler’s scheme, the Wadi Numan basin is a fifth-order watershed. There are 433 stream segments in the basin’s drainage network, accounting for 309.5 km of cumulative stream length (Table 1). First-order streams account for 45.2% (318) of the total number and 73.4% (139.9 km) of the total stream length. Second-order streams constitute 24.8% (76.8 km) of the total number and 16.2% (70) of the total length. Third-order streams represent 17.3% (53.6 km) of the total number and 7.4% (32) of the total length. Fourth-order streams represent 8.9% (27.5 km) of the total number and 2.1% (9) of the total length. Fifth-order streams make up 3.8% (11.7 km) of the total number but only 0.23% (1) of the total stream length. In Figure 3b, the stream order maps are shown.
3.2. Morphometric Parameters and Their Influence on Soil Erosion Susceptibility
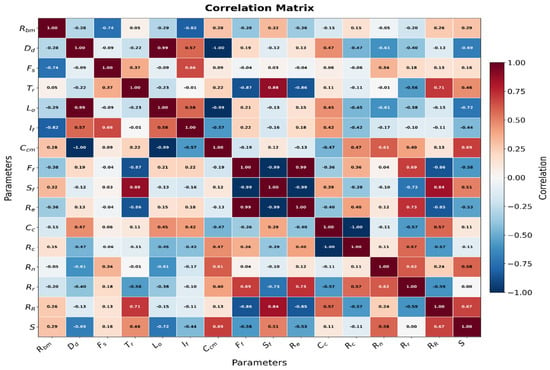
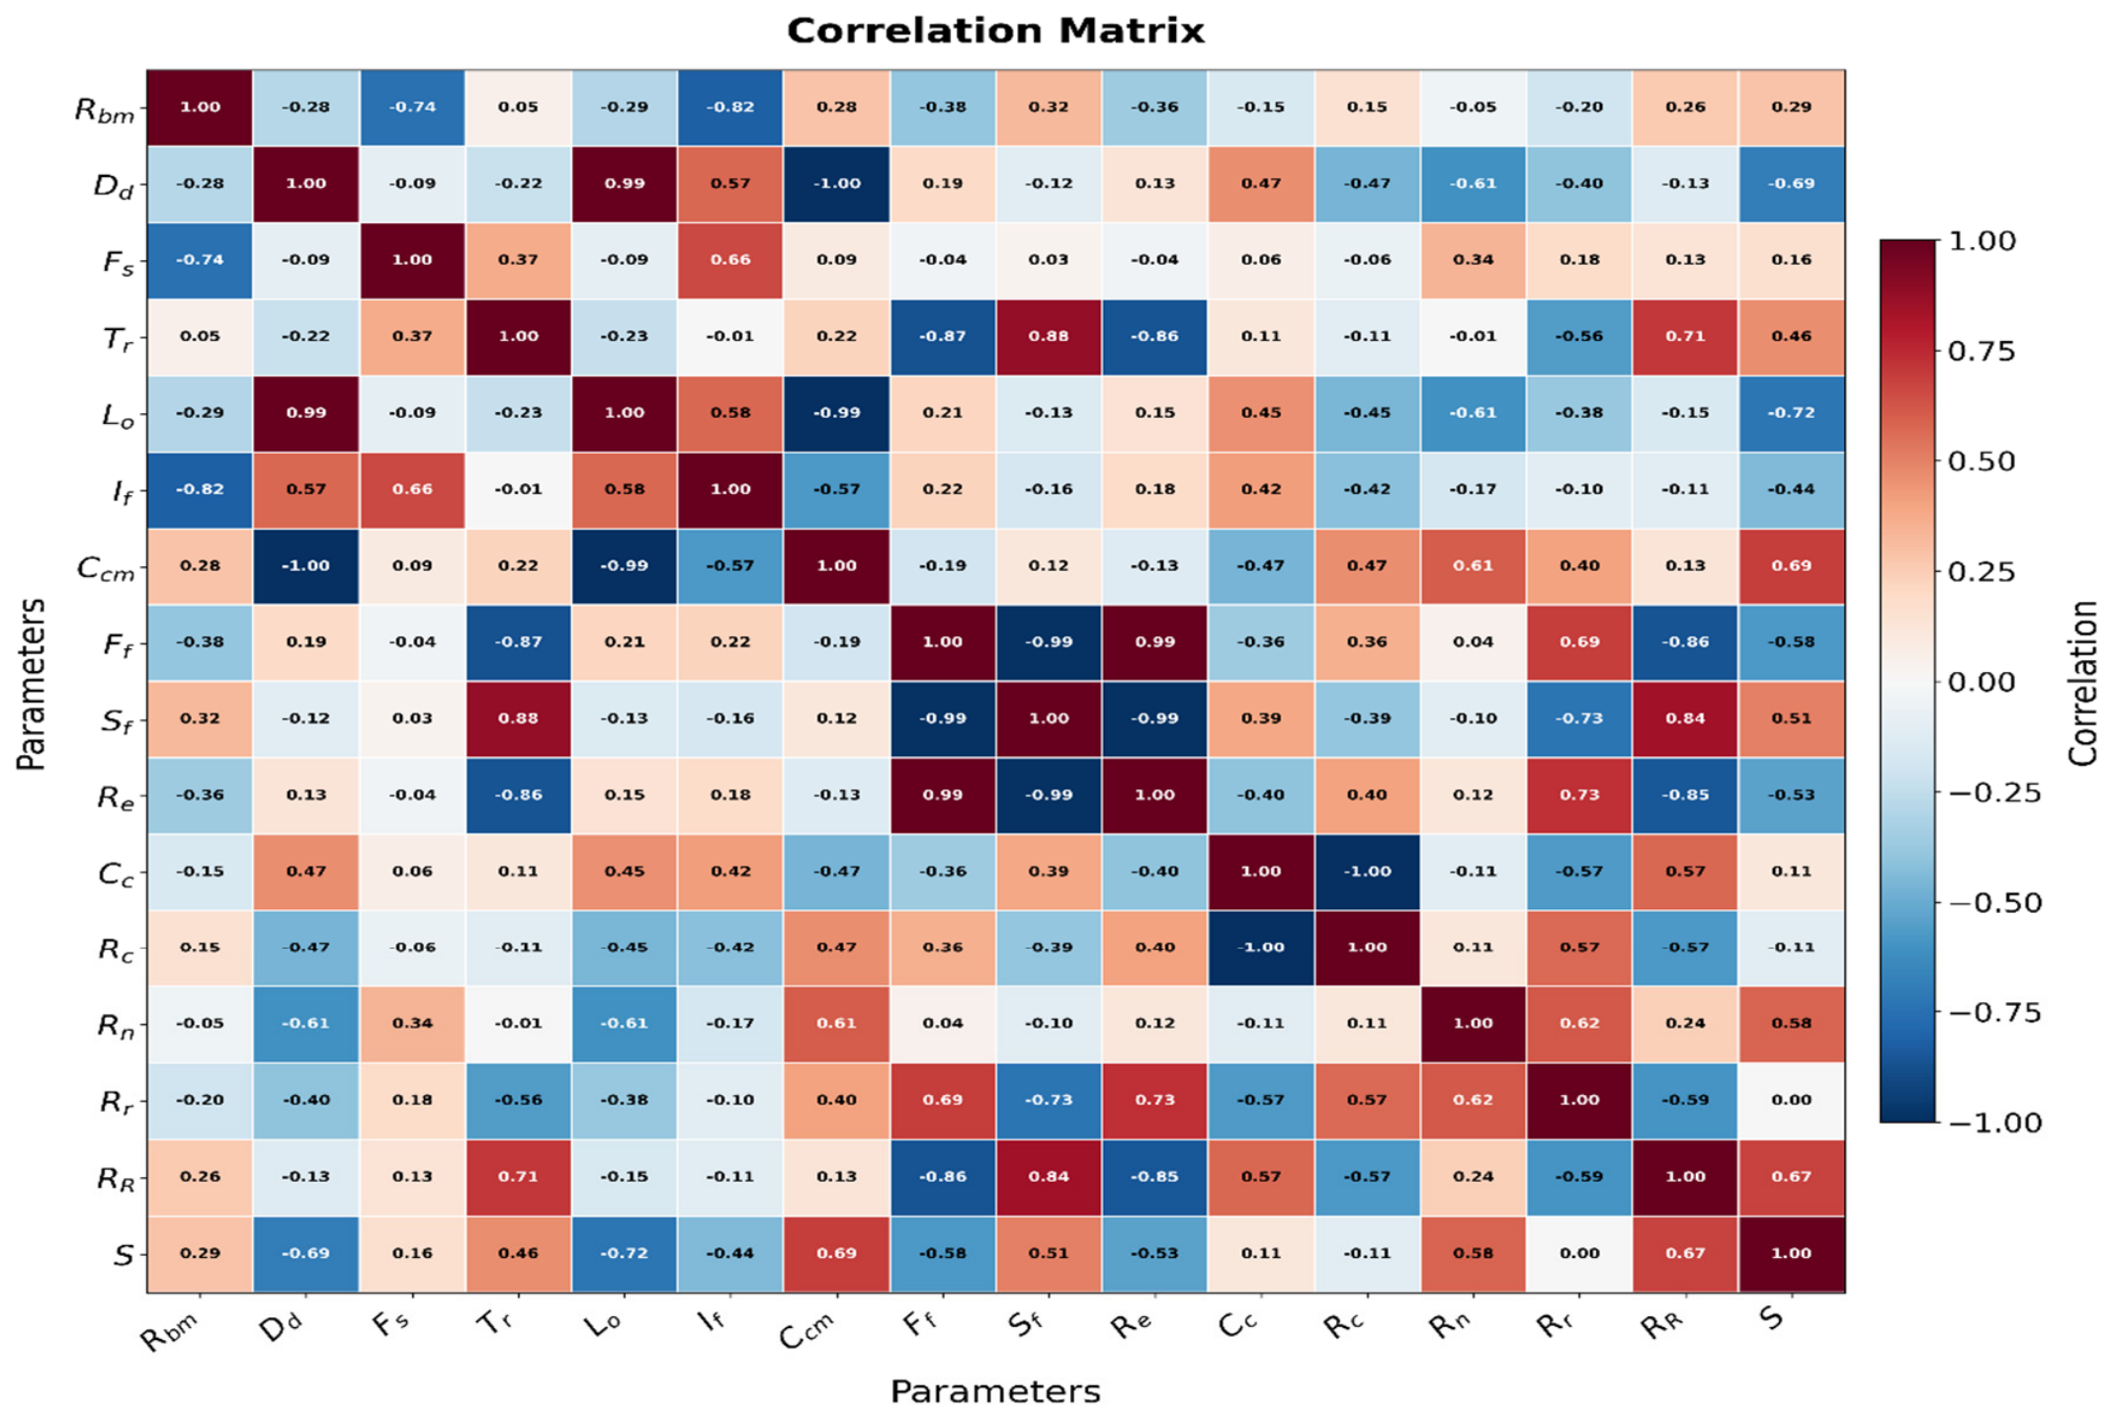
Understanding the type of lithology and the features of hydrological behavior, soil properties, and erosion characteristics is largely dependent on morphometric parameters [13,14,19,44]. In order to prioritize sub-basins in the mapping of soil erosion susceptibility, sixteen morphometric parameters were chosen (Figure 6). The full morphometric parameters of the Wadi Numan sub-basins are shown in Table 5. The degree of structural dissection in a drainage basin is measured by the mean bifurcation ratio (Rbm), where higher values indicate more complex, mountainous terrain that concentrates runoff and raises the potential for erosion [16,18]. Sub-basins with higher Rbm values in the Wadi Numan basin, like SB-5 (2.546) and SB-9 (2.313), are more prone to erosion, whereas sub-basins with lower values, like SB-10 (1.167), show more stability.
Figure 6.
Correlation matrix among morphometric parameters for the 12 sub-basins.
Table 5.
Morphometric Parameters of Wadi Numan Sub-basins.
SB-12 (1.315 km/km2), SB-7 (0.992 km/km2), and SB-8 (0.977 km/km2) had the highest values for drainage density (Dd), indicating a low capacity for infiltration and a high susceptibility to soil erosion. On the other hand, SB-1 (0.809 km/km2) and SB-2 (0.779 km/km2), which have the lowest Dd values, are less vulnerable to erosion. SB-10 (0.969 km−2), SB-3 (0.875 km−2), and SB-1 (0.833 km−2) obtained the highest values for stream frequency (Fs), indicating increased surface dissection and erosion potential. Since they had the lowest Fs values, SB-11 (0.492 km−2) and SB-2 (0.515 km−2) are more resilient to erosion. SB-9 (1.808), SB-6 (1.425), and SB-8 (1.118) had the highest texture ratio (Tr), indicating a fine drainage texture and a high susceptibility to erosion. SB-12 (0.339) and SB-11 (0.411) had the lowest Tr values, which indicated coarse texture and lower erosion potential.
SB-6 (1.816), SB-5 (1.642), and SB-4 (1.357) had the highest relative relief (RR) as measured by relief parameters, indicating steeper slopes and more potential for erosion. SB-10 (0.514) and SB-11 (0.389) exhibited the lowest RR values. SB-2 (0.167), SB-3 (0.158), and SB-1 (0.157) had the highest ruggedness number (Rn) values, indicating more rugged terrain with greater potential for erosion. SB-12 (0.059) and SB-11 (0.065) exhibited the lowest Rn values. SB-6 (0.46), SB-1 (0.43), and SB-5 (0.42) had the highest values for basin slope (S), which implies steeper slopes that boost runoff velocity and erosive power. The lowest slope values were shown by SB-12 (0.13) and SB-11 (0.27).
The shape factor (Sf) is a particularly crucial shape parameter. SB-6 (3.473), SB-9 (3.409), and SB-4 (3.009) had the highest Sf values, indicating highly elongated basins with greater peak flows and erosion potential. SB-10 (2.450) and SB-11 (2.515) had the lowest Sf values, indicating more compact basins with low erosion susceptibility. SB-10 (0.721), SB-2 (0.708), and SB-12 (0.701) had the highest Elongation Ratios (Re), indicating more circular basins with lower erosion potential. SB-6 (0.605) and SB-9 (0.611) had the lowest Re values, which indicated elongated basins with greater erosion susceptibility in the headwaters.
3.3. LULC Classification and Their Influence on Soil Erosion Susceptibility
The identified land cover classes in the study area affect soil erosion to a notable degree. Bare ground has a direct relation with soil erosion because it represents exposed soil without vegetation cover. Among the 12 sub-basins, SB-10 (2.83%), SB-12 (2.80%), and SB-7 (2.63%) show the highest proportions of bare ground indicating land-cover conditions generally associated with increased erosion susceptibility. In contrast, SB-1 (0%), SB-2 (0.005%), and SB-3 (0.005%) show the lowest proportions and lower susceptibility.
Built-up areas increase erosion risk indirectly through greater runoff and higher peak flow levels. SB-10 (41.17%), SB-12 (40.75%), and SB-5 (21.93%) record the highest proportions and greater susceptibility to erosion. In comparison, SB-1 (0.16%), SB-2 (4.69%), and SB-3 (6.67%) have lower values. Rangeland, which covers most sub-basins, has an inverse relation with soil erosion. SB-1 (99.71%), SB-2 (94.83%), and SB-3 (93.07%) record the highest proportions and therefore lower susceptibility. On the other hand, SB-10 (55.83%), SB-12 (55.14%), and SB-5 (77.21%) show lower proportions.
Crop areas cover only small portions, with SB-7 (1.32%) as the highest, followed by SB-12 (0.65%) and SB-9 (0.39%). Water appears in trace amounts, with SB-4 (0.067%) as the highest. Tree cover is almost absent, with only SB-9 (0.0001%) that shows a negligible presence. These classes have limited influence on erosion susceptibility because of their small spatial extent. The area (km2) and percentage distribution of LULC classes throughout the Wadi Numan sub-basins are shown in Table 6.
Table 6.
Area (km2) and percentage distribution of LULC classes across the sub-basins of the Wadi Numan.
3.4. Critic Weights for Morphometric Parameters
The matrix shows multiple strong positive and negative correlations that affect erosion susceptibility interpretation and CRITIC weight distribution. Redundancies fall into three categories. Dd and Fs have a strong positive correlation (r ≈ +0.8), reflecting the density of the channel network per unit area and responding to the same underlying controls of lithology, soil permeability, and slope gradient [15,16]. Second, Rr and Rn are positively correlated (r = +0.75), indicating that both measure vertical basin relief relative to horizontal extent, making them redundant topographic steepness descriptors [34]. The Ff and Sf are substantially negatively associated (r = −0.95), as expected since Sf is the opposite of Ff and both represent basin elongation [16].
These redundancies directly reduce parameter weights in CRITIC. High correlation between criteria leads to low conflict scores (Σ(1 − |rjk|)) due to information overlap, diminishing statistical independence and information content (Cj) [34]. Thus, Dd, Fs, Rr, and Rn had lower CRITIC weights than shape factor (Sf, w = 0.080) and relief ratio (Rr, w = 0.076), which had stronger discriminatory power across the twelve sub-basins despite their intercorrelations. The consistent signal from multiple independent indicators (steep slopes, dense drainage, high ruggedness) in sub-basins SB9 and SB1 strengthens confidence in their very high erosion susceptibility ranking, as their elevated priority is not driven by a single parameter but confirmed across multiple correlated indicators. Figure 7 shows the Spearman correlation matrix for the sixteen morphometric measures in Wadi Numan’s twelve subbasins.
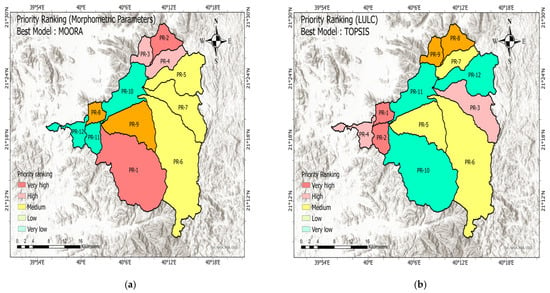
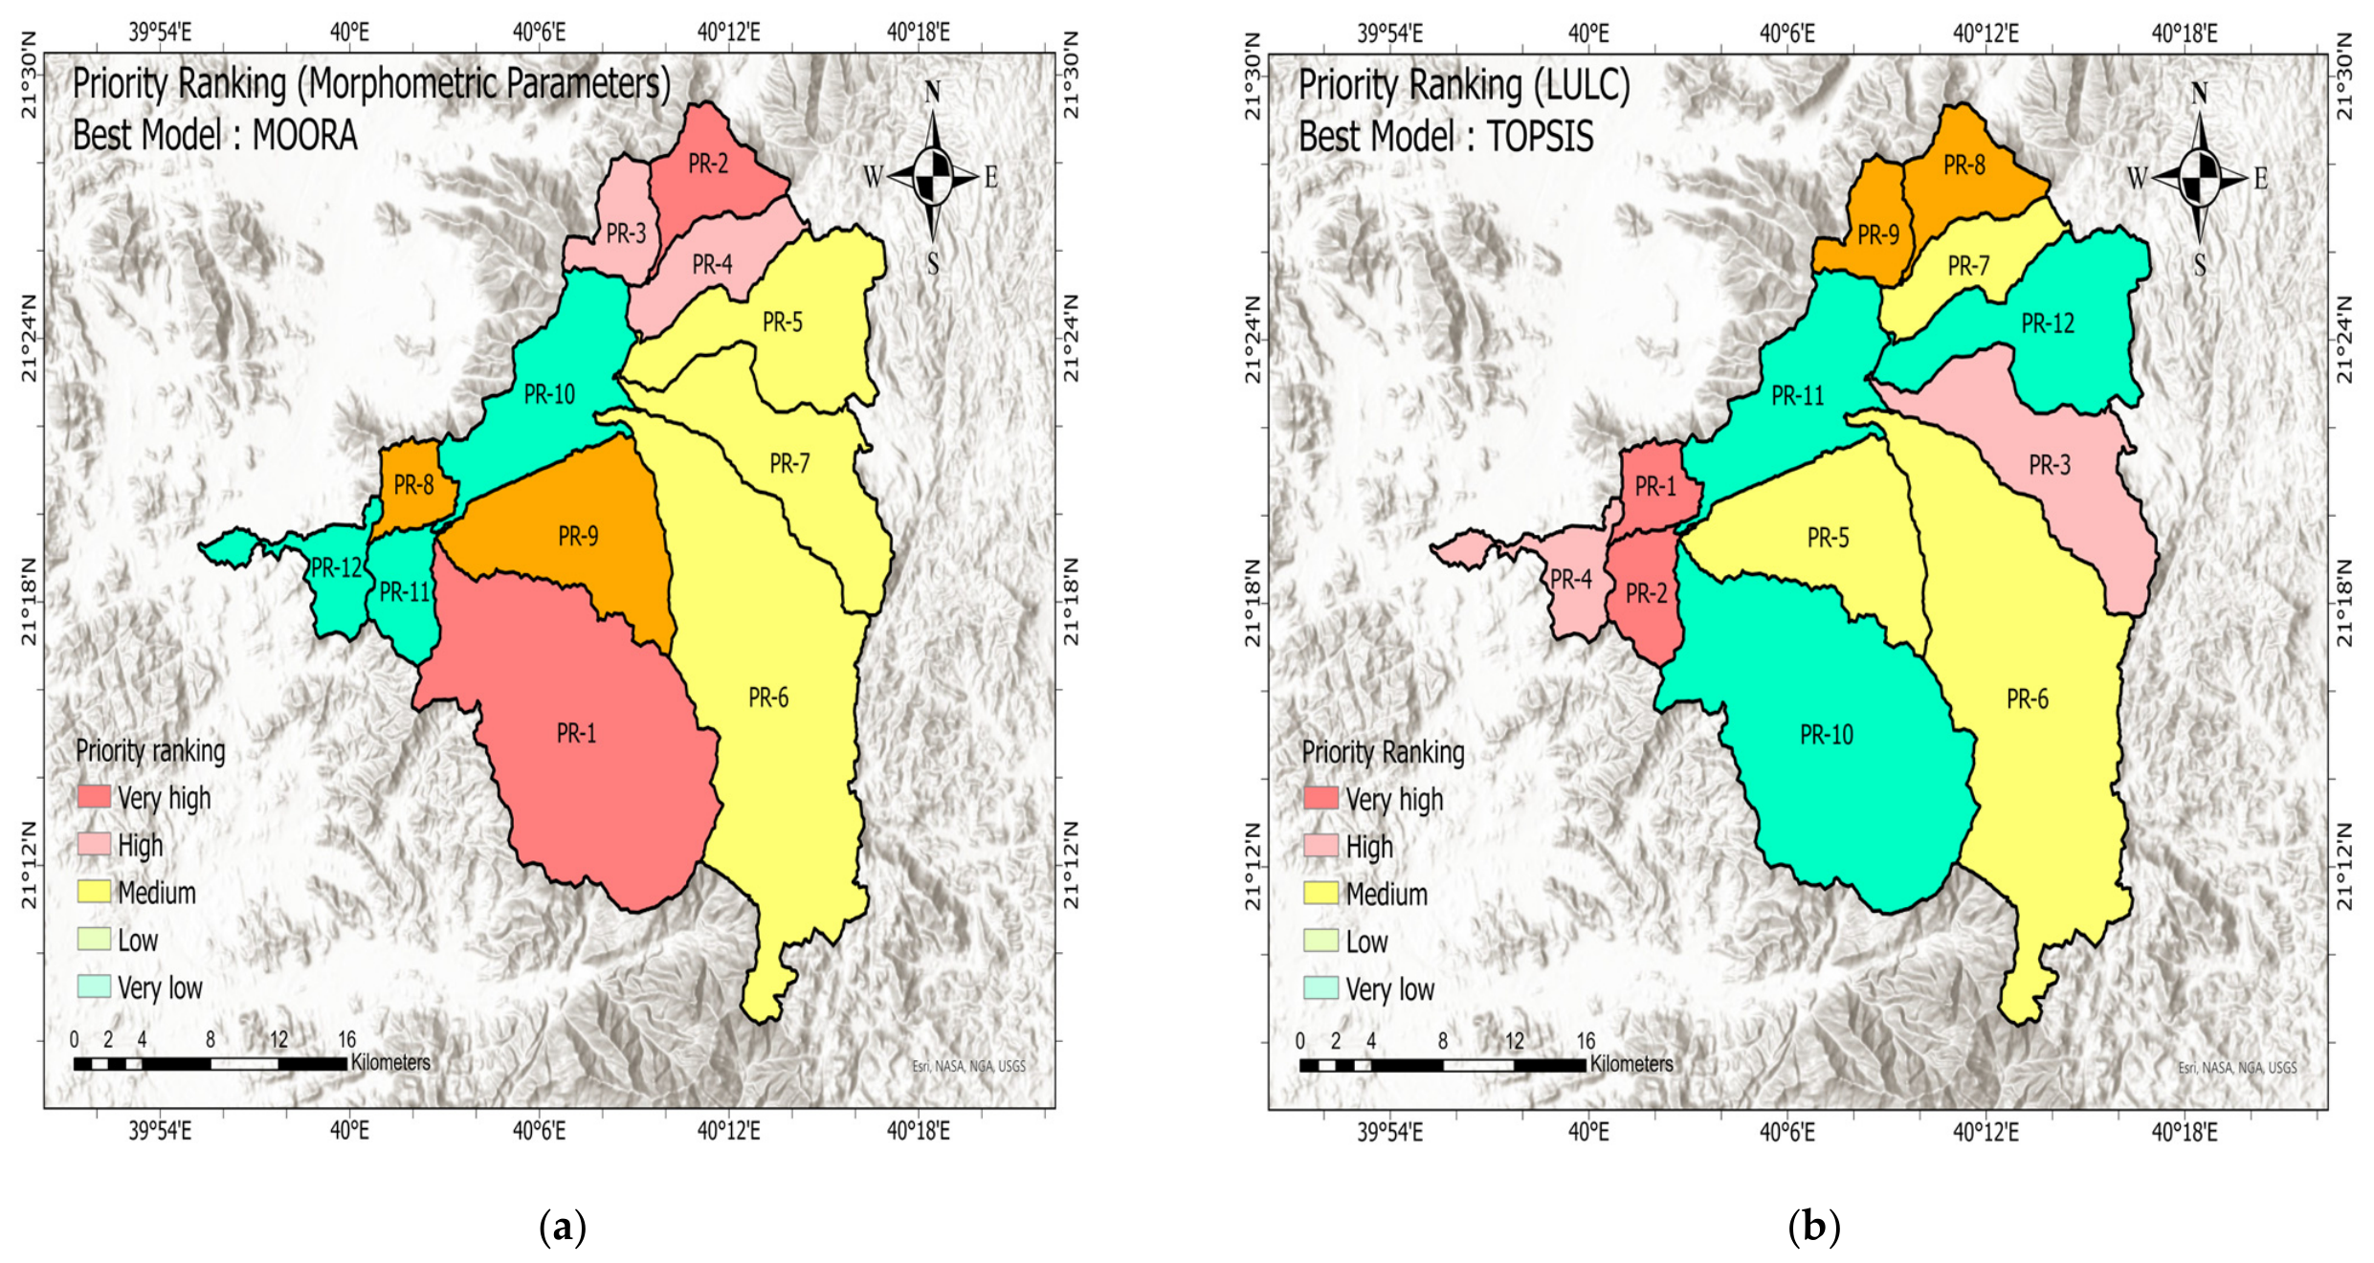
Figure 7.
(a) Priority ranking based on morphometric parameters using the top-performing MOORA model and (b) priority ranking based on LULC using the best-performing TOPSIS model.
The choice matrix was created from linear, relief, and form morphometric values for the 12 sub-basins. Linear and relief factors that affect soil erosion were maximized at their greatest values. COPRAS, ARAS, and MOORA models maximized shape characteristics with inverse relationships to soil erosion at their lowest levels. The CRITIC technique estimated criteria weights [26].
According to CRITIC criteria weights (Table 7), Sf (0.080), Rr (0.076), and Rn (0.073) received the highest weights, indicating greater discriminatory power within the decision matrix (Table 6). These were followed by Cc (0.069), and Re (0.063). Rbm and Rc received wight of 0.060 and 0.062, respectively. Fs and RR received wight of 0.059 and 0.057, respectively. Ccm, Dd, and Lo each received a wight of 0.057, whereas If received a wight of 0.056. Tr and basin slope (S) obtained the lowest weights, at 0.055 and 0.056, respectively.
Table 7.
Objective weighting of morphometric parameters based on the CRITIC method.
It should be noted that the CRITIC method assigns wights based on the statistical characteristics of the dataset, including criterion variability and inter-criterion relationship. Higher CRITIC weights indicate greater discriminatory power within the decision matrix rather than a direct measure of the physical influence of a parameter on soil erosion processes. The resulting weights therefore reflect the relative contribution of each criterion to differentiating among sub-basins under the conditions of the present study.
3.5. Critic Weights for LULC Classes
The CRITIC technique is objective, but its limitations must be considered when evaluating this study’s criterion weights. Criterion weights are based on information content (Cj) and aggregate conflict score (Σ(1 − |rjk|)), which measure statistical independence from other criteria [35]. Thus, criteria with limited spatial coverage may receive relatively high wights when they exhibit strong statistical independence and contrast with decision matrix.
The present study’s LULC analysis shows this restriction. Water and crops, which have marginal values across the twelve sub-basins (0–0.07% and 0–1.32%, respectively), were given the highest and second-highest weights (w = 0.2296 and w = 0.2249), surpassing criteria with much larger areal coverage like bare ground (w = 0.2096) and rangeland (w = 0.1642) (Table 8). Both classes have moderate standard deviations (σ = 0.286 and σ = 0.296) after min–max normalization, but are poorly linked with dominating land-cover classes (Bare Ground, Built Area, and Rangeland), resulting in conflict sums of 4.452 and 4.163, respectively. These two components multiply to yield information content values (Cj = 1.276 for Water; Cj = 1.236 for Crops) that exceed all other active criteria. Due to its complete absence across all sub-basins, the Trees criteria obtained a null weight (w = 0), rendering its normalized variance and correlation meaningless and providing no discriminating information to the analysis. These weights reflect the mathematical structure of the decision matrix—high variance contrast and statistical independence—rather than the physical significance of these classes as erosion drivers, consistent with the CRITIC method’s sensitivity to sparse data distributions reported in comparable studies [25,35].
Table 8.
Objective weighting of LULC classifications based on the CRITIC method.
The present study explicitly distinguishes between statistical weighting and geomorphological relevance throughout the analysis, and the final composite model weights the morphometric component (72.7%) more than the LULC component (27.3%) to partially compensate for low-coverage LULC classes. Future CRITIC weighting implementations in LULC-based erosion investigations should use a minimum area threshold to exclude negligible classes from the decision matrix or normalize weights relative to areal coverage to increase physical interpretability.
3.6. Prioritization of Soil Erosion-Prone Sub-Basins Using Morphometric Parameters and MCDM Models
The prioritization results of sub-basins based on morphometric parameters with the MOORA model appear in Table 9. According to MOORA, SB-9 (0.1371), SB-1 (0.1359), and SB-2 (0.1293) achieved the highest Yi scores, indicating the greatest susceptibility to soil erosion. SB-3 (0.1290) and SB-4 (0.1267) followed, while SB-11 (0.0824) and SB-12 (0.0533) showed the lowest Yi scores, which reflect minimal erosion susceptibility. These rankings show that sub-basins with high relief and rugged terrain face greater susceptibility to erosion (Figure 7a). In the COPRAS model (Table 10), SB-9 (100%), SB-1 (99.66%), and SB-2 (97.63%) recorded the highest utility percentages, confirming their high erosion susceptibility. SB-3 (97.31%) and SB-4 (96.32%) followed, while SB-11 (81.51%) and SB-12 (71.98%) showed the lowest utility percentages, indicating lower erosion potential.
Table 9.
Prioritization of sub-basins using morphometric Parameter’s and LULC classes based on MOORA.
Table 10.
Prioritization of sub-basins using morphometric parameters and LULC classes based on ARAS.
The ARAS model produced similar results, where SB-9 (0.760), SB-1 (0.765), and SB-2 (0.742) ranked as the most susceptible sub-basins. SB-3 (0.737) and SB-4 (0.731) also ranked high. In contrast, SB-11 (0.620) and SB-12 (0.558) showed the lowest Ki values, which reflect lower susceptibility to erosion (Table 11). In comparison, the TOPSIS model produced a different ranking pattern, where SB-1 (0.577), SB-3 (0.549), and SB-2 (0.546) showed the highest closeness coefficients and ranked first, second, and third, respectively. SB-9 (0.523) and SB-4 (0.503) ranked fourth and fifth, while SB-6 (0.4858) dropped to seventh place. SB-11 (0.366) and SB-12 (0.236) showed the lowest closeness coefficients and ranked last in erosion susceptibility (Table 12).
Table 11.
Prioritization of sub-basins using morphometric parameters and LULC classes based on COPRAS.
Table 12.
Prioritization of sub-basins using morphometric parameters and LULC classes based on TOPSIS.
3.7. Prioritization of Soil Erosion-Prone Sub-Basins Using LULC Classes and MCDM Models
The prioritization results of sub-basins based on LULC classes and MCDM models appear in Table 9, Table 10, Table 11 and Table 12 for MOORA, ARAS, COPRAS, and TOPSIS, respectively. According to the MOORA model, SB-10 (0.1695), SB-11 (0.1063), and SB-12 (0.0758) achieved the highest Yi scores, indicating the greatest susceptibility to soil erosion. SB-5 (0.0302) and SB-8 (−0.0061) followed, while SB-4 (−0.2444) and SB-7 (−0.1330) showed the lowest Yi scores, which reflect lower erosion susceptibility due to extensive rangeland cover. In the COPRAS model, SB-10 (100%), SB-11 (71.70%), and SB-5 (54.52%) recorded the highest utility percentages, confirming high erosion susceptibility. SB-12 (47.54%) and SB-6 (38.22%) also ranked high, while SB-4 (8.76%) and SB-9 (17.40%) showed the lowest utility percentages, which indicate lower erosion potential. The ARAS model ranked SB-7 (1.9885), SB-8 (1.9758), and SB-5 (1.7484) as the most susceptible sub-basins. SB-6 (1.0964) and SB-12 (1.0319) also ranked high. In contrast, SB-1 (0.1189) and SB-9 (0.2813) showed the lowest Ki values, which indicate lower susceptibility to erosion. The TOPSIS model ranked SB-10 (0.9988), SB-11 (0.8898), and SB-5 (0.7632) as the most susceptible sub-basins. SB-12 (0.7546) and SB-8 (0.7529) also ranked high. SB-4 (0.4239) and SB-7 (0.5227) showed the lowest closeness coefficients and ranked lowest in erosion susceptibility (Figure 7b).
3.8. Non-Parametric Tests on Morphometric Parameters
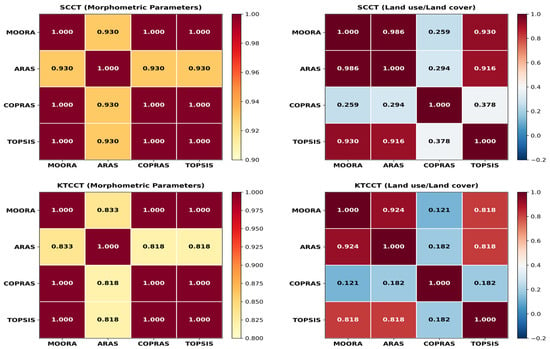
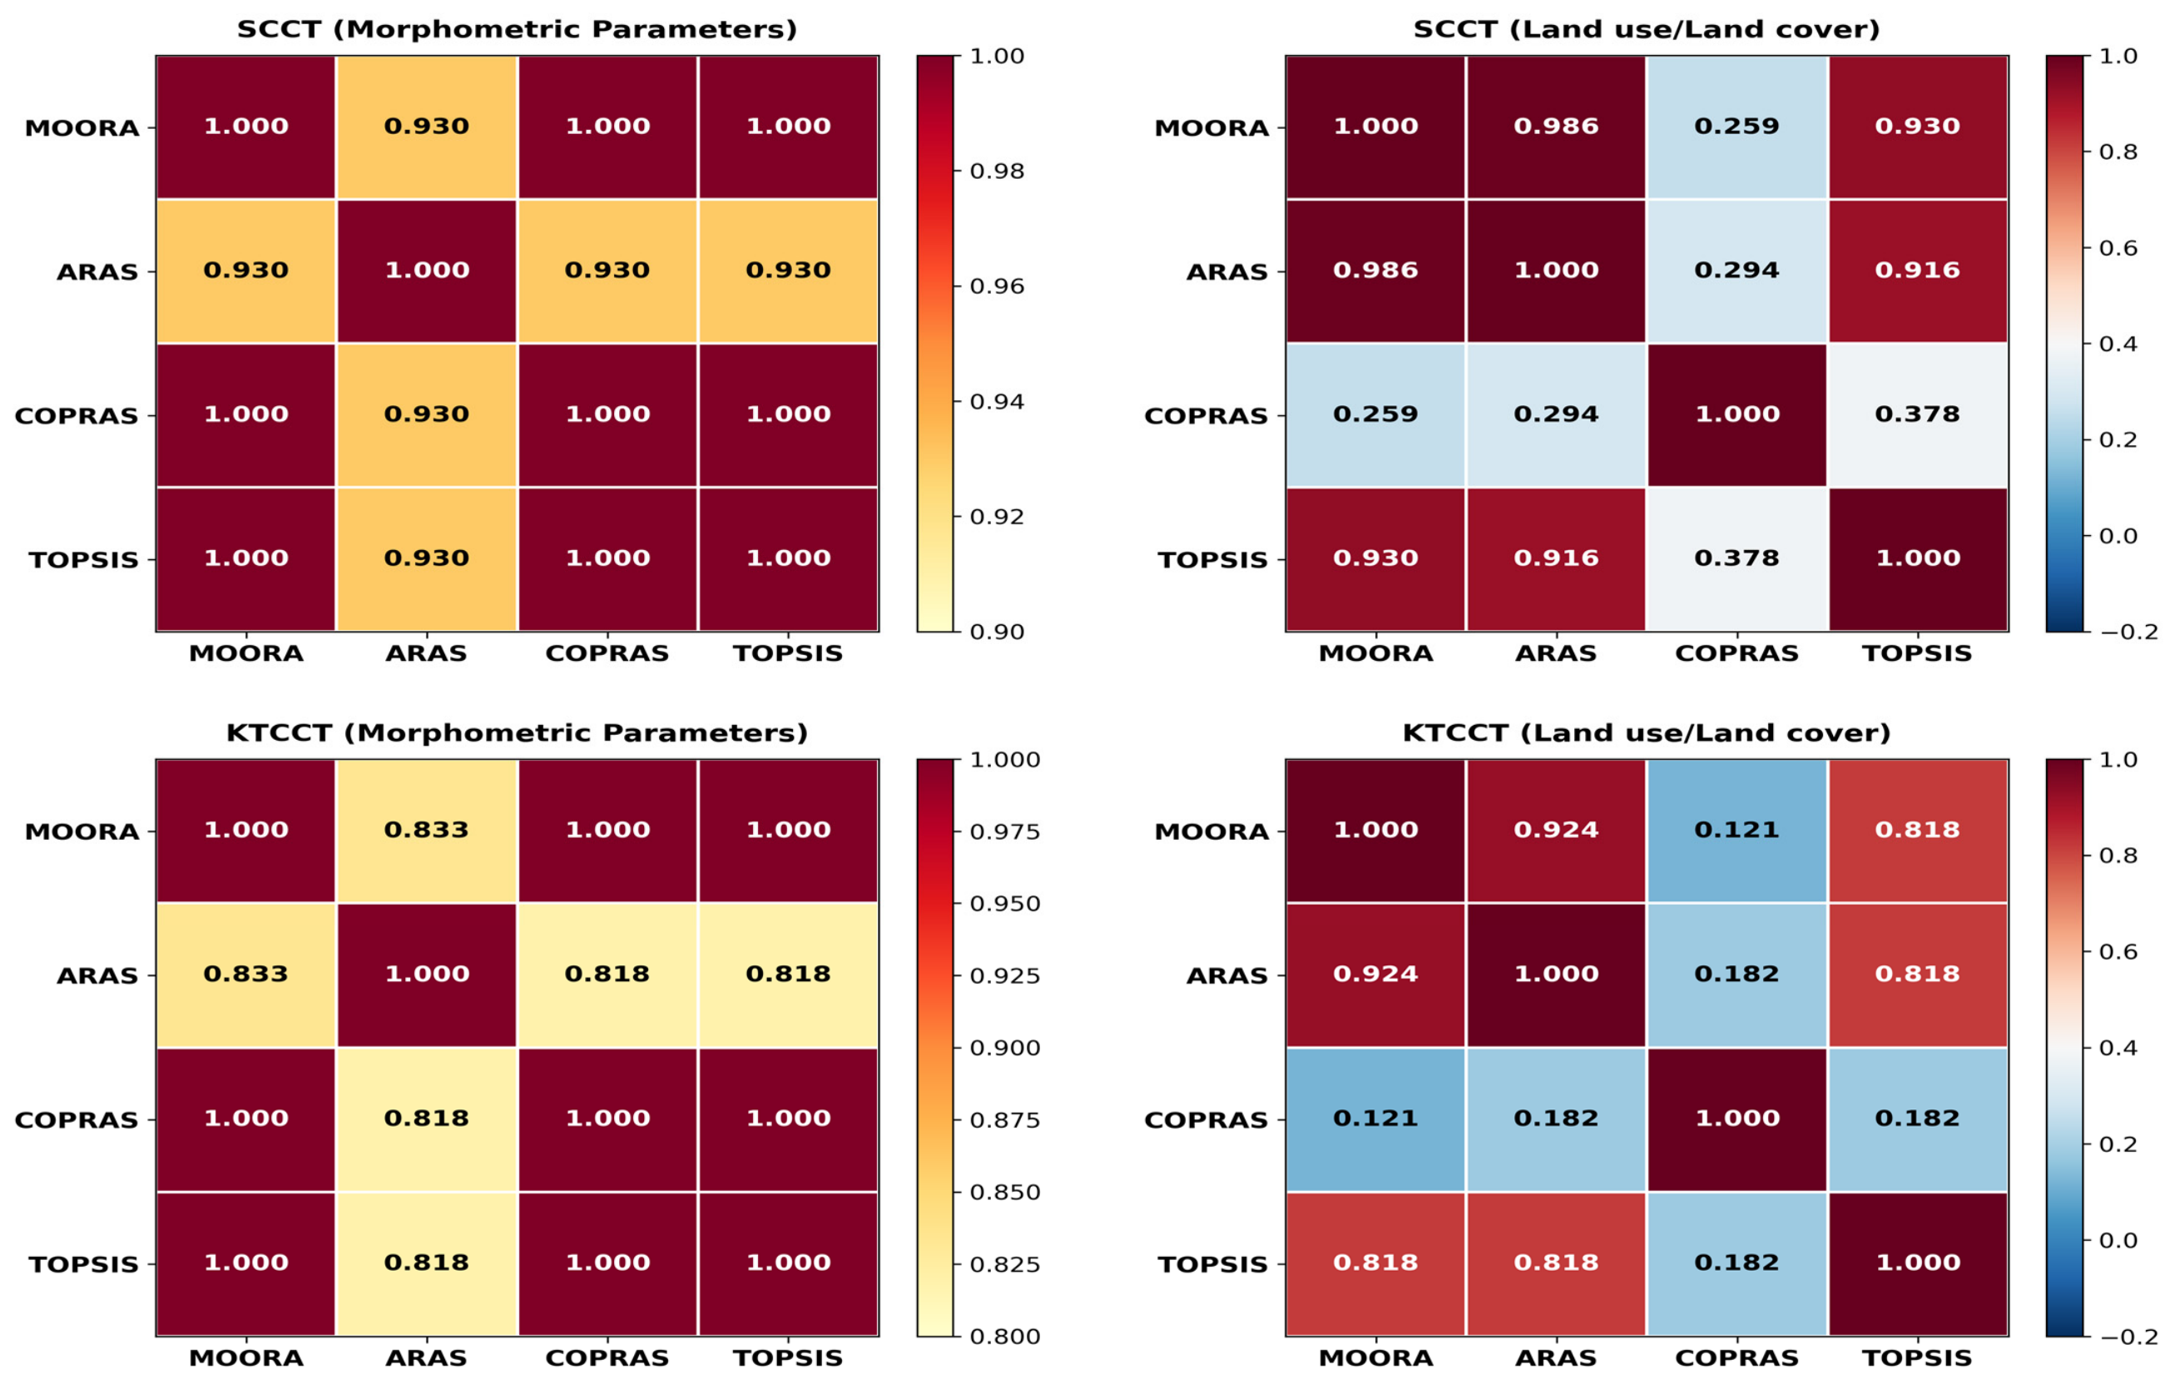
The SCCT and KTCCT nonparametric correlation tests served to assess agreement among the four MCDM methods. The comparison results based on morphometric parameters with SCCT and KTCCT appear in Table 13. The SCCT analysis shows that MOORA, ARAS, and COPRAS have perfect correlations with each other (ρ = 1.000), indicating full agreement in sub-basin prioritization. TOPSIS also shows strong correlations with the other methods (ρ = 0.930), confirming that all four methods produce highly similar rankings for morphometric analysis. The average SCCT scores place MOORA, ARAS, and COPRAS at the top (0.9825), followed by TOPSIS (0.9475). The KTCCT analysis also shows that MOORA, ARAS, and COPRAS have perfect agreement with each other (τ = 1.000), while TOPSIS shows strong correlations with the other methods (τ = 0.833 with MOORA, 0.818 with ARAS and COPRAS). The average KTCCT scores place MOORA first (0.9582), followed by ARAS and COPRAS (0.9545), and TOPSIS (0.8672). These findings confirm that all four MCDM methods produce consistent prioritization for morphometric analysis, with MOORA as the top method based on both SCCT (0.9825) and KTCCT (0.9582) scores. The strong agreement among the methods supports the robustness of morphometric prioritization.
Table 13.
Comparison of MCDM models based on morphometric parameters and LULC classes.
3.9. Non-Parametric Tests on LULC
The comparison of models based on LULC parameters with SCCT and KTCCT appears in Table 13. The SCCT analysis shows that MOORA and TOPSIS have the strongest correlation (ρ = 0.986), followed by MOORA and COPRAS (ρ = 0.930). ARAS has weaker correlations with other methods (ρ = 0.258–0.378). The average SCCT scores place COPRAS first (0.806), followed by TOPSIS (0.799) and MOORA (0.7237), while ARAS ranks last (0.3712). The KTCCT analysis shows that MOORA and TOPSIS have the highest correlation (τ = 0.924), followed by TOPSIS and COPRAS (τ = 0.818). ARAS has very weak correlations with other methods (τ = 0.121–0.182). The average KTCCT scores place TOPSIS first (0.731), followed by MOORA (0.7157) and COPRAS (0.7045), while ARAS ranks last (0.3712).
Based on combined SCCT and KTCCT scores, TOPSIS stands as the best-performing method for LULC analysis with a combined score of 0.765, followed by COPRAS (0.7552) and MOORA (0.7547). ARAS shows weak performance with a combined score of 0.2358. This result confirms its sensitivity to datasets with many zero values, a common issue in LULC data where classes such as water and trees remain absent in most sub-basins. Figure 8 represents the heat map of SCCT and KTCCT for morphometric and LULC classes, respectively.
Figure 8.
The heat map of the morphometric and LULC results from two non-parametric tests, SCCT and KTCCT.
3.10. Final Erosion Susceptibility Ranking for Wadi Numan
To determine the combined contribution of morphometric parameters and LULC classes to soil erosion susceptibility, the best-performing models were integrated based on the consistency assessment. For morphometric analysis, MOORA and COPRAS were selected as the best and second methods, respectively, based on their high SCCT and KTCCT scores (MOORA: 0.9767, COPRAS: 0.9767). For LULC analysis, TOPSIS and COPRAS were selected as the best and second methods, respectively, based on their combined scores (TOPSIS: 0.6867, COPRAS: 0.6737).
A weighted approach was used to combine morphometric and LULC rankings. The weights were assigned in proportion to the number of parameters in each dataset, so each parameter had equal influence on the final score. Morphometric parameters, with 16 criteria, received a weight of 72.7%, while LULC classes, with 6 criteria, received a weight of 27.3%. This proportional weighting scheme is widely used in similar studies [9,14] and provides a clear and defensible basis for integration.
The final weighted score for each sub-basin was calculated as
Final Score = (0.727 × MOORA morphometry rank) + (0.273 × TOPSIS LULC rank)
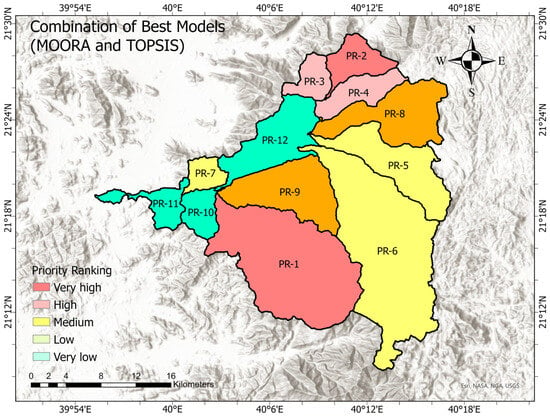
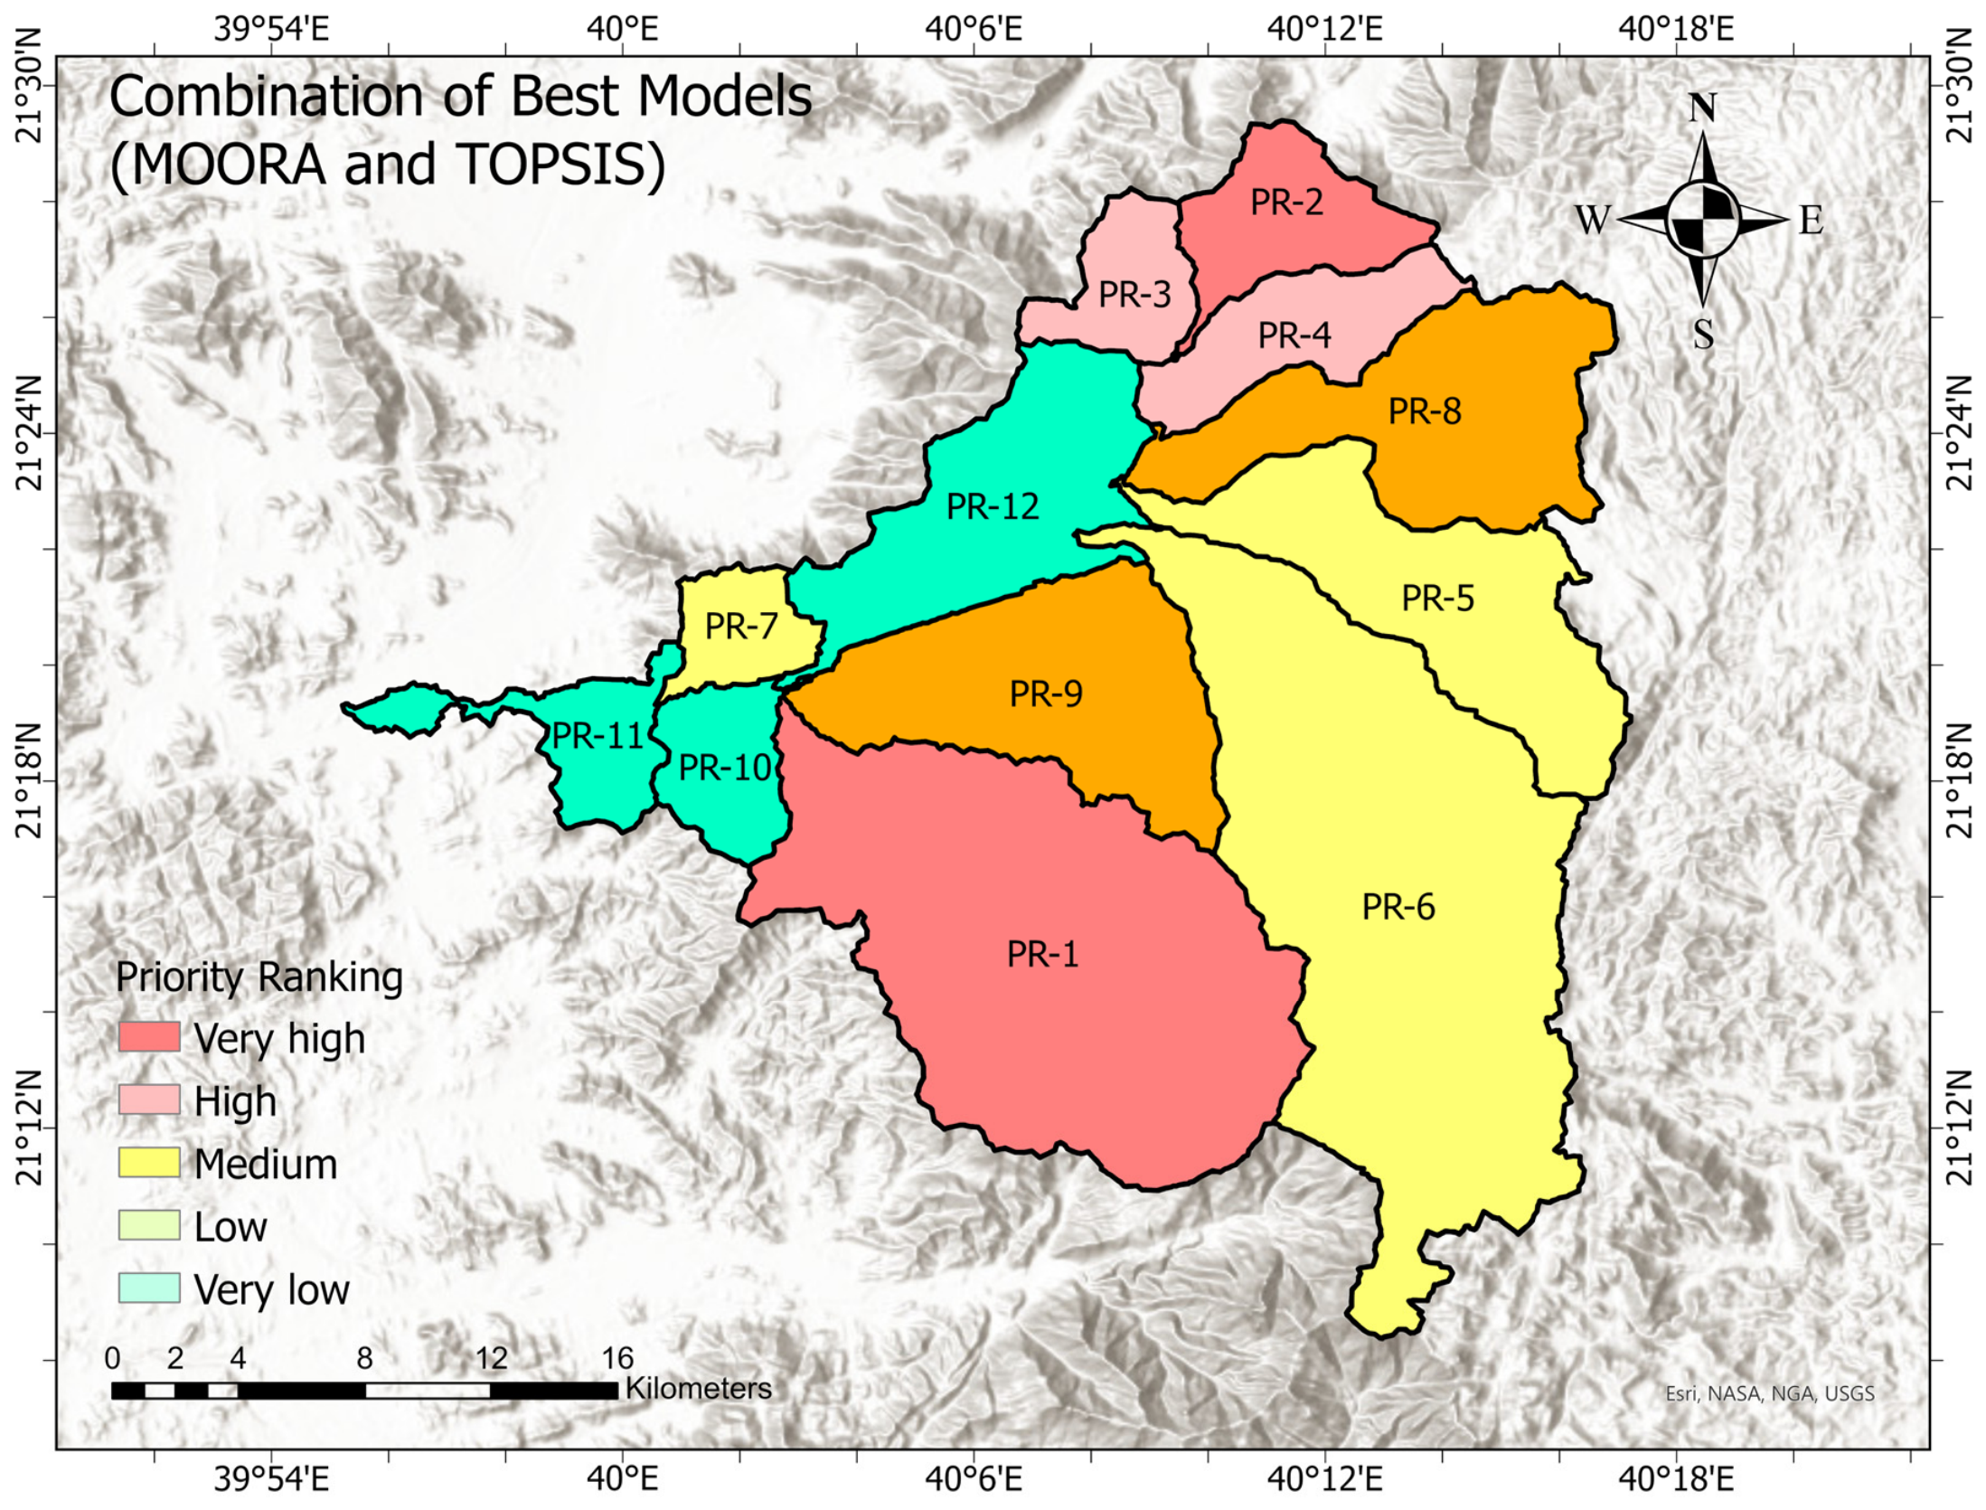
The results show that among the 12 sub-basins, SB-9 (3.45) and SB-1 (3.64) recorded the lowest weighted scores and therefore show the highest susceptibility to soil erosion. SB-2 (4.64) and SB-3 (4.82) followed, while SB-7 (10.27) and SB-12 (9.82) recorded the highest scores, which reflect minimal erosion susceptibility. The sub-basins were classified into five priority levels-very high, high, medium, low, and very low-based on the weighted scores. The results indicate that out of the 12 sub-basins, two belong to the very high susceptibility class, two to the high class, three to the medium class, two to the low class, and three to the very low susceptibility class. The results of the combined prioritization are presented in Table 14 and Figure 9.
Table 14.
Prioritization of sub-basins using a combined model based on average weights from MOORA (morphometric parameters) and TOPSIS (LULC).
Figure 9.
Final priotrization of sub-basins after taking the average of the best two models (MOORA for morphometric parameters) and (TOPSIS for LULC).
4. Discussion
4.1. Morphometric Analysis and Erosion Susceptibility
Prioritization of sub-basins plays a key role in the identification of areas that show high susceptibility to soil erosion and in the application of effective conservation measures. Many studies highlight the importance of morphometric analysis and advanced approaches in the selection of sub-basins for sustainable watershed management across different environments [9,14,25,26,45,46,47,48,49,50,51,52].
In this study, an integrated framework that combines morphometric analysis with advanced MCDM techniques (MOORA, TOPSIS, ARAS, and COPRAS) was applied to assess and rank sub-basins of the Wadi Numan basin based on erosion sensitivity. The CRITIC method served to derive objective weights for the criteria so that prioritization reflects inherent data characteristics rather than subjective judgment [35]. This approach agrees with previous research that highlights the role of objective weighting in MCDM applications for environmental management [26,44,45,53,54,55,56]. The morphometric analysis shows that basin shape and relief characteristics have the strongest influence on erosion susceptibility. Elongated basins with high shape factor values direct runoff into narrow channel networks, which increases peak flow and erosion potential during intense rainfall [15,16,17]. Sub-basins with these characteristics consistently rank among the most terrain-sensitive areas, confirming that basin geometry controls hydrological response and erosion risk. This result agrees with classical geomorphological theory [34]. Relief-related parameters, such as relief ratio and ruggedness number, also have a dominant role in erosion susceptibility. Steep slopes and high relative relief allow runoff to gain velocity quickly, which increases sediment transport capacity [14,31]. MOORA, ARAS, and COPRAS show strong and statistically significant agreement, confirming that these methods produce stable prioritization results for terrain data. TOPSIS shows weaker correlation with the other methods in morphometric analysis, which suggests that distance-based approaches may respond strongly to extreme values in highly variable datasets.
4.2. LULC and Its Role in Erosion Susceptibility
Land use and land cover also have a strong effect on drainage patterns and erosion susceptibility in sub-basins [14,19]. The CRITIC analysis shows that built-up areas and bare ground are the most influential LULC factors, and together they account for a large share of total LULC weight. This result has clear implications for watershed management. The absence of vegetation and the presence of impervious surfaces play a more critical role than vegetation presence alone. This finding agrees with Al-Juaidi [21] in eastern Jeddah, where urban expansion increased runoff connectivity and downstream erosion. The consistency assessment highlights clear differences in method performance.
TOPSIS shows the strongest agreement with other methods and performs best overall, followed by COPRAS. ARAS shows negative correlations with all other methods, reflecting difficulty in handling datasets with many zero values. This result agrees with earlier studies that reported the sensitivity of ARAS to data distribution and recommended MOORA, TOPSIS, and COPRAS for such datasets [43,44,45].
4.3. Final Prioritization and Comparison with Literature
The final combined prioritization uses MOORA for morphometric analysis and TOPSIS for LULC analysis with proportional weights of 72.7% for morphometric parameters and 27.3% for LULC. The results indicate that terrain exerts dominant influence on the final score, since morphometric parameters outnumber LULC classes. SB-9 ranks first, with a top morphometric rank and a weaker LULC rank. Although it has extensive rangeland cover, its high shape factor and high bifurcation ratio increase its overall erosion risk. This result confirms that terrain acts as the main driver of erosion in this arid mountainous basin. This finding agrees is generally consistent with the result of Adem et al. [36], who reported pronounced hydrological activity and flash flood susceptibility within the Wadi Numan basins. SB-1 ranks second, with a strong morphometric position and a moderate LULC rank. This sub-basin represents a transition zone where moderate terrain combines with a significant built-up area, reflecting the influence of urban expansion on erosion potential. This pattern agrees with Meshram et al. [28] in Indian watersheds, where land use change altered erosion susceptibility. SB-2 and SB-3 rank third and fourth and fall within the high-priority class. Both sub-basins show high relief ratios and strong rangeland cover, indicating that terrain steepness remains the main factor behind erosion risk. SB-5, SB-6, and SB-10 rank fifth, sixth, and seventh and fall within the medium priority class. SB-10 shows strong LULC conditions but weak morphometric characteristics, which demonstrates that favorable land cover cannot offset unfavorable terrain and that terrain dominates the final score. SB-4 ranks eighth despite having a strong morphometric position, because its high rangeland coverage reduces its overall risk. This result highlights that terrain defines baseline erosion risk, while land cover can reduce or increase that risk. Protection of existing vegetation in terrain-sensitive areas is therefore essential. This conclusion agrees with Shekar et al. [26] and Altaf et al. [13]. SB-11, SB-12, and SB-7 rank tenth, eleventh, and twelfth and fall within the very low-priority class. SB-11 shows weak morphometric characteristics despite a favorable LULC condition, reflecting a high proportion of built-up areas on relatively flat terrain. SB-12 shows weak morphometric characteristics and moderate LULC conditions, which reflect gentle slopes and sufficient vegetation cover. SB-7 shows weak results in both analyses, which reflect moderate terrain with higher bare ground and crop coverage.
4.4. Uncertainties, Limitations, and Future Research Directions
This study has several important limitations that must be explicitly acknowledged. First and most importantly, no independent field-based validation was performed. The SCCT and KTCCT tests assess internal ranking consistency among MCDM methods and do not validate results against observed erosion data (sediment records, field surveys, or RUSLE-derived soil loss maps). The results should be interpreted as a theoretically grounded prioritization of potential erosion susceptibility rather than a validated representation of actual erosion rates. Second, the DEM-derived morphometric parameters are subject to uncertainties from sink-filling artifacts, spatial resolution, and KACST DEM vertical accuracy. Third, the globally trained pre-classified LULC product introduces classification uncertainty for arid land-cover transitions. Furthermore, CRITIC weighting reflects statical information content and criterion discrimination ability rather than direct physical of individual parameters on erosion process.
Future research should (i) incorporate RUSLE-based or sediment yield modeling for independent validation; (ii) conduct field surveys in very high and high priority sub-basins; (iii) perform sensitivity analysis on CRITIC weights; and (iv) integrate rainfall erosivity data from rainfall stations for a comprehensive RUSLE assessment of Wadi Numan.
Therefore, the prioritization results should be interpreted as a relative assessment of erosion susceptibility based on morphometric and LULC characteristics rather than a validated representation of actual erosion rates. Although the results are generally consistent with previous hydrological and flood-related investigation conducted in the Wadi Numan, independent validation through field investigation, sediment observation, or soil loss modeling would further strengthen the applicability and reliability of the proposed framework.
5. Summary and Conclusions
This study aimed to develop an integrated GIS-based MCDM framework for soil erosion susceptibility assessment and sub-basin prioritization in the Wadi Numan basin, Makkah Region, Saudi Arabia. The application of satellite-based RS datasets with MCDM models in an ArcGIS environment for the assessment of morphometric parameters and LULC classes in relation to soil erosion susceptibility offers an effective framework for erosion susceptibility assessment in data-scarce environments.
With respect to morphometric parameters, the MOORA model demonstrated the highest performance in sub-basin prioritization among the four MCDM methods, with the highest average SCCT score and KTCCT score, while the TOPSIS model showed the strongest agreement among the four MCDM methods for LULC-based analysis. The study area was divided into five priority categories based on the combined model. The combined prioritization based on morphometric and LULC analysis indicates that SB-9 and SB-1 have the highest susceptibility to erosion and require immediate intervention to reduce soil loss in vulnerable areas. SB-2 and SB-3 also require high-priority conservation measures. Identifying erosion-prone locations is crucial to developing and implementing effective soil and water conservation strategies in mountainous arid environments. Appropriate conservation measures, including check dams, slope stabilization, revegetation, controlled grazing, and green infrastructure, should be prioritized within the very high and high susceptibility sub-basins.
Although the proposed framework provides a practical decision-support tool for identifying erosion-prone sub-basins in data-scarce environments, the resulting prioritization should be regarded as a relative susceptibility assessment. Future studies should seek to validate these findings using field observations, sediment yield measurements, or RUSLE-based soil loss estimates.
In general, the provided framework presents a scientifically sound decision-support strategy for watershed management that is consistent with similar approaches reported in the literature. The integration of objective weighting, numerous MCDM approaches, and consistency validation in this method not only improves the reliability of erosion susceptibility mapping but also enables its implementation in similar arid and semi-arid settings across the Arabian Peninsula and in other dryland regions across the world that are comparable.
Author Contributions
Conceptualization, A.E.M.A.-J.; Methodology, O.H.A., A.E.M.A.-J. and M.S.E.; Software, O.H.A. and A.E.M.A.-J.; Validation, O.H.A., A.E.M.A.-J. and M.S.E.; Formal analysis, O.H.A.; Investigation, O.H.A. and A.E.M.A.-J.; Resources, O.H.A. and A.E.M.A.-J.; Data curation, O.H.A.; Writing—original draft, O.H.A.; Writing—review & editing, A.E.M.A.-J. and M.S.E.; Visualization, O.H.A., A.E.M.A.-J. and M.S.E.; Supervision, A.E.M.A.-J. and M.S.E.; Project administration, A.E.M.A.-J.; Funding acquisition, O.H.A. All authors have read and agreed to the published version of the manuscript.
Funding
The research was funded by KAU Endowment (WAQF) at King Abdulaziz University, Jeddah, Saudi Arabia (WAQF: 2200864-135-2026).
Data Availability Statement
The raw data supporting the conclusions of this article will be made available by the authors on request.
Acknowledgments
The authors acknowledge with thanks WAQF and the Deanship of Scientific Research (DSR) for technical and financial support.
Conflicts of Interest
The authors declare no conflict of interest.
References
- Girma, R.; Abraham, T.; Muluneh, A. Quantitative evaluation of watershed attributes for water resources management in the Rift Valley Lakes Basin, Ethiopia: A case from Tikur Wuha river watershed. Appl. Water Sci. 2020, 10, 196. [Google Scholar] [CrossRef] [Scilit]
- Al-Juaidi, A.E.M. Enhancing flood vulnerability assessment in eastern Jeddah watersheds using advanced multicriteria decision analysis and sensitivity evaluation. Environ. Dev. Sustain. 2025. [Google Scholar] [CrossRef] [Scilit]
- Molla, T.; Sisheber, B. Estimating soil erosion risk and evaluating erosion control measures for soil conservation planning at Koga watershed in the highlands of Ethiopia. Solid Earth 2017, 8, 13–25. [Google Scholar] [CrossRef] [Scilit]
- Singh, G.; Panda, R.K. Grid-cell based assessment of soil erosion potential for identification of critical erosion prone areas using USLE, GIS and remote sensing: A case study in the Kapgari watershed, India. Int. Soil Water Conserv. Res. 2017, 5, 202–211. [Google Scholar] [CrossRef] [Scilit]
- Al-Juaidi, A.E.M.; Aliewi, A.S. Assessing SCS-CN and its revised models for Wadi runoff estimation in data-scarce Kuwait catchments. Arab. J. Geosci. 2026, 19, 19. [Google Scholar] [CrossRef] [Scilit]
- Al-Juaidi, A.E.M.; Emam, A.A. Flood vulnerability assessment of Wadi Numan, Makkah: Insights from Advanced Multicriteria Decision Analysis and Fuzzy Logic Techniques. J. Hydrol. Eng. 2026, 31, 040260041-1–040260041-15. [Google Scholar] [CrossRef] [Scilit]
- Abdelkarim, A.; Gaber, A.F. Flood risk assessment of the Wadi Nu’man Basin, Saudi Arabia. Water 2019, 11, 1887. [Google Scholar] [CrossRef] [Scilit]
- Tadesse, L.; Suryabhagavan, K.V.; Sridhar, G.; Legesse, G. Land use and land cover changes and soil erosion in Yezat watershed, North Western Ethiopia. Int. Soil Water Conserv. Res. 2017, 5, 85–94. [Google Scholar] [CrossRef] [Scilit]
- Arabameri, A.; Pradhan, B.; Pourghasemi, H.R.; Rezaei, K. Identification of erosion-prone areas using different multi-criteria decision-making techniques and GIS. Geomat. Nat. Hazards Risk 2018, 9, 1129–1155. [Google Scholar] [CrossRef] [Scilit]
- Pakhmode, V.; Kulkarni, H.; Deolankar, S.B. Hydrological-drainage analysis in watershed-programme planning: A case from the Deccan basalt, India. Hydrogeol. J. 2003, 11, 595–604. [Google Scholar] [CrossRef] [Scilit]
- Jaiswal, R.K.; Ghosh, N.C.; Galkate, R.V.; Thomas, T. Multi criteria decision analysis (MCDA) for watershed prioritization. Aquat. Procedia 2015, 4, 1553–1560. [Google Scholar] [CrossRef] [Scilit]
- Romshoo, S.A.; Bhat, S.A.; Rashid, I. Geoinformatics for assessing the morphometric control on hydrological response at watershed scale in the Upper Indus Basin. J. Earth Syst. Sci. 2012, 121, 659–686. [Google Scholar] [CrossRef] [Scilit]
- Altaf, S.; Meraj, G.; Romshoo, S.A. Morphometry and land cover based multi-criteria analysis for assessing the soil erosion susceptibility of the western Himalayan watershed. Environ. Monit. Assess. 2014, 186, 8391–8412. [Google Scholar] [CrossRef] [Scilit] [PubMed]
- Meshram, S.G.; Sharma, S.K. Prioritization of watershed through morphometric parameters: A PCA-based approach. Appl. Water Sci. 2017, 7, 1505–1519. [Google Scholar] [CrossRef] [Scilit]
- Horton, R.E. Erosional development of streams and their drainage basins; hydrophysical approach to quantitative morphology. GSA Bull. 1945, 56, 275–370. [Google Scholar] [CrossRef] [Scilit]
- Strahler, A.N. Quantitative analysis of watershed geomorphology. Eos Trans. Am. Geophys. Union 1957, 38, 913–920. [Google Scholar] [CrossRef] [Scilit]
- Shelar, R.; Shinde, S.; Pande, C.B.; Moharir, K.N.; Orimoloye, I.R.; Mishra, A.P.; Varade, A.M. Sub-watershed prioritization of Koyna River basin in India using multi criteria analytical hierarchical process, remote sensing and GIS techniques. Phys. Chem. Earth 2022, 128, 103219. [Google Scholar] [CrossRef] [Scilit]
- Al-Juaidi, A.E.M. The interaction of topographic slope with various geo-environmental flood-causing factors on flood prediction and susceptibility mapping. Environ. Sci. Pollut. Res. 2023, 30, 59327–59348. [Google Scholar] [CrossRef] [Scilit] [PubMed]
- Iqbal, M.; Sajjad, H. Watershed prioritization using morphometric and land use/land cover parameters of Dudhganga Catchment Kashmir Valley India using spatial technology. J. Remote Sens. GIS 2014, 3, 1. [Google Scholar] [CrossRef]
- Chitsaz, N.; Banihabib, M.E. Comparison of different multi-criteria decision-making models in prioritizing flood management alternatives. Water Resour. Manag. 2015, 29, 2503–2525. [Google Scholar] [CrossRef] [Scilit]
- Al-Juaidi, A.E.M. Prioritization of sub-watershed in Eastern Jeddah using PCA-WSA hybrid modeling approach. Environ. Dev. Sustain. 2024, 28, 2921–2945. [Google Scholar] [CrossRef] [Scilit]
- Al-Juaidi, A.E.M.; Taylan, O.; Toros, H. A comparative evaluation of machine learning classification models utilizing GIS and key flood-causing factors for enhancing flood vulnerability assessment. Environ. Dev. Sustain. 2025. [Google Scholar] [CrossRef] [Scilit]
- Mardani, A.; Jusoh, A.; Nor, K.M.; Khalifah, Z.; Zakwan, N.; Valipour, A. Multiple criteria decision-making techniques and their applications—A review of the literature from 2000 to 2014. Econ. Res.-Ekon. Istraž. 2015, 28, 516–571. [Google Scholar] [CrossRef] [Scilit]
- Brauers, W.K.; Zavadskas, E.K. The MOORA method and its application to privatization in a transition economy. Control Cybern. 2006, 35, 445–469. [Google Scholar]
- Sampath, V.K.; Radhakrishnan, N. Prioritization of sub-watersheds susceptible to soil erosion using different combinations of objective weighting and MCDM techniques in an ungauged river basin. Water Resour. Manag. 2024, 38, 3447–3469. [Google Scholar] [CrossRef] [Scilit]
- Shekar, P.R.; Mathew, A.; Hasher, F.F.B.; Mehmood, K.; Zhran, M. Towards sustainable development: Ranking of soil erosion-prone areas using morphometric analysis and multi-criteria decision-making techniques. Sustainability 2025, 17, 2124. [Google Scholar] [CrossRef] [Scilit]
- Saha, P.; Das, S.; Sarkar, A.; Gayen, S.K. Mapping soil erosion susceptibility by integrating AHP-TOPSIS and RUSLE model: A case study of the Kaljani River Basin, West Bengal. J. Sediment. Environ. 2025, 10, 4. [Google Scholar] [CrossRef] [Scilit]
- Meshram, S.G.; Hasan, M.A.; Meshram, C.; Ilderomi, A.R.; Tirivarombo, S.; Islam, S. Assessing vulnerability to soil erosion based on fuzzy best worse multi-criteria decision-making method. Appl. Water Sci. 2022, 12, 219. [Google Scholar] [CrossRef] [Scilit]
- Nabavi, A.; Sharma, S.; Kumar, V. Sensitivity assessment of multi-criteria decision-making methods. arXiv 2024, arXiv:2403.11569. [Google Scholar] [CrossRef] [Scilit]
- Abassi, M.E.; Ousmana, H.; Saouita, J.; El-Hmaidi, A.; Iallamen, Z.; Jaddi, H.; Aouragh, M.H.; Boufala, M.; Kasse, Z.; El Ouali, A.; et al. The combination of multi-criteria decision-making (MCDM) and morphometric parameters for prioritizing the erodibility of sub-watersheds in the Ouljet Es Soltane basin (North of Morocco). Heliyon 2024, 10, e38228. [Google Scholar] [CrossRef] [Scilit] [PubMed]
- Singh, R.; Pathak, V.K.; Kumar, R.; Dikshit, M.; Aherwar, A.; Singh, V.; Singh, T. A historical review and analysis on MOORA and its fuzzy extensions for different applications. Heliyon 2024, 10, e25453. [Google Scholar] [CrossRef] [Scilit] [PubMed]
- Yunus, A.P.; Oguchi, T.; Hayakawa, Y.S. Morphometric analysis of drainage basins in the Western Arabian Peninsula using multivariate statistics. Int. J. Geosci. 2014, 5, 527–539. [Google Scholar] [CrossRef]
- Biswas, S.; Sudhakar, S.; Desai, V.R. Prioritization of subwatersheds based on morphometric analysis of drainage basin: A remote sensing and GIS approach. J. Indian Soc. Remote Sens. 2002, 30, 203–215. [Google Scholar] [CrossRef] [Scilit]
- Diakoulaki, D.; Mavrotas, G.; Papayannakis, L. Determining objective weights in multiple criteria problems: The CRITIC method. Comput. Oper. Res. 1995, 22, 763–770. [Google Scholar] [CrossRef] [Scilit]
- Aghayari, L.; Saraskanroud, S.; Zeinali, B. Investigating land use changes and their effects on soil erosion: Case study Namin County. J. Environ. Sci. 2024, 12, 142–158. [Google Scholar] [CrossRef]
- Adem, E.; Elfeki, A.; Chaabani, A.; Yenehun, K.; Yenehun, A. Impact of satellite precipitation estimation methods on the hydrological response: Case study Wadi Nu’man basin, Saudi Arabia. Theor. Appl. Climatol. 2024, 155, 3907–3925. [Google Scholar] [CrossRef] [Scilit] [PubMed]
- Karra, K.; Kontgis, C.; Statman-Weil, Z.; Mazzariello, J.C.; Mathis, M.; Brumby, S.P. Global land use/land cover with Sentinel-2 and deep learning. In Proceedings of the 2021 IEEE International Geoscience and Remote Sensing Symposium (IGARSS), Brussels, Belgium, 11–16 July 2021; pp. 4704–4707. [Google Scholar] [CrossRef] [Scilit]
- Chakraborty, S.; Datta, H.N.; Kalita, K.; Chakraborty, S. A narrative review of multi-objective optimization on the basis of ratio analysis (MOORA) method in decision making. OPSEARCH 2023, 60, 1844–1887. [Google Scholar] [CrossRef] [Scilit]
- Turskis, Z.; Zavadskas, E.K. A new fuzzy additive ratio assessment method (ARAS-F). Case study: The analysis of fuzzy multiple criteria in order to select the logistic centers location. Transport 2010, 25, 159–172. [Google Scholar] [CrossRef] [Scilit]
- Zavadskas, E.K.; Kaklauskas, A.; Turskis, Z.; Tamosaitiene, J. Multi-attribute decision-making model by applying grey numbers. Informatica 2009, 20, 305–320. [Google Scholar] [CrossRef] [Scilit]
- Zavadskas, E.K.; Kaklauskas, A.; Sarka, V. The new method of multicriteria complex proportional assessment of projects. Technol. Econ. Dev. Econ. 1994, 1, 131–139. [Google Scholar]
- Hwang, C.L.; Yoon, K. Multiple Attribute Decision Making: Methods and Applications, a State-of-the-Art Survey; Springer: New York, NY, USA, 1981. [Google Scholar] [CrossRef] [Scilit]
- Szmidt, E.; Kacprzyk, J. The Spearman and Kendall rank correlation coefficients between intuitionistic fuzzy sets. In Proceedings of the 7th Conference of the European Society for Fuzzy Logic and Technology (EUSFLAT-2011), Aix-Les-Bains, France, 18–22 July 2011; Atlantis Press: Paris, France, 2011; pp. 521–528. [Google Scholar] [CrossRef] [Scilit]
- Malik, A.; Kumar, A.; Kandpal, H. Morphometric analysis and prioritization of sub-watersheds in a hilly watershed using weighted sum approach. Arab. J. Geosci. 2019, 12, 118. [Google Scholar] [CrossRef] [Scilit]
- Ameri, A.A.; Pourghasemi, H.R.; Cerda, A. Erodibility prioritization of sub-watersheds using morphometric parameters analysis and its mapping: A comparison among TOPSIS, VIKOR, SAW, and CF multi-criteria decision making models. Sci. Total Environ. 2018, 613–614, 1385–1400. [Google Scholar] [CrossRef] [Scilit] [PubMed]
- Bera, A.; Mukhopadhyay, B.P.; Das, D. Morphometric analysis and prioritization of sub-watersheds in Hinglo river basin, India using remote sensing and GIS. Spat. Inf. Res. 2018, 26, 591–597. [Google Scholar]
- Athawale, V.M.; Chakraborty, S. A comparative study on the ranking performance of some multi-criteria decision-making methods for industrial robot selection. Int. J. Ind. Eng. Comput. 2011, 2, 831–850. [Google Scholar] [CrossRef] [Scilit]
- Diwakar, A.; Singh, S.; Pramanik, M.; Choudhary, S.; Negi, M.S. Soil erodibility mapping using watershed prioritization and morphometric parameters in conjunction with WSA, SPR and AHP-TOPSIS models in Mandakini basin, India. Int. J. River Basin Manag. 2024, 22, 143–160. [Google Scholar] [CrossRef] [Scilit]
- Ganie, P.A.; Posti, R.; Bharti, V.S.; Kunal, K.; Sarma, D.; Pandey, P.K. Erosion landscape characterization in the Himalayan basin: Insights from geospatial data and multi-criteria evaluation. Environ. Monit. Assess. 2025, 197, 29. [Google Scholar] [CrossRef] [Scilit] [PubMed]
- El Jazouli, A.; Barakat, A.; Khellouk, R. GIS-multicriteria evaluation using AHP for landslide susceptibility mapping in Oum Er Rbia high basin (Morocco). Geoenviron. Disasters 2019, 6, 3. [Google Scholar] [CrossRef] [Scilit]
- Bou-Imajjane, L.; Belfoul, M.A.; Elkadiri, R.; Stokes, M. Soil erosion assessment in a semi-arid environment: A case study from the Argana Corridor, Morocco. Environ. Earth Sci. 2020, 79, 14. [Google Scholar] [CrossRef] [Scilit]
- Meliho, M.; Khattabi, A.; Mhammdi, N. Spatial assessment of soil erosion risk by integrating remote sensing and GIS techniques: A case of Tensift watershed in Morocco. Environ. Earth Sci. 2020, 79, 255. [Google Scholar] [CrossRef] [Scilit]
- Akbari, M.; Memarian, H.; Neamatollahi, E.; Shalamzari, M.J.; Noughani, M.A.; Zakeri, D. Prioritizing policies and strategies for desertification risk management using MCDM-DPSIR approach in northeastern Iran. Environ. Dev. Sustain. 2021, 23, 2503–2523. [Google Scholar] [CrossRef] [Scilit]
- Ghosh, B.; Mukhopadhyay, S. Erosion susceptibility mapping of sub-watersheds for management prioritization using MCDM-based ensemble approach. Arab. J. Geosci. 2021, 14, 349. [Google Scholar] [CrossRef] [Scilit]
- Bhattacharya, R.K.; Chatterjee, N.D.; Das, K. Sub-basin prioritization for assessment of soil erosion susceptibility in Kangsabati, a plateau basin: A comparison between MCDM and SWAT models. Sci. Total Environ. 2020, 734, 139474. [Google Scholar] [CrossRef] [Scilit] [PubMed]
- Shekar, P.R.; Mathew, A. Sub-watershed prioritization for soil erosion: A combined morphometric analysis, PCA, and MCDM approach. J. Eng. Appl. Sci. 2025, 72, 168. [Google Scholar] [CrossRef] [Scilit]

Disclaimer/Publisher’s Note: The statements, opinions and data contained in all publications are solely those of the individual author(s) and contributor(s) and not of MDPI and/or the editor(s). MDPI and/or the editor(s) disclaim responsibility for any injury to people or property resulting from any ideas, methods, instructions or products referred to in the content. |
© 2026 by the authors. Licensee MDPI, Basel, Switzerland. This article is an open access article distributed under the terms and conditions of the Creative Commons Attribution (CC BY) license.