Article

Spatiotemporal Dynamics and Driving Mechanisms of Green Development Efficiency in the Yellow River Basin: Evidence from Innovation Rebound and Micro-Environmental, Social, and Governance (ESG) Reverse-Forcing Effects

1
School of Civil Engineering and Water Resources, Qinghai University, Xining 810016, China
2
Qinghai Provincial Key Laboratory of Energy-Saving Building Materials and Engineering Safety, Xining 810016, China
3
School of Public Administration, China University of Geosciences, Wuhan 430074, China
4
Qinghai Provincial Institute of Territorial Space Planning, Xining 810008, China
*
Authors to whom correspondence should be addressed.
Land 2026, 15(6), 946; https://doi.org/10.3390/land15060946
Submission received: 2 April 2026 / Revised: 21 May 2026 / Accepted: 28 May 2026 / Published: 31 May 2026

Abstract

Enhancing green development efficiency (GDE) is crucial for promoting ecological protection and high-quality growth in the Yellow River Basin (YRB). Using panel data from 48 prefecture-level cities in the YRB from 2010 to 2022, this study applies a Super-SBM model that accounts for undesirable outputs to measure GDE. Then, a modified gravity model and social network analysis (SNA) are used to identify the evolution of its spatial correlation. Additionally, a spatial Durbin model (SDM) is employed to examine the driving mechanisms from the dual perspectives of the innovation rebound effect and external micro-ESG (Environmental, Social, and Governance) reverse-forcing pressure. The results reveal the following: First, the spatial pattern of GDE in the YRB has changed significantly, showing an overall spatial imbalance, with efficiency improvements in the middle reaches and declines in the lower reaches. Notably, resource-based cities have improved GDE due to environmental regulations. Second, the spatial correlation network has evolved from a point-axis layout to a more complex network structure. However, spatial links among cities are mainly driven by geographic proximity, while collaborative ties between cities with similar economic features remain weak. Third, technological innovation has a significant negative effect on local GDE, likely due to the energy rebound effect. Meanwhile, the cross-regional transmission of the external supply chain ESG reverse-forcing mechanism remains weak, constrained by the carbon lock-in effect in the middle and upper reaches. These findings suggest that internal technological structures and external market constraints both influence GDE in the YRB. This research offers an empirical foundation for developing targeted, cross-regional collaborative governance policies.

1. Introduction

Green development efficiency (GDE) serves as a comprehensive evaluation metric within the ecological–economic–social system, reflecting the extent to which various input factors are effectively allocated to balance economic growth with environmental carrying capacity [1]. Against the backdrop of the United Nations Sustainable Development Goals (SDGs)—which explicitly emphasize the global imperative to decouple economic growth from environmental degradation and foster sustainable industrialization—enhancing GDE has emerged as a universal challenge for heavily industrialized regions worldwide [2]. However, the theoretical adaptability and practical pathways of GDE exhibit profound regional heterogeneity globally. While post-industrial economies increasingly leverage stringent policy frameworks and mature green technologies—such as the European Green Deal—to achieve climate neutrality and drive rapid eco-efficiency gains [3], traditional resource-dependent basins around the world face a fundamentally different transition bottleneck. These regions often struggle with spatial path-dependence and severe innovation-induced energy rebound effects, where technological progress paradoxically stimulates resource consumption and hinders sustainable emission reductions [4]. Therefore, exploring the spatial dynamics and micro-mechanisms of GDE in such regions provides a crucial empirical sample for the global transition toward industrial decarbonization.
In China, the Yellow River Basin (YRB) serves as a critical ecological barrier and a major base for energy and heavy chemical industries in China. However, the region has long faced challenges such as water scarcity, ecological fragility, and high carbon emissions [5,6,7]. Driven by the national strategy for ecological protection and high-quality development in the YRB, the transformation of traditional economic growth models and the improvement of GDE—a metric that balances economic and ecological benefits—have emerged as crucial priorities for regional development [8]. Given the pronounced heterogeneity in natural resource endowments, industrial structures, and developmental stages across the upper, middle, and lower reaches of the basin, these spatial disparities may limit the implementation of uniform regional governance policies [9,10]. Consequently, this study evaluates the spatiotemporal evolution of GDE in the YRB and further explores its spatial pattern dynamics and the underlying driving mechanisms.
An extensive body of literature has systematically evaluated GDE through varied methodological lenses. Methodologically, evaluation frameworks have robustly transitioned from traditional radial Data Envelopment Analysis (DEA) to non-radial Slack-Based Measure (SBM) and Super-SBM models accounting for undesirable outputs, which effectively resolve the constraints of slack variables and multiple efficient unit rankings [11,12,13,14]. Regarding spatial characteristics, scholars have extensively investigated the spatiotemporal dynamics of GDE across national scales and major economic belts [15,16]. These studies predominantly employ continuous spatial clustering indices and static descriptive analyses to track efficiency distributions [17,18,19,20]. However, as regional economic linkages deepen, environmental governance has evolved from isolated urban efforts into complex collaborative networks. While some studies have introduced Social Network Analysis (SNA) to assess regional economic or carbon emission networks [21], its application to uncovering the hidden topological network properties of GDE—particularly from an evolutionary economic geography perspective—remains a critical frontier.
Concerning driving mechanisms, a wealth of empirical research has identified macro-level determinants, such as industrial structure, environmental regulations, and foreign direct investment [22,23,24]. Notably, when examining technological innovation, existing spatial frameworks predominantly operate on a linear assumption that technology unconditionally promotes green development [8,25,26,27,28]. Although emerging literature in energy economics acknowledges the Jevons paradox—where efficiency gains trigger energy rebound effects [29,30,31]—this non-linear dynamic has not been sufficiently incorporated into the spatial econometric modeling of heavy-chemical agglomerations like the YRB.
Furthermore, current spatial mechanism analyses are largely confined to macro-level statistical indicators. Concurrently, a distinct body of micro-level literature highlights the role of Environmental, Social, and Governance (ESG) criteria in driving corporate green innovation and supply chain compliance [32,33,34,35]. Synthesizing these two separate strands of literature reveals a distinct gap in cross-scale integration: the precise manner in which bottom-up, market-driven supply chain ESG pressures interact with top-down macro-regional eco-efficiency has not been systematically established.
To fill these methodological and theoretical gaps derived from the aforementioned synthesis, this study’s potential contributions are threefold:
First, this study enriches the methodological perspective on evaluating the spatial evolution of GDE [36,37]. While existing literature predominantly focuses on static evaluations or isolated spatial econometric analyses, this study integrates the Super-SBM model with SNA to dynamically capture the structural evolution of the GDE network across 48 prefecture-level cities in the YRB [37,38]. This approach provides a novel empirical framework for understanding the spatial heterogeneity and topological characteristics of green transitions within the basin.
Second, this study deepens the theoretical understanding of the nonlinear constraints and spatial spillover implications of technological transitions [37,39]. Deviating from the traditional linear assumption that “technology inevitably promotes green development,” this research employs a spatial Durbin model (SDM) that incorporates a quadratic term to explore potential non-linearities [40,41]. By doing so, it provides empirical evidence to identify the spatial externalities of economic development and the potential efficiency degradation associated with the “green rebound” effect, thereby highlighting the complex transition challenges faced by resource-based regions.
Third, this study expands the analytical framework, bridging external market-based regulations and regional governance. By constructing a prefecture-level “supply chain green pressure” index that aggregates micro-enterprise ESG ratings with macro-supply chain data [42,43,44], this bottom-up measurement strategy mitigates the ecological fallacy often found in purely macro-regional studies. It provides a novel cross-scale theoretical perspective for optimizing regional green governance systems by delineating the spatial boundaries of external ESG transmission.

2. Theoretical Analysis and Research Hypotheses

GDE encompasses multiple dimensions, including economic output, resource consumption, and environmental pollution [45]. Its variations are driven not only by local determinants but also by interregional spatial interactions [46]. Drawing on spatial econometrics, evolutionary economic geography, and micro-stakeholder theory, this study proposes the following research hypotheses [47].

2.1. Spatial Correlation and Network Structure Evolution of GDE

When we talk about the factors of mobility, industrial transfer, and environmental pollution, we found that spatial spillovers are prevalent [48]. Neighboring cities exhibit spatial autocorrelation in ecological governance [49], potentially leading to cross-regional “free-riding” phenomena [50]. However, facilitated by transportation infrastructure improvements and the implementation of the ecological protection and high-quality development strategy in the YRB, spatial linkages among cities have gradually transcended adjacent geographical boundaries [51,52]. These linkages progressively form an interconnected urban network characterized by a hierarchical structure and increasing topological density.
Hypothesis 1a (H1a).
GDE in the YRB exhibits positive spatial autocorrelation and agglomeration.
Hypothesis 1b (H1b).
Over time, the spatial correlation network of GDE increases in density and gradually evolves toward a polycentric spatial pattern.

2.2. Spatial Spillover Effects of Economic Development

The level of economic development is a critical determinant of green transitions. During the initial stages of economic growth, central cities typically leverage capital and policy advantages to attract factors of production from surrounding areas [53]. This process is frequently accompanied by the centralization of advanced factors and the relocation of pollution-intensive industries to peripheral areas, which in turn negatively affects the GDE of adjacent regions [54]. Only when economic development surpasses a specific threshold can central cities generate a positive effect on surrounding areas through technology and knowledge spillovers [55]. Under the institutional framework of the ‘Strong Provincial Capital Strategy,’ the YRB has transitioned toward a highly polarized spatial configuration. Given the exceptional primacy of core provincial capitals marginalizing the periphery and impeding coordinated regional green development [56], this study proposes the following hypothesis:
Hypothesis 2 (H2).
At the current stage, economic development promotes local GDE but primarily exerts a negative spatial spillover effect on adjacent regions.

2.3. The Jevons Paradox of Technological Innovation and the Energy Rebound Effect

Existing literature generally identifies technological innovation as a crucial driver of green development [57]. However, in the middle and upper reaches of the YRB—a region dominated by coal mining, petrochemical refining, and non-ferrous metal smelting industries—technological progress may trigger an energy rebound effect [58]. Specifically, a substantial portion of R&D investment has historically been allocated to improving the efficiency of fossil fuel extraction and utilization. At the same time, comparatively less emphasis has been placed on end-of-pipe treatments and clean energy substitution [59]. The subsequent decline in unit costs may further stimulate total output and resource consumption, causing technological progress to fail in effectively mitigating pollution emissions, thereby manifesting the Jevons paradox [60]. Furthermore, local R&D activities may generate positive spillovers to neighboring regions through pathways such as technical personnel mobility and industrial imitation [61]. This path dependency renders non-mandatory external regulations highly ineffective [62].
Hypothesis 3 (H3).
Given the YRB’s heavy-chemical energy structure, technological innovation may trigger short-term energy rebound effects, showing a temporary negative relationship with local GDE before long-term benefits materialize.

2.4. The Moderating Effect of Micro-ESG Pressure

Anchored in stakeholder theory and green supply chain management, the notion of “micro-ESG reverse-forcing” in this study is defined as the market-driven regulatory pressure transmitted from downstream customers with stringent ESG standards to upstream suppliers.
With the widespread adoption of ESG principles, downstream firms have raised green procurement standards for upstream suppliers, thereby generating market-driven pressure within green supply chains [63]. In theory, external ESG pressure from downstream firms serves as a market-driven regulatory force that encourages greener production practices and mitigates the negative environmental impacts of technological innovation [64]. However, in the YRB, this mechanism may be weakened by resource-dependent development patterns. At the same time, a structurally rigid, upstream-dominated industrial system further constrains the effective transmission of such pressures along the supply chain [65].
Hypothesis 4 (H4).
Due to resource-dependent development patterns, the positive moderating effect of external supply chain ESG pressure is significantly weakened, limiting its ability to correct the environmental bias of technological innovation.

3. Data Sources and Methodology

To systematically untangle the complex driving mechanisms of GDE, this study constructs a comprehensive cross-scale analytical framework (as illustrated in the Research Framework Flowchart, Figure 1). The logical hierarchy proceeds from macro-level spatiotemporal efficiency measurements (utilizing the Super-SBM model and SNA) to spatial mechanism identification (via SDM), and ultimately drills down to the moderating role of micro-enterprise ESG constraints. This multi-layered design ensures theoretical self-consistency throughout the empirical investigation.

3.1. Data Sources and Processing

The data used in this study primarily come from three sources:
First, this study selects 48 prefecture-level cities across eight provinces and autonomous regions in the YRB (Qinghai, Gansu, Ningxia, Inner Mongolia, Shanxi, Shaanxi, Henan, and Shandong) as the research sample. The observation period spans from 2010 to 2022, ultimately yielding a balanced panel dataset of 624 city-year observations. The data were extracted from the China City Statistical Yearbook and corresponding provincial and municipal statistical yearbooks.
Second, micro-level ESG ratings and supply chain network data were acquired from the Huazheng and Wind databases.
Third, fundamental geospatial data were obtained from the Ministry of Natural Resources’ Standard Map Service (based on the 2022 administrative divisions). These geographic data were used to calculate intercity spherical distances, construct spatial weight matrices, and perform spatial visualizations.

3.2. GDE Measurement Model

To measure the GDE of cities in the YRB, this study adopts a Super-SBM model accounting for undesirable outputs. Traditional DEA models fail to incorporate undesirable outputs, such as pollution emissions, into their measurement frameworks [66]. The Super-SBM model, proposed by Tone, addresses these methodological limitations by directly incorporating slack variables into the objective function and introducing a super-efficiency evaluation mechanism [67].
Suppose a production system comprises n decision-making units (DMUs), where each DMU utilizes m inputs (x) to generate s 1 desirable outputs ( y 0 g ) and s 2 undesirable outputs (yb). Accordingly, a non-oriented and non-radial Super-SBM model is constructed, with the specific programming equation expressed as follows:
m i n   ρ = 1 m i = 1 m X i ¯ X i 0 1 s 1 + s 2 ( r = 1 s 1 y - r g y r 0 g + k = 1 s 2 y - k b y k 0 b ) s . t . { x - j = 1 , j 0 n λ j x j x - g j = 1 , j 0 n λ j y j g y - b j = 1 , j 0 n λ j y j b x - x 0 , y - g y 0 g , y - b y 0 b , y - g 0 , λ 0  
where ρ represents the target GDE value; x 0 , y 0 g , and y 0 b denote the input, desirable output, and undesirable output vectors of the evaluated city, respectively; x - , y - g , and y - b are the corresponding projection values; and λ is the weight vector. If ρ     1 , it indicates that the city’s GDE lies on the efficient frontier. If ρ   <   1 , an efficiency loss exists, implying a potential for efficiency improvement by reducing inputs and undesirable outputs or by increasing desirable outputs. Additionally, the constraint λ j   = 1 is incorporated into the model.

3.3. Spatial Pattern Changes Model

Due to the cross-regional externalities of environmental pollution and the spillover effects of green technologies, relying solely on local determinants in traditional panel models may lead to biased estimations. Therefore, this study employs the SDM to simultaneously examine the direct effects and indirect spatial spillover effects of the explanatory variables. The model is specified as follows [68]:
GDE it = ρ j = 1 n ω ij GDE jt + β X it + θ j = 1 n ω ij X jt + μ i + υ t + ε it
where GDE it represents the GDE of city i in year t; ρ is the spatial autoregressive coefficient, reflecting the impact of neighboring regions’ efficiency on the local area; X it denotes the vector of explanatory variables; β is the regression coefficient of the explanatory variables; θ is the spatial lag coefficient of the explanatory variables, capturing the influence of explanatory variables from neighboring areas on local efficiency; μ i and υ t represent the individual and time fixed effects, respectively; and ε it is the random disturbance term.
Considering that the spatial correlation of green development among cities in the YRB is predominantly driven by geographical proximity, this study constructs an inverse squared geographic distance matrix [69]. The calculation formula is expressed as follows:
ω ij = 1 / d ij 2 ,   i j 0 ,   i = j
where d ij denotes the spherical distance between city i and city j, the inverse square of the distance is used to capture spatial distance decay, aligning with the spatial diffusion characteristics of pollution spillovers. For robustness, the subsequent empirical analysis introduces an economic distance matrix—constructed based on the absolute differences in per capita GDP—to comparatively examine the differential impacts of geographic proximity and economic similarity on spatial spillovers. Both the geographic and economic distance matrices were standardized before the empirical estimation to ensure the interpretability of spatial spillover effects.

3.4. Spatial Network Construction

To further explore the structural evolution and collaborative characteristics of green development among cities in the YRB, this study utilizes a modified gravity model and SNA. The construction process consists of the following steps:

3.4.1. Modified Gravity Model

The traditional gravity model is highly applicable for measuring spatial economic linkages. In this study, it is modified to transform the static GDE data of the 48 prefecture-level cities into a dynamic spatial correlation matrix. The model incorporates population and economic scale as basic network masses and uses geographical distance as the friction factor. The specific formula is as follows:
R I J = K i j × P i × G i × P j × G j D i j 2 ,     K i j = E i E i + E j
where Rij represents the strength of the green development correlation between city i and city j; Ei and Ej denote the measured GDE values of the two cities, respectively; P represents the urban population, reflecting labor carrying capacity; G represents the GDP, reflecting economic scale; and Dij is the spherical geographical distance between the two cities calculated using the Haversine formula based on their longitudes and latitudes. Kij serves as the contribution coefficient, reflecting the asymmetrical directional influence of city i in its correlation with city j.

3.4.2. Matrix Binarization

To facilitate the SNA topological evaluation, the continuous gravity matrix must be converted into a directed binary matrix. This study adopts the row-mean threshold approach. For each row in the matrix (representing the outward radiation from city i), the threshold is defined as:
T h r e s h o l d i = j = 1 n R i j n
If the gravitational strength Rij is greater than or equal to the threshold, the binarized value is assigned as 1, indicating a significant green development spillover from city i to city j. Otherwise, it is assigned 0. The diagonal elements of the matrix are set to 0.

3.4.3. Social Network Analysis Indicators

Based on the binarized matrix, this study characterizes the topological properties of the YRB’s green collaborative network using the following core SNA indicators:
  • Network Density: Defined as the ratio of actual spatial linkages to the maximum possible number of linkages. It reflects the overall degree of closeness and integration within the regional green collaborative network. A higher density indicates more frequent and robust cross-regional interactions.
  • Degree Centrality: Measures the number of direct significant connections a specific city has within the network. It accurately identifies whether a city occupies a “core” or “peripheral” status in driving the basin’s green transition.
  • Closeness Centrality: Evaluates the average shortest path distance from a node to all other nodes. It reflects a city’s ability to efficiently receive or transmit green technology and policy spillovers without relying on other intermediary cities.

3.5. Construction of the Indicator System

3.5.1. Selection of Input and Output Indicators

Based on the input-output conversion mechanisms of the regional ecological-economic-social system and the specific heavy-chemical industrial characteristics of the YRB, the GDE indicator system is constructed following the principles of systematicity and data accessibility. Given the significant variation in urban administrative areas across the YRB, using aggregate indicators risks introducing scale biases. Therefore, this study constructs its input–output system using density indicators (per unit of land area). This approach effectively mitigates distortions caused by boundary differences. The specific indicators are detailed in Table 1.

3.5.2. Specification of Macro and Micro Core Explanatory Variables

The selection of core explanatory variables is directly derived from the dual challenges of internal structural path dependency and external market compliance in the YRB. To clarify the logical hierarchy, we structured the variables across two distinct dimensions: macro-level drivers and micro-level constraints. At the macro level, variables such as economic development, technological innovation, urbanization, and industrial structure are selected to capture the fundamental structural momentum and resource endowments of the basin. At the micro level, the supply chain ESG pressure index is uniquely introduced to characterize the bottom-up external environmental constraints. This hierarchical setup essentially bridges regional structural factors with market-based governance. Table 2 is the definition and measurement of core explanatory variables. Regarding technological innovation (Ln_Tech), given the unavailability of green patent data at the prefecture level, this study uses the intensity of science and technology expenditure as a proxy. While this broad metric encompasses both green and non-green innovations and represents a measurement limitation, it fundamentally reflects the aggregate technological momentum and financial capacity for industrial transition within the basin.
As for the supply chain green pressure index (Ln_ESG), we first calculate the average ESG score of the top five downstream customers for each A-share listed company within the YRB for a given year. This value proxies the external green procurement pressure borne by the enterprise. Then, at the prefecture-city level, the average customer ESG scores of all locally registered listed companies are aggregated using their respective operating revenue proportions as weights.

4. Spatiotemporal Evolution Characteristics of GDE in the YRB

4.1. Temporal Evolution Characteristics

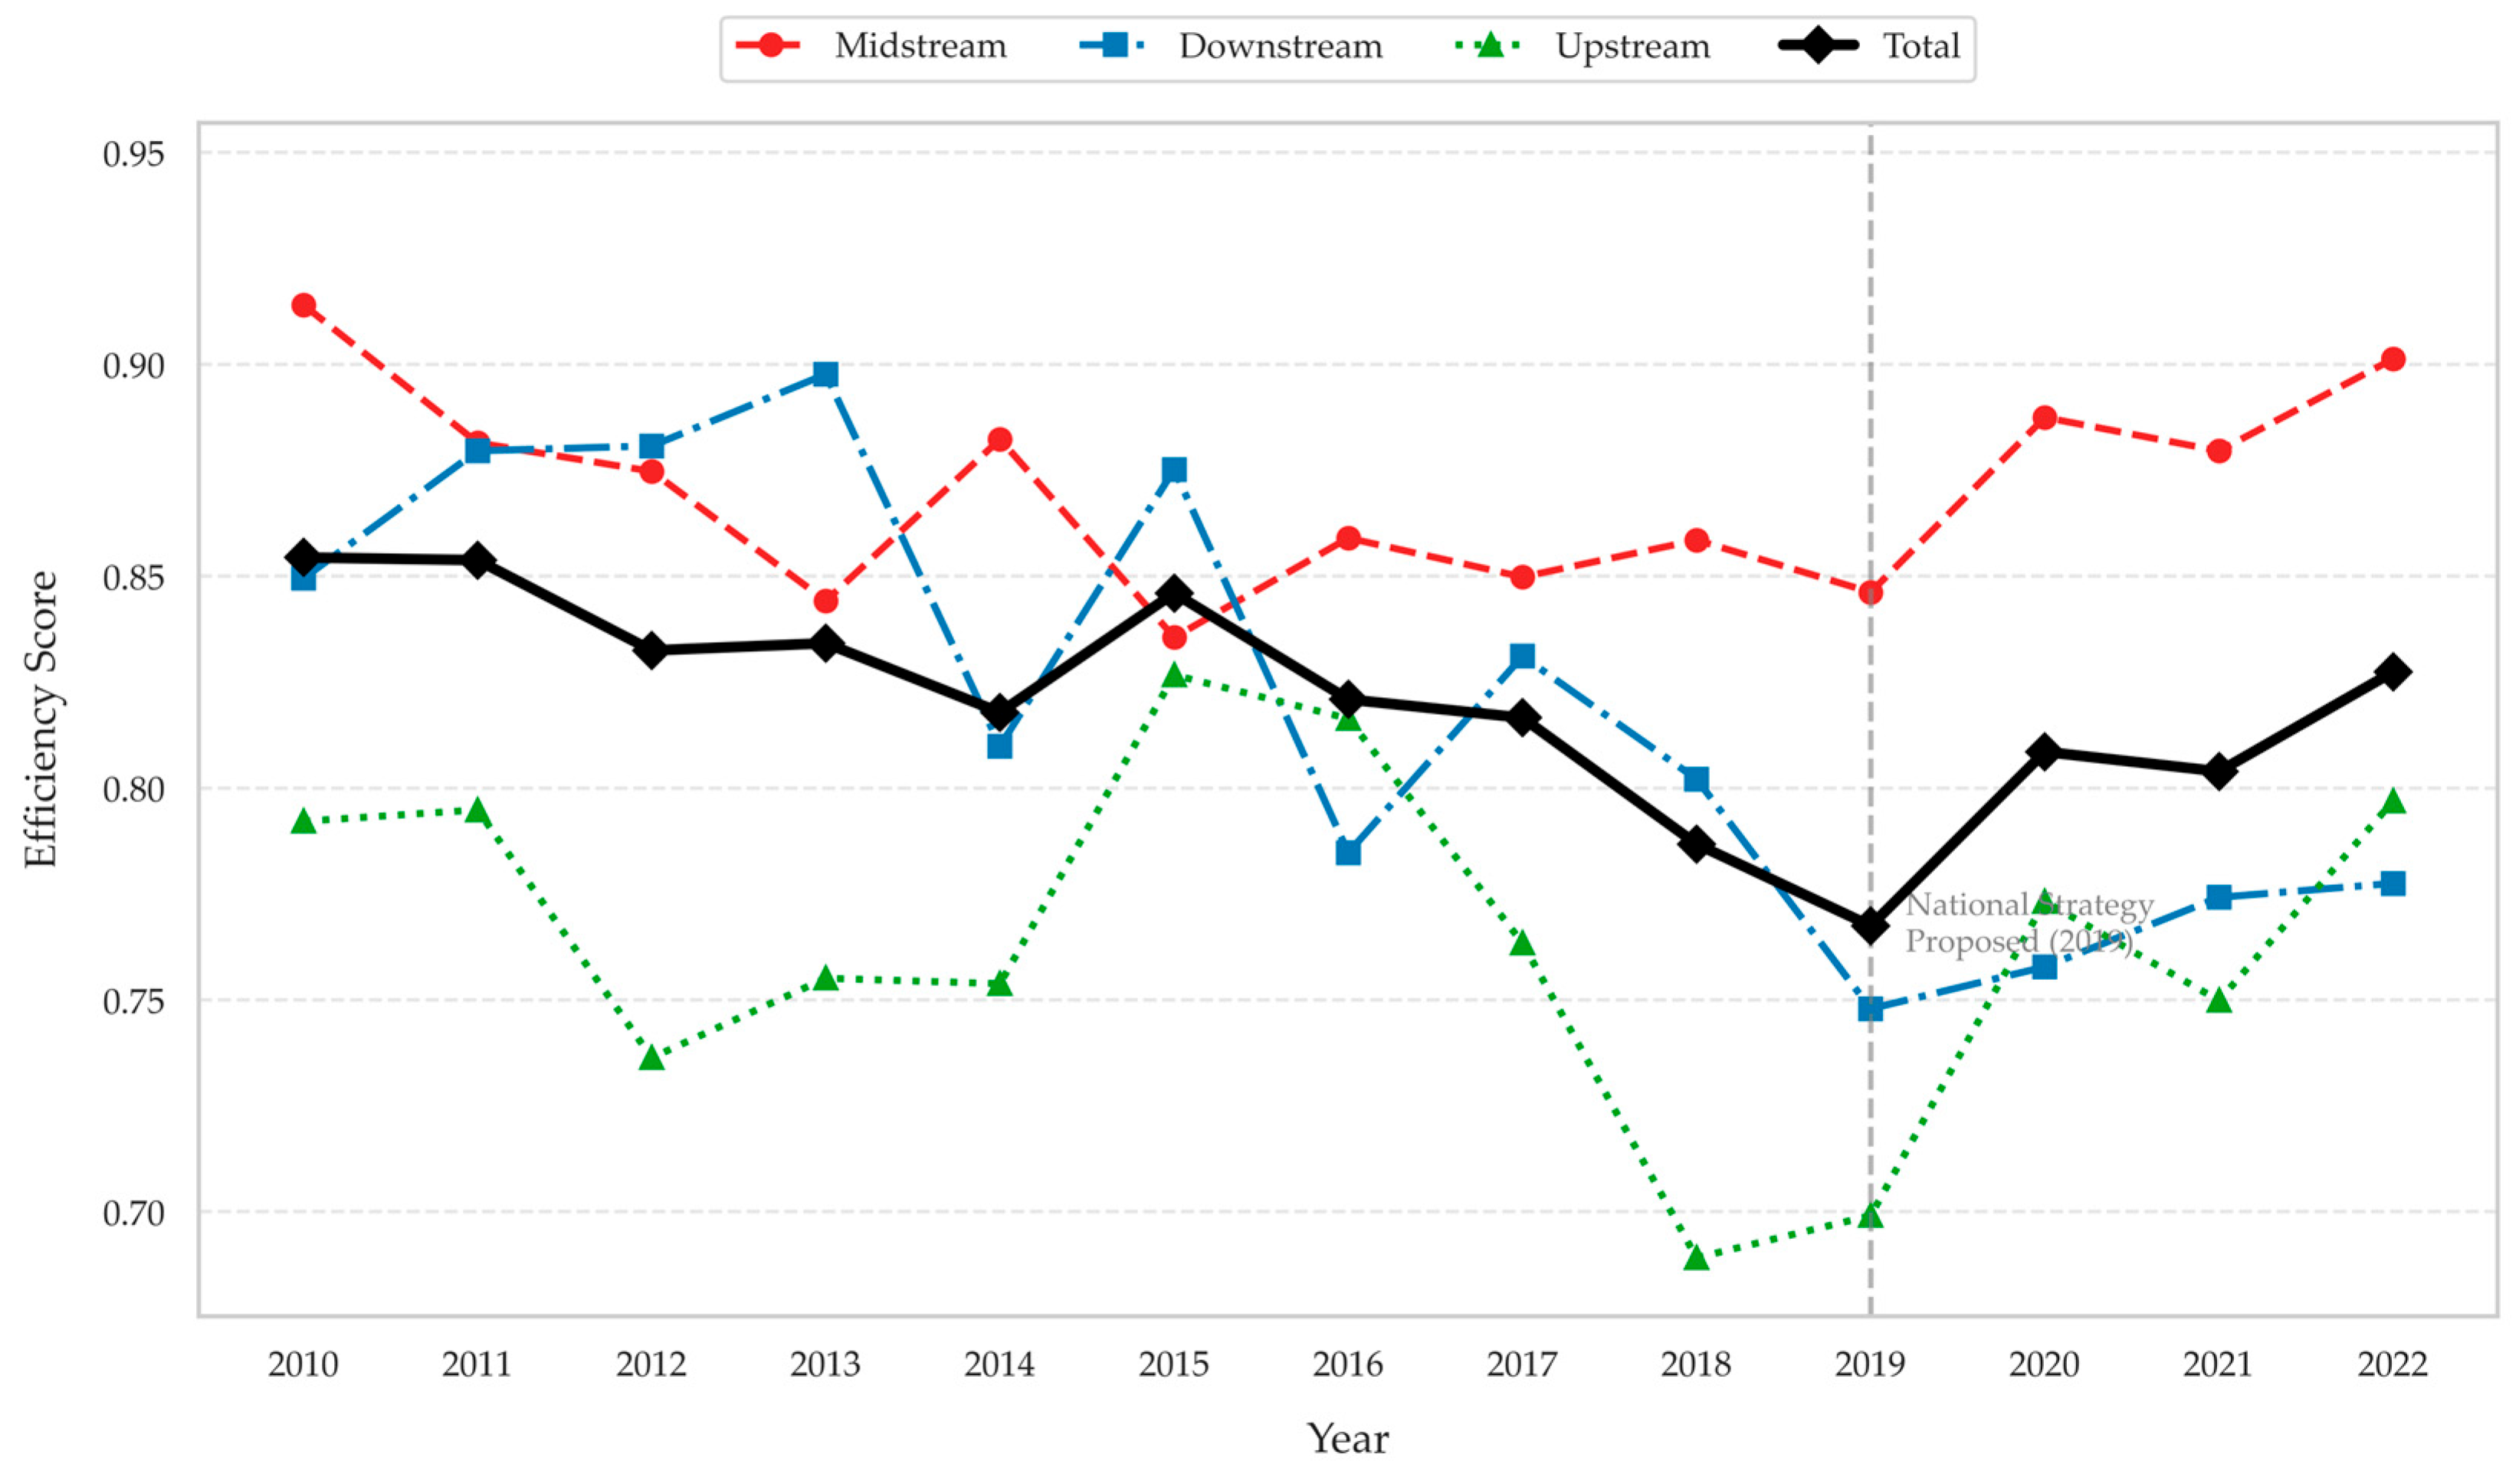
Based on the efficiency values calculated using the Super-SBM model, this study maps the evolutionary trajectories of the average GDE for the entire YRB and its upstream, midstream, and downstream regions from 2010 to 2022, as shown in Figure 2.
The results indicate that the overall GDE of the YRB exhibited a fluctuating trajectory characterized by an initial decline followed by a marginal rebound, as shown in Table 3. This fluctuation is likely structurally aligned with national macro-policy adjustments.
The overall evolutionary process can be delineated into three distinct stages:
  • Stage 1 (2010–2015): High-level oscillation. During this period, the basin-wide average efficiency hovered between 0.83 and 0.85. A notable spatial disparity was observed, wherein the midstream region consistently outperformed the upstream and downstream zones, sustaining a relatively high apparent efficiency. Conversely, the downstream region simultaneously experienced an early downward pressure on its GDE.
  • Stage 2 (2016–2019): Decline and adjustment. The overall efficiency demonstrated a synchronized downward trend across the basin, reaching its historical minimum of 0.767 in 2019. During this phase, the previously prominent efficiency gap between the midstream and downstream regions began to alter visibly.
  • Stage 3 (2020–2022): Recovery and improvement. The overall GDE experienced a fluctuating rebound, recovering to 0.827 by 2022. This period was characterized by a visible convergence in efficiency scores between the upstream and downstream reaches, although the midstream region regained its leading position.
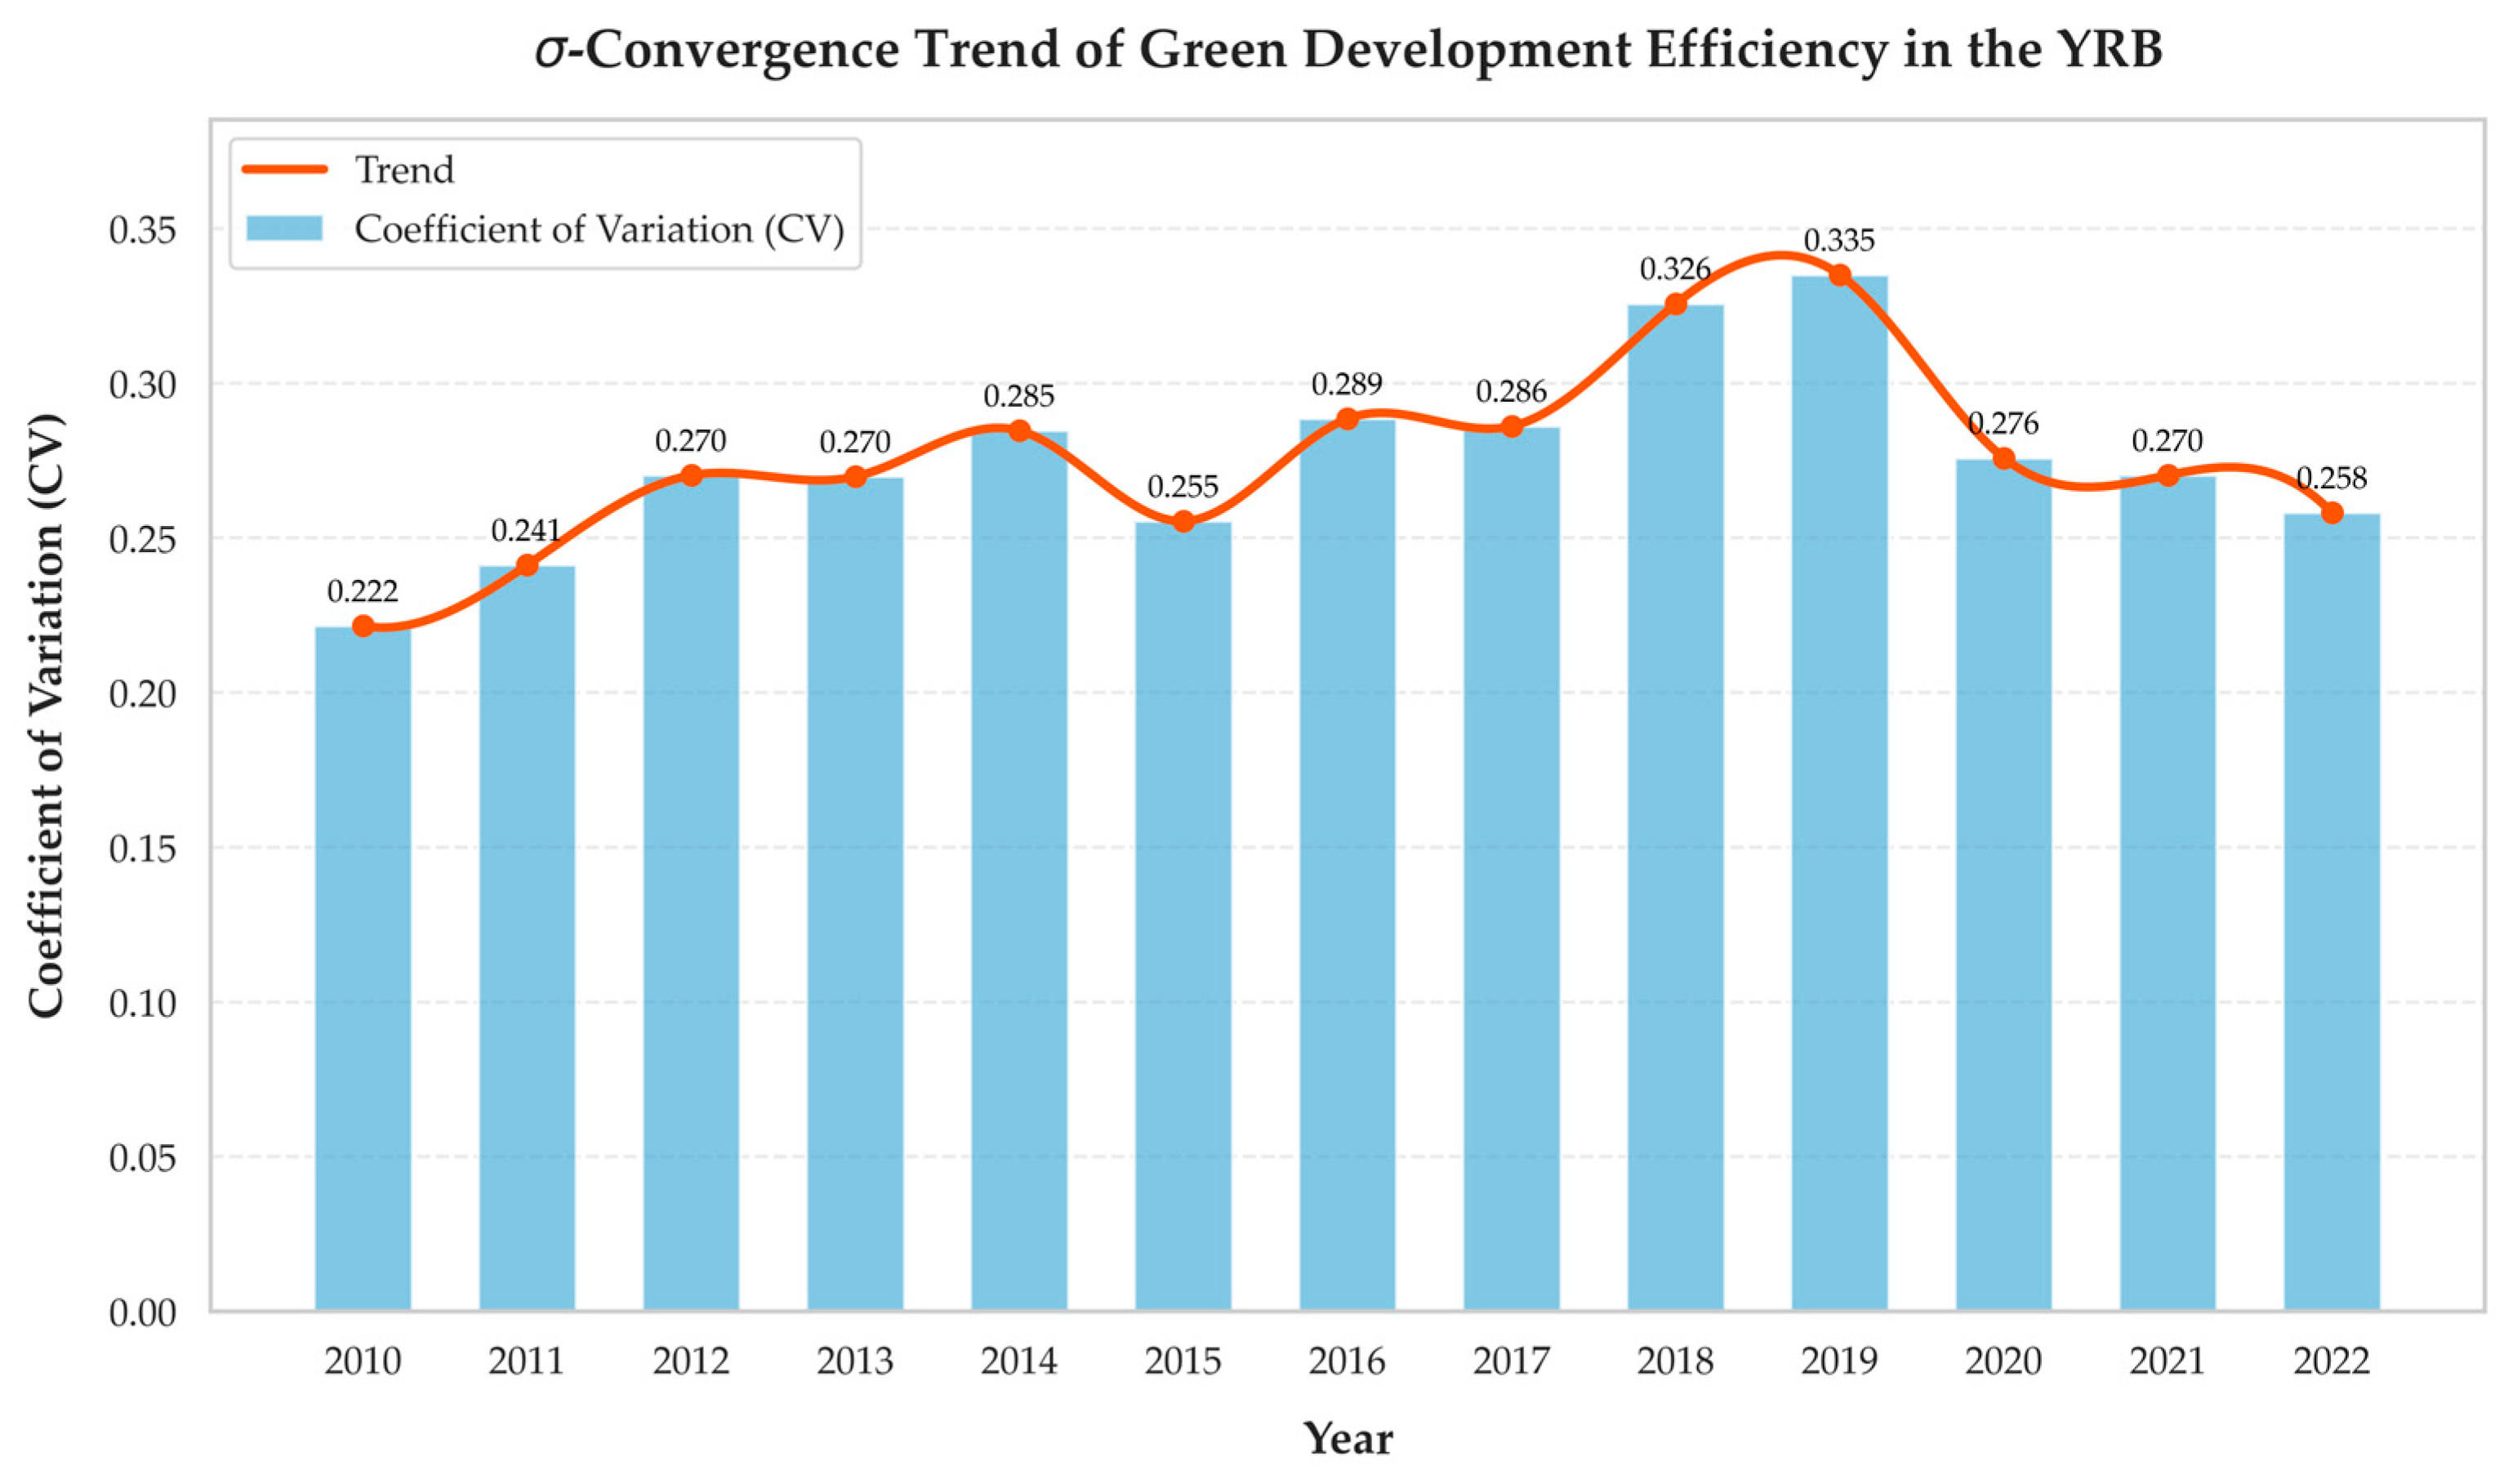
To further analyze the evolutionary characteristics of intra-regional disparities, this study calculated the annual coefficient of variation (CV), as illustrated in Figure 3.
The empirical results reveal that the CV increased from 0.22 in 2010 to a peak of 0.33 in 2019, then moderated to 0.25 in 2022. These findings suggest that, for most of the observation period, the GDE of cities in the YRB exhibited σ-divergence, indicating an expanding trend in intra-regional spatial disparities. Although the basin’s overall efficiency has recently improved, the developmental chasm between frontier cities (e.g., Xi’an, Zhengzhou) and lagging cities (e.g., Baiyin, Shizuishan) has widened considerably. This highlights an urgent need to enhance cross-regional synergistic governance mechanisms.

4.2. Spatial Evolution Characteristics

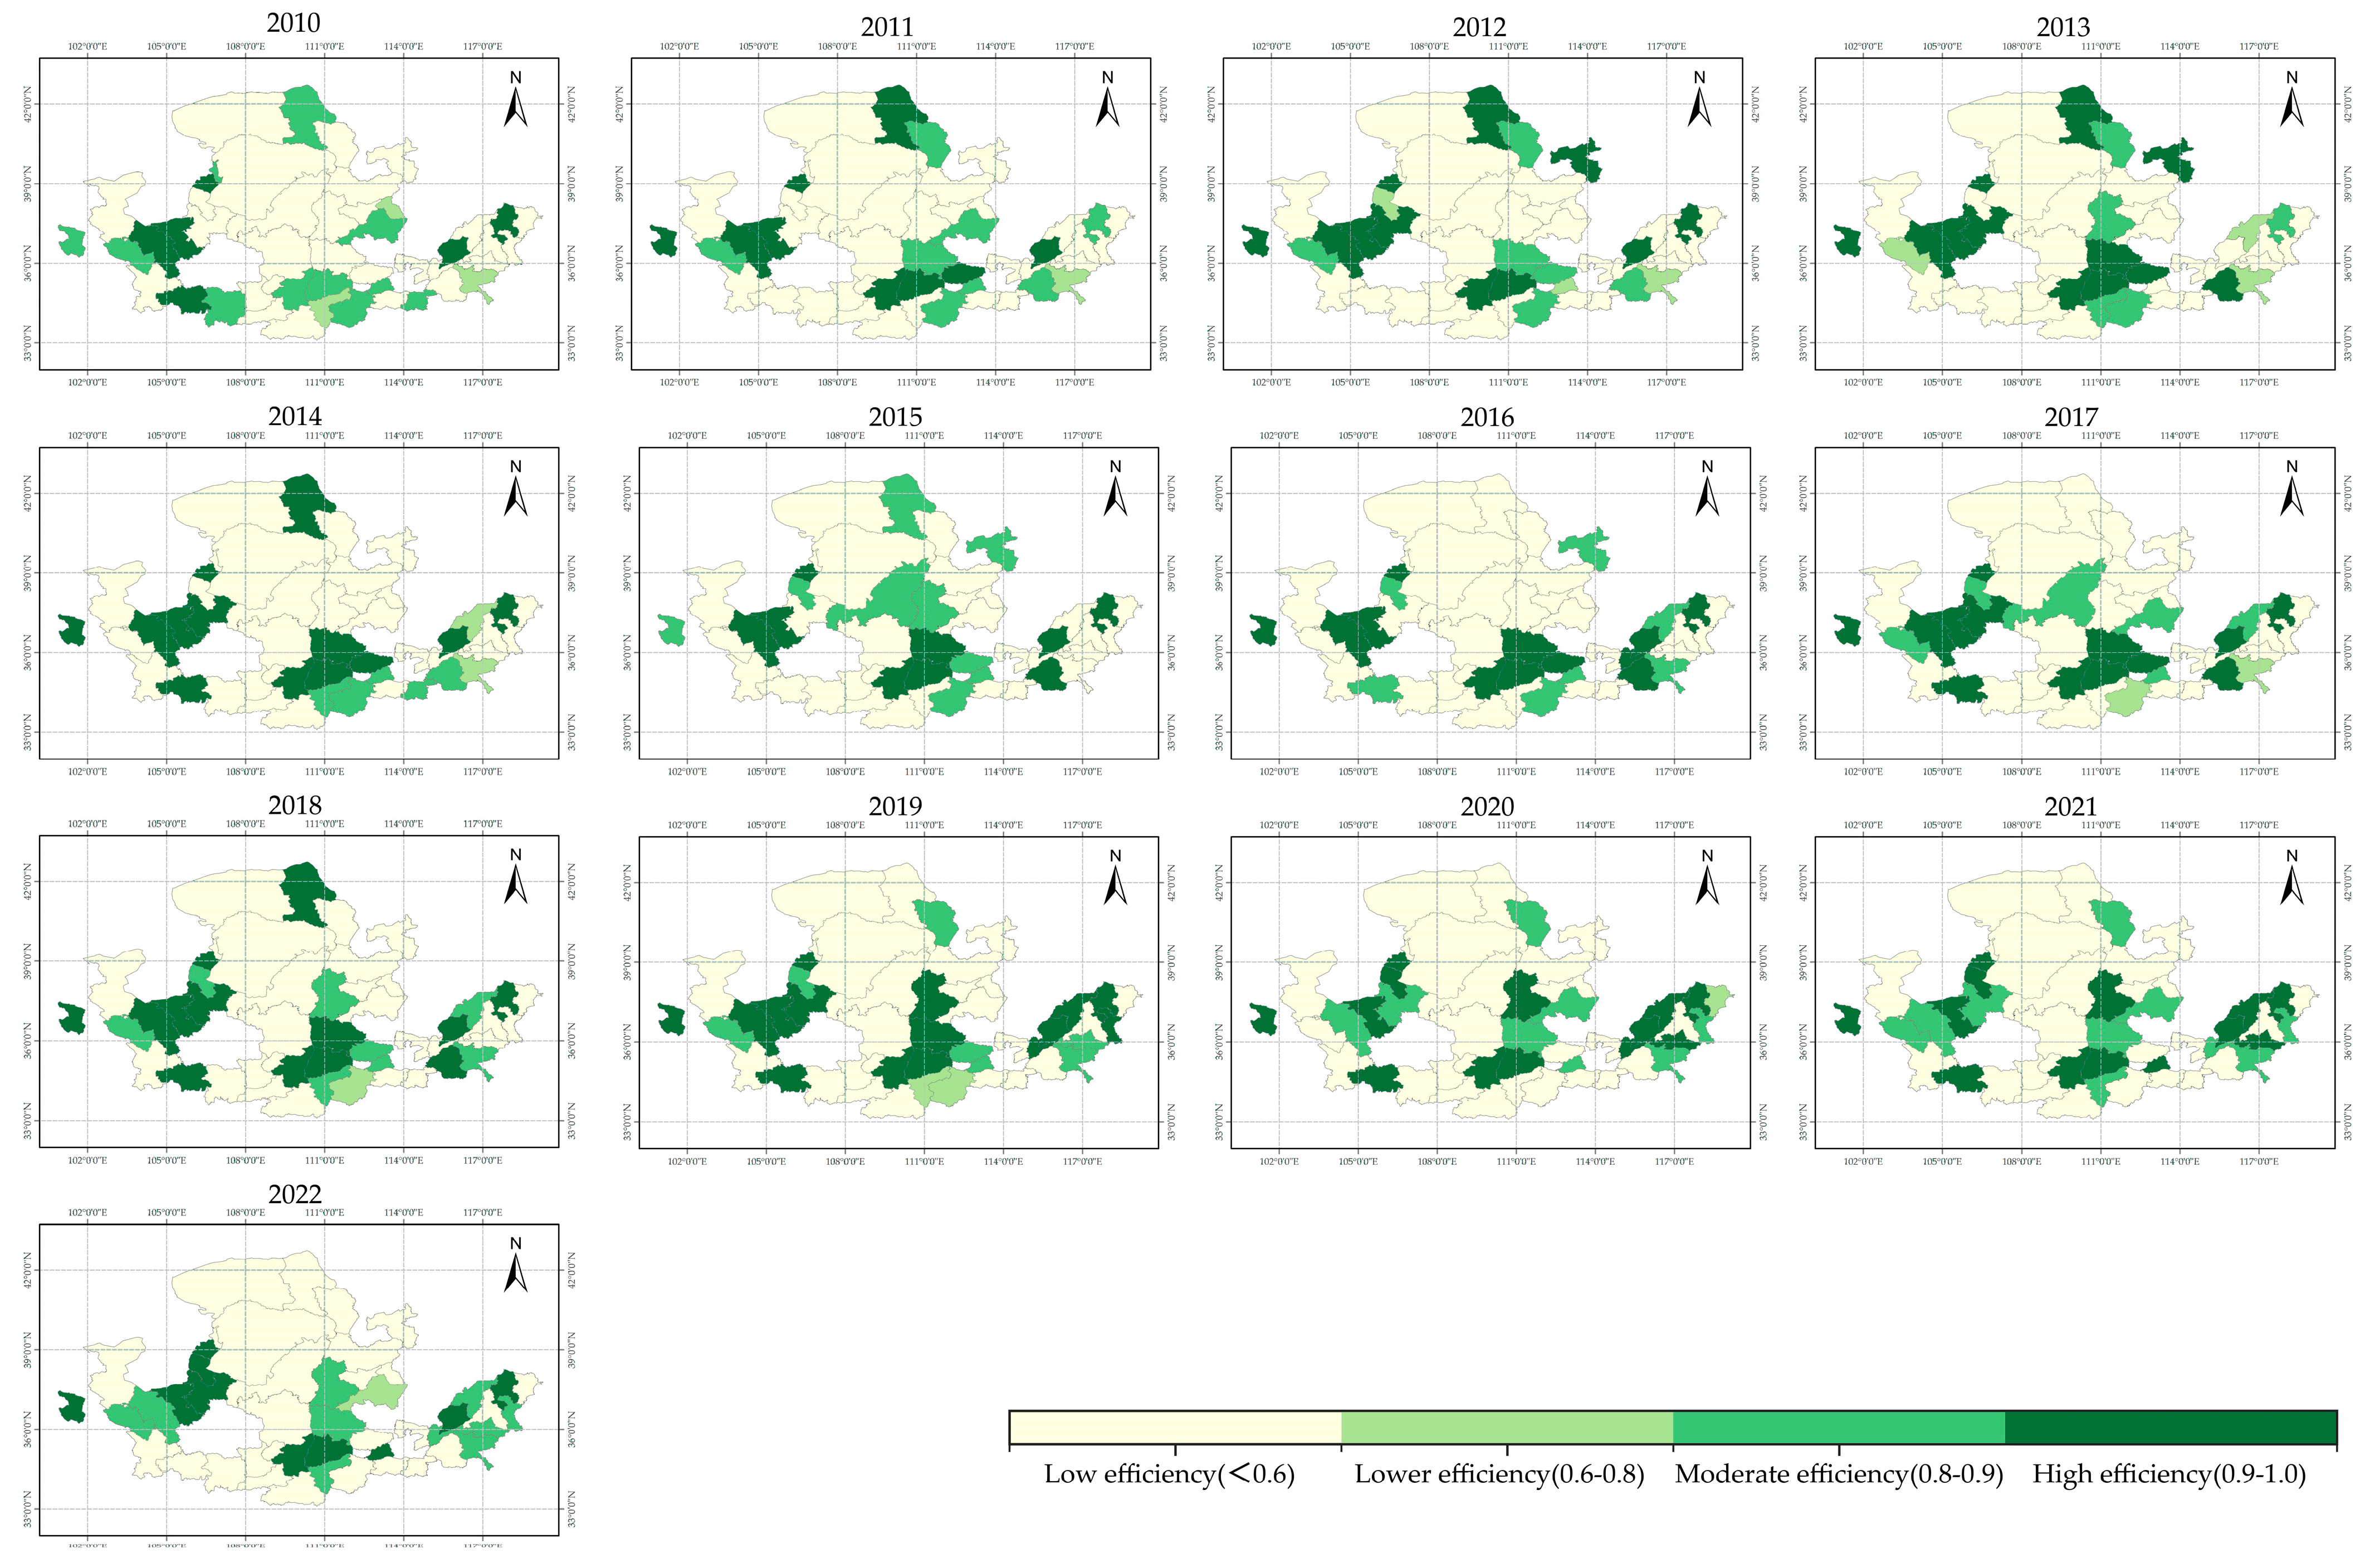
This study selects 13 years, from 2010 to 2022, to examine the spatial differentiation of GDE in the YRB. The spatial distributions are illustrated in Figure 4. To ensure scientific rigor and spatiotemporal comparability across the panel, the classification thresholds for the four GDE levels (Low, Lower, Moderate, and High efficiency) are determined by integrating the Jenks Natural Breaks optimization method with established conventions in empirical DEA literature. Mathematically, the Jenks algorithm minimizes intra-group variance while maximizing inter-group variance based on the actual distribution of our dataset. Economically, within the Super-SBM framework, a score of 1.0 represents the absolute efficiency frontier; thus, 0.6 is utilized as the baseline ‘pass line’ for severe eco-inefficiency, while 0.8 and 0.9 serve as standard academic benchmarks to delineate transitioning and mature green development states, respectively.
Spatially, the evolution of GDE in the YRB differs notably from the traditional gradient of economic development, showing a general spatial pattern of midstream (0.90) > upstream (0.80) > downstream (0.78).
(1)
Midstream region:
The average efficiency in the midstream remained consistently high, hovering around 0.90 over the long term. Research indicates that while these energy and chemical hubs generate substantial undesirable outputs (pollutants), the large desirable outputs (GDP) from resource extraction and primary processing mathematically inflate overall efficiency scores in the SBM framework. These results suggest that the high GDE in the midstream is heavily reliant on resource factor inputs. Despite high efficiency scores, the absolute volumes of industrial wastewater and sulfur dioxide emissions in these regions remain massive; however, these undesirable outputs are mathematically obscured by the extraordinarily large GDP denominators generated by bulk commodity extraction.
(2)
Downstream region:
As the economic center of the basin, the downstream region experienced a persistent decline in average efficiency, dropping from 0.849 in 2010 to 0.777 in 2022, falling below the upstream average. Empirical evidence suggests the downstream is currently navigating a painful transition between old and new economic drivers. Internally, provincial capitals like Zhengzhou and Jinan maintain positions on the efficiency frontier. Conversely, traditional industrial cities such as Binzhou, Liaocheng, and Heze have stagnated at a low efficiency range of 0.4–0.5, severely attenuating the regional average. The stringent environmental regulations have exposed the inherent inefficiencies of their heavy-chemical industrial structures.
(3)
Upstream region:
The upstream region (Qinghai, Gansu, and Ningxia) has historically had low efficiency; however, by 2022 it showed a resilient upward trend (0.797), slightly surpassing the downstream. Most of this region is designated as National Key Ecological Function Zones, strictly bounded by ecological protection redlines. Compounded by weak economic foundations and a scarcity of innovation factors, overall input–output conversion efficiency has historically been limited. Spatially, the radiation capacity of central cities like Xining and Lanzhou remains inadequate. Recent efficiency improvements are likely attributable to national ecological compensation mechanisms and the strategic deployment of renewable energy industries, indicating that GDE can maintain a degree of resilience even under rigid ecological constraints.
This measurement bias underscores the limitations of relying solely on macro-level efficiency metrics. Therefore, the subsequent analysis will incorporate real-world governance constraints at the micro level. This approach serves not merely as an empirical extension, but as a crucial theoretical corrective to the illusion of ‘inflated efficiency’ observed at the macro level.

4.3. Evolution of Spatial Correlation Networks

To further unpack the spatiotemporal dynamics, this study constructs a spatial weight matrix based on a modified gravity model and evaluates it using SNA.
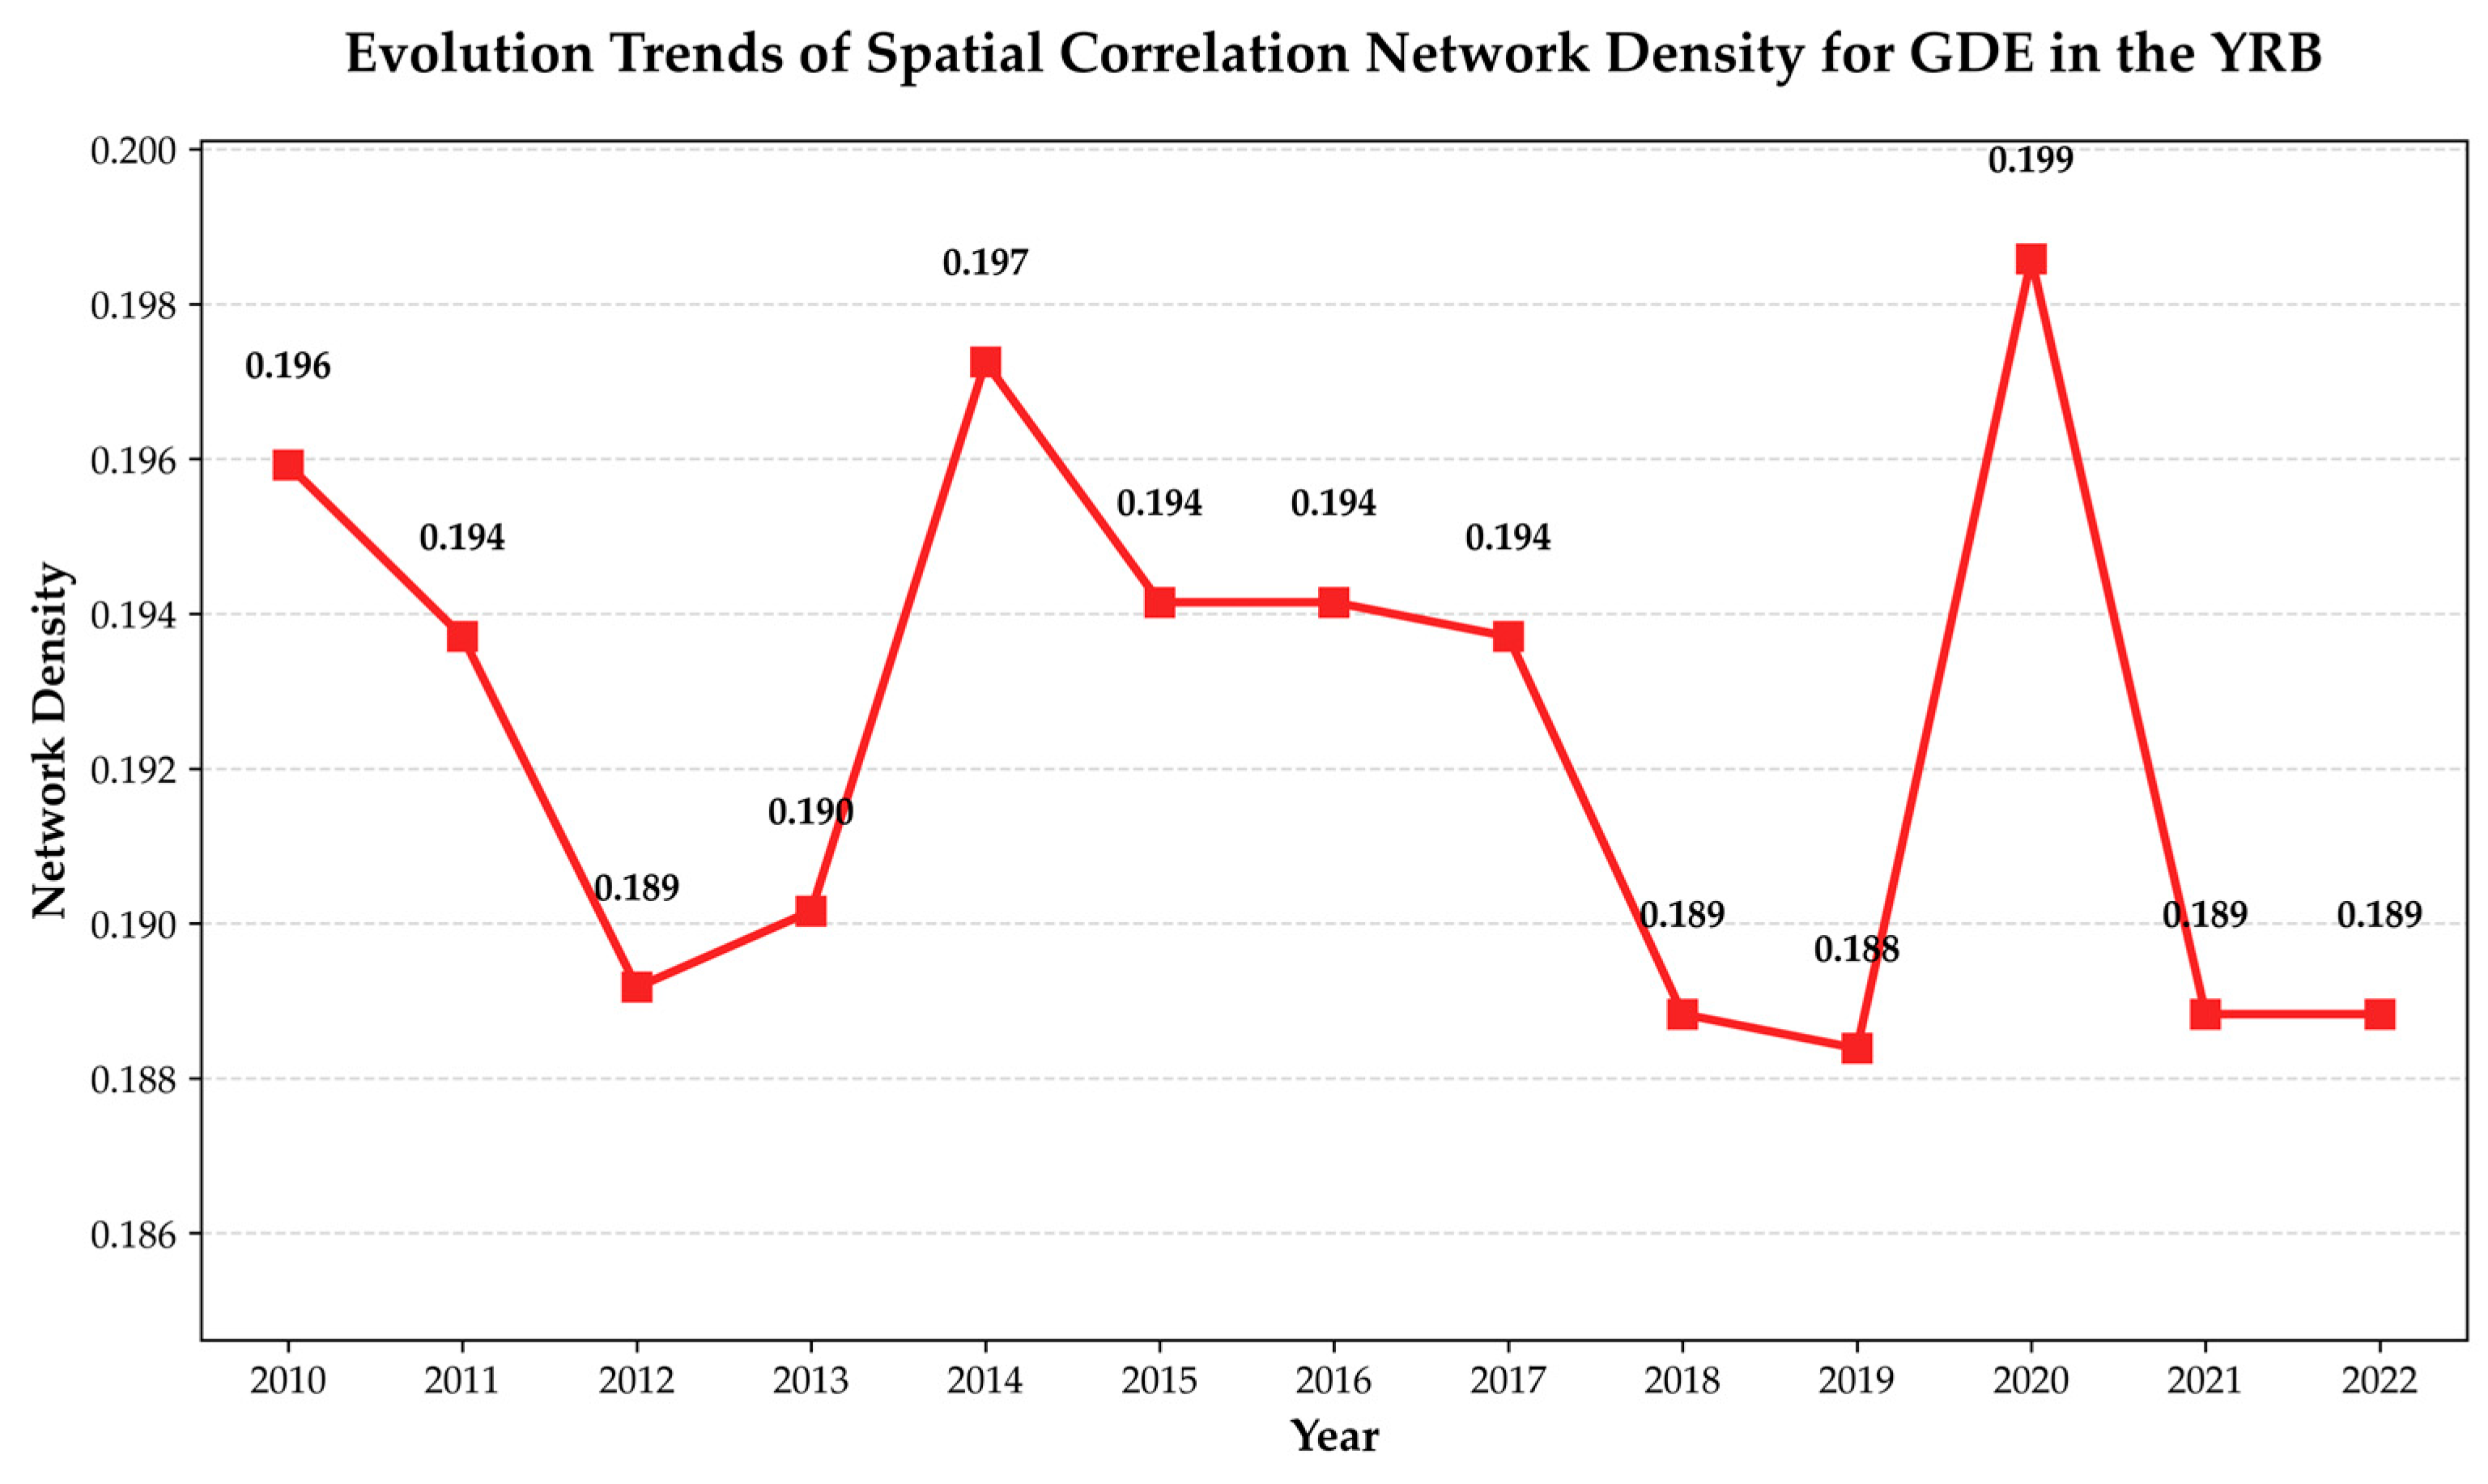
As shown in Figure 5, overall network density fluctuated only slightly between 0.188 and 0.199 from 2010 to 2022. The limited magnitude of this change indicates that the regional green collaborative network remains in a phase of weak connectivity. Driven by factors such as the elimination of outdated capacities and external environmental shocks, cross-regional collaborative green development in the YRB continues to face substantial barriers, keeping the spatial network in a prolonged transitional adjustment phase.
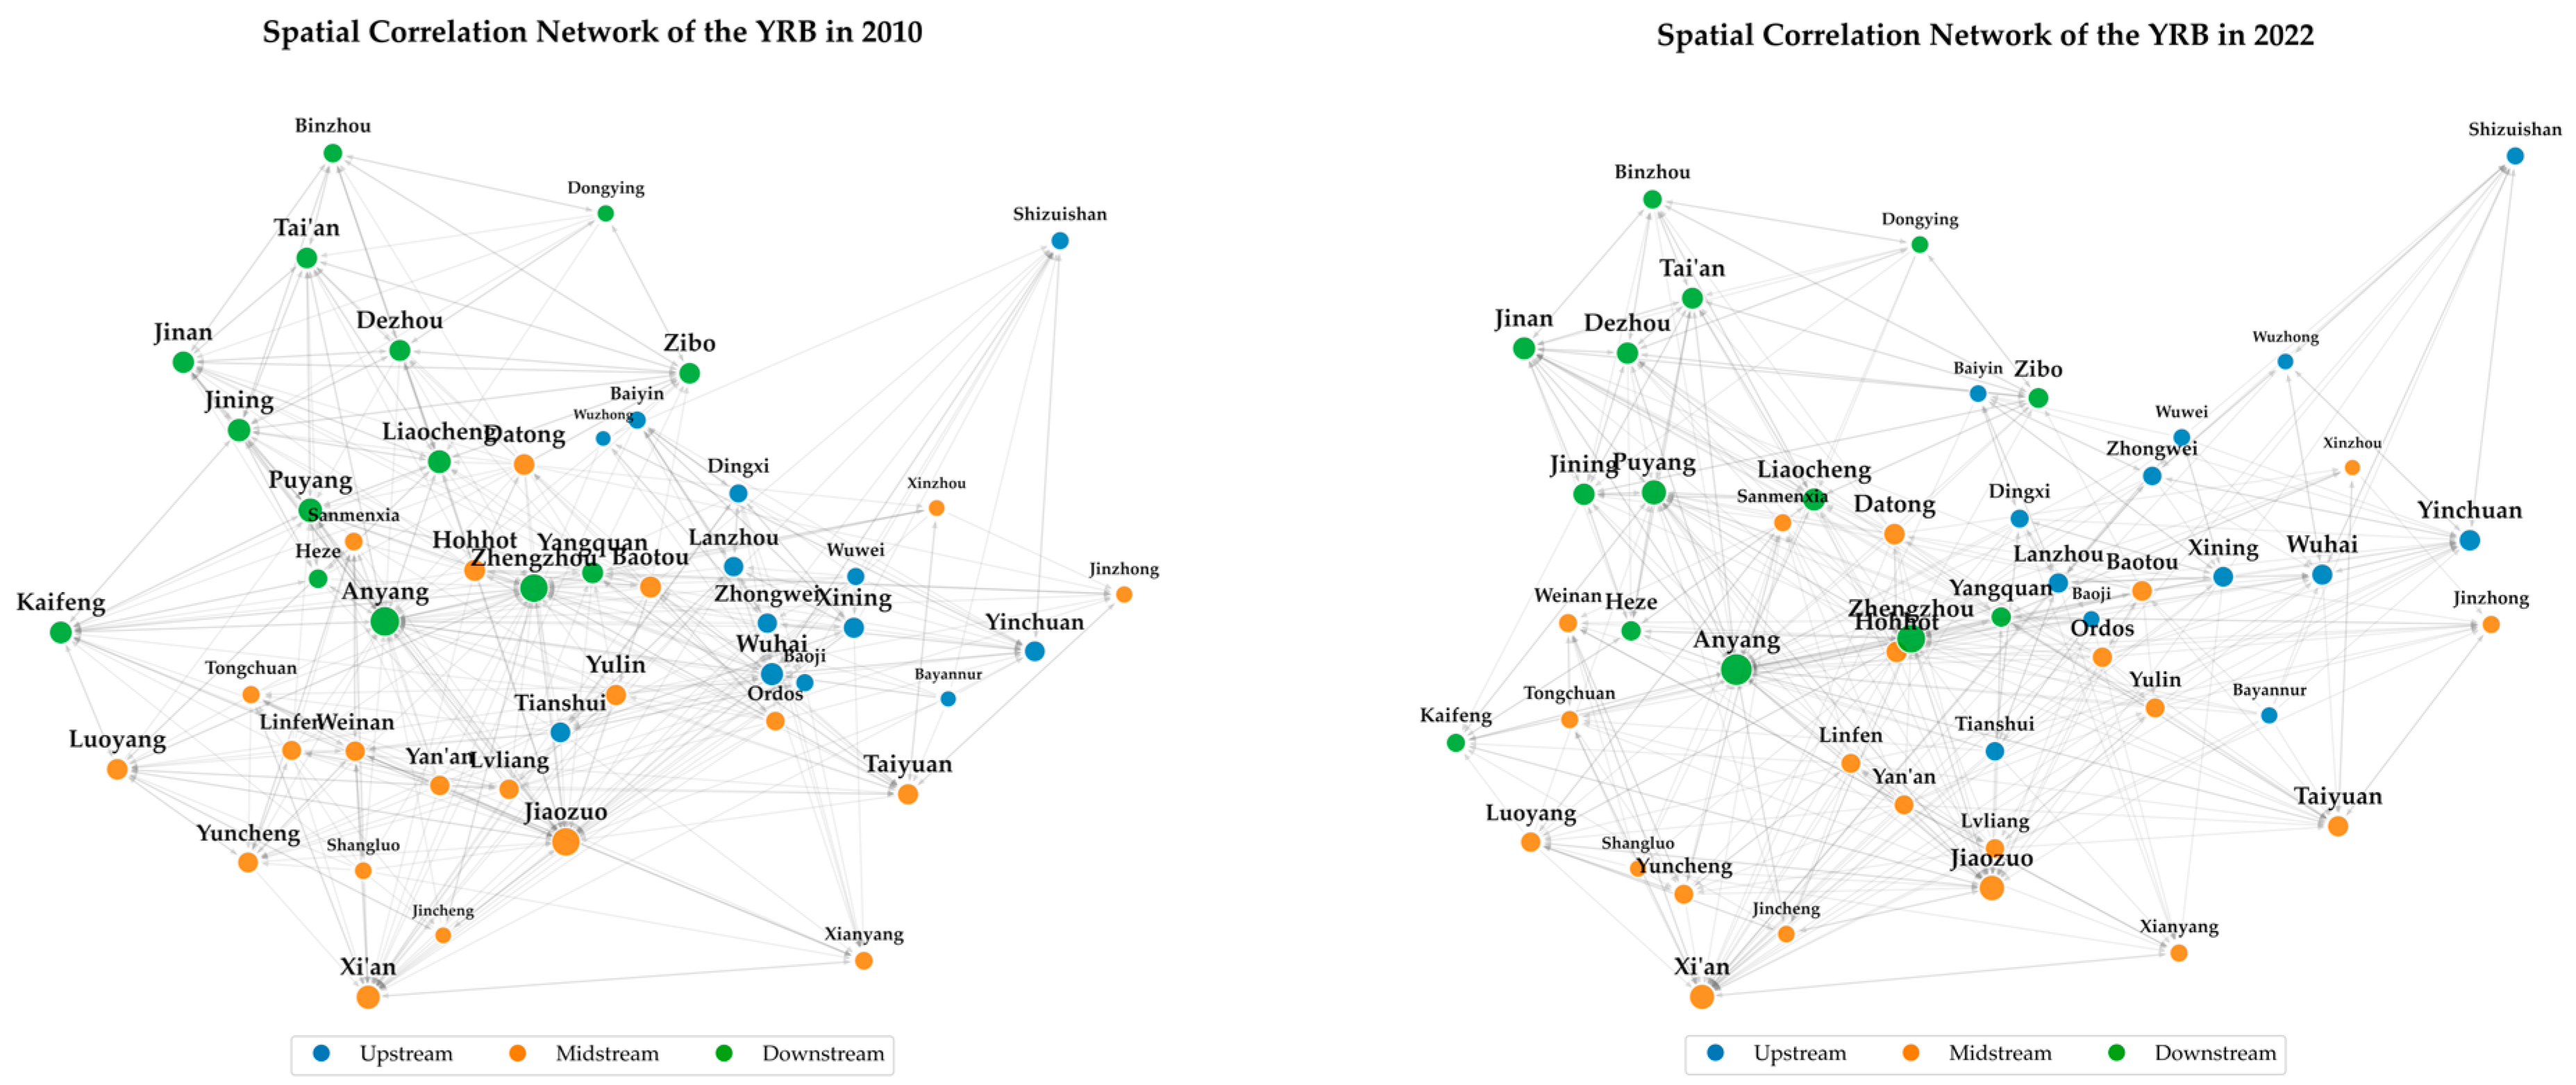
As shown in Figure 6, from a spatial topology perspective, the network exhibited a pronounced “core–periphery” structure in 2010, anchored primarily by midstream and downstream cities such as Xi’an, Zhengzhou, and Jinan, while numerous upstream cities remained highly marginalized. By 2022, the absolute centrality of a few core nodes had diminished, yielding a flatter, more decentralized network structure. Cross-regional network linkages intensified in upstream and midstream cities such as Hohhot, Ordos, and Yulin, signaling a gradual paradigm shift toward a polycentric distribution.
Within the YRB’s industrial landscape, the enhanced network centrality of certain midstream and upstream resource-based cities is primarily driven by the cross-regional dispatch of energy and bulk commodities, rather than by genuine collaborative green technology innovation. This endowment-driven network correlation implies that these cities remain relatively insulated from green constraints imposed by downstream supply chains.
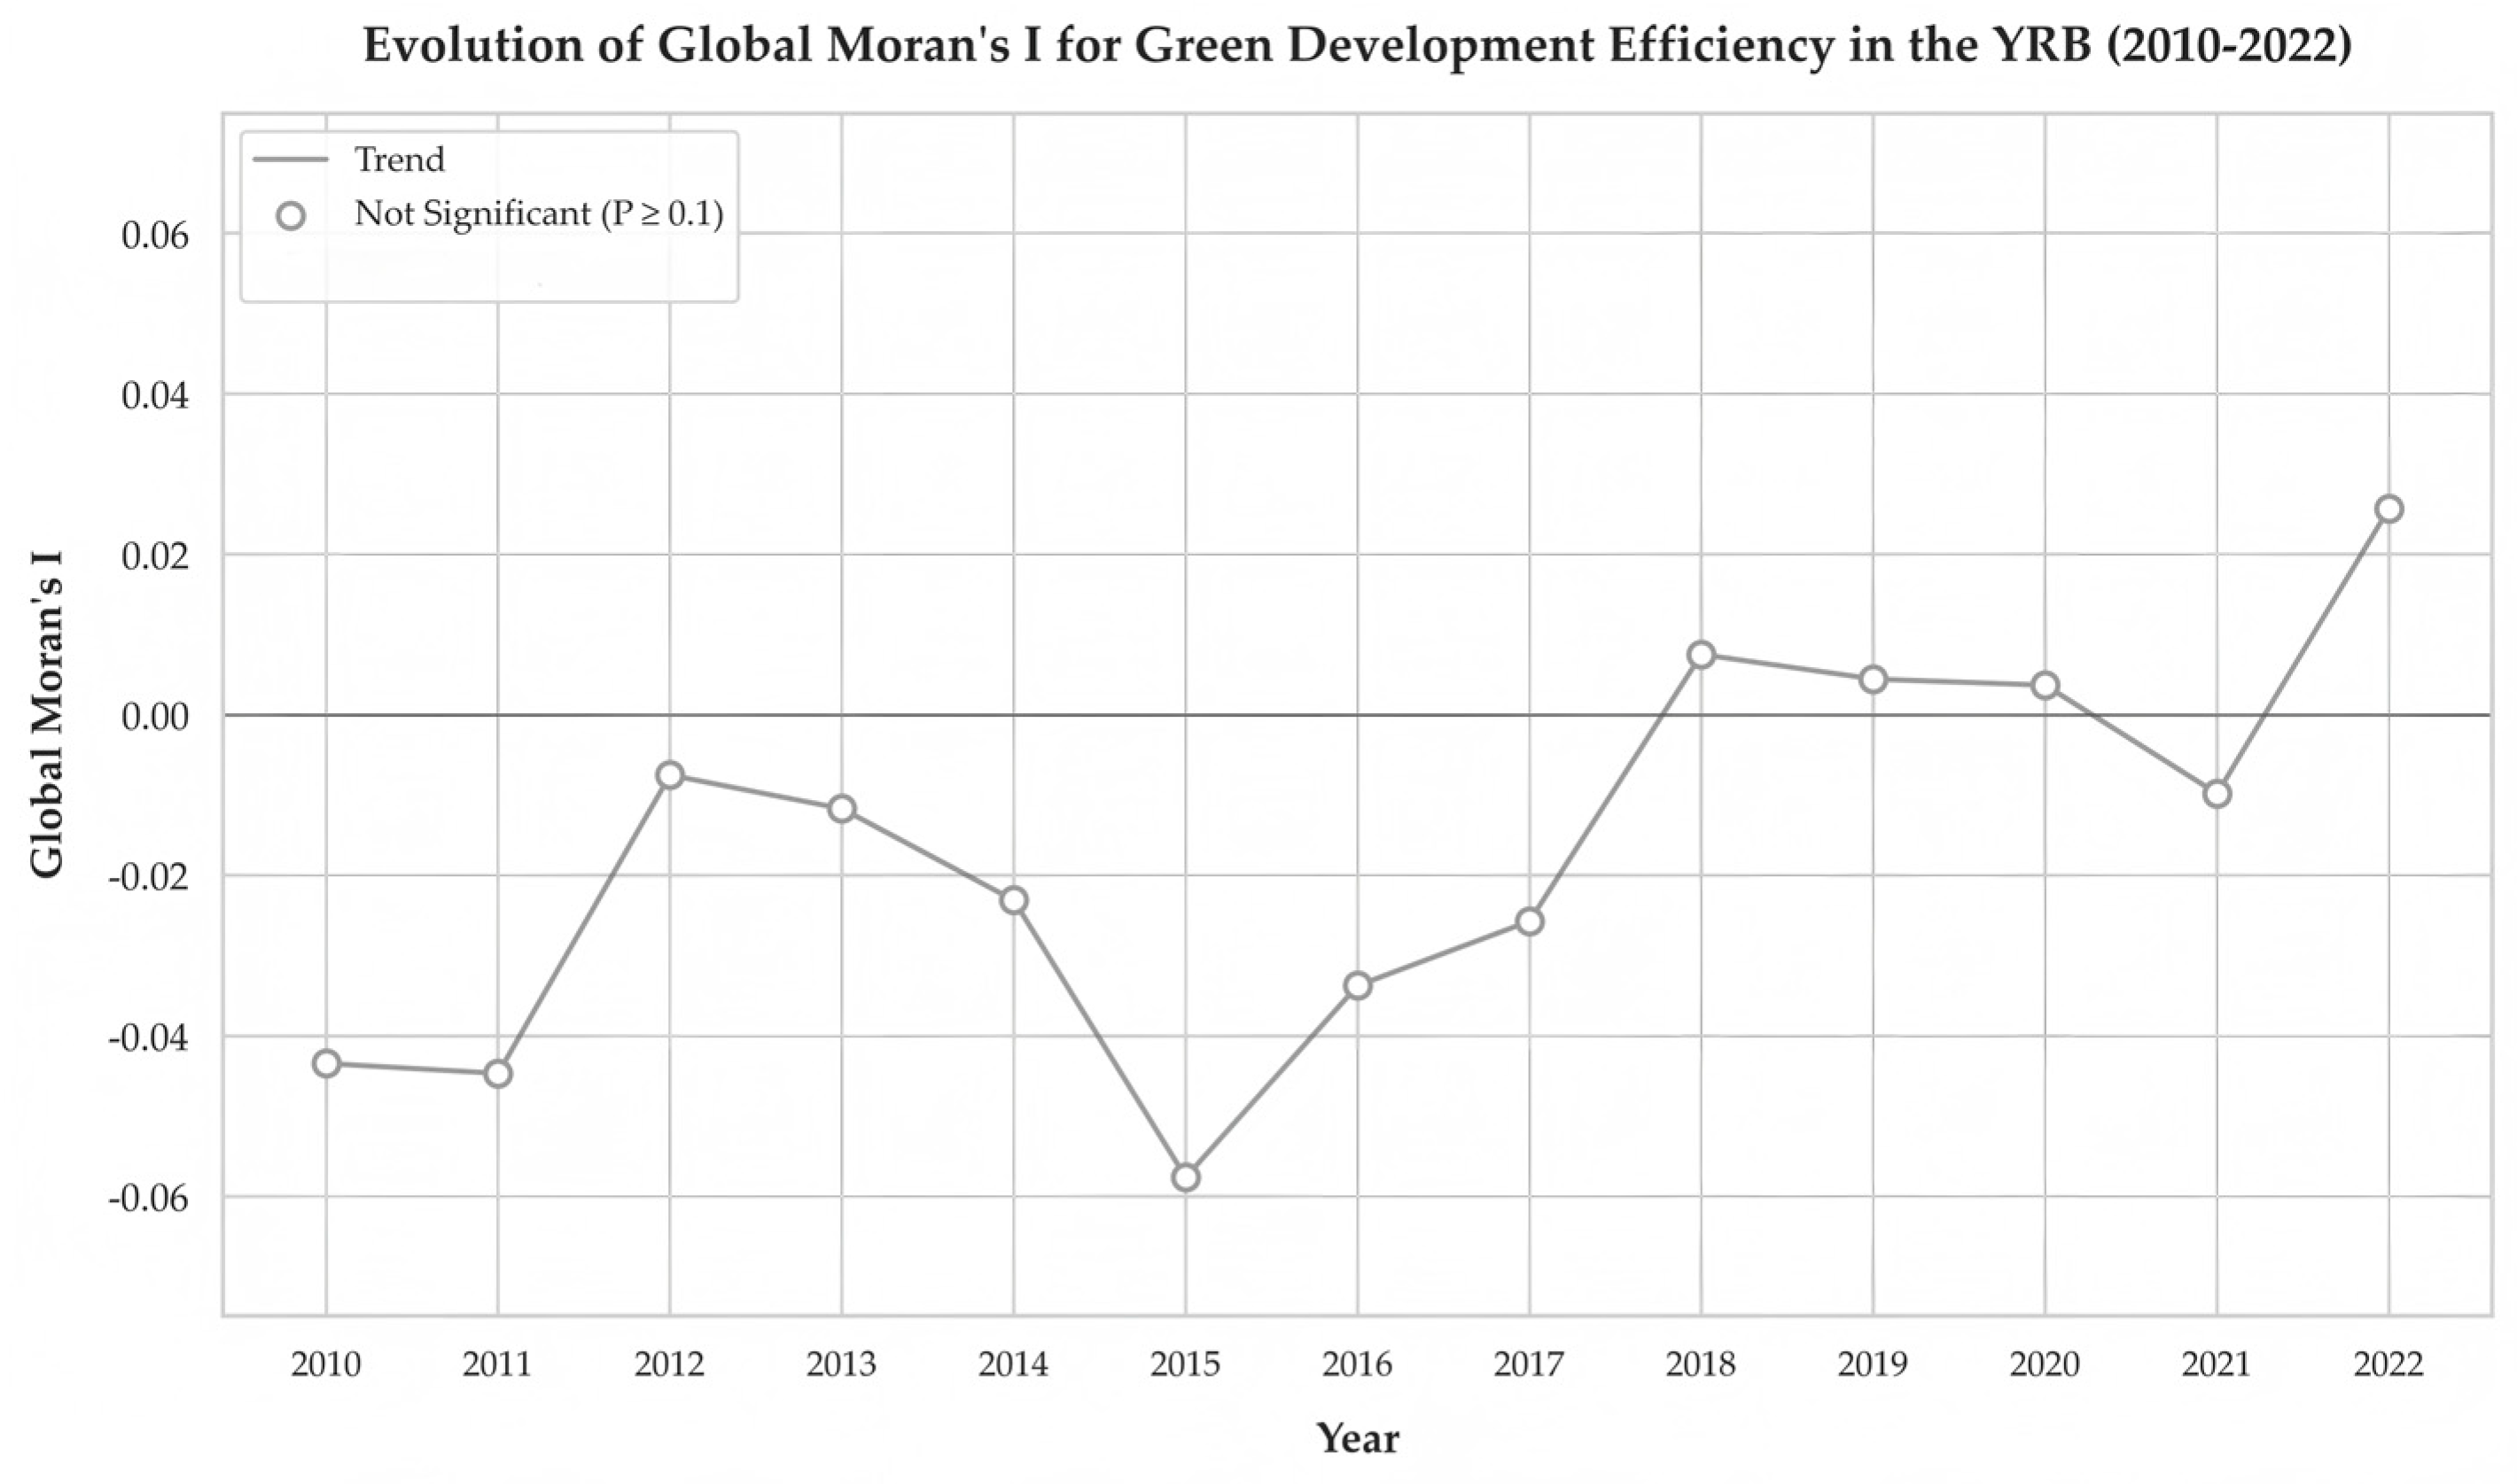
Furthermore, the Global Moran’s I test for GDE yielded negative and statistically non-significant values for the majority of the observation period, with the index for 2022 remaining at a low value of 0.025 and failing to pass the 10% significance threshold, as shown in Figure 7. This long-term statistical insignificance robustly demonstrates that when analyzed through traditional linear geographic clustering lenses, the spatial dependence of GDE across the YRB appears structurally fragmented.

4.4. Macro-Micro Compatibility Analysis

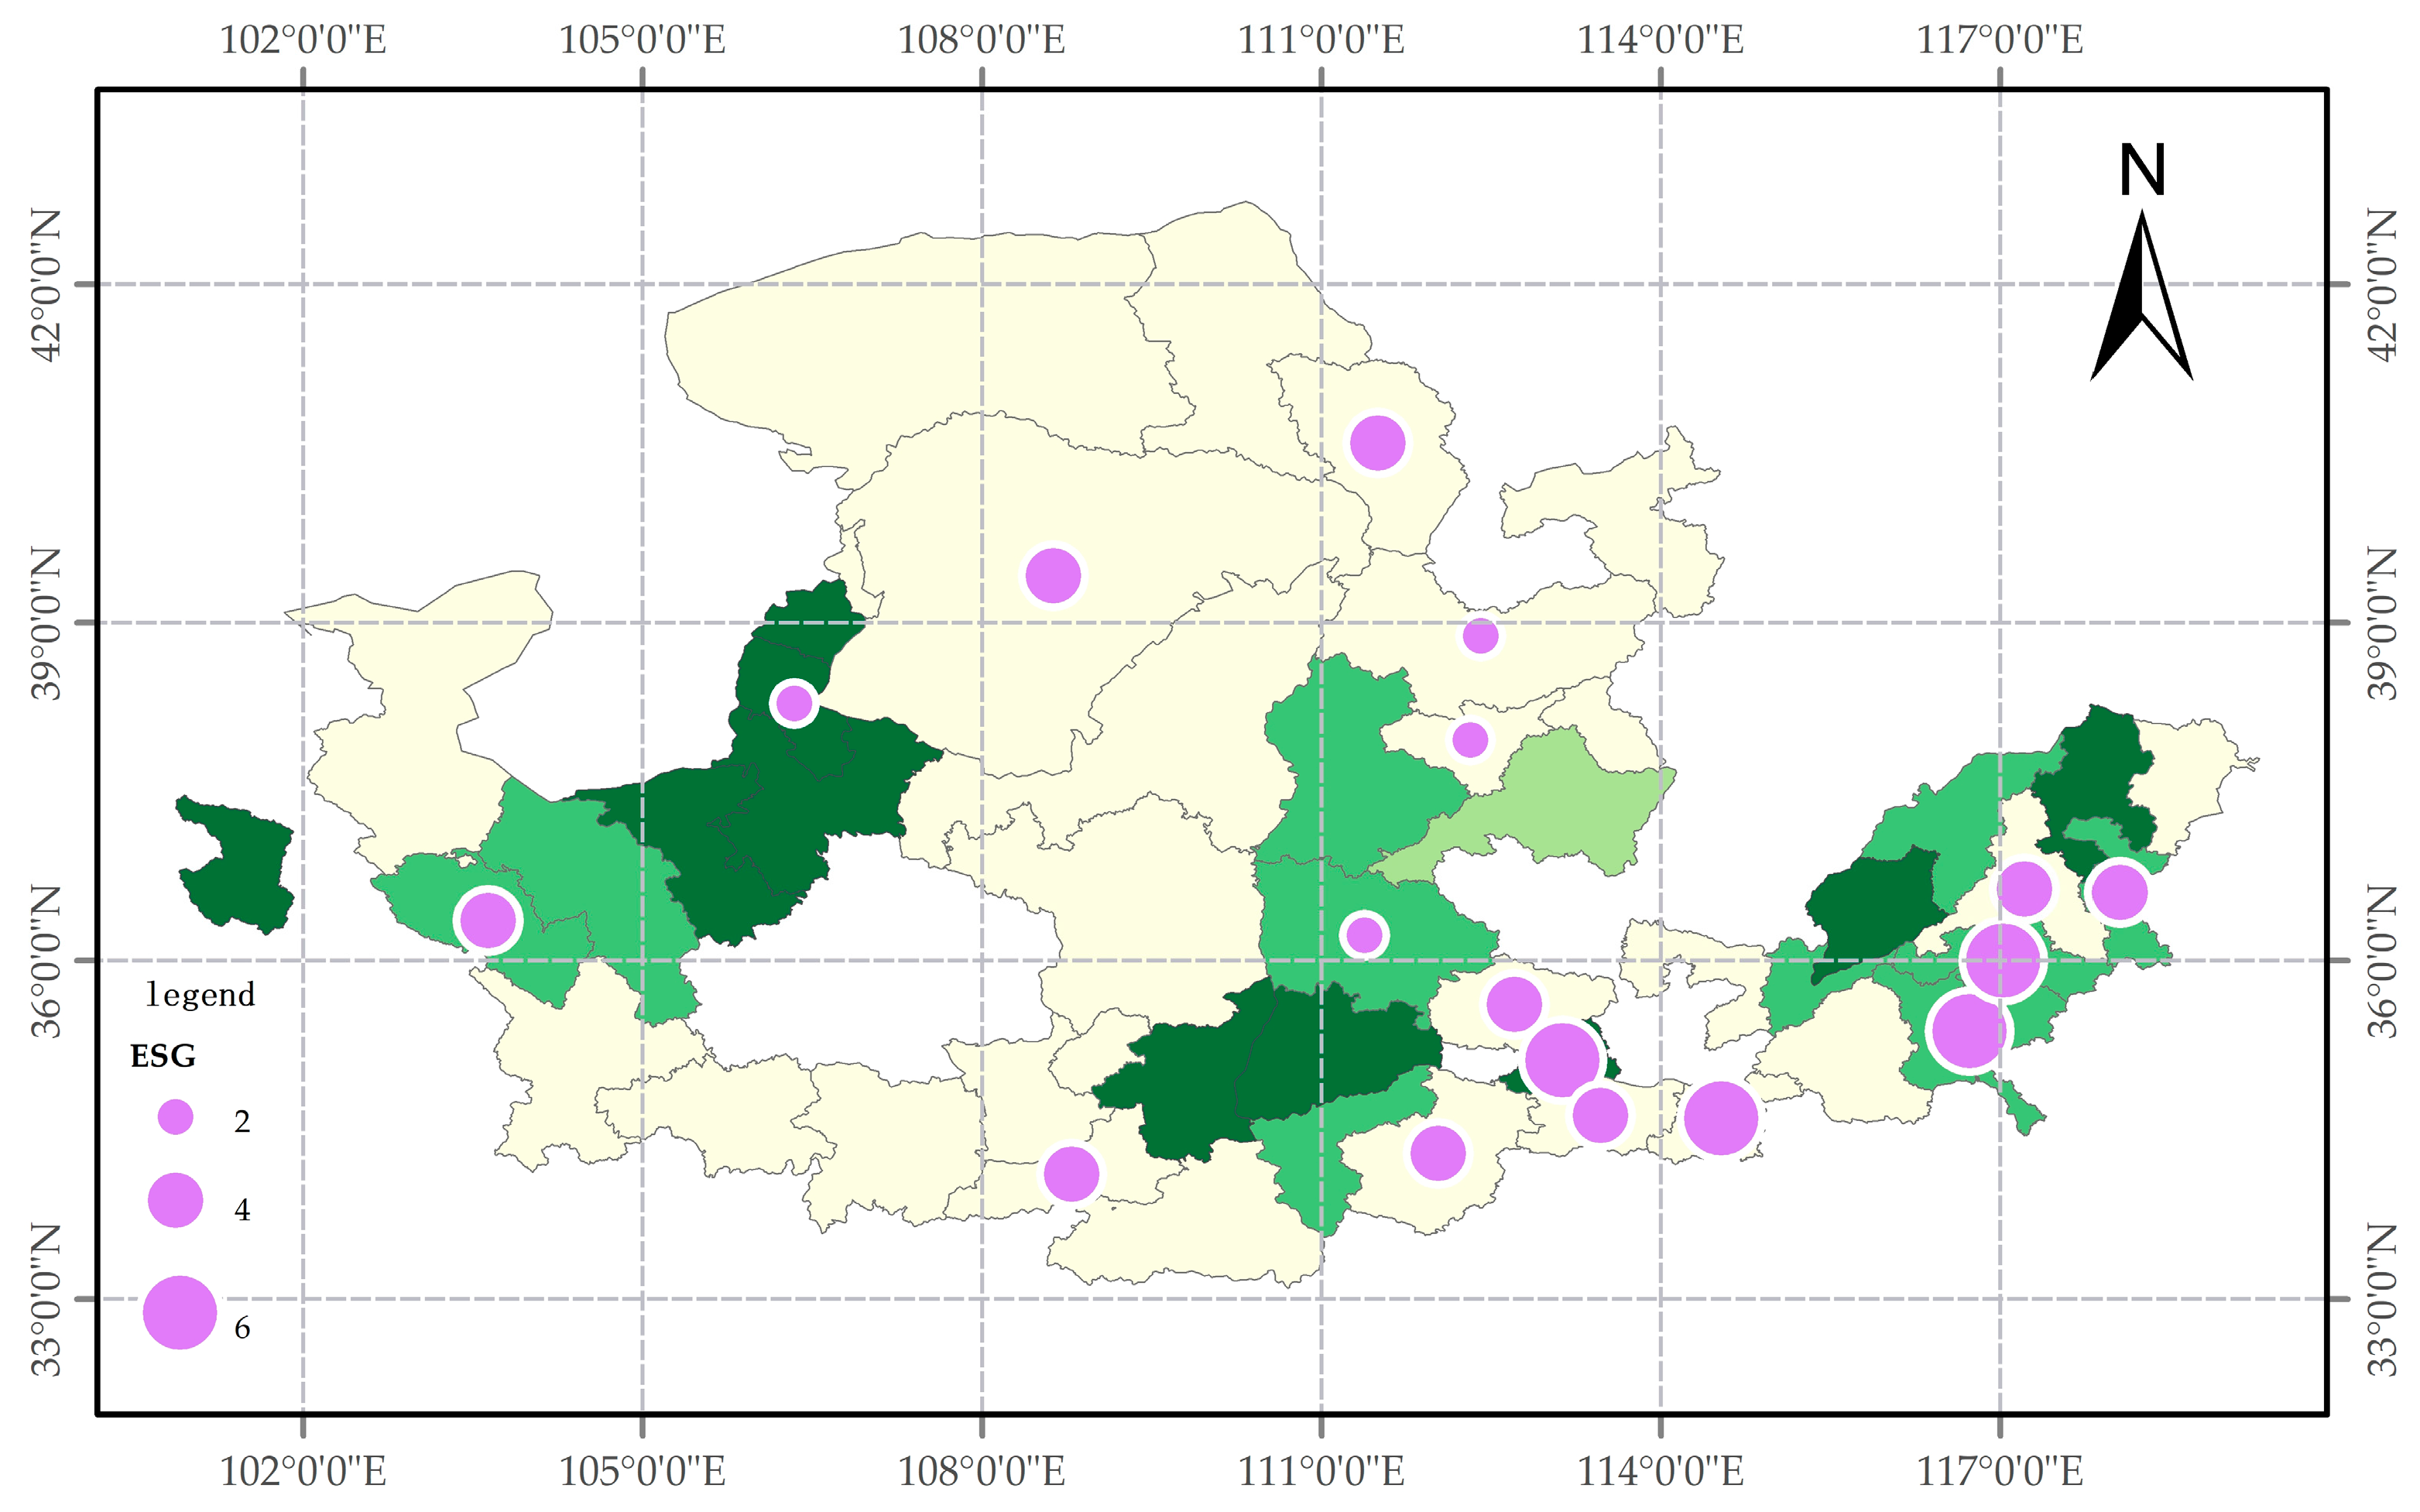
We conduct a spatial overlay analysis comparing macro-level GDE with micro-level supply chain ESG performance, revealing a pronounced spatial mismatch.
Specifically, midstream resource-based cities exhibit ostensibly high macro-level GDE alongside distinctly low micro-ESG ratings, as shown in Figure 8. This discrepancy is largely due to midstream enterprises being anchored upstream in the industrial chain, where external green governance pressures remain lax. Conversely, downstream industrial cities display depressed macro-level GDE despite their micro-enterprises operating under stringent ESG constraints. This paradigm is driven by the rigorous compliance mandates imposed on downstream firms by end-consumer markets. This profound spatial mismatch critically elucidates the non-significant transmission of micro-level regulations observed in the subsequent mechanism analysis.

5. Analysis of Macro-Level Mechanisms

Building on the spatial correlation tests presented above, this section uses the SDM to examine the underlying mechanisms driving GDE in the YRB.

5.1. SDM Baseline Regression and Effect Decomposition

Prior to conducting the spatial econometric estimation, standard diagnostic procedures proposed by Elhorst were strictly executed to determine the optimal model specification. First, the Lagrange Multiplier (LM) tests (including LM-lag and LM-error) rejected the non-spatial null hypothesis at the 1% significance level, confirming the imperative of incorporating spatial externalities. Second, the Hausman test yielded a statistically significant result (p < 0.01), robustly rejecting the random-effects specification in favor of fixed effects. Finally, both the Likelihood Ratio (LR) and Wald tests passed the 1% significance threshold, demonstrating that the SDM could not degenerate into either the Spatial Autoregressive (SAR) or Spatial Error Model (SEM). Consequently, a two-way fixed-effects SDM is employed to estimate the parameters. The baseline regression results and the decomposition of spatial partial derivative effects are reported in Table 4.
Based on Table 4, we make the following analysis:
(1)
The direct effect coefficient of economic development (ln_PGDP) is 0.358 (p < 0.01), indicating that local economic growth significantly promotes GDE. This likely reflects the capacity of increased local fiscal revenue to stimulate investments in environmental governance. Conversely, the indirect effect coefficient is significantly negative (−0.166, p < 0.1), verifying the “backwash effect” proposed in Hypothesis H2. This result suggests that, at the current stage, the economic expansion of central cities exerts a negative spatial spillover on adjacent regions, likely driven by the siphoning of advanced production factors toward core cities and the concomitant relocation of pollution-intensive industries to peripheral areas.
(2)
The empirical results reveal that the direct effect of technological innovation (ln_Tech) is significantly negative (−0.146, p < 0.01). This finding indicates that current R&D investments in the YRB have failed to translate into local green efficiency gains, instead exerting a pronounced inhibitory effect. This phenomenon is fundamentally rooted in the region’s heavy-chemical industrial structure, where substantial R&D investments are allocated toward enhancing fossil energy extraction and processing. While such technological progress rapidly expands production capacity in the short term, it simultaneously exacerbates local ecological pressure. Interestingly, the indirect effect is significantly positive (0.110, p < 0.1). This suggests that neighboring cities can partially enhance their GDE through knowledge spillovers and cross-regional technology sharing.
(3)
Comprehensive total effects. The total effect of economic development (ln_PGDP) is positive (0.192) but statistically non-significant, suggesting that the local environmental dividends of economic growth are substantially offset by its negative spatial spillovers, rendering the overall regional impact ambiguous. Furthermore, the total effect of technological innovation (ln_Tech) is −0.037, indicating that the positive spatial spillovers of knowledge sharing are ultimately insufficient to counteract the severe local environmental penalties induced by the energy rebound effect.

5.2. Testing the Nonlinear Rebound Effect of Technological Innovation

To rigorously verify the Jevons paradox induced by technological innovation, this study introduces a quadratic term for ln_Tech to conduct a nonlinear test. The regression results (Table 5) demonstrate that both the primary term (−0.202) and the quadratic term (−0.039) of technological innovation are significantly negative at the 1% level. Mathematically, these coefficients depict a trajectory that currently resides entirely on the downward-sloping segment of an inverted U-shape within the existing data range. This indicates an accelerating negative correlation between technological investment and GDE. This empirical evidence robustly substantiates that the innovation-driven “energy rebound effect” monotonically exacerbates local ecological degradation without reaching a turning point.
To elucidate the paradox of higher GDE observed in the energy-intensive midstream region, this study further examines the correlation between GDE scores and energy consumption intensity across different segments of the basin. The results (Table 6) reveal a pronounced negative correlation in the midstream (r = −0.523), significantly stronger than the associations observed in the upstream (−0.367) and downstream (−0.249) regions.
The results demonstrate that their efficiency advantages stem from localized structural optimizations that reduce unit energy intensity while maintaining massive absolute output. However, as technical efficiency improves and production costs decline, enterprises are stimulated to aggressively expand production scales, ultimately triggering a surge in total energy consumption and aggregate emissions. This mechanism perfectly illustrates the micro-foundations of the Jevons paradox, precluding the biased interpretation that “resource endowments simply mask low efficiency” and reinforcing the robustness of the core findings.

5.3. Spatial Spillover Effects of Economic Distance

The baseline regression establishes a significant positive spatial autocorrelation of GDE under geographic weights (ρ = 0.221). To discern whether these spatial interactions are driven by physical adjacency or economic integration, this section substitutes the geographic matrix with an economic distance matrix (characterizing similarities in levels of economic development) for comparative regression analysis. The results are presented in Table 7.
The results reveal a stark empirical divergence: when transitioned to economic distance weights, the spatial autoregressive coefficient (ρ) drops to 0.141 and entirely loses statistical significance. Furthermore, the indirect spatial spillover effects of all driving variables become completely insignificant. This profound contrast robustly validates that spatial interactions of GDE in the YRB exhibit severe geographic lock-in.
Notably, the transition to economic weights also induces visible fluctuations in the coefficients of fundamental control variables. This coefficient sensitivity implies that the economic distance matrix not only severs spatial spillovers but also reshapes the localized transmission mechanisms of these economic fundamentals, further underscoring the profound developmental fragmentation within the basin.
This geographically dependent, economically isolated spatial correlation pattern makes the transmission of external market forces—specifically, downstream supply chain ESG pressure—highly susceptible to structural blockages. Building upon this structural premise, the subsequent section will empirically test the moderating role of micro-enterprise ESG pressure, investigating whether this external regulatory mechanism suffers from transmission failure within the YRB’s locked-in industrial network.

6. Analysis of Micro-Mechanisms

Building on the preceding analysis of the YRB’s spatial network—which is characterized by “strong geographical connectivity but weak economic synergy”—this section further examines the effectiveness of external market-based regulatory instruments. Specifically, we investigate the moderating role of supply chain ESG pressure, functioning as an external market constraint, in the aforementioned Jevons paradox. Although the number of sampled listed companies is limited, these firms operate as core nodes within regional industrial chains, making their aggregated data a robust proxy for market-driven green pressures at the prefecture-city scale.

6.1. Micro-Level ESG Pressure Regulation Mechanism

This study introduces the urban supply chain ESG pressure index (ln_ESG) and its interaction with technological innovation (ln_Tech*ln_ESG) into the empirical framework. The regression results indicate that neither the main effect of supply chain ESG pressure nor the interaction term’s coefficient (−0.0748) is statistically significant (p > 0.1). This evidence suggests that the anticipated moderating effect is absent across the full sample. Statistically, this finding provides robust empirical support for Hypothesis H4, which posits that the micro-level ESG reverse-forcing mechanism, originating from high-standard downstream customers, undergoes severe attenuation as it crosses spatial boundaries to reach the YRB.
Furthermore, bivariate spatial association analysis shows that core nodes in the midstream and upstream reaches predominantly exhibit a high-efficiency–low-pressure spatial regime, whereas traditional industrial cities in the downstream manifest a low-efficiency–high-pressure paradigm. This spatial mismatch between micro-regulatory pressure and macro-efficiency performance reflects the inherent limitations of market-based regulatory tools for cross-regional transmission.

6.2. Analysis of Carbon Lock-In Effect

To elucidate the micro-foundations underlying the non-significant moderating effect in the full-sample test, this study introduces the carbon lock-in effect to conduct analysis, incorporating the evolutionary characteristics of midstream and upstream nodes within the spatial topological network.
The grouped regression results reveal a striking empirical divergence: the coefficient of the ESG interaction term is significantly positive for the subsample of low resource-dependent cities, indicating an effective moderating role. In stark contrast, for highly resource-dependent cities, this coefficient approaches zero and is entirely not statistically significant. This outcome profoundly substantiates Hypothesis H4, revealing the entrenched carbon lock-in within the heavy-chemical industrial structures of the YRB’s midstream and upstream. Upstream enterprises are incentivized to adopt symbolic compliance rather than substantive green process innovations when confronting external voluntary ESG standards. Consequently, when external market constraints collide with endogenous heavy-industrial structures, the transmission mechanism is fundamentally structurally obstructed. These findings underscore that, within the YRB’s green transition trajectory, relying exclusively on spontaneous market forces is wholly insufficient to rectify the misallocation of technological innovation.

7. Conclusions and Discussion

7.1. Main Conclusions

Using spatial econometric analysis and empirical testing of the underlying mechanisms, this study presents the following key conclusions:
First, the spatial pattern of GDE in the YRB has evolved into a complex networked structure. Driven by national strategies, the measured efficiency of resource-based cities in the midstream has improved significantly, exhibiting a clear trend of growth polarization. However, empirical evidence demonstrates that this spatial restructuring is predominantly propelled by passive spillovers rooted in geographic proximity. Active linkages founded on industrial division of labor and economic synergy remain fundamentally weak, engendering a “lock-in” effect where localized efficiency gains coexist with severe regional fragmentation.
Second, a pronounced Jevons paradox (energy rebound effect) undermines the ecological efficacy of technological innovation in the YRB. The research reveals that current technological progress has not immediately translated into substantive environmental performance. Constrained by the path dependency of heavy-chemical industries, short-term efficiency dividends generated by technological advancements are often offset by the surge in absolute energy consumption triggered by capacity expansion. Consequently, rather than catalyzing a holistic green transition, technological innovation can temporarily reinforce the region’s resource dependence if not coupled with strict aggregate capacity controls.
Third, the efficacy of micro-ESG constraints originating in downstream supply chains is severely attenuated as they propagate toward the midstream and upstream reaches. This structural bottleneck decisively neutralizes the market’s reverse-forcing mechanism, significantly limiting its capacity to recalibrate the trajectory of local technological innovation.

7.2. Discussion

Unlike previous studies that universally advocate for technological innovation as a panacea for regional green transitions, our findings unveil a stark Jevons paradox in resource-heavy basins [60,70,71,72]. This observation strongly resonates with recent international empirical research indicating that in traditional industrial heartlands globally, technological advancements in energy-intensive sectors frequently stimulate capacity expansion rather than facilitating deep decarbonization [73]. Although specific midstream cities register GDE scores superior to those of downstream economic hubs, these statistical improvements are primarily artifacts of administrative end-of-pipe treatments and massive resource-driven outputs, rather than a fundamental paradigm shift in production modes. Their elevated topological network centrality merely reflects the agglomeration effect of fossil endowments. This coexistence of ostensibly high efficiency scores and persistently high carbon emissions implies that the YRB’s current green transition remains highly fragile and mathematically inflated, serving as a cautionary empirical case for similar global resource-dependent regions navigating the complexities of sustainable transitions.
Furthermore, it is crucial to discuss the fluctuating trajectories identified in our spatiotemporal analysis within the context of China’s macro-policy shifts. The oscillation and eventual contraction observed during 2010–2019 likely reflect the systemic environmental compliance costs imposed by the transition away from resource-intensive pathways [74]. Specifically, the introduction of stringent environmental laws and central ecological inspections accelerated the compulsory phasing out of outdated industrial capacities [75]. In the short term, this dual shock inevitably compressed economic outputs while forcing substantial corporate capital expenditures into end-of-pipe treatments, yielding a temporary macro-efficiency penalty [76]. Conversely, the post-2020 GDE recovery aligns with the progressive release of structural optimization dividends following the 2019 YRB National Strategy [77]. The rapid deployment of renewable energy infrastructure successfully mitigated absolute pollutant density, demonstrating how macro-level regulatory realignments can fundamentally reshape localized eco-efficiency frontiers.
While existing literature emphasizes the positive environmental externalities of ESG integration, this study identifies a critical “boundary of efficacy” for voluntary market mechanisms under carbon lock-in conditions [70]. Unlike post-industrial economies where stringent institutional frameworks and mature market-based regulations effectively internalize environmental costs across supply chains [78], the spatial regime of “strong geographical connectivity but weak economic synergy” in the YRB critically restricts the diffusion of market-based pricing and regulatory signals. Lacking deep, cross-regional industrial-chain integration, the YRB lacks an effective institutional vehicle to internalize external market constraints. Consequently, the rigid boundaries of administrative jurisdictions and resource endowments have completely superseded the resource-allocation role of market mechanisms, thereby paralyzing the policy efficacy of voluntary environmental regulations.
Consequently, the theoretical findings of this study bear profound policy relevance for regional governance in the YRB. The verified Jevons paradox suggests that traditional, un-targeted innovation subsidies are structurally flawed in resource-heavy basins, highlighting the urgent need for policymakers to decouple R&D incentives from sheer capacity expansion. Furthermore, the observed failure of supply chain ESG pressures and the geographic lock-in of spatial spillovers reveal the inherent limits of relying solely on voluntary market mechanisms. Because administrative boundaries and path dependencies severely distort market signals, localized environmental regulations must be elevated to a basin-wide collaborative framework. This necessitates a fundamental policy paradigm shift: from fragmented, ‘growth-first’ technology subsidies to targeted, cross-regional governance models that integrate rigid administrative mandates with market-based tools. These critical insights directly inform the specific policy implications outlined below.

7.3. Policy Implications

First, redirect technological R&D trajectories to rigorously suppress the energy rebound effect. It is imperative to overhaul current R&D subsidy orientations by shifting financial support exclusively toward critical decarbonization technologies, such as Carbon Capture, Utilization, and Storage, and ultra-low-emission systems. Policymakers must establish a “green-performance-contingent” R&D evaluation framework that legally ties technological investments to absolute energy consumption caps to prevent innovation-induced capacity expansion.
Second, overcome geographic lock-in by building cross-regional economic collaboration networks. Regional governance should transcend physical proximity by promoting green supply chain partnerships and enclave economies linking upstream energy-producing basins with downstream advanced manufacturing hubs. By institutionalizing cross-regional capital investments and technology transfers, the YRB can develop the organizational infrastructure needed to enable the free flow of market-based regulatory signals.
Third, align rigid administrative mandates with market instruments to dismantle industrial path dependence. In response to the verified failure of voluntary ESG constraints in the upstream, central, and provincial governments must enforce rigid administrative interventions. Incorporating mandatory supply chain carbon-footprint tracking and ESG performance into corporate credit ratings and factor market-access evaluations will effectively bridge the regulatory gap. Synchronizing these rigid mandates with market-based tools (e.g., cross-regional carbon-emission trading systems) is essential to shatter carbon lock-in in heavy chemical industries and to enforce the reallocation of resources toward a circular economy.

7.4. Limitations and Future Research

While this study provides novel insights into spatiotemporal dynamics and transmission bottlenecks of GDE in the YRB, several limitations warrant further investigation.
First, constrained by the availability of prefecture-level microdata, this study utilizes aggregate science and technology expenditure as a proxy for technological innovation. This broad metric precludes a granular distinction between “green clean technologies” and “brown capacity-expanding technologies.” Future research should incorporate micro-level green patent data to precisely decompose these heterogeneous technological effects.
Second, spatial econometric analysis primarily relies on geographic and economic distance matrices. While effectively capturing proximity and developmental similarity, these matrices may not fully delineate the complex, cross-regional trade networks. Future studies could construct supply chain trade network matrices utilizing inter-regional Input–Output Tables, thereby enabling a more precise tracing of ESG pressure transmission pathways along authentic industrial chains.
Third, although spatial and two-way fixed-effects models mitigate omitted variable biases to some extent, potential endogeneity regarding technological innovation remains a challenge. Future research should employ dynamic spatial panel models or construct historical instrumental variables to further solidify causal inferences.

Author Contributions

Conceptualization, D.Y. and H.J.; methodology, D.Y.; software, D.Y.; validation, D.Y., H.J. and Y.H.; formal analysis, W.X.; investigation, D.Y.; resources, H.J.; data curation, H.J.; writing—original draft preparation, D.Y.; writing—review and editing, H.J.; visualization, Y.H.; supervision, W.X.; project administration, W.X.; funding acquisition, H.J. All authors have read and agreed to the published version of the manuscript.

Funding

This research was funded by Qinghai University Research Ability Enhancement Project (2026KTSTO6).

Institutional Review Board Statement

Not applicable.

Informed Consent Statement

Not applicable.

Data Availability Statement

Data are contained within the article. The data presented in this study can be requested from the authors.

Conflicts of Interest

The authors declare no conflicts of interest.

References

  1. Liang, K.; Li, Z.; Luo, L. Measurement, dynamic evolution and influencing factors of green development efficiency in western China: Based on ecological-economic-social system. PLoS ONE 2023, 18, e0290472. [Google Scholar] [CrossRef] [Scilit]
  2. United Nations. Transforming Our World: The 2030 Agenda for Sustainable Development. Available online: https://sdgs.un.org/2030agenda (accessed on 1 May 2026).
  3. Kazak, T. European Green Deal. Yearb. Law Dep. 2020, 9, 304–315. [Google Scholar] [CrossRef] [Scilit]
  4. Zhu, Z.; Zhang, Z. Spatiotemporal Dynamic Evolution of Energy Rebound Effect and Sustainable Path for Energy Conservation–Emission Reduction in Resource-Based Cities of China. Sustainability 2025, 17, 4419. [Google Scholar] [CrossRef] [Scilit]
  5. Wang, L.; Xue, W. Analysis of carbon emission drivers and multi-scenario projection of carbon peaks in the Yellow River Basin. Sci. Rep. 2023, 13, 13684. [Google Scholar] [CrossRef] [Scilit]
  6. Wohlfart, C.; Kuenzer, C.; Chen, C.; Liu, G. Social–ecological challenges in the Yellow River basin (China): A review. Environ. Earth Sci. 2016, 75, 1066. [Google Scholar] [CrossRef] [Scilit]
  7. Du, H.; Ji, X.; Chuai, X. Spatial Differentiation and Influencing Factors of Water Pollution-Intensive Industries in the Yellow River Basin, China. Int. J. Environ. Res. Public Health 2022, 19, 497. [Google Scholar] [CrossRef] [Scilit]
  8. Liu, L.; Yang, Y.; Liu, S.; Gong, X.; Zhao, Y.; Jin, R.; Duan, H.; Jiang, P. A comparative study of green growth efficiency in Yangtze River Economic Belt and Yellow River Basin between 2010 and 2020. Ecol. Indic. 2023, 150, 110214. [Google Scholar] [CrossRef] [Scilit]
  9. Liu, S.; Zhang, H.; Jiang, G. Spatiotemporal coupling and regional differences analysis between agricultural land use efficiency and rural revitalization in the Yellow River Basin. Sci. Rep. 2025, 15, 11348. [Google Scholar] [CrossRef] [Scilit] [PubMed]
  10. Zhang, Y.; Wang, Y. Water–Energy–Food Nexus in the Yellow River Basin of China under the Influence of Multiple Policies. Land 2024, 13, 1356. [Google Scholar] [CrossRef] [Scilit]
  11. Tone, K. A slacks-based measure of super-efficiency in data envelopment analysis. Eur. J. Oper. Res. 2002, 143, 32–41. [Google Scholar] [CrossRef] [Scilit]
  12. Tone, K. A slacks-based measure of efficiency in data envelopment analysis. Eur. J. Oper. Res. 2001, 130, 498–509. [Google Scholar] [CrossRef] [Scilit]
  13. Yang, L.; Ma, Z.; Yin, J.; Li, Y.; Lv, H. The evolution and determinants of Chinese inter-provincial green development efficiency: An MCSE-DEA-Tobit-based perspective. Environ. Sci. Pollut. Res. 2023, 30, 53904–53919. [Google Scholar] [CrossRef] [Scilit]
  14. Lu, Y.; Cao, B.; Hua, Y.; Ding, L. Efficiency Measurement of Green Regional Development and Its Influencing Factors: An Improved Data Envelopment Analysis Framework. Sustainability 2020, 12, 4361. [Google Scholar] [CrossRef] [Scilit]
  15. Yang, X.; Feng, Z.; Chen, Y.; Xu, X. A comparative analysis of the levels and drivers of regional coordinated development in the Yangtze River Economic Belt and Yellow River Basin, China. Heliyon 2024, 10, e26513. [Google Scholar] [CrossRef] [Scilit] [PubMed]
  16. Peng, S.; Yu, Y. Green development efficiency measurement and influencing factors analysis in the Yangtze River economic Belt, China. Ecol. Indic. 2024, 162, 112025. [Google Scholar] [CrossRef] [Scilit]
  17. Wang, K.-L.; Zhang, F.-Q.; Xu, R.-Y.; Miao, Z.; Cheng, Y.-H.; Sun, H.-P. Spatiotemporal pattern evolution and influencing factors of green innovation efficiency: A China’s city level analysis. Ecol. Indic. 2023, 146, 109901. [Google Scholar] [CrossRef] [Scilit]
  18. Zhou, J.; Zhong, M. Spatial-temporal evolution and peer effects of urban green development efficiency in China. Sci. Rep. 2024, 14, 8501. [Google Scholar] [CrossRef] [Scilit]
  19. Zhu, H.; Jiang, S.; Zhao, X. Spatial-Temporal Evolution and Determinants of Green Economy Efficiency: An Integrated Analytical Approach. Sustain. Futures 2024, 8, 100359. [Google Scholar] [CrossRef] [Scilit]
  20. Zhou, L.; Zhou, C.; Che, L.; Wang, B. Spatio-temporal evolution and influencing factors of urban green development efficiency in China. J. Geogr. Sci. 2020, 30, 724–742. [Google Scholar] [CrossRef] [Scilit]
  21. Sun, L.; Qin, L.; Taghizadeh-Hesary, F.; Zhang, J.; Mohsin, M.; Chaudhry, I.S. Analyzing carbon emission transfer network structure among provinces in China: New evidence from social network analysis. Environ. Sci. Pollut. Res. 2020, 27, 23281–23300. [Google Scholar] [CrossRef] [Scilit]
  22. Qiu, S.; Wang, Z.; Geng, S. How do environmental regulation and foreign investment behavior affect green productivity growth in the industrial sector? An empirical test based on Chinese provincial panel data. J. Environ. Manag. 2021, 287, 112282. [Google Scholar] [CrossRef] [Scilit]
  23. Kong, X.; Li, Z.; Lei, X.; Jiang, X.; Bao, X. Environmental regulation, outward foreign direct investment, and China’s green total factor productivity. Environ. Dev. Sustain. 2025, 27, 27761–27780. [Google Scholar] [CrossRef] [Scilit]
  24. Yu, J. Research on the impact of FDI and environmental regulation on the industrial structure upgrading in the Yellow River Basin. Front. Earth Sci. 2024, 12, 1379870. [Google Scholar] [CrossRef] [Scilit]
  25. Ahmad, N.; Youjin, L.; Žiković, S.; Belyaeva, Z. The effects of technological innovation on sustainable development and environmental degradation: Evidence from China. Technol. Soc. 2023, 72, 102184. [Google Scholar] [CrossRef] [Scilit]
  26. Wang, K.-H.; Umar, M.; Akram, R.; Caglar, E. Is technological innovation making world “Greener”? An evidence from changing growth story of China. Technol. Forecast. Soc. Change 2021, 165, 120516. [Google Scholar] [CrossRef] [Scilit]
  27. Hussain, Z.; Mehmood, B.; Khan, M.K.; Tsimisaraka, R.S.M. Green Growth, Green Technology, and Environmental Health: Evidence From High-GDP Countries. Front. Public Health 2021, 9, 816697. [Google Scholar] [CrossRef] [Scilit]
  28. Wang, M.; Pang, S.; Hmani, I.; Hmani, I.; Li, C.; He, Z. Towards sustainable development: How does technological innovation drive the increase in green total factor productivity? Sustain. Dev. 2021, 29, 217–227. [Google Scholar] [CrossRef] [Scilit]
  29. Fich, L.E.; Viola, S.; Bentsen, N.S. Jevons Paradox: Sustainable Development Goals and Energy Rebound in Complex Economic Systems. Energies 2022, 15, 5821. [Google Scholar] [CrossRef] [Scilit]
  30. York, R.; Adua, L.; Clark, B. The rebound effect and the challenge of moving beyond fossil fuels: A review of empirical and theoretical research. Wiley Interdiscip. Rev. Clim. Change 2022, 13, e782. [Google Scholar] [CrossRef] [Scilit]
  31. Sorrell, S. The Rebound Effect: An Assessment of the Evidence for Economy-Wide Energy Savings from Improved Energy Efficiency; UK Energy Research Centre: London, UK, 2007. [Google Scholar]
  32. Olejnik, A.; Żółtaszek, A.; Olejnik, J. Spatial Solution to Measure Regional Efficiency—Introducing Spatial Data Envelopment Analysis. Econ. Reg. 2021, 17, 1166–1180. [Google Scholar] [CrossRef] [Scilit]
  33. Li, Y.; Liao, C.; Li, X.; Guo, R. Understanding regional structure through spatial networks: A simulation optimization framework for exploring balanced development. Habitat Int. 2024, 152, 103155. [Google Scholar] [CrossRef] [Scilit]
  34. Dong, G.; Ma, J.; Lee, D.; Chen, M.; Pryce, G.; Chen, Y. Developing a Locally Adaptive Spatial Multilevel Logistic Model to Analyze Ecological Effects on Health Using Individual Census Records. Ann. Am. Assoc. Geogr. 2020, 110, 739–757. [Google Scholar] [CrossRef] [Scilit]
  35. Liu, X.; Huang, N.; Su, W.; Zhou, H. Green innovation and corporate ESG performance: Evidence from Chinese listed companies. Int. Rev. Econ. Financ. 2024, 95, 103461. [Google Scholar] [CrossRef] [Scilit]
  36. Li, W.; Cai, Z.; Jin, L. A spatial-temporal analysis on green development in China’s Yellow River Basin: Model-based efficiency evaluation and influencing factors identification. Stoch. Environ. Res. Risk Assess. 2023, 37, 4431–4444. [Google Scholar] [CrossRef] [Scilit]
  37. Liu, J.; Zhang, Y.; Pu, L.; Huang, L.; Wang, H.; Sarfraz, M. Research on the Impact of Energy Efficiency on Green Development: A Case Study of the Yellow River Basin in China. Energies 2023, 16, 3660. [Google Scholar] [CrossRef] [Scilit]
  38. Tabassum, S.; Pereira, F.; Fernandes, S.; Gama, J. Social network analysis: An overview. Wiley Interdiscip. Rev. Data Min. Knowl. Discov. 2018, 8, e1256. [Google Scholar] [CrossRef] [Scilit]
  39. Luo, C.; Du, J.; Yang, F. Spatial spillover effects of technological progress on energy intensity in China from the productivity improvement perspective. Sci. Rep. 2025, 15, 32202. [Google Scholar] [CrossRef] [Scilit]
  40. Pan, X.; Guo, S.; Li, M.; Song, J. The effect of technology infrastructure investment on technological innovation—A study based on spatial durbin model. Technovation 2021, 107, 102315. [Google Scholar] [CrossRef] [Scilit]
  41. Chen, H.; Yi, J.; Chen, A.; Peng, D.; Yang, J. Green technology innovation and CO2 emission in China: Evidence from a spatial-temporal analysis and a nonlinear spatial durbin model. Energy Policy 2023, 172, 113338. [Google Scholar] [CrossRef] [Scilit]
  42. Alsayegh, M.F.; Abdul Rahman, R.; Homayoun, S. Corporate Economic, Environmental, and Social Sustainability Performance Transformation through ESG Disclosure. Sustainability 2020, 12, 3910. [Google Scholar] [CrossRef] [Scilit]
  43. Li, T.-T.; Wang, K.; Sueyoshi, T.; Wang, D. ESG: Research Progress and Future Prospects. Sustainability 2021, 13, 11663. [Google Scholar] [CrossRef] [Scilit]
  44. Tsang, A.; Frost, T.; Cao, H. Environmental, Social, and Governance (ESG) disclosure: A literature review. Br. Account. Rev. 2023, 55, 101149. [Google Scholar] [CrossRef] [Scilit]
  45. Xiong, J.; Xu, D. Relationship between energy consumption, economic growth and environmental pollution in China. Environ. Res. 2021, 194, 110718. [Google Scholar] [CrossRef] [Scilit] [PubMed]
  46. Zhao, P.; Lu, Z.; Kou, J.; Du, J. Regional differences and convergence of green innovation efficiency in China. J. Environ. Manag. 2023, 325, 116618. [Google Scholar] [CrossRef] [Scilit] [PubMed]
  47. Boschma, R.A.; Lambooy, J.G. Evolutionary economics and economic geography. J. Evol. Econ. 1999, 9, 411–429. [Google Scholar] [CrossRef] [Scilit]
  48. Li, H.; Guo, H. Spatial spillovers of pollution via high-speed rail network in China. Transp. Policy 2021, 111, 138–152. [Google Scholar] [CrossRef] [Scilit]
  49. Ke, X.; Wang, X.; Guo, H.; Yang, C.; Zhou, Q.; Mougharbel, A. Urban ecological security evaluation and spatial correlation research-----based on data analysis of 16 cities in Hubei Province of China. J. Clean. Prod. 2021, 311, 127613. [Google Scholar] [CrossRef] [Scilit]
  50. Wang, D.; Zhang, Z.; Shi, R. Fiscal Decentralization, Green Technology Innovation, and Regional Air Pollution in China: An Investigation from the Perspective of Intergovernmental Competition. Int. J. Environ. Res. Public Health 2022, 19, 8456. [Google Scholar] [CrossRef] [Scilit] [PubMed]
  51. Li, J.; Tian, G.; Wu, Z.; Niu, X.; Lou, Z.; Zhao, Q.; Xia, Q.; Zhang, J. A regionally adaptive framework for water-energy-food nexus resilience: Multi-method spatiotemporal analysis in the Yellow River Basin. Humanit. Soc. Sci. Commun. 2025, 12, 1545. [Google Scholar] [CrossRef] [Scilit]
  52. Chen, X.; Wang, E.; Gao, X.; Hu, Y. Evolution of the Urban Network in the Yellow River Basin: A Corporate Network Perspective. Urban Sci. 2025, 9, 465. [Google Scholar] [CrossRef] [Scilit]
  53. Klimczuk, A.; Klimczuk-Kochańska, M. Core-Periphery Model. In The Palgrave Encyclopedia of Global Security Studies; Springer International Publishing: Cham, Switzerland, 2023; pp. 1–8. [Google Scholar]
  54. Ren, Y.; Liu, K. Green siphon or green spillover: Analyzing the spatial implications of industrial relocation on green development. Energy Strategy Rev. 2024, 55, 101536. [Google Scholar] [CrossRef] [Scilit]
  55. Ma, H.; Zhou, Y.; Pan, Y.; Dong, R.; Tang, D. Spatial spillover of fintech innovation on green economic growth based on 30 provinces in China. Front. Environ. Sci. 2025, 13, 1514403. [Google Scholar] [CrossRef] [Scilit]
  56. Huang, C. Study on the Impact of Strong Provincial Capitals on Regional Innovation Efficiency. Proc. Bus. Econ. Stud. 2025, 8, 43–48. [Google Scholar] [CrossRef] [Scilit]
  57. Cheng, M.; Wang, J.; Yang, S.; Li, Q. The driving effect of technological innovation on green development: From the perspective of efficiency. Energy Policy 2024, 188, 114089. [Google Scholar] [CrossRef] [Scilit]
  58. Liao, M.; Wang, Y. China’s Energy Consumption Rebound Effect Analysis Based on the Perspective of Technological Progress. Sustainability 2019, 11, 1461. [Google Scholar] [CrossRef] [Scilit]
  59. Nemet, G.F.; Kammen, D.M. U.S. energy research and development: Declining investment, increasing need, and the feasibility of expansion. Energy Policy 2007, 35, 746–755. [Google Scholar] [CrossRef] [Scilit]
  60. Alcott, B. Jevons’ paradox. Ecol. Econ. 2005, 54, 9–21. [Google Scholar] [CrossRef] [Scilit]
  61. Matray, A. The Local Innovation Spillovers of Listed Firms. SSRN Electron. J. 2020. [Google Scholar] [CrossRef] [Scilit]
  62. Erickson, P.; Kartha, S.; Lazarus, M.; Tempest, K. Assessing carbon lock-in. Environ. Res. Lett. 2015, 10, 084023. [Google Scholar] [CrossRef] [Scilit]
  63. Huang, S.; Zhang, Y.; Cheng, T.; Guo, X. The Influence of Customer ESG Performance on Supplier Green Innovation Efficiency: A Supply Chain Perspective. Sustainability 2025, 17, 5519. [Google Scholar] [CrossRef] [Scilit]
  64. Baratta, A.; Cimino, A.; Longo, F.; Solina, V.; Verteramo, S. The Impact of ESG Practices in Industry with a Focus on Carbon Emissions: Insights and Future Perspectives. Sustainability 2023, 15, 6685. [Google Scholar] [CrossRef] [Scilit]
  65. Kumar, M.; Raut, R.D.; Mangla, S.K.; Chowdhury, S.; Choubey, V.K. Moderating ESG compliance between industry 4.0 and green practices with green servitization: Examining its impact on green supply chain performance. Technovation 2024, 129, 102898. [Google Scholar] [CrossRef] [Scilit]
  66. Liu, W.B.; Meng, W.; Li, X.X.; Zhang, D.Q. DEA models with undesirable inputs and outputs. Ann. Oper. Res. 2010, 173, 177–194. [Google Scholar] [CrossRef] [Scilit]
  67. Tone, K.; Toloo, M.; Izadikhah, M. A modified slacks-based measure of efficiency in data envelopment analysis. Eur. J. Oper. Res. 2020, 287, 560–571. [Google Scholar] [CrossRef] [Scilit]
  68. Vega, S.; Elhorst, J. The slx model. J. Reg. Sci. 2015, 55, 339–363. [Google Scholar] [CrossRef] [Scilit]
  69. Ma, R.; Xi, C.; Li, Y. Ternary coordination and spatial convergence of digital economy, green finance, and green urbanization in the Yellow river basin of China. Front. Environ. Sci. 2025, 13, 1559458. [Google Scholar] [CrossRef] [Scilit]
  70. Asghar, M.; Ali, S.; Hanif, M.; Ullah, S. Energy Transition in Newly Industrialized Countries: A Policy Paradigm in the Perspective of Technological Innovation and Urbanization. Sustain. Futures 2024, 7, 100163. [Google Scholar] [CrossRef] [Scilit]
  71. Kwilinski, A.; Dacko-Pikiewicz, Z.; Szczepanska-Woszczyna, K.; Lyulyov, O.; Pimonenko, T. The role of innovation in the transition to a green economy: A path to sustainable growth. J. Open Innov. Technol. Mark. Complex. 2025, 11, 100530. [Google Scholar] [CrossRef] [Scilit]
  72. Sorrell, S. Jevons’ Paradox revisited: The evidence for backfire from improved energy efficiency. Energy Policy 2009, 37, 1456–1469. [Google Scholar] [CrossRef] [Scilit]
  73. Brockway, P.E.; Sorrell, S.; Semieniuk, G.; Heun, M.K.; Court, V. Energy efficiency and economy-wide rebound effects: A review of the evidence and its implications. Renew. Sustain. Energy Rev. 2021, 141, 110781. [Google Scholar] [CrossRef] [Scilit]
  74. Greenstone, M.; He, G.; Li, S.; Zou, E.Y. China’s war on pollution: Evidence from the first 5 years. Rev. Environ. Econ. Policy 2021, 15, 281–299. [Google Scholar] [CrossRef] [Scilit]
  75. Li, H.; Zhou, M.; Xia, Q.; Hao, X.; Wang, J. Has Central Environmental Protection Inspection Promoted High-Quality Economic Development?—A Case Study from China. Sustainability 2022, 14, 11318. [Google Scholar] [CrossRef] [Scilit]
  76. Lyu, H.; Ma, C.; Arash, F. Central environmental protection inspection, green technology innovation and carbon intensity of industrial enterprises—Empirical research based on multi-period differences-in-differences model. Energy 2024, 307, 132649. [Google Scholar] [CrossRef] [Scilit]
  77. Yong, X.; Chuansheng, A. Ecological protection and high-quality development in the Yellow River Basin: Framework, path, and countermeasure. Bull. Chin. Acad. Sci. (Chin. Version) 2020, 35, 875–883. [Google Scholar]
  78. Gonzalez, C.; Agrawal, V.; Johansen, D.; Hooker, R. Green supply chain practices: The role of institutional pressure, market orientation, and managerial commitment. Clean. Logist. Supply Chain. 2022, 5, 100067. [Google Scholar] [CrossRef] [Scilit]
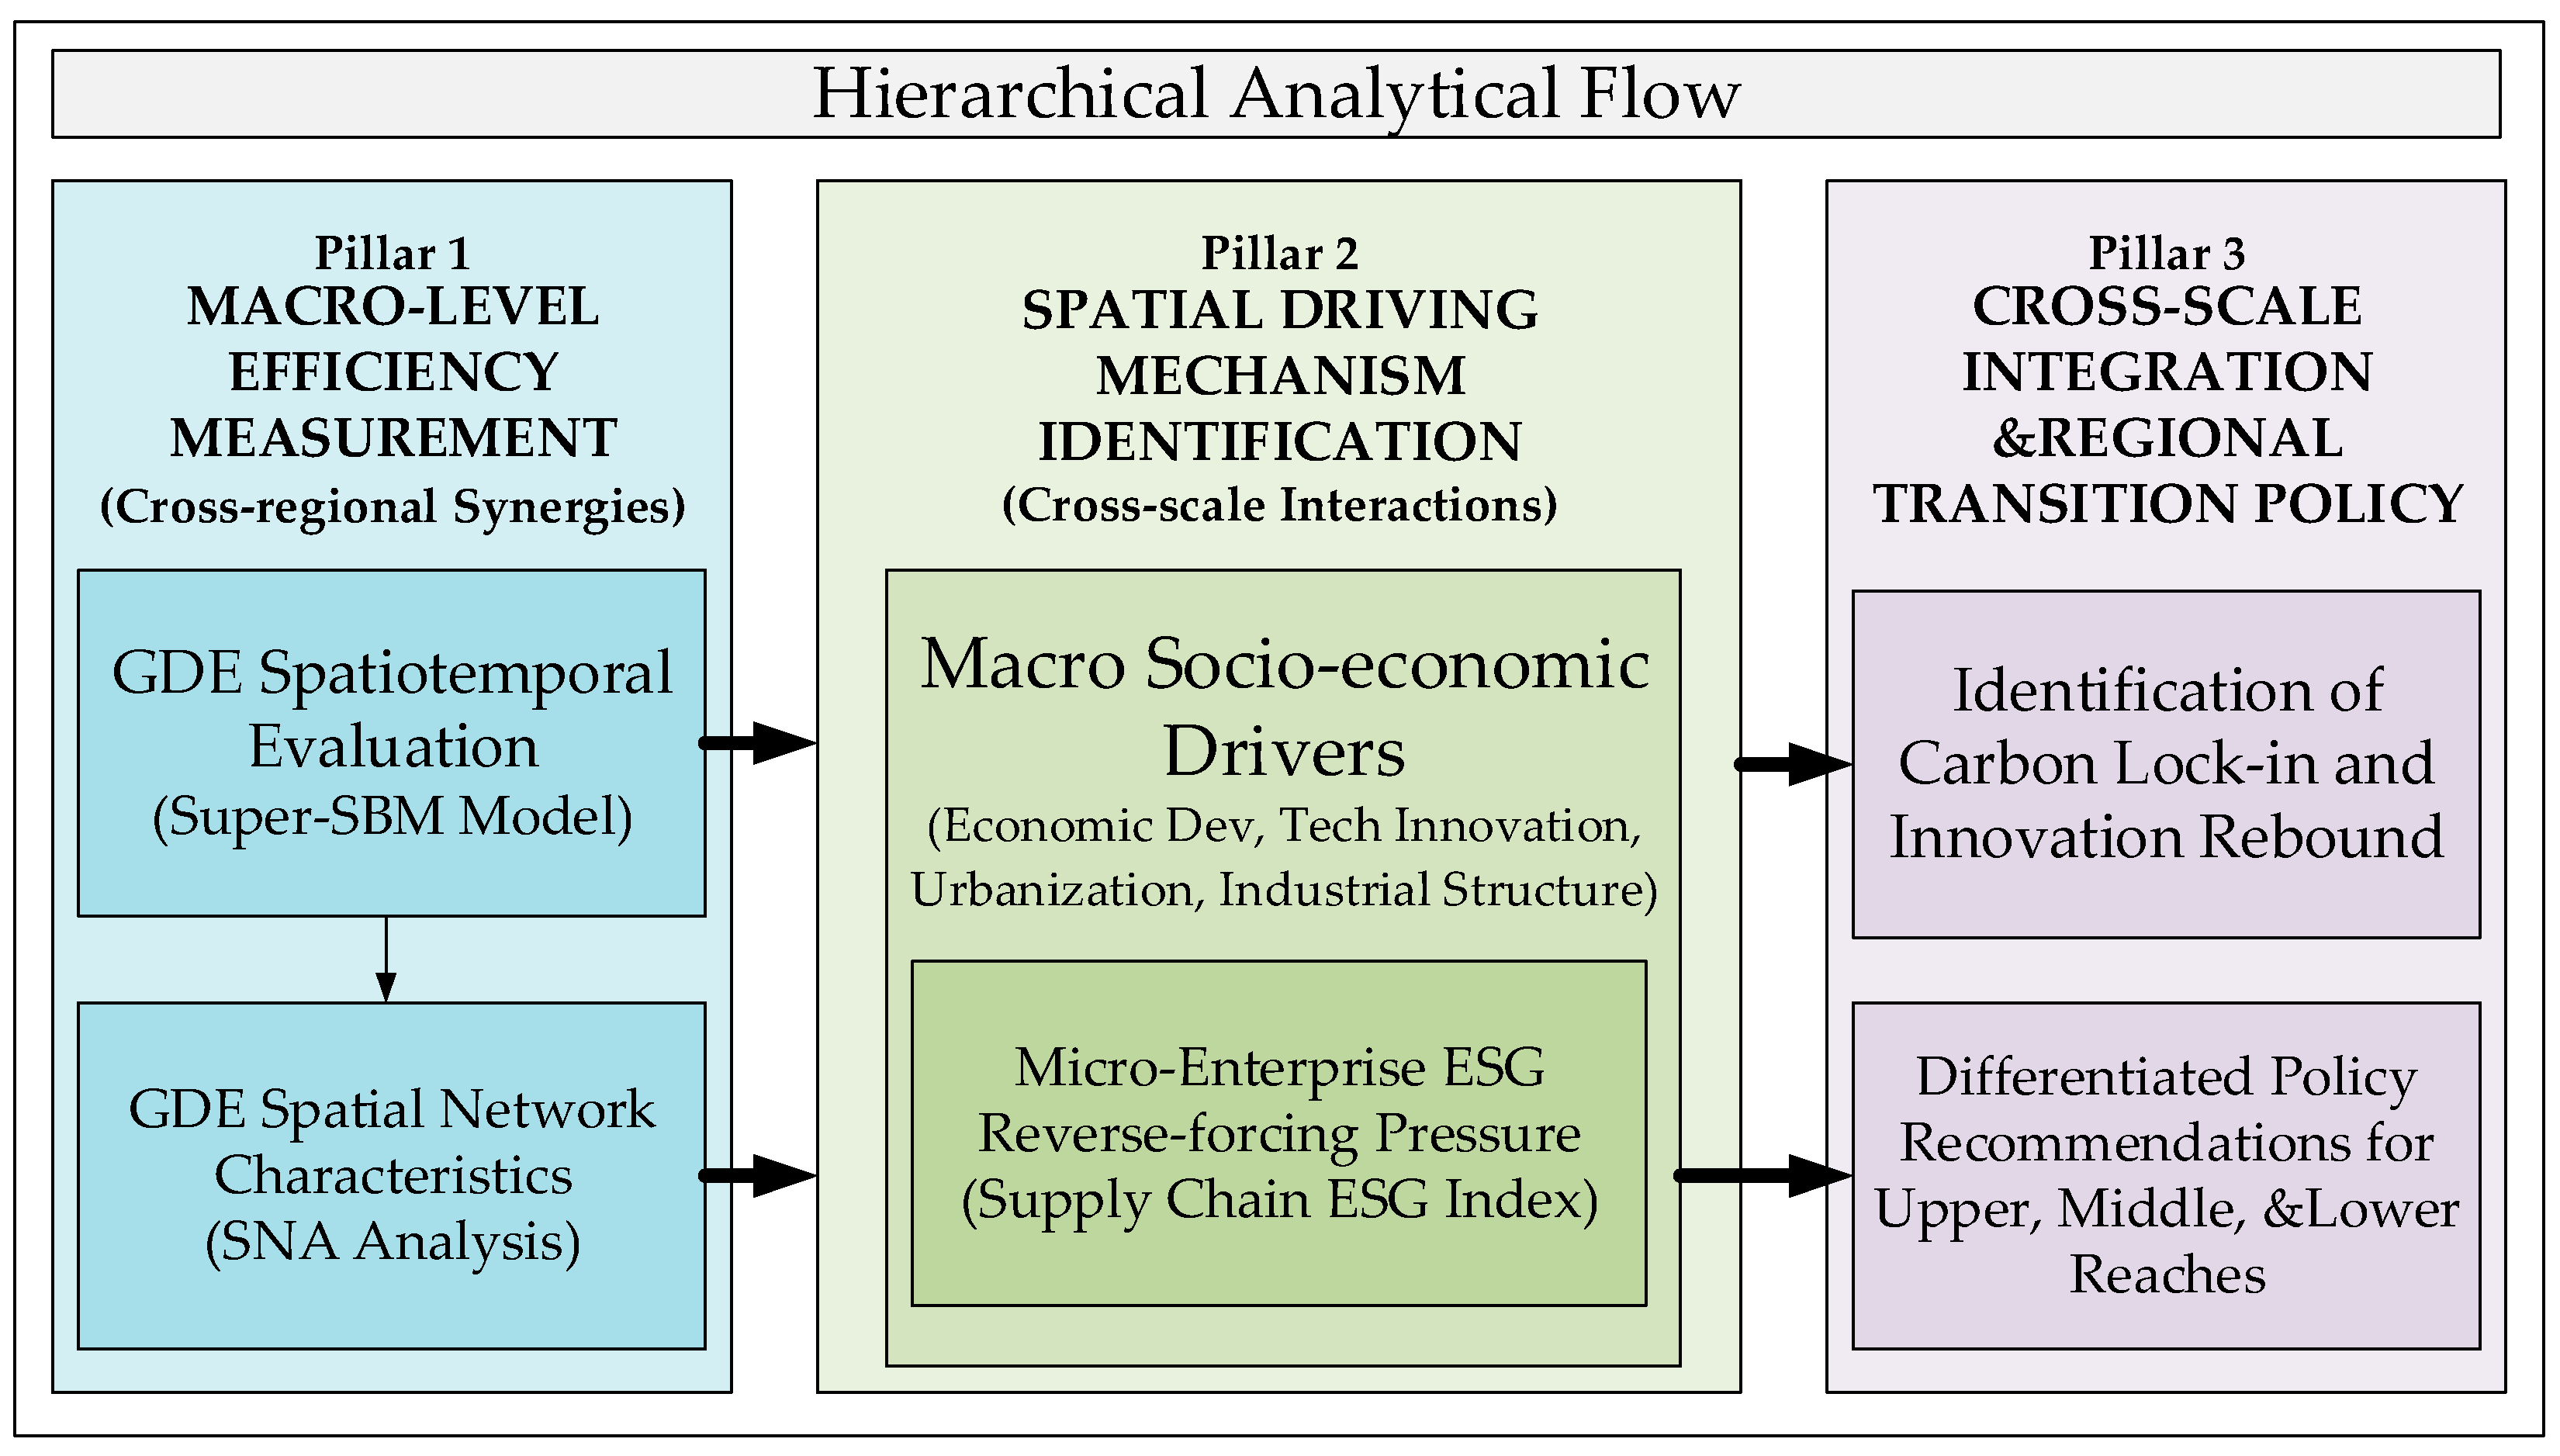
Figure 1. Research Framework Flowchart.
Land 15 00946 g001
Figure 2. Evolutionary trends of the mean GDE in the YRB and its sub-regions from 2010 to 2022.
Land 15 00946 g002
Figure 3. Convergence Trend of GDE in the YRB (Coefficient of Variation, CV).
Land 15 00946 g003
Figure 4. Spatial distribution of urban GDE in the YRB from 2010 to 2022.
Land 15 00946 g004
Figure 5. Evolution Trends of Spatial Correlation Network Density for GDE in the YRB (2010–2022).
Land 15 00946 g005
Figure 6. Comparison of Spatial Correlation Network Topological Reconstruction for GDE in the YRB, 2010 vs. 2022.
Land 15 00946 g006
Figure 7. Evolution of the Global Moran’s I Index for GDE in the YRB, 2010−2022.
Land 15 00946 g007
Figure 8. Spatial Mismatch between Urban GDE and Micro-enterprise ESG Levels in the YRB in 2022.
Land 15 00946 g008
Table 1. Measurement index system for GDE.
Primary IndicatorSecondary IndicatorProxy Variable and Calculation MethodIndicator Description
Input IndicatorLabor InputPopulation density (persons/km2)Reflects the labor carrying capacity and input intensity per unit area.
Input IndicatorCapital InputR&D capital input density: (R&D expenditure/GDP × GDP)/administrative areaReflects the intensity of technological capital driving the transition.
Input IndicatorResource InputEnergy consumption density: energy consumption per unit of GDP × GDP densityReflects the degree of intensive energy utilization.
Input IndicatorResource InputWater consumption density: water consumption per unit of GDP × GDP densityReflects the level of intensive use under rigid water-resource constraints.
Desirable OutputEconomic OutputEconomic density: GDP per unit of land areaReflects the economic value output capacity of land.
Undesirable OutputEnvironmental PollutionComprehensive pollutant emission densityIncludes SO2, industrial wastewater, and NOx, covering major pollution sources.
Table 2. Definition and measurement of core explanatory variables.
Variable NameSymbolMeasurement (Logarithmic Transformation)Expected Theoretical Mechanism
Economic DevelopmentLn_PGDPLogarithm of city-level GDP per capitaUsed to examine governance and spatial spillover effects.
Technological InnovationLn_TechLogarithm of science and technology expenditure intensityUsed to assess direct impacts and test for potential rebound effects by introducing a quadratic term.
Urbanization LevelLn_UrbanLogarithm of the urbanization rate of permanent residentsUsed to capture the dual effects of economies of scale and environmental pressure.
Industrial StructureLn_IndLogarithm of the proportion of value added by the tertiary sector in GDPReflects the environmental implications of upgrading the industrial structure.
Green Supply Chain PressureLn_ESGCity-level aggregated supply chain ESG pressure index (cross-scale integration)Introduced as a moderating variable to capture external market-based environmental constraints.
Table 3. Comparison of the evolution of mean GDE across sub-regions.
Regional Group201020162022
Basin-wide Average0.8540.8210.827
Upstream Region (Qinghai, Gansu, Ningxia)0.7920.7650.797
Midstream Region (Shanxi, Shaanxi, Inner Mongolia)0.9140.8920.901
Downstream Region (Henan, Shandong)0.8490.7950.777
Table 4. SDM baseline regression and spatial effect decomposition of GDE in the YRB.
VariableDirect EffectIndirect EffectTotal Effect
ln_PGDP0.358 ***−0.166 *0.192
ln_Tech−0.146 ***0.110 *−0.037
ln_Urban−0.093−0.662−0.754
ln_Ind−0.0010.0520.052
ρ0.221 **--
R-squared0.685
Note: *** p < 0.01, ** p < 0.05, * p < 0.1.
Table 5. Results of the Nonlinear Test for Technological Innovation.
VariableCoefficientStandard Errorp-Value
(Primary term of technological innovation)−0.202 ***(0.024)0.000
(Quadratic term of technological rebound)−0.039 ***(0.009)0.000
Note: *** p < 0.01.
Table 6. Regional correlation analysis between GDE and energy consumption intensity.
RegionCorrelation
(Efficiency vs. Energy)
Mean
Efficiency
Mean Energy
Intensity
Upstream−0.3670.7651.477
Midstream−0.5230.8701.168
Downstream−0.2490.8210.787
Note: Correlation coefficient refers to Pearson correlation between Efficiency Score and Energy Intensity.
Table 7. Regression Results and Effect Decomposition Based on Economic Distance Weights.
VariableDirect EffectIndirect EffectTotal Effect
ln_PGDP0.233 ** (0.112)0.064 (0.085)0.297 (0.156)
ln_Tech−0.165 *** (0.048)−0.023 (0.052)−0.189 (0.089)
ln_Urban−0.243 (0.210)−0.181 (0.245)−0.424 (0.395)
ln_Ind−0.090 (0.088)−0.030 (0.102)−0.120 (0.158)
Spatial ρ0.141
Note: *** p < 0.01, ** p < 0.05.
Disclaimer/Publisher’s Note: The statements, opinions and data contained in all publications are solely those of the individual author(s) and contributor(s) and not of MDPI and/or the editor(s). MDPI and/or the editor(s) disclaim responsibility for any injury to people or property resulting from any ideas, methods, instructions or products referred to in the content.