Article

Integrated Urban Climate Resilience and Sustainability Assessment System for Urban Regeneration and Building Renovation

1
Department of Global Smart City, College of Engineering, Sungkyunkwan University, Suwon 16419, Republic of Korea
2
Department of Architecture, College of Engineering, Sungkyunkwan University, Suwon 16419, Republic of Korea
3
Center for Built Environment, College of Engineering, Sungkyunkwan University, Suwon 16419, Republic of Korea
*
Author to whom correspondence should be addressed.
Land 2026, 15(6), 920; https://doi.org/10.3390/land15060920
Submission received: 13 April 2026 / Revised: 21 May 2026 / Accepted: 22 May 2026 / Published: 27 May 2026

Abstract

Urban areas are increasingly vulnerable to climate-related stresses such as heatwaves, flooding, and resource inefficiencies, requiring integrated, data-driven strategies to enhance resilience and sustainability. This study presents a modular assessment and planning framework that combines Geographic Information Systems (GIS), Building Information Modeling (BIM), City Information Modeling (CIM), microclimate simulations (ENVI-met, SWMM), Life Cycle Assessment (LCA), and remote sensing within a unified decision support interface (DSI). The framework operates across multiple spatial scales—from individual buildings to entire cities—to assess climate vulnerability, support evidence-based urban regeneration, and inform sustainable renovation strategies. It enables the identification of multifunctional interventions that reduce climate risks while improving energy efficiency, resource management, and environmental quality. Urban areas are classified based on their exposure and sensitivity to climate stressors, providing a systematic basis for prioritizing adaptation and mitigation measures. The approach is validated through a case study in Daegu, Republic of Korea, a city facing an aging building stock and increasing climatic pressures. The framework is presented as a conceptual design operating at Technology Readiness Level (TRL) 3–4, indicating that it has passed its proof-of-concept, with key components including ENVI-met microclimate simulations and Sentinel-2/Landsat remote sensing processing demonstrably operational for the Daegu context. Illustrative performance benchmarks drawn from the peer-reviewed literature demonstrate that framework-guided interventions can achieve urban heat island reductions of 1.5–4.0 °C via green roof and reflective surface combinations; stormwater runoff reductions of 30–60% through sustainable urban drainage systems; and building energy savings of 25–45 kWh/m2/yr from deep façade renovation. Its modular and transferable design ensures applicability across diverse urban contexts with similar climatic and infrastructural challenges.

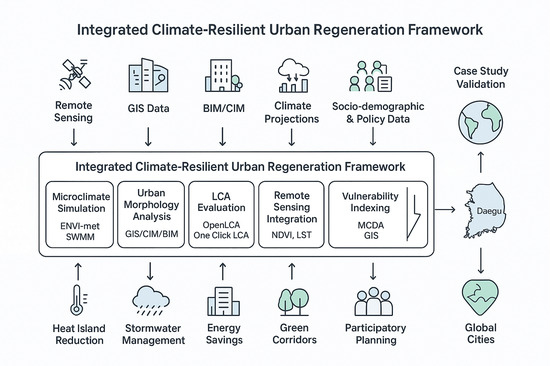
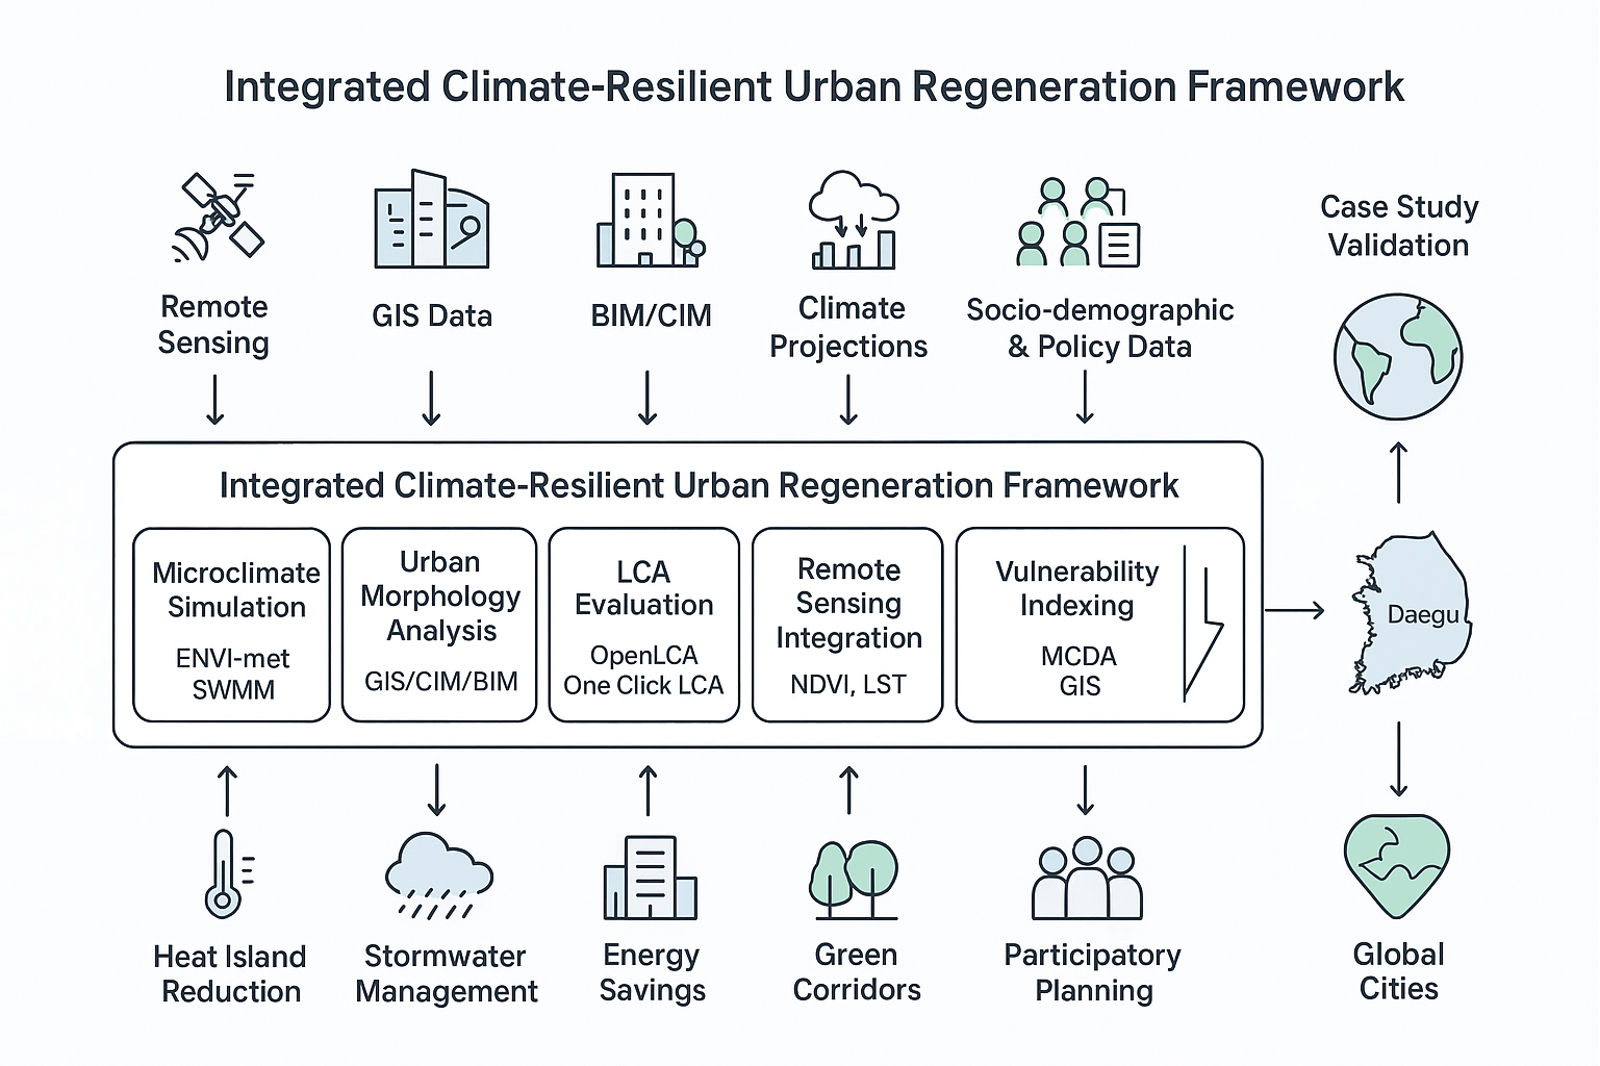
Graphical Abstract

1. Introduction

Rapid urbanization, climate change, and aging infrastructure pose urgent and pressing challenges for cities worldwide [1,2]. The increasing frequency and severity of extreme weather events, such as urban heat islands, urban flooding, and prolonged droughts underline the urgent need for integrated systems that promote resiliency and sustainability [3]. Urban regeneration and building renovation offer opportunities for transformative action, especially when guided by structured assessment and planning frameworks. There is a significant need for implementation in this area, as urban areas are particularly vulnerable to the effects of climate change due to their dependence on networked infrastructures, high energy demands, and concentrated populations, including marginalized and elderly groups [4,5].
The construction sector is of particular relevance in terms of its environmental impact, which underlines the need to minimize its harmful effects. According to the United Nations Global Status Report for Buildings and Construction 2024/2025, the greenhouse gas emissions in the construction industry have attained an unparalleled magnitude indicating a failure to meet the objectives established within the Paris Climate Agreement. In 2023 the sector’s emissions stood at 34% of global CO2 emissions [6]. This indicates that current progress is insufficient to meet the Paris Agreement targets; therefore, urgent transformation of construction and renovation practices is required.
Urban resilience planning must explicitly address the existing building stock and infrastructure, because most of the structures that will be in use in coming decades already exist and many are not designed for intensifying climate risks. Retrofitting these assets is essential not only to reduce exposure to floods, heat, or storms but also to preserve embodied carbon and avoid additional emissions from demolition and new construction [7]. A systematic assessment of structural, functional, and socio-economic vulnerabilities in “ordinary” residential and commercial buildings can reveal weak points that remain invisible in areas not yet affected by extreme events, such as outdated drainage systems, low-lying technical rooms or limited redundancy in energy supply. Planning for resilience therefore requires moving beyond a narrow focus on current hotspots toward a proactive identification of future risk landscapes, integrating multi-hazard scenarios, infrastructure interdependencies and the specific fragilities of aging building fabrics [8]. This shift from reactive protection to anticipatory adaptation is particularly challenging in neighborhoods that have not yet experienced major disruptions, where political will, funding priorities, and public awareness for structural upgrades are often limited.
Urban regeneration and building renovation present a dual opportunity: to adapt cities to climate-related risks and to decarbonize the built environment. However, achieving these goals requires more than piecemeal upgrades; it demands a coherent, strategic framework that integrates environmental performance, climate adaptation, and socio-economic considerations. This research responds to that need by developing a multi-scale, integrated planning and assessment system aligned with the Sustainable Development Goals (SDGs), especially SDG 11 (Sustainable Cities and Communities).
Climate change threatens urban life in multiple ways, including rising temperatures, more frequent heatwaves, droughts, and floods [1]. These phenomena negatively impact quality of life, public health, infrastructure performance, urban economies, and ecological systems [9]. The planning and implementation of mitigation and adaptation measures are further complicated due to the limited human, financial, and data resources [3]. In addition, the loss of vegetation and the reduced urban evapotranspiration (total evaporation from a naturally vegetated ground surface), the key component of the urban water and energy balance, worsen heat stress and diminish resilience [10,11,12,13].
Minimizing the negative impacts of climate-related disasters combined with a strategy for reducing the environmental impact of buildings urgently requires an integrated, sustainable approach to climate mitigation and adaptation [14]. Consideration of existing building structures is essential, given their long lifespans and lock-in effects on energy and climate performance [15]. The present research responds to these challenges by developing a multi-scale, integrated framework that combines climate resilience with the Sustainable Development Goals (SDGs) in the context of urban planning. The framework employs microclimate modeling, spatial data analytics, and life-cycle-based sustainability evaluation. Building upon global calls for systematic approaches to urban resilience [2], this study develops a smart urban planning system rooted in digital twins and scenario modeling.
This study aims to develop an adaptive planning framework for climate-resilient urban regeneration and building renovation. Specifically, the framework integrates urban vulnerability analysis, regeneration planning, and building retrofit strategies under multi-hazard scenarios to support sustainable and resilient urban development. The research examines relationships between climate factors (e.g., heat stress, flooding, drought) and urban form (e.g., morphology, land use, topography) as well as building-level characteristics (e.g., envelope materials, subsurface conditions). The objective is to determine which planning and design factors most strongly influence resilience, and to identify the most sustainable, realistic renovation strategies for urban areas. The framework emphasizes both mitigation and adaptation, while mitigation reduces greenhouse gas emissions, adaptive measures enable cities to cope with ongoing climate impacts. Methodologically, the research combines Life Cycle Assessment (LCA), GIS-based terrain and climate modeling, and remote sensing of green-blue infrastructure. Results provide targeted strategies to address urban heat island (UHI) effects, enhance water retention, and inform scalable interventions applicable beyond the case study area.
The South Korean city of Daegu serves as the case study, offering a complex urban context with aging building stock, significant UHI effects, and increasing climate stress.
This study introduces the Smart Urban Resilience Assessment (SURA) tool—an integrated assessment and planning framework that differs from existing urban sustainability models in three key aspects. First, it explicitly couples microclimate simulation outputs, such as surface temperature and heat stress indicators, into LCA metrics for renovation decision-making. Second, it integrates a multi-hazard–vulnerability index linking building components and urban morphology to social and physical exposure patterns. Third, it operationalizes these datasets through a modular decision support interface (DSI) that enables interactive, evidence-based planning. Collectively, these elements bridge the gap between data analytics, policy, and design, contributing a replicable methodology for climate-resilient urban regeneration.
Despite growing recognition of the need for integrated urban climate resilience frameworks, three persistent gaps remain in the literature. First, existing frameworks address climate hazards in isolation rather than as co-occurring risks requiring simultaneous assessment. Second, LCA has rarely been embedded within spatial urban planning workflows, leaving a disconnect between building-scale material decisions and city-scale environmental outcomes. Third, while digital tools such as GIS, BIM, CIM, and microclimate simulation have individually advanced urban analysis, no established framework synthesizes these within a unified, multi-scale decision support interface accessible to non-specialist planners. The present study addresses all three gaps. The framework is developed in response to three explicit research questions:
RQ1: 
How can multi-hazard climate vulnerability encompassing heat stress, flooding, and drought, be simultaneously assessed and spatially integrated across urban, neighborhood, and building scales?
RQ2: 
Which combinations of urban regeneration and building renovation interventions yield the greatest co-benefits across urban heat island reduction, stormwater management, and life cycle carbon performance?
RQ3: 
How can a modular decision support interface make integrated climate resilience assessment outputs actionable for urban planners, architects, and policymakers?
The rest of the paper is organized as follows: Section 2 reviews the relevant literature. Section 3 describes the integrated framework and its six modules (Materials and Methods). Section 4 presents the results from the framework application in Daegu, Republic of Korea. Section 5 discusses findings, limitations, and future directions.

2. Literature Review

Urban climate adaptation research has progressed considerably, yet persistent gaps/limitations remain in three areas (i) integrating multiple climate hazards, (ii) aligning assessment tools with policy frameworks, and (iii) applying LCA in spatial urban contexts. Despite the growing body of literature on urban resilience, most studies treat buildings, neighborhoods, and cities as isolated entities rather than interdependent systems [16]. Research often addresses floods or heatwaves independently, failing to incorporate both surface and subsurface urban features or real-time data interoperability. Recent work has highlighted the importance of compound hazard modeling [17,18], while advances in CIM/BIM and GIS offer potential for embedding environmental intelligence into urban planning. Still, few frameworks leverage these tools across multiple scales combining LCA with spatial planning [19,20,21].
The literature review is organized around three analytical dimensions that collectively motivate the integrated framework: (i) multi-hazard vulnerability and urban climate resilience (Section 2.1 and Section 2.2); (ii) sustainable urban regeneration and building renovation as the operational context for framework application (Section 2.3 and Section 2.4); and (iii) the methodological tools: microclimate simulation, Life Cycle Assessment, and remote sensing that form the framework’s technical backbone (Section 2.5, Section 2.6 and Section 2.7). Each dimension is reviewed with attention to its specific limitations, which together define the three-part research gap the framework addresses. Cross-cutting themes like the integration of ecosystem services into resilience planning, and the need for digital twin-enabled tool interoperability are identified where they emerge across sub-sections.

2.1. Multi-Hazard Vulnerability Analysis

Urban regeneration and building renovation now face the escalating pressures of multi-hazard risks such as heatwaves, floods, storms, landslides, and drought intersecting with urban vulnerabilities [22]. These compound exposures require integrative frameworks that account for urban infrastructure interdependencies and social inequities [23]. Efforts to assess vulnerability at regional and urban scales have expanded, drawing on conceptual models from the IPCC and indicator-based frameworks [24,25]. Studies have extended beyond assessing vulnerability to climate-related disasters by incorporating the findings into urban and regional spatial planning [26].
Conceptually, we adopt a three-pronged approach to multi-hazard vulnerability analysis:
  • Exposure mapping: High-resolution spatial layers that represent hazard footprints (land surface temperature, flood depth, wind/storm corridors, landslide susceptibility), derived from remote sensing, hydrodynamic modeling (SWMM/2D models) and microclimate simulations (ENVI-met version 5.8.0).
  • Sensitivity and adaptive capacity: Socio-demographic indicators (age, income, housing quality), critical infrastructure dependence (substation locations, pumping stations, major arterials) and building-stock characteristics (typology, envelope, thermal mass) that determine damage and loss.
  • Impact pathway and dependency modeling: Explicit representation of cascade pathways (for example, power outage → loss of pumping → sewage overflow → health impacts) using network resilience metrics and scenario-based simulations [24,25].
Methodologically, the study integrates indicator-based spatial analysis with process modeling and sensitivity testing. Indicator layers are combined using an MCDA (multi-criteria decision analysis) approach to produce a spatial vulnerability index; weights are elicited from stakeholders via a structured Analytic Hierarchy Process (AHP) and validated with Principal Component Analysis (PCA) and sensitivity analysis. Indicator outputs are linked with process models (ENVI-met for thermal impacts; SWMM for urban runoff and pluvial flooding) to produce hazard–vulnerability matrices and to identify hotspots where retrofit and regeneration actions yield the highest co-benefits.
Operationalization for planning: vulnerability outputs are framed for decision-makers using three decision bands (urgent/targeted/routine) linked to specific planning instruments:
  • Urgent: Retrofit and emergency measures in high-risk clusters (e.g., cooling centers, emergency drainage improvements)
  • Targeted: Prioritized building renovations and green infrastructure corridors in neighborhood hotspots
  • Routine: Long-term zoning and land-use changes to reduce exposure (setbacks, permeable surfaces, urban greening)
Key research gaps such as robust probabilistic representations of compound event likelihoods at urban scales, models of cascading infrastructure failure, and the embedding of equity (informal settlements, elderly populations) centrally in vulnerability weighting still remain. Addressing these gaps requires transdisciplinary data integration and co-production with local stakeholders to ensure both technical validity and social legitimacy.

2.2. Urban Climate Resilience

Urban climate resiliency refers to a city’s capacity to anticipate, absorb, adapt to, and recover from climate-related shocks such as heatwaves, floods, and storms [1]. It goes beyond adaptation by encompassing governance robustness, ecological integrity, and social equity. The concept, rooted in ecological theory [27], has evolved into a multidisciplinary construct involving systems thinking, governance, and spatial planning [28,29]. Transformative approaches have gained traction, particularly in studies focusing on socio-technical transitions and climate justice [30,31]. Urban resiliency research has explored diverse hazards; numerous studies have indicated that UHI effects exacerbate heatwave impacts [32,33], while impervious surfaces heighten flood risks. Tools like the Storm Water Management Model (SWMM) [34] and 2D hydrodynamic models remain common for flood analysis [35]. Finally, sequential disasters, such as floods followed by heatwaves, are rising in frequency, with studies in East Asia documenting such trends [18].
Frameworks for resilience assessment include indices such as the Social Vulnerability Index (SoVI) and the Flood Vulnerability Index (FVI) [36] and dashboards combining adaptive capacity, exposure, and sensitivity [37]. LCA is increasingly integrated into urban planning to evaluate the long-term environmental impacts of mitigation and adaptation measures [19]. Emerging technologies such as digital twins and smart city models enhance real-time monitoring and scenario simulation, offering powerful tools for proactive urban management [38].
Nevertheless, challenges from fragmented institutional responsibilities, funding limitations, and regulatory misalignment between building codes and flood resilience strategies still persist in cities such as Seoul, South Korea and Jakarta, Indonesia [39,40]. Furthermore, interventions risk reinforcing inequalities if not inclusively designed [41]. Data limitations—particularly the scarcity of longitudinal, high-resolution data—also hinder model validation and upscaling. Despite these gaps, urban climate resilience has become a robust interdisciplinary field, with systems-thinking approaches offering promising pathways for cities to address escalating risks.

2.3. Sustainable Urban Regeneration (SUR)

The concept of sustainable urban regeneration (SUR) has evolved as a multidisciplinary response to infrastructure decay, social inequality, climate change, and economic stagnation. Since the early 2000s, there has been a marked increase in the level of academic attention being directed toward SUR, particularly in the period following 2020. This increased focus has been accompanied by a growing emphasis on the use of digital and participatory tools [42]. In recent years, there has been a notable shift in the academic literature toward a framework that emphasizes systems thinking, participatory governance, technological integration, and long-term resilience [43]. Contemporary literature has exhibited an evident transition toward a systemic and integrated approach, which opposes the utilization of siloed interventions and advocates for cross-sectoral regeneration models [44]; and linking SUR to the global sustainability agenda, in particular the United Nations Sustainable Development Goals [6] and the European Green Deal [45] which emphasizes the inclusive, green, and smart transformation of urban areas [37] (EU, 2021). The evolution of the SUR model from a physical urban regeneration to a holistic approach demonstrates the integration of different themes. These include environmental sustainability (green infrastructure, energy efficiency), social inclusion (affordable housing, participation), economic viability (local jobs, innovation ecosystems), and governance (multi-stakeholder partnerships, co-creation).
Early regeneration models were largely physical and economic, focusing on infrastructure improvement and real estate development. Recent literature conceptualizes SUR as a multidimensional transformation process, where the triple bottom line—people, planet, and prosperity—is central. Authors like Pineda Pinto and Steele [44] emphasize the importance of inclusive governance, ecological restoration, and smart technologies in SUR strategies. Couch et al. [46] and Roberts et al. [47] highlight frameworks that integrate sustainability into redevelopment, stressing the reuse of existing assets and stakeholder involvement. The recent review by [48] identifies a trend toward composite sustainability indices that assess urban regeneration projects based on energy use, mobility, green space, and housing affordability. Urban sustainability frameworks, like the Urban Sustainability Framework (USF) [49], provide structured approaches for cities to assess their status, define goals, and create action plans by balancing economic, social, and environmental aspects. Tools such as STILE [50] or SUMP (Sustainable Mobility Plan) [51] are increasingly used to operationalize sustainability targets in real urban contexts. MCDA methods (multi-criteria decision analysis) are being used to structure decision-making in complex regeneration projects. For instance, Acevedo-De-los-Ríos et al. [52] developed a GIS-based MCDA model for prioritizing regeneration actions in informal urban settlements using over 60 environmental and social indicators. These tools are useful in contexts with limited resources and high spatial inequality. Omrany et al. [53] and Pimentel Pereira [54] point out the growing role of BIM and CIM for multi-scalar planning. Digital twins—virtual replicas of cities—allow real-time simulation and scenario testing [55]. These technologies support adaptive planning, climate resilience, and stakeholder visualization [56]. Urban Living Labs (ULLs) foster co-creation and democratic innovation [57] Frameworks such as ReSOLVE emphasize circular economy principles [58], though most SUR models underperform in closing material loops [59,60]. AI-enabled methods are now emerging for biodiversity monitoring in regeneration projects [61].
An important dimension receiving increasing attention is the systematic integration of ecosystem services as a structural component of planning decision-making, rather than an add-on consideration. Córdoba Hernández and Camerin 2023 [62] demonstrate that embedding ecosystem service assessments including biodiversity, carbon sequestration, water regulation, and cultural services directly into land use planning instruments can significantly improve decision quality by linking environmental values with operational planning scales. Their ecological capacity assessment framework, developed in the European context, provides a methodological precedent for the spatially explicit, multi-criteria ecosystem service integration the present framework operationalizes through its remote sensing (Module 4) and vulnerability indexing (Module 5) components. Transitioning from biophysical treatment of vegetation variables (e.g., surface temperature, NDVI) toward comprehensive ecosystem service integration represents both a theoretical aspiration and a practical development direction for the framework.
Overall, SUR literature is converging toward integrated, participatory, and data-rich frameworks. However, key challenges remain in standardizing ontologies, ensuring equitable participation, and embedding biodiversity and circularity as core metrics.

2.4. Building Renovation

Building renovation plays a pivotal role in the transformation of cities into climate-resilient, low-carbon, and socially inclusive environments. Amidst intensifying climate change impacts—rising global temperatures, increasing frequency of extreme weather events, and growing energy demands—renovating existing buildings within the broader framework of sustainable urban regeneration becomes both a necessity and an opportunity [63].
Building renovation, particularly in dense urban contexts, extends beyond energy efficiency to encompass broader goals of climate resilience, social equity, and ecological integration. Sustainable urban regeneration is defined here as a multidimensional process that revitalizes urban areas while improving environmental performance, enhancing social inclusivity, and increasing resilience to climate-related hazards. Recent studies underscore the urgent need for energy-efficient renovation of the existing building stock to meet ambitious sustainability goals, such as those set by the United Nations for 2030 [3]. However, despite growing awareness among building owners and stakeholders, implementing comprehensive sustainability measures in renovations remains challenging due to gaps in decision-making tools and the limited use of LCA concepts in practice [64], with most building owners relying on more traditional metrics such as energy use and investment costs [65].
Recent studies emphasize integrating circular economy principles, climate risk assessments, and digital tools [66,67]. Deep renovation practices enhance energy efficiency, reduce emissions, and improve indoor comfort [68,69]. Typology-based approaches for Building Stock Energy Assessment (TABULA/EPISCOPE) help classify renovation needs based on climatic zones, construction periods, and structural characteristics. Frameworks like the Climate Risk and Vulnerability Assessment (CRVA) and Urban Climate Resilience Frameworks evaluate exposure, sensitivity, and adaptive capacity of buildings. These are often combined with geospatial tools (GIS) to map urban risk hotspots. LCA tools assess the environmental impact of retrofit materials and techniques across their entire life cycle. In Europe and East Asia, tools like Level(s), One Click LCA, and GREEN-i+ promote resource efficiency and circular renovation [70].
In this research project, the integration of digital twins, AI-driven diagnostics and intelligent monitoring systems is intended to further improve the effectiveness and traceability of renovation measures in urban areas, rendering them clearer and financially viable. The research will put a focus on risk assessment, with quantitative modeling of weather parameters (temperature, rainfall, wind) and their effects on construction productivity. Emerging tools for weather risk management include advanced analytics for weather forecasting, scenario-based planning, and digital twins for simulating renovation outcomes under various climate scenarios.

2.5. Urban Microclimate and Urban Heat Island (UHI) Effect

The integration of outdoor microclimate simulations within the framework of a sustainable urban development process is critical for reducing energy consumption, CO2 emissions, the urban heat island effect and urban sprawl while also mitigating the UHI effect [71]. Consequently, the development of microclimate simulation tools is imperative to maintain congruence with state-of-the-art technologies and to cultivate optimized urban forms according to their environmental performance (see [72]). As a symbol of global climate change, the change in the urban thermal environment is a factor that plays an important role in the evaluation of urban regeneration and building renovation, especially in the context of ongoing rapid urbanization [73]. Urbanization has led to significant transformations in land use and land cover, profoundly altering local climates. Described in detail like in by Oke [74] or Oke et al. [75], one of the most notable phenomena associated with urban climate is the UHI effect, where urban areas experience higher temperatures than their rural surroundings due to anthropogenic activities and changes in surface properties. The UHI effect exacerbates thermal discomfort, increases energy demand, and poses a health risk in urban areas [76].
Advances in computational tools and interdisciplinary methodologies have expanded its applications, as evidenced by the following synthesis of key studies and frameworks [77]. The methodological advancements in urban climate analysis emphasize cross-scale integration, linking macroclimate data with microscale urban morphology to better understand and mitigate the UHI effect [78]. Among the most prominent tools is ENVI-met [79], a three-dimensional microclimate model that simulates complex surface–atmosphere interactions [80]. It is extensively used to evaluate the effectiveness of UHI mitigation strategies such as green roofs, tree canopies, and shaded pedestrian corridors [81]. Another notable tool, the Urban Weather Generator (UWG) [82], estimates UHI intensity by correlating urban form parameters with local temperature variations. Its application in case studies such as Barcelona’s 22@ Innovation District has demonstrated its value in urban-scale climate diagnostics [83]. Additionally, parametric design workflows, including platforms like CitySim [84] and GIS-integrated tools [85], facilitate the coupling of microclimate simulations with building energy demand models [81]. This enables a holistic assessment of both indoor thermal performance and outdoor comfort conditions, supporting data-informed design and planning decisions at multiple urban scales [86,87].
Urban regeneration presents a critical opportunity to mitigate the UHI effect through climate-responsive planning and comprehensive building renovation. As cities adapt to increasing thermal stress, key interventions are emerging as both necessary and effective. These include retrofitting existing buildings with reflective roofing materials and insulated façades to reduce heat absorption and improve energy efficiency. Furthermore, integrating nature-based solutions—such as green roofs, vegetated corridors, and urban forestry —into renewal projects enhances microclimatic conditions while providing co-benefits for biodiversity and air quality [88]. Climate-sensitive urban design strategies, including optimized street orientation, from high-albedo pavements over reflective coatings to shading devices, the strategic use of open spaces and urban geometry optimization, to enhance ventilation and shading, and water-based solutions, including fountains and misting systems, further contribute to thermal comfort at the neighborhood scale. Reflecting this paradigm shift, initiatives like the European Union’s Renovation Wave [89] are embedding thermal resilience into building policies, positioning UHI mitigation as a core objective in both regulatory frameworks and architectural design practices. Relevant research by for example Santamouris [90] or Santamouris et al. [76] and Emmanuel and Krüger [91] explore the influence of land surface properties, vegetation, and built environment configurations on urban microclimates. Studies by Li et al. [92] and Emmanuel and Krüger [91] emphasize the effectiveness of integrated strategies that combine vegetation, reflective materials, and urban design interventions. Retrofitting strategies, such as high-albedo roofing and vertical greening systems, are critical for thermal mitigation. Recent studies by Susca and Pomponi [93] and Merdymshaeva [94] emphasize integrating UHI effects into LCA and microclimate mapping to inform urban interventions.
As a component of the research initiative, a comprehensive analysis of the characteristics of the built environment is being conducted. This encompasses, for instance, materials used for roof and road coverings, along with the textures and colors employed. The utilization of simulation models (ENVI-met) facilitates the derivation of scenarios aimed at the mitigation of microclimatic hotspots in the region, with the objective of ameliorating their deterioration. These findings provide a foundation for the implementation of forward-looking urban planning measures, which are designed to address the dynamic challenges posed by inner-city heat islands.

2.6. Life Cycle Assessment (LCA)

LCA provides a standardized methodology to quantify environmental impacts associated with building materials and renovation strategies across their entire life cycle—from resource extraction and manufacturing to use, maintenance, and end-of-life (ISO 14040 [95]; EN 15978 [96]). Within the context of sustainable urban regeneration, LCA is increasingly recognized as an indispensable tool for guiding low-carbon, resource-efficient, and resilient interventions. Despite its widespread application, most LCA studies have traditionally focused on new construction rather than renovation or maintenance phases. As highlighted by Vilches et al. [97], the latter stages remain underrepresented in literature despite their critical role in determining long-term sustainability. Studies by Asdrubali et al. [98] and Stephan et al. [99] show that integrating LCA into urban planning helps prioritize low-impact materials and retrofit strategies, confirming that incorporating heat storage and radiation properties into LCA enables more precise sustainability evaluations. Recent advancements extend conventional LCA toward more holistic and context-sensitive evaluations. Newer methodologies [100] now include UHI parameters and simulate the effects of reflective coatings and green systems on thermal load reduction. Ansah et al. 2020 [101], for example, conducted a comparative environmental and economic assessment of four façade systems for low-cost residential buildings in Ghana, using a framework that integrates BIM, LCA, and Life Cycle Costing (LCC) to deliver a more comprehensive sustainability evaluation. Parallel efforts incorporate CIM and GIS-based datasets, allowing multi-scalar analyses that extend from building-level materials to neighborhood-wide interventions. These approaches increasingly align LCA with digital twin environments, supporting scenario testing for renovation outcomes under different climate and policy futures. In addition, the adoption of modular LCA tools—such as One Click LCA and Level(s)—facilitates rapid decision-making while improving comparability across projects [70].
Within building renovation, LCA provides critical insights into the trade-offs between operational energy savings and embodied carbon impacts of retrofit materials. Renovation strategies such as high-performance insulation, façade retrofitting, and green roofs may reduce long-term energy demand, yet their short-term embodied carbon costs must be evaluated. This dual assessment ensures that renovation efforts do not inadvertently lock cities into unsustainable carbon trajectories. At the urban scale, integrating LCA into regeneration frameworks enables planners to assess circularity potentials—such as reuse of demolition waste, recycling of construction materials, and closed-loop resource flows—while balancing socio-economic and ecological priorities [19]. Coupled with multi-criteria decision analysis (MCDA), LCA supports more transparent trade-offs among cost, performance, and environmental impact.
This research contributes by embedding LCA into a broader climate-resilient planning framework, explicitly linking material choices, building renovation strategies, and urban microclimate dynamics. By combining LCA with digital modeling, remote sensing, and scenario-based assessments, the proposed framework advances the use of LCA from a stand-alone evaluation method to an integrated decision support tool for climate-resilient urban regeneration.

2.7. Remote Sensing and Vegetation Mapping

Remote sensing has become a cornerstone in the analysis of urban climate dynamics and sustainable regeneration, offering the capacity to monitor, quantify, and model spatial patterns of land use, vegetation, and thermal properties at multiple scales. Its utility is particularly evident in urban heat island (UHI) studies and vegetation-based mitigation strategies. Pioneering work by Weng [102] and Voogt and Oke [103] established how satellite-derived surface temperature and vegetation indices can reveal spatial heterogeneity in urban microclimates. More recent studies, such as Lu et al. [104] and Na et al. [105], confirm that urban green spaces (UGS) exert measurable cooling effects, underscoring their role as cost-effective, multifunctional climate adaptation measures.
Remote sensing platforms—including Landsat, Sentinel, and MODIS—are widely employed for long-term UHI analysis, vegetation monitoring, and impervious surface mapping. UAV-based imaging has expanded capabilities by providing high-resolution (<10 cm) thermal and multispectral data for fine-scale neighborhood assessments [106]. LiDAR data further supports the mapping of three-dimensional vegetation structures, enabling accurate estimation of canopy cover and evapotranspiration potential [100]. Hyperspectral and thermal infrared sensors allow detection of material albedo and emissivity variations, aiding in microclimate-sensitive renovation design.
These tools are increasingly used to map thermal hotspots and prioritize intervention areas for urban cooling [107]; assess vegetation health and evapotranspiration, key indicators of UHI mitigation capacity [104]; quantify fragmentation of green-blue networks, informing ecological connectivity strategies; and support urban growth modeling, linking land-use change with microclimatic shifts [103]. Integration with Urban Regeneration Frameworks Recent approaches combine remote sensing with GIS and urban climate models, providing layered insights into land surface temperature, vegetation indices (NDVI, EVI), and impervious surface ratios. For example, Jayasooriya and Adams [108] demonstrated how UAV thermal imaging, integrated into stormwater management models, enhanced understanding of blue-green infrastructure performance. Similarly, machine learning techniques are increasingly employed to classify vegetation types, predict canopy cooling potential, and automate hotspot detection [106]. Emerging applications also integrate remote sensing outputs with CIM/BIM platforms, enabling dynamic feedback between building-level renovation measures and city-scale climate resilience strategies. Such integration strengthens decision support systems by embedding spatial environmental intelligence into urban planning and design.
Despite these advances, challenges remain. Variability in spatial and temporal resolution across datasets can complicate longitudinal analyses. Cloud cover, seasonality, and sensor calibration affect data quality. Socio-ecological dimensions of urban vegetation—such as accessibility, equity, and cultural value—are still insufficiently captured in remote sensing analyses [100]. Moreover, the integration of remote sensing with LCA frameworks is nascent, limiting comprehensive evaluations of vegetation-based mitigation strategies.
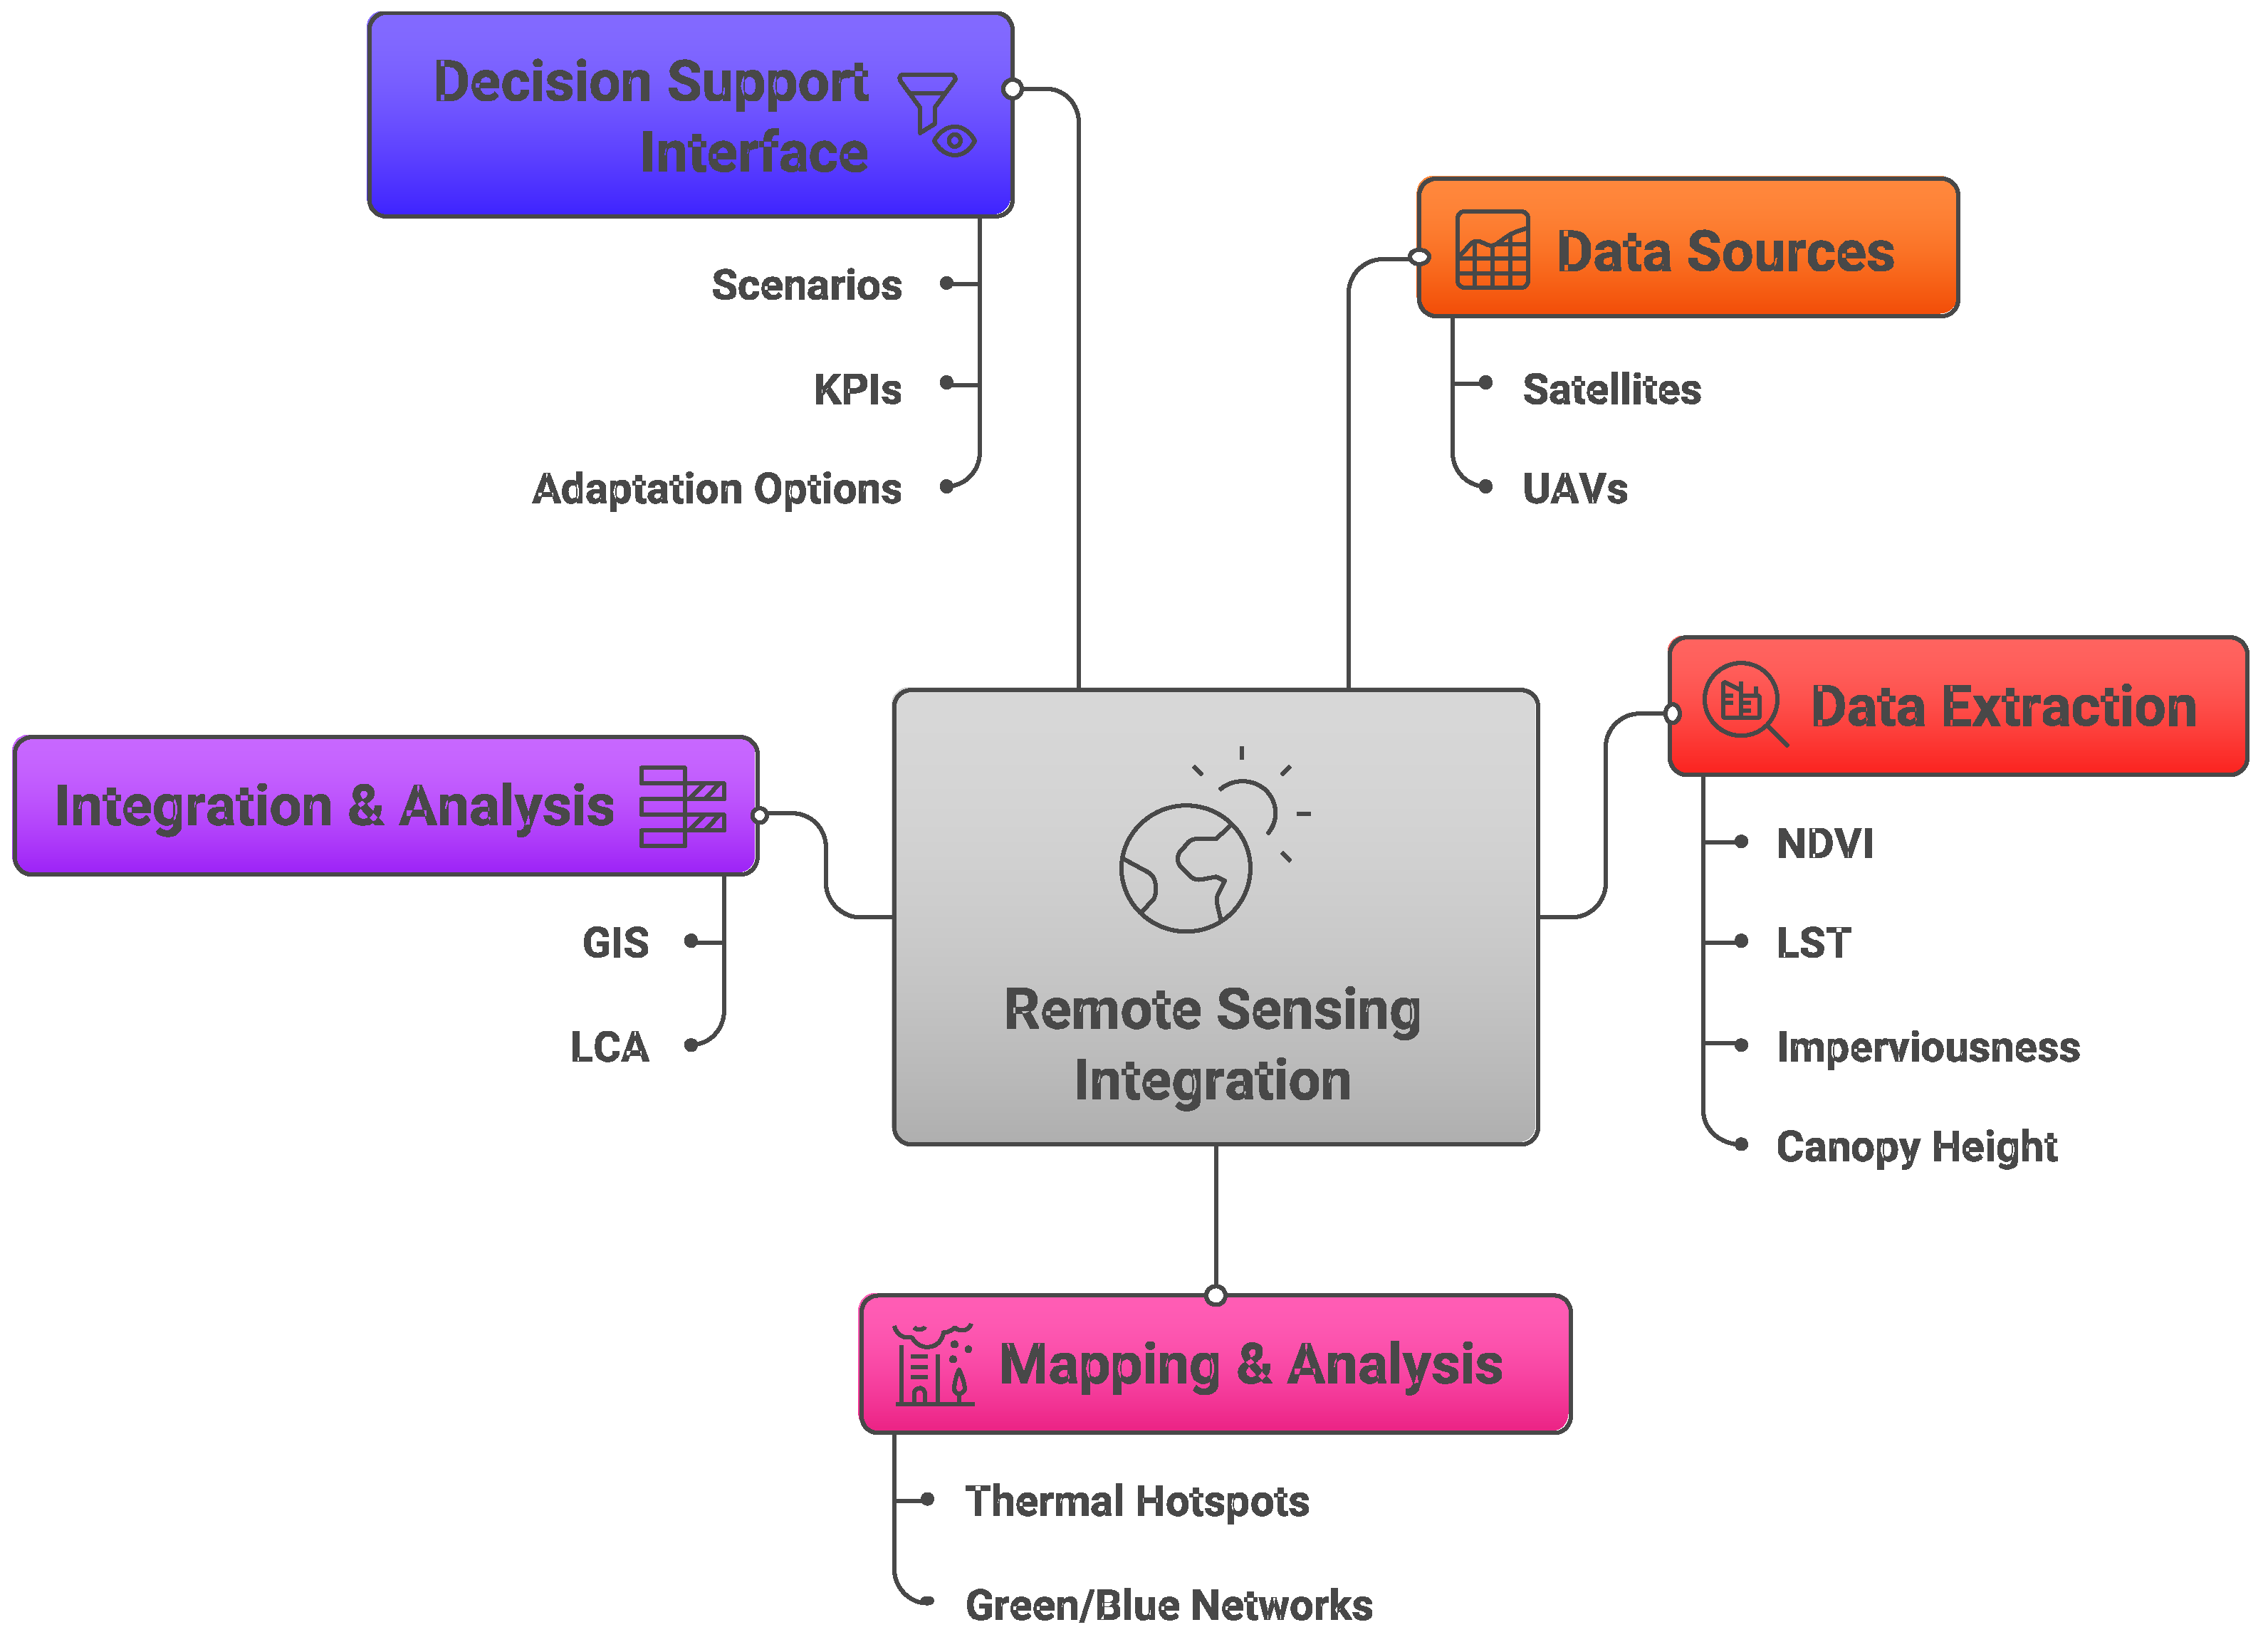
To strengthen the integration of spatial, climatic, and ecological datasets, remote sensing forms a critical component of the proposed framework. Satellite and UAV imagery provide multispectral, thermal, and topographic information that complements microclimate simulations and Life Cycle Assessment (LCA). By linking vegetation indices, surface temperature data, and imperviousness mapping with GIS-based urban models, remote sensing enables both the diagnosis of urban climate vulnerabilities, and the monitoring of regeneration impacts over time. Figure 1 illustrates the conceptual workflow for integrating remote sensing outputs into the broader climate-resilient urban regeneration framework.

2.8. Positioning Against Existing Integrated Urban Climate Resilience Frameworks

Several international frameworks and toolsets have addressed aspects of integrated urban climate resilience assessment, providing important reference points for the present study. The Urban Climate Change Resilience Framework (UCCRF), developed within the USAID/ICLEI 100RC program, provides a governance-centered methodology for assessing adaptive capacity at city scale but does not integrate simulation-based hazard modeling or building-scale LCA [28]. The European GreenStar and Cities Adapt platforms aggregate city-level sustainability indicators and support policy tracking but lack multi-hazard simulation and are not designed for building renovation decision support. The Urban Sustainability Framework (USF), referenced in Section 2.3, provides structured goal-setting but does not operationalize spatial vulnerability mapping or microclimate simulation. Integrated BIM/GIS approaches such as those by Omrany et al. 2023 [53] and Pimentel Pereira 2024 [54] connect building information models to urban planning contexts but do not embed LCA, multi-hazard indexing, and a participatory DSI within a unified platform. Ferré-Bigorra et al. [109], whose digital twin integration principles inform the present framework’s data architecture (Section 3.8), provide strong technical integration but are not designed for multi-hazard climate vulnerability assessment or renovation decision support.
Against this landscape, the present framework contributes three distinguishing features not found in combination in any single existing initiative: (i) simultaneous simulation-based multi-hazard assessment (heat, flooding, drought) across city, neighborhood, and building scales; (ii) explicit embedding of LCA within spatial urban planning workflows, linking material-level renovation decisions to city-scale environmental outcomes; and (iii) a modular DSI designed to make integrated multi-scale outputs actionable for non-specialist planners, architects, and community stakeholders. These three features collectively respond to the persistent integration gaps identified across Section 2.1, Section 2.2, Section 2.3, Section 2.4, Section 2.5, Section 2.6 and Section 2.7.

3. Materials and Methods

3.1. Conceptual Framework Overview

The overarching research objective is to develop and validate a smart, integrated system for assessing and planning urban climate resilience and sustainability. This system is designed to support urban regeneration and building renovation efforts in the face of increasing climate risks. The core innovation lies in an internationally applicable, digitally enabled modeling and assessment platform that integrates Geographic Information Systems (GIS), Building Information Modeling (BIM), and City Information Modeling (CIM) into a coherent multi-scale methodology. By doing so, the platform evaluates both current and projected climate impacts—including extreme weather events—across urban, neighborhood, and building scales [1,110].
The conceptual framework builds on three methodological pillars:
  • Spatial analytics through GIS and remote sensing to capture morphology, vegetation, land surface temperature (LST), and hydrological dynamics.
  • Simulation models (microclimate and hydrological) to quantify exposure and test adaptation measures.
  • LCA-based evaluation of building and material interventions to ensure long-term sustainability.
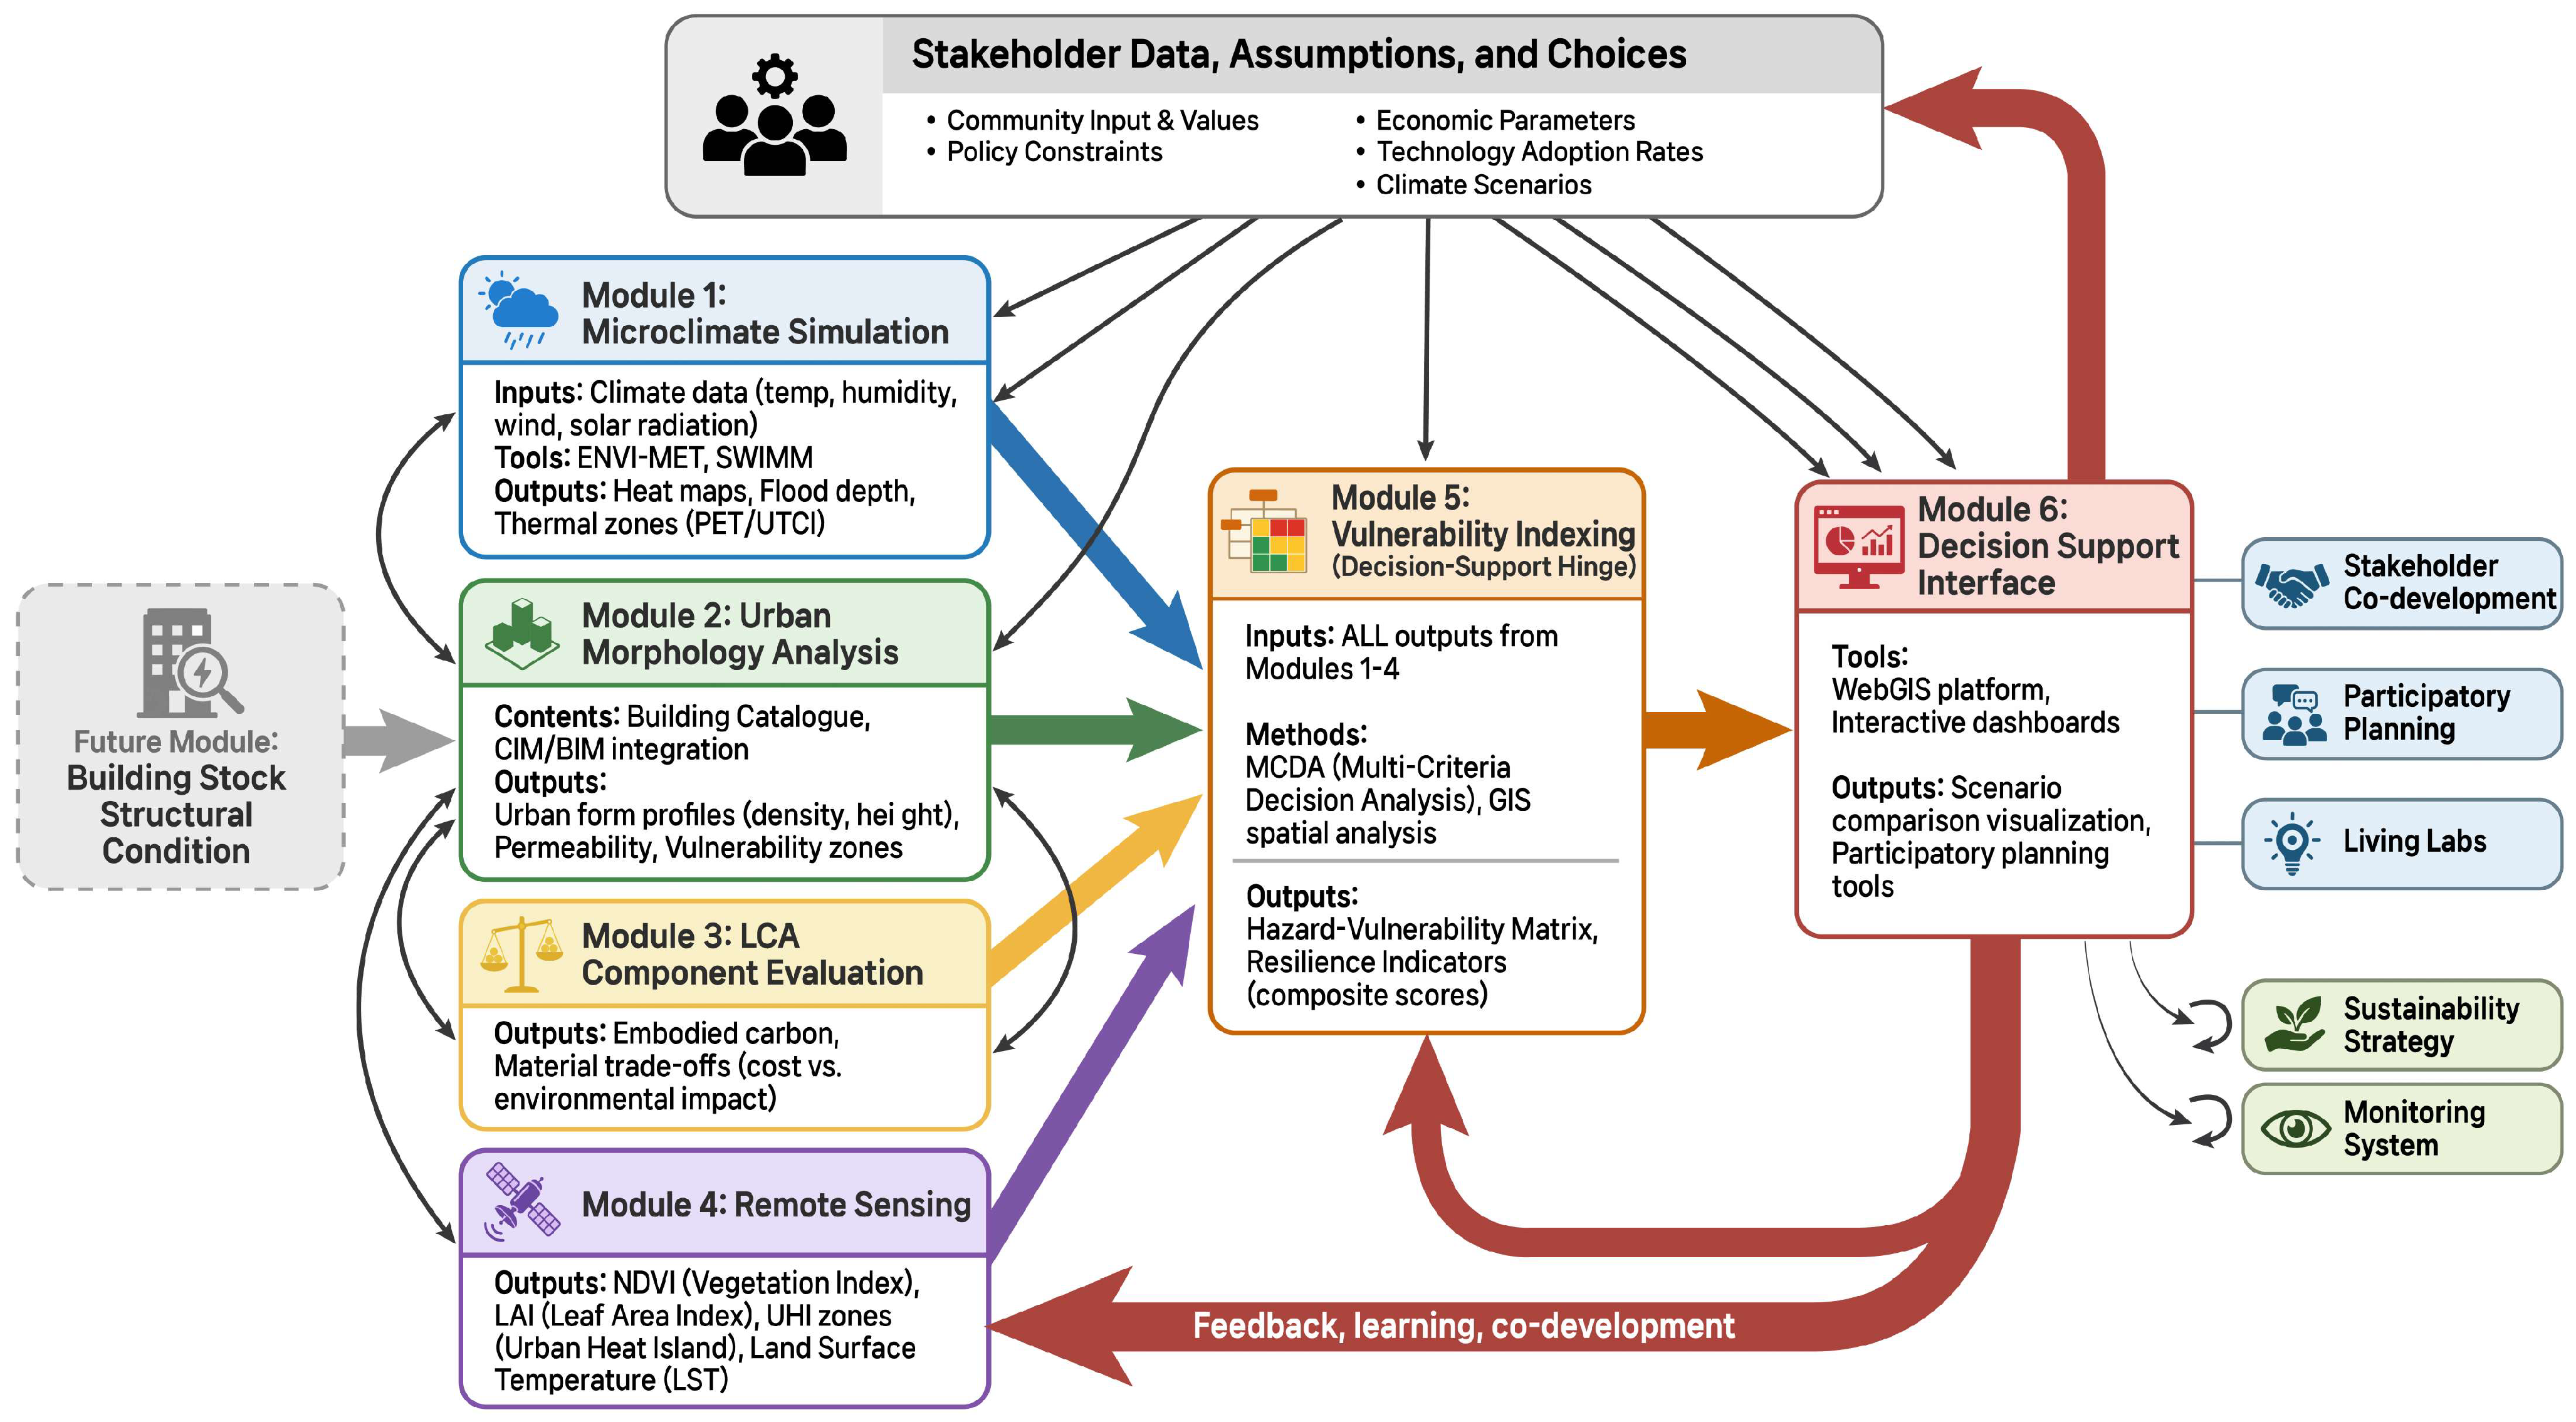
These are operationalized through six interlinked modules, which collectively feed into a decision support interface—a dynamic, participatory platform for urban planners, architects, and policymakers. The modular approach ensures adaptability: data generated in one module (e.g., remote sensing for vegetation mapping) provides essential inputs for others (e.g., LCA or vulnerability indexing).
The six modules (Table 1) jointly underpin the creation of a climate impact mitigation and adaptation catalogue and an interactive decision support dashboard, enabling cities to identify, evaluate, and prioritize interventions based on scientific evidence and stakeholder needs. The proposed framework is presented as a conceptual design at Technology Readiness Level (TRL) 3–4. The proof-of-concept has been demonstrated at the individual module level, while full system integration particularly the unified decision support interface (Module 6) remains under active development.
The data cycle begins with climate and morphological inputs (Modules 1–4), which are synthesized into vulnerability profiles (Module 5). These outputs are then visualized in the decision support interface (Module 6), where users can explore “what-if” scenarios—for example, how reflective roofing combined with green corridors reduces UHI intensity, or how drainage retrofits mitigate both flood depth and heat stress. The integrative design ensures that multi-hazard analysis, sustainability evaluation, and socio-spatial vulnerability mapping converge within a single, scalable platform. Figure 2 illustrates the integration of various methodological tools.
To strengthen the strategic orientation of urban regeneration, an indicator-based module will be developed that systematically records the overall structural condition of the building stock at both building and neighborhood level, including age, energy standard, materiality, functional deficits, and infrastructural integration [111]. By linking this module to climate risk assessment, renovation priorities can be derived not only from acute climate hazards, but also from structural age, insufficient sustainability performance and functional obsolescence of existing buildings.
On this basis, the decision-making logic of the SURA tool will be expanded so that it can highlight options for comprehensive renovation and neighborhood-wide redevelopment, even in areas that are not yet directly affected by climate change impacts. This enables the derivation of redevelopment strategies at neighborhood scale, in which holistic renewal trajectories are identified that are more effective in the long term than gradual, isolated interventions at individual building level [112].
The conceptual and practical refinement of the tool will draw on international best practice examples [113], with particular reference to integrated neighborhood regeneration approaches in Copenhagen [114], which serve as a benchmark for sustainable, climate-responsive, and stock-sensitive transformation processes.

3.2. Urban Microclimate Simulation (Module 1)

Urban microclimate modeling plays a central role in simulating and forecasting the spatial variability of climate impacts, such as heatwaves and pluvial flooding. Using advanced modeling tools as ENVI-met and SWMM, urban surface interactions are modeled at fine resolutions to capture microclimatic variations [91,115]. Model calibration is achieved by integrating multi-source data: macroclimate projections (e.g., IPCC scenarios), historical local weather observations (e.g., from KMA), flood occurrence records, and urban surface data. The simulations are based on:
  • High-resolution meteorological data (e.g., KMA, IPCC climate scenarios) and given urban parameters (e.g., vegetation cover, surface albedo, building geometry) with strong correlations to observed damage from past climate events.
  • Enhancing model fidelity through iterative validation using empirical datasets and remote sensing sources.
Simulating dynamic changes under various regeneration scenarios, using site-specific morphological data derived from remote sensing and in-situ measurements.
These simulations provide insight into the formation of urban heat islands (UHIs), water runoff behavior, and thermal comfort zones across urban areas. Calibrated models inform planners about high-risk zones, enabling design interventions such as shading, surface permeability enhancement, and green infrastructure optimization.
Outputs include spatially explicit maps of UHI intensity, ventilation corridors, thermal comfort zones, and flood depths, which together inform the identification of high-risk areas. These outputs guide the design of climate-responsive interventions, such as optimized street orientation, permeable surfaces, nature-based solutions, and shading systems. Importantly, coupling microclimate simulation with building performance simulation (BPS), as demonstrated by Palme et al. [116,117], links outdoor environmental dynamics with indoor energy demand and occupant comfort, providing a holistic evidence base for urban regeneration and building renovation.
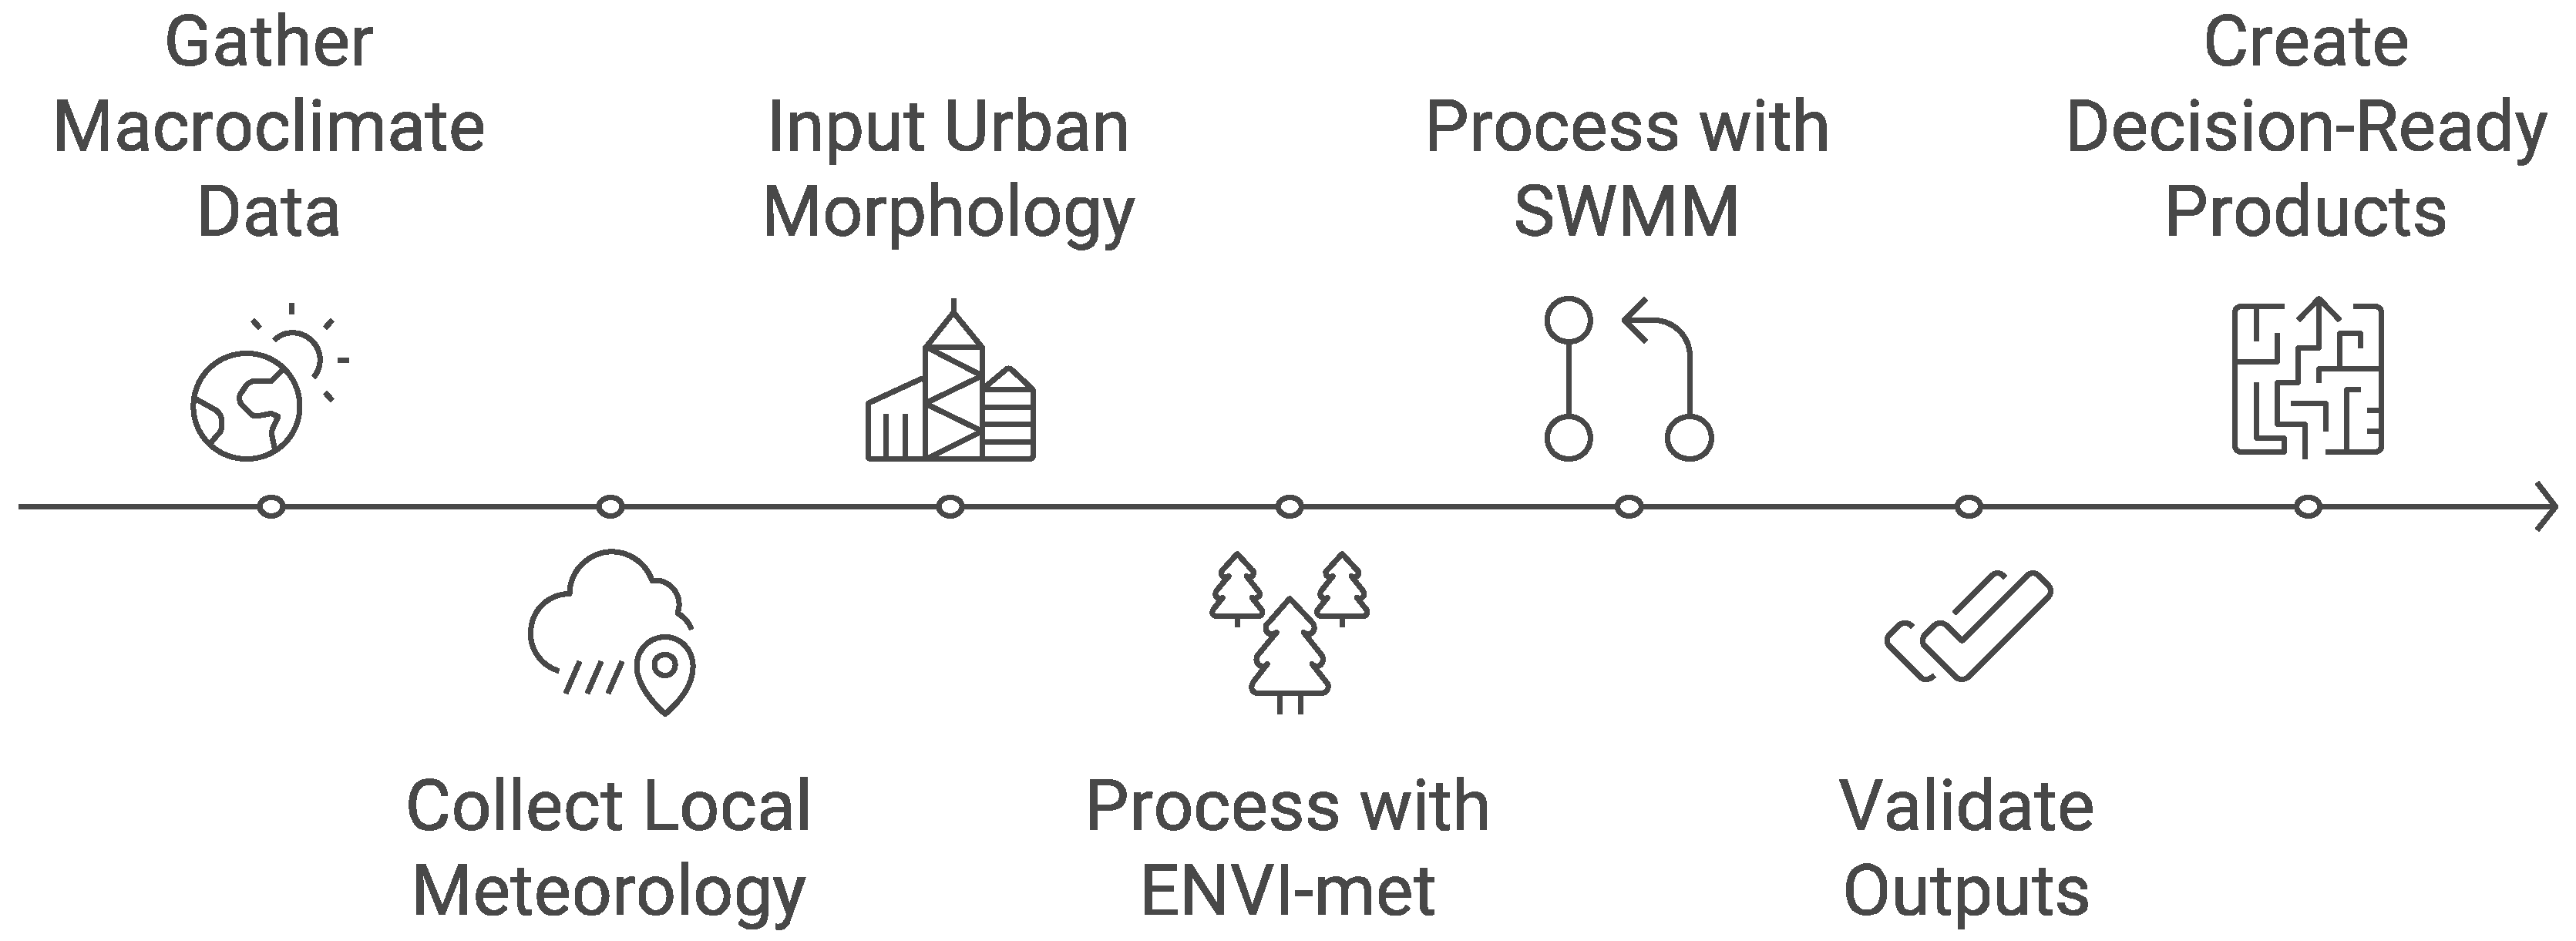
Figure 3 illustrates the workflow of the microclimate simulation module. Inputs include macroclimate data, local meteorology, and urban morphology, which are processed through ENVI-met and SWMM engines. Outputs are validated against empirical data and translated into decision-ready products, such as risk maps and scenario comparisons. This modular structure ensures adaptability across diverse urban contexts while maintaining scientific rigor. The decision-ready products in Figure 3 refer to spatially explicit risk maps and scenario comparisons that are directly usable as planning inputs (e.g., identification of high-risk zones for prioritization), but are considered intermediate products at the system level, as they are subject to further synthesis through Module 5 (vulnerability indexing) and Module 6 (DSI scenario comparison) before final planning recommendations are generated.

3.3. Urban Morphology GIS and CIM/BIM Integration (Module 2)

Urban morphology offers a structured way to understand how the physical form of the city—plots, buildings, streets, and open spaces—shapes and constrains resilience strategies [118]. By tracing historical processes of urbanization, densification, and infrastructural layering, morphological analysis reveals how past decisions have produced specific spatial configurations, from compact historic cores to dispersed peri-urban fabrics, each with distinct exposure profiles and adaptive capacities [119]. Typological approaches translate these insights into operative categories—for example, recurring building and block types, street patterns, or open-space systems—that can guide context-sensitive interventions rather than generic, one-size-fits-all solutions [120]. In planning practice, such typological frameworks can underpin design codes, retrofit strategies, and zoning tools that are calibrated to the characteristic morphologies of different urban regions, thereby aligning resilience measures with the long-term evolution of the built environment [121]. Integrating morphological, historical, and typological perspectives in urban resilience planning thus helps to link short-term risk reduction with the slow transformations of urban form, and supports incremental yet cumulative changes toward more robust and adaptable city fabrics.
A key innovation of the proposed framework is the seamless integration of GIS with CIM and BIM data frameworks. This hybrid spatial-digital infrastructure enables:
  • Mapping and prioritizing potential urban regeneration zones.
  • Integrating geospatial data layers with 3D building models to identify high-impact renovation opportunities. Building-level intervention mapping using LOD3 BIM data.
  • Supporting a comprehensive catalogue of urban and building typologies, materials, envelope systems, and green infrastructure components, that links climate vulnerability to specific building materials, typologies, and system components
This integration facilitates spatial decision-making that considers both urban form and technical building specifications, allowing for multi-scale intervention planning. The interoperability of GIS and BIM/CIM platforms supports integrated, multi-scale planning from macro-level exposure to micro-level adaptation strategies [122].
In the context of this module, the establishment of a catalogue is imperative. This catalogue will concern the envelope of buildings, i.e., the façade and roof. The purpose of the catalogue is to serve the formulation of measures to mitigate the effects of climate change and to adapt cities, neighborhoods and buildings. The catalogue includes the quantification of the potential for sustainability and urban resilience based on life cycle analyses (LCA). The basis of these calculations is the material’s capacity for heat absorption or storage, and its propensity for storage or reflection at the level per square meter. Comparative studies for this catalogue were provided by [123], among others, who use similar parameters in their study, so that a data comparison will certainly be possible.
Ultimately, this integration provides a spatial-decision support layer within the larger system, linking the physical structure of cities to their climate performance. By enabling scenario testing across multiple scales, the GIS–CIM/BIM framework facilitates resilient and sustainable urban transformation strategies that are both technically robust and socially inclusive.

3.4. LCA-Based Component Evaluation (Module 3)

This module quantifies the sustainability and climate resilience potential of building components and urban interventions by applying LCA. Unlike traditional energy-focused evaluations, this approach assesses both embodied and operational impacts, linking material properties with adaptation performance. Key assessment indicators include:
  • Material choices, embodied energy and carbon of building materials across production, transport, installation, use, and end-of-life phases.
  • Performance improvements and operational energy reduction through passive (e.g., insulation, shading) and active (e.g., HVAC upgrades, renewable integration) retrofitting strategies.
  • Mitigation and adaptation co-benefits, such as reduced surface runoff (via permeable or vegetated surfaces), enhanced thermal stress resilience, and lowered risk from floods and heatwaves.
The approach follows international standards ISO 14040 [95], and allows comparisons of renovation strategies based on total life cycle impacts [91,124]. Indicators can be customized for climate-specific hazards, such as heatwaves and flooding, and used to develop performance benchmarks for renovation strategies. This allows stakeholders to assess trade-offs between cost, carbon, and resilience to benchmark retrofitting strategies under regionally relevant conditions, such as high heat stress in East Asia or flood-prone districts in European contexts. For instance, reflective coatings may reduce UHI intensity but increase embodied emissions, while vegetated roofs may incur higher initial costs but provide long-term thermal and hydrological co-benefits. The integration of LCA outputs into the broader decision support platform ensures that technical, economic, and environmental dimensions are considered holistically in urban regeneration planning.

3.5. Remote Sensing and Green Infrastructure Analysis (Module 4)

Remote sensing plays a pivotal role in this framework by capturing spatial and temporal variability in land surface and ecological characteristics. It complements microclimate and GIS-based assessments by providing multispectral and thermal imagery that links ecological dynamics with urban form. Applications include:
  • Urban vegetation and green space quantification: Using indices like NDVI (Normalized Difference Vegetation Index), LAI (Leaf Area Index), and SAVI (Soil Adjusted Vegetation Index), remote sensing allows detailed mapping of tree cover, lawn surfaces, and vegetative health [107].
  • Surface temperature estimation: Thermal remote sensing from satellites (e.g., Landsat 8 TIRS, Sentinel-3 SLSTR) is used to identify urban heat island hotspots, validating outputs from ENVI-met and other microclimate models.
  • Permeability and land-use mapping: High-resolution imagery is utilized to detect impervious surfaces and provide hydrological modeling inputs.
The integration of remote sensing with ENVI-met simulations enables validation and enhancement of microclimate models. For instance, vegetation health data derived from satellite imagery is cross-validated with ground-based measurements and incorporated into surface energy balance modeling. Additionally, remote sensing supports the longitudinal monitoring of regeneration impacts, allowing decision-makers to track climate benefits over time. Ultimately, remote sensing offers a scalable and transferable data source that strengthens the global applicability of the framework. By embedding ecological and thermal information into the decision support interface, planners can evaluate not only building-level retrofits but also landscape-scale green infrastructure strategies for sustainable urban transformation.

3.6. Hazard and Vulnerability Indexing (Module 5)

The hazard and vulnerability indexing module operationalizes the integration of environmental, infrastructural, and socio-demographic data into a multi-criteria framework for urban climate risk assessment [125]. Building on the outputs from microclimate simulations, LCA, and remote sensing analyses, this module develops composite indices that highlight spatial hotspots of vulnerability and inform targeted interventions for urban regeneration and building renovation. Based on the results of the multi-hazard vulnerability analysis [126], the framework proposes urban regeneration plans tailored to regional multi-hazard scenarios by adjusting urban physical properties. Furthermore, the spatial vulnerability patterns generated from the vulnerability assessment are used to reassess the physical characteristics of buildings and the surrounding environment, leading to the development of renovation planning measures for individual buildings. This study introduces a re-planning framework that encompasses urban vulnerability analysis, urban regeneration planning, and building renovation strategies under the context of multi-hazard scenarios, contributing to sustainable and resilient urban development. At its core, the framework applies multi-criteria decision analysis (MCDA) in a GIS environment, linking hazard exposure with the adaptive capacity of urban systems. The process involves three steps: i. Hazard Characterization, ii. Exposure and Sensitivity Assessment, and iii. Vulnerability Indexing and Spatial Integration.
i. Hazard Characterization (the process of identifying, mapping, and quantifying environmental threats affecting urban areas, using simulation models and spatial metrics to quantify key climate-related hazards affecting the urban environment).
  • ENVI-met simulations generate high-resolution maps of heat stress (°C above baseline) and outdoor thermal comfort indices.
  • SWMM models provide pluvial flood depth and stormwater network performance metrics under varying rainfall intensities.
  • Additional hazard layers incorporate drought severity indices and wind vulnerability in exposed urban corridors.
ii. Exposure and Sensitivity Assessment (Exposure assessment refers to the identification and mapping of features or assets that may be subject to climate or environmental hazards. Sensitivity assessment involves analyzing how vulnerable these assets are by examining their characteristics).
  • Urban surface characteristics (e.g., reflectivity, permeability, vegetation) are mapped using GIS and remote sensing.
  • Building and infrastructure data (envelope, material, insulation) are integrated from BIM/CIM catalogues.
  • Infrastructure networks, including subsurface drainage and stormwater networks are evaluated for redundancy and robustness.
iii. Vulnerability Indexing and Spatial Integration (socio-demographic vulnerability indicators are combined with modeled hazard data to produce spatially integrated, multi-hazard risk assessments).
  • Socio-demographic datasets (population density, age distribution, income, health vulnerability) are overlaid with hazard layers to identify socially vulnerable hotspots.
  • Indicators are weighted using MCDA approaches to reflect local policy priorities (e.g., prioritizing elderly populations for heatwave adaptation).
  • Outputs include a hazard–vulnerability matrix, which spatially aligns multi-hazard risk intensity with socio-technical vulnerability.
The MCDA weighting procedure follows the Analytic Hierarchy Process (AHP) of Saaty [127] A pairwise comparison matrix is constructed for five vulnerability criteria: heat hazard, flood hazard, social vulnerability, building sensitivity, and adaptive capacity (Table 2). Expert weights have been elicited from a structured panel of eight specialists using a nine-point intensity scale. The normalized weights are: 0.271 (heat hazard), 0.383 (flood hazard), 0.175 (social vulnerability), 0.108 (building sensitivity), and 0.063 (adaptive capacity). These weights reflect Daegu’s compound heat-flood risk profile, in which flood hazard is rated the primary driver of acute structural risk. Matrix consistency is verified by the consistency ratio (CR = 0.09 < 0.10 threshold, confirming acceptable consistency; Saaty, 1980 [127]). As a secondary validation, PCA is applied to the empirical indicator dataset to confirm that PCA-derived loadings align with the expert weights, ensuring that the weighting structure reflects real spatial data patterns rather than expert bias. Sensitivity testing varies the weights of the two highest-ranked criteria by ±20%, confirming index ranking stability (Spearman r > 0.92 across all sensitivity runs).
In spatial implementation, the hazard–vulnerability matrix takes the form of two co-registered GIS raster layers: a multi-hazard risk intensity index and a socio-technical vulnerability index, both normalized to a 0–1 scale and visualized as overlapping choropleth maps within the DSI, enabling planners to identify areas of both high hazard and high social vulnerability as priority intervention zones. The resulting indices form the basis for multi-hazard scenario planning, enabling planners to compare intervention strategies such as reflective retrofitting, flood-adaptive landscaping, or ventilation corridor design. By explicitly linking physical risk parameters (e.g., heat stress, flood depth) with social vulnerability factors, this module ensures that regeneration plans are equitable as well as technically robust. Ultimately, the hazard and vulnerability indexing module acts as the decision-support hinge of the framework: transforming heterogeneous data streams into actionable priorities for renovation and regeneration, and enabling a proactive, resilience-oriented urban exposure planning process.
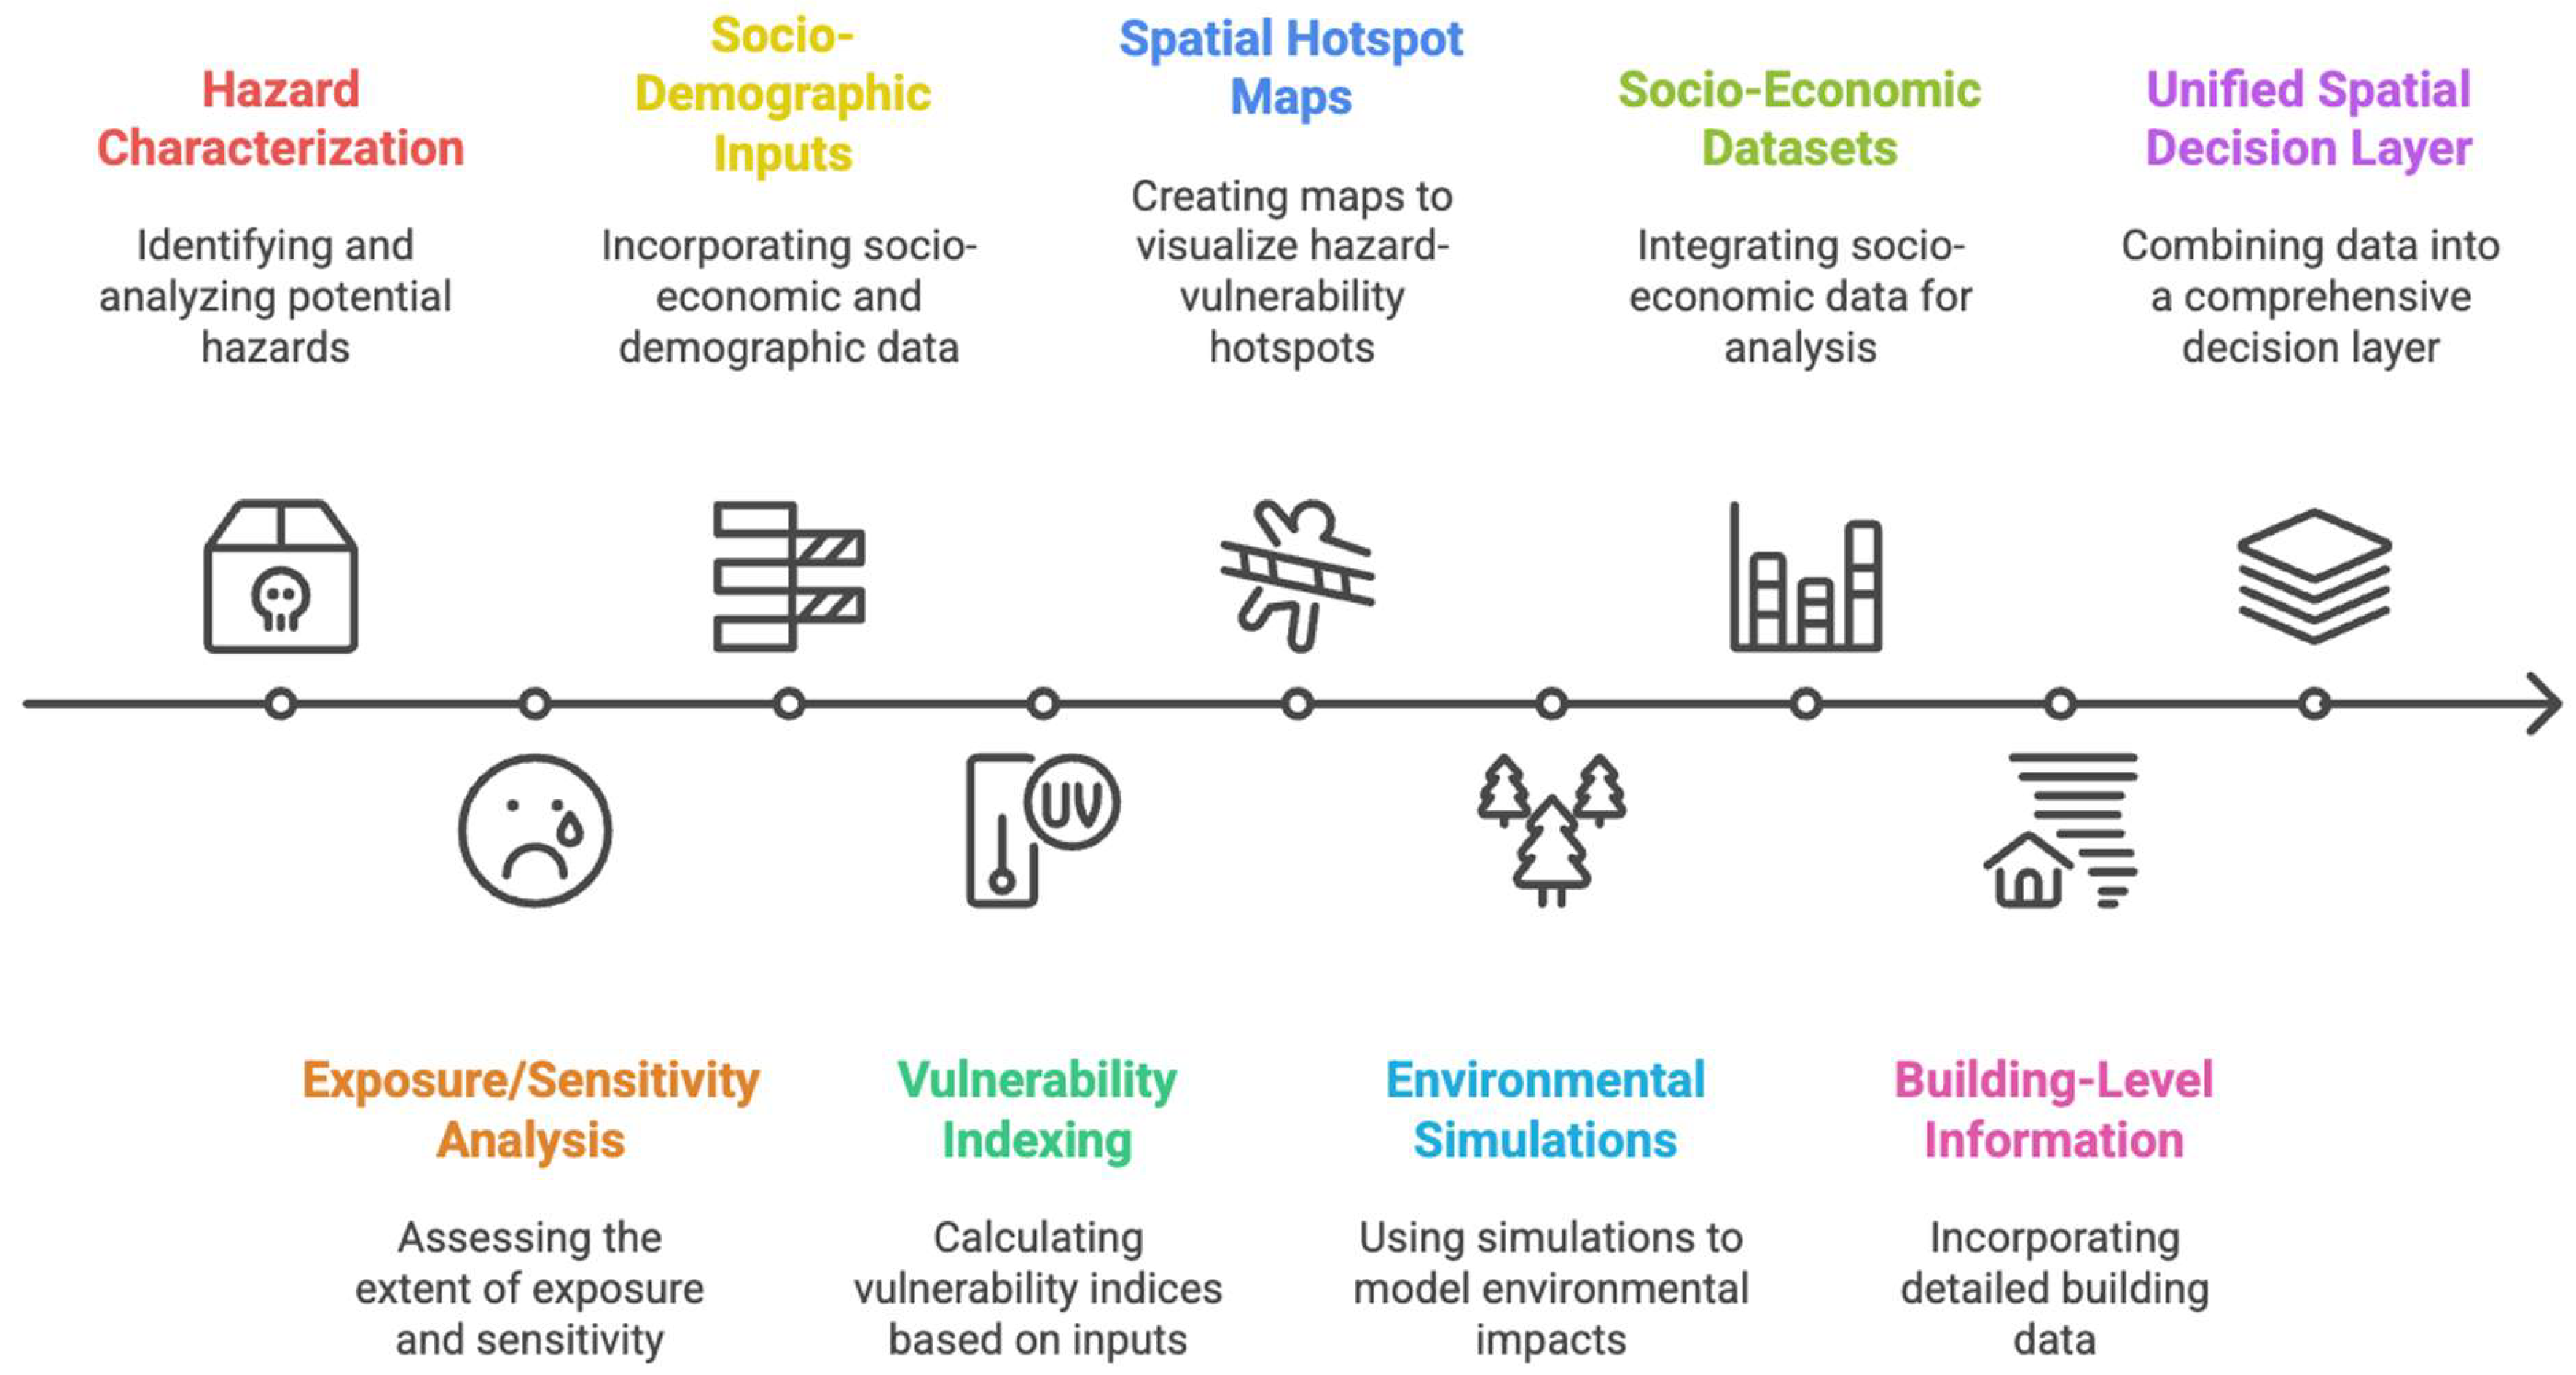
To operationalize the hazard and vulnerability indexing process, this module integrates environmental simulations, socio-economic datasets, and building-level information into a unified spatial-decision layer. Figure 4 presents the conceptual workflow, showing how hazard mapping (heat, flood, drought) is combined with exposure, sensitivity, and adaptive capacity to produce composite vulnerability indices.
The Adaptive Capacity dimension of the vulnerability index (Table 3) draws on three data streams that may appear sequentially in Figure 4 but are in practice computed in parallel with hazard and exposure mapping. Governance and service capacity data (emergency response protocols, planning regulations, UN-Habitat governance benchmarks) are compiled from municipal policy documents and are held constant across scenarios. Socio-economic factors (household income, education levels, health access) are sourced from census databases and GIS household survey layers. Green-blue infrastructure data (vegetation cover percentage, water retention area mapping) are derived directly from Module 4 (remote sensing NDVI/LAI outputs). These three streams are shown downstream in Figure 4 for visual clarity, reflecting the fact that their outputs must be spatially integrated and normalized before being combined with hazard and exposure layers in the vulnerability indexing step but they are not outputs of that indexing step: they are inputs to the Adaptive Capacity sub-index, which together with sensitivity, exposure, and hazard scores forms the composite vulnerability index. The inclusion of green-blue infrastructure under Adaptive Capacity reflects the established conceptual positioning (IPCC AR6) of ecosystem-based resources as a component of adaptive capacity; it does not preclude their parallel role as intervention options within the DSI (Module 6).
Table 3 summarizes the specific indicators used across each dimension of vulnerability assessment. By structuring hazards, exposure, sensitivity, and adaptive capacity into discrete yet interoperable categories, the framework ensures methodological transparency and comparability across case studies. Together, Figure 4 and Table 2 illustrate how climate hazards are quantified, linked to socio-technical vulnerabilities, and translated into spatial outputs for planners. The resulting hazard–vulnerability matrix forms the basis for targeted regeneration strategies and building renovation measures under multi-hazard scenarios.

3.7. Decision Support Interface (DSI) (Module 6)

The smart DSI functions as a dynamic dashboard that integrates outputs from all modules into accessible, actionable insights. Functioning as a dynamic dashboard, the DSI consolidates multi-source data—ranging from microclimate simulations (Module 1) and morphological analyses (Module 2) to LCA evaluations (Module 3), remote sensing outputs (Module 4), and hazard–vulnerability indexing (Module 5). This interoperability ensures that complex datasets are synthesized into coherent visualizations to support decision-making across spatial and governance scales.
Key functions of DSI include:
  • Climate Risk Visualization: Interactive maps display future heat, flood, and drought scenarios under multiple climate projections and renovation pathways, enabling exploration of uncertainty and stress testing of strategies.
  • Adaptation Strategy Comparison: Users can compare alternative regeneration and renovation interventions using predefined performance indicators (e.g., reduction in heat stress hotspots, embodied carbon savings, or improved runoff retention).
  • Stakeholder Engagement: Intuitive dashboards and map-based interfaces allow non-experts, including residents and community groups, to interact with climate risk data, fostering participatory, and inclusive planning.
  • Participatory Planning Support: The interface integrates scenario exploration tools, allowing policymakers, planners, and citizens to collaboratively test design options and evaluate co-benefits across environmental, economic, and social dimensions.
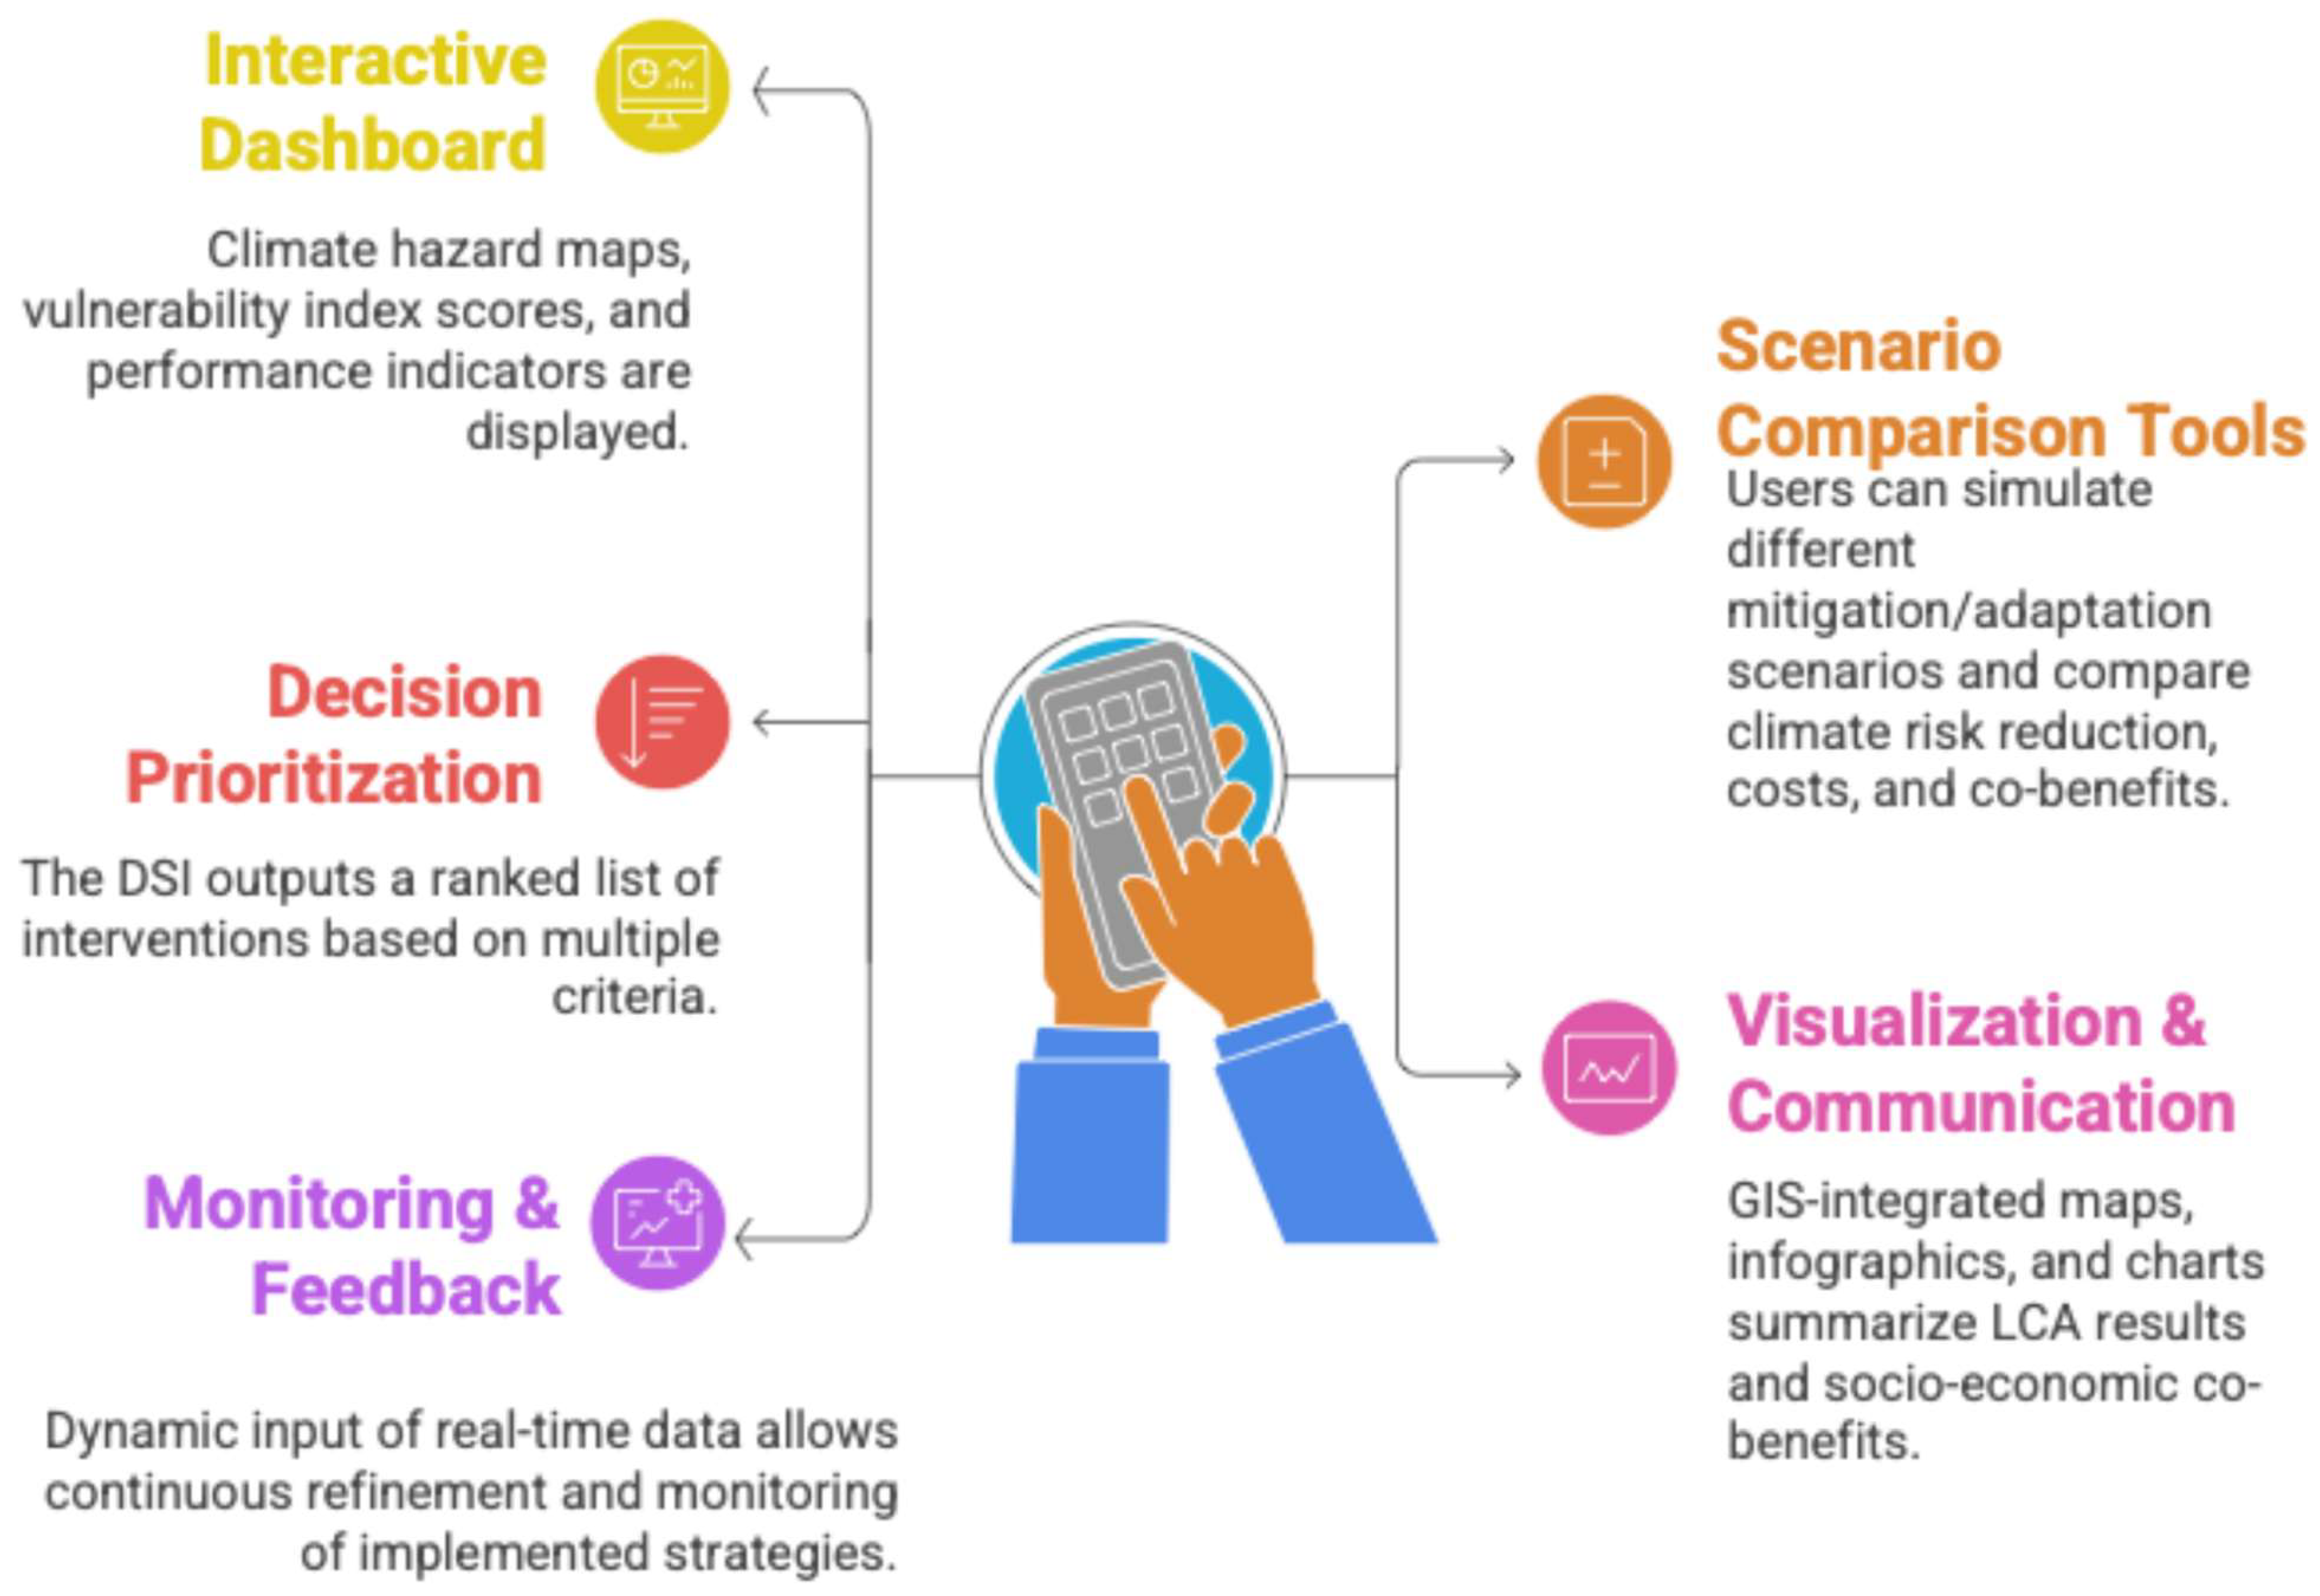
Figure 5 illustrates the strategic framework of the DSI, showing how its four primary functions—risk visualization, adaptation comparison, participatory planning, and stakeholder engagement—are interlinked around the core interface. Together, these elements facilitate informed, scenario-based decision-making for urban climate resilience.
To enable the functioning of the DSI and its interconnected modules, a wide range of datasets and computational tools are required. These inputs provide the empirical foundation for simulations, vulnerability indexing, and scenario analyses, while also ensuring that results are transparent and reproducible across scales. Table 4 summarizes the key domains of data acquisition—ranging from macroclimate scenarios to building inventories—along with the corresponding tools and applications. This structured overview illustrates how each dataset feeds into the modeling workflow and ultimately supports integrated urban climate resilience planning.
Within the DSI, incommensurate values (e.g., embodied carbon versus implementation cost versus flood risk reduction) are made comparable through the MCDA framework of Module 5, which assigns AHP-derived weights to competing criteria, while the dashboard visualizes these trade-offs transparently as multi-KPI scenario comparisons (see Table 8 and Scenario A–C). Stakeholders can adjust relative weights through the participatory interface, enabling value-sensitive planning. Economic costing is currently included in an indicative form (USD/m2 implementation cost benchmarks for renovation scenarios; Table 8) but does not yet constitute a full life cycle cost (LCC) analysis, as this is a planned extension. The urban regeneration scope of the DSI in its current form is focused on building-level renovation and neighborhood-scale green/blue infrastructure interventions (e.g., permeable paving, green roofs, SUDS, street trees, as illustrated in Scenarios A–C). These green/blue infrastructure options are included both as monitoring variables in Module 4 (NDVI, LAI mapping) and as intervention options in the scenario comparison layer of Module 6. Grey infrastructure (drainage networks, road surfaces) is included as an exposure variable in the vulnerability index (Module 5) and as a scenario parameter in SWMM-based flood modeling (Module 1), but comprehensive grey infrastructure renewal decision support is outside the current scope. Transport emissions are assessed as a climate risk context variable (city-scale GHG exposure mapping) but transport renovation decisions are not currently within the regeneration decision scope of the DSI and is identified as a future extension (Section 5.3).
The novelty of this DSI lies in its modularity and adaptability. It is designed not only for the Daegu case study but also for global transferability. By linking scientific modeling outputs with interactive governance tools, the DSI bridges the gap between data-driven analysis and real-world decision-making. Ultimately, the DSI serves as a participatory digital environment where technical experts, city officials, and communities converge to co-develop climate-resilient and sustainable urban regeneration strategies.

3.8. Data Sources and Tools

To operationalize the proposed framework, diverse datasets and tools are required. These inputs enable the integration of climate simulations, geospatial analytics, and building-scale assessments, ensuring consistency across modules. Table 5 summarizes the main data sources and tools applied in this research.
The six modules are connected through a structured data exchange architecture ensuring interoperability, spatial alignment, and temporal consistency. This section describes the intended technical integration design; full implementation is ongoing.
Data exchange formats include BIM data: IFC via ifcopenshell.; GIS layers: GeoJSON/Shapefile; meteorological information: EPW format (KMA data+IPCC downscaled scenarios); SWMM: INP format; LCA inventory: ecoinvent 3.9 in XML via One Click LCA and OpenLCA; remote sensing: GeoTIFF rasters. All spatial layers are aligned to EPSG:5186 (Korea 2000/Central Belt 2010 TM). BIM models are georeferenced by extracting IFC site placement coordinates and reprojecting to EPSG:5186 prior to GIS integration.
For database architecture a PostgreSQL/PostGIS spatial database serves as the central repository for all processed layers from Modules 1–5. Python 3.11 scripts using geopandas 0.14.0, pyswmm 1.3.1, and ifcopenshell 0.7 manage inter-module data flows. LCA outputs are linked to the spatial database via building identifier keys from the cadastral layer. Microclimate simulations use three meteorological scenarios: historical baseline (2010–2020 KMA), SSP2–4.5 mid-century (2041–2060), and SSP5–8.5 end-century (2081–2100), downscaled to hourly resolution via the Urban Weather Generator (UWG). SWMM uses 10-year and 100-year design rainfall return periods, consistent with Daegu’s municipal drainage standard.
The architecture is conceptually aligned with urban digital twin frameworks described by Ferré-Bigorra et al. [109], but does not currently interface with an operational city-wide digital twin for Daegu. To the authors’ knowledge, no such publicly accessible digital twin for Daegu exists at the time of writing, whether government-managed or otherwise. Should one become available, integration with the framework’s spatial database is explicitly planned as a future development step.

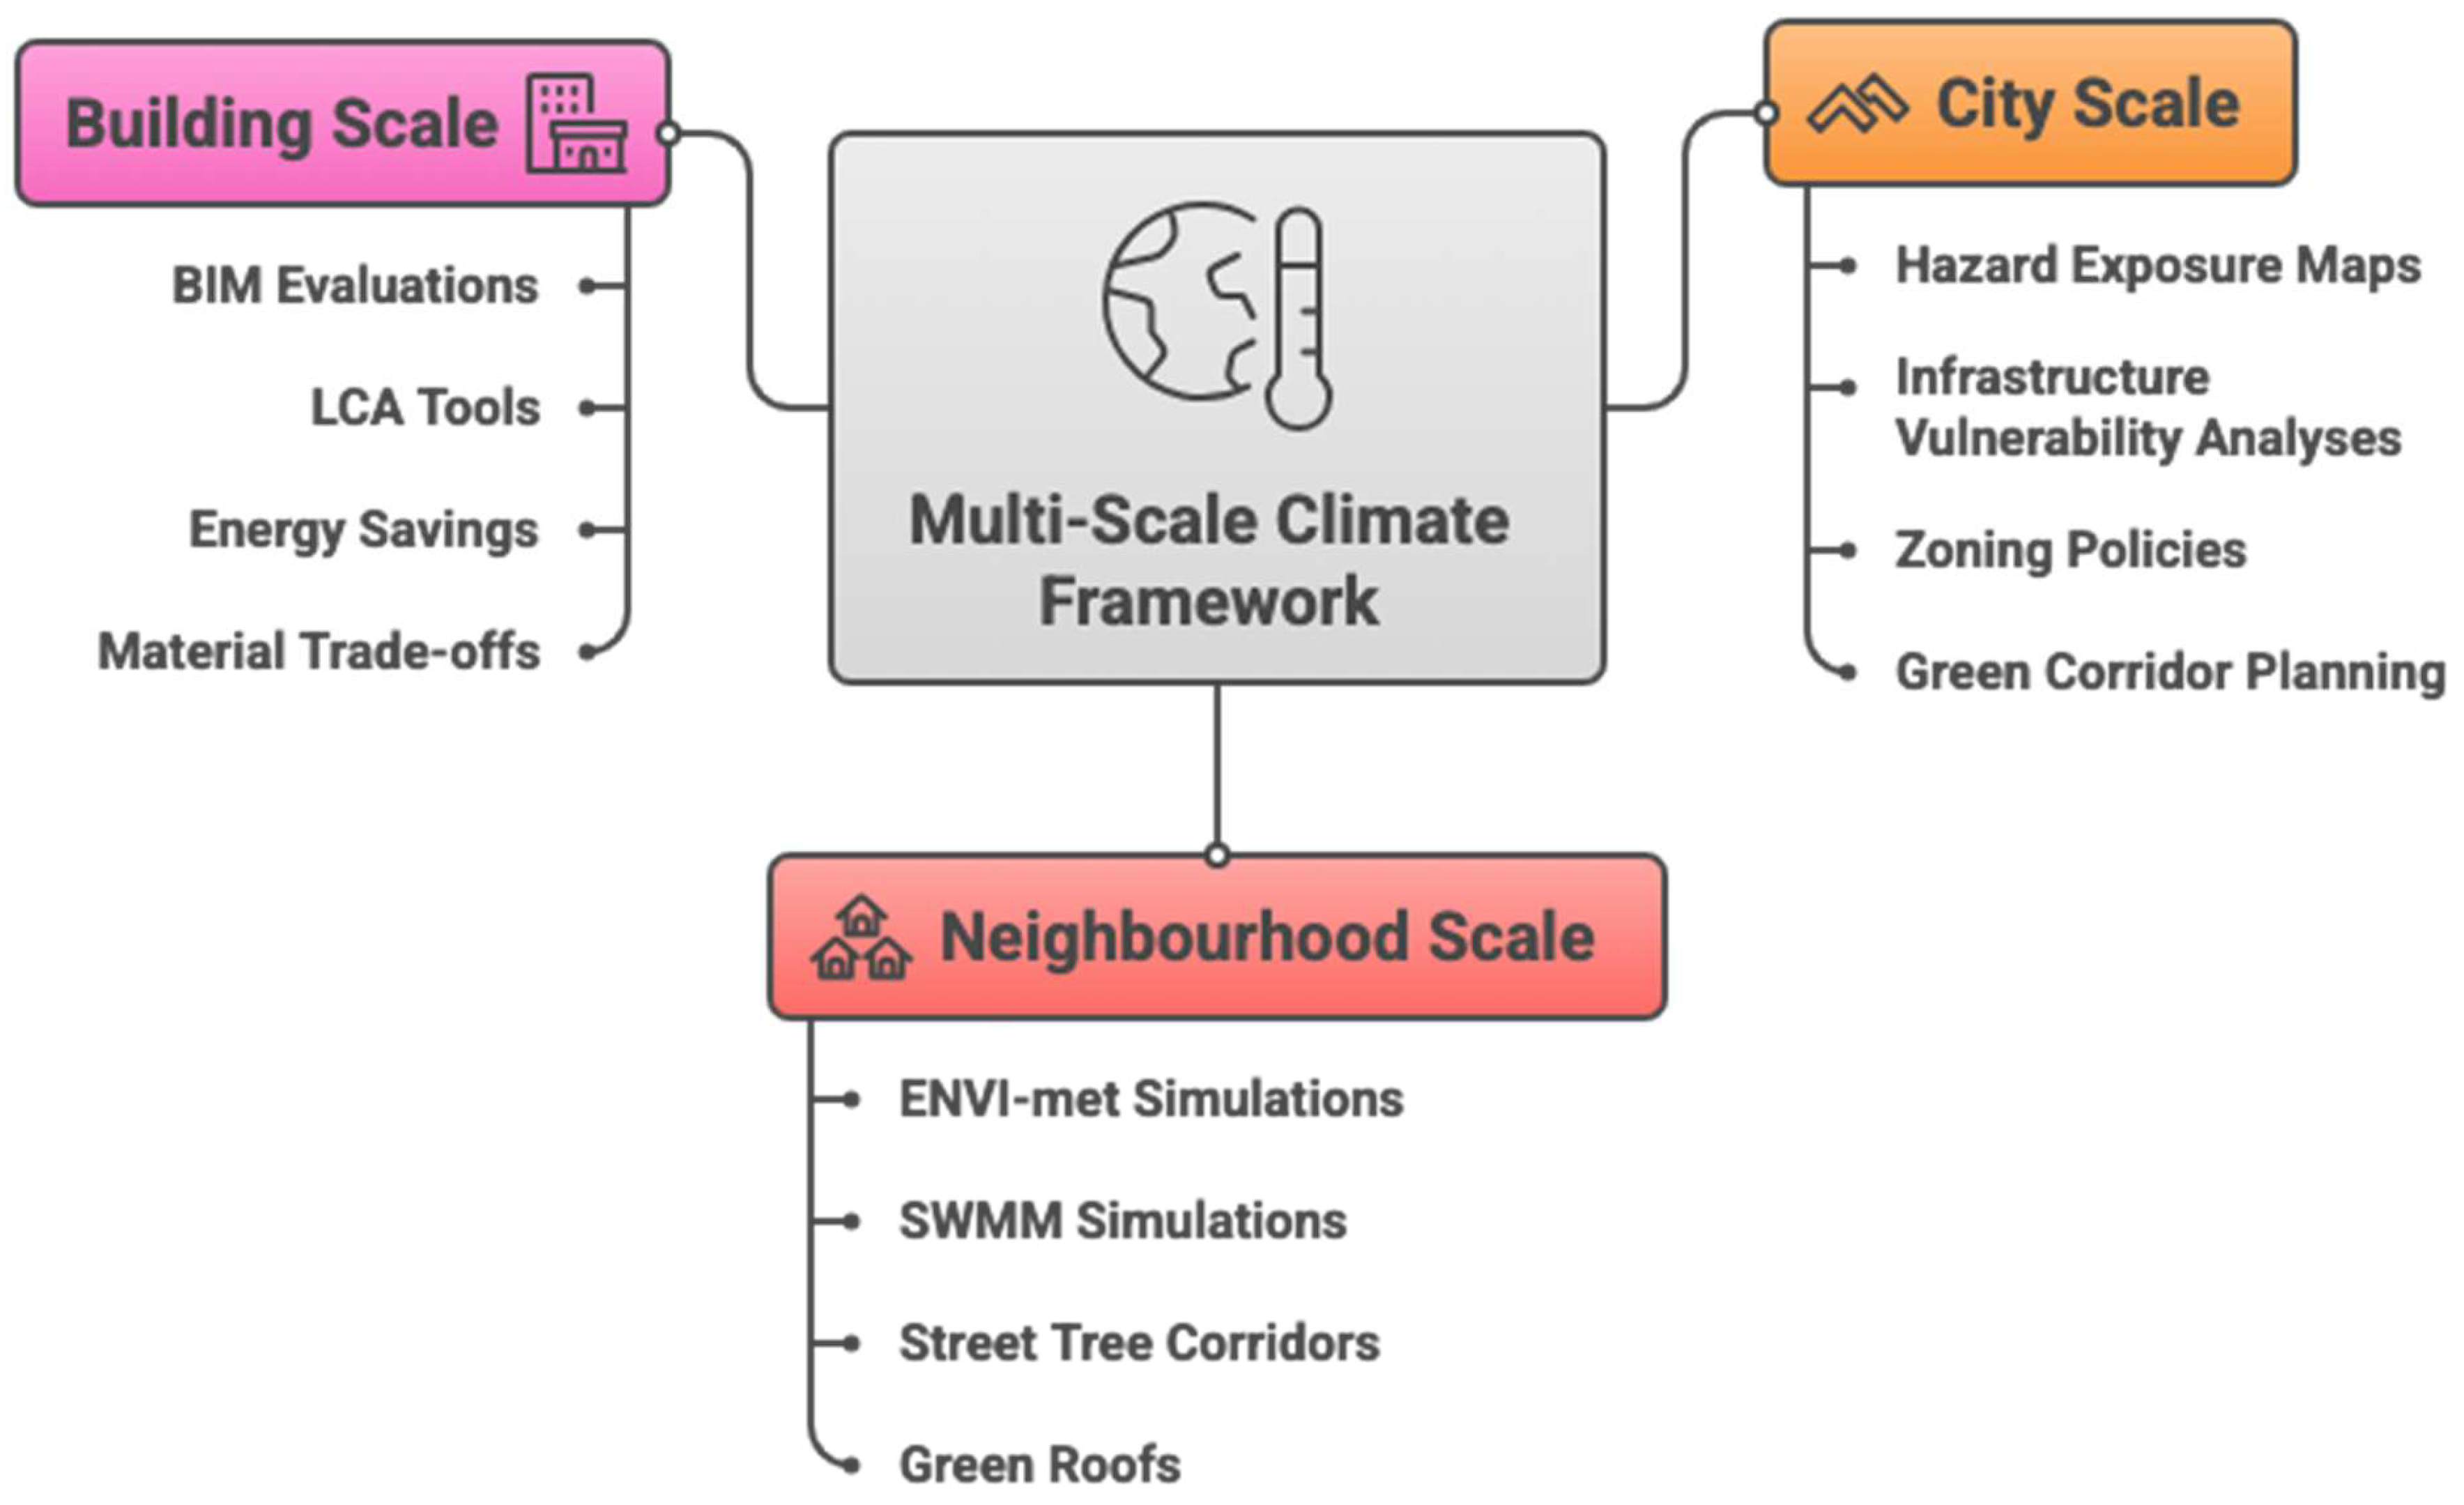
3.9. Multi-Scale Modeling Approach

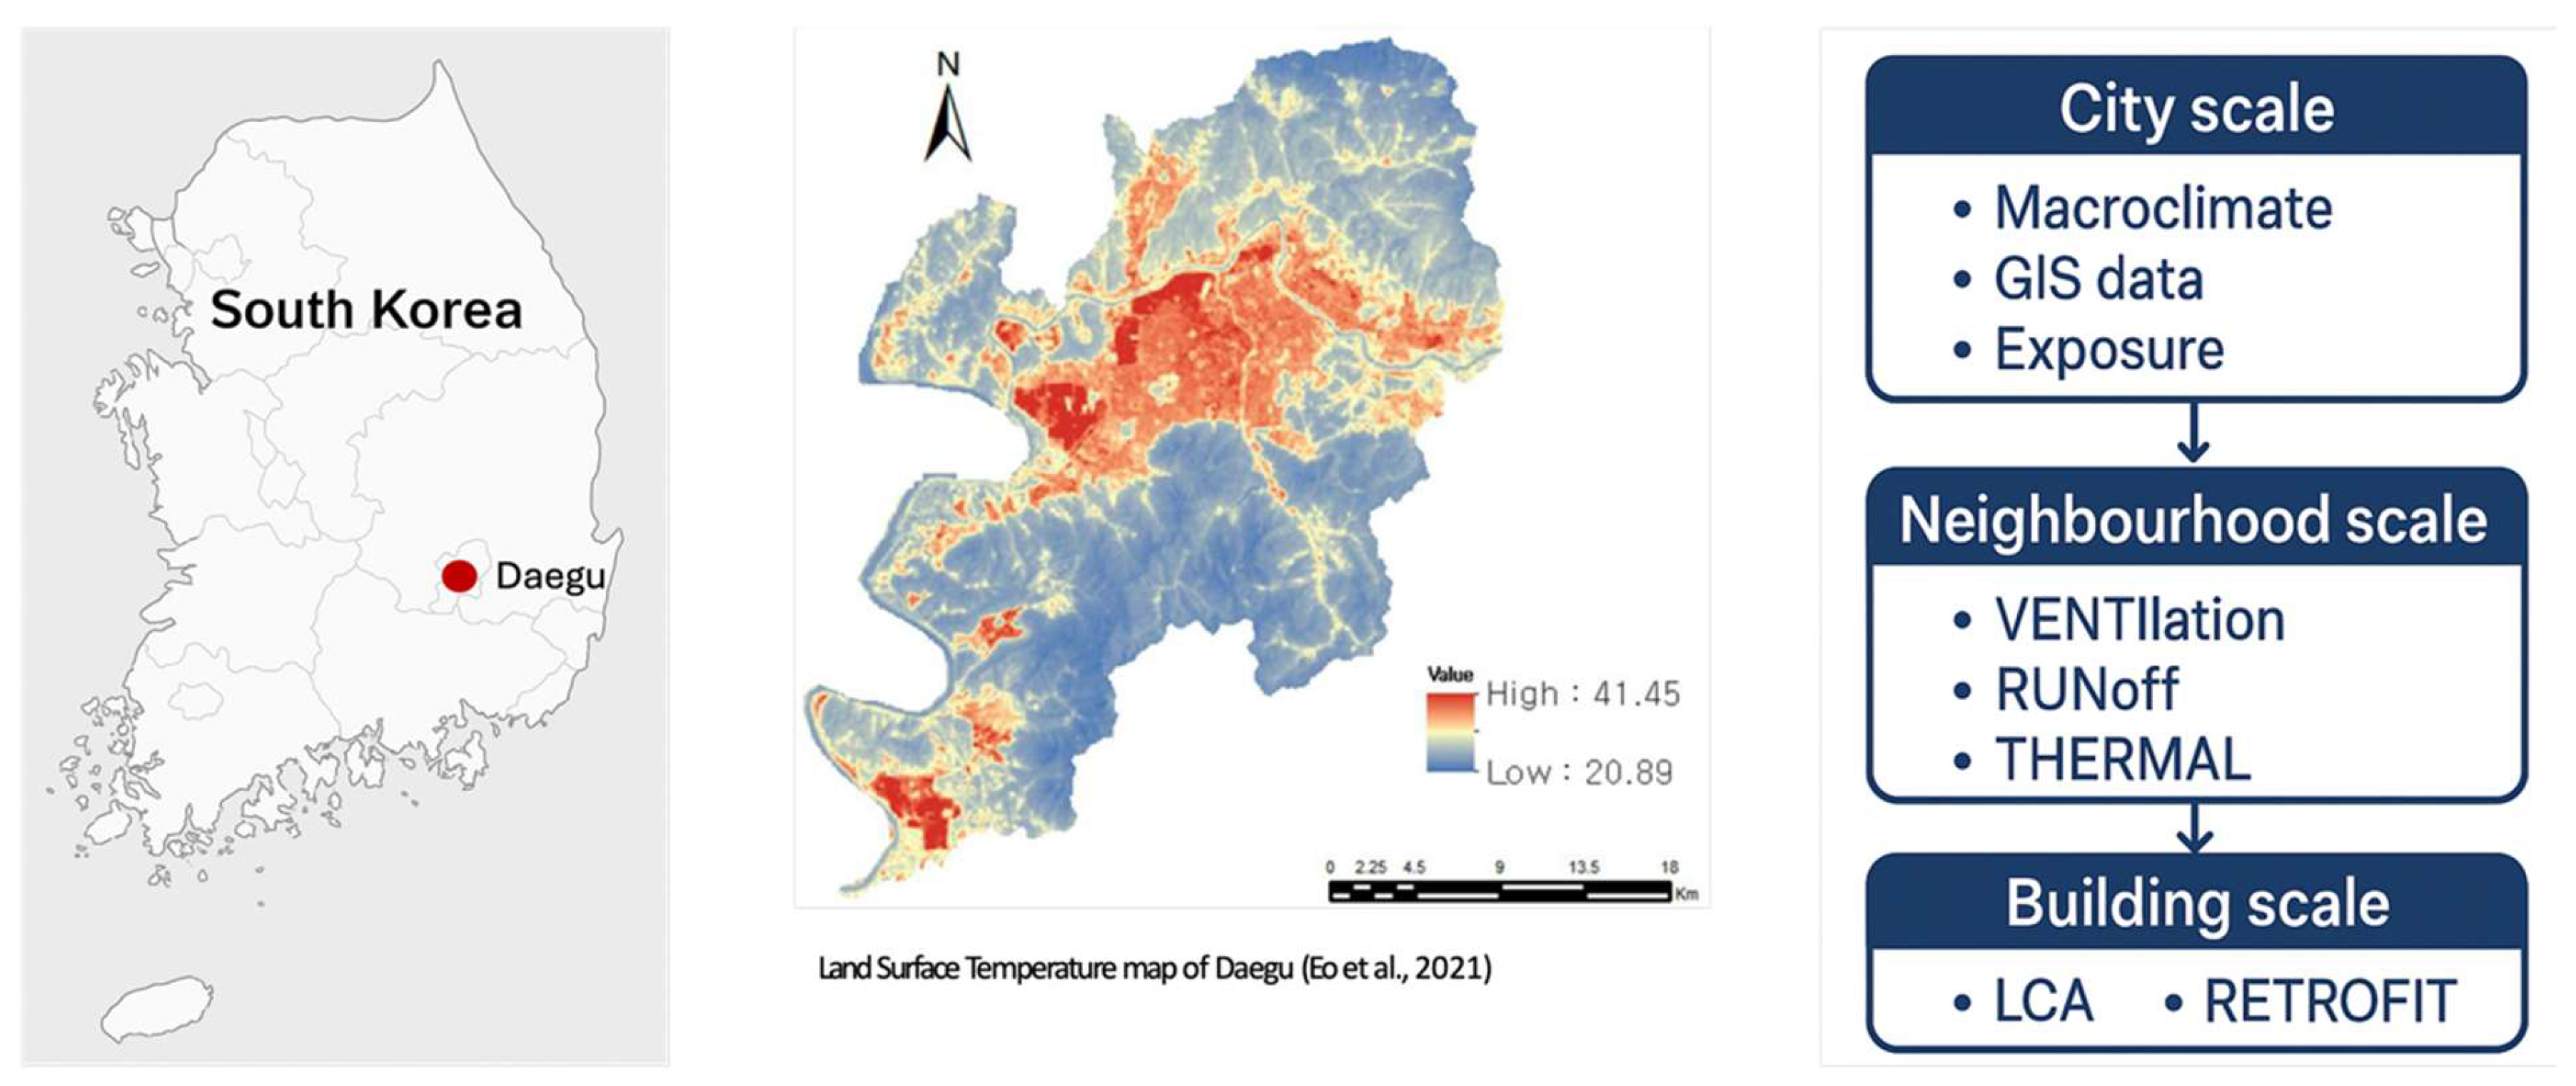
The modeling approach operates across three explicit spatial scales as shown in Figure 6 with feedback between them. This multi-scale structure ensures that top-down climate projections and bottom-up retrofit strategies are aligned, creating a dynamic system where outputs at one scale refine inputs at another.
  • City scale (macro) hazard exposure maps (e.g., land surface temperature, flood corridors) and infrastructure vulnerability analyses are generated using remote sensing and GIS. Outputs inform city-wide zoning policies, green corridor planning, and investment priorities. Typical outputs include heat exposure maps, critical infrastructure vulnerability indices, and service recovery time estimates.
  • Neighborhood scale (meso): Simulations of urban morphology effects on ventilation, shading, and runoff, using 10–100 s domains with ENVI-met and SWMM coupled inputs. Outputs support block-level regeneration packages (green roofs, permeable paving, street trees) and neighborhood prioritization.
  • Building scale (micro): Building energy and envelope modeling, LCA of retrofit options (functional unit: per m2 renovated gross floor area over a 50-year horizon), and façade/roof catalogue implementation. Building-scale outputs feed back into neighborhood scenarios (aggregate energy demand, local heat mitigation potential).
The system is explicitly coupled: neighborhood ENVI-met outputs inform building energy simulations and LCA boundary conditions (surface temperature and incident radiation), while aggregated building retrofit outcomes update city-scale supply/demand and emissions scenarios.

3.10. Uncertainty Sources and Sensitivity Framework

Each component model carries inherent uncertainties that propagate through the integrated system. Table 6 summarizes uncertainty sources, indicative magnitude ranges, and sensitivity testing approaches by module.
Module-level key uncertainties include ENVI-met: Leaf Area Index (±0.5 m2/m2), surface albedo (±0.05–0.10), wind speed (±10–20%); SWMM: Manning roughness (±15–25%), infiltration rate (±30%), design rainfall (±20%); LCA: background ecoinvent data (±15–30% GHG), allocation method, service life (±10 yr); remote sensing: LST (±1–2 °C), NDVI (±0.05–0.08); vulnerability index: AHP weight subjectivity, managed via PCA validation and ±20% OAT sensitivity testing. Uncertainties also compound across module interfaces (e.g., ENVI-met temperature outputs inform LCA thermal load calculations). Preliminary bounding analysis estimates system-level compound uncertainty for integrated KPI outputs at ±20–35%, supporting the use of ranges rather than point estimates in the scenario benchmarks. A One-at-a-Time (OAT) approach is adopted for the current framework stage. Full probabilistic uncertainty quantification (Monte Carlo across all modules) is a priority deliverable for the next phase of framework development.

3.11. Current Scope of Sustainability Coverage and SDG Alignment

In light of the framework’s stated alignment with the SDGs and recognizing that all 17 SDGs and approximately two-thirds of their targets are relevant to urban contexts; it is important to define clearly what the current framework addresses and where development remains needed. In its present form, the framework explicitly covers: (i) climate adaptation for urban heat stress, pluvial flooding, and drought (Modules 1, 5); (ii) GHG mitigation related to building envelope renovation and material production through LCA (Module 3); (iii) urban green and blue infrastructure mapping and monitoring through remote sensing and vulnerability indexing (Modules 4, 5); (iv) selected social equity indicators including population density, age distribution, income, and health vulnerability embedded in the vulnerability index (Module 5); and (v) participatory decision support to broaden access to planning processes (Module 6).
The framework does not currently address: coastal storm surge or sea-level rise risks (relevant for coastal cities); transport-mode GHG emissions or mobility-related mitigation; industrial and grey infrastructure emissions beyond the building sector; comprehensive circular economy metrics beyond building material LCA; biodiversity and full ecosystem service valuation beyond vegetation indices (future InVEST integration is planned; see Section 5.3); and economic costing frameworks beyond illustrative USD/m2 benchmarks. These limitations reflect both the deliberate focus on building renovation and urban regeneration as the primary intervention context, and the framework’s current TRL 3–4 development status. Future extensions to address these dimensions are outlined in Section 5.3.

4. Results

To demonstrate the applicability of the proposed evaluation system, Daegu, Republic of Korea (RoK) was selected as the primary case study site. The choice was informed by prior research conducted in the city (see [21]) and ongoing research projects within the city [128]. Daegu provides an ideal testbed due to its diverse urban morphology, rapid development history, and pressing climate vulnerabilities. Its built environment exhibits spatial, technical, and design characteristics representative of many Korean cities, enabling transferability of results to similar contexts. Standardized typological clusters derived from Daegu can be extrapolated to broader national and regional applications.
Located in the southeastern region of the Republic of Korea, Daegu is one of the country’s six major metropolitan cities, with a population of 2.37 million as of 31 December 2023. The total area is 885 km2, 90% of which is urban, with only 10% being non-urban [129]. Daegu’s strategic location makes it an important economic and transport hub, surrounded by mountains and boasting a landscape of skyscrapers, parks, and traditional markets [130]. Its subtropical climate, characterized by hot summers and dry, cool winters, as well as its location, make Daegu one of the driest metropolitan cities in the Republic of Korea [131]. The city has experienced average summer temperatures rising by over 2 °C since the 1960s, and a record high of 40.0 °C in 2018, exacerbating the urban heat island (UHI) effect. With approximately 50% of residential buildings built before 1990, many lack adequate thermal insulation, ventilation systems, or energy-efficient designs. As such, building renovation is a key component of Daegu’s strategy to mitigate urban climate risks and promote sustainable regeneration [132]. The dense concentration of industrial complexes in the west generates artificial heat, which contributes to heatwaves and tropical nights [133]. This region has an annual mean temperature of 24.8 °C, with an average annual rainfall of 1600 mm, concentrated during the monsoon season from June to August. Although flooding tends not to occur in the city center, the influence of periodic heavy rainfall during the rainy season should nevertheless be considered in terms of sustainable urban planning and construction [129].
Taken together, Daegu’s demographic density, climate stress, and aging building stock provide both a challenge and an opportunity for testing integrated, multi-scale resilience frameworks. The city is projected to experience increasingly severe heatwaves under climate change scenarios [131], underlining the urgency of evidence-based renovation strategies. The necessary data has been and will be collected from previous studies, reports, plans, satellite images, and aerial photographs of the city’s natural and urban context [21]. The considerations and proposals for the structural and functional improvement of the building structures are oriented based on simulations of the development of the microclimate and LCA analyses based on the building catalogue, the data from remote sensing and the analysis of urban morphology [134].

4.1. Baseline Characterization of the Daegu Study Area

Table 7 presents key baseline indicators for the Daegu study area, compiled from published studies, Korea Meteorological Administration (KMA) records (KMA, 2025 [135]), and Daegu Metropolitan Government datasets (Daegu Metropolitan Government, 2023 [136]). These provide the quantitative empirical foundation against which the intervention scenarios in Section 4.2 are benchmarked. The data confirm that Daegu is among the most thermally stressed metropolitan areas in the Republic of Korea: urban core land surface temperatures reach 34–42 °C in summer [137], driven by low green coverage (~18% NDVI > 0.3 in the urban core), high impervious surface ratios, and a building stock where approximately 50% of residential units predate 1990 and lack adequate thermal insulation (Daegu Metropolitan Government, 2023). Projected intensification of both heat and rainfall extremes under SSP scenarios (IPCC AR6) underlines the urgency of the integrated multi-hazard renovation and regeneration strategies the framework supports.

4.2. Scenario-Based Assessment

To demonstrate the framework’s capacity to generate actionable planning outputs, three illustrative intervention scenarios are defined for the Daegu context. All values are indicative benchmarks drawn from the peer-reviewed literature, not direct empirical measurements. They are framed as illustrative applications of the framework’s assessment logic, consistent with its current TRL 3–4 status. Table 8 presents a structured comparison across nine KPIs.
Scenario A UHI Mitigation (Green Roof + Reflective Surfaces) applies green roof installation combined with high-albedo reflective roofing to pre-1990 residential UHI hotspot zones. Modules applied are M1, M3, and M4. Expected co-benefits include UHI surface temperature reduction 1.5–3.0 °C; passive cooling energy savings 10–20 kWh/m2/yr; stormwater retention improvement 10–20%; and implementation cost of 80–200 USD/m2.
Scenario B Flood Management (Permeable Paving + SUDS) deploys permeable paving and sustainable urban drainage systems in flood-vulnerable neighborhoods. Modules applied include M1, M3, and M5. Expected co-benefits are stormwater runoff reduction 40–60%; peak flow attenuation by 30–50%; surface temperature reduction of 0.5–1.5 °C; and overall implementation cost of 40–120 USD/m2.
Scenario C Integrated Deep Renovation applies comprehensive deep renovation including façade insulation, roof greening, reflective surfaces, and SUDS across all six modules. Expected co-benefits include total energy demand reduction by 40–70% vs. baseline; UHI reduction of 2.5–4.0 °C; runoff reduction by 30–50%; embodied carbon expenditure 60–150 kg CO2-eq/m2; and implementation cost of USD 150–350/m2. This scenario demonstrates the highest co-benefit profile at higher cost and embodied carbon investment.

4.3. Urban Dataset

To evaluate the environmental performance of building renovation strategies within the context of urban climate resilience, a comprehensive cradle-to-grave Life Cycle Assessment is conducted on representative residential buildings of Daegu, South Korea. The buildings, constructed predominantly between 1970 and 1990, reflect typical Korean construction practices of the era. Characterized by reinforced concrete structural systems, brick or plaster façades, and flat roofs, these typologies provide a relevant basis for assessing both embodied and operational environmental impacts. The geographical context of Daegu and the multi-scale evaluation approach applied in this study are illustrated in Figure 7, which combines spatial location, urban heat distribution patterns, and the analytical workflow across city, neighborhood, and building-scale levels.
In advancing the conventional LCA framework, this study incorporates UHI effects into the analysis by considering material-specific thermal properties such as albedo and thermal mass, in line with the approach proposed by [93]. This allows for a more climate-responsive assessment of renovation materials and strategies. To capture spatial temperature variability and refine UHI-related inputs, mobile sensing techniques were employed to generate high-resolution microclimate maps across diverse urban morphologies in Daegu, following for example the methodology outlined by Merdymshaeva et al. [94].
Complementary to ground-based measurements, remote sensing analysis using Landsat imagery will be conducted to evaluate the spatial distribution and cooling performance of urban green spaces (UGS). This aligns with the findings of [105], who highlighted the significant temperature moderation potential of UGS in dense urban environments. Furthermore, to assess the dynamic thermal impact of retrofit interventions, Large Eddy Simulation (LES) models are utilized [140]. These models enable detailed analysis of airflow and heat transfer interactions at the neighborhood scale, allowing for predictive evaluation of retrofit scenarios in terms of thermal comfort and climate resilience.

4.4. Application of Framework in Daegu

The Daegu case study operationalizes the framework by combining vulnerability assessment, microclimate modeling, LCA-based retrofit evaluation, and participatory decision support. Specifically:
  • City scale: Macroclimate projections (IPCC SSP2/SSP5) and municipal GIS data inform exposure mapping for heat and flood risks.
  • Neighborhood scale: ENVI-met and SWMM simulations assess ventilation corridors, runoff management, and thermal hotspots, guiding block-level regeneration packages.
  • Building scale: LCA and retrofit catalogues are applied to test renovation strategies, integrating thermal performance with long-term sustainability metrics.
Through this multi-scale application, Daegu will serve as both a proof-of-concept and a pilot implementation, validating the system’s capacity to align scientific modeling with practical urban planning. The outcomes are designed to be transferable to other Korean metropolitan areas and adaptable to global urban contexts with similar climatic and infrastructural challenges.

4.5. Framework Validation Status and Roadmap

As the framework operates at TRL 3–4, full empirical validation of integrated system outputs has not yet been completed. The following validation activities are planned: (i) ENVI-met outputs will be calibrated against KMA ground station records and cross-validated with Landsat 8 TIRS thermal composites for 2020–2022; UAV-based thermal surveys of representative Daegu neighborhoods will provide fine-scale ground truth. (ii) SWMM runoff volumes and peak flows will be validated against recorded data from three historical monsoon flood events (2018, 2020, 2022) at gauged sub-catchments within the study area. (iii) The hazard–vulnerability matrix outputs will be cross-referenced with Daegu Metropolitan Government’s published heat vulnerability and flood risk zone designations. (iv) The integrated DSI will be piloted with a stakeholder panel including city planners, building engineers, and community representatives, with usability assessed via structured feedback protocols.
Although full empirical validation remains ahead, several important learnings have emerged from the case study development process. First, data availability has proven more constraining for the social vulnerability and building-scale components than for the climate hazard components. While KMA meteorological data, Landsat/Sentinel imagery, and IPCC scenarios are readily available, consistent building-level material and energy performance data required for Module 3 (LCA) depend on manual audit campaigns and are not yet systematically available from municipal datasets. Second, governance integration has been facilitated by prior collaborative relationships with Daegu Metropolitan Government, but embedding the framework’s outputs into formal planning instruments (e.g., Urban Regeneration New Deal projects) requires alignment with national building codes and municipal renovation subsidy criteria that evolve independently of research timelines. Specifically, current engagement with the Daegu Metropolitan Government has included access to municipal GIS layers, the city’s building registry and renovation database, and alignment with the Eco-friendly and Safe Housing Remodeling Project (Daegu Metropolitan Government, 2023), which provides a concrete policy vehicle for future operationalization of the framework [132]. Third, the multi-module technical integration particularly linking ENVI-met spatial outputs to LCA material inputs via the PostGIS database has required custom scripting and highlights the importance of standardizing data exchange interfaces (Section 3.8) as a prerequisite for operational deployment. These learnings directly inform the validation roadmap priorities outlined above.

5. Discussion

Although tailored to Daegu, the proposed framework is intentionally designed for global applicability, particularly in data-rich urban contexts where multi-source datasets can be integrated into participatory planning systems. Its modular structure ensures adaptability: components such as microclimate modeling, LCA evaluation, and remote sensing can be scaled or substituted depending on data availability and policy priorities. This flexibility positions the framework as a transferable tool for advancing climate resilience across diverse urban environments, from rapidly urbanizing Asian megacities to medium-sized European towns and African secondary cities.
The novelty of this proposed framework lies in bridging technical, spatial, and policy domains to address urban climate resilience and sustainability. By linking environmental simulations with decision support interfaces, the framework transcends siloed methods of urban planning and creates an evidence-based pathway toward systemic transformation. It also aligns with global agendas such as the UN Sustainable Development Goals (SDGs), the EU Green Deal, and national renovation strategies, embedding climate resilience directly into planning, design, and governance processes.

5.1. Framework Contributions and Comparison with Related Approaches

The integrated framework addresses three research questions that together advance the state of practice in urban climate resilience assessment relative to existing initiatives described in Section 2.8. In response to RQ1, simultaneous multi-hazard vulnerability assessment across city, neighborhood, and building scales is enabled by coupling ENVI-met, SWMM, remote sensing, and MCDA-based indexing within a shared PostGIS spatial database distinguishing the framework from single-hazard tools and from vulnerability indices that aggregate hazard data without spatial simulation. In response to RQ2, the scenario-based assessment demonstrates that the framework can systematically compare intervention typologies across LCA carbon metrics, hydrological performance, and thermal comfort simultaneously; Scenario C emerges as the highest co-benefit strategy, illustrating the type of trade-off the DSI makes transparent. In response to RQ3, the modular DSI architecture aligned with the digital twin integration principles of Ferré-Bigorra et al. [109] provides a structured pathway for making multi-module outputs actionable without requiring end-users to engage with underlying simulation models.
The ecosystem services dimension of urban resilience highlighted by Córdoba Hernández and Camerin [62,141] as a structural component of planning decision-making is addressed through the explicit inclusion of vegetation mapping (Module 4, NDVI/LAI), green infrastructure assessment in the vulnerability module (Module 5), and the green infrastructure intervention scenarios in Section 4.2. Future work will further integrate quantitative ecosystem service valuation (e.g., InVEST toolkit) as an additional LCA co-benefit metric, transitioning from biophysical treatment of vegetation variables toward comprehensive ecosystem service integration.

5.2. Addressing Limitations

Several limitations must be acknowledged. First, as a TRL 3–4 conceptual design, the framework has not yet been validated as a fully integrated system. The scenario benchmarks in Section 4.2 are drawn from the literature rather than from direct simulation or measurement in Daegu. Full empirical validation is the primary deliverable of the next research phase. Second, ENVI-met is computationally intensive at neighborhood scale (~10 ha), limiting direct city-scale application; the Urban Weather Generator (UWG) is identified as a complementary lightweight tool for city-scale UHI screening. Third, the LCA module relies on global ecoinvent data, which may not accurately represent Korean supply chains; a Korea-specific adaptation using KICT datasets is planned [142]). Fourth, the AHP weighting procedure depends on expert elicitation and may reflect the convened panel’s priorities; the framework’s Module 6 stakeholder engagement function is designed to enable community-based weight revision in participatory planning. Fifth, uncertainty propagation across module interfaces has been assessed qualitatively (Section 3.10) but not yet probabilistically quantified, a priority for future methodological development.

5.3. Future Research Directions

Looking forward, several research and implementation directions are particularly promising:
  • Completion and full empirical validation of the Daegu pilot, including completion of the ENVI-met calibration, SWMM flood validation, and DSI stakeholder co-design activities described in Section 4.5. This is the primary near-term deliverable and constitutes the prerequisite for evidence-based claims of framework performance and transferability to other urban contexts.
  • System implementation across multiple Korean cities such as Gwangju, Deajeon, Seoul, and Busan.
  • AI-driven climate analytics (machine learning and digital twins) integration for predictive modeling, early-warning systems, and automated scenario testing.
  • Development of open-source planning toolkits for municipal governments, NGOs, and researchers to adopt the framework without high technical barriers.
  • Strengthening community engagement components, including participatory dashboards co-design workshops, and urban living labs, to enhance inclusivity and ensure that technical outputs translate into socially accepted interventions.
  • Cross-sectoral applications, expanding beyond heat and flood resilience to address air pollution, resource circularity, and ecosystem services in urban regeneration strategies.
In sum, this research contributes a scalable and interdisciplinary planning framework that can guide evidence-based urban regeneration and building renovation under climate change. Its continued evolution through wider applications, digital innovations, and participatory extensions will strengthen its role as both a scientific and policy-support tool for sustainable urban futures.

Author Contributions

J.K.: Conceptualization, methodology, investigation, writing—original draft preparation, writing—review and editing. B.M.: Writing—original draft preparation, writing—review and editing. J.W.: Data curation, visualization. A.S.A.: Writing—review and editing, data curation, validation, project supervision, visualization. T.S.: Conceptualization, writing—review and editing, supervision, project administration All authors have read and agreed to the published version of the manuscript.

Funding

This work was supported by the National Research Foundation of Korea (NRF), funded by the Korean government, Ministry of Science and ICT (MSIT) (RS-2024-00346177).

Data Availability Statement

The data supporting this study’s findings are available from the corresponding author upon reasonable request.

Conflicts of Interest

The authors declare no conflicts of interest.

Abbreviations

The following abbreviations are used in this manuscript:
GISGeographic Information Systems
BIMBuilding Information Modeling
CIMCity Information Modeling
LCALife Circle Assessment
DSIDecision Support Interface
SDGsSustainable Development Goals
UHIUrban Heat Island
SWMMStorm Water Management Model
SoVISocial Vulnerability Index
FVIFlood Vulnerability Index
SURSustainable Urban Regeneration
MCDAMulti-Criteria Decision Analysis
USFUrban Sustainability Framework
SUMPSustainable Mobility Plan
UWGUrban Weather Generator
LCCLife Cycle Costing
UGSUrban Green Spaces
LESLarge Eddy Simulation
AHPAnalytic Hierarchy Process
PCAPrincipal Component Analysis

References

  1. Intergovermental Panel of Climate Change II (IPCC). Climate Change 2022: Impacts, Adaptation, and Vulnerability. Contribution of Working Group II to the Sixth Assessment Report of the Intergovernmental Panel on Climate Change. Pörtner, D.C.R.H.-O., Tignor, M., Poloczanska, E.S., Mintenbeck, K., Alegría, A., Craig, M., Langsdorf, S., Löschke, S., Möller, V., Okem, A., et al., Eds.; Cambridge University Press: Cambridge, UK; New York, NY, USA, 2022. [Google Scholar]
  2. Intergovermental Panel of Climate Change (IPCC). Climate Change 2023: Synthesis Report. Contribution of Working Groups I, II and III to the Sixth Assessment Report of the Intergovernmental Panel on Climate Change. Core Writing Team, Lee, H., Romero, J., Eds.; IPCC: Geneva, Switzerland, 2023; pp. 1–34. [Google Scholar]
  3. United Nations (UN) (Ed.) Transforming Our World: The 2030 Agenda for Sustainable Development; United Nations: New York, NY, USA, 2015. [Google Scholar]
  4. Department for Energy Security and Net Zero. 2024 Government Greenhouse Gas Conversion Factors for Company Reporting: Methodology Paper for Conversion Factors Final Report. Department for Energy Security and Net Zero: London, UK, 2024. [Google Scholar]
  5. EEA (European Enviroment Agency) (Ed.) Annual Report 2010 and Environmental Statement 2011; Publications Office of the EU: Luxembourg, 2011. [Google Scholar]
  6. UN DESA. The Sustainable Development Goals Report 2025—July 2025. UN DESA: New York, NY, USA, 2025. [Google Scholar]
  7. Senjana, S.; Handayani, W.; Suprapt, A. A Review of Resilience in Urban Form for Natural Disater Prone Areas. Spatium 2024, 51, 63–72. [Google Scholar] [CrossRef]
  8. Williams-Eynon, A. Retrofitting for Resilience: How to Protect Existing Buildings from Floods, Fires, and More While Preserving Embodied Carbon. Urban Land, 28 April 2022.
  9. IPCC. Climate Change 2022—Mitigation of Climate Change: Working Group III Contribution to the Sixth Assessment Report of the Intergovernmental Panel on Climate Change. Cambridge University Press: Cambridge, UK, 2023. [Google Scholar]
  10. Schmidt, M. Rainwater Harvesting for Evaporative Cooling—Towards a New Water Paradigm; Schuetze, T., Kang, J.-E., Eds.; Sungkyunkwan University: Seoul, Republic of Korea, 2013; pp. 75–100. [Google Scholar]
  11. Schmidt, M. Gebäudebegrünung und energieeffiziente Gebäudekühlung. In Klimaresiliente Stadt und Architektur—Block 3 Anpassungsmaßnahmen an den Klimawandel; Berlin, A., Ed.; Architektenkammer Berlin: Berlin, Germany, 2021; pp. 1–135. [Google Scholar]
  12. Li, X.-X.; Liu, X. Effect of tree evapotranspiration and hydrological processes on urban microclimate in a tropical city: A WRF/SLUCM study. Urban Clim. 2021, 40, 101009. [Google Scholar] [CrossRef]
  13. Qiu, G.Y.; Yan, C.; Liu, Y. Urban evapotranspiration and its effects on water budget and energy balance: Review and perspectives. Earth-Sci. Rev. 2023, 246, 104577. [Google Scholar] [CrossRef]
  14. Bloemendaal, N.; de Moel, H.; Martinez, A.B.; Muis, S.; Haigh, I.D.; van der Wiel, K.; Haarsma, R.J.; Ward, P.J.; Roberts, M.J.; Dullaart, J.C.M.; et al. A globally consistent local-scale assessment of future tropical cyclone risk. Sci. Adv. 2022, 8, eabm8438. [Google Scholar] [CrossRef]
  15. Lourenço, B.A. Enhancing the Sustainability Assessment: A Multi-Criteria Decision Making Framework for Assessing Building Elements. In Institute of Energy Efficient and Sustainable Design and Building; TUM School of Engineering and Design of the Technical University of Munich: Munich, Germany, 2023. [Google Scholar]
  16. Shamsuddin, S. Resilience resistance: The challenges and implications of urban resilience implementation. Cities 2020, 103, 102763. [Google Scholar] [CrossRef]
  17. Xu, H.; Li, Y.; Tan, Y.; Deng, N. A Scientometric Review of Urban Disaster Resilience Research. Int. J. Environ. Res. Public Health 2021, 18, 3677. [Google Scholar] [CrossRef]
  18. Chen, Y.; Liao, Z.; Shi, Y.; Tian, Y.; Zhai, P. Detectable Increases in Sequential Flood-Heatwave Events Across China During 1961–2018. Geophys. Res. Lett. 2021, 48, e2021GL092549. [Google Scholar] [CrossRef]
  19. Amoruso, F.M.; Dietrich, U.; Schuetze, T. Development of a Building Information Modeling-Parametric Workflow Based Renovation Strategy for an Exemplary Apartment Building in Seoul, Korea. Sustainability 2018, 10, 4494. [Google Scholar] [CrossRef]
  20. Amoruso, F.M.; Schuetze, T. Life cycle assessment and costing of carbon neutral hybrid-timber building renovation systems: Three applications in the Republic of Korea. Build. Environ. 2022, 222, 109395. [Google Scholar] [CrossRef]
  21. Schuetze, T.; Gohaud, E. Potential for sustainable urban regeneration policies and practices in Daegu, Republic of Korea. IOP Conf. Ser. Earth Environ. Sci. 2020, 588, 052039. [Google Scholar] [CrossRef]
  22. Dodman, D.; Hayward, B.; Pelling, M.; Broto, V.C.; Chow, W.; Chu, E.; Dawson, R.; Khirfan, L.; McPhearson, T.; Prakash, A.; et al. Chapter 6: Cities, Settlements and Key Infrastructure. In Climate Change 2022: Impacts, Adaptation and Vulnerability. Contribution of Working Group II to the Sixth Assessment Report of the Intergovernmental Panel on Climate Change; Pörtner, H.-O., Roberts, D.C., Tignor, M., Poloczanska, E.S., Mintenbeck, K., Alegría, A., Craig, M., Langsdorf, S., Löschke, S., Möller, V., et al., Eds.; Cambridge University Press: Cambridge, UK; New York, NY, USA, 2020; pp. 907–1040. [Google Scholar]
  23. Zscheischler, J.; Westra, S.; Hurk, B.; Seneviratne, S.; Ward, P.; Pitman, A.; AghaKouchak, A.; Bresch, D.; Leonard, M.; Wahl, T.; et al. Future climate risk from compound events. Nat. Clim. Change 2018, 8, 469–477. [Google Scholar] [CrossRef]
  24. Penny, D.; Zachreson, C.; Fletcher, R.; Lau, D.; Lizier, J.T.; Fischer, N.; Evans, D.; Pottier, C.; Prokopenko, M. The demise of Angkor: Systemic vulnerability of urban infrastructure to climatic variations. Sci. Adv. 2018, 4, eaau4029. [Google Scholar] [CrossRef]
  25. Kappes, M.S.; Papathoma-Koehle, M.; Keiler, M. Assessing physical vulnerability for multi-hazards using an indicator-based methodology. Appl. Geogr. 2012, 32, 577–590. [Google Scholar] [CrossRef]
  26. Yiannakou, A.; Salata, K.-D. Adaptation to Climate Change through Spatial Planning in Compact Urban Areas: A Case Study in the City of Thessaloniki. Sustainability 2017, 9, 271. [Google Scholar] [CrossRef]
  27. Holling, C. Resilience of ecosystems: Local surprise and global change. In Global Change; Roederer, J.G., Malone, T.F., Eds.; Cambridge University Press: Cambridge, UK, 1986; pp. 228–269. [Google Scholar]
  28. Meerow, S.; Stults, M. Comparing Conceptualizations of Urban Climate Resilience in Theory and Practice. Sustainability 2016, 8, 701. [Google Scholar] [CrossRef]
  29. Meerow, S.; Newell, J.P.; Stults, M. Defining urban resilience: A review. Landsc. Urban Plan. 2016, 147, 38–49. [Google Scholar] [CrossRef]
  30. Ahern, J. From fail-safe to safe-to-fail: Sustainability and resilience in the new urban world. Landsc. Urban Plan. 2011, 100, 341–343. [Google Scholar] [CrossRef]
  31. Leichenko, R. Climate change and urban resilience. Curr. Opin. Environ. Sustain. 2011, 3, 164–168. [Google Scholar] [CrossRef]
  32. Li, D.; Bou-Zeid, E. Synergistic Interactions between Urban Heat Islands and Heat Waves: The Impact in Cities Is Larger than the Sum of Its Parts. J. Appl. Meteorol. Climatol. 2013, 52, 2051–2064. [Google Scholar] [CrossRef]
  33. Cheval, S.; Amihăesei, V.-A.; Chitu, Z.; Dumitrescu, A.; Falcescu, V.; Irașoc, A.; Micu, D.M.; Mihulet, E.; Ontel, I.; Paraschiv, M.-G.; et al. A systematic review of urban heat island and heat waves research (1991–2022). Clim. Risk Manag. 2024, 44, 100603. [Google Scholar] [CrossRef]
  34. Rossman, L.; Huber, W. Storm Water Management Model Reference Manual Volume III—Water Quality; The U.S. Environmental Protection Agency (EPA): Washington, DC, USA, 2016. [Google Scholar]
  35. Zhou, Q. A Review of Sustainable Urban Drainage Systems Considering the Climate Change and Urbanization Impacts. Water 2014, 6, 976–992. [Google Scholar] [CrossRef]
  36. Cutter, S.L.; Boruff, B.J.; Shirley, W.L. Social Vulnerability to Environmental Hazards. Soc. Sci. Q. 2003, 84, 242–261. [Google Scholar] [CrossRef]
  37. UN-Habitat. World Cities Report 2020: The Value of Sustainable Urbanization. UN-Habitat: Nairobi, Kenya, 2020. [Google Scholar]
  38. Batty, M. Digital twins. Environ. Plan. B Urban Anal. City Sci. 2018, 45, 817–820. [Google Scholar] [CrossRef]
  39. Hwang, K.; Schuetze, T.; Amoruso, F.M. Flood Resilient and Sustainable Urban Regeneration Using the Example of an Industrial Compound Conversion in Seoul, South Korea. Sustainability 2020, 12, 918. [Google Scholar] [CrossRef]
  40. Aerts, J.C.J.H.; Botzen, W.J.W.; Emanuel, K.; Lin, N.; de Moel, H.; Michel-Kerjan, E.O. Evaluating Flood Resilience Strategies for Coastal Megacities. Science 2014, 344, 473–475. [Google Scholar] [CrossRef] [PubMed]
  41. Shi, L.; Eric, C.; Debats, J. Explaining Progress in Climate Adaptation Planning Across 156 U.S. Municipalities. J. Am. Plan. Assoc. 2015, 81, 191–202. [Google Scholar] [CrossRef]
  42. Tiboni, M.; Botticini, F.; Sousa, S.; Silva, N. A Systematic Review for Urban Regeneration Effects Analysis in Urban Cores. Sustainability 2020, 12, 9296. [Google Scholar] [CrossRef]
  43. Moufid, O.; Praharaj, S.; Jarar Oulidi, H. Digital technologies in urban regeneration: A systematic review of literature. J. Urban Manag. 2025, 14, 264–278. [Google Scholar] [CrossRef]
  44. Pineda Pinto, M.; Steele, W. Regenerative Urban Development Paradigms in a Time of Climate Change and Ecological Crisis. In Future Cities Making: Mission-Oriented Research for Urban Sustainability Transitions in Australia; Frantzeskaki, N., Moglia, M., Newton, P., Prasad, D., Pineda Pinto, M., Eds.; Springer Nature Singapore: Singapore, 2025; pp. 197–212. [Google Scholar]
  45. European Commission. The European Green Deal, COM(2019) 640 Final. Available online: https://commission.europa.eu/strategy-and-policy/priorities-2019-2024/european-green-deal (accessed on 11 October 2025).
  46. Couch, C.; Sykes, O.; Börstinghaus, W. Thirty years of urban regeneration in Britain, Germany and France: The importance of context and path dependency. Prog. Plan. 2011, 75, 1–52. [Google Scholar] [CrossRef]
  47. Roberts, P.; Sykes, H.; Granger, R.; Roberts, P. Urban Regeneration, 2nd ed.; nSAGE Publications Ltd.: London, UK, 2017. [Google Scholar]
  48. Said, Z.M.; Dindar, S. Key Challenges and Strategies in the Evaluation of Sustainable Urban Regeneration Projects: Insights from a Systematic Literature Review. Sustainability 2024, 16, 9903. [Google Scholar] [CrossRef]
  49. World Bank; Global Platform for Sustainable Cities. Urban Sustainability Framework, 1st ed.; World Bank Group: Washington, DC, USA, 2018. (In English) [Google Scholar]
  50. Olianas, D.; Leotta, M.; Ricca, F.; Biagiola, M.; Tonella, P. STILE: A tool for optimizing E2E web test scripts parallelization. J. Syst. Softw. 2025, 222, 112304. [Google Scholar] [CrossRef]
  51. SUMP-Central Compentence Center (EU). Zubehör. Available online: https://sump-central.eu/de/tools-resources/tools-2/sump-self-assessment-tool/ (accessed on 11 October 2025).
  52. Acevedo-De-los-Ríos, A.; Jones-Pérez, J.; Rondinel-Oviedo, D.R. Methodology for Prioritizing Sustainable Urban Regeneration Interventions in Informal Settlements: Case Study in Lima. Cities 2025, 157, 105550. [Google Scholar] [CrossRef]
  53. Omrany, H.; Ghaffarianhoseini, A.; Ghaffarianhoseini, A.; Clements-Croome, D.J. The uptake of City Information Modelling (CIM): A comprehensive review of current implementations, challenges and future outlook. Smart Sustain. Built Environ. 2023, 12, 1090–1116. [Google Scholar] [CrossRef]
  54. Pereira, A.P.; Prokopiuk, M. Informational Modeling of Cities: Method and Challenges for Institutional Implementation. J. Urban Technol. 2024, 31, 97–115. [Google Scholar] [CrossRef]
  55. Grieves, M. Origins of the Digital Twin Concept. 2016. Available online: https://www.researchgate.net/publication/307509727_Origins_of_the_Digital_Twin_Concept (accessed on 11 October 2025).
  56. VanDerHorn, E.; Mahadevan, S. Digital Twin: Generalization, characterization and implementation. Decis. Support Syst. 2021, 145, 113524. [Google Scholar] [CrossRef]
  57. Puerari, E.; De Koning, J.I.J.C.; Von Wirth, T.; Karré, P.M.; Mulder, I.J.; Loorbach, D.A. Co-Creation Dynamics in Urban Living Labs. Sustainability 2018, 10, 1893. [Google Scholar] [CrossRef]
  58. Iyer-Raniga, U. Using the ReSOLVE framework for circularity in the building and construction industry in emerging markets. IOP Conf. Ser. Earth Environ. Sci. 2019, 294, 012002. [Google Scholar] [CrossRef]
  59. Vanhuyse, F. The Urban Circularity Assessment Framework (UCAF): A Framework for Planning, Monitoring, Evaluation, and Learning from CE Transitions in Cities. Circ. Econ. Sustain. 2024, 4, 1069–1092. [Google Scholar] [CrossRef]
  60. Pegorin, M.C.; Caldeira-Pires, A.; Faria, E. Interactions between a circular city and other sustainable urban typologies: A review. Discov. Sustain. 2024, 5, 14. [Google Scholar] [CrossRef]
  61. Rahmati, Y. Artificial Intelligence for Sustainable Urban Biodiversity: A Framework for Monitoring and Conservation. arXiv 2024, arXiv:2501.14766. [Google Scholar] [CrossRef]
  62. Córdoba Hernández, R.; Camerin, F. Assessment of ecological capacity for urban planning and improving resilience in the European framework: An approach based on the Spanish case. Cuad. De Investig. Geográfica 2023, 49, 119–142. [Google Scholar] [CrossRef]
  63. European Commission. Renovation Wave for Europe—Greening Our Buildings, Creating Jobs, Improving Lives. COM (2020) 662 Final; European Commission: Brussels, Belgium, 2020. [Google Scholar]
  64. Jensen, P.A.; Liane, T.; Paula, F.; Visscher, H. Sustainable building renovation—Strategies and processes. Constr. Manag. Econ. 2022, 40, 157–160. [Google Scholar] [CrossRef]
  65. Khadra, A.; Akander, J.; Myhren, J.A. Sustainable Renovation Practices in Decision-Making for Multi-Family Buildings. Smart Cities 2025, 8, 63. [Google Scholar] [CrossRef]
  66. Yadav, V.; Yadav, N. Beyond Sustainability, Toward Resilience, and Regeneration: An Integrative Framework for Archetypes of Regenerative Innovation. Glob. J. Flex. Syst. Manag. 2024, 25, 849–879. [Google Scholar] [CrossRef]
  67. He, C.; Hou, Y.; Ding, L.; Li, P. Visualized literature review on sustainable building renovation. J. Build. Eng. 2021, 44, 102622. [Google Scholar] [CrossRef]
  68. Ürge-Vorsatz, D.; Petrichenko, K.; Staniec, M.; Antal, M. Best Practice Policies for Low Carbon & Energy Buildings Based on Scenario Analysis; Global Best Practice Network for Buildings: Paris, France, 2012. [Google Scholar]
  69. Sibileau, H.; Broer, R.; Dravecký, L.; Fabbri, M.; Álvarez, X.F.; Kockat, J.; Jankovic, I. DEEP Renovation: Shifting from Exception to s Tandrad Practice in EU Policy; Buildings Performance Institute Europe (BPIE): Brussels, Belgium, 2021. [Google Scholar]
  70. KICT; Korea Institute of Civil Engineering and Building Technology. 2022 KICT Annual Report; Korea Institute of Civil Engineering and Building Technology: Ilsan, Republic of Korea, 2023. [Google Scholar]
  71. Hausfather, Z.; Drake, H.F.; Abbott, T.; Schmidt, G.A. Evaluating the Performance of Past Climate Model Projections. Geophys. Res. Lett. 2020, 47, e2019GL085378. [Google Scholar] [CrossRef]
  72. Ferreiro-Lera, G.-B.; Penas, Á.; del Río, S. Unveiling Deviations from IPCC Temperature Projections through Bayesian Downscaling and Assessment of CMIP6 General Circulation Models in a Climate-Vulnerable Region. Remote Sens. 2024, 16, 1831. [Google Scholar] [CrossRef]
  73. Grimm, N.B.; Faeth, S.H.; Golubiewski, N.E.; Redman, C.L.; Wu, J.; Bai, X.; Briggs, J.M. Global Change and the Ecology of Cities. Science 2008, 319, 756–760. [Google Scholar] [CrossRef]
  74. Oke, T.R. The energetic basis of the urban heat island. Q. J. R. Meteorol. Soc. 1982, 108, 1–24. [Google Scholar] [CrossRef]
  75. Oke, T.R.; Mills, G.; Christen, A.; Voogt, J.A. Urban Climates; Cambridge University Press: Cambridge, UK, 2017. [Google Scholar]
  76. Santamouris, M.; Paolini, R.; Haddad, S.; Synnefa, A.; Garshasbi, S.; Hatvani-Kovacs, G.; Gobakis, K.; Yenneti, K.; Vasilakopoulou, K.; Feng, J.; et al. Heat mitigation technologies can improve sustainability in cities. An holistic experimental and numerical impact assessment of urban overheating and related heat mitigation strategies on energy consumption, indoor comfort, vulnerability and heat-related mortality and morbidity in cities. Energy Build. 2020, 217, 110002. [Google Scholar] [CrossRef]
  77. Mandjoupa, L.K.; Roman, K.K.; Azam, H.; Denis, M. Analyzing Urban Microclimate (UMC) Parameters and Comprehensive Review of UHI and Air Quality Interconnections. Environments 2025, 12, 104. [Google Scholar] [CrossRef]
  78. Virk, G. Designing for the urban climate: An integrated methodology to assess the impact of the urban climate on building performance in the United Kingdom. In The Bartlett School of Environment, Energy and Resources; UCL (University College London): London, UK, 2020. [Google Scholar]
  79. Bruse, M. ENVI-met 3.0: Updated Model Overview. 2004. Available online: https://www.envi-met.net/documents/papers/overview30.pdf (accessed on 11 October 2025).
  80. Schneider, M.; Tötzer, T.; Bügelmayer-Blaschek, M.; Berg, R. Pitfalls and Potentials of Microclimate Simulations in Urban Planning. J. Urban Plan. Dev. 2023, 149, 04023048. [Google Scholar] [CrossRef]
  81. Mosteiro-Romero, M.; Maiullari, D.; Pijpers-van Esch, M.; Schlueter, A. An Integrated Microclimate-Energy Demand Simulation Method for the Assessment of Urban Districts. Front. Built Environ. 2020, 6, 553946. [Google Scholar] [CrossRef]
  82. Mao, J.; Norford, L. Urban Weather Generator: Physics-Based Microclimate Simulation for Performance-Oriented Urban Planning. In Urban Microclimate Modelling for Comfort and Energy Studies; Springer: Cham, Switzerland, 2021; pp. 241–263. [Google Scholar]
  83. Morganti, M.; Ricci, D. Climate Adaptation in Urban Regeneration: A Cross-Scale Digital Design Workflow. In Technological Imagination in the Green and Digital Transition; Springer International Publishing: Cham, Switzerland, 2023. [Google Scholar]
  84. EPFL. CitySim Software. Available online: https://www.epfl.ch/labs/leso/transfer/software/citysim/ (accessed on 11 October 2025).
  85. QGIS. Available online: https://qgis.org/en/site/ (accessed on 11 October 2025).
  86. Du, S.; Zhang, X.; Jin, X.; Zhou, X.; Shi, X. A review of multi-scale modelling, assessment, and improvement methods of the urban thermal and wind environment. Build. Environ. 2022, 213, 108860. [Google Scholar] [CrossRef]
  87. Leone, M.F.; Visconti, C.; Tersigni, E.; Nocerino, G.; Addabbo, N.; Verde, S.; Mills, G.; Pellegrino, M.; Ruggiero, A.; Koutra, S.; et al. Climate-Resilient Urban Planning, Design and Governance Toolkit; UCCRN: New York, NY, USA, 2024. [Google Scholar]
  88. Lim, H.; Jo, S.; Park, S. Analysis of Thermal Environment Modification Effects of Street Trees Depending on Planting Types and Street Directions in Summertime Using ENVI-Met Simulation. J. Korean Inst. Landsc. Archit. 2022, 50, 1–22. [Google Scholar] [CrossRef]
  89. European Commission. Stakeholder Conslutation on the Renovation Wave Initative. Directorate-General for Energy. Directorate C—Renewables, Research and Innovation, Energy Efficiency: European Commisson, 2020. Available online: https://circabc.europa.eu/ui/group/8f5f9424-a7ef-4dbf-b914-1af1d12ff5d2/library/cfe4009f-fa1d-4487-91f0-9b245da50faf/details?open=true (accessed on 11 October 2025).
  90. Santamouris, M. Regulating the damaged thermostat of the cities—Status, impacts and mitigation challenges. Energy Build. 2015, 91, 43–56. [Google Scholar] [CrossRef]
  91. Emmanuel, R.; Krüger, E. Urban heat island and its impact on climate change resilience in a shrinking city: The case of Glasgow, UK. Build. Environ. 2012, 53, 137–149. [Google Scholar] [CrossRef]
  92. Li, Z.; Zhao, Y.; Xia, H.; Xie, S. A multi-objective optimization framework for building performance under climate change. J. Build. Eng. 2023, 80, 107978. [Google Scholar] [CrossRef]
  93. Susca, T.; Pomponi, F. Heat island effects in urban life cycle assessment: Novel insights to include the effects of the urban heat island and UHI-mitigation measures in LCA for effective policy making. J. Ind. Ecol. 2020, 24, 410–423. [Google Scholar] [CrossRef]
  94. Merdymshaeva, E.; Mora, S.; Machida, Y.; Zhang, F.; Duarte, F.; Paul, S.; Ratti, C.; Mörtberg, U. Assessing the impact of greenery on urban heat using opportunistic drive-by sensing. Environ. Plan. B Urban Anal. City Sci. 2025, 52, 1974–1993. [Google Scholar] [CrossRef]
  95. ISO 14040:2006; Environmental Management—Life Cycle Assessment—Principles and Framework. International Organization for Standardization: Geneva, Switzerland, 2006.
  96. EN 15978:2026; Sustainability of Construction Works—Assessment of Environmental Performance of Buildings—Calculation Method. European Committee for Standardization: Brussels, Belgium, 2026.
  97. Vilches, A.; Garcia-Martinez, A.; Sanchez-Montañes, B. Life cycle assessment (LCA) of building refurbishment: A literature review. Energy Build. 2017, 135, 286–301. [Google Scholar] [CrossRef]
  98. Asdrubali, F.; Baldassarri, C.; Fthenakis, V. Life cycle analysis in the construction sector: Guiding the optimization of conventional Italian buildings. Energy Build. 2013, 64, 73–89. [Google Scholar] [CrossRef]
  99. Stephan, A.; Crawford, R.H.; de Myttenaere, K. A comprehensive assessment of the life cycle energy demand of passive houses. Appl. Energy 2013, 112, 23–34. [Google Scholar] [CrossRef]
  100. Komeh, Z.; Hamzeh, S.; Memarian, H.; Attarchi, S.; Alavipanah, S.K. A Remote Sensing Approach to Spatiotemporal Analysis of Land Surface Temperature in Response to Land Use/Land Cover Change via Cloud Base and Machine Learning Methods, Case Study: Sari Metropolis, Iran. Int. J. Environ. Res. 2025, 19, 98. [Google Scholar] [CrossRef]
  101. Ansah, M.K.; Chen, X.; Yang, H.; Lu, L.; Lam, P.T.I. An integrated life cycle assessment of different façade systems for a typical residential building in Ghana. Sustain. Cities Soc. 2020, 53, 101974. [Google Scholar] [CrossRef]
  102. Weng, Q. Remote sensing of impervious surfaces in the urban areas: Requirements, methods, and trends. Remote Sens. Environ. 2012, 117, 34–49. [Google Scholar] [CrossRef]
  103. Voogt, J.A.; Oke, T.R. Thermal remote sensing of urban climates. Remote Sens. Environ. 2003, 86, 370–384. [Google Scholar] [CrossRef]
  104. Lu, Y.; Wu, J.; Liu, M. Decoding the cooling potential of urban green spaces: A cross-city investigation of driving factors in 311 Chinese cities under varying climate zones. Sustain. Cities Soc. 2025, 126, 106410. [Google Scholar] [CrossRef]
  105. Na, N.; Dan, L.; Dandan, X.; Xuhui, N.; Yanqing, L.; Wang, H. Measuring the cooling effects of green cover on urban heat island effects using Landsat satellite imagery. Int. J. Digit. Earth 2024, 17, 2358867. [Google Scholar] [CrossRef]
  106. Han, T.; Du, C.; Xie, Y.; Xian, X.; Zhang, X.; Yang, B.; Chen, Y. A 3D perspective for understanding the mechanisms of urban heat island and urban morphology using multi-modal geospatial data and interpretable machine learning. Build. Environ. 2025, 282, 113184. [Google Scholar] [CrossRef]
  107. Weng, Q. Thermal infrared remote sensing for urban climate and environmental studies: Methods, applications, and trends. ISPRS J. Photogramm. Remote Sens. 2009, 64, 335–344. [Google Scholar] [CrossRef]
  108. Jayasooriya, V.M.; Adams, M.D. From urban heat islands to intra-urban heat islands: Role of urban fabric in redefining microclimates of tomorrow’s compact cities. Energy Build. 2024, 324, 114900. [Google Scholar] [CrossRef]
  109. Ferré-Bigorra, J.; Casals, M.; Gangolells, M. The adoption of urban digital twins. Cities 2022, 131, 103905. [Google Scholar] [CrossRef]
  110. Grimmond, C.S.B.; Oke, T.R. Turbulent Heat Fluxes in Urban Areas: Observations and a Local-Scale Urban Meteorological Parameterization Scheme (LUMPS). J. Appl. Meteorol. 2002, 41, 792–810. [Google Scholar] [CrossRef]
  111. Sibileau, H. Delivering the EPBD: A Guide Towards Better, Affordable and More Resilient Buildings for All in Europe. Buildings Performance Institute Europe: Brussels, Belgium, 2025. [Google Scholar]
  112. Cascone, S.; Parisi, G.; Caponetto, R. BIM-Based Strategies for the Revitalization and Automated Management of Buildings: A Case Study. Sustainability 2024, 16, 6720. [Google Scholar] [CrossRef]
  113. Komarzyńska-Świeściak, E.; Kirschke, K.; Kirschke, P. Timing Circular Regeneration with Adaptive Reuse Potential: A Century of Transformations at the Renoma Department Store, Wroclaw. Sustainability 2025, 17, 11276. [Google Scholar] [CrossRef]
  114. Fayed, L.; Elshater, A.; Rashed, R. Copenhagen: A Model for Regenerative Cities. In Proceedings of the “Architecture and Urbanism: A Smart Outlook” AR_UP 2019, Cairo, Egypt, 14–16 October 2019. [Google Scholar]
  115. Grimmond, S. Urbanization and global environmental change: Local effects of urban warming. Geogr. J. 2007, 173, 83–88. [Google Scholar] [CrossRef]
  116. Palme, M.; Inostroza, L.; Villacreses, G.; Lobato, A.; Carrasco, C. Urban weather data and building models for the inclusion of the urban heat island effect in building performance simulation. Data Brief 2017, 14, 671–675. [Google Scholar] [CrossRef]
  117. Palme, M.; Inostroza, L.; Villacreses, G.; Lobato-Cordero, A.; Carrasco, C. From urban climate to energy consumption. Enhancing building performance simulation by including the urban heat island effect. Energy Build. 2017, 145, 107–120. [Google Scholar] [CrossRef]
  118. Beall, J. Urbanising futures and sustainability: ODS sponsored plenary panel discussion, DSA 2022. Oxf. Dev. Stud. 2023, 51, 1–5. [Google Scholar] [CrossRef]
  119. Oliveira, V.; Silva, M.; Samuels, I. Urban morphological research and planning practice: A Portuguese assessment. Urban Morphol. 2013, 18, 23–39. [Google Scholar] [CrossRef]
  120. Gyucha, A.; Derby Lewis, A.; Solinis Casparius, R.; Piland, N.C.; Alberti, M. Editorial: Shaping the future: Urban resilience and socio-ecological systems through time. Front. Ecol. Evol. 2024, 12, 1392723. [Google Scholar] [CrossRef]
  121. Murshed, S.M.; Duval, A.; Koch, A.; Rode, P. Impact of urban morphology on energy consumption of vertical mobility in Asian cities: A comparative analysis with 3D city models. Urban Sci. 2018, 3, 4. [Google Scholar] [CrossRef]
  122. Li, X.; Zhou, W.; Ouyang, Z. Forty years of urban expansion in Beijing: What is the relative importance of physical, socioeconomic, and neighborhood factors? Appl. Geogr. 2013, 38, 1–10. [Google Scholar] [CrossRef]
  123. Croce, S.; Vettorato, D. Urban surface uses for climate resilient and sustainable cities: A catalogue of solutions. Sustain. Cities Soc. 2021, 75, 103313. [Google Scholar] [CrossRef]
  124. ISO 14040:2006 + Amd 1:2020; Umweltmanagement—Ökobilanz—Grundsätze und Rahmenbedingungen. ISO: Geneva, Switzerland, 2020.
  125. Turner, B.L.; Kasperson, R.E.; Matson, P.A.; McCarthy, J.J.; Corell, R.W.; Christensen, L.; Eckley, N.; Kasperson, J.X.; Luers, A.; Martello, M.L.; et al. A framework for vulnerability analysis in sustainability science. Proc. Natl. Acad. Sci. USA 2003, 100, 8074–8079. [Google Scholar] [CrossRef]
  126. Birkmann, J. Measuring Vulnerability to Natural Hazards: Towards Disaster Resilient Societies, 2nd ed.; United Nations University Press: New York, NY, USA, 2013. [Google Scholar]
  127. Saaty, T.L. The Analytic Hierarchy Process; McGraw-Hill: New York, NY, USA, 1980. [Google Scholar]
  128. Gohaud, E.; Arora, A.S.; Schuetze, T. Urban Form and Sustainable Neighborhood Regeneration—A Multiscale Study of Daegu, South Korea. Sustainability 2025, 17, 4888. [Google Scholar] [CrossRef]
  129. Eum, J.-H.; Kim, K.; Jung, E.-H.; Rho, P. Evaluation and Utilization of Thermal Environment Associated with Policy: A Case Study of Daegu Metropolitan City in South Korea. Sustainability 2018, 10, 1179. [Google Scholar] [CrossRef]
  130. Seo, H.; Jun, B.-W. Analyzing the Driving Forces for the Change of Urban Green Spaces in Daegu with Logistic Regression and Geographical Detector [로지스틱 회귀분석과 지리 탐색기를 이용한 대구시 녹지 변화의 동인 분석]. J. Korean Assoc. Reg. Geogr. 2017, 23, 403–419. [Google Scholar] [CrossRef]
  131. Seong, J.H.; Lee, K.R.; Kwon, Y.S.; Han, Y.K.; Lee, W.H. A Study on Identification of the Heat Vulnerability Area Considering Spatial Autocorrelation—Case Study in Daegu [공간적 자기상관성을 고려한 폭염취약지역 도출에 관한 연구–대구광역시를 중심으로]. J. Korean Soc. Surv. Geod. Photogramm. Cartogr. 2020, 38, 295–304. [Google Scholar]
  132. Daegu Metropolitan Government. Eco-Friendly and Safe Housing Remodelling Projects [친환경·안심 주택 리모델링 사업 백서]; Daegu Metropolitan Government: Daegu, Republic of Korea, 2023. [Google Scholar]
  133. Eum, J.-H.; Scherer, D.; Fehrenbach, U.; Woo, J.-H. Development of an urban landcover classification scheme suitable for representing climatic conditions in a densely built-up Asian megacity. Landsc. Urban Plan. 2011, 103, 362–371. [Google Scholar] [CrossRef]
  134. Kim, J.; Yeom, S.; Hong, T. Analyzing the cooling effect, thermal comfort, and energy consumption of integrated arrangement of high-rise buildings and green spaces on urban heat island. Sustain. Cities Soc. 2025, 119, 106105. [Google Scholar] [CrossRef]
  135. Korea Meteorological Administration. Open MET Data Portal; Korea Meteorological Administration: Seoul, Republic of Korea, 2025. [Google Scholar]
  136. Daegu Metropolitan Government (Ed.) Building Stock Registry and Urban Renovation Database; Daegu Metropolitan Government: Daegu, Republic of Korea, 2023. [Google Scholar]
  137. Eo, S.; Choi, H.-S.; Kim, G.; Lee, G. The Relationship between Surface Temperature and Vegetation Cover Obtained Using Landsat 8 Satellite Imagery—A Case Study of Daegu Metropolitan City. J. Clim. Change Res. 2021, 12, 713–720. [Google Scholar] [CrossRef]
  138. KMA (Ed.) Climatological Normals of Korea and Long-Term Climate Records for Daegu Station. KMA: Seoul, Republic of Korea, 2025. [Google Scholar]
  139. Santamouris, M.; Haddad, S.; Saliari, M.; Vasilakopoulou, K.; Synnefa, A.; Paolini, R.; Ulpiani, G.; Garshasbi, S.; Fiorito, F. On the energy impact of urban heat island in Sydney: Climate and energy potential of mitigation technologies. Energy Build. 2018, 166, 154–164. [Google Scholar] [CrossRef]
  140. Maronga, B.; Winkler, M.; Li, D. Can Areawide Building Retrofitting Affect the Urban Microclimate? An LES Study for Berlin, Germany. J. Appl. Meteorol. Climatol. 2022, 61, 800–817. [Google Scholar] [CrossRef]
  141. Córdoba Hernández, R.; Camerin, F. The application of ecosystem assessments in land use planning: A case study for supporting decisions toward ecosystem protection. Futures 2024, 161, 103399. [Google Scholar] [CrossRef]
  142. KICT (Ed.) Korean Life Cycle Inventory (LCI) Database; KICT: Goyang, Republic of Korea, 2025. [Google Scholar]
Figure 1. Conceptual framework for remote sensing integration in urban climate resilience. Data derived from satellites and UAVs (e.g., Landsat, Sentinel, LiDAR, drone surveys) are processed to extract vegetation indices (NDVI, SAVI, LAI), land surface temperature, and imperviousness metrics. These outputs inform vegetation and urban heat island (UHI) mapping, which are then coupled with GIS analyses and LCA modules. The results feed directly into the DSI to enable scenario-based planning, performance benchmarking, and participatory decision-making.
Land 15 00920 g001
Figure 2. Integrated conceptual framework showing six methodological modules and their interdependencies. Modules 1–4 generate spatial, environmental, and material performance data, which are integrated in Module 5 (vulnerability indexing). Module 6 provides a decision support interface enabling scenario evaluation and stakeholder co-development. The framework incorporates dynamic feedback loops and multi-scale interactions, with stakeholders contributing data, assumptions, and iterative decision inputs.
Land 15 00920 g002
Figure 3. Workflow of the urban microclimate simulation module.
Land 15 00920 g003
Figure 4. Hazard and vulnerability indexing workflow.
Land 15 00920 g004
Figure 5. DSI strategic framework for climate-resilient decision support.
Land 15 00920 g005
Figure 6. Multi-scale climate framework: city, neighborhood, and building.
Land 15 00920 g006
Figure 7. Location of Daegu within the Republic of Korea and schematic overview of the multi-scale evaluation framework applied in the case study. The left panel shows Daegu’s geographic position, the central panel presents a land surface temperature map (reprinted/adapted with permission from Eo et al. [137] Copyright © 2021, The Korean Society of Climate Change Research), to illustrate the local climatic context, and the right panel summarizes the methodological workflow across city, neighborhood, and building-scale analyses used to assess climate exposure, microclimate dynamics, and renovation performance.
Land 15 00920 g007
Table 1. Overview of methodological modules and tools.
ModuleDescriptionKey ToolsOutputs
1. Microclimate SimulationSimulates urban heat, ventilation, and rainfallENVI-met, SWMMHeat maps, flood depth, thermal zones
2. Urban Morphology AnalysisAnalyzes spatial structure and permeabilityQGIS, CIM/BIMVulnerability zones, urban form profiles
3. LCA Component EvaluationAssesses environmental impacts of retrofitsOne Click LCA, OpenLCAEmbodied carbon, material trade-offs
4. Remote SensingMaps vegetation, LST, land coverSentinel-2, Landsat 8, LiDARNDVI, LAI, UHI zones
5. Vulnerability IndexingCombines hazard + social + material dataMCDA, GISHazard–vulnerability matrix, resilience indicators
6. Decision Support InterfaceVisualizes scenarios and KPIsWebGIS, custom dashboardScenario comparisons, participatory planning tools
Table 2. AHP pairwise comparison matrix for vulnerability indexing weights.
CriterionHeat HazardFlood HazardSocial VulnerabilityBuilding SensitivityAdaptive CapacityNorm. Weight
Heat Hazard11/22340.271
Flood Hazard213450.383
Social Vulnerability1/21/31230.175
Building Sensitivity1/31/41/2120.108
Adaptive Capacity1/41/51/31/210.063
Consistency Ratio (CR) = 0.09 < 0.10 → Acceptable (Saaty, 1980 [127]). Weights elicited via structured expert panel (n = 8 specialists in urban planning, climate science, and building engineering). Diagonal values = 1 (self-comparison). Values > 1 indicate row criterion is more important; fractions indicate lesser importance. Note: These weights are indicative for the Daegu context and reflect the city’s specific risk profile (significant UHI + seasonal monsoon flooding). Weights should be re-elicited via the stakeholder AHP procedure when applying the framework to other urban contexts.
Table 3. Indicators for multi-hazard vulnerability assessment.
DimensionIndicator TypeExample Indicators/MetricsData Sources/Tools
HazardHeat stressMaximum daily temperature, UHI intensity, heatwave frequencyENVI-met, Landsat TIRS, KMA, IPCC scenarios
FloodingRainfall intensity, flood depth, runoff volumeSWMM, LiDAR, rainfall gauges, DEMs
DroughtSoil moisture deficit, groundwater level, precipitation anomalyRemote sensing (SMAP, Sentinel-1), KMA
ExposurePopulation and assetsPopulation density, critical infrastructure, housing unitsCensus, GIS layers, urban cadastral maps
Land useResidential vs. commercial share, green space availabilityQGIS, land cover datasets, local planning maps
SensitivityBuilding typologyAge of structures, material type, insulation levelBIM/CIM databases, building registries
Infrastructure conditionDrainage system age/capacity, road permeabilityMunicipal engineering datasets
Adaptive CapacityGovernance and servicesEmergency response capacity, planning regulations, governance integration capabilityCity policy documents, UN-Habitat frameworks
Socio-economic factorsHousehold income, education, health accessHousehold surveys, census data
Green/blue infrastructureVegetation cover %, water retention areasNDVI, LAI, GIS-based land cover maps
Table 4. Integrated data framework for climate-resilient urban planning.
Input Data SourcesProcessing/IntegrationOutputs/VisualizationsUser Functions
Microclimate simulations (ENVI-met, SWMM)Scenario-based modeling of heat stress, runoff, and comfort zonesInteractive heat and flood mapsExplore spatial risk zones under different climate scenarios
Urban morphology (GIS, CIM/BIM)Cross-scale integration of building typologies and land useVulnerability zoning and 3D urban profilesIdentify priority regeneration districts and renovation clusters
LCA evaluations (One Click LCA, OpenLCA)Benchmarking material and retrofit strategies against ISO standardsComparative embodied carbon and energy-use indicatorsCompare retrofit measures by cost, carbon footprint, and resilience benefits
Remote sensing (Sentinel-2, Landsat, LiDAR)Vegetation and land surface temperature mappingNDVI/LAI overlays with UHI hotspotsAssess urban greening and track vegetation health over time
Hazard and vulnerability indexing (MCDA, GIS)Integration of hazard, infrastructure, and socio-demographic dataComposite hazard–vulnerability matricesPrioritize interventions by combining physical risk with social vulnerability
Stakeholder inputs (surveys, participatory workshops)Participatory scenario explorationMulti-criteria strategy evaluationEnable collaborative decision-making and community-informed planning
Table 5. Summary of input datasets used.
DomainData Sources/ToolsApplication
MacroclimateMeteonorm, KMA (Korea Meteorological Administration), IPCC SSP2/SSP5 scenariosMacroclimate simulation, heatwave and rainfall analysis
Urban MorphologyAW3D30 (30 m DSM), Natural Earth, Copernicus Urban AtlasUrban structure analysis, permeability mapping
Remote SensingSentinel-2 (NDVI, SAVI), Landsat 8 TIRS (LST), MODIS, LiDAR (vegetation height models)Vegetation, LST, surface materials
InfrastructureMunicipal GIS (e.g., Daegu Urban Platform), QGIS, open street dataDrainage, road, green space networks
BuildingsRevit BIM models, CIM platforms, building energy audits, material inventoriesRetrofit scenarios, façade/roof catalogue, LCA inputs
Simulation ToolsENVI-met, SWMM, OpenLCA, Rhino/Grasshopper (Ladybug Tools), InVEST ToolkitModeling heat and flood, runoff, environmental impacts
Table 6. Uncertainty sources and sensitivity framework by module.
ModuleKey Uncertain ParametersPrimary Uncertainty SourcesMagnitude RangeMitigation/Sensitivity Approach
M1- ENVI-met (Microclimate)Leaf Area Index (LAI)
Surface albedo
Building geometry
Meteorological forcing
Vegetation parameterization; sensor measurement error; boundary condition assumptionsLAI: ±0.5 m2/m2 Albedo: ±0.05–0.10 Wind speed: ±10–20%UAV-derived canopy data for LAI; satellite albedo retrieval; ensemble runs with 3 met. scenarios (historical, SSP2–4.5, SSP5–8.5)
M1- SWMM (Hydrology)Manning roughness coefficient
Infiltration rates
Pipe capacity
Rainfall input
Soil variability; aging infrastructure; sub-daily rainfall uncertaintyManning n: ±15–25% Infiltration: ±30% Design rainfall: ±20%OAT sensitivity on Manning n and infiltration; comparison against 3 historical flood events; Monte Carlo sampling for design storms
M3- LCAEcoinvent background data
Allocation method
Transport distances
Service life assumption
Database vintage; allocation choices; local vs. global supply chainGHG: ±15–30% for key materials Primary energy: ±10–25%Sensitivity run comparing cut-off vs. 100% burden allocation; ±20% service life variation (40/50/60 yr); regional Korean ecoinvent adaptation
M4- Remote SensingAtmospheric correction
Sensor calibration
Seasonal variability
Spatial resolution mismatch
Cloud cover; sensor degradation; temporal compositingLST: ±1–2 °C NDVI: ±0.05–0.08Multi-temporal composites (5-image median); cross-validation with KMA ground stations and UAV thermal survey; inter-sensor harmonization (Landsat 8 and 9)
M5- Vulnerability Indexing (MCDA/AHP)Indicator weights
Socio-demographic data vintage
Indicator normalization method
Subjectivity in expert elicitation; data currency; sensitivity to normalization choiceAHP consistency ratio: CR < 0.10 Weight variation: ±20% for top 2 criteriaPCA-based weight validation; CR threshold check; ±20% OAT weight sensitivity on heat and flood hazard dimensions; comparison of min–max vs. z-score normalization
System-level (Propagated)Upstream module outputs feed downstream calculations (e.g., ENVI-met temperatures → LCA thermal load; SWMM drainage → vulnerability index)Compounding uncertainties across module interfaces; assumptions in data translationCascade amplification estimated at ±20–35% for compound outputsBounding scenario analysis (optimistic/central/pessimistic) across all modules simultaneously; flagged as priority for full probabilistic validation in future work
Note: Full probabilistic uncertainty quantification (e.g., Monte Carlo simulation across all modules simultaneously) is identified as a priority task for the next phase of framework development and full empirical validation. The bounding scenario approach provides a pragmatic interim alternative for the current conceptual framework stage.
Table 7. Daegu baseline characterization—key climate and built environment indicators.
IndicatorBaseline ValueSourceData Origin
UHI intensity (summer peak)Up to +5.8 °C above rural surroundings (Daegu city center vs. Mt. Palgong reference)[131,137] LST map (Landsat 8 TIRS)/KMA station records
Mean summer land surface temp.34–42 °C (urban core); 28–33 °C (suburban fringe)—July average[137]Landsat 8 TIRS Band 10 composites
Share of pre-1990 residential buildings~50% of total residential building stock (est. 180,000+ units)[136]City building registry [129]
Share with inadequate thermal insulation~60–70% of pre-1990 stock lacks current KS F 2278 insulation standards[136]City renovation database
Green coverage ratio (NDVI > 0.3)~18% of urban core area (Daegu-gu, Jung-gu combined)[137]Sentinel-2 NDVI composite (2022)
Annual rainfall~1600 mm/yr (70% concentrated June–August monsoon)[138]KMA Daegu station (long-term average)
Stormwater drainage design standard10-year return period design capacity (most central districts)[132,136]Municipal engineering records
Projected rainfall intensification (SSP5–8.5, 2050)+15–25% increase in 1 h design rainfall intensity[9,138]Downscaled CMIP6 ensemble
Historic heat record40.0 °C (August 2018)—national record high[138]KMA station records
Projected mean summer temp. increase (SSP2–4.5, 2050)+1.5–2.2 °C above 1990 baseline[9,72] CMIP6 downscaling for Daegu region
Table 8. Scenario-based assessment for the Daegu case study.
KPIUnitBaseline (No Intervention)Scenario A UHI Mitigation (Green + Reflective)Scenario B Flood Management (Permeable + SUDS)Scenario C Deep Renovation (Integrated)Reference Sources
UHI Surface Temp. Reduction°C above baseline01.5–3.00.5–1.52.5–4.0[76]; ENVI-met benchmarks
Pedestrian Thermal Comfort (PET reduction)°C PET02.0–4.00.5–1.53.0–5.0ENVI-met literature
Stormwater Runoff Reduction% of rainfall010–2040–6030–50SWMM modeling benchmarks [35]
Peak Flow Attenuation% reduction05–1530–5020–35[35,108]
Heating Energy SavingskWh/m2/yr00–50–525–45[68,69]
Cooling Energy SavingskWh/m2/yr010–202–820–35[139]
Embodied Carbon (materials)kg CO2-eq/m2020–4540–12060–150[99,101]
Life cycle CO2 Savings (50 yr)kg CO2-eq/m2/yr03–81–420–40[69,99]
Estimated Implementation CostUSD/m280–20040–120150–350[64,101]
Primary Modules AppliedM1, M3, M4M1, M3, M5M1–M6 (all)This framework
Disclaimer/Publisher’s Note: The statements, opinions and data contained in all publications are solely those of the individual author(s) and contributor(s) and not of MDPI and/or the editor(s). MDPI and/or the editor(s) disclaim responsibility for any injury to people or property resulting from any ideas, methods, instructions or products referred to in the content.