1. Introduction
Urbanization and climate change heighten pluvial flooding risks and deteriorate stormwater quality in cities worldwide [
1,
2]. The IPCC Sixth Assessment Report reports a high-confidence increase in the frequency and severity of heavy precipitation events across many urban regions. In highly impervious urban environments, where drainage systems often exceed their design capacity, reliance on conventional gray infrastructure alone is no longer adequate to achieve multiple objectives simultaneously, including runoff reduction, detention, purification, ecological restoration, and improved urban livability [
3,
4]. As a result, nature-based and process-oriented approaches, such as low-impact development (LID), sustainable urban drainage systems, and blue–green infrastructure (GI), have become increasingly important in modern urban water governance [
3,
5].
Through the national Sponge City policy framework, China has institutionalized this transition. Following the 2014 launch of central fiscal support for Sponge City pilot projects and the 2015 national guidelines subsequently issued, Sponge City development has evolved from a pilot-based policy experiment into a broader state-led agenda for urban resilience, ecological infrastructure construction, and integrated stormwater governance [
3,
6]. The policy target to have over 80% of urban built-up areas meet Sponge City standards by 2030 represents a technical adjustment in drainage policy and a broader shift from rapid discharge toward source control, distributed retention, and integrated runoff management [
2,
5].
However, although Sponge City projects in China operate under a broadly similar policy framework and technical terminology, their outcomes vary significantly across flood prevention, long-term maintenance, governance coordination, and social co-benefits [
1,
2,
6]. Current studies suggest that engineering design alone cannot explain such differences. Institutional factors, including cross-agency coordination, financing arrangements, and the construction and maintenance relationship, shape implementation capacity, whereas social factors, such as information accessibility, procedural fairness, feedback incorporation, and community recognition, may critically affect long-term project legitimacy and public value [
2,
6,
7]. Despite wide recognition of importance, public participation remains insufficiently operationalized in comparative Sponge City research.
There are two particularly important methodological gaps. First, a structured, comparable framework for measuring public participation across the entire project life cycle is still lacking. Current studies often merely identify whether participation occurs, seldom capturing its differences across planning, design, construction, and maintenance [
8,
9]. Second, in large project portfolios, such as those in national Sponge City pilot cities, representative projects are frequently selected implicitly or conveniently rather than through a transparent and auditable procedure [
10]. This reduces cross-case comparability and the credibility of the inferential chain connecting project-level findings to broader governance interpretation [
10,
11].
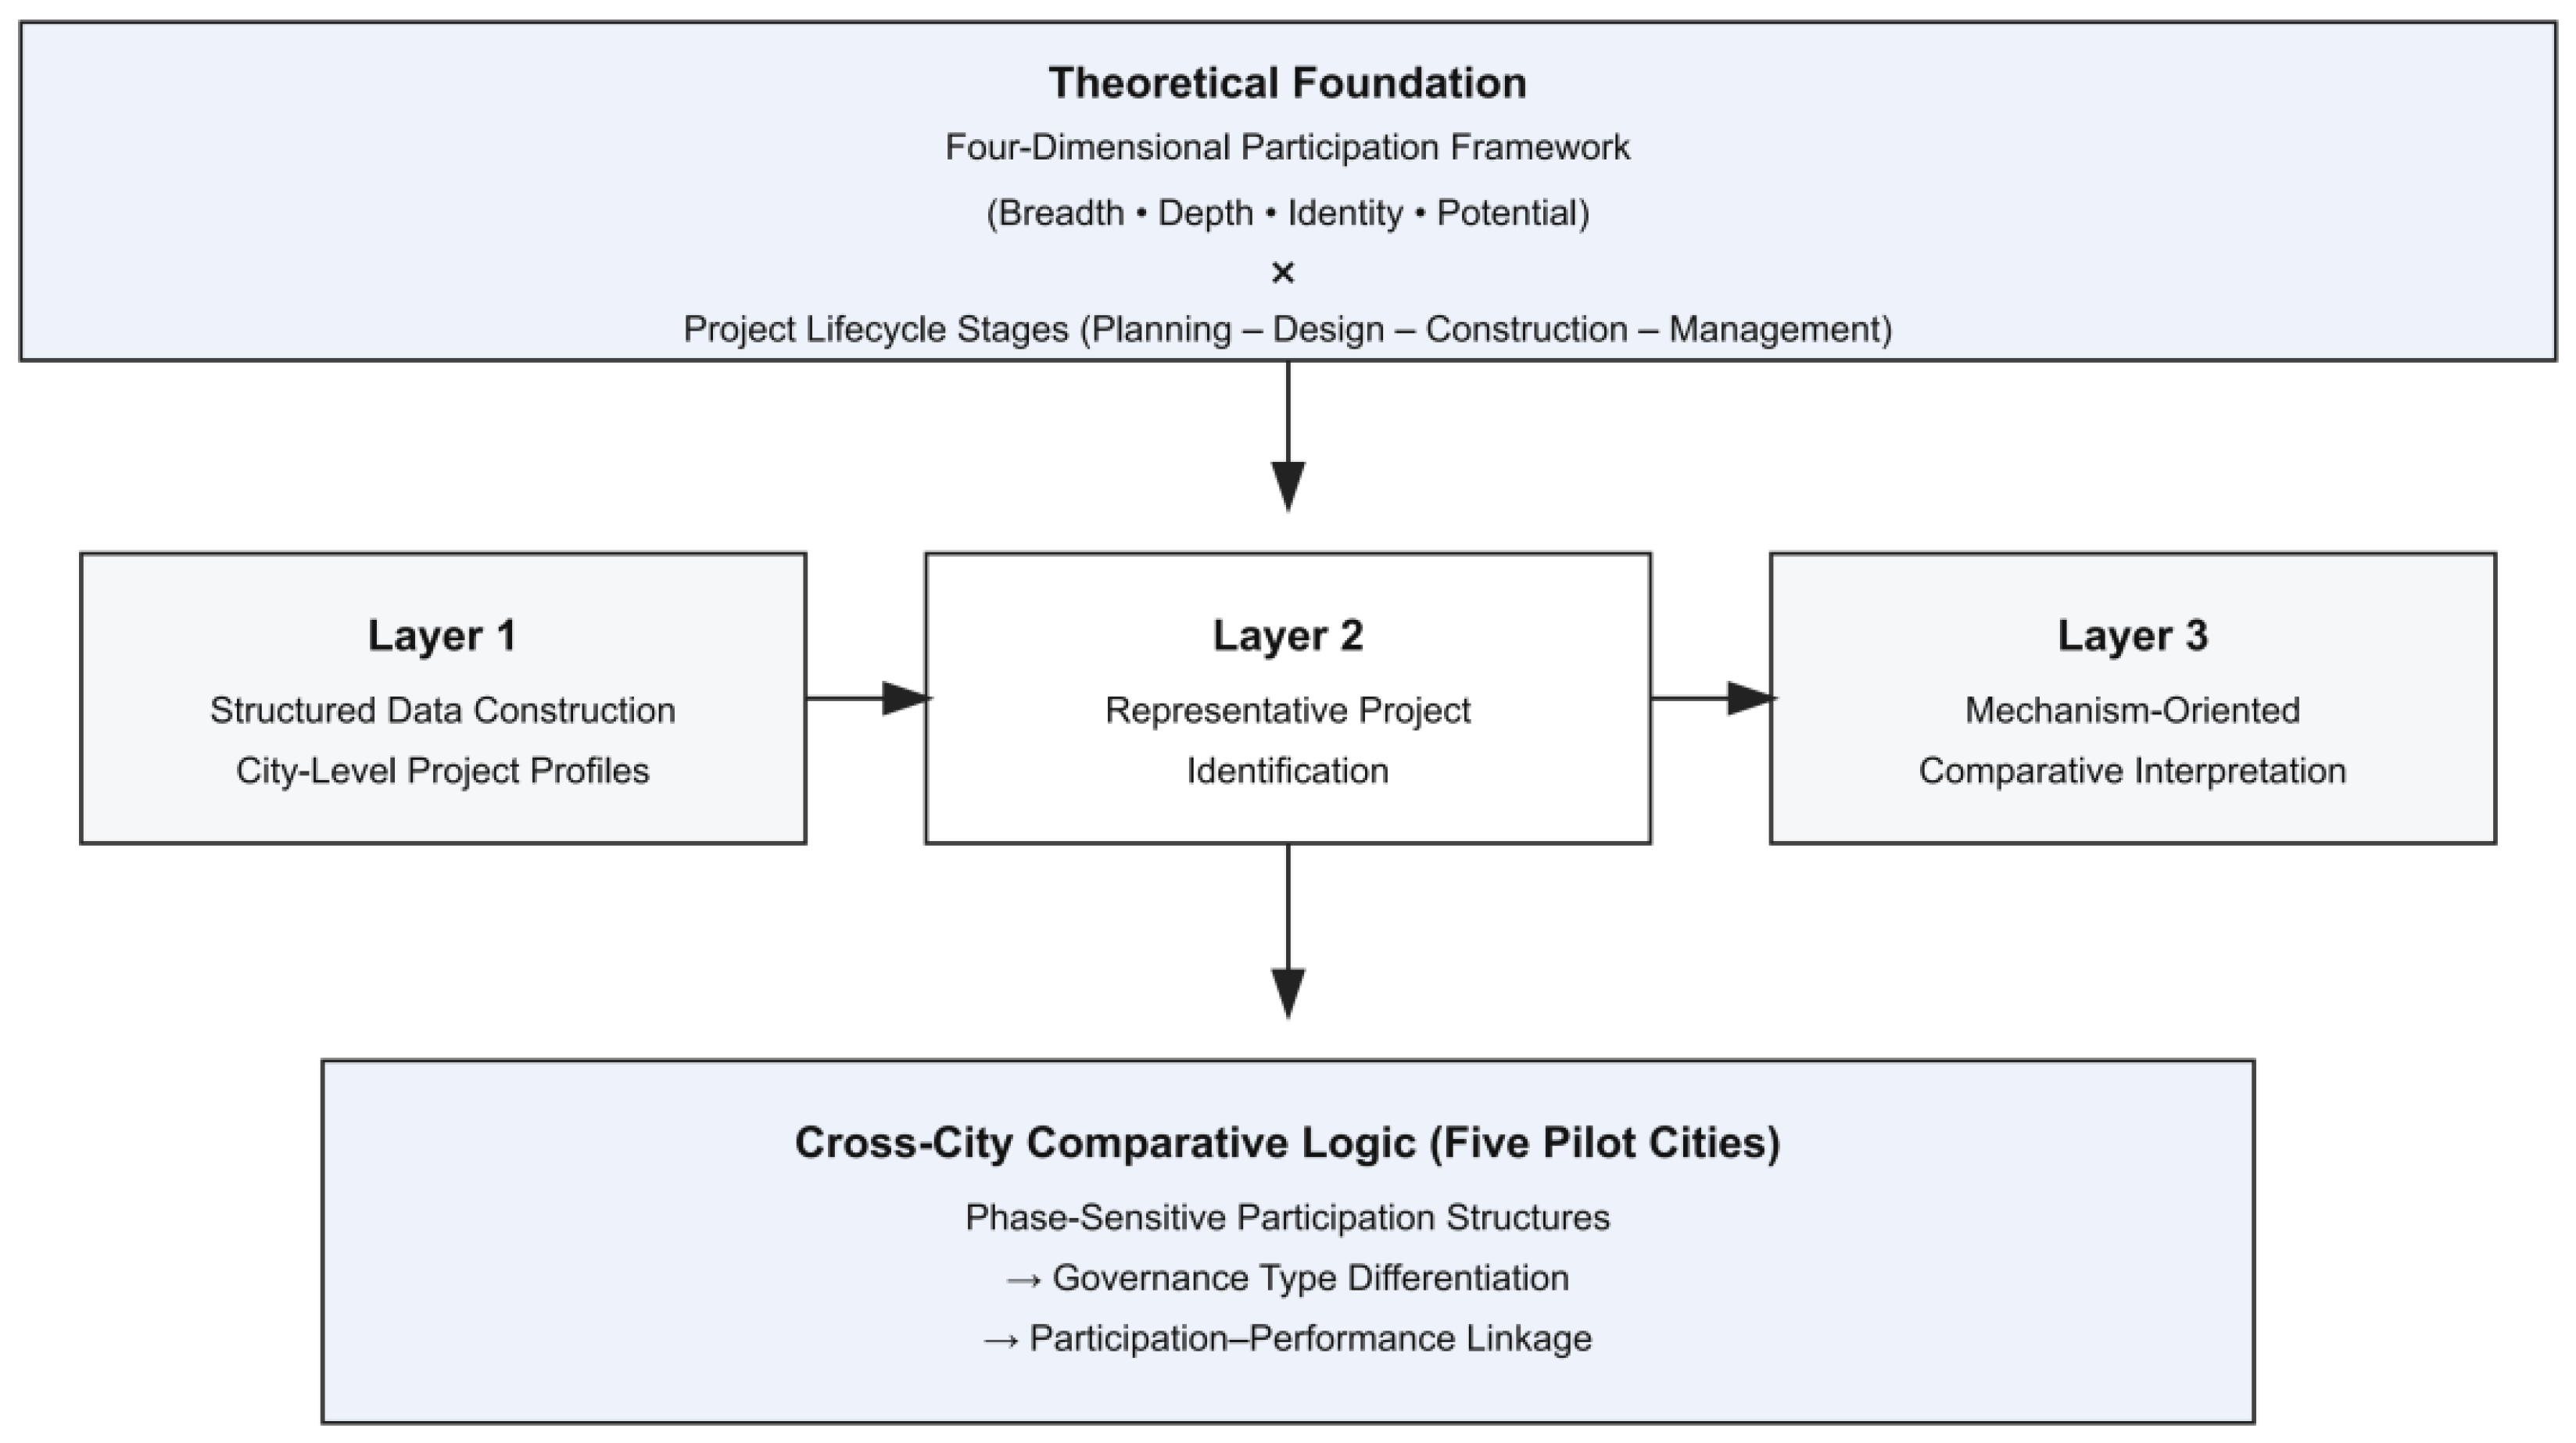
To address these gaps, this study develops a cross-city comparative framework for analyzing public participation in Sponge City projects, comprising three linked components: data construction, representative project identification, and mechanism interpretation. First, to create auditable city-level project profiles, structured project databases and multisource evidence bundles are assembled. Second, typology-based screening and multicriteria decision procedures are used to identify representative projects within each city. Third, public participation is evaluated across the full project life cycle, with the resulting differences interpreted in relation to broader governance configurations (
Figure 1).
In this study, the analytical framework used is based on four participation dimensions: breadth, depth, identity, and potential [
12]. Here, breadth refers to the participating actors’ inclusiveness and diversity; depth to the degree of substantive influence on decisions and project processes; identity to recognition, attachment, and the perceived legitimacy of public involvement; and potential to the institutional, organizational, and resource conditions enabling sustained participation across the project life cycle [
12]. Based on this framework, participation is operationalized using 16 indicators spanning the four dimensions. Specifically, participation breadth comprises B1–B4, participation depth comprises D1–D4, participation identity comprises I1–I4, and participation potential comprises P1–P4. The full operational definitions and indicator names are reported in
Supplementary Table S1. These indicators and their AHP-calibrated weights were derived from a prior expert-driven framework-building study on public participation in Sponge City and GI/LID governance [
13]. They are retained in the present study to ensure conceptual consistency and analytical transferability. The 16 indicators function as a standardized diagnostic tool to examine how participation is documented, institutionalized, and sustained across planning, design, construction, and maintenance.
Instead of treating participation as a static project attribute, this study understands it as a life cycle-sensitive governance structure. The key analytical concern is therefore not simply whether participation exists but how different forms of participation are configured across stages, made visible in documentary evidence, and differentiated across projects under varying governance conditions. This perspective enables a shift from simple absence judgments toward a more structured interpretation of participation within Sponge City governance.
The study focuses on five national Sponge City pilot cities, Jinan, Shanghai, Xiamen, Shenzhen, and Wuhan, combining policy comparability with substantial contextual diversity. These cities provide a suitable basis for analyzing variation in participation under a shared national framework but across different hydro-climatic, spatial, and governance conditions. Based on this design, the article addresses three related questions:
(1) What common patterns and cross-city differences appear in participation structures across the planning, design, construction, and maintenance stages of representative Sponge City projects?
(2) How can representative projects be identified from city-level project portfolios using a transparent and auditable procedure?
(3) How do different participation configurations illustrate broader governance strengths and weaknesses across project types and institutional settings?
There are three contributions in this study. First, public participation is reframed as a life cycle-sensitive governance structure rather than a static or binary project attribute. Second, a replicable and auditable approach is suggested for representative project identification in cross-city Sponge City research. Third, empirically grounded evidence is provided for improving participation design, institutionalized co-governance, and long-term maintenance resilience under different urban governance conditions.
2. Literature Review
2.1. Evidence-Based Evaluation of Governance and Participation
A well-established methodological approach to evaluating governance-related constructs includes plan and policy content analysis, together with plan quality evaluation [
14,
15,
16]. These approaches are especially pertinent to Sponge City research by framing evaluation as a measurement problem instead of purely subjective interpretation. In other words, governance is assessed through standardized evidence retrieval, explicit coding instruments, and transparent reliability checks, instead of just through narrative description. This approach is particularly useful for the present study for comparing public participation across cities, projects, and stages of the project life cycle.
Three principles from this tradition are directly applicable to evaluating public participation in Sponge City projects. First, standardized retrieval protocols, including fixed sources, predefined keywords, and minimum search intensity, can enhance cross-case comparability and reduce idiosyncratic evidence selection [
15,
16]. Second, using coding manuals and anchored rubrics can operationalize abstract governance concepts, translating dimensions such as transparency, accountability, feedback responsiveness, and institutional support into observable and auditable criteria [
17,
18]. Third, the documentary evaluation rigor can be strengthened through independent coding and reporting of interrater reliability, such as weighted kappa or intraclass correlation coefficients, limiting subjective bias and improving methodological transparency [
19,
20].
This methodological perspective is particularly applicable to Sponge City governance because public participation and governance arrangements typically generate documentary traces at every stage of the project life cycle. Such traces comprise policy and institutional documents, procurement and contracting records, construction and maintenance arrangements, public consultation notices, official response logs, and feedback incorporation evidence [
21,
22]. These materials enable participation to be assessed not only as being present or absent but also as an auditable governance structure with identifiable implementation features. In this sense, an evidence-based approach does not presuppose the absence of undocumented participation, rather emphasizing what can be systematically observed, verified, and compared across cases.
At the same time, documentary traces are not neutral administrative byproducts; rather, governance modes and delivery arrangements frequently influence their visibility and timing. For example, government-led delivery may institutionalize participation through disclosure requirements and formal consultation routines, as opposed to contract-based accountability, third-party oversight, and performance reporting in public–private partnership (PPP) or quasi-market arrangements [
23]. Recognizing these governance effects is critical as the study not only aims to measure participation but also to analyze structural variations in participation under different institutional conditions.
2.2. Sponge City Assessment
The Sponge City and GI/LID literature offers diverse tools for evaluating engineering and ecological outcomes, frequently utilizing indicator systems and multicriteria decision analysis (MCDA). These studies have provided significant contributions to evaluating runoff control, water quality improvement, ecological co-benefits, and construction performance. However, the social dimension of Sponge City projects has often been treated in a much narrower scope. Instead of treating public participation as a structured governance construct that changes throughout the project life cycle, many studies approximate it using through public awareness, willingness to pay, satisfaction, acceptance, or general willingness to [
24,
25,
26]. Consequently, existing frameworks lack ability to explain the variation in participation across planning, design, construction, and maintenance or its connection to governance arrangements.
This limitation aligns precisely to the first methodological gap outlined in the Introduction. R public participation is reduced to attitudinal or binary proxies, it becomes difficult to capture its stage-sensitive functions or enable systematic cross-case comparison. Hence, using an operational participation instrument becomes necessary. Here, participation is conceptualized not as a single attribute but as a multidimensional governance structure. Adopting the four-dimensional framework of Yuan and Kim participation is understood through breadth, depth, identity, and potential. Breadth concerns the inclusiveness and diversity of participating actors; depth refers to the degree of substantive influence on decisions and project processes; identity pertains to recognition, attachment, and the perceived legitimacy of public involvement; and potential denotes the institutional and resource conditions that sustain participation throughout the project life cycle [
12]. Utilizing this framework, the 16-indicator system developed for this study offers a standardized approach to evaluate how participation is documented, institutionalized, and sustained across planning, design, construction, and maintenance.
A second limitation in existing literature is that much empirical Sponge City research still depends on single-city studies, prominent demonstration cases, or convenience-based case choice. Despite valuable local insights offered by such studies, they frequently provide limited justification for treating a specific case as representative of a broader project portfolio. As established in case study methodology, convenience-oriented selection often leads to bias and weakens the inferential logic of comparative analysis [
27]. This limitation holds particularly significance in Sponge City research, where each pilot city often includes multiple projects with different types, delivery modes, evidence conditions, and governance arrangements.
Resolving this issue requires a portfolio-aware design: first, constructing a within-city project inventory as a documented universe of candidate cases; second, defining explicit representativeness criteria consistent with the study’s analytical purpose; and third, utilizing a transparent selection procedure to identify structurally representative projects [
27,
28]. In this sense, representative project selection should be considered as part of the methodological contribution of the study itself rather than as an informal primary step. This is particularly relevant because while comparing participation structures across cities, this study maintains an auditable inference chain from project identification to mechanism interpretation.
Taken together, the literature validates the three-part analytical logic of this study. First, evidence-based evaluation traditions establishes a rigorous foundation for data construction through standardized retrieval, auditable evidence archiving, and anchored scoring. Second, representative case selection research justifies using within-city project inventories and transparent screening procedures for selection bias reduction. Third, Yuan and Kim’s [
12] four-dimensional participation framework provides the conceptual basis for measuring participation as a life cycle-sensitive governance structure. Collectively, these strands facilitate the transition from documentary evidence to cross-city comparison, ultimately enabling a more rigorous interpretation of the variation in participation structures across projects, governance modes, and urban contexts.
3. Methodology
The analytical framework (
Figure 1) is translated into a three-stage workflow, comprising data construction, representative project selection, and mechanism interpretation. The methodological objective is to generate auditable, cross-city comparable diagnostics of public participation across all stages of Sponge City and LID projects. Toward this goal, the first stage of this study involves constructing within-city project inventories from 2015 to 2025 and establishing a standardized Evidence Log to archive multisource documentary evidence. Then, it applies a constrained MCDA procedure to identify one structurally representative project from each city. Finally, participation is measured using a multidimensional measurement instrument, producing life cycle-sensitive diagnostics supported by explicit missing-evidence rules and interrater reliability checks. This workflow directly bridges the two methodological gaps identified in the Introduction: the absence of a longitudinal, quantitative participation framework and the lack of a transparent, representative case selection procedure for large project portfolios.
3.1. Site Selection
3.1.1. Study Area and Sampling Frame: Five-City Selection
Case city selection is a strategic design decision in comparative research because it determines the analytical robustness of subsequent findings. In China’s Sponge City program, given the coexistence of a unified national policy framework and substantial regional heterogeneity, case selection must simultaneously satisfy two conditions: institutional comparability and contextual diversity. In China, the Sponge City initiative was formally institutionalized in 2014 through the joint issuance of the Notice on Launching Central Fiscal Support for Sponge City Pilot Projects by the Ministry of Finance, the Ministry of Housing and Urban-Rural Development, and the Ministry of Water Resources [
29]. The policy established a competitive pilot mechanism with central fiscal incentives and performance-based evaluation. The General Office of the State Council issued the subsequent Guidelines on Promoting Sponge City Construction establishing runoff volume control targets and formalized evaluation criteria nationwide [
30]. By focusing exclusively on national pilot cities, this study establishes a shared institutional baseline, minimizing regulatory variance and enhancing cross-city comparability [
30,
31].
Within Despite this shared institutional framework, Chinese cities show significant hydro-climatic and morphological heterogeneity. Under the East Asian monsoon regime, highly seasonal precipitation is coupled with intensifying extreme rainfall observed across many urban regions [
31]. Consequently, rapid urbanization, impervious surface expansion, and constrained drainage retrofitting amplify pluvial flooding risks [
3,
20]. Coastal storm surges and tidal backwater effects intensify rainfall-induced flooding, while inland river–lake systems create basin-scale hydrological complexity and coordination challenges. These environmental characteristics are conceptualized as governance stress conditions rather than as contextual background. Higher rainfall intensity, compound hazards, and complex watershed morphology necessitate increased demands for interdepartmental coordination, maintenance capacity, and stakeholder engagement, thereby providing analytically significant variation to examine life cycle participation configurations across different stress environments.
Against this backdrop, Jinan, Shanghai, Xiamen, Shenzhen, and Wuhan were selected from the national Sponge City pilot framework to represent structured diversity in climatic zones, hydrological settings, and governance modes [
1,
6]. Jinan, characterized by concentrated summer precipitation and spring-fed catchment like the Damming Lake, illustrates the challenges of retrofitting drainage infrastructure in dense, historic urban areas [
1]. As a low-lying deltaic megacity in the Yangtze River Delta, Shanghai faces compound pluvial and tidal risks through systematic city-wide implementation supported by integrated digital governance platforms [
3,
4,
6]. Xiamen exemplifies rapid coastal expansion in a typhoon-prone, subtropical marine environment, paired with increasingly institutionalized acceptance procedures and maintenance standards [
4,
6]. With over 1900 mm of annual rainfall, Shenzhen has implemented PPP arrangements that prioritize integrated plant-network drainage management in designated pilot areas [
4,
6,
11,
32]. Situated in a dense river–lake network and historically vulnerable to large-scale flooding, Wuhan has implemented demonstration-area contrasts to test coordinated basin-scale governance approaches [
11,
21].
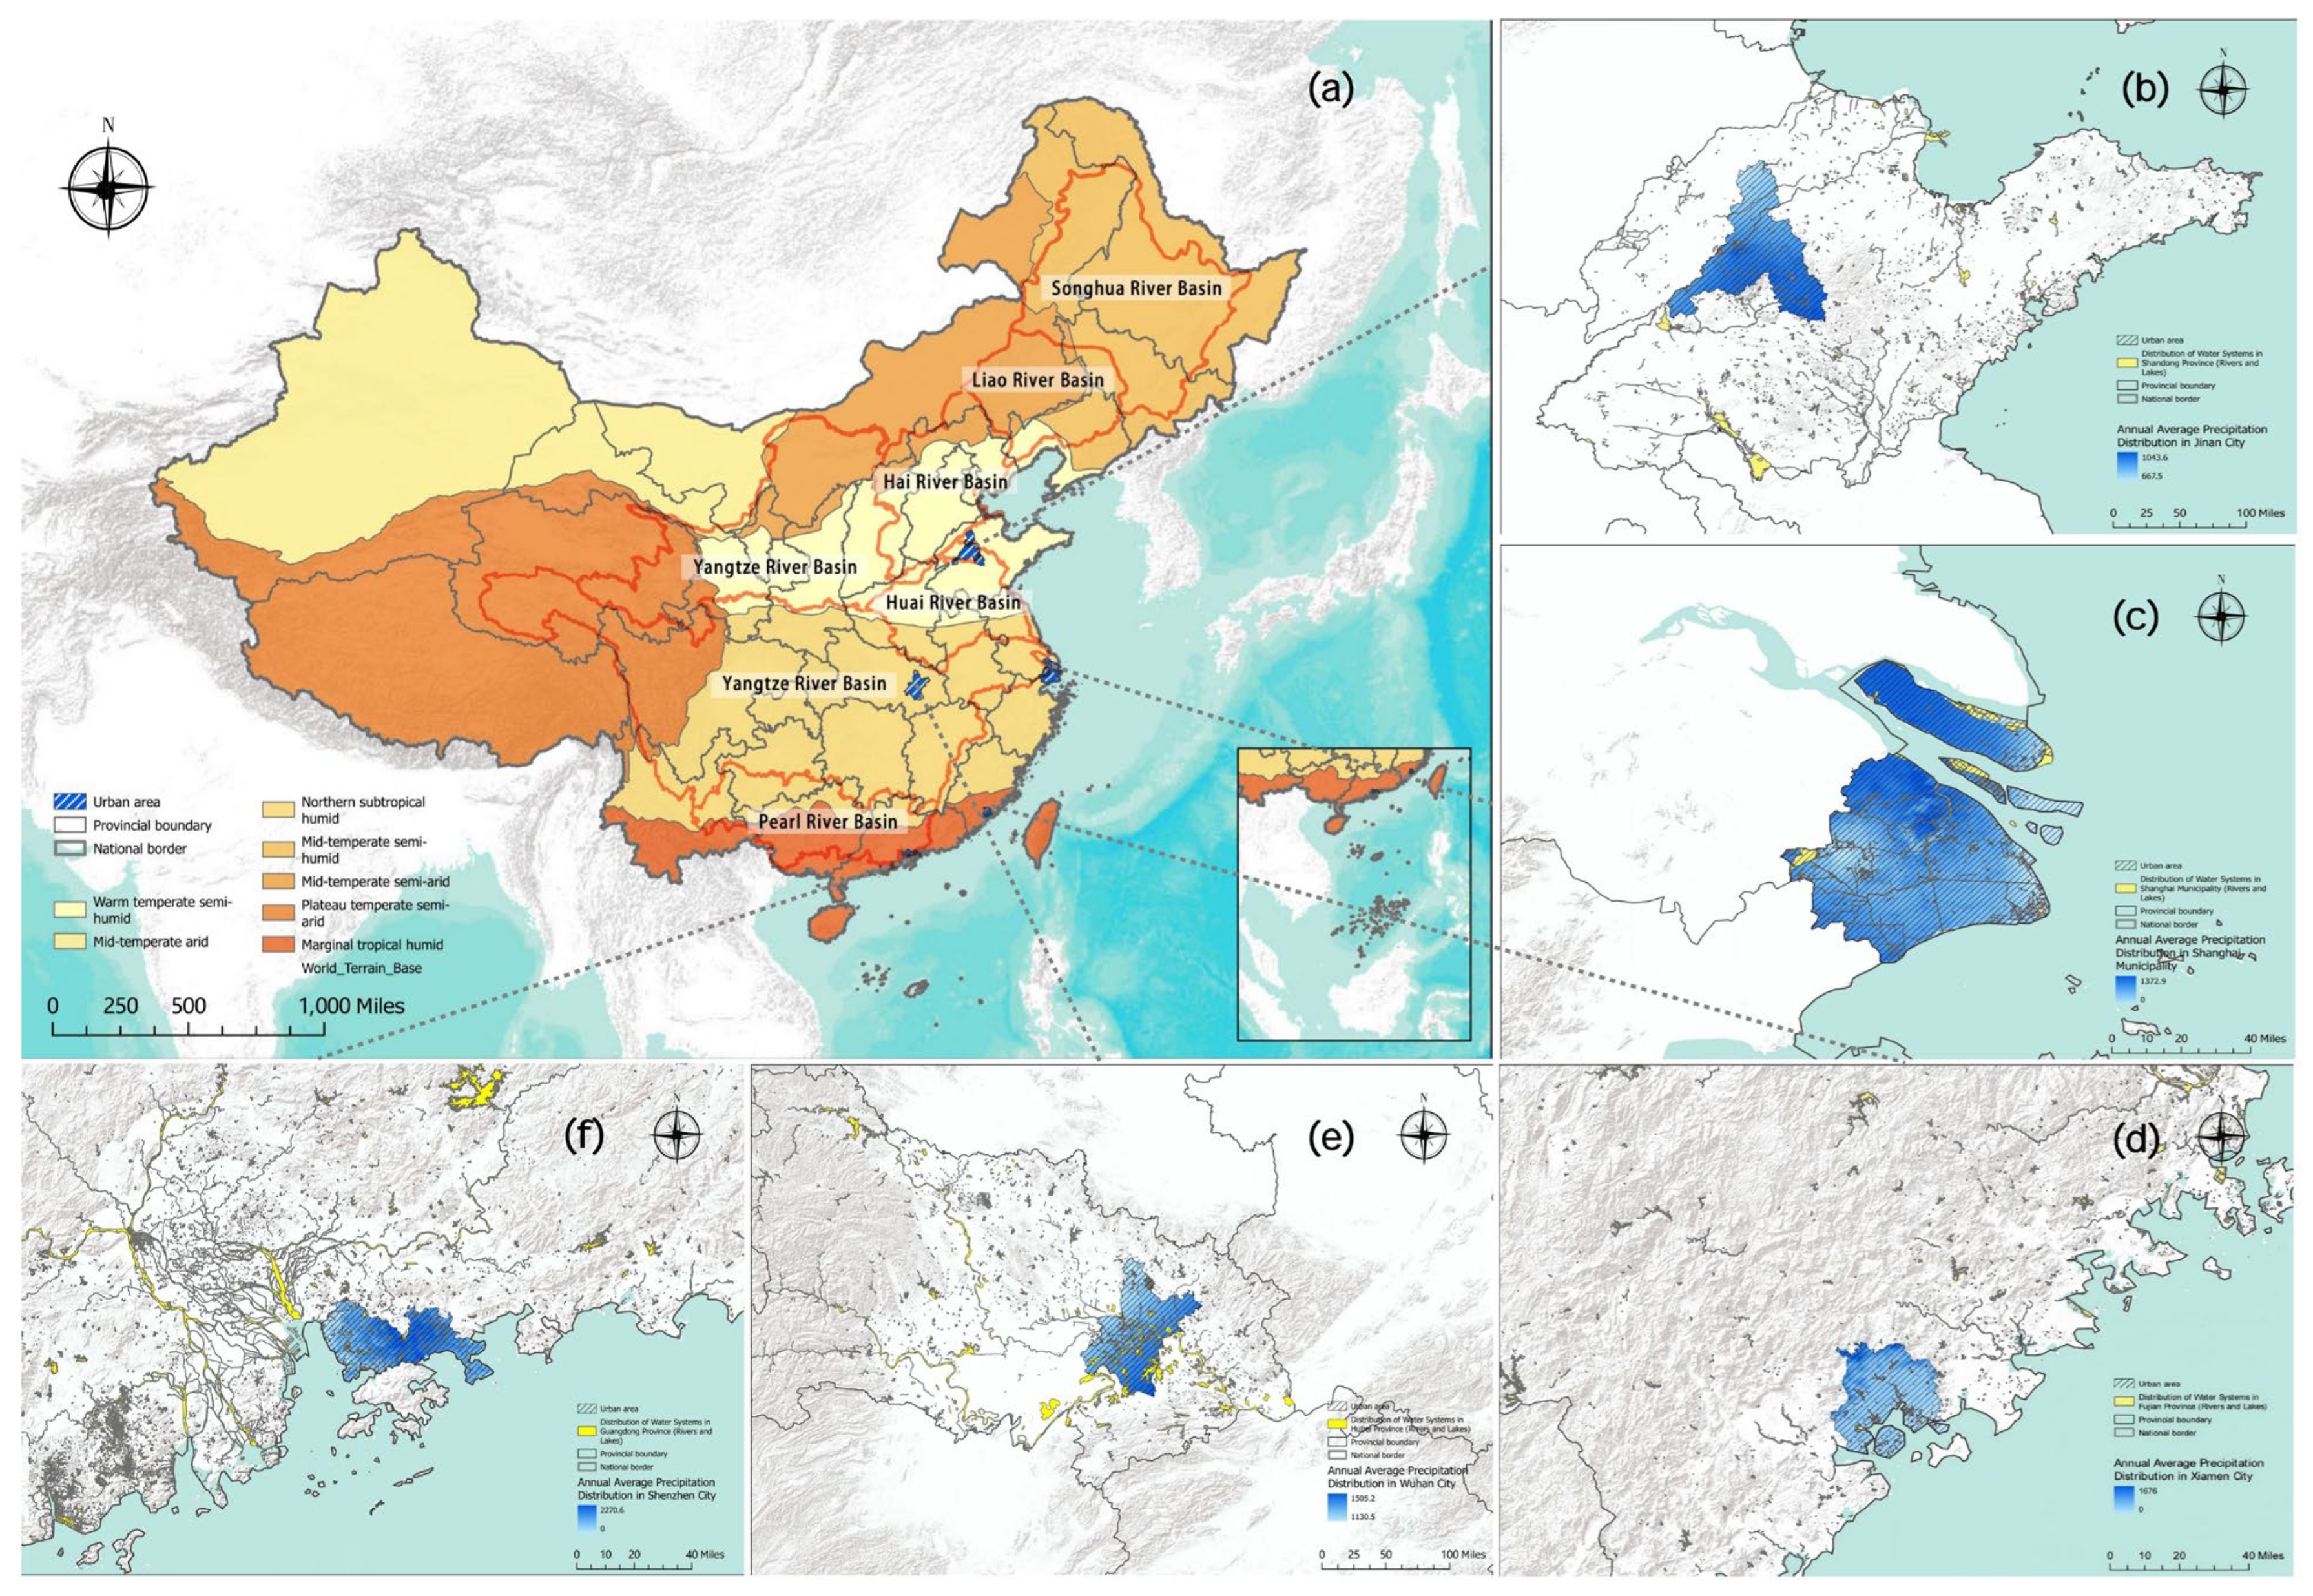
As shown in
Figure 2, the five cities span distinct climatic regimes in Chinese monsoon-dominated system. Jinan is characterized by a warm-temperate, subhumid climate with basin-constrained hydrology. Wuhan situated in a humid subtropical inland region is defined by the interaction between rivers and lakes. Shanghai located on a deltaic coastal plain is vulnerable to the combined effects of pluvial and tidal influences. Xiamen and Shenzhen sitting in maritime and southern subtropical monsoon regions are characterized by intense rainfall and high levels of typhoon-related precipitation. At the urban scale (
Figure 2b–f), the spatial relationship between built-up areas and major water systems highlights varied hydrological constraints, spanning spring-fed basins and inland lakes to estuarine and coastal systems. This hydro-climatic heterogeneity strengthens the comparative design and increases analytical leverage to evaluate stage-sensitive participation structures across governance settings by providing organized variation in environmental exposure while preserving institutional comparability.
Therefore, these five cities were selected using a structured comparative logic that integrates institutional comparability and contextual heterogeneity (
Table 1) [
4,
6]. The study establishes an analytically sound basis for analyzing stage-sensitive participation structures and their relationship to governance type and long-term operational sustainability by anchoring the analysis in the national pilot program while spanning distinct exposure regimes and governance configurations [
6,
11,
32].
3.1.2. Construction of Project Inventory
To reduce the risk of convenience sampling and showcase-case bias in small-N intensive comparison, the study first constructs a fine-grained project inventory for each selected cities following the portfolio-aware research design. This helps to define a policy-constrained and documented candidate universe [
27]. The 2015–2025 inventory window covers the national Sponge City pilot program and its subsequent scaling-up phase [
4,
27,
33]. This temporal boundary guarantees that the proposed projects remain comparable in policy direction, technical standards, and performance and acceptance logics. Spatially, municipal Sponge City implementation plans, special plans, and annual action programs guide the inventory to prioritize projects situated within officially defined pilot districts or important implementation regions [
6,
30]. A project that falls outside of clearly designated pilot district but subject to the same municipal Sponge City regulatory and evaluation system is retained and flagged accordingly to preserve portfolio completeness and avoid artificial boundary truncation.
To improve auditability and cross-city comparability, a standardized multisource retrieval protocol is used for inventory construction. To enhance reproducibility and auditability, the project inventory was constructed using a predefined source–keyword–stage retrieval protocol. For each city, searches were conducted across four evidence streams: public procurement and tendering records, sectoral agency disclosures, public consultation or environmental impact assessment records, and acceptance or operation and maintenance records. The summarized retrieval protocol, including source categories, example keyword combinations, minimum inclusion requirements, stopping criteria, duplicate handling, and conflict resolution rules, is reported in
Table 2. Search terms combined city names, district names, available project names, Sponge City or LID terminology, and stage-specific governance terms. Example Chinese keyword combinations included “城市名 + 海绵城市 + 项目”, “区名 + 海绵城市 + 年度建设项目”, “项目名 + 招标/中标/采购”, “项目名 + 意见征求/公众参与/社会稳定风险评估”, “项目名 + 竣工验收/绩效评价”, and “项目名 + 运维/养护/维护”. Supplementary English searches used combinations such as “city name + Sponge City project”, “project name + LID”, “project name + public consultation”, “project name + completion acceptance”, and “project name + operation and maintenance”. A candidate project was retained in the city-level inventory only when its identity was verified by at least one official project identity record, such as a procurement notice, award announcement, formal planning document, annual implementation list, approval document, or acceptance record. Each retained project also had to be supported by at least two independent evidence streams confirming its relevance to Sponge City, LID, stormwater governance, ecological restoration, or related urban water-management implementation. These requirements applied only to inventory construction, while the stricter life cycle completeness and S3-level evidence auditability criteria for representative project selection were applied later, as described in
Section 3.2 and
Section 3.3. Retrieval proceeded iteratively within each evidence stream until two consecutive source-keyword combinations produced no additional unique records for a given project or project cluster. Duplicate records were removed by normalizing project names and cross-checking district location, implementation period, responsible agency, contract or approval information, and acceptance or maintenance references. When conflicting information appeared, formal approval, procurement, acceptance, and maintenance records were prioritized over departmental summaries, while media reports were used only for contextual triangulation. This procedure kept the initial inventory inclusive while ensuring that subsequent project selection and scoring were based on auditable documentary traces.
This approach aligns with established practices in plan and policy content analysis and plan quality evaluation, prioritizing explicit coding rules, traceable evidence, and transparent reliability logic [
15,
16]. There are four streams of evidence systematically searched and archived. The first stream utilizes public procurement and tendering platforms, including public resource trading portals and government procurement systems, to establish project identity, contract value, and delivery arrangement, such as EPC, design–bid–build, and PPP [
34,
35]. The second consists of sectoral agency disclosure portals, including housing and urban–rural development, water affairs, and urban management portals, are used to capture policy alignment signals, such as linkage to municipal special plans, annual implementation lists, or formal review procedures. The third consists of public consultation and environmental impact assessment disclosure systems are used to retrieve publicly disclosed consultation materials, comment solicitation records, and any official response [
17,
36]. Lastly, acceptance and maintenance-related records, including completion acceptance filings, maintenance procurement notices, maintenance contracts, and inspection or assessment summaries, are used to verify late-stage life cycle evidence.
Supplementary Table S3 contains the results of the final representative project screening matrix and selection for the five-city portfolios.
Every retrieved items collected are archived in an Evidence Log designed to provide a transparent audit trail from documentary traces to downstream analytical decisions. Each entry is indexed with unique identifiers, such as a URL or file ID, the issuing body, publication date, evidence type, and a short extracted signal relevant to governance and participation. Each item is further mapped to one or more life cycle stages, namely, planning, design, construction, and maintenance, and linked to subsequent analytical functions, including representative selection proxies and participation indicators.
Appendix A provides the Evidence Log template and coding fields. Using these archived materials, each candidate project is consolidated into a structured project profile comprising: (a) fundamental attributes, like typology, spatial scale, and functional orientation; (b) governance details, including funding source, delivery mode, responsible agencies, and third-party involvement; (c) evidence of its life cycle, across planning, design, construction, and maintenance; and (d) public salience indicators, prioritizing official consultation records while treating authoritative media exposure only as a supplementary signal. The resulting within-city inventories establish an empirical foundation for transparent, representative project selection and the measurement of subsequent participation.
Table 3 summarizes the principal data sources and extracted fields for project inventory construction.
Duplicate candidate records are reconciled within each city through normalizing project name and cross-referencing spatial and temporal markers, including district identifiers, tender and award timestamps, acceptance filings, and maintenance procurement cycles. This consolidated inventory serves as the documented portfolio for subsequent screening of eligible candidates. This study considers life cycle trace completeness as an eligibility requirement for subsequent selection, not as a ranking criterion within inventory construction, allowing the candidate universe to remain complete while preserving life cycle-sensitive participation diagnostics.
3.2. Coding of Evidence Strength Coding and Constraints on Auditability
To mitigate documentation bias and limit subjective reliance on weak or ambiguous materials, all retrieved evidence items were coded by strength prior to downstream selection and participation assessment. Such coding scheme serves two purposes: first, differentiating the evidentiary value of heterogeneous documentary materials and, second, establishing a transparent auditability standard for further analysis. This approach aligns with traditions of plan and policy review as well as documentary content analysis, prioritizing explicit coding rules, traceable evidence, and replicable inference from documentary sources [
15,
16,
17,
36].
Three categories of evidence strength were established. S3-level evidence denotes high-quality, auditable documentation directly supporting governance actions or implementation states. Examples include procurement and award documents, formal plans and regulatory texts, acceptance filings, maintenance procurement or contract records, and formal consultation adoption tables or official response logs. S2-level evidence refers to official, yet less transaction-specific materials, including departmental bulletins, annual summaries, and meeting briefs, supporting project activities or institutional arrangements but may lack comprehensive procedural detail. S1-level evidence refers to weak evidence, including non-authoritative secondary reports or general media materials, used solely for contextual triangulation, not as the primary basis for substantive claims. By establishing this hierarchy, the empirical analysis remains grounded in documentary evidence of differing quality, rather than assuming all records hold analytical equivalence [
17,
36].
Based on this coding scheme, the project-level count of S3-level evidence items primarily operationalized auditability. The workflow enforced two constraints. The first limited the representative selection to projects adhering to both a life cycle completeness condition and a minimum auditability threshold. Specifically, eligible candidates had to exhibit documentary evidence spanning all four life cycle stages, namely, planning, design, construction, and maintenance, with at least an S2-level evidence or S3-level evidence level of documentation, in addition to meeting a project-level threshold of S3-level evidence ≥ 4. The S3-level evidence ≥ 4 criterion was used as a minimum auditability threshold, not as a measure of participation performance. Together with the life cycle completeness requirement, which required at least S2-level evidence- or S3-level evidence-level evidence for planning, design, construction, and maintenance, this criterion ensured that selected cases had sufficient strong and independently verifiable evidence for downstream scoring. A threshold sensitivity check was conducted to assess whether the final selection depended on this cutoff. Three conditions were compared: life cycle completeness plus S3-level evidence ≥ 4, life cycle completeness plus S3-level evidence ≥ 3, and a broader backup condition requiring at least three documented life cycle stages plus S3-level evidence ≥ 3. The selected projects remained unchanged under the relaxed S3-level evidence ≥ 3 condition. Although additional backup candidates entered the comparison when the life cycle requirement was relaxed, none displaced the final cases because of weaker life cycle traceability, less complete evidence bundles, or lower project specificity. These results, reported in
Supplementary Table S7, suggest that the final selection was not an artifact of the S3-level evidence ≥ 4 threshold. This threshold may nonetheless favor better-documented projects. It is therefore treated as a condition of documentary auditability rather than as evidence that excluded projects lacked meaningful participation. Excluded projects may still contain meaningful participation practices, but they did not provide sufficient public documentary evidence for comparable life cycle assessment [
15,
16].
Second, measurement of participation was also subject to auditability constraints. During scoring, an indicator was only assigned a score of 3 or higher on the 0–4 anchored rubric, representing an advanced or institutionalized level, if supported by at least one S3-level evidence evidence item that explicitly satisfied the corresponding rubric requirement. This rule was implemented to prevent higher-order conclusions based on weak or indirect documentary signals and to ensure that findings regarding institutionalization, feedback closure, or sustained participatory practice remain evidence linked and independently verifiable [
15,
16,
37,
38].
3.3. Selecting Representative Project Through Constrained MCDA
This study selects one structurally representative Sponge City or LID project from each city portfolio for the evaluation of in-depth, life cycle participation, totaling five projects. The goal of this selection is not to find an exemplary case, but rather to identify a project that reflects the mainstream implementation pattern of the local portfolio while providing sufficient documentation for the measurement of auditable, stage-sensitive participation. The selected project is therefore interpreted as a project-level representative case within a documented city portfolio, not as a statistical proxy for the entire city’s governance level or all Sponge City projects implemented in that city. This portfolio-aware approach addresses the well-recognized risk of bias in small-N, case-based inference when cases are selected based on convenience instead of a predefined candidate set [
27].
A coherent integration of life cycle, governance, and evidence-related considerations defines representativeness operationally. Candidate projects are preferred if they exhibit verifiable traces across planning, design, construction, and maintenance. Particular emphasis is placed on evidence related to maintenance, as late-stage records are essential for diagnosing participation continuity beyond project delivery [
21,
39]. To ensure comparability under the national Sponge City policy, representative selection is limited to the 2015–2025 study period, prioritizing projects with clearer documentation in recent years when otherwise comparable. Policy and institutional alignment is further analyzed by determining whether a project is explicitly linked to municipal Sponge City policy instruments, including special plans, annual implementation programs, formal review procedures, or acceptance systems, enabling participation traces to be interpreted against a consistent institutional baseline [
21,
30].
Typicality and scale are also incorporated to ensure exclusion of extreme outliers that could distort cross-city analysis. Projects representing standard local delivery typologies (e.g., road retrofits, community-scale systems, park or greenway interventions, and area-based implementation packages) are preferred over isolated demonstration showcases, provided that the latter is not demonstrably structural within the city portfolio [
21,
30,
39]. An auditability principle governs the selection: candidate projects must satisfy minimum documentary evidence thresholds to support comparable life cycle scoring. Because this rule may favor better-documented cases, its effect was tested through relaxed-threshold sensitivity analysis. This ensures that subsequent participation scoring is evidence based rather than impressionistic, consistent with established traditions of plan and policy evaluation highlighting explicit evidence standards and transparent inference [
15,
16,
39,
40]. Finally, public salience serves as an auxiliary rather than a primary selection signal. Official consultation traces and formal adoption records represent the primary proxies for public attention, while exposure in authoritative media is considered only a supplementary signal and does not replace evidence of official participation [
41].
A two-step limited MCDA workflow governs the selection process. First, each city portfolio is subjected to an eligibility screen based on the study window, life cycle completeness requirement, and minimum evidence availability thresholds established in
Section 3.2. Second, engineering features (policy alignment, recency, typicality and scale, auditability, and auxiliary public salience) are used to profile the remaining candidates based on the representativeness dimensions in
Table 4. To make feature construction transparent, all representativeness features were converted into numerical scores before TOPSIS calculation using predefined coding rules. Life cycle completeness was coded as the number of documented stages across planning, design, construction, and maintenance, ranging from 0 to 4. Auditability was coded as the number of S3-level evidence items retained in the project evidence bundle. Policy alignment, typicality and scale, recency, and public salience were coded using anchored 0–3 scales based on documentary evidence, as defined in
Table 4. All qualitative coding was evidence-linked: a higher score could be assigned only when the corresponding Evidence Log entries explicitly supported the coding decision. Authoritative media exposure was treated only as supplementary contextual evidence and could not independently substitute for official policy, consultation, procurement, acceptance, or Maintenance records. Before entropy-weighted TOPSIS was applied, all selection features were treated as benefit-type indicators because higher values indicate stronger traceability, representativeness, or auditability. The features were normalized using min–max normalization, as shown in Equation (1):
For entropy-weighted TOPSIS, the normalized values were first converted into feature proportions, as shown in Equation (2):
where m denotes the number of eligible candidate projects in the corresponding city portfolio. The entropy value of feature j was then calculated using Equation (3):
where
was treated as 0 when
0. The entropy weight of feature j was calculated using Equation (4):
where n denotes the number of discriminating selection features.
Where
denotes the original value of project
on feature
, and
denotes the normalized value. If all candidates in a city had the same value for a feature, that feature was treated as non-discriminating in the city-level ranking. Entropy weights were then derived from the normalized within-city candidate matrix, and TOPSIS was then used to calculate the relative closeness coefficient, as shown in Equation (5):
where
and
denote the distances of candidate project
from the positive and negative ideal solutions. A higher
indicates that the candidate is closer to the ideal representative project profile within the city portfolio. Entropy weighting was used as a dispersion-based MCDA weighting method rather than as a statistical estimator. Therefore, it does not impose a formal minimum sample size requirement in the same way as regression-based inference. Nevertheless, because several city portfolios contained a small number of eligible projects after the auditability and life cycle completeness screens, entropy-derived feature weights may be sensitive to the limited within-city candidate matrix. To address this issue, the entropy-weighted TOPSIS results were compared with equal-weight TOPSIS rankings and a documentary plausibility check. The resulting entropy feature weights and the ranking robustness comparison are reported in
Supplementary Table S9. The final selected representative projects remained unchanged across entropy-weighted and equal-weight TOPSIS specifications.
Based on this entropy-weighted TOPSIS procedure, a composite representativeness score was calculated to generate an ordered list of eligible candidates within each city [
42,
43]. The project with the highest rank served as the preliminary representative. To ensure the final choice was not an artifact of a single weighting assumption, rankings were recalculated under equal weights and, if appropriate, slight weight adjustments. A final plausibility check was then conducted to verify the coherence of evidence bundles throughout the life cycle and confirm that the selected project aligned with the local portfolio’s mainstream structure.
Supplementary Table S3 shows the final representative project screening matrix for the five-city portfolios, including life cycle traceability, auditability, and TOPSIS-based selection results.
Table 4 summarizes the dimensions of representative selection and their operational proxies.
3.4. Participation Measurement and Quality Assurance
3.4.1. Participation Measurement
A multidimensional participation measurement instrument is used for mechanism interpretation designed to systematically capture documentary traces of participation across project life cycle and assess stage-specific strengths and weaknesses under different governance arrangements. This study utilizes a previously developed instrument comprising four dimensions, breadth, depth, identity, and potential, totaling 16 indicators. Conceptually, grounded in participation theory, the instrument defines participation as a life cycle-sensitive governance structure with observable institutional features, as opposed to a simple binary attribute [
10,
42,
43,
44,
45,
46].
Supplementary Table S1 provides operational definitions of the 16 participation indicators used in this study, while
Supplementary Table S2 outlines the anchored rubric and evidence rules for scoring each indicator stage.
Each representative project was scored across all 16 indicators using a 0–4 anchored rubric. Scoring was explicitly evidence linked, requiring every assigned score to be traceable to one or more entries in the Evidence Log that met the corresponding rubric requirements. To maintain auditability at higher score levels, any indicator rated at the advanced or institutionalized level (3 or higher) required at least one S3-level evidence evidence item explicitly substantiating the claimed institutionalization, closure mechanism, or sustained participatory practice. Aligned with best practices in participation and governance assessment, this rule prevents the inference of higher-order judgments from weak or indirect documentary signals and ensures that claims regarding embedded participation remain independently verifiable [
15,
16,
19,
20,
47].
Indicator scores were then combined into dimension-level profiles for breadth, depth, identity, and potential. The calculation proceeded from indicator-stage cells to dimension-level, stage-level, and overall scores. Each project was first scored at the indicator-stage level using the 0–4 anchored rubric. The global indicator weights were adopted from a prior expert-driven AHP study on public participation in Sponge City and GI/LID governance [
14]. In that AHP calibration, 29 experts were invited and 26 valid questionnaires were retained after consistency screening. The expert panel included scholars and practitioners with backgrounds in Sponge City/LID planning, landscape architecture, urban water governance, ecological infrastructure, public participation, and municipal or project implementation. Pairwise comparisons were conducted using Saaty’s 1–9 scale. A consistency check was performed for each judgment matrix, and matrices with
0.10 were excluded. Valid judgments were aggregated using the geometric mean, and the final weights were calculated using the principal eigenvector method. In the present study, these AHP-derived weights function as fixed ex ante analytical weights rather than being estimated from the five empirical cases. To ensure reproducibility of the weighted scoring procedure, the normalized global indicator weights used for aggregation are reported in
Supplementary Table S8. Indicator scores were then aggregated into the four dimensions according to the B1–B4, D1–D4, I1–I4, and P1–P4 mapping. For each project
and dimension
, the dimension-level score was calculated using Equation (6):
where
denotes the dimension-level score of project
in dimension
denotes the normalized global weight of indicator
, and
denotes the evidence-based score of indicator
.
Indicators and supporting evidence were further mapped to the four project stages, namely planning, design, construction, and maintenance, to generate life cycle-sensitive diagnostics. Stage-level scores were calculated by applying the same weighted aggregation logic to all available indicator-stage cells within each stage. The overall life cycle score was calculated using Equation (7):
where
denotes the overall life cycle score of project
,
denotes the evidence-based score of indicator
for project
at stage
, and
denotes the set of non-EM indicator-stage cells available for aggregation. In the main analysis, EM cells were treated as missing and excluded from the denominator through weight renormalization, so that documentary silence was not automatically penalized. The full indicator-by-stage scoring matrices and weighted outputs are reported in
Supplementary Tables S4 and S5. This approach allowed the analysis to identify both cross-project differences in overall participation configuration and within-project variation in participation performance throughout the stages. It also aligns with recent initiatives to develop multidimensional participation indices, based on surveys or documents, that move beyond simple presence or absence measures [
10,
19,
20,
46]. Thus, this instrument directly addresses the methodological gap identified in the literature, namely, the limited availability of cross-city, life cycle-spanning quantitative tools that can measure the quality and configuration of participation, not just its existence [
19,
20,
44,
45,
46].
3.4.2. Handling Missing Evidence and Reliability Assurance
To avoid conflating “missing evidence” with “absent evidence,” this study distinguishes three evidence-status categories: observed, EM (evidence missing), and EN (evidence negative). Observed means that adequate documentary evidence was retrieved to support the scoring. EM indicates that relevant evidence was not found using the standardized retrieval protocol and therefore should not automatically be interpreted as low participation or nonperformance. EN indicates that the absence or non-implementation of a participatory practice is clearly documented. This distinction is essential in documentary analysis because public records frequently reflect uneven disclosure practices rather than purely substantive variations in governance performance [
17,
36].
Missingness rates were reported for all representative projects, and robustness checks evaluated alternative EM treatments to ensure that comparative conclusions were not contingent on a single incomplete evidence assumption. The main analysis treated EM as missing and excluded EM cells from direct penalization through weight renormalization. Two conservative sensitivity scenarios were then calculated: EM = 0, which assumes no documentable participation for missing cells, and EM = 1, which assumes only minimal or symbolic evidence. These scenarios were used to test whether project scores and rankings were sensitive to the treatment of documentary silence. The results of the EM sensitivity analysis are reported in
Section 4.2 and
Supplementary Table S5. These checks enhance transparency regarding the influence of incomplete documentation on comparative results and reduce the risk of overinterpreting gaps in the record.
Two independent raters used the anchored rubric and Evidence Log mapping to score each indicator to improve scoring consistency. Interrater agreement was evaluated using weighted Cohen’s kappa for ordinal indicator scores and intraclass correlation coefficients for aggregated dimension-level and overall scores, following established guidelines for ordinal coding and scale-level agreement assessment [
10,
19,
20,
48]. Dimension-specific weighted Cohen’s kappa values were 0.881 for participation breadth, 0.859 for participation depth, 0.773 for participation identity, and 0.672 for participation potential. The overall indicator-stage weighted kappa was 0.818. These results indicate substantial to almost perfect agreement across the scoring dimensions, supporting the robustness and reproducibility of the evidence-based scoring process. Disagreements exceeding the predefined adjudication threshold were resolved by rechecking evidence, applying rubric-based rules, and documenting resolution notes. This established an auditable trail from the documentary source to the final score assignment, strengthening the transparency and reproducibility of the life cycle-sensitive participation diagnostics.
4. Results
4.1. Final Representative Projects
Following the completion of the portfolio construction, evidence strength screening, and constrained representative selection process outlined in
Section 3, one project was retained from each city for life cycle-sensitive participation assessment. Rather than selecting the most high-profile project, this step aimed to choose a case that was policy relevant, sufficiently bounded, traceable across stages, and broadly representative of the dominant local implementation pattern. This approach reduces showcase-case bias and strengthens the interpretability of subsequent cross-city comparisons.
The final five cases demonstrate diverse local implementation strategies within the shared national Sponge City policy framework: the Shanghai case is the Heping Park Renovation Project; Wuhan case, Changqing Park Underground CSO Detention Tank Project; Xiamen case, Xinyang Main Flood Discharge Canal Ecological Rehabilitation Project; Shenzhen case, Bijiashan River Culvert Daylighting Pilot Project (Shenzhen Middle School Section); and Jinan case, Xinglong Park Construction Project. Covering park retrofitting, complex water infrastructure, ecological rehabilitation, and green space construction, together, these projects capture substantial variation in project typology, governance, and documentation.
Table 5 summarizes the key characteristics of the five final representative projects: typology, delivery mode, responsible agency, dominant evidence strengths, and selection rationale.
Table 5 shows that all five selected projects satisfied the life cycle traceability requirement across planning, design, construction, and maintenance. In each case, the retained evidence bundle included at least S3-level evidence- and S2-level evidence-level materials, while weak contextual materials were used only for triangulation and not as the sole basis for substantive scoring. To assess whether the final case selection was driven by the S3-level evidence ≥ 4 auditability threshold, a threshold sensitivity check was also conducted. When the auditability threshold was relaxed from S3-level evidence ≥ 4 to S3-level evidence ≥ 3 while retaining the life cycle completeness requirement, the same five projects remained the final selected cases. When a broader backup condition allowing at least three documented life cycle stages and S3-level evidence ≥ 3 was applied, additional backup candidates entered the screening pool, but none replaced the final selected projects because of weaker life cycle traceability, lower project specificity, or lower TOPSIS ranking. Detailed sensitivity results are reported in
Supplementary Table S7. Adopting a documentation-first evaluation logic, official records served as the primary basis for participation assessment, whereas media coverage and promotional narratives functioned only as supplementary contextual signals. This distinction differentiates visibility from evidentiary strength and reduces the risk of mistaking promotional exposure for substantive performance. Consequently, the final case set is analytically meaningful and methodologically defensible: each project represents a distinct local implementation pathway with a sufficiently complete and robust evidence chain across its life cycle.
4.2. Results of Weighted Participation
The weighted participation framework was subsequently applied to the five representative projects. Each project was assessed using a stage-sensitive matrix covering 16 indicators throughout planning, design, construction, and maintenance, resulting in up to 64 scorable cells per case. All scores were assigned based on the anchored 0–4 rubric and the evidence handling protocols defined in
Section 3. In the absence of relevant evidence after standardized retrieval, the corresponding cell was coded as EM instead of defaulting to low performance. This approach ensures that cross-case comparison remains rooted in evidence instead of making it mechanically punitive.
Supplementary Table S4 contains full indicator-by-stage scoring matrices for the five representative projects.
At the overall project level, the differences are clear. Shenzhen achieved the highest weighted participation score at 2.856, followed by Wuhan at 2.383, Shanghai at 2.306, Jinan at 2.287, and Xiamen at 2.156.
Table 6 reports these stage-specific and overall weighted results. The ranking demonstrates that representative Sponge City projects do not converge on a single participation pattern, despite sharing a common national policy framework. Instead, the quality of participation differs systematically between cities, reflecting differences in project type, governance arrangement, and life cycle traceability.
Supplementary Table S5 presents the distribution of EM cells and weighted score outputs for the five representative projects, enabling readers to assess how incomplete documentation might affect cross-case comparison.
Table 6 indicates that Shenzhen leads in both the overall weighted score and maintenance, having substantially higher scores than the other four cases. Wuhan is relatively strong in construction and maintenance, followed by the moderate and balanced performance of Shanghai and Jinan, while Xiamen ranks lowest under the main EM-as-missing specification. Because EM cells appeared frequently in the indicator-stage matrices, an EM sensitivity analysis was conducted to test whether this ranking depended on the treatment of missing documentary evidence. Under the main specification, EM was treated as missing and excluded from direct penalization through weight renormalization. Two conservative scenarios were then compared: EM = 0 and EM = 1. As shown in
Table 7, Shenzhen remained the highest-scoring project across all EM treatments, with scores of 2.856, 2.306, and 2.499 under the three specifications, respectively. This indicates that the strongest participation profile is robust to alternative EM assumptions. However, the middle-ranked cases showed greater sensitivity. Jinan rose from fourth place under the main specification to second place under both conservative scenarios, mainly because it had fewer EM cells. Xiamen requires particular caution because it contains 14 EM cells, representing 21.9% of the 64 indicator-stage cells. These EM cells do not indicate documented non-participation; rather, they reflect insufficient publicly retrievable evidence for some participation-related mechanisms after the standardized retrieval protocol. The project nevertheless retained complete life cycle traceability across planning, design, construction, and maintenance, which is why it remained eligible for comparison. Under the main EM-as-missing specification, Xiamen scored 2.156 and ranked fifth. Under the conservative EM = 0 and EM = 1 scenarios, its score changed to 1.690 and 1.906, respectively, and it remained within the lower-scoring group. Therefore, Xiamen’s exact rank should be interpreted cautiously, but the broader finding that it represents a comparatively weaker documented participation profile remains robust. Overall, the cross-city comparison should be interpreted primarily as a structured comparison of participation profiles rather than as a precise city-level ranking. Detailed missing-evidence distributions and supplementary sensitivity results are reported in
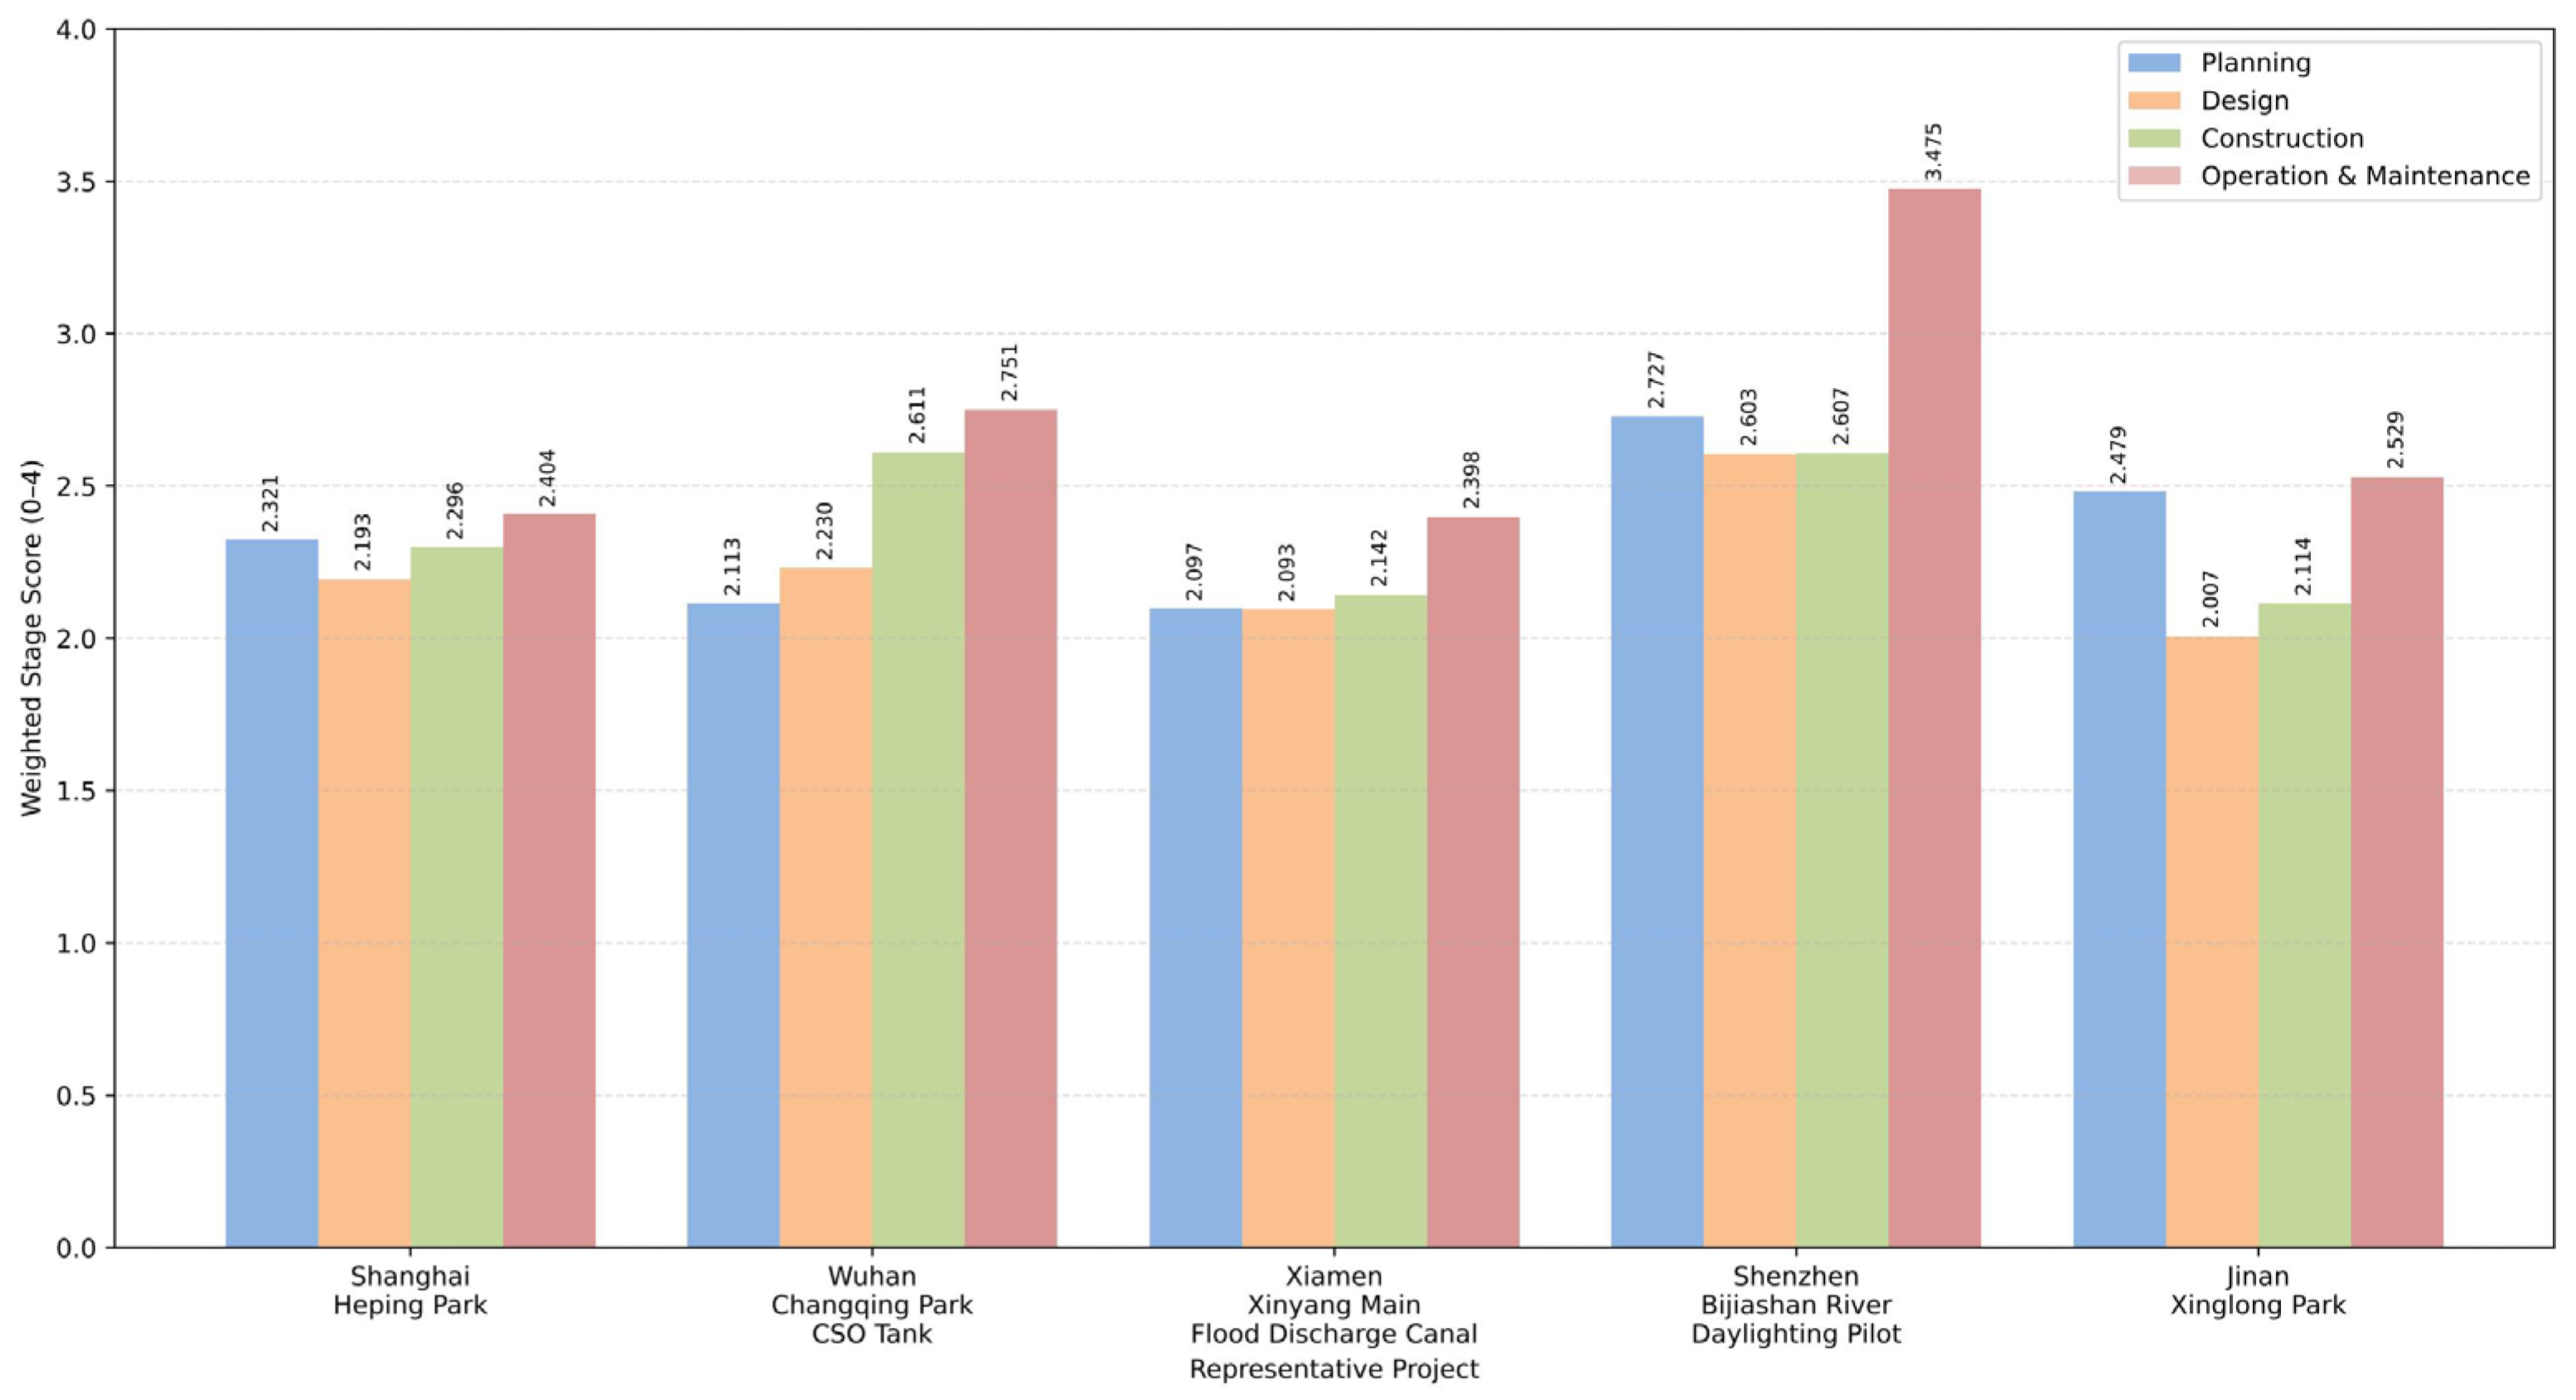
Supplementary Table S5. To visualize the stage-level differences more directly,
Figure 3 shows a comparison of the stage-specific scores of the five representative projects.
At the dimension level,
Table 8 provides a diagnostic profile of how each project performs across participation breadth, depth, identity, and potential. This table should not be read as a second overall project ranking, because it aggregates dimension-level profiles rather than the life cycle overall score reported in
Table 6. Shenzhen displays the most balanced dimension-level profile across all four dimensions, especially in participation potential, which reflects visible institutional support, facilitating conditions, maintenance linkage, and long-term governance continuity. By contrast, Wuhan ranks second in the life cycle overall score in
Table 6 because of its relatively stronger construction- and maintenance-stage performance, but it appears lower in
Table 8 because its breadth and depth scores are weaker.
Table 8 therefore complements
Table 6 by explaining the internal composition of participation performance rather than replacing the primary overall project ranking.
Table 8 shows Shanghai and Jinan constituting a second cluster with greater breadth and identity than depth. This pattern suggests that the participation strength of park-oriented or public space projects primarily stems from procedural accessibility, place-based recognition, transparency, and institutional legitimacy, rather than from strong delegated influence. A third cluster, composed of Wuhan and Xiamen, exhibits relatively weak breadth and depth, yet potential remains comparatively strong. In these cases, participation-related strengths are reflected in technical embedding, governance continuity, and operational support, rather than through visible, public-facing deliberation.
Supplementary Table S5 summarizes the weighted score outputs, including the overall 0–4 and 0–100 results, for transparency and reproducibility.
To move beyond project-specific scores,
Table 9 synthesizes the recurring strengths and weaknesses from the five representative projects, highlighting their broader cross-case implications. Based on a cross-case analysis of
Table 9, the strongest recurrent features center on institutional support, resource support, transparency and legitimacy, and replicability or learning potential. Conversely, the weakest and least prominent features relate to the inclusion of marginalized groups and the formal closing of feedback adoption processes. This pattern suggests that the principal governance challenge in current Sponge City practice is not a total absence of participation, but rather in their uneven distribution across projects and stages. Procedural openness and administrative support are more common than substantive inclusion and demonstrable decision influence.
4.3. Cross-Case Comparison of Life Cycle
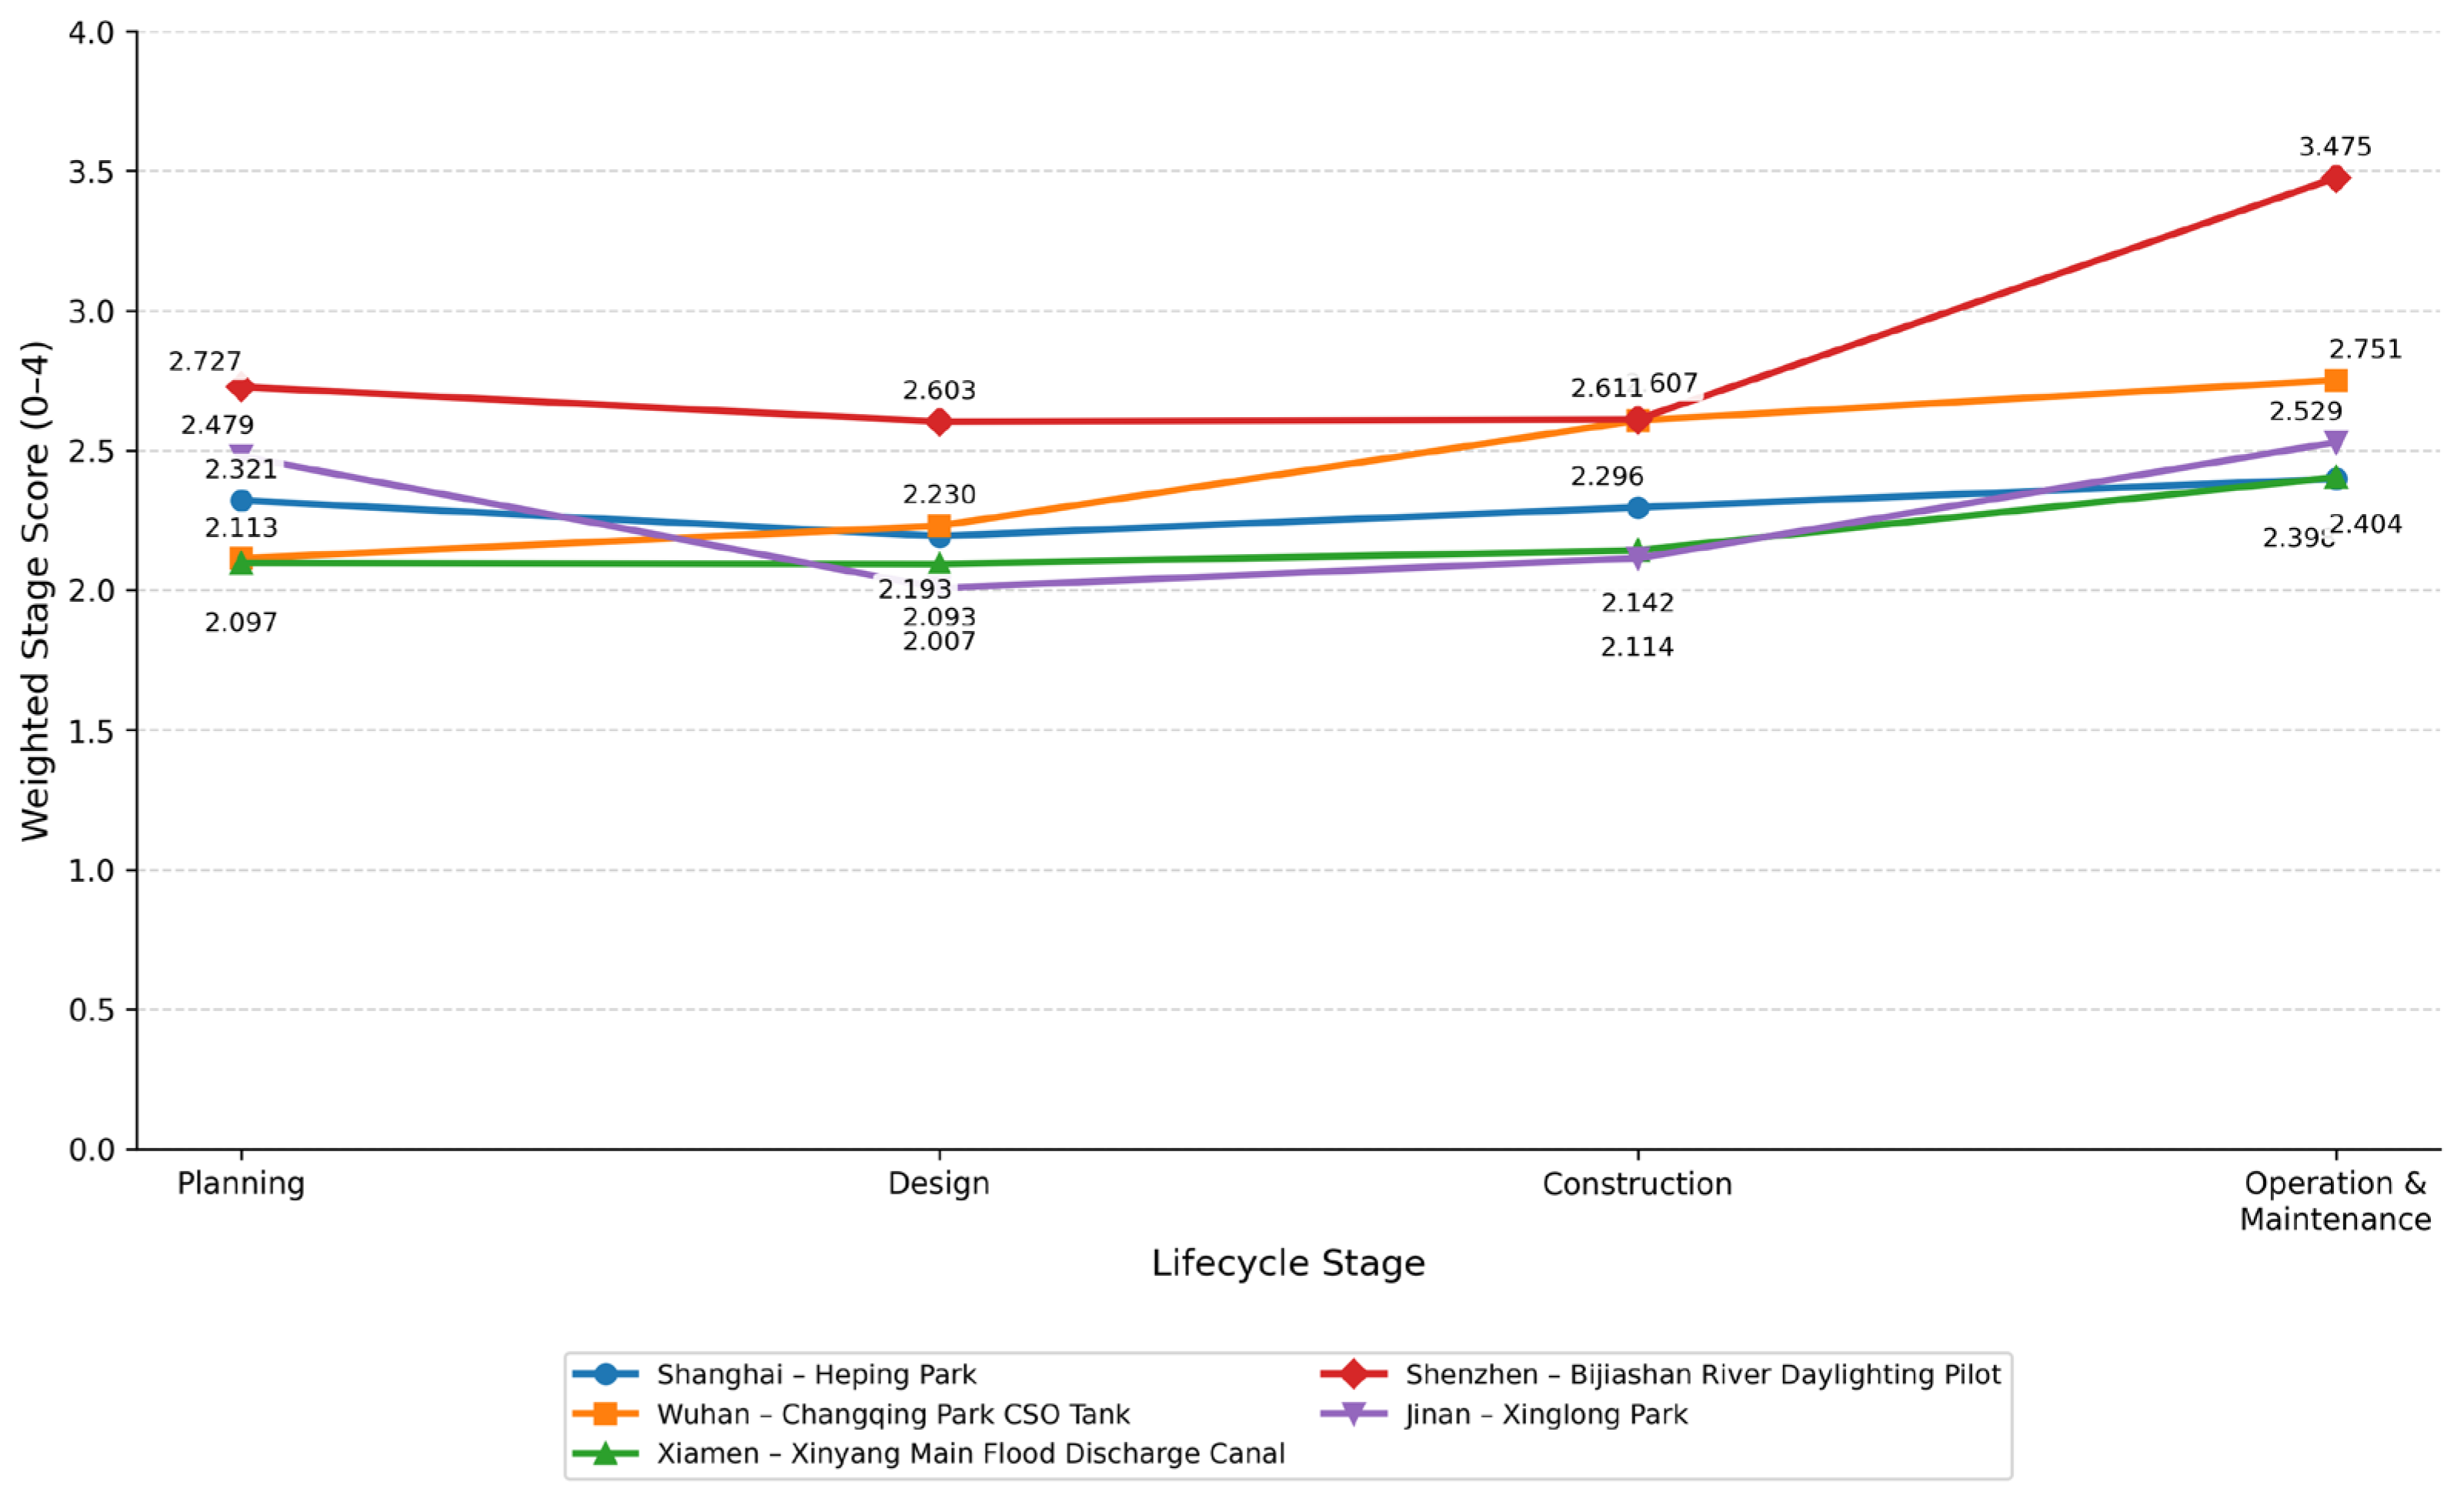
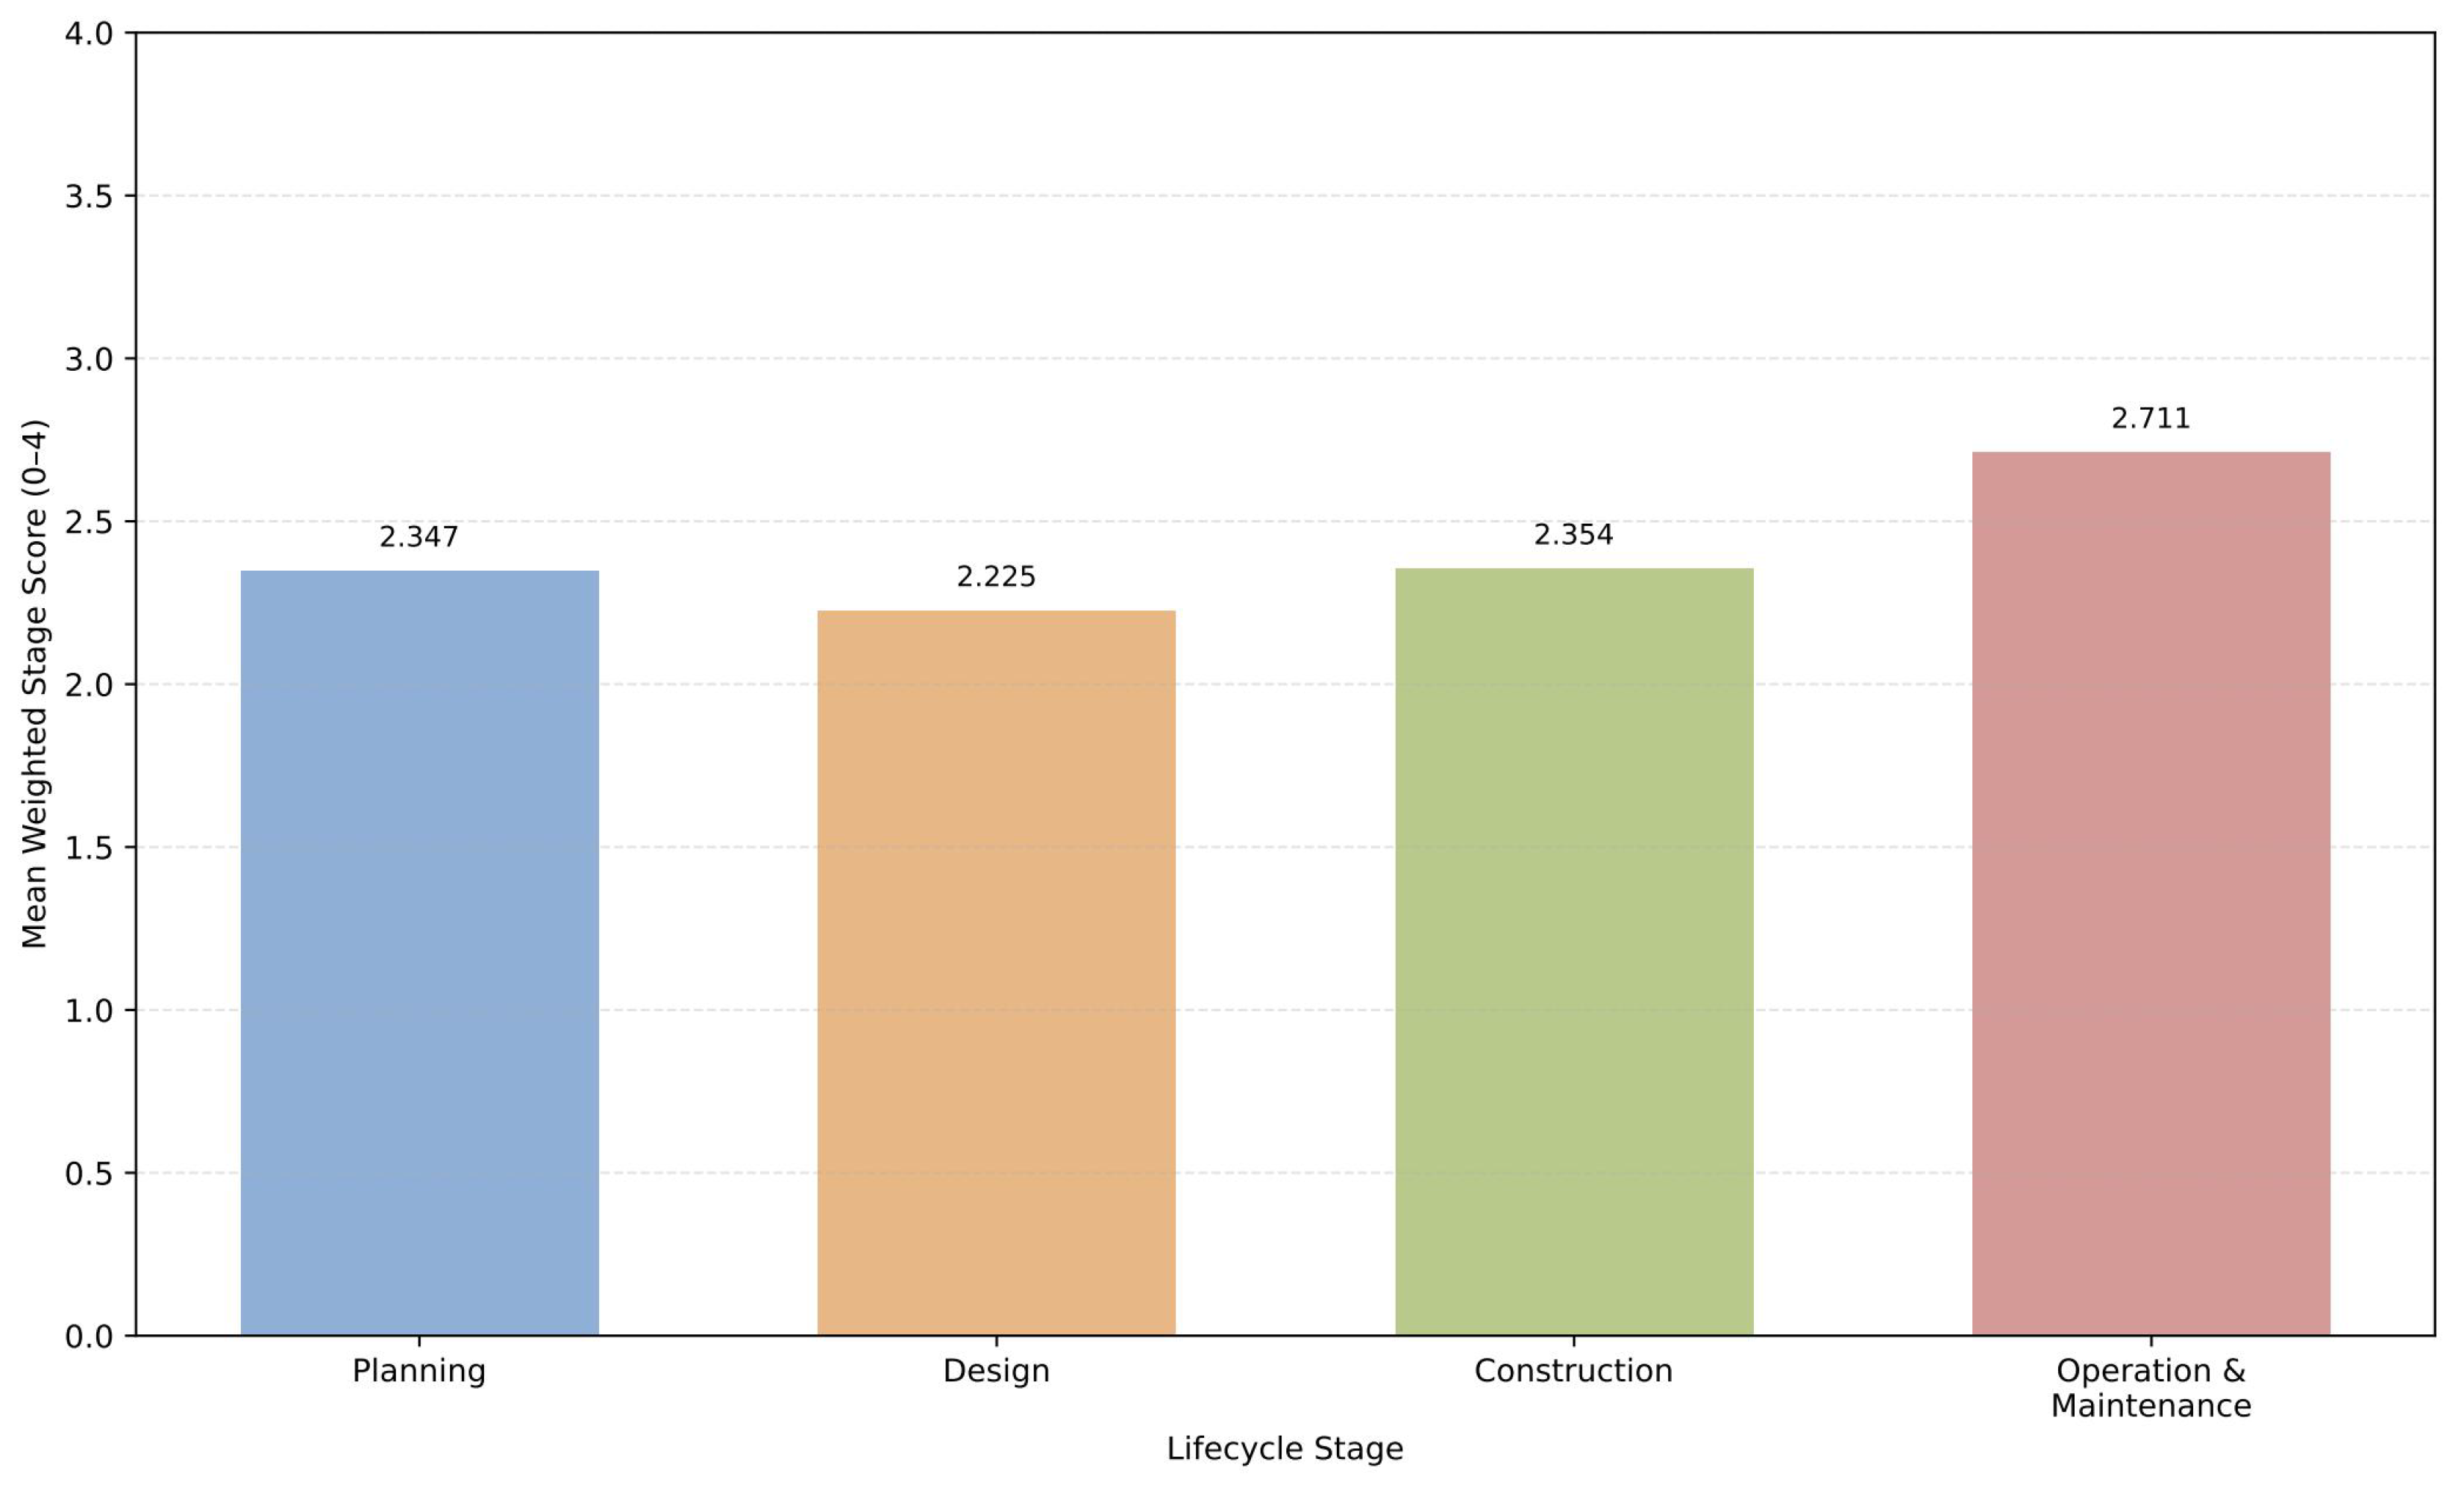
The cross-case comparison shows clear variations in participation performance throughout the life cycle stages. With average weighted score of 2.711, maintenance ranks highest across the five projects, followed by construction at 2.354, planning at 2.347, and design at 2.225. This result differs from the common expectation that participation is highest in planning and gradually decreases over time. Within this sample, post-completion governance and long-term management often leave clearer and more durable documentation than earlier participatory design efforts. Therefore, the higher maintenance-stage score should not be interpreted as direct proof that post-delivery participation is substantively deeper than early-stage participation. Rather, it indicates that maintenance is the phase in which governance continuity, assigned responsibility, resource support, and post-delivery management arrangements are most visible in the documentary record. To reduce the risk of score inflation from generic maintenance documentation, maintenance-stage scores were assigned only when the evidence supported participation-relevant mechanisms, such as public-facing management responsibility, feedback channels, stewardship arrangements, continuity mechanisms, or institutionalized support, rather than merely indicating the existence of a maintenance contract.
Table 10 shows the relative ranking of the five cities at each stage. The five cities’ structured differences are further revealed by stage ordering. In planning, Shenzhen and Jinan show the best planning performance, which highlights their relatively strong public consultation and transparent procedures. In design, Shenzhen remains the strongest case, although this stage is the weakest overall, indicating limited public-facing design disclosure in several cities. In construction, Wuhan and Shenzhen perform best, consistent with the high traceability of technically intensive infrastructure delivery. In maintenance, Shenzhen again leads, followed by Wuhan and Jinan, suggesting that late-stage continuity, maintenance arrangements, and post-delivery institutional support distinguish higher-performing cases.
Therefore, the maintenance-stage advantage should be understood as a documented governance continuity pattern rather than as a direct measure of the total substantive quality of public participation. Complementing the stage ranking,
Figure 4 presents a comparison of cross-case life cycle of the five representative projects, while
Figure 5 summarizes the mean participation performance by stage. Together, these figures show that maintenance is the strongest stage overall and design the weakest.
Following this cross-case synthesis,
Table 10 displays a qualitative diagnostic matrix of the five representative projects. As shown, Shenzhen demonstrates the most balanced hybrid profile, integrating engineering innovation with remarkably visible public-facing governance and strong maintenance continuity. Wuhan exemplifies a technically embedded governance model characterized by high institutional support and post-delivery functionality despite its limited breadth and depth. Shanghai illustrates a public-space retrofit approach focused on transparency, place identity, and public visibility. Jinan is characterized as a procedurally open park development case with relatively strong planning and maintenance but weak intermediate technical-stage participation. In contrast, Xiamen represents a governance-led ecological rehabilitation approach, marked more by institutional continuity than explicit participatory closure. Together, these project profiles demonstrate that cross-case differences are not merely matters of participation magnitude but are better understood as distinct participation configuration under distinct governance and project conditions.
Collectively, the cross-case comparison yields four primary results. First, the five representative projects lack a uniform participation pattern, displaying distinct life cycle profiles influenced by their project type and governance structure. Second, projects focusing on public space retrofitting and procedural openness excel in planning, while technically intensive infrastructure projects perform better in construction and maintenance. Third, the maintenance phase is the most diagnostically revealing stage in this sample clearly indicating whether governance continuity was institutionalized after project delivery. Fourth, cross-city differences are not random but rather are structured, reflecting variations in the visibility, supportiveness, and sustainability of participation across different local implementation logics.
5. Discussion
This study builds on emerging research that defines public participation not as a single project attribute but as a structured, multidimensional, and life cycle-sensitive governance capability. Collectively, the findings indicate that participation in Sponge City projects is best understood as a differentiated governance structure, rather than as a uniform procedural step, with its visibility, strength, and continuity varying across different stages, project types, and institutional settings. There are three key implications.
First, the results highlight a distinct gap between normative priority and empirical realization. The weighted framework adopted in this study assumes, based on prior theory and expert input, that participation varies in importance across all the project life cycle. However, the empirical application captures actual, documented participation rather than normative desirability. Within this sample, design is the weakest stage, while maintenance is the strongest. This contrast suggests a documentation asymmetry: maintenance-stage records provide stronger evidence of institutionalized governance continuity, whereas front-end co-design, feedback translation, and public-facing technical adjustment remain less visible in the documentary record. From a governance perspective, this mismatch is critical because the stages most likely to secure local fit, legitimacy, and long-term acceptance are not necessarily those where participation is most visibly practiced.
Second, the results indicate that cross-case differences signify distinct participation profiles rather than a simple “high” versus “low” contrast, as summarized in
Table 11. Shenzhen performs best by exhibiting balanced strengths across breadth, depth, identity, and potential, aside from achieving the highest overall score. By contrast, Wuhan shows that strong institutional capacity and operational continuity can exist despite weak breadth and depth. The Shanghai and Jinan cases indicate that public space projects can yield high identity, visibility, and procedural legitimacy even with restricted delegated influence. Xiamen illustrates a different configuration, where participation is more administrative than interactive. These differences suggest that participation is shaped by a combination of project typology, technical complexity, hydrological pressure, institutional arrangement, and public legibility, rather than by a single underlying participation variable. Therefore, project type influences how participation performs and becomes socially visible, intelligible, and governable.
Third, a persistent weakness in substantive inclusion and feedback closure is highlighted. As
Table 9 shows, indicators related to institutional/resource support, transparency, and learning potential are consistently more visible than those related to marginalized group inclusion or the auditable integration of public input into decision-making. In short, current Sponge City governance mechanisms works well for procedural openness and administrative support but struggles to prove whether diverse publics are genuinely represented and whether participation alters project decisions in a clear and auditable way. This distinction is critical. If feedback is not tracked and marginalized groups are ignored, participation risks becoming procedurally present but substantively selective. Therefore, the problem is not simply that participation is missing, but that the most visible forms are not truly inclusive or transformative.
These findings enhance the broader understanding of how participation functions under different governance conditions. In technically intensive infrastructure projects, participation is often more deeply embedded in institutional continuity, maintenance support, and operational governance, rather than in visible public deliberation. Conversely, park and public space projects frequently display greater citizen-facing visibility, place identity, and procedural openness, but not necessarily stronger depth in terms of delegated influence. This means that participation should not be evaluated only by the presence of formal consultation or public visibility, but rather by how different participatory functions are distributed across the project types and life cycle. Under this interpretation, participation is better understood as a governance structure rather than an isolated democratic event. More specifically, what varies across cases is not merely the amount of participation but the configuration through which it is operationalized, documented, and sustained.
The relatively similar score of Jinan compared with several southern cases should not be interpreted as evidence that Sponge City construction or maintenance costs are similar across northern and southern China. The present study evaluates documented public participation and governance traceability rather than engineering cost performance, maintenance expenditure, or cost-effectiveness. Construction and maintenance costs may differ substantially across regions because of rainfall intensity, drainage design standards, typhoon exposure, tidal backwater effects, freeze–thaw conditions, vegetation establishment, and seasonal maintenance requirements. However, these cost variables were not included in the present participation scoring framework. In this sample, Jinan’s moderate participation performance mainly reflects the selected project type and documentary profile. The Xinglong Park Construction Project is a bounded park and green space project with clear planning-stage disclosure, major decision procedures, design review records, and post-construction progress evidence. Jinan also contains fewer EM cells than the other four cases, which improves the observability of participation-related governance traces. Therefore, the absence of a clear north–south gradient in participation scores does not imply an absence of regional cost differences. Rather, it indicates that the participation scores are shaped more directly by project typology, documentary traceability, and governance procedures than by construction or maintenance cost conditions alone. Future research should integrate cost data, hydrological performance, and participation indicators to examine whether higher-cost Sponge City implementation contexts generate different participation demands or governance arrangements.
From a policy standpoint, the findings suggest that enhancing public participation in Sponge City governance requires more than just increasing the number of consultation activities. This implication is consistent with recent national policy efforts to summarize replicable Sponge City mechanisms in work organization, integrated planning, whole-process control, funding support, and public participation, indicating that participation is increasingly being framed as part of full-process governance rather than as an isolated consultation activity [
49]. Fundamentally, it necessitates establishing participation frameworks integrated with decision-making processes, supported by traceable evidence, and tailored to the specific needs of each project stage. This involves ensuring better representation during planning and earlier agenda openness, establishing tighter links between public input and technical adjustment in design, and fostering transparency and conflict management. Furthermore, maintenance should evolve from symbolic post-completion display into more durable stewardship and co-management arrangements. In this sense, public participation should be understood as an essential governance infrastructure, not merely supplementary procedural layer. The transition from treating participation as a procedural supplement to viewing it as a governance infrastructure is a central implication of this study.
At the same time, several limitations warrant consideration when interpreting these results. First, the analysis focuses on documented visibility rather than the totality of actual participation practices, meaning informal, tacit, or undocumented actions may be underrepresented. Relatedly, the auditability threshold may favor projects with stronger public documentation. Although the threshold sensitivity check indicates that the final case selection remained stable under relaxed S3-level evidence conditions, less-documented projects may still contain informal, locally embedded, or weakly publicized participation practices that are not fully captured by this documentary approach. The EM sensitivity analysis further indicates that the strongest profile remains stable, while the ranking of middle cases is more sensitive to missing evidence assumptions. Accordingly, the findings should be interpreted as evidence-based participation profiles rather than exhaustive accounts of all participatory practices or precise city-level league table rankings. Second, the weighting system highlights relative importance rather than proving a causal effect; it identifies structured differences in participation configuration, yet does not establish that a specific dimension directly causes governance performance. Third, using one representative project per city strengthens analytical depth and cross-case comparability, but limits statistical generalization to all Sponge City projects within each city. The selected cases should therefore be interpreted as documentarily auditable project-level profiles that illustrate dominant implementation pathways, rather than as complete measures of whole-city governance performance. The study’s contribution lies not in proposing universal distribution patterns but in demonstrating a replicable and auditable framework for life cycle-sensitive comparison.
Collectively, the findings address the study’s core questions by showing transparent identification of representative projects, how participation structures change throughout the project life cycle, and how these configurations mirror broader governance strengths and weaknesses across different urban conditions. The focus should not be just on the existence of participation exists, but on whether it is aligned with critical project stages, properly documented for auditing, and designed for long-term continuity rather than short-term procedural compliance. Under this perspective, participation is viewed not as an optional ecological infrastructure but as part of the governance infrastructure through ensuring Sponge City projects are durable, legitimate, and socially intelligible.
6. Conclusions
This study established a life cycle-sensitive framework to evaluate public participation in Chinese Sponge City projects through cross-city comparison. By integrating project inventory construction, evidence-based representative project selection, and multidimensional participation measurement, two methodological gaps in the existing literature are addressed: the lack of a structured, full life cycle measurement framework and the lack of a transparent and auditable process for representative case selection within large project portfolios. Analyzing five representative projects in Jinan, Shanghai, Xiamen, Shenzhen, and Wuhan, the study provided a comparative diagnosis of how participation is configured, documented, and sustained under different governance conditions.
The findings arrived at four main conclusions. First, public participation in Sponge City projects should be viewed as a structured governance capability, varying across breadth, depth, identity, and potential, rather than as a static, single attribute spanning planning, design, construction, and maintenance. Second, the five representative projects do not share a uniform participation pattern but display distinct life cycle participation profiles driven by project typology, institutional arrangement, and governance context. Third, maintenance is the strongest documented stage, while design is the weakest, indicating that current Sponge City governance leaves more visible evidence of post-delivery continuity than of front-end co-design and feedback translation. Fourth, the most persistent weaknesses lie in substantive inclusion and the traceable closure of feedback adoption processes, rather than in procedural openness itself.
The study offers three main contributions. Theoretically, it reframes public participation as a life cycle-sensitive governance framework moving beyond a binary or purely attitudinal variable. Methodologically, it introduces a replicable and auditable workflow connecting project inventory construction, evidence-strength coding, representative project selection, and multidimensional participation assessment. Empirically, it shows that participation differences across Sponge City projects are structured rather than random driven by project type, governance arrangement, and the sustainability of participation across the project life cycle. From a policy standpoint, the findings suggest that enhancing participation in Sponge City governance requires a stage-matched participation architecture rather than just increasing consultation activities. Ultimately, this perspective highlights participation as essential governance infrastructure for ensuring long-term project legitimacy, continuity, and public intelligibility.
Several limitations are also worth noting. The study focuses on documented visibility rather than the total scope of participation, meaning informal or undocumented engagement may be underrepresented. The weighting framework supports structured comparison, but it does not establish causal effects. Furthermore, using the five representative projects strengthens analytical depth but limits statistical generalization. Future research can expand this framework by increasing the case base, combining documentary analysis with field methods, and integrating construction cost, maintenance expenditure, hydrological performance, and participation indicators to examine how regional implementation conditions shape governance outcomes. Overall, the study shows that the impact of participation depends on its distribution throughout the project life cycle, institutional support, and traceability in governance. Therefore, participation is an integral component of Sponge City governance, not merely an optional procedure.