Article

Rural Land Circulation and Common Prosperity in China: Spatial Econometric Evidence from Provincial Panel Data

1
School of Economics and Trade, Hunan University, Changsha 410079, China
2
Department of International Economics, National Technical University of Ukraine “Igor Sikorsky Kyiv Polytechnic Institute”, 03056 Kyiv, Ukraine
3
School of Humanities and Social Sciences, Jiangsu University of Science and Technology, Zhenjiang 212100, China
*
Author to whom correspondence should be addressed.
Land 2026, 15(6), 918; https://doi.org/10.3390/land15060918
Submission received: 10 April 2026 / Revised: 8 May 2026 / Accepted: 20 May 2026 / Published: 27 May 2026
(This article belongs to the Section Land Socio-Economic and Political Issues)

Abstract

This study examines the relationship between rural land circulation and common prosperity across 30 Chinese provinces over the period 2010–2022. We construct a multidimensional common prosperity index based on economic development, income distribution, public services, and social security using the entropy weight method. A Spatial Durbin Model (SDM) is employed to capture both local effects and interregional spillovers. The results show that rural land circulation exerts a positive and statistically significant impact on common prosperity. Effect decomposition further indicates that the influence is primarily driven by local (direct) effects, while spatial spillovers also play a meaningful role, suggesting that improvements in one region can generate positive externalities for neighboring areas. Additional analysis reveals three key channels through which land circulation is associated with common prosperity: improvements in agricultural productivity, increases in farmer income, and urbanization advancement. The effects exhibit clear regional heterogeneity, being strongest in central China, moderate in western regions, and statistically insignificant in the eastern provinces, reflecting diminishing marginal returns as land markets mature. Moreover, the impact of land circulation is more pronounced in regions with higher levels of digital economy development, indicating that digitalization enhances the efficiency and inclusiveness of land market transactions. These findings are robust to alternative spatial weight matrices, variable definitions, and sample adjustments. Overall, the results highlight the importance of regionally differentiated land circulation policies and the role of market integration in promoting balanced and inclusive development.

1. Introduction

China’s pursuit of common prosperity, formally designated as a national strategic priority at the Central Financial and Economic Affairs Commission meeting in August 2021, confronts a persistent structural challenge: rural residents’ per capita disposable income reached only 39.3% of their urban counterparts in 2022, despite four decades of reform-era growth [1]. This urban–rural divide extends beyond income to education, healthcare, social security, and public infrastructure, forming a multidimensional inequality that stands as the primary obstacle to shared development [2,3,4].
Land, as the most valuable asset held by rural households, sits at the center of this challenge. Since the Household Responsibility System replaced collective farming in the early 1980s, farmland has been allocated in small, fragmented plots to individual households [5,6]. While this initial reform generated substantial productivity gains, the resulting fragmentation has increasingly constrained agricultural modernization and scale economies [7]. In response, central and provincial governments have actively promoted rural land circulation—the voluntary transfer of land management rights among farmers, cooperatives, and agribusiness firms—as a mechanism to consolidate fragmented plots, improve agricultural efficiency, and raise rural incomes. By 2022, approximately 38.1% of household-contracted arable land had entered circulation nationwide, up from 12.4% in 2010 [8]. Secure land tenure, which underpins farmers’ willingness to invest in their plots and to participate in circulation markets, has been strengthened by the rural land titling program initiated in 2014 [9,10].
Despite the scale of this transformation, the academic literature remains divided on whether land circulation genuinely advances common prosperity or merely benefits a subset of rural households and enterprises. One strand of research emphasizes efficiency gains: Deininger and Jin [11] and Jin and Deininger [12] found that land rental markets in China raised both productivity and equity, as smallholders received rental income while consolidated operators achieved economies of scale. Gao et al. [13] documented that land rental was associated with a 15–20% increase in agricultural investment per hectare in Jiangsu Province. Recent studies corroborate these findings: Pei et al. [14] demonstrated that land transfer improves land use efficiency primarily by increasing plot sizes, while Ji et al. [9] showed that cropland transfer-in raises both on-farm and off-farm income for receiving households, with education moderating the income effects. Deng and Kang [15] further found that land transfer generates welfare gains through both physical rental income and implicit social rents arising from improved community relations. A contrasting view, advanced by Ye [16], cautions that circulation benefits may accrue disproportionately to larger operators and well-connected enterprises, potentially widening within-rural inequality. Zhang et al. [17] examine this distributive question directly, finding that land transfer reduces income inequality among farm households overall but with heterogeneous effects across household types, suggesting that the equity-promoting impact depends on local market conditions and household asset endowments. Others have emphasized indirect pathways: land circulation frees surplus agricultural labor for urban employment, accelerating urbanization and generating non-farm income [18,19].
A second limitation of the existing literature is the near-universal reliance on OLS or fixed-effects panel models that treat provinces as independent observations. Given the strong spatial interdependence in China’s economic landscape—provinces share factor markets, compete for investment, and emulate policy innovations—ignoring spatial effects likely biases estimation results [20,21]. The spatial dimension is particularly relevant for land circulation, whose promotion often follows regional policy diffusion patterns and whose economic effects may spill across provincial boundaries through labor migration and agricultural product markets.
This paper addresses both gaps by estimating the effect of rural land circulation on a multidimensional common prosperity index across 30 Chinese provinces from 2010 to 2022, using a Spatial Durbin Model that captures both direct effects and spatial spillovers. We further investigate three mediating channels—agricultural productivity improvement, farmer income growth, and urbanization advancement—and examine how the relationship varies across China’s eastern, central, and western regions.
The study offers three contributions. First, rather than using a single income measure, we construct a composite common prosperity index capturing the multidimensional nature of shared development, including economic growth, distributional equity, public service provision, and social protection. Second, by employing spatial econometric methods, we account for the geographic interdependence that characterizes provincial-level development in China. Third, we identify and quantify specific transmission mechanisms through which land circulation affects common prosperity, providing differentiated policy guidance for regions at different development stages.
The remainder of the paper proceeds as follows. Section 2 develops the theoretical framework and research hypotheses. Section 3 describes the data sources, variable construction, and econometric methodology. Section 4 presents the empirical results. Section 5 discusses the findings in relation to existing literature and derives policy implications. Section 6 concludes.

2. Theoretical Framework and Research Hypotheses

2.1. Land Circulation, Agricultural Productivity, and Common Prosperity

The theoretical link between land circulation and agricultural productivity rests on the concept of optimal farm size. In neoclassical agricultural economics, productivity depends on the alignment between farm scale and available technology, capital, and management capacity [11,12]. China’s Household Responsibility System allocated land in small, often non-contiguous plots—an average household manages 0.5 hectares divided across five to six separate parcels [7]. This extreme fragmentation generates two inefficiencies: it prevents the adoption of large-scale machinery and modern farming techniques that require contiguous acreage, and it increases the time and effort spent traveling between parcels [18].
Land circulation addresses these inefficiencies through consolidation. When smallholders lease their management rights to larger operators—professional farmers, cooperatives, or agribusiness firms—the resulting consolidated plots support mechanized operations, standardized input use, and professional management [11,12]. Beyond on-farm gains, land circulation facilitates labor reallocation from agriculture to higher-productivity sectors. Households that lease out their land can dedicate more time to off-farm employment, where wages typically exceed agricultural returns by a factor of three to five [19,22].
Furthermore, the impact of agricultural labor productivity on common prosperity extends beyond output expansion and primarily operates through improvements in labor allocation and income structure. In traditional smallholder agriculture, excessive labor input often leads to a phenomenon of “involution”, where marginal productivity remains persistently low relative to non-agricultural sectors, thereby constraining income growth among farmers [23]. With the advancement of land circulation and the emergence of scaled operations, rising agricultural labor productivity releases surplus labor, enabling its reallocation toward non-agricultural sectors with higher marginal returns. This process not only increases output per agricultural worker, but more importantly creates opportunities for low-income farmers to transition out of low-productivity agricultural activities and access wage income. As a result, it contributes to narrowing the rural–urban income gap while simultaneously mitigating income inequality within rural areas [24].
Hypothesis 1.
Rural land circulation improves agricultural labor productivity, which in turn promotes common prosperity by raising economic output per agricultural worker and narrowing sectoral income differences.

2.2. Land Circulation, Farmer Income, and Common Prosperity

The income effects of land circulation operate through multiple channels. For households that transfer out their land, rental income provides a stable source of cash flow that was previously unavailable when land was underutilized, although its absolute magnitude is typically modest [11]. More importantly, the release of labor time enables household members to engage in non-agricultural wage employment. In regions with more active land circulation markets, the share of non-farm income in total household income is typically 8–12 percentage points higher than in regions where land transfer is more constrained [13,25].
For households that lease in land, larger operational scales reduce average production costs and improve access to government support targeted at scale operators. China’s 2016 agricultural subsidy reform shifted producer subsidies toward “moderate-scale operators,” directly incentivizing land consolidation and scale expansion [25]. These operators also benefit from enhanced bargaining power in output markets and improved access to agricultural supply chain financing.
However, the distributional effects of land circulation are inherently dual. If the benefits of land transfer accrue disproportionately to wealthier households or external investors, rural income inequality may be exacerbated [16]. Zhou et al. [26] show that when wage growth persistently lags behind productivity growth—the so-called “reverse Kaldor fact”—the labor share in primary income distribution may decline, thereby weakening the income-enhancing effects of land circulation for low-income farmers. At the same time, land rents, as a form of property income, may contribute to reducing inequality within the existing distributional system [26]. Complementary institutional arrangements can further reinforce the equalizing effects of land circulation. For instance, Li et al. [27] find that the combination of homestead property rights confirmation and labor mobility significantly reduces intra-rural income inequality. More broadly, the net effect of land circulation on common prosperity depends on whether income growth is broadly shared and supported by appropriate redistribution mechanisms [28].
Hypothesis 2.
Rural land circulation increases farmers’ per capita income and promotes common prosperity through both a level effect (higher average income) and a distributional effect (more equitable income sharing).

2.3. Land Circulation, Urbanization, and Common Prosperity

Land circulation and urbanization interact to form a self-reinforcing cycle. As land consolidation improves agricultural efficiency and releases surplus labor, rural-to-urban migration accelerates, thereby increasing the level of urbanization [19]. In turn, stronger labor demand and higher wages in urban areas provide incentives for remaining rural households to lease out land and migrate, further deepening the development of land circulation markets [18,22].
Urbanization promotes common prosperity through multiple channels. Urban areas typically offer higher wages, better access to public services, and more diversified employment opportunities [29,30]. As urban populations expand, rising demand for public services often stimulates improvements in education, healthcare, and infrastructure, generating spillover benefits for both urban residents and surrounding rural communities [31]. Cheng et al. [32] further show that urbanization exhibits an inverted U-shaped relationship with the urban–rural income gap—initially widening disparities but eventually reducing them as urbanization progresses. In the long run, urbanization contributes to narrowing regional income gaps and improving the overall income distribution. This suggests that land circulation-induced urbanization, once surpassing a critical threshold, can effectively promote common prosperity by reducing spatial inequality.
However, the urbanization process also entails potential risks. If migrant workers face discrimination, lack access to social security, or are confined to low-quality employment, the equalizing effects of urbanization may be weakened. Under China’s household registration (hukou) system, rural migrants often have limited access to urban public services [30,33]. Cheng et al. [32] emphasize that, in the early stages, urbanization may exacerbate inequality due to urban-biased policies and human capital outflows. Only by promoting people-centered urbanization and accelerating the integration of rural migrants into urban citizenship can the inclusive effects of urbanization be fully realized. Recent empirical evidence from 2024–2025 further shows that hukou reforms lowering registration barriers have significantly enhanced rural households’ resilience and increased wages by improving labor market access [34,35].
Hypothesis 3.
Rural land circulation promotes urbanization, and urbanization in turn advances common prosperity by expanding access to higher-wage employment and improving public service provision.

2.4. Spatial Spillover Effects

Economic activities do not occur in isolation. Tobler’s [36] first law of geography—“everything is related to everything else, but near things are more related than distant things”—applies directly to land circulation and common prosperity. Agricultural product markets, labor markets, and policy environments all exhibit spatial dependence [20]. When one province implements effective land circulation policies and achieves productivity gains, neighboring provinces may benefit through inter-provincial labor mobility, agricultural technology diffusion, competitive policy learning, and shared infrastructure [21,37].
Spatial spillovers in common prosperity may be either positive or negative. If land circulation in one province generates growth that spills into neighbors through trade and labor flows, the spatial effect is positive. Conversely, if successful land circulation attracts mobile factors of production away from neighboring provinces, a “beggar-thy-neighbor” dynamic could emerge [38].
Hypothesis 4.
The effect of rural land circulation on common prosperity exhibits positive spatial spillovers, such that land circulation in one province also contributes to common prosperity in neighboring provinces.
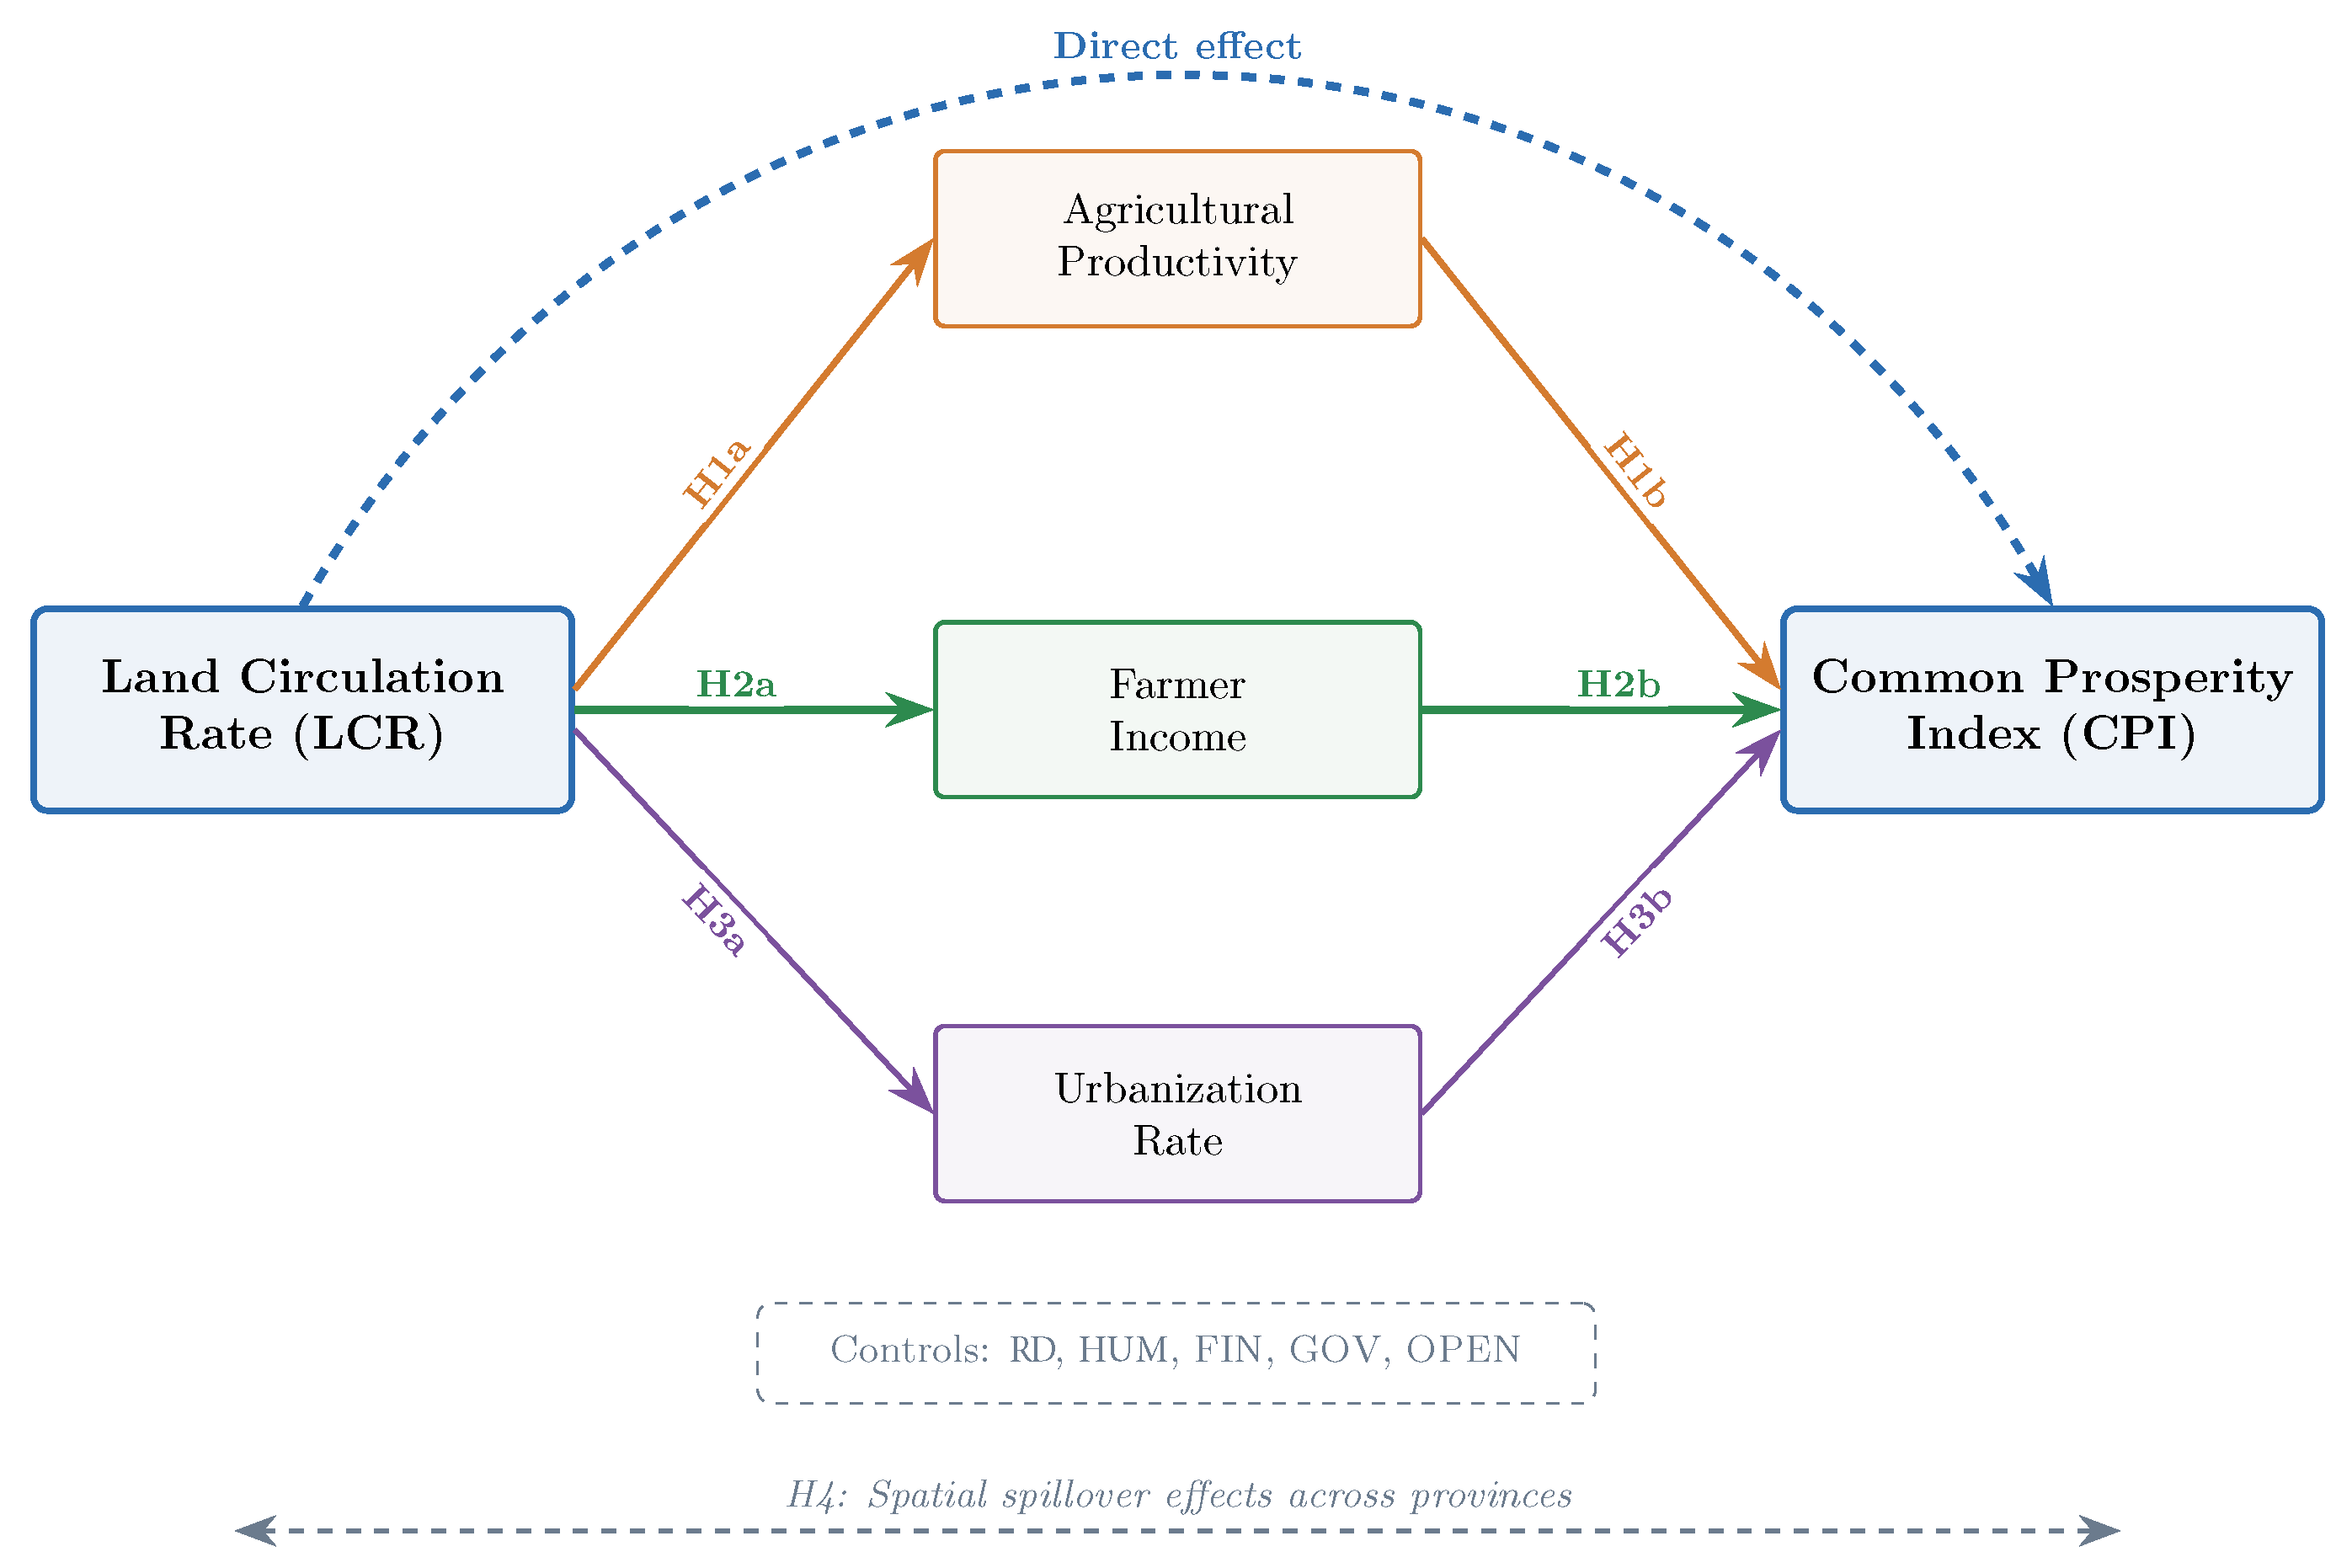
Figure 1 summarizes the theoretical framework.

3. Data and Methodology

3.1. Study Area and Data Sources

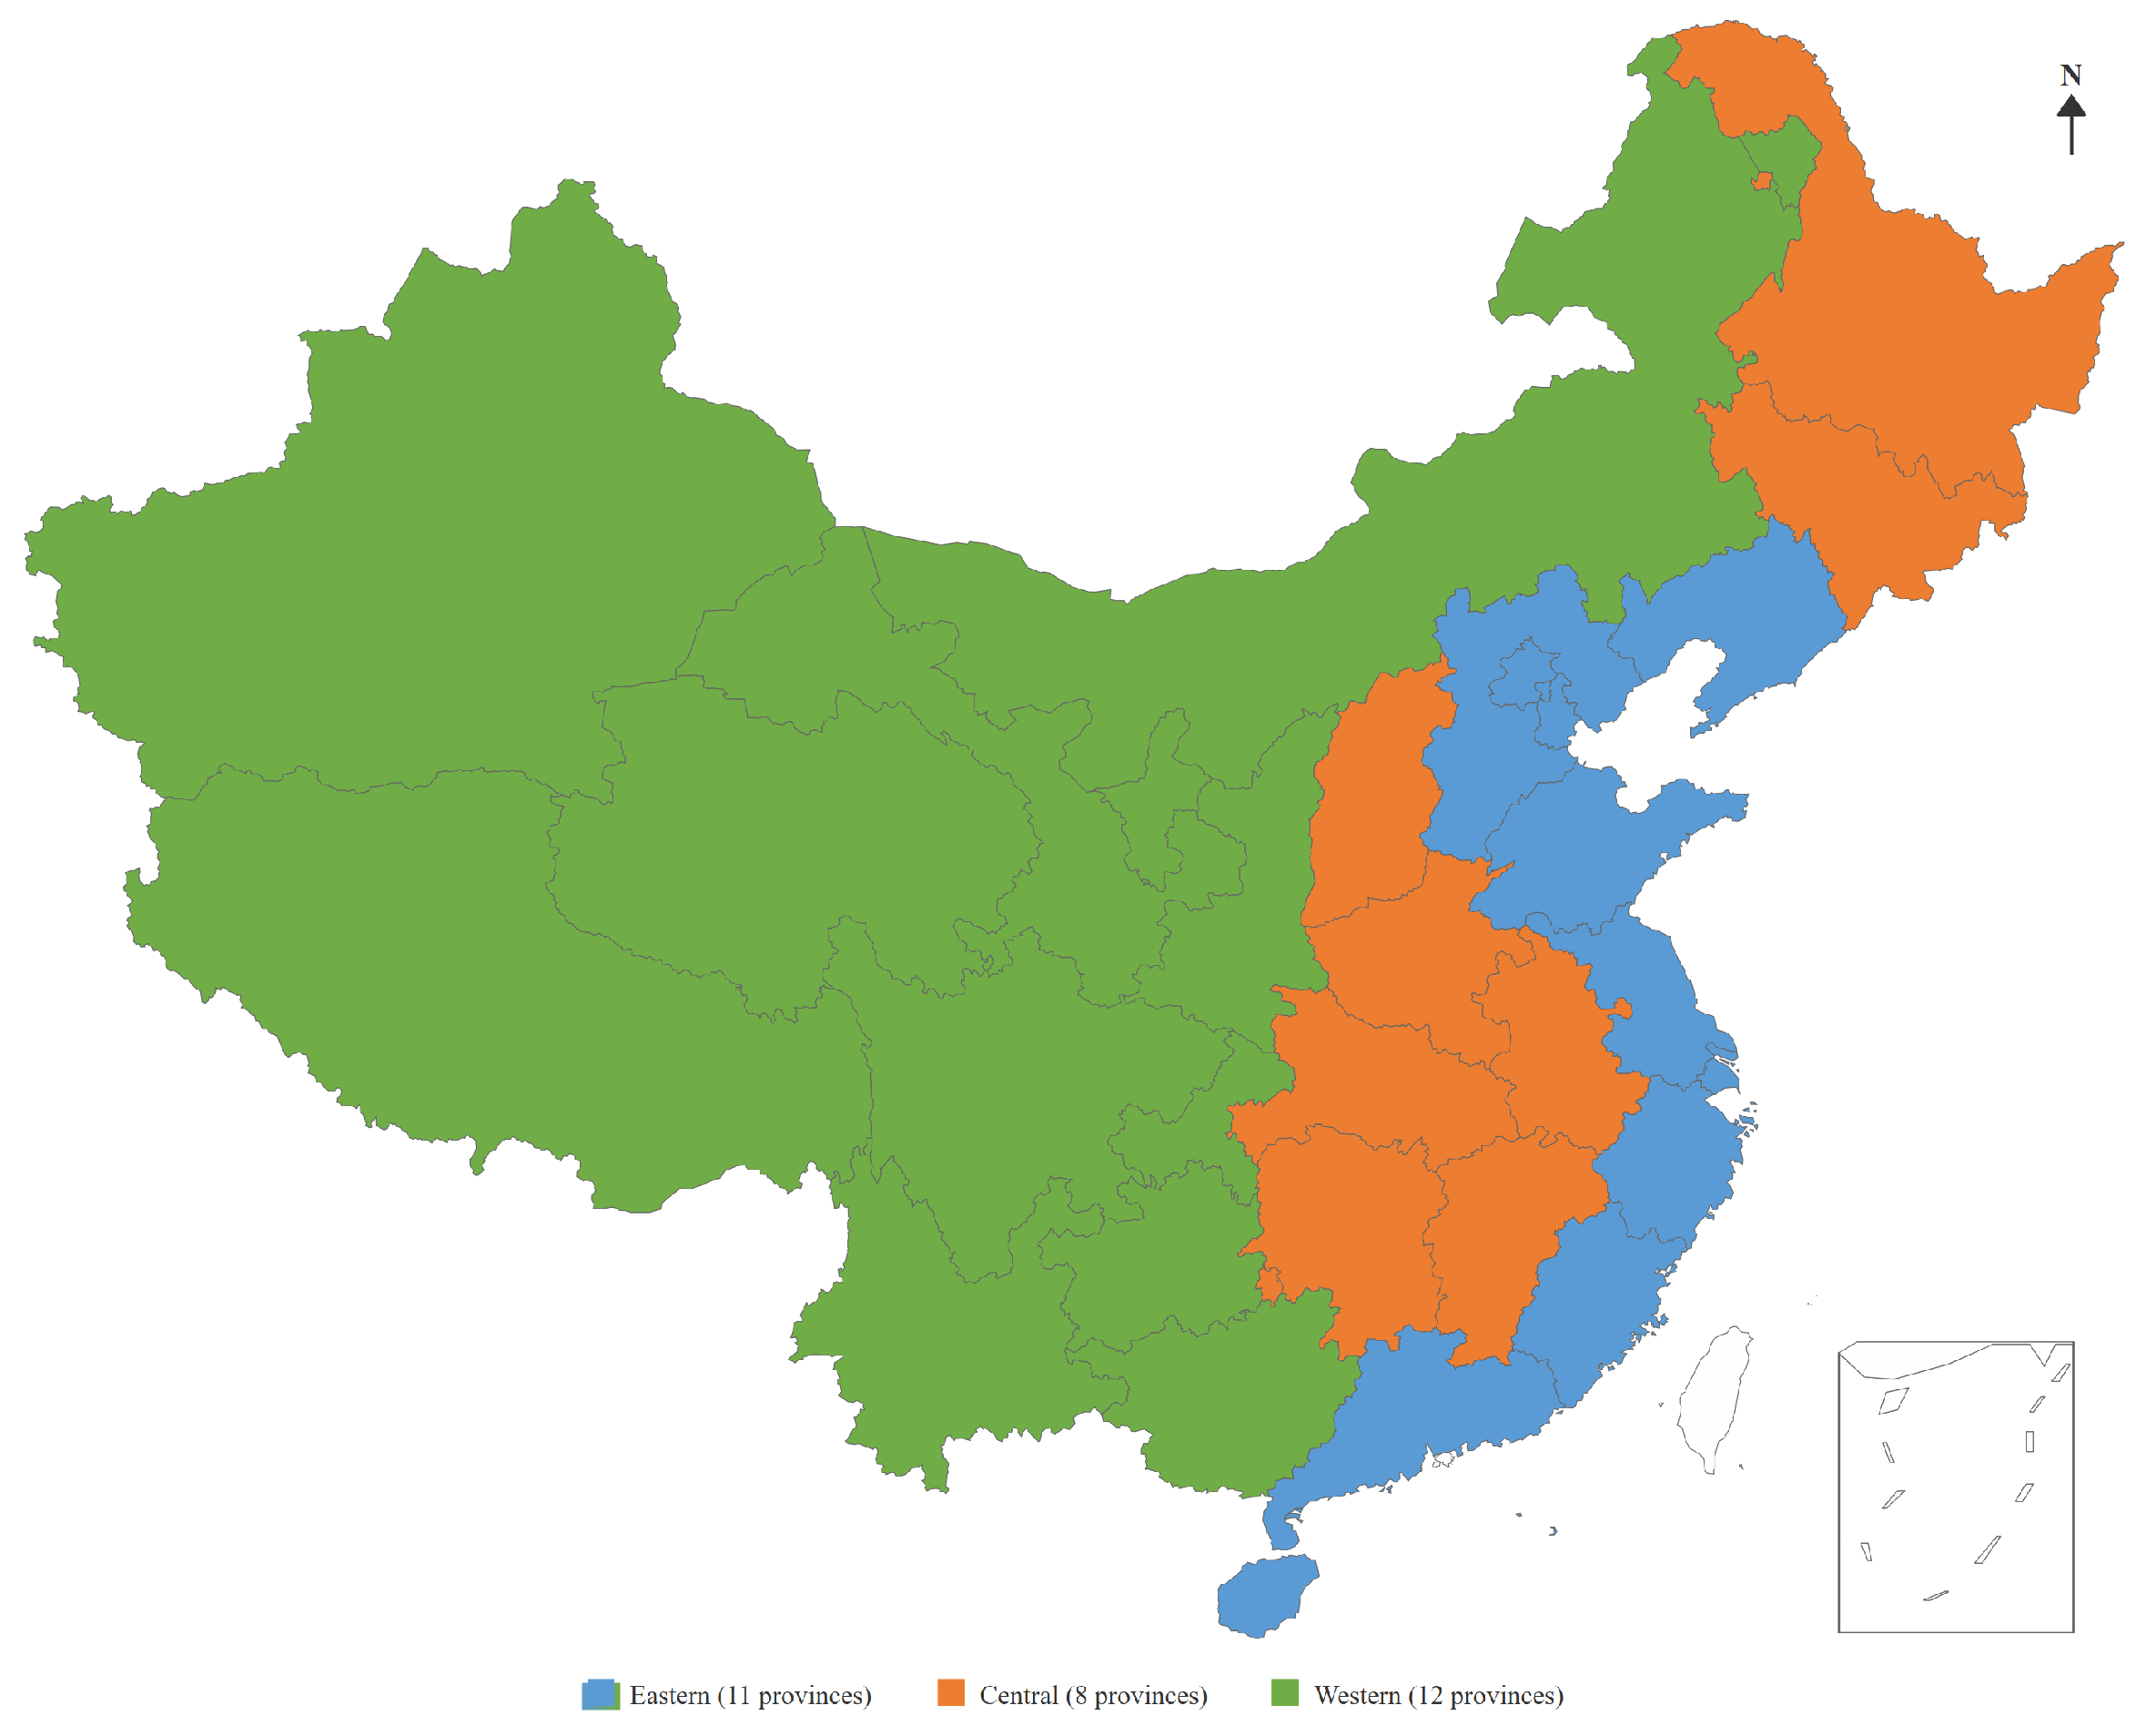
This study covers 30 Chinese provincial-level administrative units (excluding Tibet, Hong Kong, Macao, and Taiwan due to data availability constraints) over 2010–2022, yielding a balanced panel of 390 province-year observations. The starting year of 2010 is chosen because systematic provincial-level data on land circulation rates became available from the Ministry of Agriculture and Rural Affairs beginning that year; 2010 also marks the approximate inflection point after which land circulation accelerated rapidly following the 2008 Third Plenum reforms that clarified and strengthened rural land management rights [37,39]. Figure 2 displays the spatial distribution of the 30 study provinces across the three macro-regions.
Data are drawn from four primary sources. Socioeconomic indicators—GDP, population, urbanization rates, fiscal expenditures, and trade volumes—come from the China Statistical Yearbook and provincial statistical bulletins [1]. Land circulation data, specifically the area of circulated farmland and total household-contracted arable land area, are obtained from the China Rural Management Statistical Annual Report [8]. Education and healthcare indicators are sourced from the China Education Statistical Yearbook and the China Health Statistical Yearbook, respectively. Patent data come from the China Statistical Yearbook on Science and Technology.

3.2. Variable Construction

3.2.1. Dependent Variable: Common Prosperity Index

The measurement of common prosperity itself has attracted growing scholarly attention. Multidimensional provincial-level index construction using entropy weighting has become a methodological benchmark, with studies confirming that common prosperity levels have risen nationally but with persistent east–west gradients [40]. Digital inclusive finance, which has expanded rapidly in rural areas, is identified as an additional driver of common prosperity, with rural revitalization acting as a threshold moderating variable [40]. Zhang et al. [41] find that digital inclusive finance promotes common prosperity through mechanisms including income enhancement, consumption upgrading, and social security improvement, providing micro-level evidence of the multidimensional character of shared development. Li and Hu [4] find that formal and informal financial participation alleviate multidimensional relative poverty through the channels of land transfer and non-farm employment, directly linking financial access to the common prosperity agenda at the micro level.
This study constructs a multidimensional indicator system for common prosperity based on its dual dimensions of material prosperityand spiritual prosperity, following the established literature on the multidimensional measurement of common prosperity [42]. Material common prosperity is primarily reflected in two aspects: economic development and income distribution. The former captures the overall level of regional economic development and residents’ income-generating capacity, while the latter characterizes the urban–rural income gap and the degree of distributional equity.
Spiritual common prosperity is measured through public services and social security. Public services reflect the provision of education, healthcare, and cultural resources, thereby indicating equality of opportunity and the equalization of development conditions. Social security, in turn, captures the government’s role in risk-sharing and income redistribution.
Through this framework, the multidimensional nature of common prosperity is systematically characterized across four interrelated dimensions: development foundation, distribution structure, service provision, and institutional support. Table 1 presents the corresponding indicator system.
All indicators are normalized to the [0, 1] range using min-max standardization. For negative indicators (the urban–rural income ratio), we reverse the normalization so that higher values correspond to greater common prosperity. The entropy weight method assigns higher weights to indicators with greater cross-sectional variation, reducing subjective bias in weight selection. Table 2 reports the entropy values, diversity coefficients, resulting weights, and descriptive statistics for all twelve indicators.

3.2.2. Core Independent Variable: Land Circulation Rate

The land circulation rate (LCR) is defined as the ratio of circulated arable land area to total household-contracted arable land area, expressed as a percentage:
LCR i t = Circulated arable land area i t Total contracted arable land area i t × 100 %
This measure captures the extent to which farmland management rights have been transferred through rental, subcontracting, leasing, shareholding, exchange, or other arrangements in province i during year t. Following the established literature, the ratio of transferred farmland to contracted farmland is widely used as a proxy for farmland transfer intensity, as it directly reflects the scale of land reallocation across different transfer modes and market participants [43].
For presentation purposes, descriptive statistics are reported in percentage form (0–100). In regression analyses, LCR is rescaled into a proportion (divided by 100, ranging from 0 to 1), such that the estimated coefficients represent the effect of a one-unit (i.e., 100 percentage point) change, and a one-percentage-point change corresponds to one-hundredth of the reported coefficient.

3.2.3. Control Variables

To mitigate potential omitted variable bias, we include a set of control variables that may systematically affect common prosperity, following the related literature [32]. Specifically:
(1) Innovation capacity (RD) is measured by the intensity of regional R&D expenditure. Technological innovation enhances productivity and promotes income growth, thereby influencing both economic development and income distribution.
(2) Human capital (HUM) is proxied by the average years of schooling, calculated as 6 Q 1 + 9 Q 2 + 12 Q 3 + 16 Q 4 , where Q 1 Q 4 denote the shares of population with primary school, junior high school, senior high school, and college education or above, respectively. Higher human capital improves labor productivity and earning capacity, and thus plays a key role in shaping income inequality.
(3) Financial development (FIN) is measured by the ratio of total bank loans to GDP. Financial deepening facilitates capital allocation and investment, but may also have distributional effects by unevenly benefiting different groups.
(4) Government size (GOV) is captured by fiscal expenditure as a share of GDP. Government intervention affects resource redistribution and public service provision, thereby influencing the realization of common prosperity.
(5) Trade openness (OPEN) is defined as the ratio of total imports and exports to GDP. External openness affects income distribution through channels such as industrial upgrading and factor mobility.
These control variables have been widely used in the literature on income distribution and common prosperity, as they capture key economic, structural, and institutional factors influencing regional development and inequality [32,43].
Table 3 reports the descriptive statistics for all variables.
The CPI ranges from 0.198 (Guizhou, 2010) to 0.782 (Beijing, 2022), with a mean of 0.437 and standard deviation of 0.142, reflecting substantial variation both across provinces and over time. The land circulation rate varies from 4.3% (Yunnan, 2010) to 63.8% (Shanghai, 2022), with a sample mean of 32.6%.

3.3. Spatial Econometric Model

3.3.1. Spatial Weight Matrix

Spatial econometric models require a spatial weight matrix W that quantifies interactions between each pair of provinces [20]. We adopt an inverse-distance spatial weight matrix as the baseline specification:
w i j = 1 / d i j if d i j d ¯ and i j 0 otherwise
where d i j is the great-circle distance between the geographic centroids of provinces i and j, and d ¯ is the median inter-provincial distance. The matrix is row-standardized so that each row sums to one [20,21]. For robustness, we also employ an economic distance weight matrix (based on the inverse of absolute differences in per capita GDP) and a k-nearest-neighbor matrix with k = 5 .

3.3.2. Spatial Autocorrelation Test

We test for spatial autocorrelation using the global Moran’s I statistic [44]:
I = n S 0 · i = 1 n j = 1 n w i j ( y i y ¯ ) ( y j y ¯ ) i = 1 n ( y i y ¯ ) 2
where y i is the observation for province i, y ¯ is the sample mean, w i j is the element of the row-standardized weight matrix, and S 0 = i j w i j . Under the null hypothesis of spatial randomness, the standardized Moran’s I follows an asymptotic standard normal distribution. We supplement the global test with local Moran’s I (LISA) statistics to identify spatial clusters [45].

3.3.3. Spatial Durbin Model

Based on the LM tests and Wald/LR specification tests reported in Section 4, we select the Spatial Durbin Model as the primary estimation framework. The SDM nests both the Spatial Autoregressive Model (SAR) and the Spatial Error Model (SEM) as special cases, and allows spatial lags of both the dependent and independent variables [20,38]:
CPI i t = ρ j = 1 n w i j CPI j t + β 1 LCR i t + β 2 X i t + θ 1 j = 1 n w i j LCR j t + θ 2 j = 1 n w i j X j t + μ i + λ t + ε i t
where ρ is the spatial autoregressive coefficient; β 1 and θ 1 are coefficients on land circulation and its spatial lag; β 2 and θ 2 are coefficient vectors on controls and their spatial lags; μ i captures province fixed effects; λ t captures time fixed effects; and ε i t is the idiosyncratic error.
SDM coefficients cannot be directly interpreted as marginal effects due to feedback mechanisms in the spatial lag structure. Following LeSage and Pace [20], we decompose the total effect into direct effects (within-province impact, including feedback through neighbors) and indirect effects (spatial spillovers to other provinces).

3.4. Mechanism Test Model

To identify the channels through which land circulation affects common prosperity, we adopt a mechanism analysis framework, operationalized by Equation (5). Following the empirical strategy of Dell [46], who examines the persistent effects of Peru’s colonial mining mita by focusing on how the treatment influences a set of intermediate outcomes (e.g., land ownership, public goods provision, and market participation) without explicitly modeling the full transmission from these mediators to final outcomes, we concentrate on estimating the impact of LCR on potential mediating variables (M). In this framework, the identification of channels relies on whether LCR significantly affects these intermediate factors, which are direct determinants of common prosperity, as discussed in Section 2. Given that the baseline model is specified as an SDM, which explicitly accounts for spatial dependence, we use the SDM-based total effect of LCR on CPI, reported in Table 6, as the benchmark, rather than relying on coefficients from a non-spatial model.
M i t = γ j = 1 n w i j M j t + α 1 LCR i t + α 2 X i t + δ 1 j = 1 n w i j LCR j t + δ 2 j = 1 n w i j X j t + μ i + λ t + ε i t
where M i t denotes the mediator variable, including agricultural labor productivity, farmers’ income, and the urbanization rate. The coefficient α 1 captures the direct effect of local land circulation on the mediator, while δ 1 reflects spatial spillover effects from neighboring regions.

4. Empirical Results

4.1. Spatial-Temporal Patterns

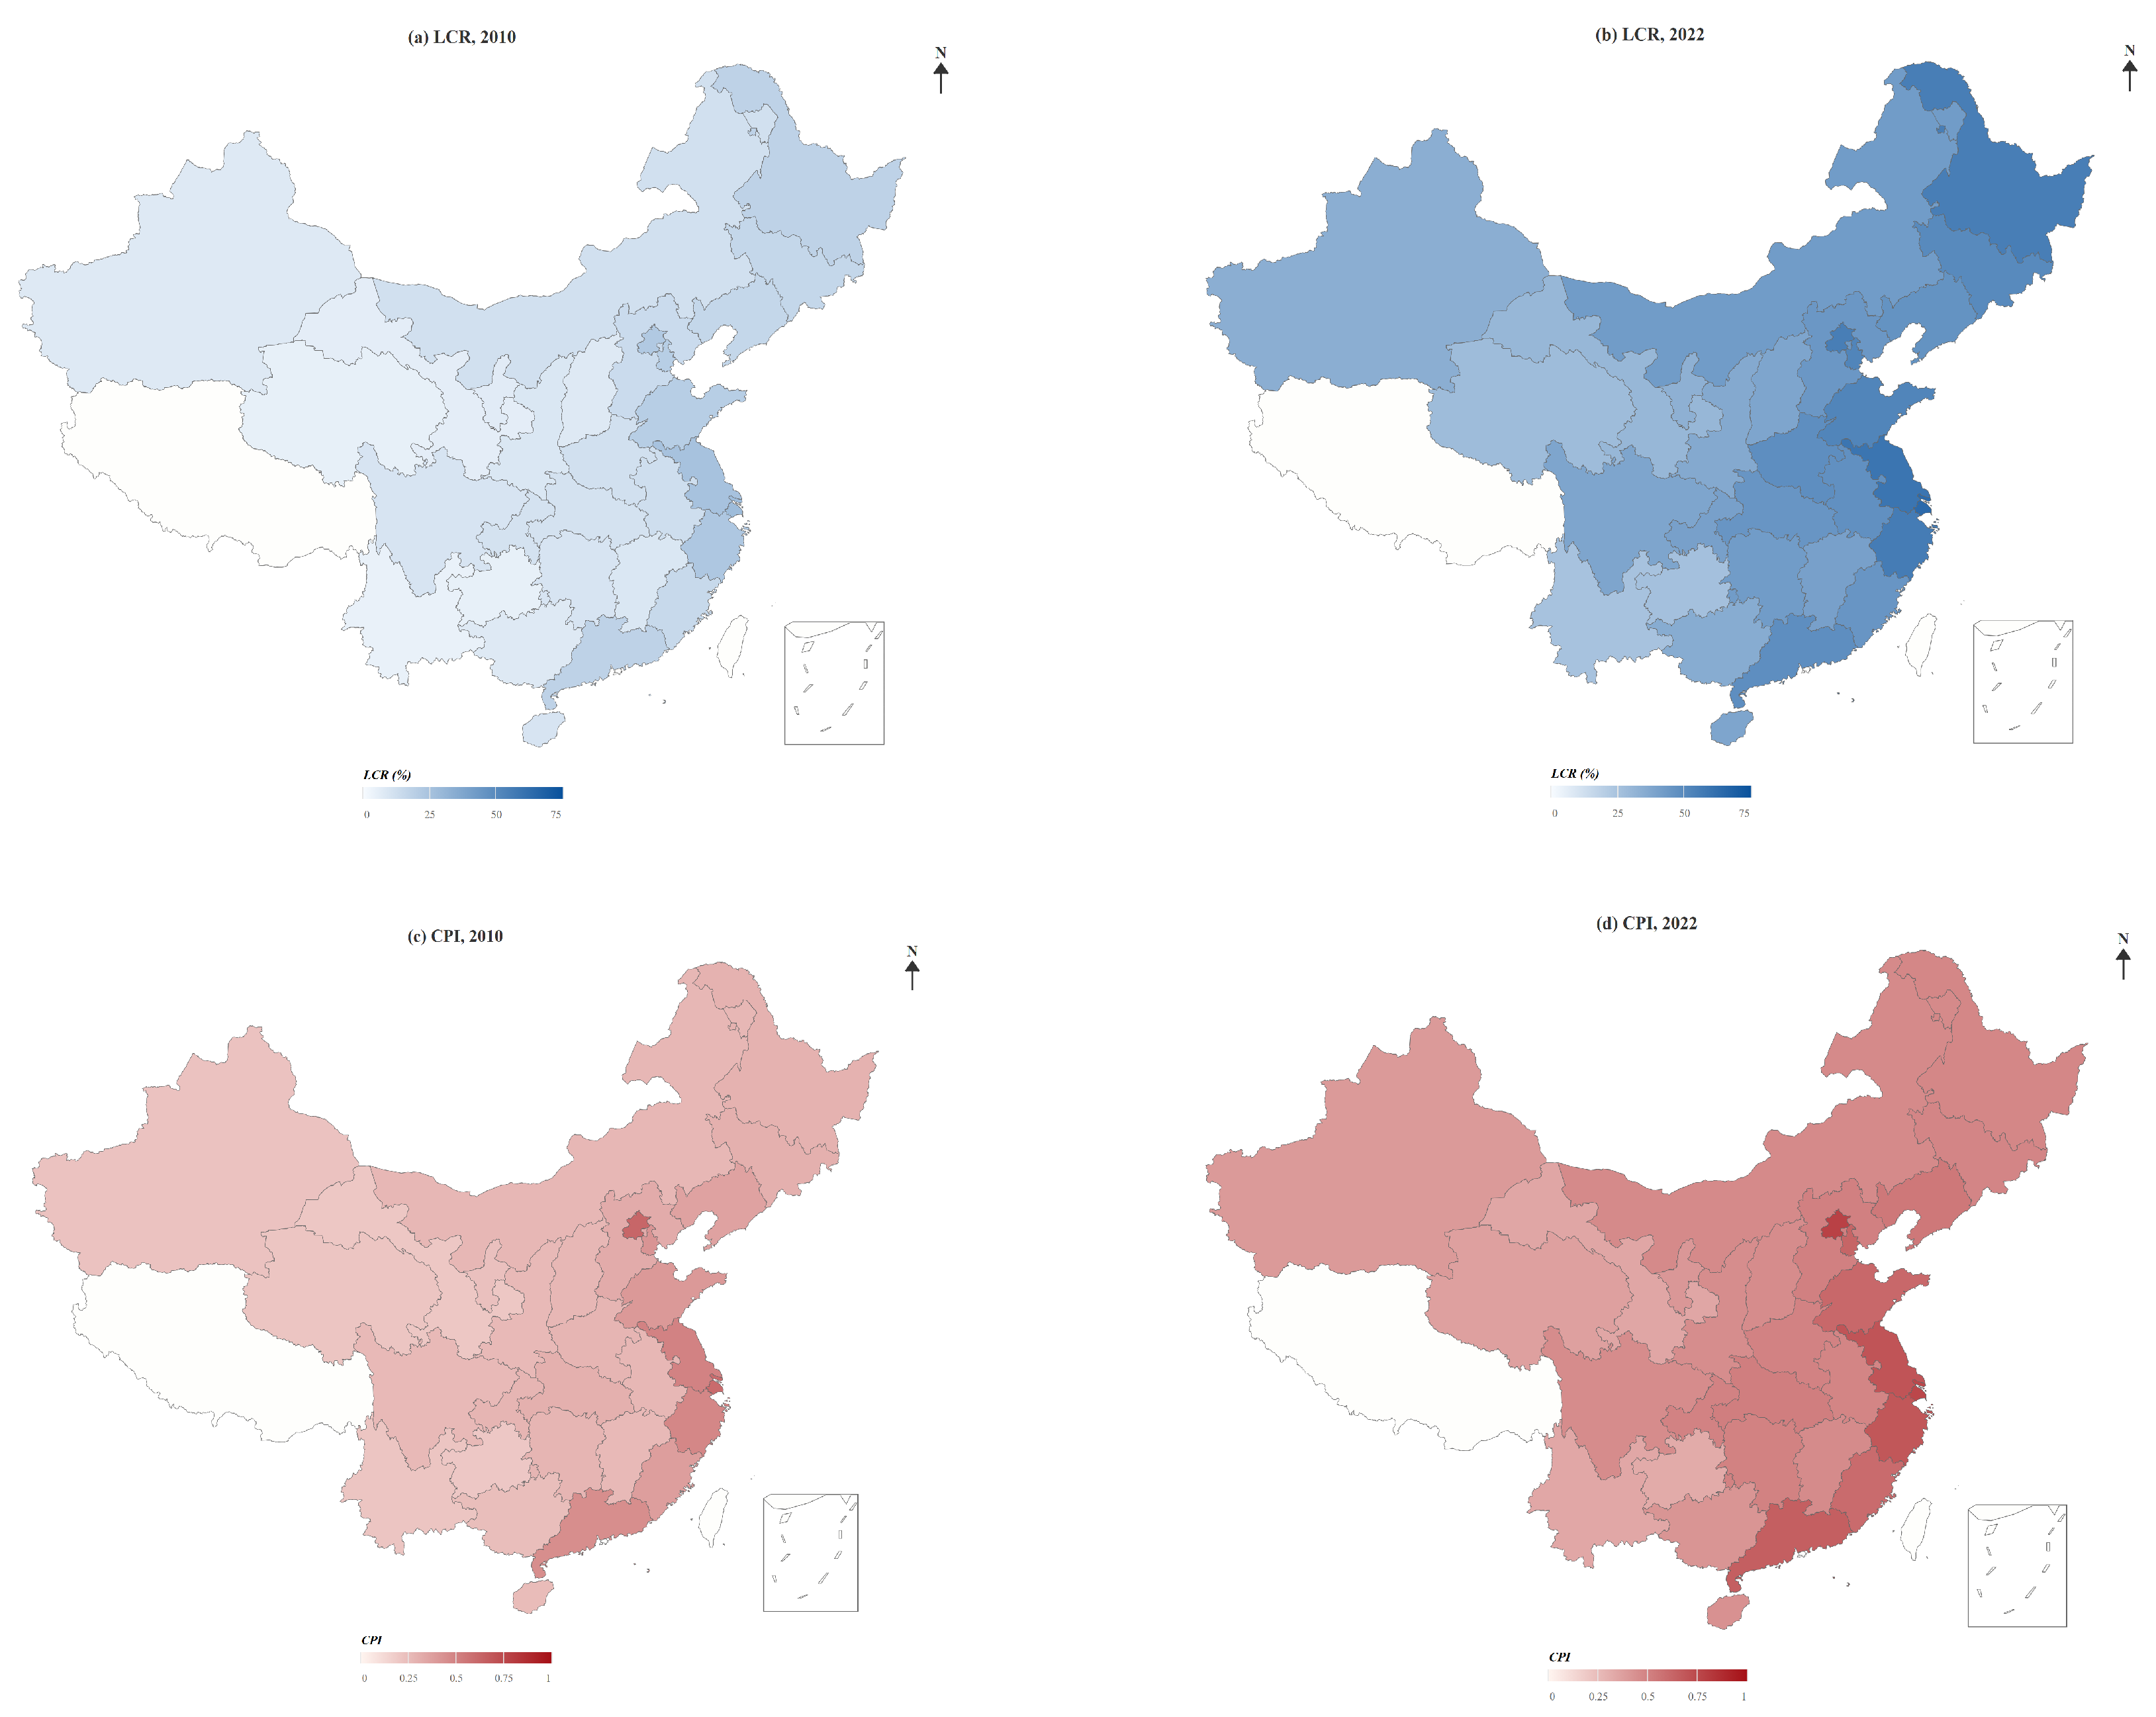
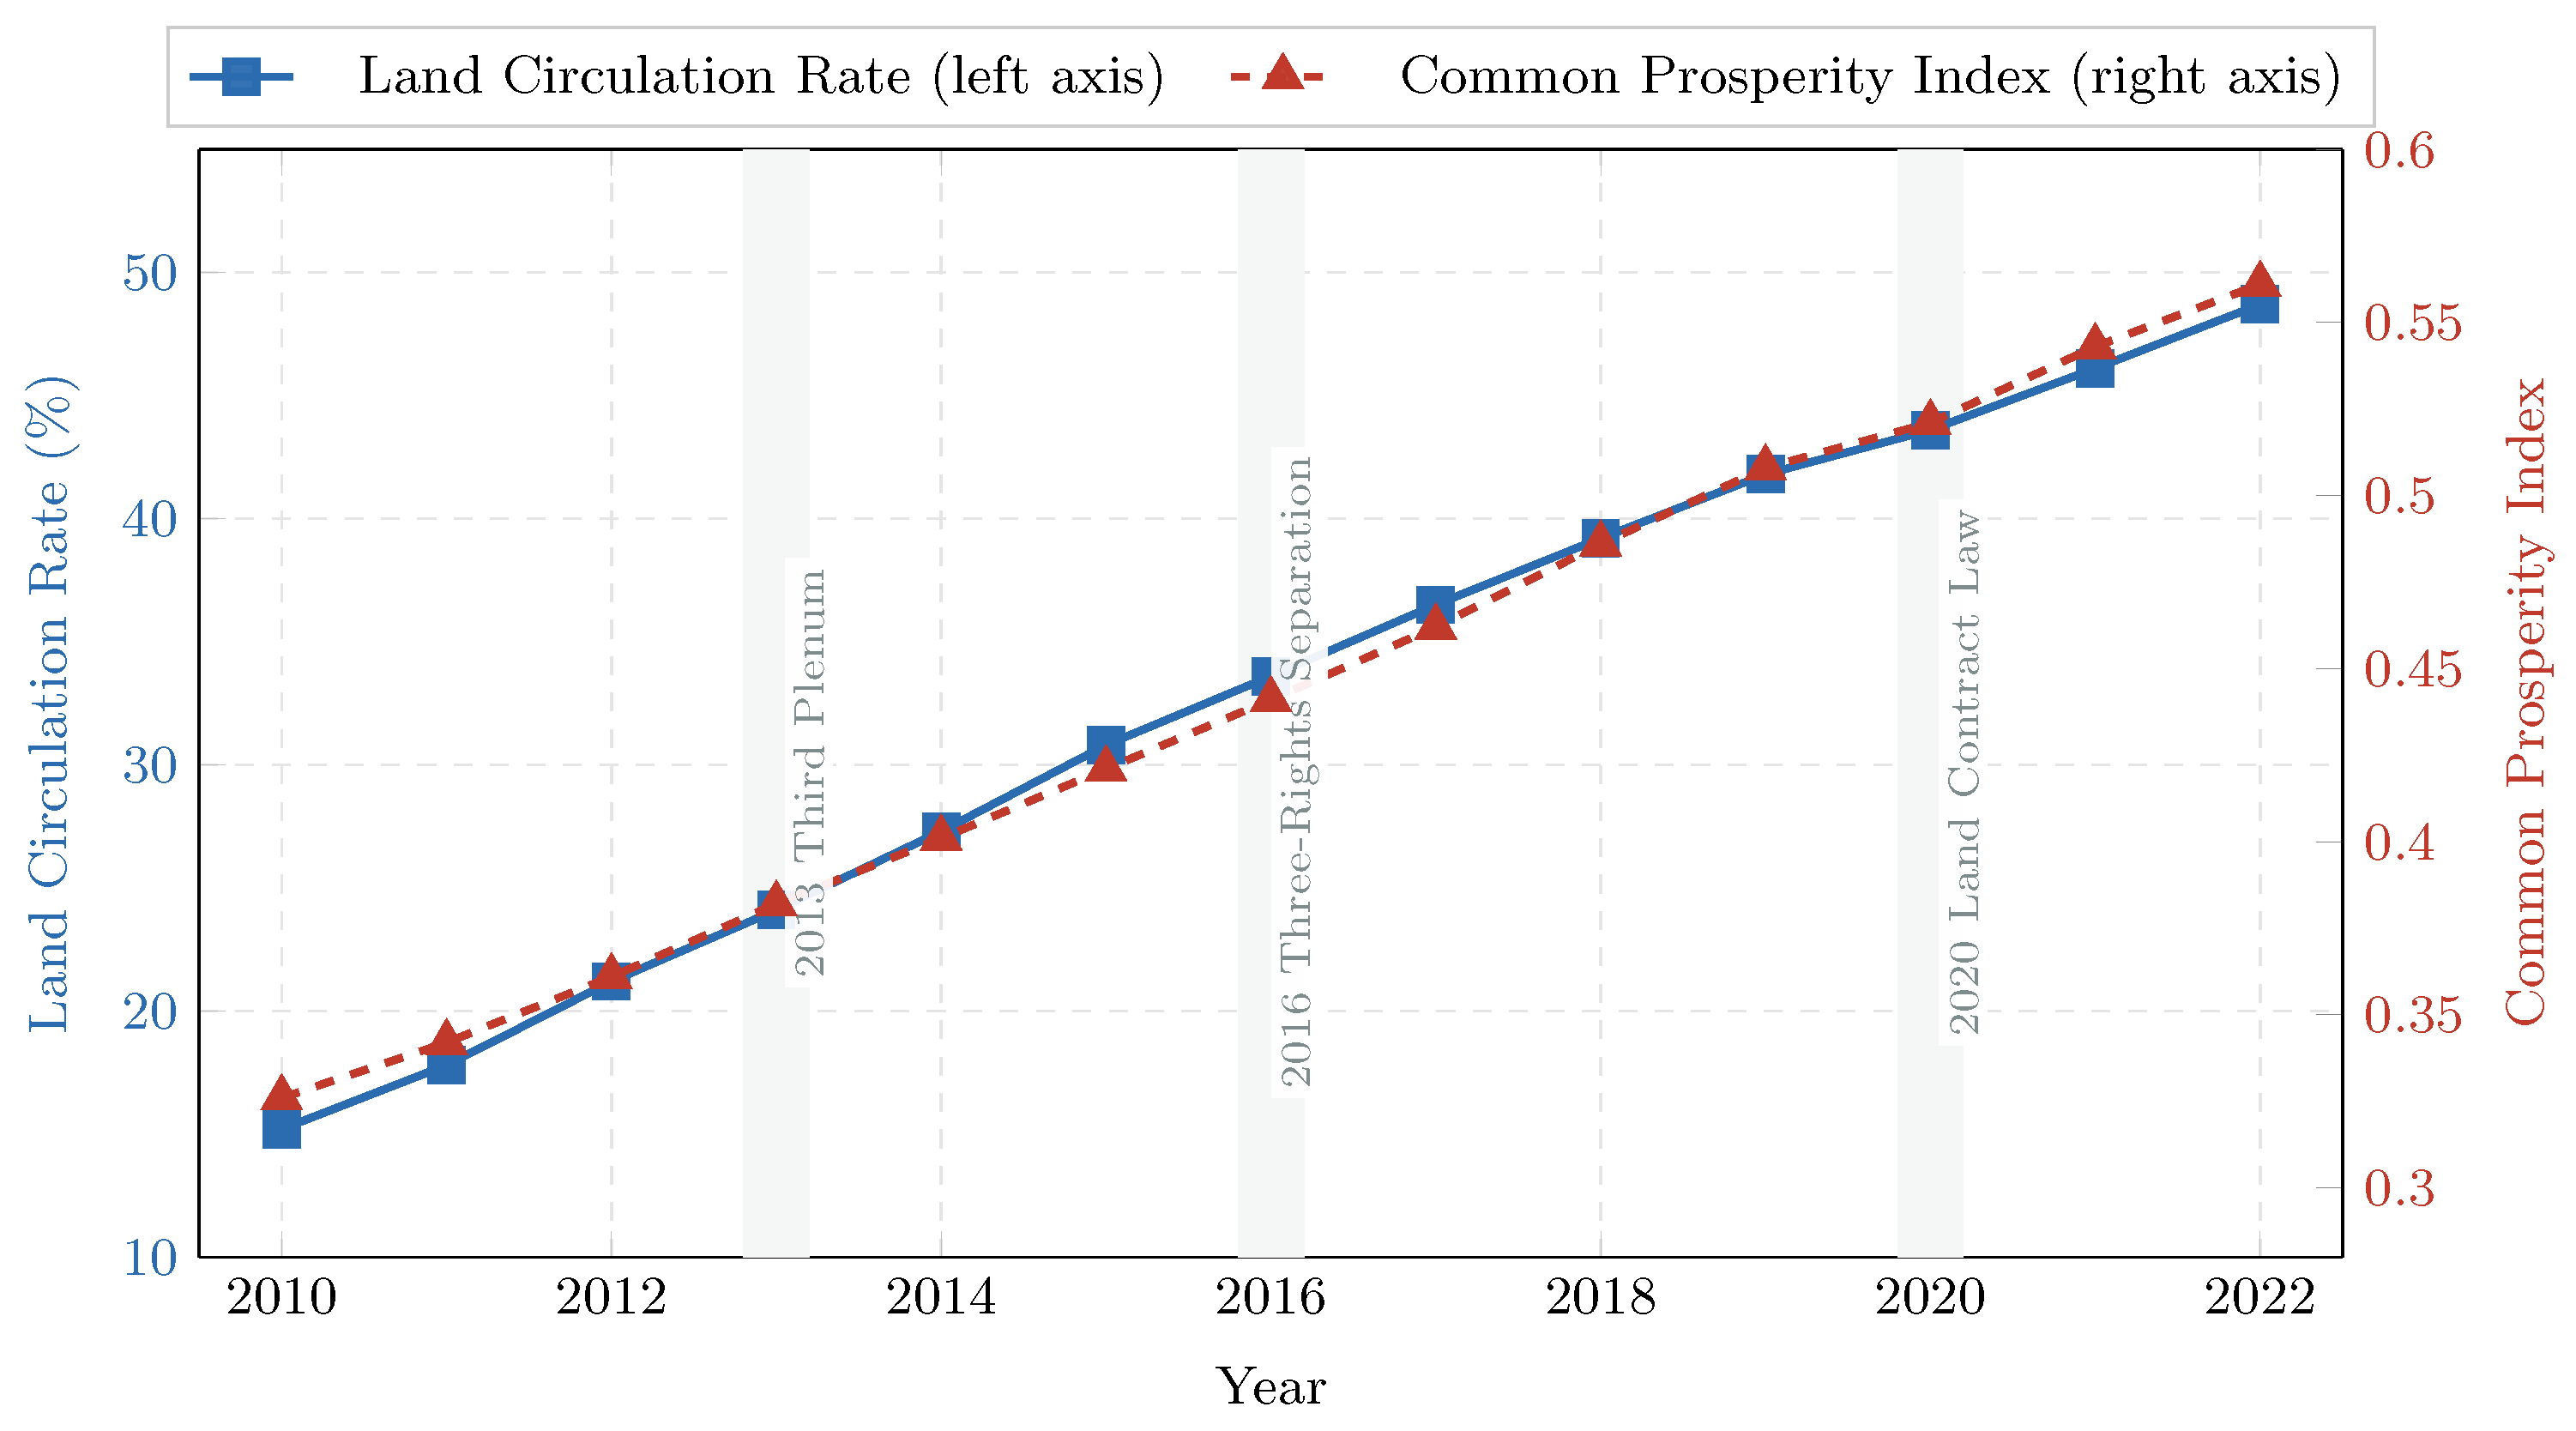
Figure 3 traces the national average land circulation rate and common prosperity index from 2010 to 2022. Both series exhibit clear upward trends: the mean LCR rose from 15.2% to 48.7%, while the mean CPI climbed from 0.326 to 0.561. These provincial simple means assign equal weight to each of the 30 provinces and therefore exceed the population- and area-weighted national aggregate reported by the Ministry of Agriculture and Rural Affairs (12.4% in 2010 and 38.1% in 2022); smaller provinces with relatively high circulation rates receive greater implicit weight in the unweighted sample average. The co-movement of these two series is suggestive, though not dispositive, of a positive relationship.
Geographically, high land circulation rates in 2010 clustered along the eastern coastal provinces (Jiangsu, Zhejiang, Shandong) and the northeast (Heilongjiang, Jilin), while the southwest (Guizhou, Yunnan, Guangxi) lagged behind. By 2022, rates had risen across the board, yet the east–west gradient persisted. The spatial pattern of common prosperity mirrors this gradient, with the Yangtze River Delta and Pearl River Delta consistently scoring highest and the western interior remaining lowest. Figure 4 maps the spatial distributions of both variables at the start and end of the study period.

4.2. Spatial Autocorrelation Analysis

Table 4 reports the global Moran’s I statistics for the CPI and LCR at two-year intervals from 2010 to 2022.
Moran’s I for the CPI ranges from 0.298 to 0.352, all significant at the 1% level, confirming positive spatial autocorrelation: provinces with high common prosperity tend to cluster near other high-prosperity provinces, and conversely for low-prosperity areas. For LCR, Moran’s I ranges from 0.218 to 0.287, also consistently significant. The slight decline over time for both variables suggests a modest convergence trend, though spatial dependence remains pronounced.
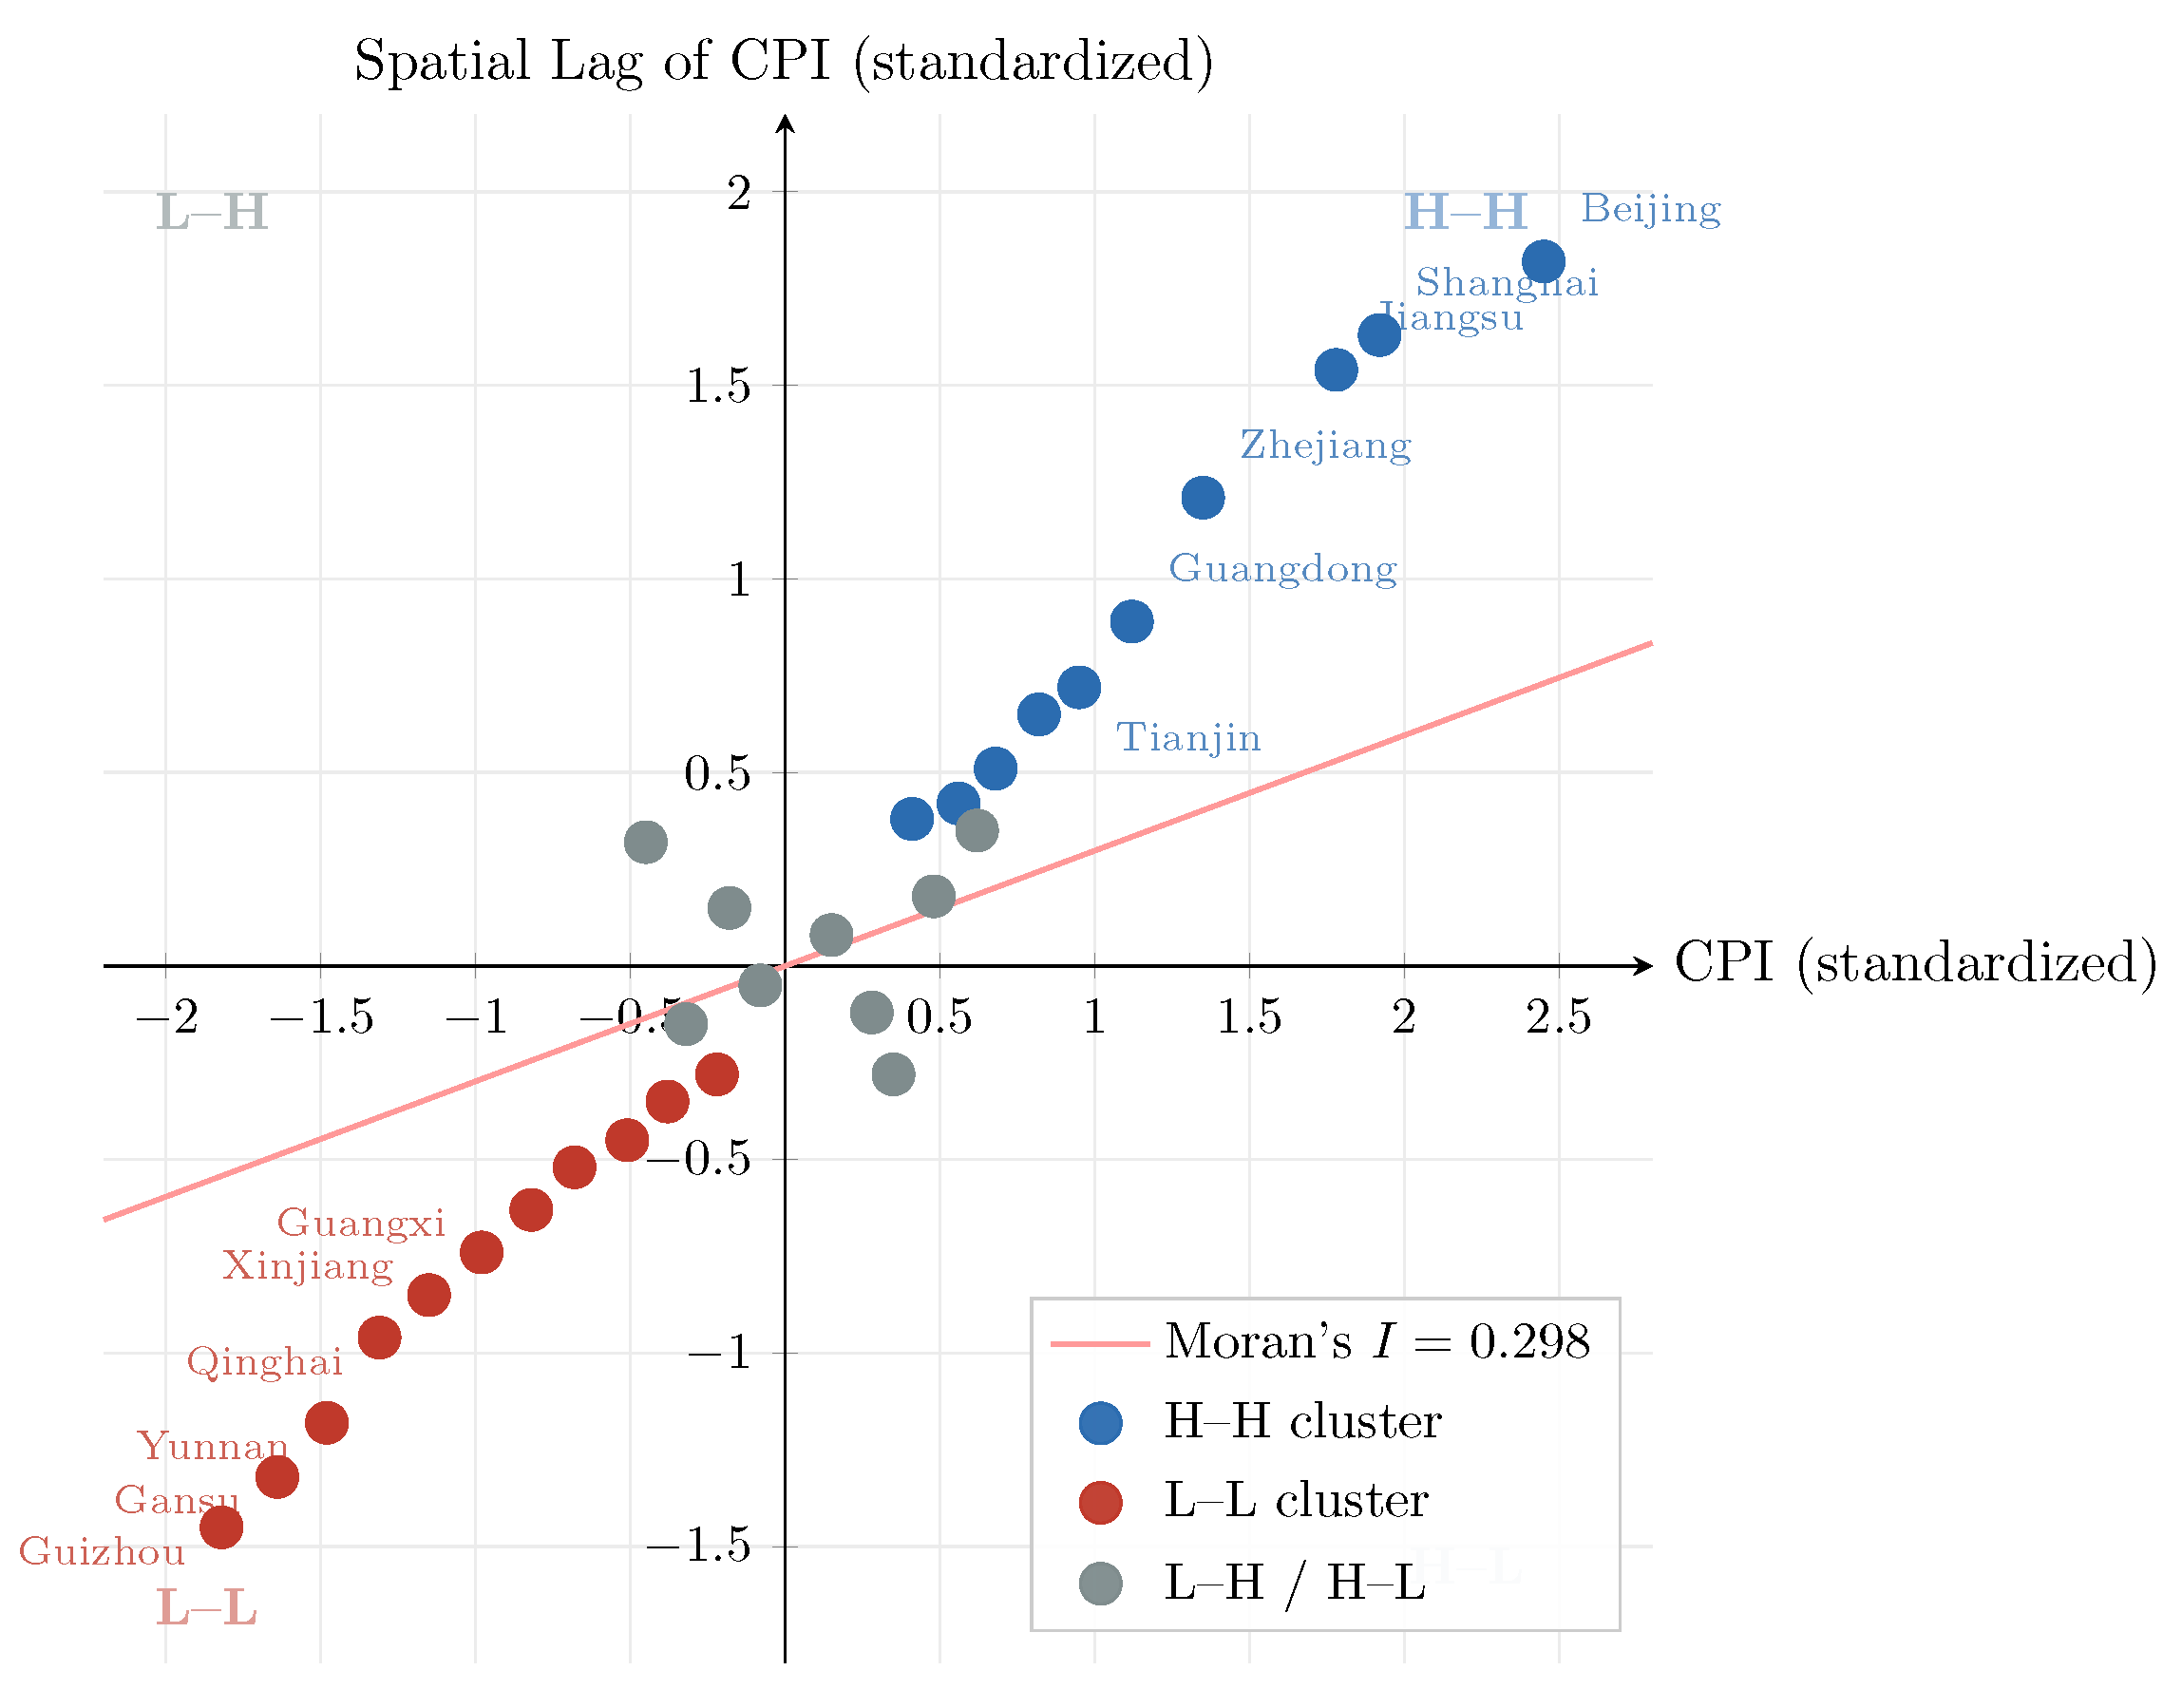
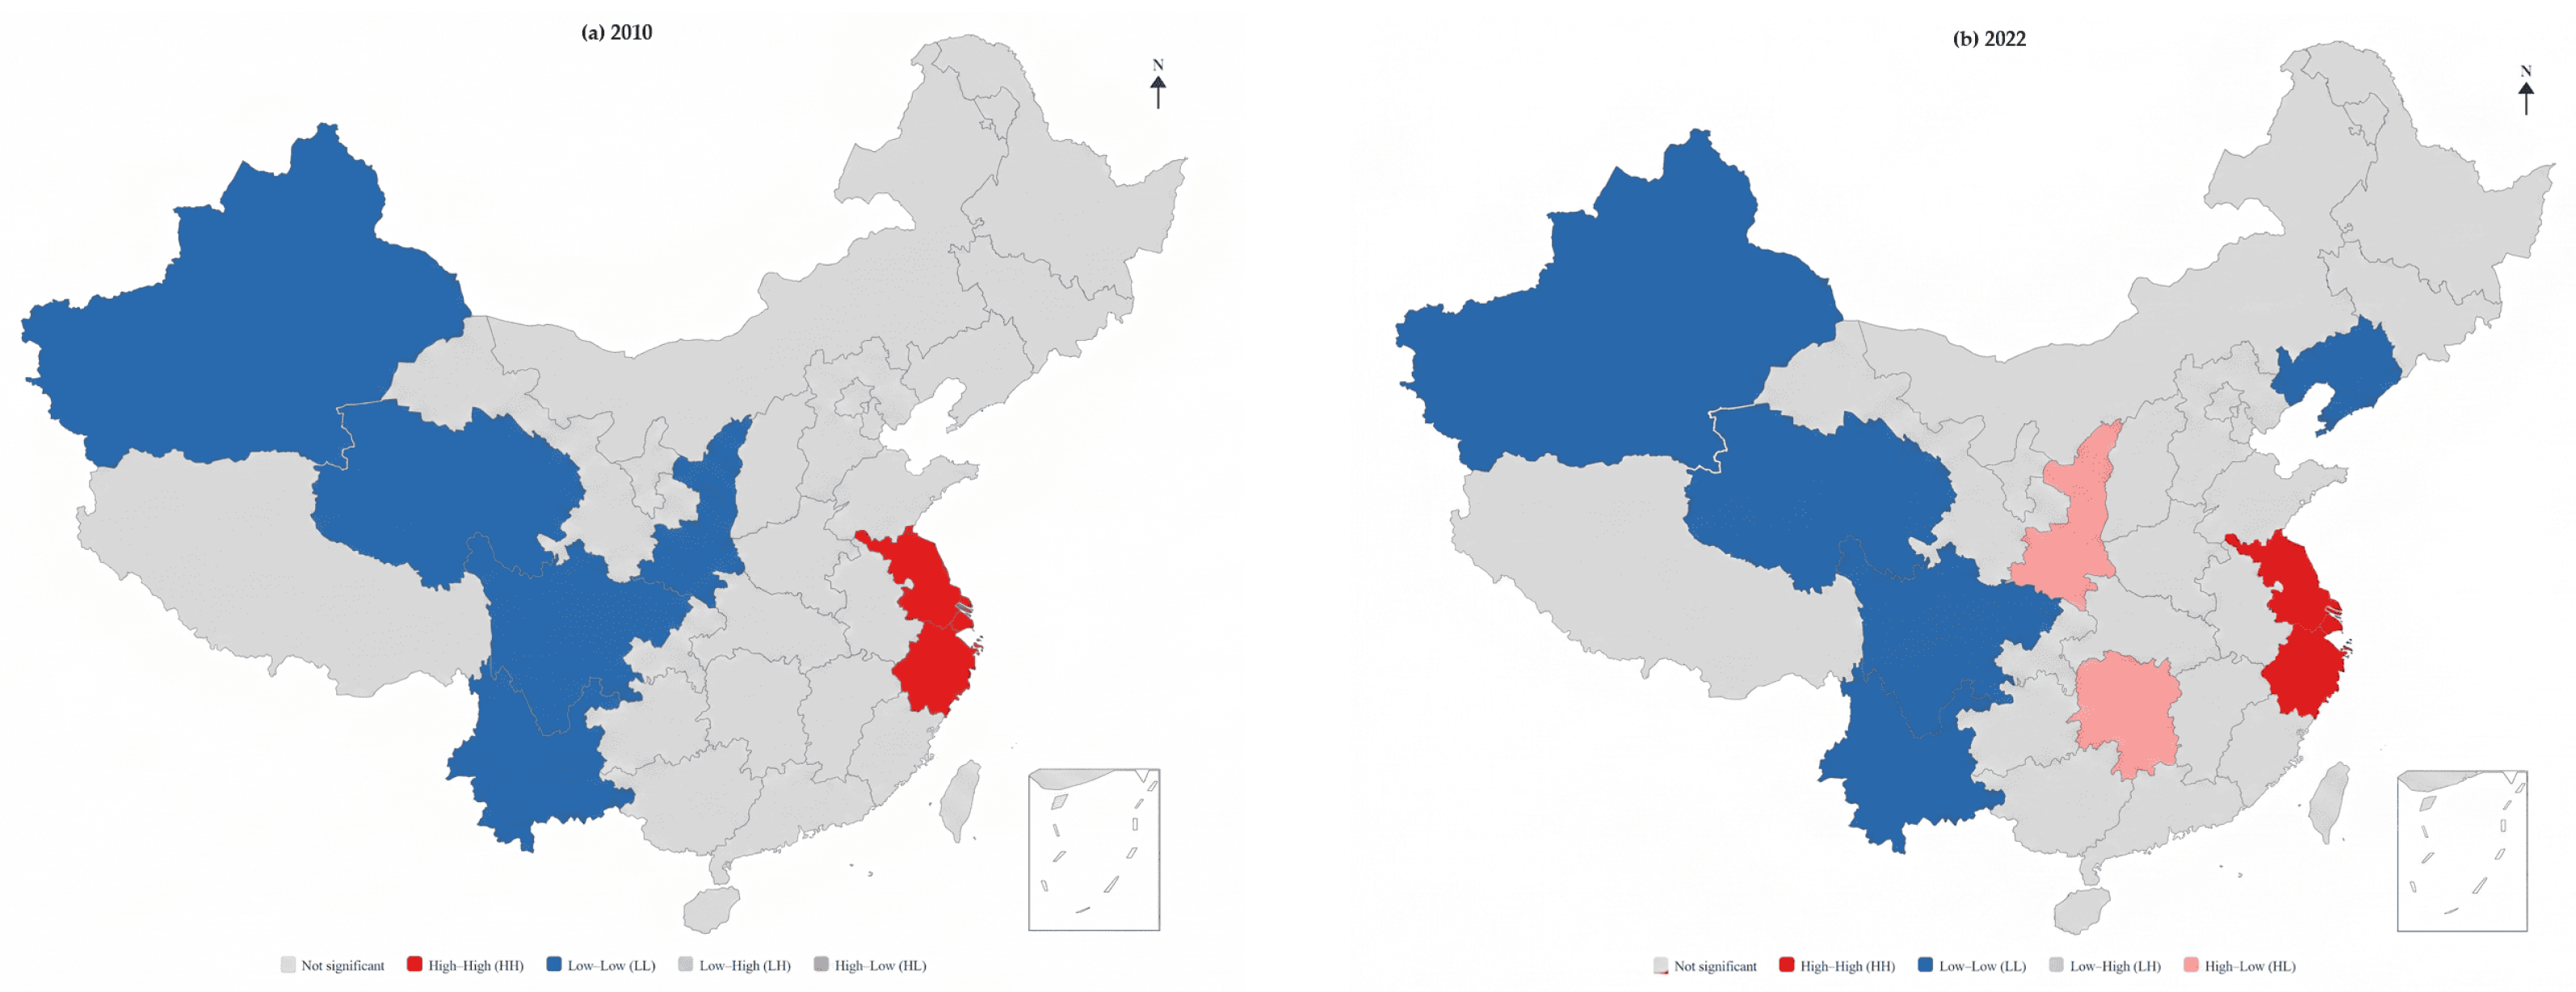
Figure 5 displays the Moran scatter plot for the 2022 CPI. Most provinces fall in the first quadrant (High–High: Shanghai, Jiangsu, Zhejiang, Fujian, Guangdong) or third quadrant (Low–Low: Gansu, Guizhou, Yunnan, Qinghai), consistent with the global test. Figure 6 presents the LISA cluster maps of the CPI, revealing clear spatial clustering patterns. High–High clusters are mainly concentrated in eastern coastal provinces, whereas Low–Low clusters are predominantly located in western interior regions.

4.3. Model Selection

Table 5 presents the results of spatial model selection tests.
The Hausman test ( χ 2 = 41.58 , p < 0.01 ) rejects the random-effects specification in favor of fixed effects. Both the LM-lag (26.91) and LM-error (18.42) statistics strongly reject the null hypothesis of no spatial dependence at the 1% level, and their robust counterparts remain statistically significant—Robust LM-lag at the 1% level and Robust LM-error at the 5% level—indicating that neither the SAR nor the SEM specification alone adequately captures the spatial dependence structure. Further model comparison using LR and Wald tests consistently favors the SDM over its nested alternatives: the LR tests reject the restrictions implied by both the SAR (17.65, p < 0.05 ) and SEM (21.06, p < 0.01 ), with the Wald tests yielding similar conclusions. Taken together, these results provide strong empirical support for adopting the two-way fixed-effects SDM as the preferred specification.

4.4. Spatial Durbin Model Estimation

Table 6 presents the main regression results. Column (1) reports OLS as a non-spatial benchmark; columns (2)–(4) report the SAR, SEM, and SDM estimates, respectively.
In the OLS benchmark, the LCR coefficient is 0.152 ( p < 0.01 ), suggesting that a one-percentage-point increase in the land circulation rate is associated with a 0.00152-unit increase in the CPI. Among the control variables, innovation capacity (RD) and human capital (HUM) exhibit significantly positive coefficients, indicating that technological progress and educational improvement contribute positively to common prosperity. Financial development (FIN) is weakly significant in the OLS and SEM models, but becomes insignificant after accounting for spatial dependence. Government size (GOV) shows a negative but insignificant coefficient, while trade openness (OPEN) remains statistically insignificant across all specifications.
The SDM estimates in column (4) provide further insights. The spatial autoregressive coefficient ρ is 0.257 ( p < 0.01 ), confirming significant positive spatial dependence in common prosperity across provinces. The coefficient of LCR remains significantly positive at 0.134 ( p < 0.01 ), although slightly smaller than the OLS estimate, suggesting that non-spatial models may overestimate the local effect by ignoring spatial interactions. The spatial lag term of land circulation ( W   × LCR) is positive and significant at the 5% level, indicating that land circulation in neighboring provinces also promotes local common prosperity through spatial spillover effects. Among the spatially lagged control variables, only W   × RD is weakly significant and positive, suggesting that technological innovation may generate cross-regional spillovers.

4.5. Effect Decomposition

Table 7 decomposes the SDM estimates into direct, indirect (spillover), and total effects.
For land circulation, the direct effect is 0.131 ( p < 0.01 ), the indirect effect is 0.063 ( p < 0.05 ), and the total effect is 0.194 ( p < 0.01 ). The direct effect accounts for approximately 67.5% of the total effect, while the remaining 32.5% is attributable to spatial spillovers, indicating that rural land circulation not only improves local common prosperity but also generates positive externalities for neighboring provinces through labor mobility, factor flows, and policy diffusion.
In economic terms, a one-standard-deviation increase in LCR (16.8 percentage points) raises the CPI by approximately 0.022 through direct channels and 0.011 through spillover channels, resulting in a combined increase of about 0.033 on the 0–1 CPI scale. Given that the sample standard deviation of CPI is 0.142, this corresponds to approximately 23.2% of one standard deviation, suggesting that the economic magnitude of land circulation is substantial.
Among the control variables, innovation capacity (RD) and human capital (HUM) exhibit significantly positive direct and total effects. Specifically, the total effect of RD is 0.083 ( p < 0.05 ), implying that technological innovation contributes to common prosperity primarily through productivity improvement and income enhancement. Human capital also shows a positive total effect of 0.050 ( p < 0.05 ), indicating that education and skill accumulation play an important role in reducing inequality and improving welfare.
By contrast, financial development (FIN), government size (GOV), and trade openness (OPEN) do not exhibit statistically significant total effects once spatial dependence is explicitly incorporated into the SDM framework. This suggests that their impacts on common prosperity may be more indirect, region-specific, or conditional on institutional and structural contexts rather than universally positive across provinces.

4.6. Mechanism Analysis

Table 8 reports the spatial effects of land circulation on three key mechanism variables. Across all channels, land circulation exerts positive and statistically significant total effects, indicating that it promotes agricultural productivity, farmer income, and urbanization, albeit with varying magnitudes.
A clear hierarchy emerges across channels. The total effect is strongest for farmer income (0.165, p < 0.01 ), followed by agricultural productivity (0.133, p < 0.05 ) and urbanization (0.109, p < 0.05 ). This pattern suggests that income growth constitutes the primary transmission channel through which land circulation contributes to common prosperity, while productivity improvements and structural transformation play complementary roles.
Decomposing the effects reveals that direct effects dominate across all channels, whereas indirect (spillover) effects are generally weaker and less precisely estimated. In particular, the spillover effects for agricultural productivity and urbanization are not statistically significant, indicating that these processes are largely localized. Agricultural production is inherently place-specific and constrained by land tenure arrangements, agro-ecological conditions, and localized technology adoption, which limit cross-regional diffusion. Similarly, urbanization is shaped by institutional frictions—most notably the hukou system and the localized provision of public services—which restrict the spatial transmission of urbanization benefits across provinces [30,33].
By contrast, the income channel exhibits a statistically significant spillover effect, consistent with the high mobility of labor and the integration of regional labor markets. Land circulation facilitates labor reallocation toward higher-productivity non-agricultural sectors, and these gains can extend beyond provincial boundaries through migration and interregional economic linkages. Recent evidence suggests that reforms easing hukou restrictions further amplify these effects by improving migrant workers’ access to urban labor markets and social protection [34,35]. Moreover, confirmation of homestead rights can complement land circulation by clarifying household property stakes and strengthening the income effects associated with labor transfer [10,27].
Overall, these findings indicate that the effects of land circulation operate primarily through local structural transformation, with spatial spillovers playing a channel-specific role. The dominance of the income channel underscores the importance of labor mobility in translating land market reforms into broad-based welfare improvements, while the limited spillovers in productivity and urbanization highlight the persistence of technological and institutional barriers to cross-regional diffusion.

4.7. Heterogeneity Analysis

4.7.1. Regional Geographic Heterogeneity

We re-estimate the SDM separately for China’s three macro-regions: eastern (10 provinces), central (8 provinces), and western (12 provinces). The classification follows the standard National Bureau of Statistics three-region framework: the eastern region comprises ten coastal provinces (Beijing, Tianjin, Hebei, Liaoning, Shanghai, Jiangsu, Zhejiang, Fujian, Shandong, and Guangdong); the central region includes eight interior provinces (Shanxi, Jilin, Heilongjiang, Anhui, Jiangxi, Henan, Hubei, and Hunan); and the western region covers the remaining twelve provinces.1 Table 9 reports the results.
The coefficient is largest in the central region (0.203, p < 0.01 ). Central provinces—Henan, Hubei, Hunan, Anhui, Jiangxi, Shanxi, Heilongjiang, and Jilin—form China’s agricultural heartland, where arable land is abundant and the potential gains from consolidation are high but land circulation started later than in the east. The marginal return to circulation in these provinces remains steep: moving from small-scale fragmented farming to moderate-scale consolidated operations generates large productivity and income gains.
In the western region, the coefficient is 0.154 ( p < 0.05 ), positive and significant but smaller than in the center. Western provinces face compounding constraints—poor infrastructure, mountainous terrain, lower education levels—that limit the translation of land circulation into common prosperity. In Guizhou and Yunnan, for instance, much arable land lies on steep hillsides where consolidation yields smaller mechanization benefits than on the central plains.
In the eastern region, the coefficient is 0.079 (p > 0.10), positive but statistically insignificant. Eastern provinces have the longest history of land circulation and the highest current rates. The insignificance suggests diminishing marginal returns: once land markets are well-established, further increases in circulation yield limited additional common prosperity gains. This pattern is consistent with a concave relationship in which the steepest gains accrue during the transition from low to moderate circulation rates.

4.7.2. Digital Economy Heterogeneity

We further split the sample into high- and low-digital-economy groups based on the provincial digital development index, using the annual median as the cutoff, and re-estimate the SDM to assess heterogeneous effects of land circulation. The detailed results are reported in Table 9.
In provinces with higher digital development, the total effect of land circulation is 0.173 ( p < 0.01 ), indicating a strong and statistically significant impact on common prosperity. Advanced digital infrastructure, widespread rural e-commerce, and digital agricultural services reduce geographic and information frictions in land transactions. These conditions improve matching efficiency, lower transaction costs, and foster the integration of scale agriculture with modern service sectors, thereby amplifying the prosperity-enhancing effect of land circulation.
By contrast, in provinces with lower digital development, the total effect is 0.096 ( p > 0.10 ) and statistically insignificant. Limited digital infrastructure, weak information flows, and restricted access to digital tools constrain standardized land transfers and the expansion of scale operations. Insufficient digital governance further impedes efficient factor allocation, diminishing the marginal contribution of land circulation to income growth and common prosperity.
Overall, the digital economy serves as a critical enabling condition. The results point to a complementary relationship between land market reform and digital transformation, whereby land circulation exerts a stronger and more pronounced effect on common prosperity in digitally advanced regions.

4.8. Robustness Checks

Table 10 summarizes five robustness tests.
Robustness checks confirm the stability of the baseline results. Replacing the spatial weight matrix with alternative specifications—economic distance (row 2) and k-nearest neighbors (row 3)—yields total effects of 0.181 and 0.188, respectively, both significant at the 1% level and closely aligned with the baseline estimate of 0.194 (row 1).
Furthermore, reconstructing the Common Prosperity Index (CPI) using principal component analysis (PCA) produces a coefficient of 0.108 (row 4), which remains positive and statistically significant at the 1% level, indicating that the results are robust to alternative measurement strategies. Excluding the four direct-administered municipalities (row 5), which may exhibit distinct administrative and economic characteristics, leads to a slightly larger coefficient (0.205), suggesting that the baseline estimate is, if anything, conservative relative to the purely provincial sample.
To further address potential endogeneity concerns, we follow Yan et al. [47] and employ an instrumental variable approach using the interaction between terrain ruggedness and year ( Terr × Year ). This instrument is justified on several grounds. First, terrain ruggedness satisfies the relevance and exogeneity conditions: regions with more rugged terrain face higher barriers to land circulation, while terrain itself is unlikely to directly affect common prosperity. Second, terrain-based instruments have been widely used in the literature and are generally considered credible. Third, interacting terrain ruggedness with time introduces variation that overcomes the time-invariant nature of geographic characteristics.
The results (row 7) show that the Sargan test fails to reject the null hypothesis, indicating no evidence of over-identification and supporting the validity of the instrument. The coefficient on LCR remains positive and statistically significant (0.156, p < 0.01 ), confirming that the baseline findings are robust after accounting for endogeneity.

5. Discussion

5.1. Interpretation of Main Findings

The central finding—that rural land circulation exerts a positive and statistically significant effect on common prosperity within a spatial framework—extends the existing literature by explicitly incorporating spatial dependence into the analysis of land market reforms. The estimated total effect indicates that land circulation is not only statistically significant but also economically meaningful in promoting multidimensional shared development.
Three aspects of the results merit further discussion. First, the presence of significant spatial spillover effects suggests that the benefits of land circulation are not confined to local jurisdictions but propagate across regions. This pattern is consistent with the mobility of labor and capital induced by land reallocation. For example, the release of surplus agricultural labor in inland provinces can contribute to production and income generation in coastal regions through migration and factor reallocation [19,22]. At the same time, institutional innovations in land circulation—such as rural land rights reforms and cooperative farming practices—may diffuse across regions through policy learning and intergovernmental interaction [37,39]. These findings highlight that land circulation operates within an integrated economic space rather than in isolated local markets.
Second, the channel analysis indicates that land circulation is closely associated with improvements in agricultural productivity, farmer income, and urbanization. Among these pathways, the role of income growth appears particularly important. This suggests that the contribution of land circulation to common prosperity is primarily realized through its impact on household-level income rather than solely through aggregate production efficiency. A plausible explanation is that land circulation facilitates labor reallocation from low-productivity agricultural activities to higher-return non-agricultural sectors, thereby generating more immediate and broadly distributed welfare gains [18,22]. In contrast, productivity improvements, while important, may operate more gradually and be less evenly distributed across households.
Third, the contribution of urbanization, although positive, appears comparatively limited. While land circulation promotes rural–urban migration, institutional constraints on migrants’ access to urban public services may weaken the extent to which urbanization translates into inclusive welfare gains [30,33]. This suggests that the effectiveness of the urbanization channel depends critically on complementary reforms in social protection and public service provision.
In addition, the results reveal pronounced regional heterogeneity. The effect of land circulation is strongest in central China, moderate in western regions, and statistically insignificant in the east. This pattern is consistent with diminishing marginal returns to land market development: in regions where land markets are already relatively mature, further expansion of circulation may yield limited additional gains, whereas in less-developed regions, the reallocation of land resources can generate substantial efficiency and income effects.
Finally, the stronger effects observed in regions with higher levels of digital economy development underscore the complementary role of digitalization in enhancing land market performance. Digital technologies can reduce information asymmetry, lower transaction costs, and improve market matching efficiency, thereby amplifying the economic and distributional effects of land circulation.

5.2. Comparison with Existing Literature

Our results align with Deininger and Jin [11], who found positive productivity effects from land rental markets, and with Jin and Deininger [12], who documented both efficiency and equity gains from land circulation in China. Pei et al. [14] extend these findings by distinguishing land inflow from outflow behaviors, confirming that plot consolidation—not merely aggregate circulation volume—drives the efficiency premium. Deng and Kang [15] highlight welfare channels beyond income, including the social capital formed when farmers lease to relatives and neighbors at below-market rents. Our contribution extends these studies by incorporating spatial effects and a multidimensional outcome measure. The non-significant eastern region effect echoes the observation by Gao et al. [13] that returns to land market development diminish as markets mature—a finding with direct policy relevance, as it cautions against uniform national targets for circulation rates.
The positive spatial spillover finding contrasts with some theoretical predictions of beggar-thy-neighbor effects in spatial competition models [38]. At the provincial scale in China, cooperative and diffusive channels appear to dominate competitive effects. This may partly reflect the centralized policy framework: the central government promotes land circulation as a national strategy and coordinates inter-provincial policy learning through pilot zones and demonstration projects [37].
Our finding that the central region exhibits the strongest effect aligns with the agricultural geography documented by Tu and Long [48]. Central provinces combine large arable land endowments with moderate current circulation rates, placing them on the steep portion of a likely S-shaped adoption curve. Eastern provinces, having already traversed the high-return segment, show diminishing marginal effects. Western provinces, constrained by terrain and infrastructure, realize smaller returns per unit of circulation increase.
The income distribution implications connect to the broader literature on inequality in China. Piketty et al. [49] documented the dramatic rise of wealth concentration in China since the 1990s, with rural populations bearing a disproportionate share. Kanbur and Zhang [3] traced fifty years of regional inequality through periods of planning, reform, and openness. Recent provincial-level analyses reveal that common prosperity levels have risen nationally but exhibit strong spatial clustering, with eastern provinces far outpacing western ones [40]. The digital economy and financial inclusion have emerged as complementary forces: digital inclusive finance promotes common prosperity especially in provinces with robust rural revitalization programs [40,41]. Our results suggest that land circulation, when accompanied by functional labor markets, acts as an equalizing force—not by redistributing existing wealth, but by unlocking productive potential in rural areas and enabling labor to flow toward higher-productivity employment.

5.3. Policy Implications

The empirical results yield a set of targeted and internally consistent policy implications.
First, the robust positive direct and spatial spillover effects of land circulation suggest that continued institutional support for a well-functioning land market remains warranted. Policy priorities should focus on reducing transaction frictions and uncertainty, including standardized contracts, clearer land management rights confirmation, transparent pricing mechanisms, and accessible dispute resolution systems. Given the presence of significant spatial spillovers, isolated local policies may generate suboptimal outcomes; instead, cross-regional coordination mechanisms—such as integrated regional land markets and information-sharing platforms—are likely to enhance overall efficiency and welfare gains [39].
Second, the mechanism analysis highlights that farmer income growth is an important transmission channel, implying that policy design should prioritize income-enhancing pathways rather than circulation per se. Specifically, land circulation increases property income (through rent), but its broader income effect depends critically on the expansion of non-farm income opportunities. Policies should therefore (i) promote rural labor mobility by reducing institutional barriers and improving access to stable off-farm employment, (ii) expand vocational training systems tailored to local labor market demand, and (iii) support the development of rural industries (e.g., agri-processing and rural services) to absorb surplus labor locally. In parallel, strengthening rural social protection systems can stabilize income expectations and reduce households’ risk aversion toward land transfer decisions. Moreover, reforms that allow rural collective construction land to enter the market provide an additional channel for asset-based income, reinforcing the income effect of farmland circulation and improving the overall allocation of rural resources [50].
At the same time, the productivity channel suggests that land consolidation alone is insufficient; complementary investments in agricultural technology diffusion, extension services, and digital agriculture are necessary to translate scale effects into efficiency gains. Existing evidence indicates that digital tools can lower information costs and improve matching efficiency in land markets, thereby amplifying both productivity and income effects [51].
Third, the urbanization channel—although positive—remains relatively constrained, indicating the presence of institutional frictions. Deepening reforms in the household registration system and improving the portability of social welfare benefits are essential to facilitate the permanent settlement of rural migrants in cities. This would allow land transfer to more effectively release labor from agriculture and enhance the reallocation of labor across sectors [29,30].
Finally, the pronounced regional heterogeneity calls for differentiated policy strategies rather than uniform national targets. In central China, where marginal effects are strongest, scaling up land circulation through institutional innovation and policy incentives is likely to yield substantial gains. In western regions, where constraints related to geography and infrastructure limit returns, land circulation policies should be complemented by investments in transportation, human capital, and ecological compensation to enhance overall effectiveness [31,52]. In eastern regions, where land markets are relatively mature and marginal effects diminish, the policy focus should shift from expansion to quality improvement—strengthening contract enforcement, protecting tenant rights, regulating large-scale operations, and ensuring a fair distribution of rental income.
Overall, these implications underscore that land circulation is not a standalone policy instrument; its effectiveness depends on the alignment of labor mobility, rural industrial development, and institutional reforms, particularly those that enhance farmer income channels and reduce structural constraints.

6. Conclusions

This study examines the relationship between rural land circulation and common prosperity across 30 Chinese provinces over the period 2010–2022 within an SDM framework. The results indicate that land circulation exerts a positive and statistically significant effect on multidimensional common prosperity. Further analysis reveals three primary transmission pathways—agricultural productivity improvement, farmer income growth, and urbanization advancement. The estimated effects exhibit clear regional heterogeneity: they are strongest in central China, moderate in western regions, and statistically insignificant in the east, suggesting diminishing marginal returns as land markets mature. Moreover, the positive impact of land circulation is more pronounced in regions with higher levels of digital economy development, indicating that digital technologies can enhance both the efficiency and inclusiveness of land market transactions.
These findings have important implications for China’s common prosperity agenda. When supported by context-specific institutional arrangements, land circulation can serve as an effective instrument for reducing urban–rural disparities and promoting inclusive development. In particular, reforms that strengthen property rights protection, improve market transparency, and facilitate efficient transactions are critical for unlocking the full benefits of land reallocation. The presence of spatial spillovers further suggests that land reform is not a zero-sum process; rather, improvements in one region can generate positive externalities for neighboring areas through factor mobility and market integration.
Several limitations warrant consideration. First, province-level analysis may obscure substantial within-region heterogeneity; future research based on county-level or household-level data would provide more granular insights into the distributional consequences of land circulation. Second, the construction of the common prosperity index inevitably involves choices regarding indicators and weighting schemes, which may influence the results despite the use of the entropy method. Third, the linear specification adopted in this study may not capture potential nonlinearities or threshold effects, whereby the benefits of land circulation materialize only after reaching a certain scale.
Future research could build on these findings by examining the heterogeneous impacts of different circulation modes (e.g., rental, shareholding, and cooperative arrangements), exploring long-run dynamic effects using panel VAR or system GMM approaches, and further investigating the interaction between land circulation and broader structural transformations, such as digitalization and factor market reforms.


Author Contributions

Conceptualization, D.D. and N.L.; methodology, D.D. and Y.W.; formal analysis, D.D.; data curation, D.D. and D.Q.; writing—original draft preparation, D.D.; writing—review and editing, N.L. and Y.W.; visualization, D.D. and D.Q.; supervision, N.L. and Y.W.; funding acquisition, D.D. and N.L.; project administration, N.L. All authors have read and agreed to the published version of the manuscript.

Funding

This research was funded by National Social Science Fund of China (No. 23BJL009); National Natural Science Foundation of China (No. 72203066); Shandong Provincial Natural Science Foundation (No. ZR2024QG036); Postgraduate Scientific Research Innovation Project of Hunan Province (No. QL20230082).

Institutional Review Board Statement

Not applicable.

Informed Consent Statement

Not applicable.

Data Availability Statement

The data used in this study are drawn from officially published Chinese government statistical yearbooks, primarily available through the National Bureau of Statistics of China (https://www.stats.gov.cn/sj/ndsj/ (accessed on 15 October 2025)). Processed datasets are available from the corresponding author upon reasonable request.

Acknowledgments

The authors thank the anonymous reviewers for their constructive comments, which helped improve the manuscript.

Conflicts of Interest

The authors declare no conflicts of interest. The funders had no role in the design of the study; in the collection, analyses, or interpretation of data; in the writing of the manuscript; or in the decision to publish the results.

Abbreviations

The following abbreviations are used in this manuscript:
CPICommon Prosperity Index
LCRLand Circulation Rate
SDMSpatial Durbin Model
SARSpatial Autoregressive Model
SEMSpatial Error Model
OLSOrdinary Least Squares
FEFixed Effects
LISALocal Indicators of Spatial Association
NBSNational Bureau of Statistics
PCAPrincipal Component Analysis

Note

1
Following several provincial-level panel studies on agricultural modernization, we assign Hainan to the western region due to its small agricultural base and development characteristics that more closely resemble western provinces than the industrialized eastern coast. The specific province-to-region assignment is displayed in Figure 2.

References

  1. National Bureau of Statistics of China. China Statistical Yearbook 2023; China Statistics Press: Beijing, China, 2023.
  2. Li, S.; Sato, H.; Sicular, T. Rising Inequality in China: Challenges to a Harmonious Society; Cambridge University Press: Cambridge, UK, 2013. [Google Scholar]
  3. Kanbur, R.; Zhang, X. Fifty Years of Regional Inequality in China: A Journey through Central Planning, Reform, and Openness. Rev. Dev. Econ. 2005, 9, 87–106. [Google Scholar] [CrossRef]
  4. Li, Z.; Hu, X. The Common Prosperity Effect of Rural Households’ Financial Participation: A Perspective Based on Multidimensional Relative Poverty. Front. Public Health 2024, 12, 1457921. [Google Scholar] [CrossRef]
  5. Lin, J.Y. Rural Reforms and Agricultural Growth in China. Am. Econ. Rev. 1992, 82, 34–51. [Google Scholar]
  6. Brandt, L.; Huang, J.; Li, G.; Rozelle, S. Land Rights in Rural China: Facts, Fictions and Issues. China J. 2002, 47, 67–97. [Google Scholar] [CrossRef]
  7. Tan, S.; Heerink, N.; Qu, F. Land Fragmentation and Its Driving Forces in China. Land Use Policy 2006, 23, 272–285. [Google Scholar] [CrossRef]
  8. Ministry of Agriculture and Rural Affairs. China Rural Management Statistical Annual Report 2023; China Agriculture Press: Beijing, China, 2023.
  9. Ji, X.; Wang, Y.; Yang, L.; Li, C.; Chen, L. The Impact of Cropland Transfer on Rural Household Income in China: The Moderating Effects of Education. Land Use Policy 2025, 148, 107399. [Google Scholar] [CrossRef]
  10. Sun, X.; Wang, J.; Rao, F. Land Tenure Security and Sustainable Land Investment: Evidence from National Plot-Level Data in Rural China. Land 2025, 14, 191. [Google Scholar] [CrossRef]
  11. Deininger, K.; Jin, S. The Potential of Land Rental Markets in the Process of Economic Development: Evidence from China. J. Dev. Econ. 2005, 78, 241–270. [Google Scholar] [CrossRef]
  12. Jin, S.; Deininger, K. Land Rental Markets in the Process of Rural Structural Transformation: Productivity and Equity Effects from China. J. Comp. Econ. 2009, 37, 629–646. [Google Scholar] [CrossRef]
  13. Gao, L.; Huang, J.; Rozelle, S. Rental Markets for Cultivated Land and Agricultural Investments in China. Agric. Econ. 2012, 43, 391–403. [Google Scholar] [CrossRef]
  14. Pei, S.; Zhao, S.; Li, X.; Li, J. Impacts of Rural–Urban Labour Transfer and Land Transfer on Land Efficiency in China: A Mediating Effects Analysis. Land 2024, 13, 702. [Google Scholar] [CrossRef]
  15. Deng, Z.; Kang, J. Study on the Impact of Land Transfer on Farmers’ Welfare: Theoretical and Empirical Evidence from China. Land 2025, 14, 2384. [Google Scholar] [CrossRef]
  16. Ye, J. Land Transfer and the Pursuit of Agricultural Modernization in China. J. Agrar. Change 2015, 15, 314–337. [Google Scholar] [CrossRef]
  17. Zhang, Y.; Bie, M.; Li, Y.; Zhang, S. Promoting Sustainability: Land Transfer and Income Inequality Among Farm Households. Land 2024, 13, 1757. [Google Scholar] [CrossRef]
  18. Feng, S.; Heerink, N.; Ruben, R.; Qu, F. Land Rental Market, Off-Farm Employment and Agricultural Production in Southeast China: A Plot-Level Case Study. China Econ. Rev. 2010, 21, 598–606. [Google Scholar] [CrossRef]
  19. de Brauw, A.; Rozelle, S. Migration and Household Investment in Rural China. China Econ. Rev. 2008, 19, 320–335. [Google Scholar] [CrossRef]
  20. LeSage, J.; Pace, R.K. Introduction to Spatial Econometrics; CRC Press: Boca Raton, FL, USA, 2009. [Google Scholar]
  21. Anselin, L. Spatial Econometrics: Methods and Models; Kluwer Academic Publishers: Dordrecht, The Netherlands, 1988. [Google Scholar]
  22. Kung, J.K.S. Off-Farm Labor Markets and the Emergence of Land Rental Markets in Rural China. J. Comp. Econ. 2002, 30, 395–414. [Google Scholar] [CrossRef]
  23. Ji, Y.; Huang, X.; Fang, C.; Zhan, J. The De-involution Transformation of Agricultural Labor Utilization in China: Evidence from Nearly a Century of Data. Issues Agric. Econ. 2024, 9, 15–29. (In Chinese) [Google Scholar]
  24. Wang, Y.; Wei, Y. The Impact of Agricultural New Quality Productivity on Farmers’ Income Growth. J. Agro-For. Econ. Manag. 2024, 23, 446–455. (In Chinese) [Google Scholar]
  25. Huang, J.; Wang, X.; Zhi, H.; Huang, Z.; Rozelle, S. Subsidies and Distortions in China’s Agriculture: Evidence from Producer-Level Data. Aust. J. Agric. Resour. Econ. 2011, 55, 53–71. [Google Scholar] [CrossRef]
  26. Zhou, L.; Ma, J.; Ma, X. The Impact of Income Distribution on Common Prosperity and Its Correction Path: Evidence from the “Reverse Kaldor Fact” and the Three-Tier Distribution System in China. Soft Sci. 2026, 1–18. (In Chinese) [Google Scholar]
  27. Li, C.; Li, J.; Fu, Y.; Hu, W. Effects of Confirmation of Homestead Rights and Labor Transfer on Rural Income Inequality in China. Land 2025, 14, 2115. [Google Scholar] [CrossRef]
  28. Li, S. The Goals and Implementation Path of Common Prosperity. Econ. Res. J. 2021, 56, 4–13. (In Chinese) [Google Scholar]
  29. Yang, D.T. Urban-Biased Policies and Rising Income Inequality in China. Am. Econ. Rev. 1999, 89, 306–310. [Google Scholar] [CrossRef]
  30. Lu, M.; Chen, Z. Urbanization, Urban-Biased Policies, and Urban–Rural Inequality in China, 1987–2001. Chin. Econ. 2006, 39, 42–63. [Google Scholar] [CrossRef]
  31. Fan, S.; Zhang, L.; Zhang, X. Reforms, Investment, and Poverty in Rural China. Econ. Dev. Cult. Change 2004, 52, 395–421. [Google Scholar] [CrossRef]
  32. Cheng, K.; Liu, S. The Mechanism and Effects of Urbanization on Common Prosperity: Evidence from the Perspective of Income Inequality. East China Econ. Manag. 2023, 37, 78–88. (In Chinese) [Google Scholar]
  33. Sicular, T.; Ximing, Y.; Gustafsson, B.; Li, S. The Urban–Rural Income Gap and Inequality in China. Rev. Income Wealth 2007, 53, 93–126. [Google Scholar] [CrossRef]
  34. Liu, J.; Wei, K.; Shuai, Q. Impact of the New Round of Hukou System Reforms on Rural Household Development Resilience in China. Sci. Rep. 2025, 15, 7211. [Google Scholar] [CrossRef]
  35. Zhang, W.; Zou, X.; Luo, C.; Yuan, L. Hukou Reform and Labor Market Outcomes of Urban Natives in China. J. Popul. Econ. 2024, 37, 22. [Google Scholar] [CrossRef]
  36. Tobler, W. A Computer Movie Simulating Urban Growth in the Detroit Region. Econ. Geogr. 1970, 46, 234–240. [Google Scholar] [CrossRef]
  37. Gao, J.; Liu, Y.; Chen, J. China’s Initiatives towards Rural Land System Reform. Land Use Policy 2020, 94, 104567. [Google Scholar] [CrossRef]
  38. Elhorst, J.P. Spatial Econometrics: From Cross-Sectional Data to Spatial Panels; Springer: Berlin, Germany, 2014. [Google Scholar]
  39. Wang, J.; Li, Y.; Wang, Q.; Cheong, K.C. Urban–Rural Construction Land Replacement for More Sustainable Land Use and Regional Development in China: Policies and Practices. Land 2019, 8, 171. [Google Scholar] [CrossRef]
  40. Wang, J.; Tan, Z.; Zuo, Y. Digital Inclusive Finance and Common Prosperity: The Threshold Effect Based on Rural Revitalization. Int. Rev. Econ. Financ. 2025, 100, 104096. [Google Scholar] [CrossRef]
  41. Zhang, C.; Zhu, Y.; Zhang, L. Effect of Digital Inclusive Finance on Common Prosperity and the Underlying Mechanisms. Int. Rev. Financ. Anal. 2024, 91, 103028. [Google Scholar] [CrossRef]
  42. He, J.; Liu, Z. Is the Comprehensive Pilot Policy of New Urbanization Conducive to the Common Prosperity of Urban and Rural Areas? Econ. Issues 2026, 1, 99–108. (In Chinese) [Google Scholar]
  43. Chen, H.; Meng, F.; Li, G.; Guo, J.; Xiong, W.; Li, X.; Zou, Y. Decoding the Relationship between Farmland Transfer and Crop Diversity: Insights from China. J. Environ. Manag. 2025, 384, 125588. [Google Scholar] [CrossRef]
  44. Moran, P.A.P. Notes on Continuous Stochastic Phenomena. Biometrika 1950, 37, 17–23. [Google Scholar] [CrossRef] [PubMed]
  45. Anselin, L. Local Indicators of Spatial Association—LISA. Geogr. Anal. 1995, 27, 93–115. [Google Scholar] [CrossRef]
  46. Dell, M. The Persistent Effects of Peru’s Mining Mita. Econometrica 2010, 78, 1863–1903. [Google Scholar] [CrossRef]
  47. Yan, G.; Wang, X.; Qian, H. The Impact of Land Transfer Policy on Agricultural Green Development. J. Harbin Univ. Commer. (Soc. Sci. Ed.) 2025, 3, 102–114. (In Chinese) [Google Scholar]
  48. Tu, S.; Long, H. Rural Restructuring in China: Theory, Approaches and Research Prospect. J. Geogr. Sci. 2017, 27, 1169–1184. [Google Scholar] [CrossRef]
  49. Piketty, T.; Yang, L.; Zucman, G. Capital Accumulation, Private Property, and Rising Inequality in China, 1978–2015. Am. Econ. Rev. 2019, 109, 2469–2496. [Google Scholar] [CrossRef]
  50. Zhou, L.; Zhang, W.; Li, F. Does Rural Collective Construction Land Marketization Increase Farmers’ Income? A Multi-Period DID Analysis of China’s County-Level Data. Front. Sustain. Food Syst. 2025, 9, 1719098. [Google Scholar] [CrossRef]
  51. Zhou, X.; Cheng, G.; Zhang, B. Does Farmland Transfer Promote Digital Agriculture?—Based on Panel Data from 30 Provinces in China. Land 2025, 14, 481. [Google Scholar] [CrossRef]
  52. Liu, Y.; Li, Y. Revitalize the World’s Countryside. Nature 2017, 548, 275–277. [Google Scholar] [CrossRef] [PubMed]
Figure 1. Theoretical framework: transmission channels from land circulation to common prosperity. Colored arrows represent the three mediating pathways (H1–H3) with distinct colors for each channel. The blue curved arrow indicates the direct effect. The dashed double arrow at the bottom represents spatial spillover effects (H4) across provincial boundaries.
Land 15 00918 g001
Figure 2. Study area: 30 Chinese provincial-level administrative units classified into three macro-regions (Eastern, Central, and Western). Tibet, Hong Kong, Macao, and Taiwan are excluded due to data constraints.
Land 15 00918 g002
Figure 3. National average land circulation rate and common prosperity index, 2010–2022. The left axis corresponds to the land circulation rate (solid blue line); the right axis corresponds to the common prosperity index (dashed red line). Vertical dashed lines indicate three major policy milestones: the 2013 Third Plenum Decision on strengthening rural land management rights; the 2016 “separation of three rights” (ownership, contracting right, and management right) policy directive; and the 2020 enactment of the revised Rural Land Contract Law.
Land 15 00918 g003
Figure 4. Spatial distribution of land circulation rate (top row, a,b) and common prosperity index (bottom row, c,d), 2010 versus 2022. Darker shading indicates higher values.
Land 15 00918 g004
Figure 5. Moran scatter plot of the Common Prosperity Index, 2022 (Moran’s I = 0.298). Blue points denote H–H cluster provinces, red points denote L–L cluster provinces, and gray points represent mixed-quadrant observations. The fitted line slope equals the global Moran’s I statistic.
Land 15 00918 g005
Figure 6. LISA cluster map of the Common Prosperity Index (panels a,b) for 2010 and 2022 (p < 0.05). Red indicates High–High clusters, mainly located in eastern coastal provinces, while blue indicates Low–Low clusters, mainly in western interior provinces. Light blue and pink represent Low–High and High–Low outliers, respectively. Gray areas are not statistically significant.
Land 15 00918 g006
Table 1. Indicator system for the Common Prosperity Index.
DimensionCategoryIndicatorDirectionWeight
MaterialEconomic DevelopmentPer capita GDP (yuan)+0.098
Per capita disposable income (yuan)+0.107
Tertiary sector share (%)+0.075
Income DistributionUrban–rural income ratio0.112
Min. wage/avg. wage ratio+0.089
Transfer income share in rural income (%)+0.081
SpiritualPublic ServicesPer capita education expenditure (yuan)+0.096
Hospital beds per 1000 persons+0.078
Public library books per capita+0.067
Social SecurityBasic pension coverage rate (%)+0.083
Basic medical insurance coverage (%)+0.069
Min. subsistence allowance coverage (%)+0.045
Direction “+” indicates positive indicators; “−” indicates inverse indicators (reversed during normalization). Weights are determined by the entropy weight method.
Table 2. Entropy weight calculation details for CPI indicators.
IndicatorEntropyDiversityWeightMeanSD
Per capita GDP0.9120.0880.09852,81326,457
Disposable income0.9040.0960.10724,16812,384
Tertiary share0.9330.0670.07547.6%9.8%
Urban–rural ratio0.9000.1000.1122.510.48
Min/avg wage ratio0.9200.0800.0890.2810.063
Transfer income share0.9270.0730.08121.3%5.7%
Education expenditure0.9140.0860.0961842786
Hospital beds0.9300.0700.0786.121.87
Library books0.9400.0600.0670.730.32
Pension coverage0.9260.0740.08372.4%12.1%
Medical insurance0.9380.0620.06995.2%3.8%
Subsistence allowance0.9600.0400.0453.41%1.26%
Entropy values closer to 1 indicate less variation; higher diversity coefficients (1 − entropy) yield higher weights.
Table 3. Descriptive statistics of main variables (30 provinces, 2010–2022).
VariableNMeanSDMinMax
CPI3900.4370.1420.1980.782
LCR (%)39032.6216.834.3063.80
RD3901.7962.0310.1826.830
HUM3909.1641.2594.13712.725
FIN3901.530.680.523.47
GOV (%)39024.8311.629.3164.72
OPEN (%)39025.3128.631.82122.4
Table 4. Global Moran’s I test results for CPI and LCR.
YearCPI Moran’s Iz-ValueLCR Moran’s Iz-Value
20100.3524.87 ***0.2874.12 ***
20120.3464.79 ***0.2733.95 ***
20140.3384.68 ***0.2613.82 ***
20160.3254.53 ***0.2523.71 ***
20180.3144.39 ***0.2433.58 ***
20200.3064.28 ***0.2313.44 ***
20220.2984.16 ***0.2183.28 ***
*** p < 0.01. Based on the inverse-distance spatial weight matrix.
Table 5. Spatial model specification tests.
TestStatisticp-Value
Hausman (FE vs. RE)41.580.000
LM-lag26.910.000
Robust LM-lag14.070.000
LM-error18.420.000
Robust LM-error6.120.041
LR test (SDM vs. SAR)17.650.019
LR test (SDM vs. SEM)21.060.006
Wald test (SDM vs. SAR)18.720.014
Wald test (SDM vs. SEM)21.830.005
Table 6. Regression results: OLS benchmark and spatial models.
VariableOLS (1)SAR (2)SEM (3)SDM (4)
LCR0.152 ***0.138 ***0.145 ***0.134 ***
(0.037)(0.035)(0.036)(0.034)
RD0.069 **0.061 **0.065 **0.056 **
(0.031)(0.029)(0.030)(0.027)
HUM0.043 **0.039 **0.041 **0.037 **
(0.018)(0.017)(0.018)(0.016)
FIN0.029 *0.0260.027 *0.023
(0.016)(0.015)(0.016)(0.015)
GOV−0.026−0.022−0.024−0.020
(0.022)(0.021)(0.021)(0.020)
OPEN0.0170.0150.0160.013
(0.014)(0.013)(0.014)(0.024)
W × LCR0.082 **
(0.038)
W × RD0.041 *
(0.023)
W × HUM0.018
(0.020)
W × FIN0.028
(0.031)
W × GOV−0.019
(0.030)
W × OPEN0.037
(0.029)
ρ 0.265 ***0.257 ***
(0.055) (0.056)
λ 0.276 ***
(0.060)
Province FEYesYesYesYes
Year FEYesYesYesYes
R 2 0.6680.7080.7010.732
Log-L423.85460.92455.37479.18
N390390390390
Standard errors in parentheses. *** p < 0.01, ** p < 0.05, * p < 0.10. All models include province and year fixed effects. Spatial models use the inverse-distance weight matrix. Spatial lag terms for other control variables are included in the SDM but omitted from the table for brevity.
Table 7. Decomposition of the effect of land circulation on common prosperity.
VariableDirect EffectIndirect EffectTotal Effect
LCR0.131 *** (0.033)0.063 ** (0.032)0.194 *** (0.042)
RD0.055 ** (0.026)0.028 (0.029)0.083 ** (0.038)
HUM0.036 ** (0.015)0.014 (0.019)0.050 ** (0.024)
FIN0.022 (0.015)0.010 (0.018)0.032 (0.023)
GOV−0.019 (0.019)−0.009 (0.022)−0.028 (0.029)
OPEN0.012 (0.013)0.006 (0.016)0.018 (0.020)
Standard errors in parentheses. *** p < 0.01, ** p < 0.05. Computed from the SDM in column (4) of Table 6, following LeSage and Pace [20].
Table 8. Mediation analysis: transmission channels from land circulation to common prosperity.
ChannelDirect EffectIndirect EffectTotal Effect
Agri. productivity0.112 ***0.0210.133 **
(0.037)(0.017)(0.052)
Farmer income0.129 ***0.036 **0.165 ***
(0.039)(0.016)(0.041)
Urbanization0.094 **0.0150.109 **
(0.038)(0.018)(0.049)
Standard errors in parentheses. *** p < 0.01 , ** p < 0.05 .
Table 9. Regional heterogeneity: SDM total effects by macro-region.
VariableEasternCentralWesternHigh DigitalLow Digital
LCR (total effect)0.0790.203 ***0.154 **0.173 ***0.096
(0.056)(0.046)(0.059)(0.041)(0.058)
ControlsYesYesYesYesYes
Province FEYesYesYesYesYes
Year FEYesYesYesYesYes
ρ 0.211 ***0.304 ***0.247 ***0.289 ***0.226 ***
(0.070)(0.066)(0.073)(0.063)(0.071)
R 2 0.7760.7310.6890.7420.701
N130104156195195
Standard errors in parentheses. *** p < 0.01 , ** p < 0.05 . Total effects computed from region-specific SDM estimations.
Table 10. Robustness checks: total effect of LCR on common prosperity under alternative specifications.
SpecificationCoefficientSESargonp-ValueN
(1) Baseline (inverse-distance W)0.194 ***0.042390
(2) Economic distance W0.181 ***0.045390
(3) k-nearest neighbors ( k = 5 )0.188 ***0.039390
(4) PCA-constructed CPI0.108 ***0.028390
(5) Excl. municipalities a0.205 ***0.046338
(6) Terr × Year0.156 ***0.0436.8100.273390
*** p < 0.01 . All specifications include province and year fixed effects. a Excludes Beijing, Tianjin, Shanghai, and Chongqing (26 provinces × 13 years = 338).
Disclaimer/Publisher’s Note: The statements, opinions and data contained in all publications are solely those of the individual author(s) and contributor(s) and not of MDPI and/or the editor(s). MDPI and/or the editor(s) disclaim responsibility for any injury to people or property resulting from any ideas, methods, instructions or products referred to in the content.