Article

Closer to Home, More Trusted? Territorial Disparities in Government Trust Across Thai Regions

by
Sanyarat Meesuwan
1,* and
Jenn-Jaw Soong
2
1
College of Politics and Governance, Mahasarakham University, Mahasarakham 44150, Thailand
2
Department of Political Science, National Cheng Kung University, Tainan City 70101, Taiwan
*
Author to whom correspondence should be addressed.
Land 2026, 15(6), 906; https://doi.org/10.3390/land15060906
Submission received: 25 March 2026 / Revised: 11 May 2026 / Accepted: 20 May 2026 / Published: 25 May 2026

Abstract

From the Red Shirt heartlands of the North and Northeast to the conservative South and the fragmented middle-class electorate of Bangkok, Thailand’s regional divisions reflect a deeply contested relationship with centralized power. How these divisions shape citizens’ relative trust in local versus central government remains an open empirical question. Drawing on three waves of the Asian Barometer Survey conducted between 2014 and 2022 (pooled N = 3600), this study examines whether territorial location produces differential trust in local relative to central government. The findings are mixed. Regional differences are observable in baseline models, but their explanatory power diminishes once individual-level evaluations of political institutions and economic conditions are taken into account. Rural residents exhibit a smaller trust gap, indicating a weaker relative preference for local over central government, consistent with central welfare transfers sustaining support for the central tier. At the contextual level, higher regional poverty rates are associated with a compression of the trust gap between levels of government. Once poverty is introduced, the overall temporal increase observed by 2022 is no longer statistically significant. Structural economic geography explains much of the aggregate shift. Regional dynamics, however, are not uniform. The Northeast diverges sharply in the final wave, and the pattern holds across model specifications. The shift points to accumulated political alienation rooted in repeated episodes of electoral disenfranchisement. The findings carry direct implications for decentralization policy and territorial development strategy. Where regional trust gaps are driven by fiscal constraints on local government and accumulated political alienation, administrative redesign alone cannot restore citizen confidence in sub-national governance.

1. Introduction

Thailand has experienced repeated cycles of political confrontation, institutional crisis, and military intervention over the past two decades. These tensions crystallized after the 2006 coup in the conflict between the Yellow Shirt and Red Shirt movements. Yellow Shirt support was concentrated in Bangkok and the urban south; Red Shirt strength lay in the rural north and northeast [1,2]. The People’s Democratic Reform Committee, a regrouping of the Yellow Shirt movement, organized nationwide blockades of polling stations and violent confrontations that brought down the elected government of Prime Minister Yingluck Shinawatra in May 2014. The coup dissolved the constitution, installed the National Council for Peace and Order, and produced a constitutional order designed to limit the electoral power of rural majorities [3]. The conflict was fundamentally a contestation over elections, sovereignty, and representation, with one side positioning the monarchy at the center of political authority within a hierarchical social order and the other grounding legitimacy in popular sovereignty and electoral outcomes [4,5,6].
Laothamathas’ [7] tale of two democracies thesis contrasts democratic orientations among urban middle-class and rural voters. Urban voters evaluate democracy in normative terms, expect competent leadership, and apply higher accountability standards through frequent interaction with state institutions. Rural voters treat elections as mechanisms for securing tangible benefits within patron-client networks, which lowers expectations of state performance and sustains institutional trust even where corruption is perceived [8,9,10].
Polarization fractured institutional trust in different directions across these groups. The urban middle class withdrew confidence from elected institutions and extended it to the military and the Constitutional Court. Rural populations experienced the repeated dissolution of their elected parties through judicial intervention while Yellow Shirt protesters who seized government buildings faced few legal consequences. This asymmetry drove what qualitative accounts describe as ta sawang, political awakening through recognition of structural injustice, and deepened rural distrust of unelected state institutions [1,5,11].
Decentralization reforms from the late 1990s transferred fiscal and administrative responsibilities to sub-national governments, but implementation has been uneven across regions. Local governments in the north and northeast operate with less fiscal capacity and fewer administrative resources than those in Bangkok and central Thailand [12,13]. This variation shapes how local authorities are assessed relative to the central state across different parts of the country.
Spatial variation in institutional trust and its relationship to decentralization has received limited attention in the Thai context relative to the extensive literature on electoral behavior, protest mobilization, and elite conflict. Existing survey-based studies tend to examine trust in government through a single undifferentiated measure, rarely distinguishing between local and central levels or tracing changes across the period of military rule after 2014. Using three waves of the Asian Barometer Survey covering 2014 to 2022, this study compares trust in local government with trust in central government across Thailand’s five regions. The difference between these two measures illustrates how decentralization is experienced at the citizen level. Trust in local government shapes citizens’ willingness to engage with decentralized service delivery and hold sub-national authorities accountable, with direct implications for rural development and the governance of spatially unequal societies.

2. Political Trust, Territorial Context, and Multi-Level Government Evaluation

2.1. Political Trust: Concept, Significance, and Vertical Differentiation

Political trust has been central to debates about democratic legitimacy and citizen-state relations for decades. Easton [14] drew a foundational line between two forms of political support. Diffuse support represents generalized attachment to the political order itself, while specific support captures performance-based evaluations of institutions and officeholders. Political trust belongs to the latter and rises when institutions deliver and erodes when they do not.
Those who distrust specific officeholders may still retain loyalty to the system itself, a pattern that pushed scholarship away from treating trust as a single attitude. Defining what occupies each level has produced genuine disagreement. Performance-based accounts treat trust as a running evaluation, updated when government output meets citizen expectations; citizens extend it when delivery succeeds and withdraw it when delivery falls short [15]. Beyond performance, trust also carries a prior disposition toward government action, conditioning how citizens assess state capacity [16]. A separate strand shifted focus to institutional reliability, asking whether government can be counted on to act correctly without oversight [17]. Citrin and Stoker [18] added a further distinction, separating willingness from ability, since a government may be trusted on one dimension while doubted on the other.
Institutional performance theory argues that trust follows from governance outcomes including prosperity, accessible services, and procedural fairness [19]. Cultural theory locates trust in socialization, traditional values, and national culture that exist independently of what government does. Neither account fully explains the variation scholars observe, and contemporary scholarship increasingly integrates both perspectives [20,21].
Trust carries real governance consequences. Its erosion correlates with declining electoral participation, protest, and support for anti-system movements [22]. Niu and Zhao [23] demonstrated the behavioral stakes in urban China, where migrants with lower local government trust were less likely to participate in social security schemes and doubted that contributions would yield returns.
In multi-level governance systems, trust is rarely distributed evenly across tiers of authority [24]. Local officials, more visible and proximate than national representatives, attract direct attribution when services fail [25]. Dong and Kübler [26] identified a hierarchical trust pattern in urban China, where high trust in central government intentions coexisted with low trust in local officials regarded as corrupt or ineffective in implementation. In remote areas where state presence is thin, evaluative expectations adjust downward and even minimal provision generates relatively positive assessments.

2.2. Territorial Context, Decentralization, and the Trust Gap

Decentralization is theorized to bring government closer to citizens and enhance responsiveness. In practice, this depends on whether local governments possess adequate fiscal resources and administrative capacity, and the gap between decentralization policy and actual territorial outcomes is well documented across diverse institutional contexts [27,28]. Where these conditions are absent, local governments operate as weaker state actors and may be trusted less than the more distant central government, from which redistributive transfers still flow [29,30]. The trust gap reflects how different tiers of the state are experienced under uneven capacity conditions.
Daily contact with the physical environment, including health facility access, infrastructure quality, and official responsiveness, provides what Stroppe [31] calls low-intensity information cues about political system performance. Rodríguez-Pose [32] described the aggregate outcome as a geography of discontent, concentrating dissatisfaction in places bypassed by national development. Rickardsson [33] showed in Sweden that residents in municipalities with shrinking services were significantly more likely to channel dissatisfaction into protest voting. These everyday experiences inform perceptions of government performance, while the central government retains symbolic distance from localized service failures.
The relationship between proximity and trust is further differentiated across the urban–rural spectrum. Urban residents interact with local authorities more frequently, apply higher accountability standards, and face greater exposure to administrative failure and petty corruption. By contrast, rural populations tend to evaluate both governance tiers more leniently due to historically limited state presence.
The relationship between regional inequality and institutional trust has received considerable attention in European and post-communist contexts. Lipps and Schraff [34] found that citizens in economically declining regions report lower institutional trust across Europe’s multilevel governance system. Regional inequality reduces citizens’ confidence in both national and supranational institutions independently of income inequality. In post-communist societies, Mishler and Rose [20] demonstrated that institutional performance drives trust more strongly than cultural predispositions. Trust responds to what governments deliver, not to inherited attitudes. Thailand diverges from both contexts. Electoral manipulation and hybrid authoritarianism introduce mechanisms of trust erosion that neither European nor post-communist frameworks fully capture. The Thai case extends existing theory by examining how repeated electoral disenfranchisement affects the vertical distribution of trust across governance tiers in a non-democratic context.

2.3. Hypotheses

The theoretical arguments above generate four testable predictions about how territorial context shapes government trust in Thailand.
H1: 
Residents of peripheral regions exhibit larger trust gaps between local and central government than Bangkok residents.
Citizens in peripheral regions face uneven fiscal capacity and thinner state presence, producing greater divergence in how they evaluate local relative to central government.
H2: 
The association between regional location and the trust gap declines after controlling for individual-level evaluations of institutional legitimacy and economic conditions.
Attitudinal and socioeconomic characteristics vary systematically across regions. Once these compositional differences are accounted for, territorial location should explain little of the remaining variation in the trust gap.
H3: 
Rural residents report smaller trust gaps than urban residents.
Historically thin local state presence in rural areas lowers evaluative standards across both governance tiers. The differential between them narrows as a result.
H4: 
Higher regional poverty rates compress the trust gap between local and central government.
In the most economically constrained regions, both tiers of government operate at low capacity. Citizens lower expectations for both simultaneously, producing convergence in evaluations rather than differentiation between levels.

3. Materials and Methods

3.1. Materials

This study used data from the Asian Barometer Survey (ABS). Three waves were conducted in Thailand in 2014, 2018, and 2022, corresponding to Waves 4, 5, and 6. Each wave surveyed 1200 respondents and produced 3600 pooled observations before listwise deletion. Analytical sample sizes vary across model specifications. The ABS is a cross-national research program that measures public opinion on democracy, governance, and political values across Asia. In Thailand, data were gathered by King Prajadhipok’s Institute through face-to-face interviews with multi-stage stratified random sampling [35]. The sample covered urban and rural areas across five regions, namely Bangkok, the North, the Central region, the Northeast, and the South. Earlier ABS waves (Waves 1–3) were excluded due to missing comparable trust measures and limited longitudinal comparability with the post-2014 political period. Wave 4 fieldwork in Thailand ran from August to October 2014, conducted entirely after the May 22 coup and under military rule. Wave 5 and Wave 6 data were similarly collected under conditions of military or military-influenced governance. Therefore, all three waves reflect political environments in which social desirability pressures on reported central government trust cannot be ruled out.
The three waves marked distinct moments in Thailand’s post-coup political trajectory. The 2017 constitution and the return to constrained electoral competition in 2019 each reshaped the relationship between citizens and the state in ways that varied considerably across regions. Pooling these three time points allowed the study to track not just where trust disparities existed, but how they moved and why some regions shifted more dramatically than others.

3.2. Dependent Variable

The dependent variable is the trust gap, defined as the difference between respondents’ trust in local and central government. This measure compares institutional evaluations across levels of governance and has been linked to both regional inequality and variation in local government performance, e.g., [30,34]. Local and central government trusts in ABS were measured on a four-point scale (1 = “a great deal of trust,” 4 = “none at all”) and reverse-coded so that higher values reflect greater trust in local government. Regional values represent the mean of individual-level differences within each region and wave. The trust items for local and national government used identical wording and response categories across Waves 4, 5, and 6. This consistency ensures longitudinal comparability of the dependent variable.
Relative trust between tiers of government is theoretically meaningful in multilevel governance systems, where citizens may evaluate local and central authorities in distinct ways [26]. A difference score preserves this comparative orientation directly, retaining information about citizens’ relative confidence in one tier versus the other in a way that separate models cannot. At the same time, difference scores carry methodological limitations. A zero value, for example, may mean either uniformly high trust or uniformly low trust across tiers. Similarly, changes in the trust gap may result from shifts in local trust, central trust, or both. Accordingly, while the trust gap provides a useful measure of relative institutional evaluation, its interpretation should be complemented by analyses of trust in each tier separately.
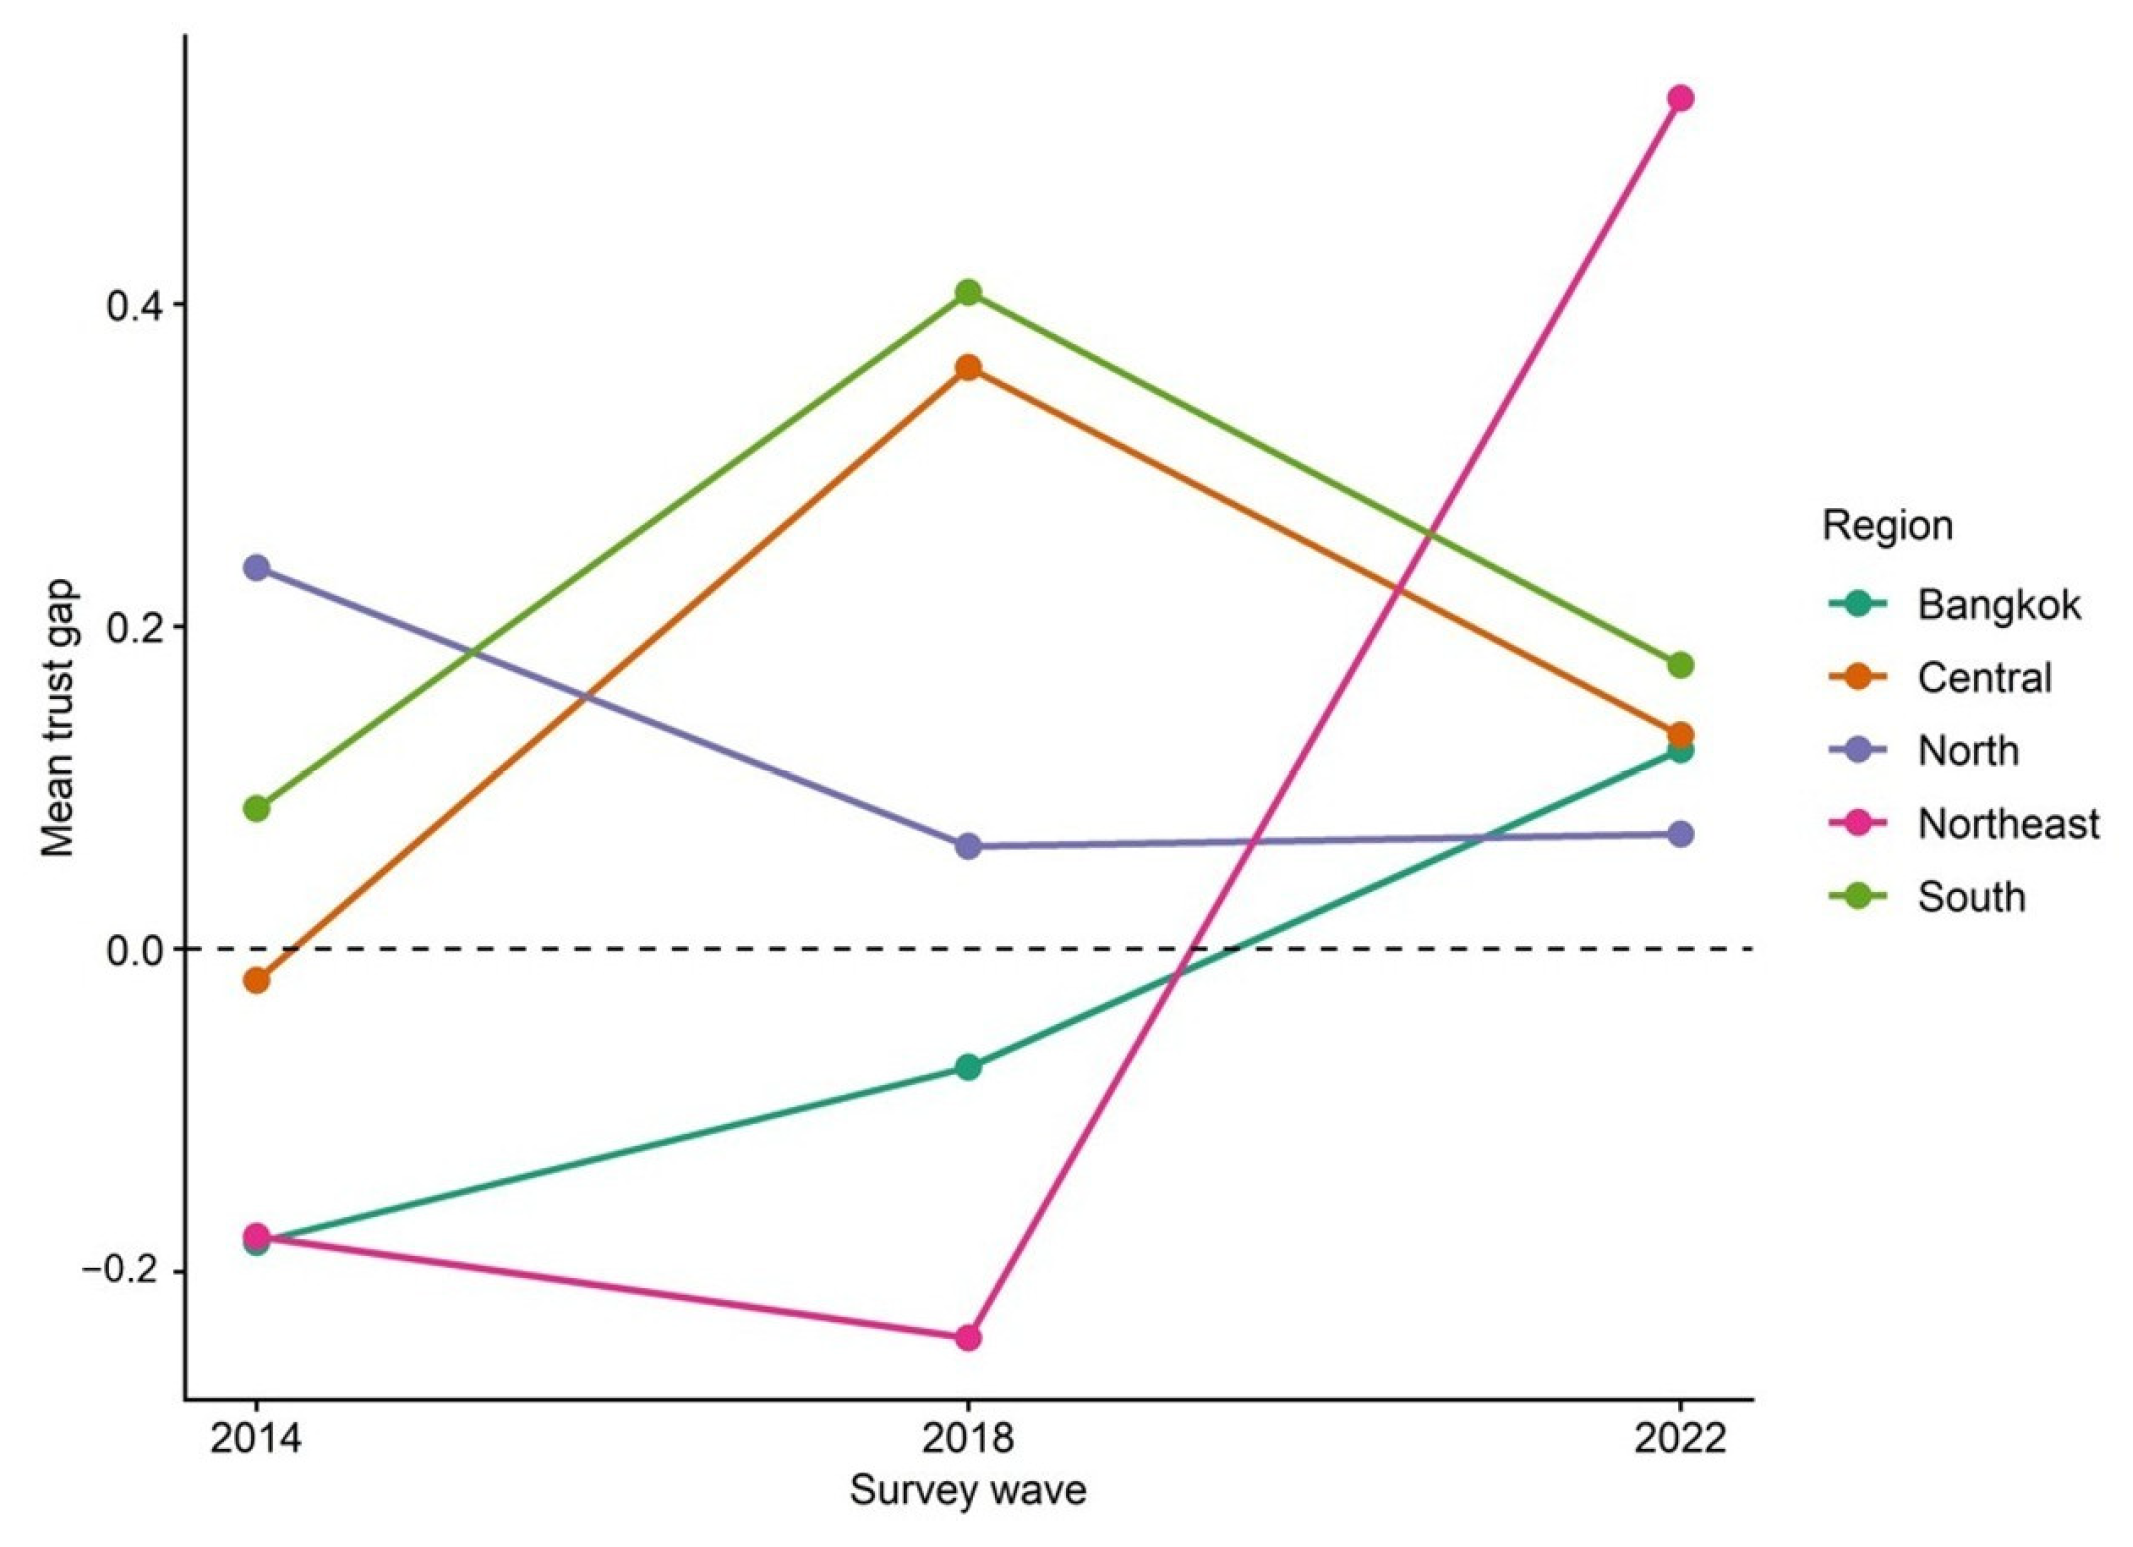
Figure 1 presents the spatial distribution of the trust gap across three waves. In 2014, the pattern was mixed, with negative values in Bangkok and the Northeast, positive values in the North and South, and near-neutral values in the Central region. In 2018, divergence increased. The Northeast posted the lowest values, while the Central and Southern regions displayed strong positive gaps. By 2022, all regions turned positive. The Northeast recorded the largest shift, with a trust gap of 0.528, the highest among all regions and a substantial reversal from its previously lowest position.

3.3. Independent Variables

Three groups of independent variables were included across model specifications: regional and temporal indicators, individual-level characteristics, and economic context.
Regional and temporal variation was captured through dummy variables, with Bangkok the reference category and 2014 the baseline period.
At the individual level, age was mean-centered to reduce multicollinearity [36]. Gender was coded 1 for male and 0 for female. Education was measured in years of schooling, ranging from 0 to 24. Income reflected household position on a five-point relative quintile scale. Economic evaluation measured respondents’ assessment of their household’s current economic situation on a five-point scale. Political legitimacy was constructed from two items—satisfaction with government performance and satisfaction with democracy—each measured on a four-point scale. The internal consistency of the two-item legitimacy index was acceptable (Cronbach’s α = 0.70). Political science literature treats performance satisfaction as an antecedent evaluation distinct from institutional trust itself [14,15,20]. The VIF for the legitimacy index stays below 2.0 across all specifications (Table S1), providing no evidence of multicollinearity between this predictor and the dependent variable. Satisfaction with government performance and satisfaction with democracy capture evaluative orientations toward institutional outputs. They precede trust judgments rather than duplicate them.
Political engagement was a formative composite index computed as the mean of three dichotomous or rescaled items: campaign participation (whether the respondent attended a rally, persuaded others, or helped a candidate), political news consumption (frequency of following political news, rescaled to a 0–1 range), and political interest (self-reported level of interest in politics, rescaled to a 0–1 range). All three components were rescaled to a common metric prior to aggregation. The index ranged from 0 to 1, with higher values indicating greater political engagement. While campaign participation represents an overt behavior, news consumption and political interest constitute the cognitive prerequisites for such action. Equal weighting prevents any single component from dominating the composite score and ensures the index reflects a general orientation toward the political system.
Rural residence was coded 1 for rural and 0 for urban. Unless otherwise noted, all attitudinal variables were reverse-coded so that higher values indicated more positive evaluations. The regional poverty rate was obtained from the National Statistical Office of Thailand [37]. It was standardized prior to analysis and represented structural socioeconomic disadvantage.
Table 1 reports descriptive statistics for all variables included in the analysis. The sample had a mean age of 46.81 years. Male respondents accounted for 53.2% of the sample. Rural residents comprised 22% of respondents. Average years of schooling were 9.13, and the mean income quintile was 2.33, a concentration in lower-middle income groups. The mean regional poverty rate was 8.83%, with values ranging from 0.99% to 17.08% across regions.

3.4. Regional Socioeconomic Context

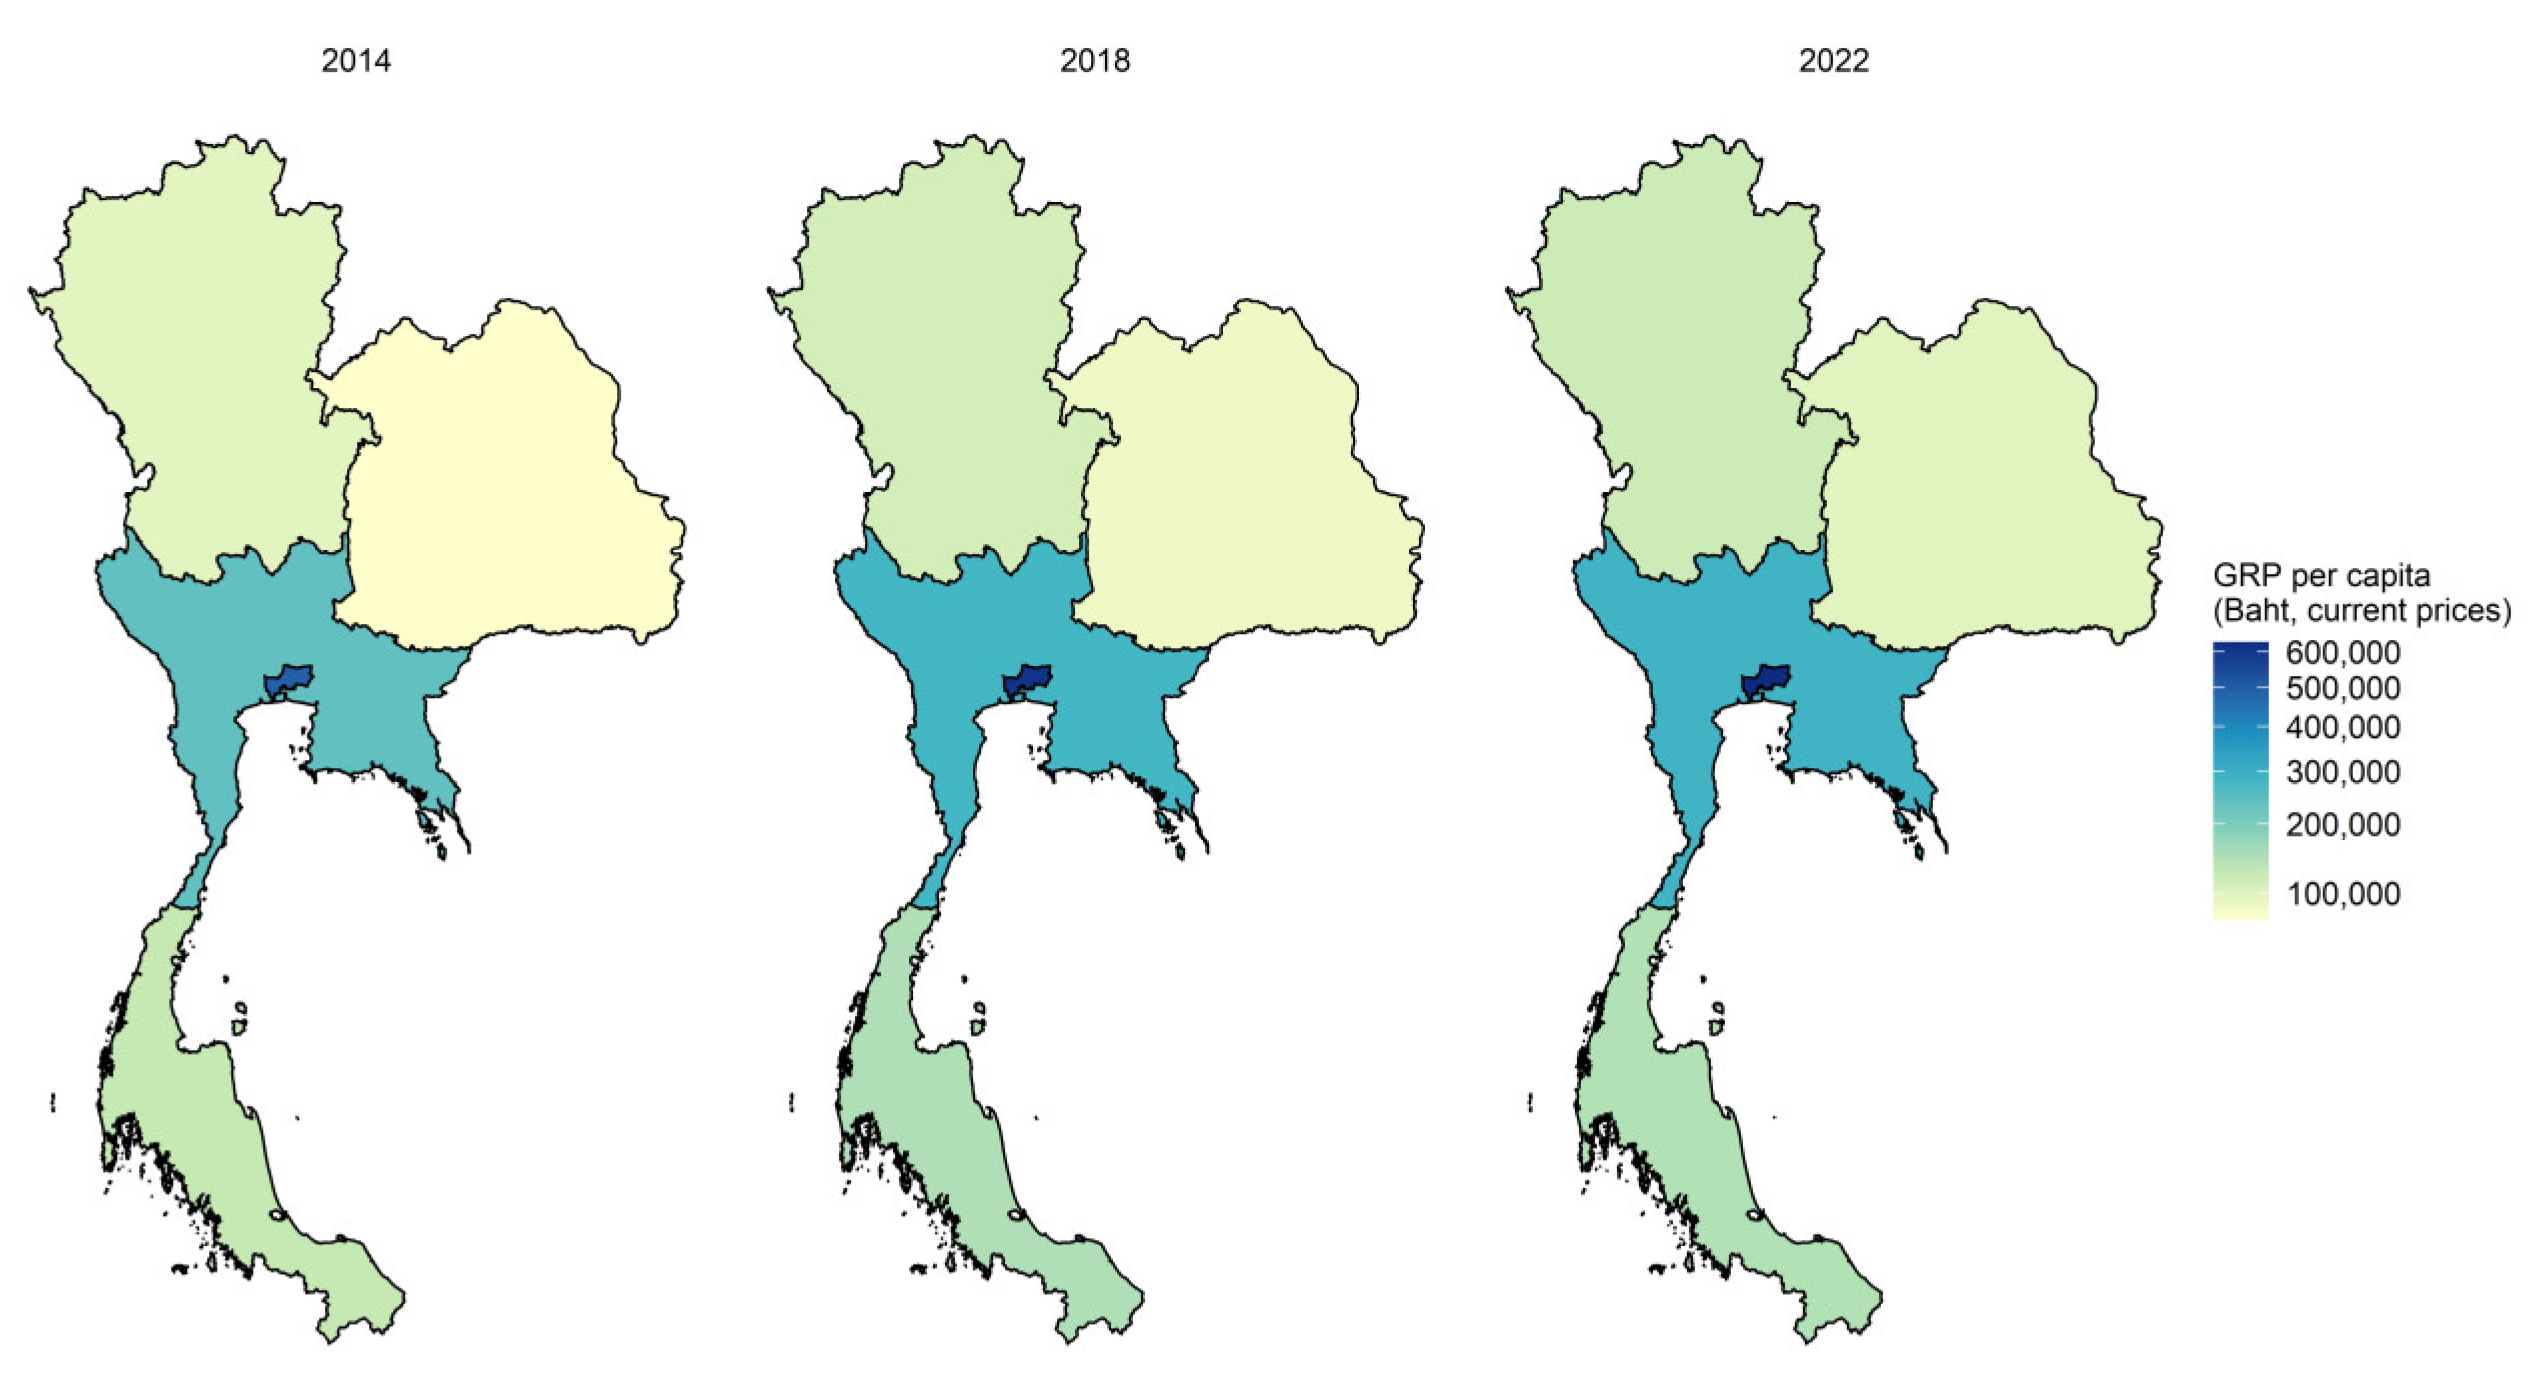
Thailand’s five regions differed in economic development. Bangkok recorded the highest gross product per capita, at 489,035 baht in 2014 and 627,732 baht in 2022. The Central region followed, at 238,755 baht in 2014 and 283,684 baht in 2022 [38]. Both regions served as the primary hubs of industrial and export-oriented activity. The North, Northeast, and South exhibited lower levels of Gross Regional Product (GRP) per capita throughout the study period.
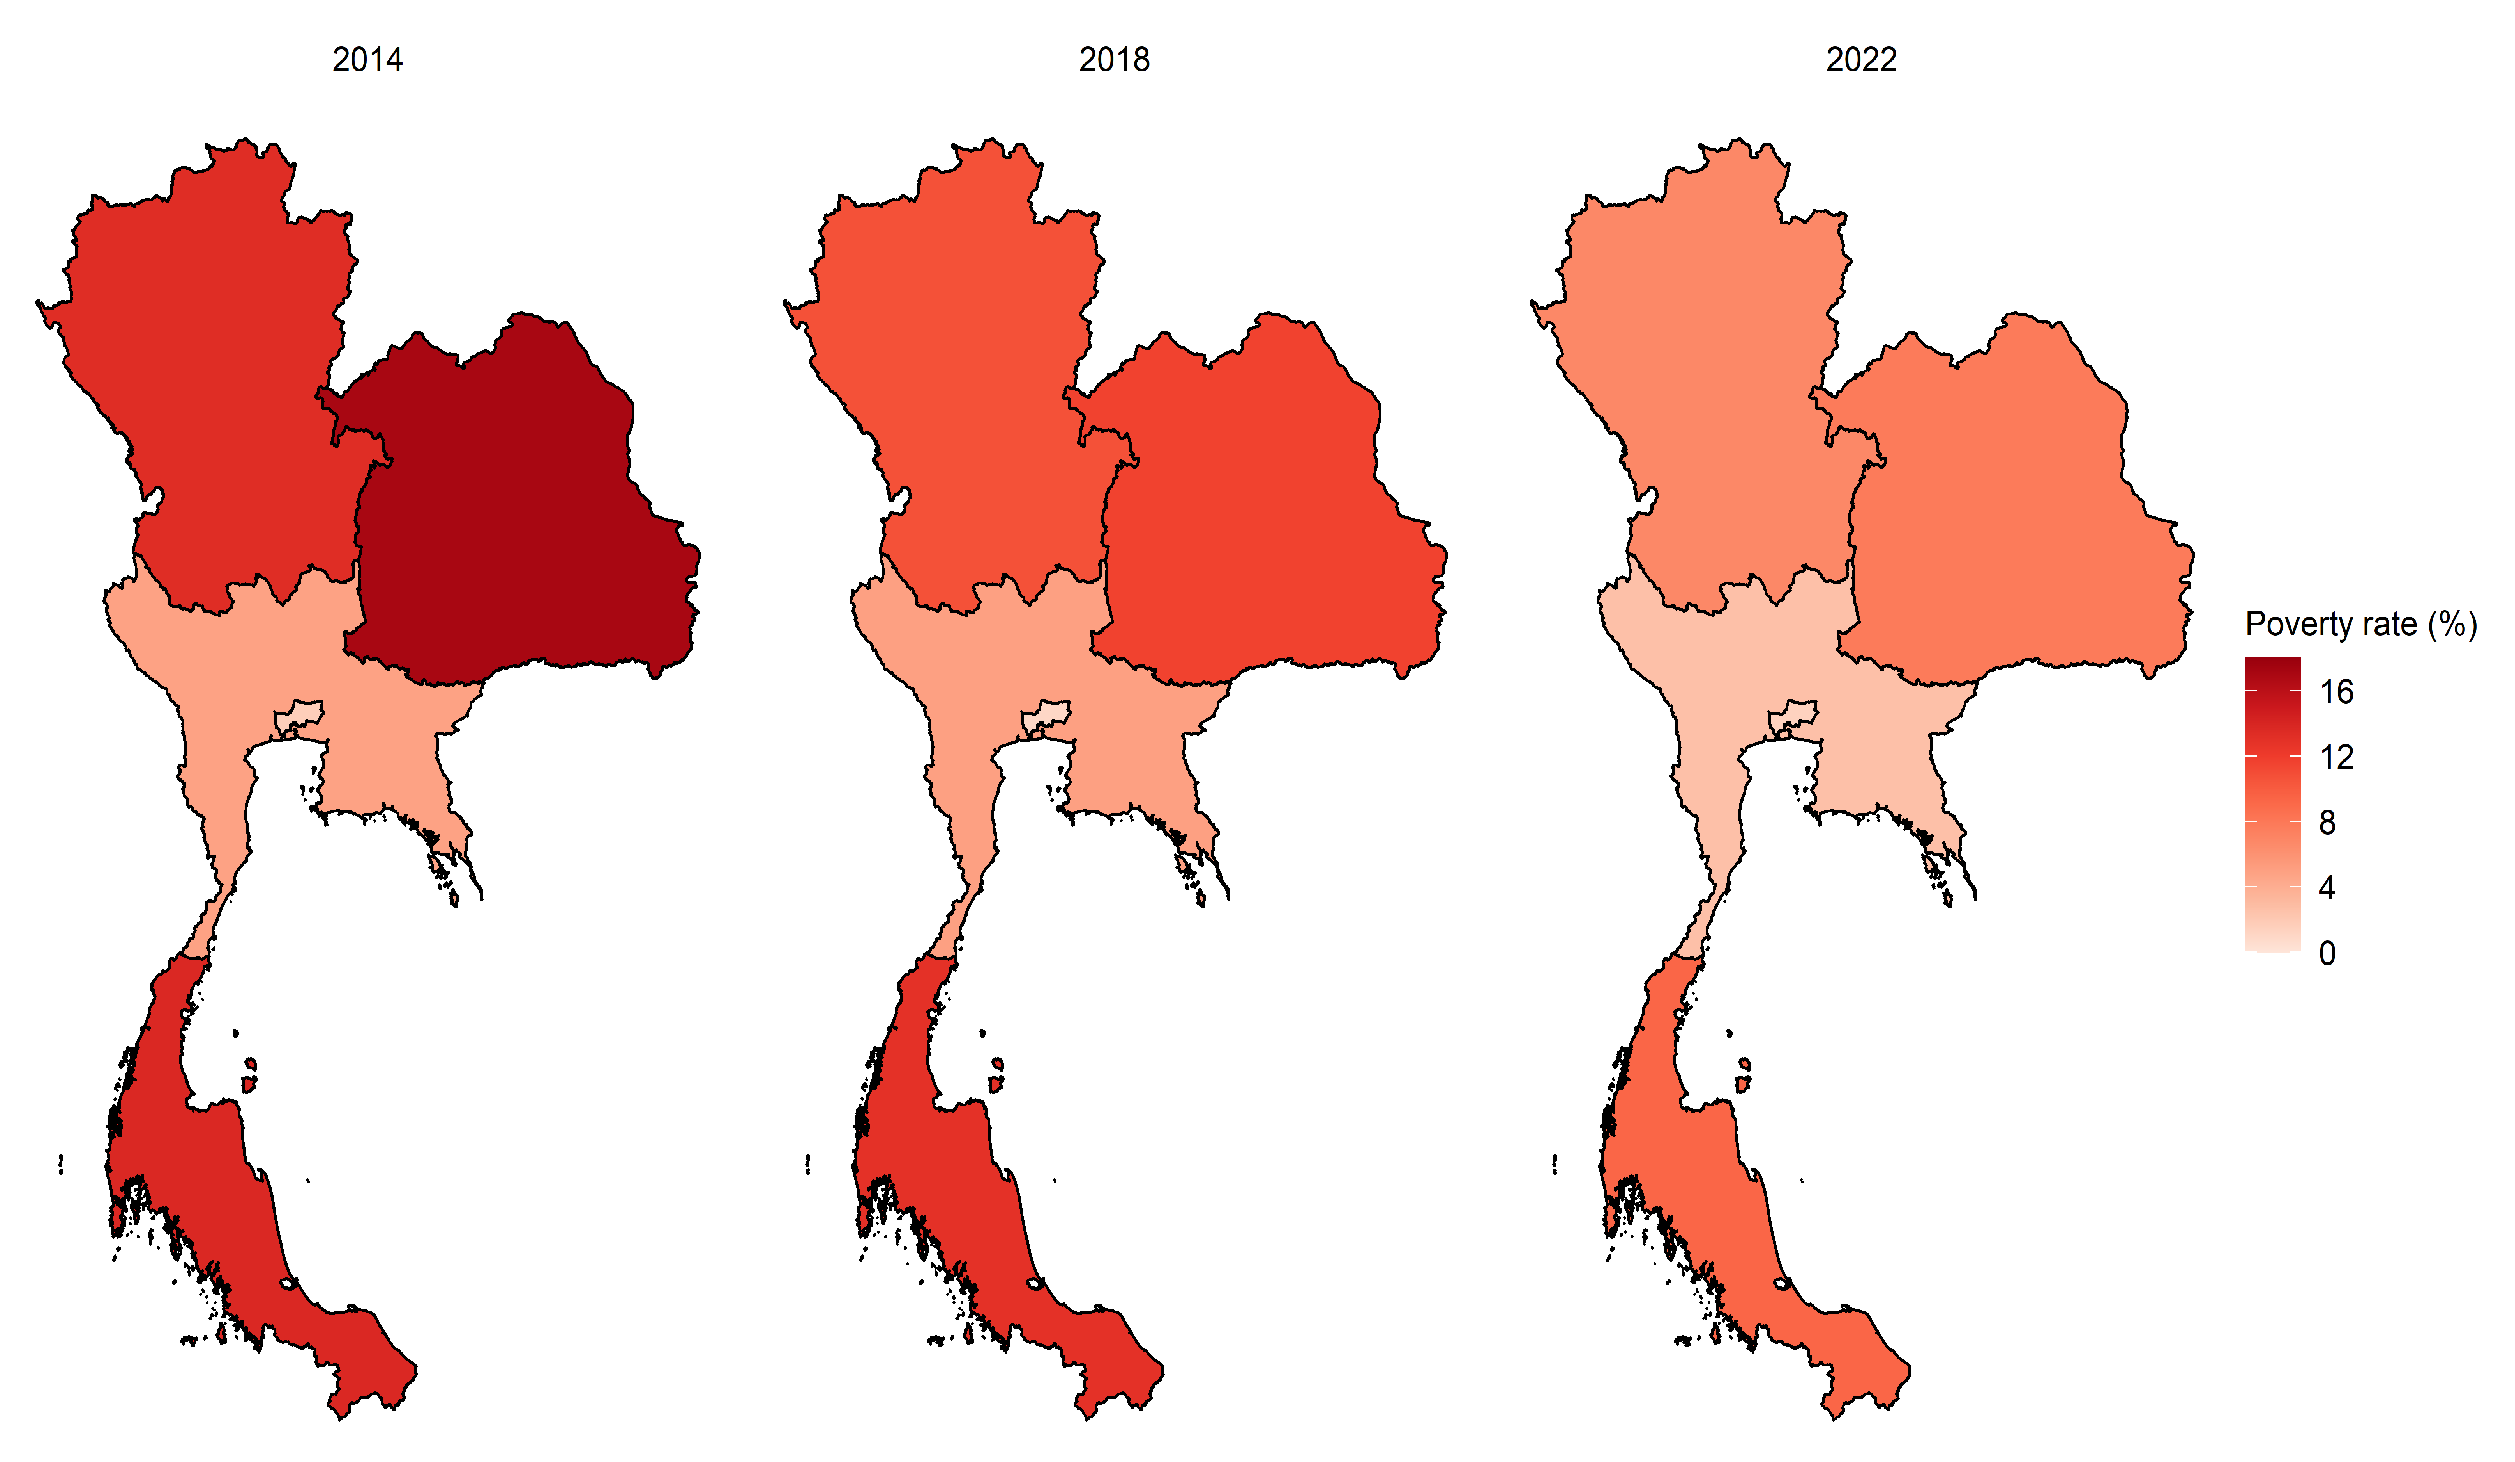
Poverty rates displayed a similar spatial pattern, though with notable temporal shifts. The Northeast recorded the highest rate in 2014 at 17.08%. By 2018 and 2022, the South exceeded it, reaching 9.30% by the final wave compared to 7.81% in the Northeast. Poverty declined across most regions over time. The Central region showed a slight increase between 2014 and 2018 before falling sharply by 2022, while Bangkok consistently maintained the lowest rates [37]. These patterns reflect persistent regional inequality in Thailand’s development trajectory. GRP per capita and poverty rate were not included together in the regression models due to high collinearity. Both are presented here to situate the trust gap findings within a broader context of territorial inequality (see Figure 2 and Figure 3).

3.5. Analytical Strategy

This study employed ordinary least squares regression with heteroscedasticity-robust standard errors (HC3) across four model specifications [39]. The baseline model examined regional and temporal variation on the trust gap. Adding individual-level controls in Model 2a tested whether regional differences persisted after accounting for respondent characteristics. Substituting the standardized poverty rate for regional dummies in Model 2b addressed the role of economic context. Region-by-wave interaction terms in Model 3 tested whether trust gap trajectories differed across regions over time.
An ordered logit robustness check was conducted to address the bounded ordinal nature of the trust gap. The direction and relative magnitude of all key predictors—including the legitimacy index, rural residence, and Wave 6—closely mirrored the OLS estimates and justify using OLS for the primary estimation strategy (Table S2). Estimating a supplementary model without economic evaluation addresses the endogeneity concern directly. The legitimacy index, rural residence, and the Northeast × Wave 6 interaction retain consistent direction and magnitude across both specifications (Table S3). Subjective economic assessments do not drive the core findings.
Cluster-robust standard errors at the regional level were not applied, as the number of clusters (five regions) fell below the threshold for reliable cluster-based inference [39]. The regional poverty rate varies only at the region-wave level and produces 15 unique values across 2536 observations. The analytic sample for Models 2a–3 reflects listwise deletion on individual-level covariates. Variance inflation factors were examined across all specifications. For Model 3, generalized variance inflation factors (GVIF(1/(2 × Df))) were computed at the predictor level to account for interaction terms [40]. All adjusted values were low and well below conventional thresholds, with no evidence of problematic multicollinearity. VIF values for Models 1a, 1b, 2a, and 2b also remained within acceptable ranges (Table S1). All models were estimated in R version 4.5.2.4.

4. Results

4.1. Descriptive Patterns

In Wave 4, the mean trust gap stood at −0.032, a slight overall preference for central government. By Wave 5 it had turned marginally positive (0.026). It reached 0.273 by Wave 6, a shift traceable across all model specifications.
Regional variation was already present in Wave 4. The North reported a positive trust gap (0.236), while Bangkok (−0.182), the Northeast (−0.178), and the Central region (−0.020) all leaned toward central government. The South fell in between (0.087). By Wave 6, all five regions had shifted in the same direction. The Northeast recorded the largest movement, rising from −0.178 to 0.528, as Figure 4 shows. These values represent raw regional means unadjusted for individual-level covariates.

4.2. Regression Results

Table 2, Model 1 presents a baseline regression of the trust gap on regional dummies and survey wave indicators, with Bangkok at Wave 4 as the reference category (N = 3140; R2 = 0.028, F(6, 3133) = 15.16, p < 0.001). Three regional predictors reached significance. Respondents in the South report a trust gap 0.247 points higher than those in Bangkok (SE = 0.067, p < 0.001), the largest regional differential in this specification. The Central region (B = 0.171, SE = 0.059, p = 0.003) and the North (B = 0.161, SE = 0.062, p = 0.009) also show significantly higher gaps. The Northeast coefficient, though positive (B = 0.086), falls short of significance (p = 0.118). Its trust profile did not differ from Bangkok’s in the baseline period. Wave 6 carries a large and highly significant coefficient (B = 0.305, SE = 0.038, p < 0.001). Trust gap scores were higher relative to Wave 4, net of regional differences. Wave 5 falls short of significance (B = 0.066, p = 0.092). Model 1b replicates this specification on the complete-case sample (N = 2536). Regional coefficients shrank substantially, a pattern attributable to compositional differences between the full and analytic samples. The Wave 6 coefficient held at a comparable magnitude in the restricted sample (B = 0.335, p < 0.001).
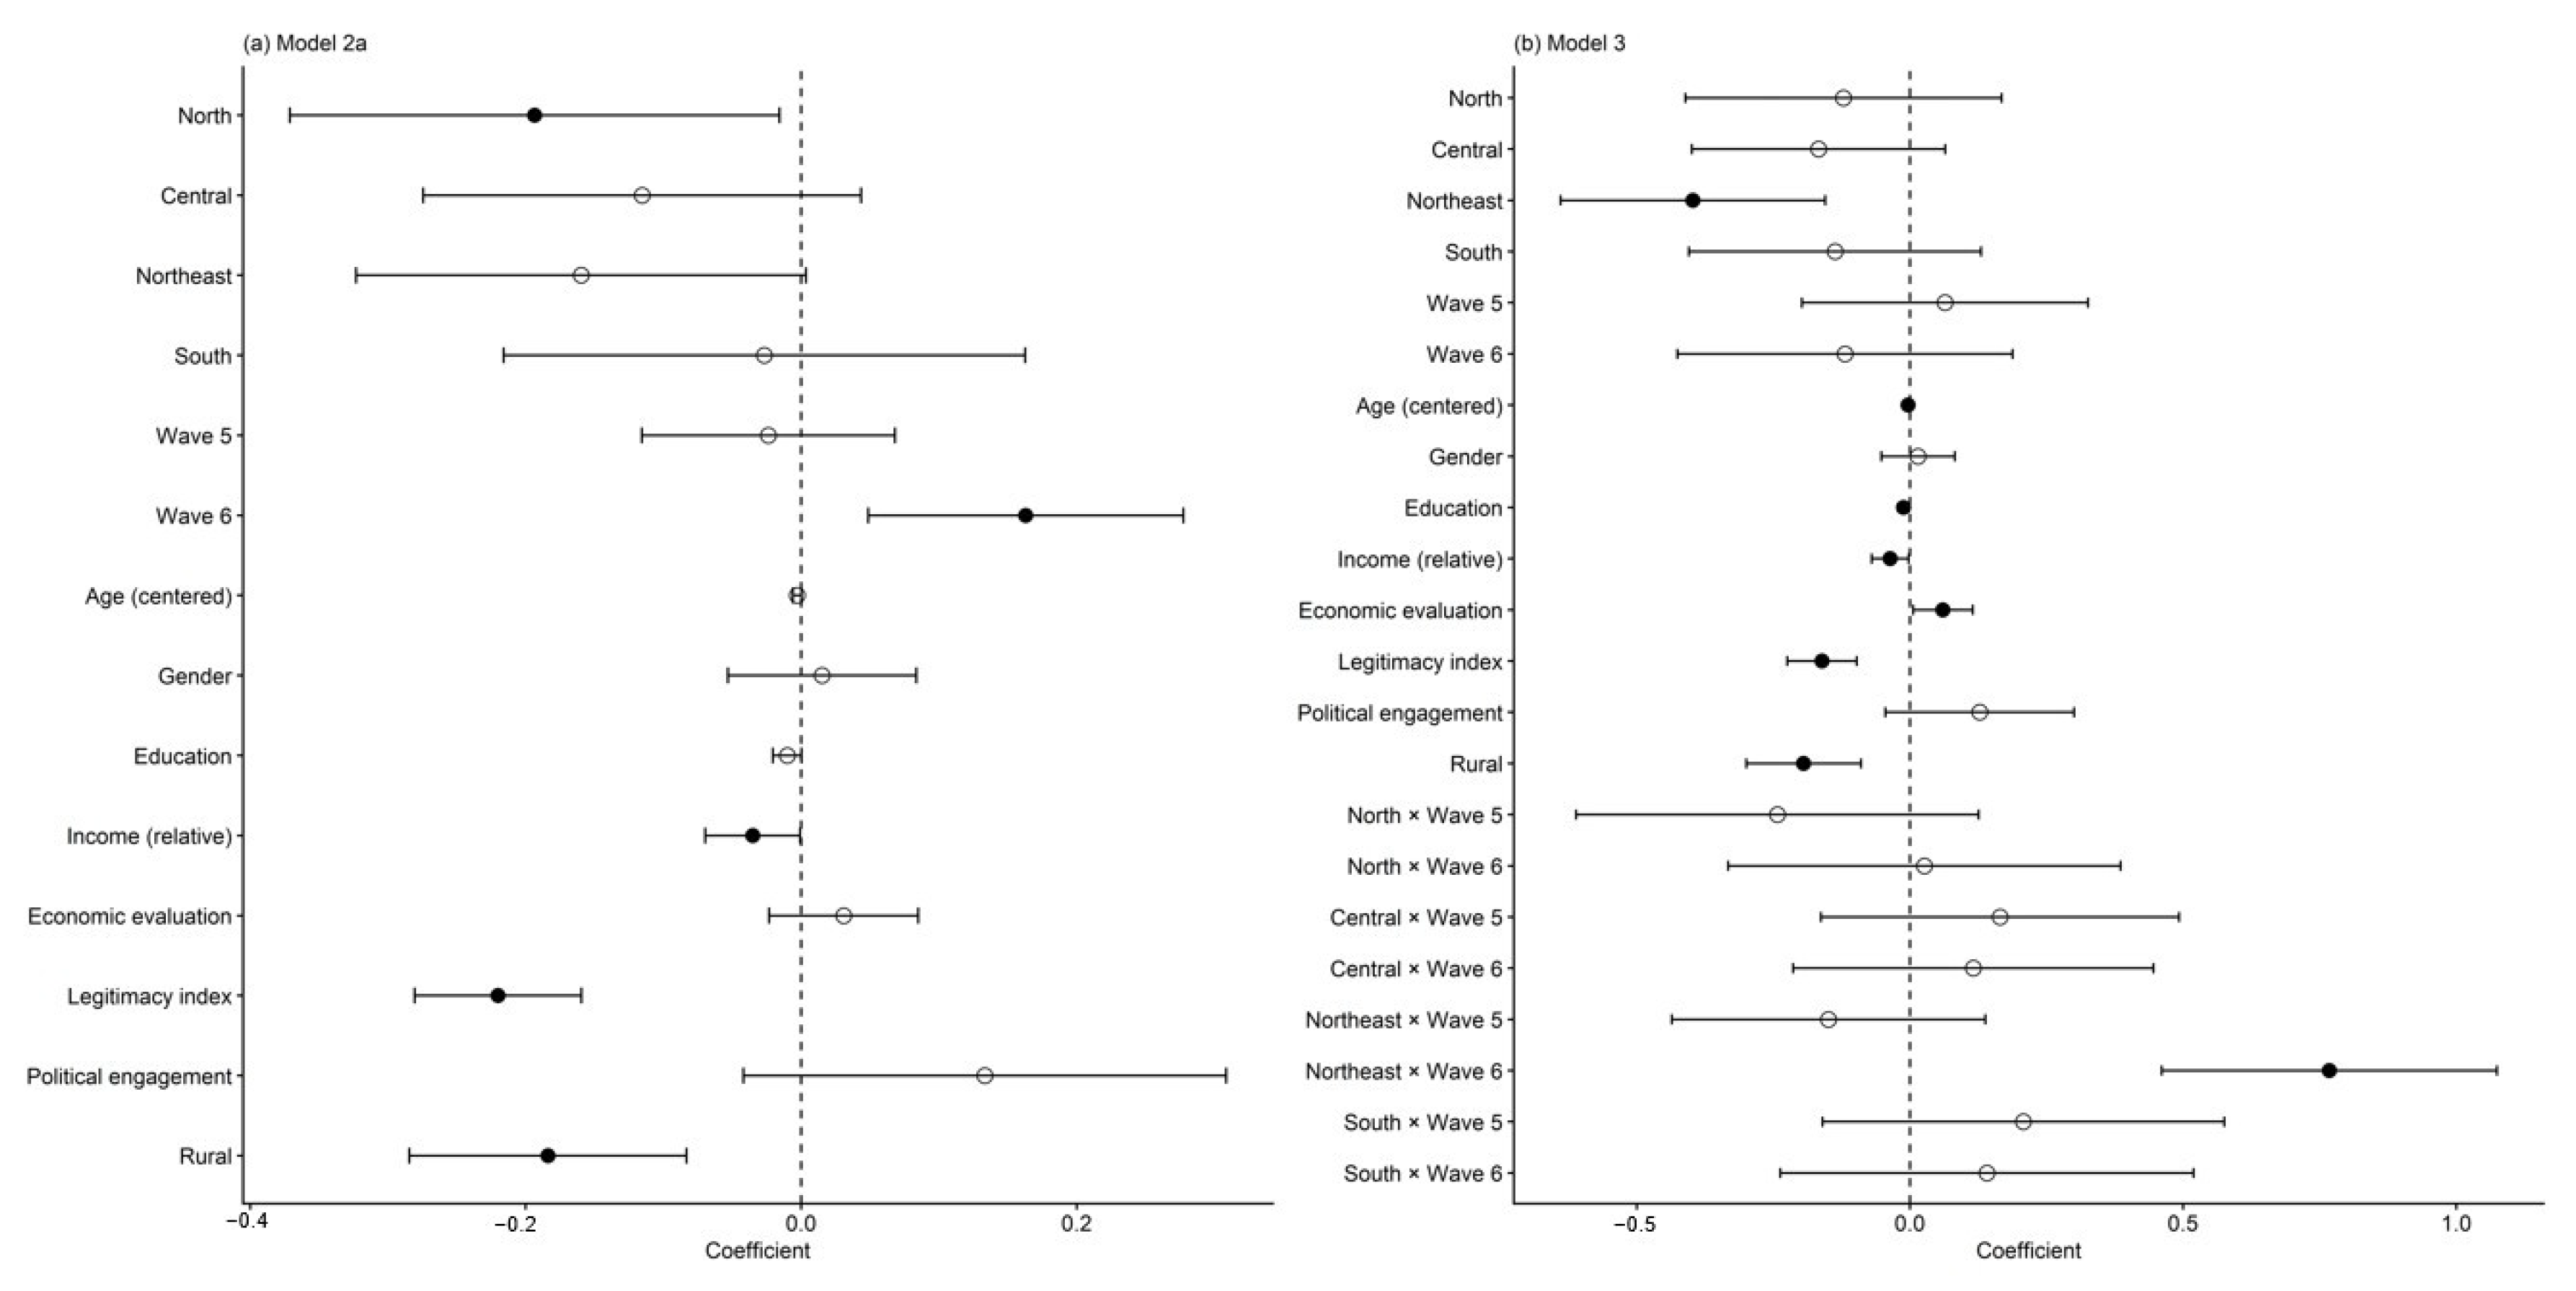
Adding individual-level controls (Model 2a; N = 2536; R2 = 0.062, F(14, 2521) = 11.92, p < 0.001) changes the picture considerably. Figure 5 presents coefficient plots for Models 2a and 3. The reduction in sample size from Model 1 reflects listwise deletion on the added covariates. All four region dummies turn negative, and only the North retains significance (B = −0.193, SE = 0.091, p = 0.033). The reversal shows that regional differences in Model 1 partly captured compositional differences across regions—in income, education, legitimacy evaluations, and residential setting—and not geography as such. The legitimacy index emerges as the strongest predictor (B = −0.220, SE = 0.031, p < 0.001). Respondents who perceive political institutions as legitimate report smaller trust gaps, with more similar evaluations of local and central government. Rural residence exerts a comparably large effect, with rural respondents scoring 0.184 points lower than urban respondents (SE = 0.051, p < 0.001). Decentralization theory predicts the opposite. Rural residents, more reliant on local administrative organizations, would be expected to express stronger preference for local government. The coefficient indicates the contrary pattern, a finding that warrants further theoretical attention in the discussion. Relative income also reaches significance (B = −0.035, SE = 0.018, p = 0.045). Wave 6 remains significant and positive (B = 0.163, SE = 0.058, p = 0.005), though the coefficient is roughly half its Model 1 size.
To identify which covariates drove the regional sign reversal, a sequence of nested models added controls in four blocks: regional and wave indicators, demographics, legitimacy and economic evaluations, and political engagement with rural residence. Regional coefficients turned negative upon the addition of demographic controls, with rural residence completing the reversal and pushing the North coefficient to significance. Geography explains little of the trust gap once the demographic and residential composition of each region is accounted for.
A second control specification (Model 2b) substitutes a standardized provincial poverty rate for the regional dummies while keeping individual-level controls (R2 = 0.061, F(11, 2524) = 15.27, p < 0.001). Figure 2 presents the regional distribution of poverty rates that underlies this variable. The poverty rate coefficient is negative and significant (B = −0.069, SE = 0.024, p = 0.004). This significance level requires cautious interpretation. The poverty rate contains only 15 unique values, and standard errors for this variable may be overly optimistic. Residents of more economically peripheral regions report smaller trust gaps. H4 is not supported. Contrary to the predicted direction, higher poverty rates compress rather than widen the trust gap. Economic marginalization does not translate into greater relative preference for local government. Wave 6 loses significance once poverty is introduced (B = 0.072, p = 0.218). Regional economic structure may account for the temporal pattern observed in earlier models. The apparent increase in trust gap scores by 2022 likely reflects underlying regional differences.
To test whether temporal trajectories in the trust gap differ across regions, Model 3 introduces eight region-by-wave interaction terms (R2 = 0.106, adj. R2 = 0.098, F(22, 2513) = 13.84, p < 0.001). Only one interaction reaches significance. Northeast x Wave 6 (B = 0.767, SE = 0.157, p < 0.001) is the highest coefficient in the entire analysis. The reference category is Bangkok in Wave 4, with the intercept at 0.659. The Northeast main effect (B = −0.397, p = 0.001) places the predicted trust gap at −0.169 for Northeast respondents in Wave 4. By Wave 6, the predicted value rises to 0.480, a shift of approximately 0.65 points. No other region exhibits a comparable shift. Temporal change in the trust gap is not a uniform national trend but a regionally concentrated one, driven primarily by the Northeast’s trajectory between 2014 and 2022. Predicted trust gap values for all region-wave combinations appear in Table 3, with the Northeast recording the largest movement of any region across the study period.
The legitimacy index (B = −0.161, SE = 0.032, p < 0.001) and rural residence (B = −0.194, SE = 0.054, p < 0.001) remain strong and stable across all four specifications. Their consistency confirms that individual-level political evaluations and residential setting shape trust differentials independently of regional location and survey wave. Regional disparities in the trust gap are real, but explained more by who lives where than by geography itself. The Northeast’s pronounced shift by Wave 6 points to political alienation and uneven state presence in the region.
Decomposing the trust gap into its constituent parts clarifies the mechanism. Separate models estimating local and central government trust as independent outcomes show that the Northeast’s Wave 6 shift was driven primarily by rising local government trust (B = 0.525, p < 0.001). The central government trust coefficient moved in the opposite direction and did not reach significance (B = −0.243, p = 0.064). Citizens in the Northeast did not simply lose confidence in Bangkok. The widening trust gap is not merely a rejection of the center. Accumulated political alienation redirected evaluative credit toward local institutions, a distinction that grounds the subsequent discussion of political alienation and territorial development (Tables S4 and S5).

5. Discussion

Regional location predicts the trust gap in the baseline model, but the effect is largely compositional. Citizens across Thailand’s regions do not differ from Bangkok residents primarily because of where they live. The difference lies in who lives there and how those residents evaluate political institutions. This compositional logic is rooted in what Hewison [41] calls a general inequality of condition, a long-standing pattern in which economic growth has been captured disproportionately by capital and urban elites while peripheral regions fell further behind. The Northeast consistently records the lowest GRP per capita of any region, and the absolute gap with Bangkok widened between 2014 and 2022. A regressive rice tax historically transferred wealth from the agricultural sector to urban consumers, and state welfare and education investments similarly concentrated in the capital, excluding rural populations from formal sector benefits for generations [42]. Geography shapes trust through the population and institutional conditions it produces.
The rural result challenges decentralization theory’s proximity argument [25,29]. One plausible reading draws on Dong and Kübler’s [26] account of hierarchical trust, where central government retains credibility as the source of redistributive transfers even when local officials are distrusted for corruption or weak delivery. In Thailand, programmatic welfare transfers have historically reached rural households through the central state. Universal healthcare, village funds, and agricultural support schemes—institutionalized across successive administrations—created a durable association between central government and material welfare delivery among rural populations. These transfers originated from and remained associated with the central tier, generating specific support for it even among populations that might otherwise resent Bangkok’s dominance. Local governments operate with limited fiscal autonomy and are more visibly embedded in patronage networks that rural communities experience as unreliable. Urban residents, holding both tiers to higher accountability standards and more exposed to local administrative failures, differentiate more sharply between them. Stroppe’s [31] argument that low-intensity everyday cues about service quality accumulate into durable evaluative patterns fits this dynamic well. The welfare-transfer explanation is theoretically motivated by the literature on redistributive transfers. With the current data, it cannot be tested directly and should be treated as one tentative mechanism among several plausible alternatives. The rural variable measures current residence, not a stable long-term characteristic. Reverse causality cannot be ruled out. Rural residents dependent on central transfers may distrust local government specifically on account of local officials operating within patronage structures that exclude them from reliable service delivery.
The poverty rate result adds a structural dimension. Residents of economically peripheral regions report smaller trust gaps, not larger ones. Where poverty is highest, local governments are also most constrained in capacity. Citizens in these areas tend to hold uniformly compressed expectations of both governance tiers, with no strong preference for either. What appeared as a temporal shift in trust attitudes is at least partially attributable to structural economic geography. The overall wave trend should not be read as evidence of genuine nationwide attitudinal change. Rodríguez-Pose [32] argued that territorial inequalities generate differentiated political attitudes independently of political events. The poverty result is consistent with that logic and calls for caution in reading the overall wave trend as evidence of attitudinal change.
The Northeast stands apart. Its trust trajectory between 2014 and 2022 diverges sharply from every other region, concentrated entirely in the final wave. The political context provides the most plausible interpretive frame, though it cannot be confirmed by the regression alone. The Northeast has been the electoral heartland of the rural majority repeatedly disenfranchised by Bangkok-based institutional interventions: military coups, judicial dissolutions of elected governments, and constitutional engineering designed to contain rural electoral power. The 2006 and 2014 coups represented a defense of the palace–military–business coalition. The target was a government whose welfare programs and electoral base threatened the existing structure of inequality. That structure had long tied regional poverty to political alignment [3]. The central establishment repeatedly dissolved governments with strong rural mandates and resisted meaningful decentralization, including direct elections for provincial governors which the 1997 Constitution declined to grant [43]. This institutional design reproduced the same exclusion pattern that had accumulated since 2006, extending the Northeast’s experience of electoral disenfranchisement into the nominally electoral period that Wave 6 captured. The arrangement has been described as sophisticated authoritarianism, in which formal electoral procedures coexist with structural mechanisms that prevent reformist majorities from exercising power [44].
The region’s distinct identity compounds this political marginalization. What the Thai state officially labels Isan was itself an administrative invention, the term replacing Lao in the late nineteenth century to erase ethnic distinctiveness and enforce a homogeneous national identity through education, language policy, and bureaucratic control. Scholarly estimates place the ethnically Lao population of the Northeast at between 13 and 18 million, nearly one-third of Thailand’s total [45]. Despite a century of forced assimilation, a distinct Isan identity persisted and hardened, with language-based political solidarity producing measurable differences in trust and electoral preference.
A century of cultural assimilation followed by decades of political marginalization created conditions in which central state authority carries a particular kind of illegitimacy in the Northeast that other regions do not share to the same degree. By 2022, accumulated alienation had reached a tipping point. The 2023 election, conducted just one year after Wave 6 data collection, reinforces this reading. The Move Forward Party finished first or second in all 400 constituencies nationwide. Its support extended strongly into northeastern provinces. The regional reformist alignment visible in the Wave 6 trust data continued into electoral behavior. Yet institutional override followed, as the party was blocked from forming government by the military-appointed Senate despite winning the most seats, reproducing precisely the pattern of disenfranchisement that the trust data reflect [46,47]. Easton’s [14] distinction between specific and diffuse support is useful here. The abruptness of the Wave 6 shift suggests a response to specific institutional events. The Wave 6 time point effectively functions as a proxy for the cumulative impact of military governance—the 2014 coup, the 2017 constitutional engineering, and the 2019 electoral opening that preserved military veto power. Political alienation from the center did not produce generalized institutional cynicism. Confidence was redirected toward the proximate tier instead.
Institutional legitimacy evaluation is the primary axis along which trust differentials are organized. The pattern holds across regions and waves. Respondents who perceive political institutions as legitimate distribute trust more evenly between governance tiers, with less concentration at the local level. This aligns with Hetherington’s [15] performance-based account and Mishler and Rose’s [20] synthesis. Both locate trust in ongoing assessments of institutional behavior. Legitimate institutions compress vertical trust differentiation and vice versa. The direction of that widening is shaped by the specific political experience of each region. While urban and rural voting behavior has begun to converge around reformist platforms, the conservative establishment continues to override electoral mandates through constitutional mechanisms. In this context, the trust gap may be less a measure of attachment to local government and more a measure of alienation from central authority, a distinction that matters for how decentralization policy is designed and evaluated.
Several limitations bear on the interpretation of these findings. The pooled cross-sectional design means wave-level differences stem from aggregate shifts in the sampled population. Within-person attitude change cannot be observed. The five-region framework is coarser than provincial variation and may mask heterogeneity within regions. Economic evaluation is measured at the individual level and may be endogenous to political trust. Instrumental variable approaches could address this in future work. All three waves were conducted under military or military-influenced governance, raising the possibility that social desirability pressures inflated reported central government trust and attenuated observed regional and temporal differences, particularly in Wave 4 and Wave 5. The trust gap operationalization is grounded in theory but cannot distinguish whether observed changes originate from shifts in local trust, central trust, or both. The supplementary decomposition models address this concern partially.

6. Conclusions

Territorial disparities in government trust run deeper than geography. Institutional legitimacy and state capacity drive them. Decentralization reforms that ignore these foundations will fall short. Fiscally constrained local governments and a central state perceived as unresponsive to electoral mandates produce trust deficits that administrative redesign alone cannot resolve.
Historical marginalization, repeated electoral disenfranchisement, and persistent economic inequality have made trust in the Northeast especially volatile. Reformist aspirations have expanded. The constitutional order has not moved to accommodate them. Trust recovery in the Northeast depends less on administrative reform and more on constitutional changes that restore meaningful electoral representation. Thailand’s territorial trust landscape cannot fully stabilize until the legitimacy crisis at the center is addressed directly.
The findings have important implications for decentralization and territorial development. Fiscal transfer mechanisms should be redesigned to close the capacity gap between local and central government. Priority should go to regions where both tiers command low confidence. Decentralization policy that expands administrative responsibilities without corresponding fiscal autonomy will deepen the conditions that compress the trust gap and reduce local government effectiveness as a development actor. Transparency in central-to-local allocation decisions would allow citizens to attribute service outcomes more accurately across governance tiers, strengthening the legitimacy of decentralized institutions. Territorial cohesion strategies in Thailand must account for the political dimension of trust alongside fiscal and administrative reforms.
Future research should extend this analysis in three directions. Provincial-level data from administrative sources would allow finer-grained spatial analysis beyond the five-region framework and provide the spatial granularity needed to confirm the poverty finding. Longitudinal panel designs would permit within-person tracking of attitude change across political transitions. Survey experiments separating proximity effects from performance evaluations would help distinguish the mechanisms driving the rural trust pattern identified in this study.

Supplementary Materials

The following supporting information can be downloaded at: https://www.mdpi.com/article/10.3390/land15060906/s1, Table S1. Variance inflation factors across model specifications. Table S2. Ordered logit robustness check for trust gap. Table S3. OLS regression results excluding economic evaluation. Table S4. OLS regression results for local and central government trust without interactions. Table S5. OLS regression results for local and central government trust with region × wave interactions.

Author Contributions

Conceptualization, S.M.; Methodology, S.M.; Validation, S.M.; Formal analysis, S.M.; Investigation, S.M.; Resources, S.M.; Data curation, S.M.; Writing—original draft, S.M.; Writing—review & editing, S.M.; Visualization, S.M.; Supervision, J.-J.S.; Project administration, S.M.; Funding acquisition, S.M. All authors have read and agreed to the published version of the manuscript.

Funding

This research was funded by Mahasarakham University. The APC was funded by Mahasarakham University.

Data Availability Statement

Data are available from the Asian Barometer Survey https://www.asianbarometer.org (accessed on 1 October 2025).

Conflicts of Interest

The authors declare no conflicts of interest.

Abbreviations

The following abbreviations are used in this manuscript:
ABSAsian Barometer Survey
GRPGross Regional Product
GVIFGeneralized Variance Inflation Factor
HC3Heteroscedasticity-Consistent Standard Errors (Type 3)
OLSOrdinary Least Squares
VIFVariance Inflation Factor

References

  1. Charoensin-o-larn, C. Redrawing Thai Political Space: The Red Shirt Movement. In Cleavage, Connection and Conflict in Rural, Urban and Contemporary Asia; Bunnell, T., Parthasarathy, D., Thompson, E., Eds.; Springer: Dordrecht, The Netherlands, 2013; Volume 3, pp. 233–252. [Google Scholar] [CrossRef]
  2. Thananithichot, S. The Roots and Drivers of the Color-Based Polarizations in Thailand. Asian J. Public Opin. Res. 2021, 9, 85–105. [Google Scholar] [CrossRef]
  3. Sopranzetti, C. Thailand’s Relapse: The Implications of the May 2014 Coup. J. Asian Stud. 2016, 75, 299–316. [Google Scholar] [CrossRef]
  4. Hewison, K. Thailand: Contestation over elections, sovereignty and representation. Representation 2015, 51, 51–62. [Google Scholar] [CrossRef]
  5. Jarernpanit, T. The Moral Disintegration and the Politics of Cultural Emotions within Thailand’s Current, Deeply Divided Political Conflicts. Humanit. Arts Soc. Sci. Stud. 2018, 18, 717–736. [Google Scholar] [CrossRef]
  6. Sombatpoonsiri, J. The 2014 Military Coup in Thailand: Implications for Political Conflicts and Resolution. Asian J. Peacebuild. 2017, 5, 131–154. [Google Scholar] [CrossRef]
  7. Laothamatas, A. A Tale of Two Democracies: Conflicting Perceptions of Elections and Democracy in Thailand. In The Politics of Election in Southeast Asia; Taylor, R.H., Ed.; Cambridge University Press: New York, NY, USA, 1996; pp. 201–223. [Google Scholar]
  8. McCargo, D. Thailand’s urbanized villagers and political polarization. Crit. Asian Stud. 2017, 49, 365–378. [Google Scholar] [CrossRef]
  9. Meesuwan, S.; Setthasuravich, P. Urban and rural threat perceptions of China in Thailand: A longitudinal analysis from the Asian Barometer Survey. Front. Polit. Sci. 2025, 7, 1564586. [Google Scholar] [CrossRef]
  10. Punyaratabandhu, S. Corruption and Government Trust: A Survey of Urban and Rural Inhabitants in the North and Northeast of Thailand. Int. Public Manag. Rev. 2014, 8, 164–182. [Google Scholar]
  11. Buchanan, J. Translating Thailand’s protests: An analysis of Red Shirt rhetoric. Austrian J. South-East Asian Stud. 2013, 6, 60–80. [Google Scholar]
  12. Lowatcharin, G. Along Came the Junta: The Evolution and Stagnation of Thailand’s Local Governance. Kyoto Rev. Southeast Asia 2014, 16. Available online: https://kyotoreview.org/yav/along-came-the-junta-the-evolution-and-stagnation-of-thailands-local-governance/ (accessed on 1 December 2025).
  13. World Bank. The Reform of Central-Local Fiscal Relations in Thailand; Report No. 67486-TH; World Bank: Bangkok, Thailand, 2012; Available online: https://openknowledge.worldbank.org/server/api/core/bitstreams/be65745b-19aa-5874-b141-6ae294775035/content (accessed on 6 January 2026).
  14. Easton, D. A Systems Analysis of Political Life; John Wiley: New York, NY, USA, 1965. [Google Scholar]
  15. Hetherington, M.J. The political relevance of political trust. Am. Political Sci. Rev. 1998, 92, 791–808. [Google Scholar] [CrossRef]
  16. Hetherington, M.J.; Husser, J.A. How trust matters: The changing political relevance of political trust. Am. J. Political Sci. 2012, 56, 312–325. [Google Scholar] [CrossRef]
  17. Miller, A.H.; Listhaug, O. Political parties and confidence in government: A comparison of Norway, Sweden and the United States. Br. J. Political Sci. 1990, 20, 357–386. [Google Scholar] [CrossRef]
  18. Citrin, J.; Stoker, L. Political trust in a cynical age. Annu. Rev. Political Sci. 2018, 21, 49–70. [Google Scholar] [CrossRef]
  19. Kestilä-Kekkonen, E.; Söderlund, P. Political trust, individual-level characteristics and institutional performance. Scand. Political Stud. 2016, 39, 138–160. [Google Scholar] [CrossRef]
  20. Mishler, W.; Rose, R. What are the origins of political trust? Testing institutional and cultural theories in post-communist societies. Comp. Political Stud. 2001, 34, 30–62. [Google Scholar] [CrossRef]
  21. Zhang, J.; Li, H.; Yang, K. A meta-analysis of the government performance–trust link: Taking cultural and methodological factors into account. Public Adm. Rev. 2022, 82, 39–58. [Google Scholar] [CrossRef]
  22. Levi, M.; Stoker, L. Political trust and trustworthiness. Annu. Rev. Political Sci. 2000, 3, 475–507. [Google Scholar] [CrossRef]
  23. Niu, G.; Zhao, G. Identity and trust in government: A comparison of locals and migrants in urban China. Cities 2018, 83, 54–60. [Google Scholar] [CrossRef]
  24. Alıca, B.; Schakel, A.H. Does multilevel government increase legitimacy? Citizens’ preferences for subnational authority and acceptance of governmental decisions. J. Public Policy 2025, 45, 270–292. [Google Scholar] [CrossRef]
  25. Brinkerhoff, D.W.; Wetterberg, A.; Wibbels, E. Distance, services, and citizen perceptions of the state in rural Africa. Governance 2018, 31, 103–124. [Google Scholar] [CrossRef]
  26. Dong, L.; Kübler, D. Government performance, political trust, and citizen subjective well-being: Evidence from rural China. Glob. Public Policy Gov. 2021, 1, 383–400. [Google Scholar] [CrossRef]
  27. Ho, S.; Choudhury, P.R.; Haran, N.; Leshinsky, R. Decentralization as a strategy to scale fit-for-purpose land administration: An Indian perspective on institutional challenges. Land 2021, 10, 199. [Google Scholar] [CrossRef]
  28. Schneider, C.; Cottineau, C. Decentralisation versus territorial inequality: A comparative review of English city region policy discourse. Urban Sci. 2019, 3, 90. [Google Scholar] [CrossRef]
  29. Kahkonen, S.; Lanyi, A. Decentralization and Governance: Does Decentralization Improve Public Service Delivery? PREM Notes, No. 55; World Bank: Washington, DC, USA, 2001. [Google Scholar] [CrossRef]
  30. Qi, L.; Gong, H. Local government performance: Promoting trust in local government and reducing trust gap. Local Gov. Stud. 2025, 51, 726–746. [Google Scholar] [CrossRef]
  31. Stroppe, A.-K. Left behind in a public services wasteland? On the accessibility of public services and political trust. Political Geogr. 2023, 105, 102905. [Google Scholar] [CrossRef]
  32. Rodríguez-Pose, A. The revenge of the places that don’t matter (and what to do about it). Camb. J. Reg. Econ. Soc. 2018, 11, 189–209. [Google Scholar] [CrossRef]
  33. Rickardsson, J. The urban–rural divide in radical right populist support: The role of residents’ characteristics, urbanization trends and public service supply. Ann. Reg. Sci. 2021, 67, 211–242. [Google Scholar] [CrossRef]
  34. Lipps, J.; Schraff, D. Regional inequality and institutional trust in Europe. Eur. J. Political Res. 2021, 60, 892–913. [Google Scholar] [CrossRef]
  35. Asian Barometer. Asian Barometer: Survey Methods. Available online: https://asianbarometer.org/survey.html?page=s40 (accessed on 2 December 2025).
  36. Kromrey, J.D.; Foster-Johnson, L. Mean centering in moderated multiple regression: Much ado about nothing. Educ. Psychol. Meas. 1998, 58, 42–67. [Google Scholar] [CrossRef]
  37. National Statistical Office of Thailand. Proportion of Poor Population (Expenditure-Based), Classified by Region and Province, 2012–2023. Available online: https://www.nso.go.th/nsoweb/index#gsc.tab=0 (accessed on 1 December 2025). (In Thai)
  38. Office of the National Economic and Social Development Council (NESDC). Gross Regional and Provincial Product. Available online: https://www.nesdc.go.th/info/gross-regional-and-provincial-product/ (accessed on 1 December 2025). (In Thai)
  39. Esarey, J.; Menger, A. Practical and effective approaches to dealing with clustered data. Political Sci. Res. Methods 2019, 7, 541–559. [Google Scholar] [CrossRef]
  40. Fox, J.; Monette, G. Generalized collinearity diagnostics. J. Am. Stat. Assoc. 1992, 87, 178–183. [Google Scholar] [CrossRef]
  41. Hewison, K. Considerations on inequality and politics in Thailand. Democratization 2014, 21, 846–866. [Google Scholar] [CrossRef]
  42. Choeun, H.; Godo, Y.; Hayami, Y. The economics and politics of rice export taxation in Thailand: A historical simulation analysis, 1950–1985. J. Asian Econ. 2006, 17, 103–125. [Google Scholar] [CrossRef]
  43. Jory, P. Political decentralisation and the resurgence of regional identities in Thailand. Aust. J. Soc. Issues 1999, 34, 337–352. [Google Scholar] [CrossRef]
  44. Sripokangkul, S.; Crumpton, C.D.; Draper, J. Restricting democratic choice in Thailand’s 2019 election: “Retrograde” and “sophisticated” authoritarianism. TRaNS Trans-Reg.-Natl. Stud. Southeast Asia 2023, 11, 71–87. [Google Scholar] [CrossRef]
  45. Ricks, J. State institutions in Northeast Thailand: Lao ethnics and the Thai identity. In State Institutions, Civic Associations, and Identity Demands: Regional Movements in Greater Southeast Asia; University of Michigan Press: Ann Arbor, MI, USA, 2024; pp. 106–119. [Google Scholar]
  46. Koh, Y.; Sinpeng, A.; Thabchumpon, N. The Pheu Thai Party’s decline in the 2023 Thai general elections: An analysis of Chiang Mai’s provincial results. Contemp. Southeast Asia 2025, 47, 408–436. [Google Scholar] [CrossRef]
  47. Pawakapan, P. Thailand in 2024: Institutional reform impossible and instability continues. Southeast Asian Aff. 2025, 2025, 309–324. [Google Scholar]
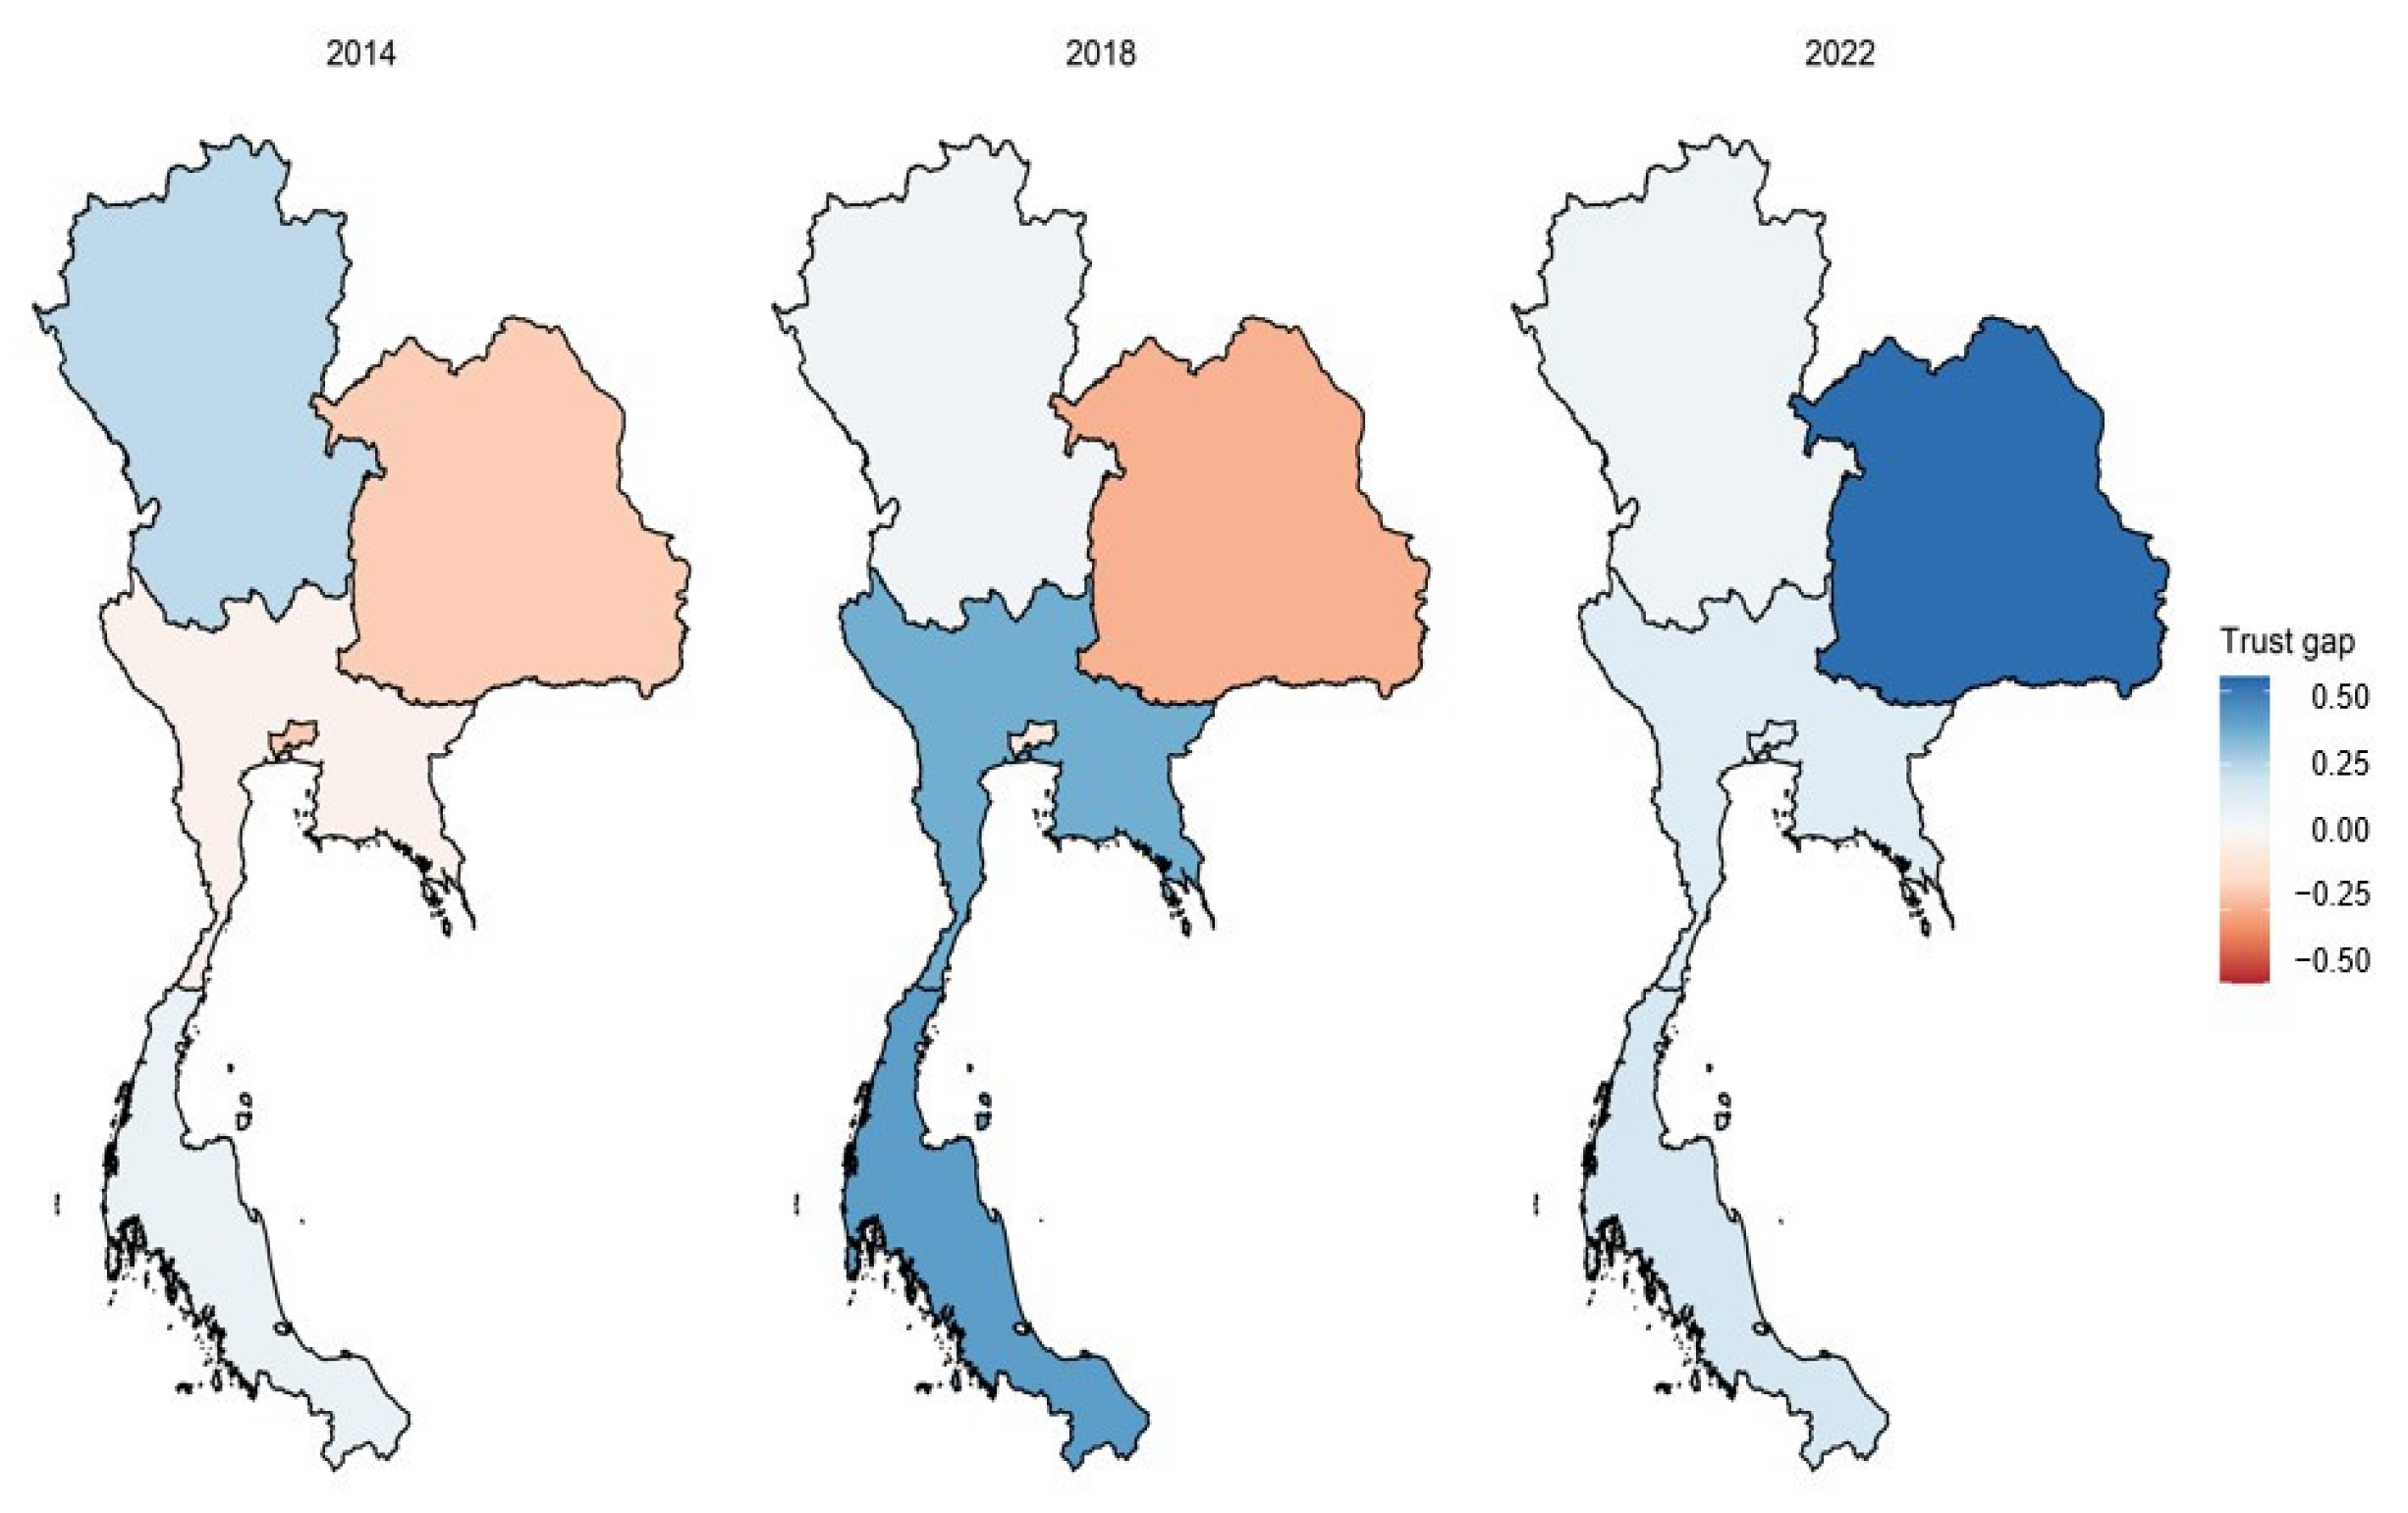
Figure 1. Trust gap by region, 2014–2022. Positive values indicate greater trust in local government; negative values indicate greater trust in central government.
Land 15 00906 g001
Figure 2. Poverty rate by region, 2014–2022.
Land 15 00906 g002
Figure 3. Gross regional product per capita by region, 2014–2022.
Land 15 00906 g003
Figure 4. Mean trust gap by region, 2014–2022. The dashed horizontal line indicates a trust gap of zero.
Land 15 00906 g004
Figure 5. Coefficient plots with 95% confidence intervals. (a) Model 2a: individual-level predictors; (b) Model 3: region × wave interactions. Filled circles indicate statistical significance at p < 0.05, while unfilled circles indicate non-significant estimates. Interaction terms are presented in a separate block at the bottom for clarity.
Land 15 00906 g005
Table 1. Descriptive statistics of the variables.
VariableNMinMaxMeanSD
Trust Gap3140−3.003.000.090.89
Age35841810446.8113.78
Gender (male = 1)3587010.530.50
Education (years)35230249.134.53
Income (quintile)3195152.331.18
Economic Evaluation3547152.720.76
Legitimacy Index3109142.610.79
Political Engagement3585010.430.22
Rural (rural = 1)3587010.220.41
Poverty Rate (%)36000.9917.088.834.80
Note. Binary variables are coded as 0–1 indicators; means represent proportions. N varies due to missing data. Poverty rate is measured at the regional level.
Table 2. OLS regression results for trust gap across Thai regions.
VariableModel 1aModel 1bModel 2aModel 2bModel 3
Region (ref = Bangkok)
North0.161 (0.062) **0.003 (0.073)−0.193 (0.091) * −0.121 (0.148)
Central0.171 (0.059) **0.039 (0.067)−0.116 (0.081) −0.168 (0.118)
Northeast0.086 (0.055)0.024 (0.062)−0.160 (0.083) −0.397 (0.123) **
South0.247 (0.067) ***0.174 (0.077) *−0.026 (0.097) −0.137 (0.136)
Survey wave (ref = Wave 4)
Wave 50.066 (0.039)0.028 (0.044)−0.024 (0.047)−0.066 (0.048)0.064 (0.134)
Wave 60.305 (0.038) ***0.335 (0.042) ***0.163 (0.058) **0.072 (0.059)−0.119 (0.156)
Region × Wave interactions (ref = Bangkok × Wave 4)
North × Wave 5 −0.243 (0.188)
North × Wave 6 0.026 (0.183)
Central × Wave 5 0.166 (0.167)
Central × Wave 6 0.117 (0.168)
Northeast × Wave 5 −0.149 (0.146)
Northeast × Wave 6 0.767 (0.157) ***
South × Wave 5 0.208 (0.188)
South × Wave 6 0.141 (0.193)
Controls
Age (centered) −0.003 (0.002)−0.003 (0.002) *−0.003 (0.002) *
Gender 0.015 (0.035)0.013 (0.035)0.015 (0.034)
Education −0.010 (0.005)−0.007 (0.005)−0.012 (0.005) *
Income (relative) −0.035 (0.018) *−0.041 (0.017) *−0.036 (0.017) *
Economic evaluation 0.031 (0.028)0.028 (0.027)0.060 (0.028) *
Legitimacy index −0.220 (0.031) ***−0.215 (0.031) ***−0.161 (0.032) ***
Political engagement 0.134 (0.089)0.145 (0.087)0.128 (0.088)
Rural −0.184 (0.051) ***−0.205 (0.048) ***−0.194 (0.054) ***
Poverty rate (std) −0.069 (0.024) **
Constant−0.167 (0.054) **−0.100 (0.071)0.793 (0.161) ***0.700 (0.143) ***0.659 (0.194) ***
N31402536253625362536
R20.0280.0330.0620.0610.106
Adj. R20.0260.0300.0570.0570.098
F15.1614.2711.9215.2713.84
Note. Robust (HC3) standard errors are reported. Model 1a uses the full analytical sample. Model 1b re-estimates Model 1a on the complete-case sample used in Models 2a–3. Model 2a includes individual-level covariates and regional dummy variables. Model 2b replaces regional dummy variables with the standardized poverty rate. Model 3 includes region × wave interaction terms. The largest sources of missing data in the analytic sample were the legitimacy index (491 cases) and income (405 cases). * p < 0.05. ** p < 0.01. *** p < 0.001.
Table 3. Predicted trust gap by region and wave (Model 3).
RegionWave 4Wave 5Wave 6
Bangkok0.2280.2920.109
North0.107−0.0720.014
Central0.0610.2900.058
Northeast−0.169−0.2540.480
South0.0910.3630.113
Note. Predicted values from Model 3 with continuous covariates held at their sample means and rural residence set to its sample proportion (0.22). Positive values denote greater trust in local government relative to central government.
Disclaimer/Publisher’s Note: The statements, opinions and data contained in all publications are solely those of the individual author(s) and contributor(s) and not of MDPI and/or the editor(s). MDPI and/or the editor(s) disclaim responsibility for any injury to people or property resulting from any ideas, methods, instructions or products referred to in the content.