Article

Spatiotemporal Evolution and Multi-Scenario Simulation of Carbon Storage on the Loess Plateau Based on PLUS-InVEST and XGBoost-SHAP

1
College of Resources and Environment, Shanxi University of Finance and Economics, Taiyuan 030006, China
2
Shanxi Institute of Surveying, Mapping and Geoinformation, Taiyuan 030001, China
3
School of Culture Tourism and Journalistic Arts, Humanistic Education Center, Shanxi University of Finance and Economics, Taiyuan 030006, China
4
School of Science and Technology, Hong Kong Metropolitan University, Hong Kong SAR 999077, China
*
Author to whom correspondence should be addressed.
Land 2026, 15(6), 1088; https://doi.org/10.3390/land15061088
Submission received: 20 May 2026 / Revised: 16 June 2026 / Accepted: 17 June 2026 / Published: 19 June 2026

Abstract

Accurate assessment of carbon storage dynamics and their driving factors is important for ecological sustainability and land management on the Loess Plateau under China’s dual carbon goals. In this study, the InVEST and PLUS models were integrated to evaluate carbon storage changes from 2000 to 2020 and simulate future carbon storage patterns for 2030 under four development scenarios, including natural development (ND), rapid development (RD), cropland protection (CP), and ecological protection (EP). In addition, the XGBoost-SHAP framework was employed to identify the dominant drivers and nonlinear response relationships controlling spatial variation in carbon storage. During 2000–2020, ecosystem carbon storage across the Loess Plateau generally increased, rising from 5.780 Pg to 5.893 Pg. Spatially, carbon storage displayed a pronounced pattern characterized by higher levels in the southeast and lower levels in the northwest, aligning with forest–grassland restoration belts. Scenario simulations showed that EP produced the largest carbon storage gain, with total carbon storage projected to reach 5.962 Pg in 2030. In contrast, RD reduced carbon storage to 5.858 Pg because of intensive construction land expansion. XGBoost-SHAP results identified net primary productivity (NPP) as the most influential factor controlling spatial variation in carbon storage, accounting for 57.3% of the total explanatory importance, whereas soil erosion (SE) exhibited a strong negative effect on carbon storage. Population density (POPD) also exerted a negative effect, whereas gross domestic product (GDP) showed positive contributions in economically developed counties. These findings enhance understanding of the spatial response characteristics of carbon storage under environmental gradients and human disturbance across the Loess Plateau. They further provide scientific support for differentiated ecological management and regionally adapted carbon mitigation planning.

1. Introduction

Global warming has intensified and become a major challenge to sustainable development. Accelerated industrialization, extensive fossil fuel consumption, and intensive land development have sharply increased atmospheric greenhouse gas concentrations, thereby amplifying global warming and related ecological risks [1,2]. In response, China’s dual-carbon strategy has made coordinated emission reduction and carbon sink enhancement central to carbon neutrality research and policy. Terrestrial ecosystems constitute an important component of the global carbon cycle. Through photosynthesis, they absorb and retain CO2, offsetting approximately 28% of annual global CO2 emissions while functioning as a major natural carbon sink [3,4]. In addition, these ecosystems contribute substantially to climate regulation and ecological resilience [4,5]. Consequently, for ecologically vulnerable regions such as the Loess Plateau, enhancing the assessment and management of ecosystem carbon storage is of great significance for promoting low-carbon transition and achieving carbon neutrality goals.
Land use transition processes exert substantial influence on carbon dynamics within terrestrial ecosystems [6]. Situated in the Yellow River Basin, the Loess Plateau serves as an important ecological barrier and has undergone pronounced transformations in land use configuration during recent decades. Rapid urbanisation has reduced regional carbon sequestration capacity and intensified local carbon imbalance [7,8]. By comparison, large-scale ecological rehabilitation programmes, especially the Grain for Green Program (GFGP), have reshaped vegetation distribution and promoted the enhancement of regional carbon sinks [9,10]. Nevertheless, ecosystem carbon responses to land use transition are highly dependent on temporal scales and policy intervention, making future changes difficult to estimate accurately. Under the coupled influence of climate variation and anthropogenic disturbance, coordinating economic growth with ecological conservation has become a major issue. Although previous research has highlighted the importance of land use optimisation for improving carbon sequestration potential, the mechanisms through which alternative development scenarios regulate land use configuration remain insufficiently clarified in the context of ecological governance on the Loess Plateau [11,12]. Resolving this issue requires a deeper understanding of the spatial and temporal responses of carbon storage to land transformation processes, together with the nonlinear mechanisms controlling such variation. Accordingly, integrating Shared Socioeconomic Pathways and Representative Concentration Pathways (SSPs–RCPs) [13] into analyses of future carbon storage trajectories and scenario-dependent responses on the Loess Plateau can provide valuable support for ecological restoration, spatial planning, Yellow River Basin conservation, and carbon neutrality implementation.
Reconstructing historical carbon storage trajectories and forecasting future carbon storage variation under different development scenarios are essential for understanding regional carbon cycle processes and informing ecological governance. Carbon storage is widely recognized as one of the most important regulating ecosystem services because of its critical role in climate regulation and ecological sustainability. Recent studies have emphasized the importance of spatially explicit and multidimensional ecosystem-service assessments to support environmental management and decision-making [14]. Therefore, assessing carbon storage dynamics under different development pathways not only contributes to carbon-cycle research but also provides important information for ecosystem-service management and sustainable land-use planning. In recent decades, carbon storage assessment has been conducted across multiple spatial scales, including global, regional, watershed, and urban systems, providing important insights into the influence of land use transition on ecosystem carbon dynamics [2,15]. Traditional approaches, including forest inventory analysis, field surveys, and empirical parameter estimation, have provided an important basis for regional carbon accounting. However, these methods are often constrained by limited spatial detail and weak consistency among scenario simulations, reducing their ability to capture fine-scale spatiotemporal heterogeneity related to land use and land cover change (LUCC) [16,17].
With the rapid advancement of ecosystem service assessment techniques, the InVEST model has become a commonly used tool for quantifying terrestrial ecosystem carbon storage at the regional scale. The model can estimate multiple carbon pools, including vegetation biomass and soil carbon, while requiring relatively accessible input data and showing strong adaptability across spatial scales [18,19]. To explore how future land use transitions may influence carbon storage dynamics, many recent studies have combined the InVEST model with the Patch-generating Land Use Simulation (PLUS) framework [20,21,22]. Within the PLUS framework, LEAS extracts land expansion rules using a random forest algorithm, whereas CARS simulates future land patches through a cellular automata process [11]. This structure enables PLUS to represent patch formation, spatial competition among land use classes, and the combined influence of environmental and socioeconomic drivers with greater flexibility than FLUS and CA-Markov models. Consequently, PLUS has been widely applied in land use simulation, ecosystem service assessment, and carbon storage prediction within ecologically fragile and erosion-prone regions, including the Loess Plateau and the Yellow River Basin [23,24,25].
When analysing the factors driving carbon storage variation, conventional linear and statistical approaches, including geographical detectors and multiple regression methods, often struggle to represent the complex nonlinear relationships among geographic variables. Recently, machine learning techniques have been increasingly adopted in regional ecological studies because of their advantages in addressing pronounced spatiotemporal heterogeneity and complicated geographic processes [26,27,28]. In particular, extreme gradient boosting (XGBoost) has been widely used to analyse complex ecosystem relationships because of its efficiency, flexibility, and ability to process high-dimensional, nonlinear, and multicollinear data [29,30,31]. However, the internal decision mechanisms of machine learning approaches are often difficult to clearly interpret. Although feature contribution information can be obtained, the model alone provides limited insight into data trends and potential relationships among predictors [32]. The SHapley Additive exPlanations (SHAP) framework provides a transparent feature-attribution approach. It enhances model interpretability and facilitates a more comprehensive understanding of the mechanisms controlling spatial variation in regional carbon storage [33,34].
Previous studies have provided an important basis for assessing ecosystem carbon storage and related spatiotemporal patterns across the Loess Plateau. However, several limitations remain in current research. First, previous studies have primarily concentrated on historical carbon storage characteristics, whereas future carbon storage evolution under multiple development scenarios, particularly coupled SSPs–RCPs scenarios, has received relatively limited attention within the context of ongoing Grain for Green implementation [35,36]. Second, most existing simulations have mainly focused on overall carbon storage variation, while the influences of fine-scale land use restructuring and spatial arrangement of forest, shrubland, and grassland ecosystems on carbon accumulation processes remain insufficiently explored. The mechanisms through which land use structural optimisation regulates carbon storage in fragmented terrain therefore remain unclear [37]. Third, traditional statistical models are poorly suited to the fragmented terrain and complex ecological patterns of the Loess Plateau, and they cannot adequately capture nonlinear relationships driven by multiple coupled factors [38,39]. Although machine learning and explainable frameworks can identify factor interactions and threshold effects [34,40], their regional application to carbon storage driver attribution within the Loess Plateau remains limited.
The Loess Plateau has experienced substantial land-use restructuring driven by long-term ecological restoration projects, urban expansion, agricultural restructuring, and climate change [41,42]. These changes have intensified the trade-offs among ecological protection, economic development, and regional carbon sink functions across the Loess Plateau [43]. Therefore, investigating land use dynamics and carbon storage variation under multiple development pathways during the carbon-peaking stage, as well as exploring the dominant factors responsible for regional carbon storage heterogeneity, can support land use optimisation and provide decision-making evidence for enhancing terrestrial carbon sink potential.
To address these gaps, this study developed a PLUS–InVEST–XGBoost–SHAP framework for three purposes. First, it reconstructed carbon storage changes on the Loess Plateau during 2000–2020. Second, it integrated coupled SSP-RCP scenarios to project 2030 carbon storage under natural development (ND), rapid development (RD), ecological protection (EP), and cropland protection (CP) scenarios. Third, it used XGBoost-SHAP to identify the dominant drivers and nonlinear responses underlying spatial carbon storage heterogeneity. The findings can inform land use optimization, carbon sink improvement, and dual-carbon implementation in the Loess Plateau.

2. Materials and Methods

2.1. Study Area

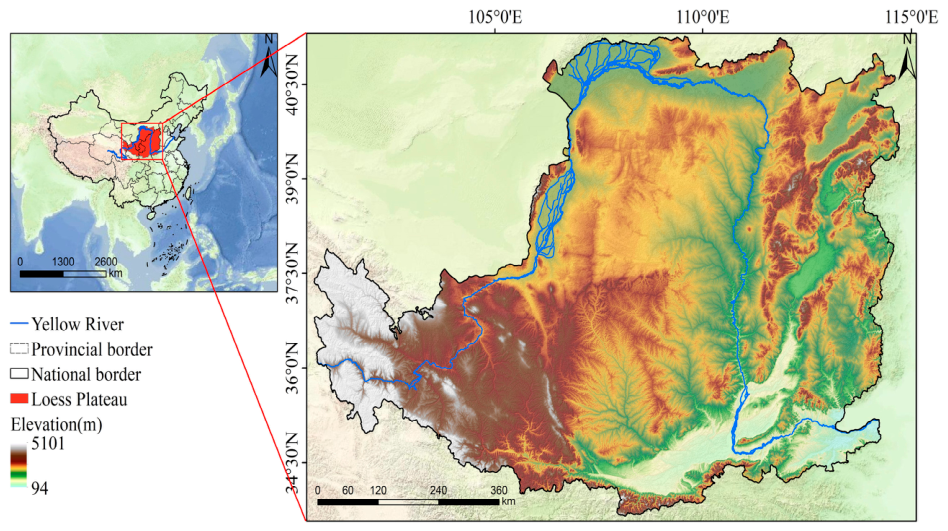
The Loess Plateau, a major ecological security region in China, lies between 33°41′–41°16′ N and 100°52′–114°33′ E (Figure 1). The Yellow River runs through its central part, and the region spans seven provincial-level units: Qinghai, Gansu, Ningxia, Inner Mongolia, Shaanxi, Shanxi, and Henan. Covering approximately 635,000 km2, the study area is dominated by a temperate continental monsoon climate with semi-arid conditions. It experiences strong seasonal temperature contrasts, with cold winters, hot summers, and uneven precipitation. The Loess Plateau exhibits a pronounced precipitation gradient, with mean annual precipitation ranging from approximately 150 to 750 mm across the region. Because of geological structure and long-term external erosion, the region has deeply incised gullies and strong topographic relief. It is among the world’s most erosion-prone and ecologically sensitive areas. Over a long historical period, population growth and intensive cultivation reduced native vegetation and converted large areas to agricultural land. In addition, intensive energy extraction based on abundant mineral resources has promoted economic growth but also disturbed land cover structure and increased the risk of ecological degradation. Since the late twentieth century, ecological restoration programs, represented by the GFGP, have become a major force reshaping land use and land-cover patterns on the Loess Plateau.

2.2. Data Sources and Processing

The land use dataset employed in this study was obtained from the China Land Cover Dataset. After preprocessing and reclassification, land use types in the study area were categorized into six classes: cropland, forest land, grassland, construction land, water bodies, and unused land. To support land use simulation and carbon storage analysis, multiple driving variables were selected (Table 1). In addition to historical environmental variables, future temperature and precipitation data for 2030 under SSP1-2.6, SSP2-4.5, SSP3-7.0, and SSP5-8.5 scenarios were obtained from the CMIP6 dataset. These climate projections were subsequently incorporated into the PLUS model as dynamic environmental drivers for future land-use simulations under different climate and socioeconomic pathways. The selected drivers represented three dimensions: natural conditions, socioeconomic pressure, and accessibility (Table 1). Natural variables included precipitation (Pre), temperature (Tmp), potential evapotranspiration (PET), elevation (Ele), slope (Slope), net primary productivity (NPP), soil erosion (SE), and soil texture, represented by sand (Sand), silt (Silt), and clay (Clay). Socioeconomic pressure was described by population density (POPD) and gross domestic product (GDP). Accessibility was quantified using Euclidean-distance rasters generated from vector data on roads, rivers, and mining sites, including distance to rivers (DR), distance to mining areas (DM), distance to highways (DHE), distance to national roads (DNR), distance to provincial roads (DSR), and distance to urban roads (DUR). All spatial datasets were reprojected to a unified Albers Conic Equal Area coordinate system and spatially aligned before analysis to ensure spatial consistency in model calculation. Raster datasets with an original spatial resolution of 30 m (e.g., DEM, slope, and soil erosion) were retained at their native resolution, and only reprojection and spatial alignment were performed. Continuous variables originally available at 1000 m resolution (e.g., precipitation, temperature, PET, NPP, population density, GDP, and soil texture) were resampled to 30 m using bilinear interpolation. Vector datasets (roads, rivers, and mines) were converted into 30 m continuous distance rasters using the Euclidean Distance tool.

2.3. Methods

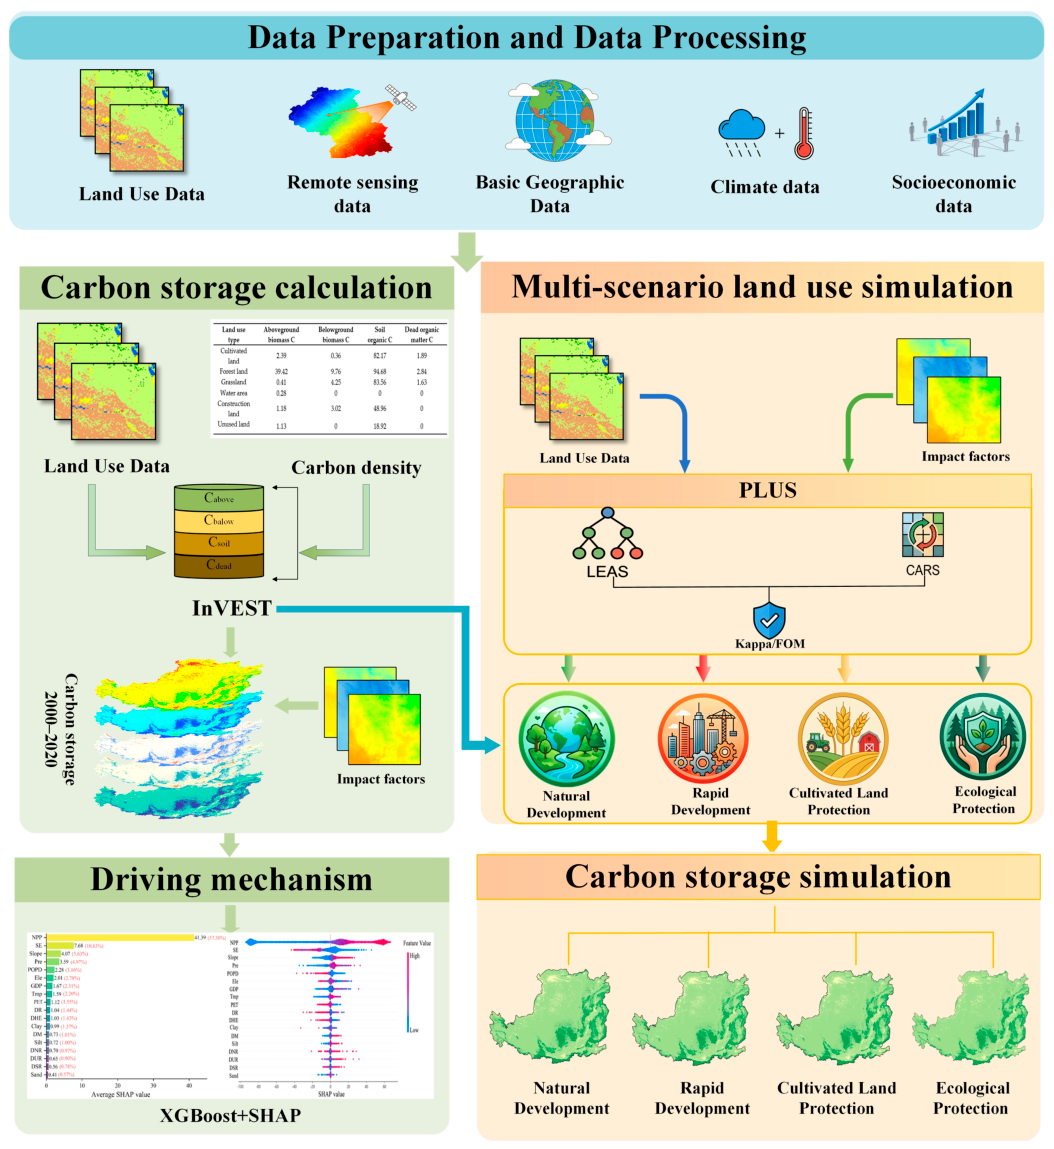
The technical framework of this study is shown in Figure 2. First, multi-source datasets, including land use, remote sensing, climatic, socioeconomic, and geographic data, were collected and processed. The InVEST carbon module was then used to estimate carbon storage from 2000 to 2020 based on land use data and carbon density parameters. Subsequently, the PLUS model was employed to simulate land use patterns in 2030 under four scenarios: ND, RD, CP, and EP. The simulated land use maps were further incorporated into the InVEST model to project future carbon storage under different scenarios. Finally, the XGBoost-SHAP framework was applied to analyse the dominant drivers and nonlinear response characteristics of spatial carbon storage variation. The main models and software used in this study included InVEST (version 3.16.0, Natural Capital Project, Stanford University, Stanford, CA, USA), PLUS (version 1.2.5, High-Performance Spatial Computational Intelligence Laboratory, China University of Geosciences, Wuhan, China), ArcGIS (version 10.8, Esri, Redlands, CA, USA), and Python (version 3.13, Python Software Foundation, Wilmington, DE, USA) with the XGBoost (version 3.2.0) and SHAP (version 0.51.0) packages for XGBoost-SHAP analysis.

2.3.1. Carbon Storage Estimation with InVEST

Regional carbon storage was estimated with the InVEST Carbon module. The calculation included four carbon pools: aboveground biomass, belowground biomass, soil organic carbon, and dead organic matter. For each grid cell, carbon storage was obtained by matching the land use type with its corresponding carbon density coefficients. The resulting raster layers were used to describe spatial variation in carbon storage across the study area. The calculation was expressed as follows:
C k = C k _ a b o v e + C k _ b e l o w + C k _ s o i l + C k _ d e a d
C T = k = 1 n A r e a k C k
In this formulation, the index k represents specific land use categories. The aggregate carbon coefficient for each class ( C k , measured in t·hm−2) is derived by integrating four distinct sequestration reservoirs: aerial and subterranean biomass, organic soil matter, and necrotic organic debris (symbolized as C k _ a b o v e , C k _ b e l o w , C k _ s o i l , and C k _ d e a d , respectively). Consequently, the cumulative terrestrial carbon inventory ( C T ) is determined by aggregating the products of these class-specific densities and their corresponding spatial extents ( A r e a k , in hm2) across all n land cover types included in the assessment.
To ensure the geographic relevance of carbon density coefficients, we synthesized baseline values from localized arid-region research [44,45] and from the national field survey dataset of vegetation and soil carbon density released by the National Ecosystem Science Data Center of China. This empirical foundation ensured that the initial data were anchored in regional observations. Subsequently, the Alam climate-driven framework [46] was employed to refine biomass and soil carbon pools based on local hydro-thermal conditions.
C B P = 6.798 × e 0.0054 × M A P
C B T = 28 × M A T + 398
C S P = 3.3968 × M A P + 3996.1
K B P = C B P 1 C B P 2 ; K B T = C B T 1 C B T 2
K B = K B P × K B T ; K S P = C S P 1 C S P 2
In this calibration, mean annual precipitation ( M A P , mm·yr−1) and mean annual temperature ( M A T , °C) were incorporated as key environmental drivers. Specifically, C B P and C S P designate the biomass and soil carbon densities as adjusted by precipitation, while C B T reflects the biomass density refined by M A T . The corresponding modifiers, K B P and K B T , act as the specific precipitation and temperature correction factors for aboveground biomass, respectively. Furthermore, K B serves as the integrated adjustment coefficient for aboveground biomass, while K S P scales the soil carbon component. Validation against existing Loess Plateau literature [23,47,48] confirmed the high consistency of these calibrated parameters, indicating that the values in Table 2 accurately reflect the regional carbon sequestration potential. It should be noted that the climate-driven equations proposed by Alam et al. [46] were not directly used to estimate carbon density values. Instead, they were employed to derive relative correction coefficients reflecting the influence of temperature and precipitation gradients. The baseline carbon density parameters were obtained from ecosystem datasets and published studies conducted in China, while the Alam framework was used only for spatial adjustment of these baseline values. It should be noted that aquatic sediment carbon was not included because the adopted terrestrial ecosystem carbon-density database does not provide sediment carbon-density parameters for open-water ecosystems. Therefore, the zero value for water areas in Table 2 refers to the soil/sediment carbon pool rather than the absence of carbon storage in water bodies.

2.3.2. Multi-Scenario Land Use Simulation Using the PLUS Model

Model Principle and Validation
PLUS was applied to project land use patterns in 2030, with LEAS identifying expansion rules and CARS allocating future patches.
The determination of neighborhood weight parameters was achieved through an iterative sensitivity testing procedure. We leveraged the land use transitions occurring during the 2000–2010 period to initialize the model, incorporating biophysical drivers—such as topography and climate—within the LEAS architecture. Within this framework, a Random Forest algorithm served to decipher the spatial rules governing land-type proliferation. With 2010 as the temporal anchor, the CARS then integrated Markov-derived growth demands to reconstruct the 2020 spatial arrangement. Finally, simulation accuracy was assessed by benchmarking the simulated 2020 land use map against observed land use records.
A grid-search approach was applied to calibrate neighbourhood weights. The initial parameter settings were determined according to the historical expansion intensity of individual land use categories. Multiple parameter combinations were generated within a ±20% disturbance range at 10% intervals. FOM was used as the calibration criterion during iterative model runs. The final weights for cropland, grassland, forest land, water bodies, construction land, and unused land were 0.43, 0.16, 0.05, 0.01, 0.36, and 0.05, respectively. The simulated 2020 map matched the observed map well, with an overall accuracy of 95.25%, a Kappa coefficient of 0.8964, and an FOM value of 0.2357. This FOM value is comparable to those reported in recent PLUS-based land-use simulation studies [49], indicating satisfactory performance in capturing the spatial pattern of land-use change. To further evaluate potential class-imbalance effects, class-specific Producer’s Accuracy (PA), User’s Accuracy (UA), and F1-scores were calculated (Table S1). All land-use categories achieved PA and UA values above 89%, while F1-scores ranged from 90.44% to 96.19%. Notably, minority classes such as water area and built-up land also maintained high accuracies, indicating that the high overall accuracy was not solely driven by the dominant grassland class. The confusion matrix and graphical summary of class-specific accuracy are provided in the Supplementary Materials (Figures S1 and S2), and the exact PA, UA, and F1-score values are listed in Table S1.
Land Use Scenario Design Under the SSPs-RCPs Framework
Future landscape simulations for 2030 were developed by integrating the SSP-RCP matrices introduced in the IPCC Sixth Assessment Report (AR6). To parameterize alternative development pathways, transition probabilities and conversion rules were adjusted according to national ecological protection, cropland conservation, and regional development policies. The adjustment magnitudes applied in the CP, RD, and EP scenarios were not intended to represent exact future transition probabilities, but rather to quantify different policy intensities relative to the baseline scenario. Similar parameterization approaches have been widely adopted in previous PLUS-based scenario simulation studies, where land-use transition probabilities or conversion rules were modified to represent alternative policy and development pathways [50,51]. By synthesizing existing land use trajectories and regional insights from the Loess Plateau [23,47,52,53,54], we constructed four divergent development scenarios as follows.
The scenario of ND was used as a reference scenario. It assumed that future land use dynamics would continue following the historical evolution pattern observed during 2000–2020. The historical Markov transition probability matrix and neighbourhood weights were retained. Water bodies and existing construction land were fixed as non-convertible classes, while cropland, forest land, grassland, and unused land changed according to historical transition rules. This baseline setting represented land use evolution without new policy intervention. RD reflected accelerated urbanization and industrial development. Compared with ND, conversion likelihoods from cropland, forest land, grassland, and unused land to construction land were increased by 40%, 30%, 30%, and 50%, respectively. The reverse conversion from construction land was restricted to represent strong urban and industrial land demand. This scenario reflects the land demand associated with accelerated urbanisation and industrial park development on the Loess Plateau. CP represented a strict cropland-conservation scenario driven by food-security requirements. Cropland continuously present during 2000–2020 was defined as the core protection zone because cropland resources are limited and erosion risk is high on the Loess Plateau. High-quality cropland, including valley terraces and flat valley land, was prioritized. The unused land-to-cropland transition likelihood was increased by 40% to represent terrace construction and slope improvement, whereas cropland-to-grassland, cropland-to-construction land, and cropland-to-forest land likelihoods were reduced by 40%, 30%, and 15%, respectively, to limit non-grain and non-agricultural conversion. EP represented an ecological-priority scenario for strengthening carbon sinks and the Yellow River ecological barrier. Forest land, grassland, and water bodies were fixed as non-convertible ecological spaces. The cropland-to-construction land transition likelihood was reduced by 30% to constrain expansion, while the likelihoods of sloping cropland and unused land converting to grassland were increased by 30%. Forest land-to-cropland and grassland-to-cropland likelihoods were reduced by 30% and 40%, respectively, to prevent reverse conversion from ecological land. The parameter settings were determined by synthesizing the objectives of the National Master Plan for Major Ecosystem Protection and Restoration Projects (2021–2035) [55], the ecological protection and high-quality development strategy of the Yellow River Basin, the permanent basic farmland protection policy, and previous PLUS-based scenario simulation studies.
To enhance the consistency of future scenario simulations, the four land-use scenarios were associated with corresponding SSP-RCP pathways by incorporating CMIP6-derived climate projections into the PLUS-based land-use simulation. Specifically, future mean annual temperature and annual precipitation under SSP1-2.6, SSP2-4.5, SSP3-7.0, and SSP5-8.5 were used as scenario-specific climatic driving variables in the LEAS module. Each land-use scenario was therefore simulated using the climatic background corresponding to its associated SSP-RCP pathway. Together with topographic, soil, accessibility, and socioeconomic variables, these climate variables were used by the random forest algorithm to generate development probability surfaces for each land-use type. In this way, the simulated 2030 land-use patterns reflect not only land-use policy assumptions but also the spatial influence of SSP-RCP-specific temperature and precipitation conditions. The resulting scenario-specific land-use maps were then input into the InVEST Carbon module to estimate carbon storage. It should be noted that the CMIP6 climate projections affected carbon storage indirectly through land-use allocation, whereas the carbon-density coefficients used by the InVEST model were not dynamically adjusted by future climate projections. The four land-use scenarios were further associated with SSP-RCP pathways according to their socioeconomic narratives, climate-policy assumptions, and land-use implications. ND was associated with SSP2-4.5, which represents a middle-of-the-road pathway with moderate socioeconomic development and continuation of historical policy trends [56]. This pathway is consistent with the ND assumption that land use follows the historical trajectory from 2000 to 2020 without additional strong policy intervention. EP was associated with SSP1-2.6, which represents a sustainable and low-emission pathway emphasizing green development, ecological protection, and climate mitigation [57]. This narrative is consistent with the EP scenario, in which ecological land is strictly protected and the conversion of unused land and sloping cropland toward forest and grassland is encouraged. CP was associated with SSP3-7.0, which represents a regional-rivalry pathway characterized by stronger concerns over resource security, food self-sufficiency, and fragmented regional development [58]. This narrative corresponds to the CP scenario because strict cropland protection and food-security-oriented land management may increase cropland retention or expansion, while potentially competing with ecological restoration space. RD was associated with SSP5-8.5, which represents a fossil-fuel-dependent development pathway characterized by rapid economic growth, intensive energy use, and high emissions [56,59]. This narrative is consistent with the RD scenario, in which accelerated urbanization and industrial expansion increase construction-land demand and weaken ecological constraints. Therefore, the correspondence between the land-use scenarios and SSP-RCP pathways was established based on the consistency between each pathway’s socioeconomic-climate narrative and the land-use policy assumptions used in the PLUS.
To provide a clearer climatic context for the four scenarios, regionalized climate projections for the Loess Plateau in 2030 derived from the CMIP6 BCC-CSM2-MR model are summarized in Table 3. The projected mean annual temperature and annual precipitation under each SSP-RCP pathway provide additional physical evidence for the association between future land-use development pathways and their corresponding climate scenarios. These climate projections were used as scenario-specific climatic driving variables in the PLUS model, whereas the carbon-density coefficients in the InVEST Carbon module were not dynamically adjusted by future climate projections.

2.3.3. Driving Mechanism Analysis Based on the XGBoost-SHAP Model

The XGBoost regression model was used to identify major explanatory variables associated with spatial carbon storage distribution. Based on a gradient-boosted decision tree framework, XGBoost iteratively optimises the objective function and reduces prediction residuals, allowing it to capture complex nonlinear relationships among high-dimensional variables [60]. A grid-search methodology was implemented to fine-tune essential model configurations—specifically the iterative count, tree depth, shrinkage factor, and subsampling intensity. This optimization aimed to bolster the model’s predictive generalization by carefully equilibrating the trade-off between bias and variance. To rigorously evaluate the regression performance and generalization stability of the optimized XGBoost model, standard regression metrics including the coefficient of determination (R2), root mean square error (RMSE), and mean absolute error (MAE) were calculated. SHAP was then introduced to interpret the model. As a game-theory-based additive explanation method, SHAP calculates feature-specific Shapley values and decomposes nonlinear model predictions into the additive contribution effect associated with individual variables [33]. By examining the distribution characteristics and directional responses represented by SHAP outputs, this approach overcomes the limitation of traditional variable importance measures that cannot indicate effect direction. It also quantifies the relative contribution intensity of different drivers and reveals their nonlinear response characteristics.
Comparisons across multiple periods showed that the ranking and effects of the drivers were broadly consistent from 2000 to 2020. Therefore, this study focused on 2020, the most recent year in the dataset, to analyse the mechanisms underlying spatial variation in carbon storage.

3. Results

3.1. Land Use Dynamics and Scenario Simulation

3.1.1. Land Use Change from 2000 to 2020

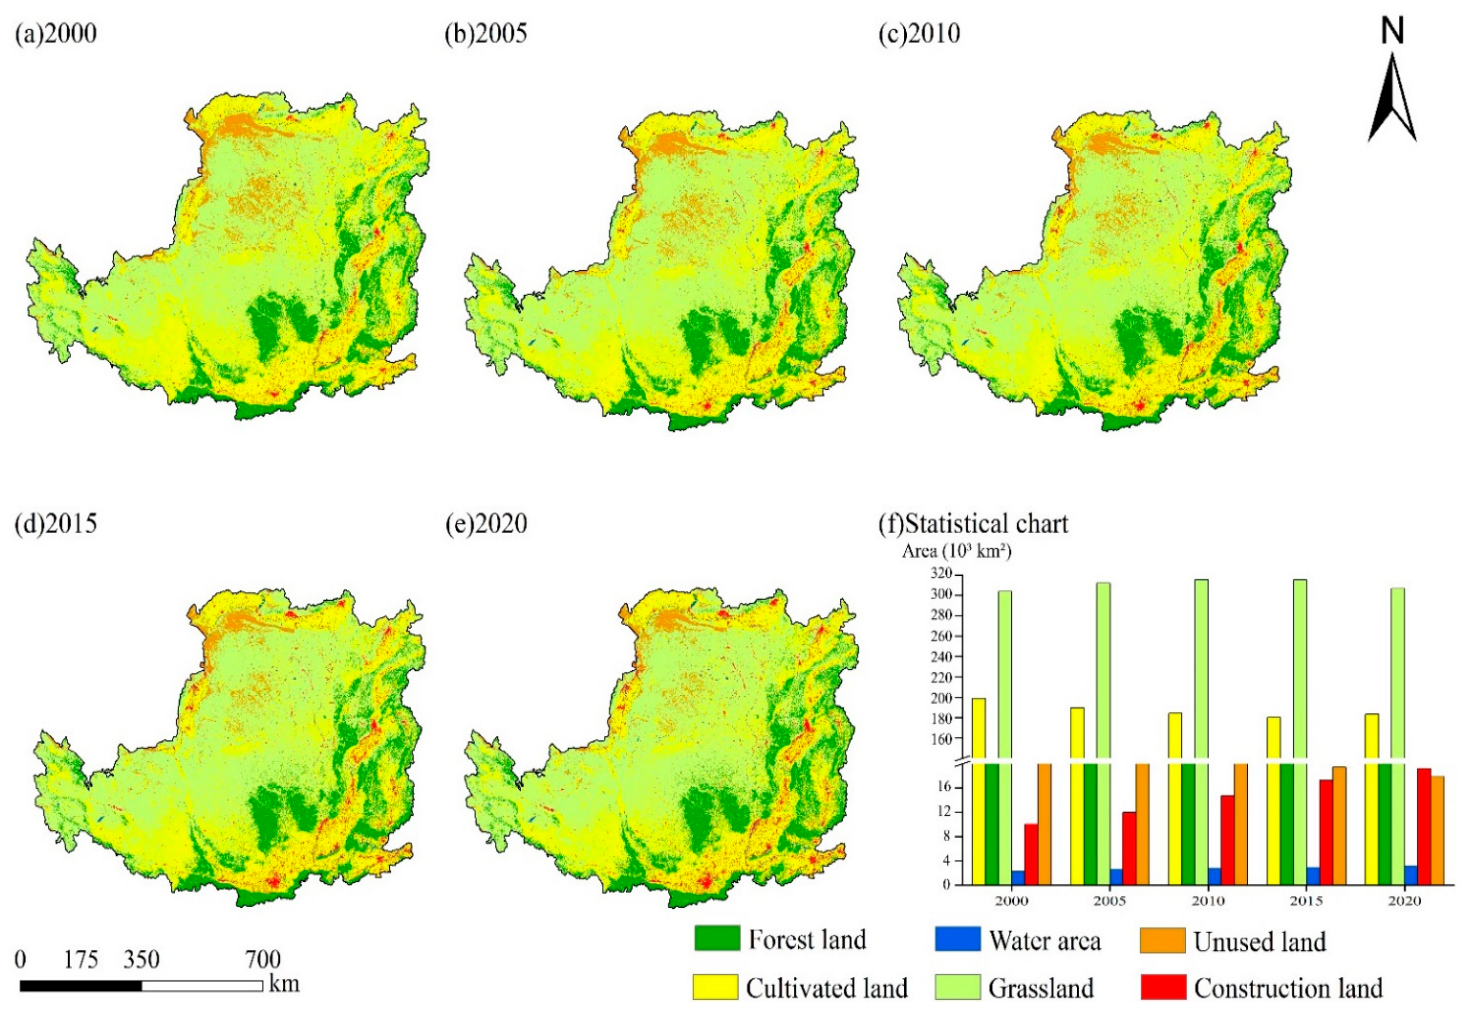
Land use on the Loess Plateau changed substantially between 2000 and 2020, both spatially and temporally (Figure 3). Grassland, cropland, and forest land were the dominant land use classes, together covering more than 90% of the region. Cropland contracted from 31.77% in 2000 to 28.78% in 2015, before rebounding to 29.28% in 2020; overall, it decreased by 15,592.9 km2 during the study period. Forest land expanded steadily, increasing from 13.18% to 15.29%, with a net gain of 13,228.41 km2. Throughout the study period, grassland maintained its status as the primary landscape matrix, consistently covering nearly half of the total area. Its spatial extent exhibited a fluctuating trajectory, climbing from 48.54% in 2000 to a decadal peak of 50.38% (2010), before receding to 49.01% by 2020. Simultaneously, the proportion of water bodies increased slightly from 0.36% to 0.49%, corresponding to an area expansion of 832.99 km2 (a 36.98% increase). Construction land showed the most rapid expansion, increasing from 1.61% to 3.07% and gaining 9169.99 km2, equivalent to a 91.17% increase. Unused land followed the opposite trend, decreasing from 4.55% to 2.85% with a total reduction of 10,588.85 km2.
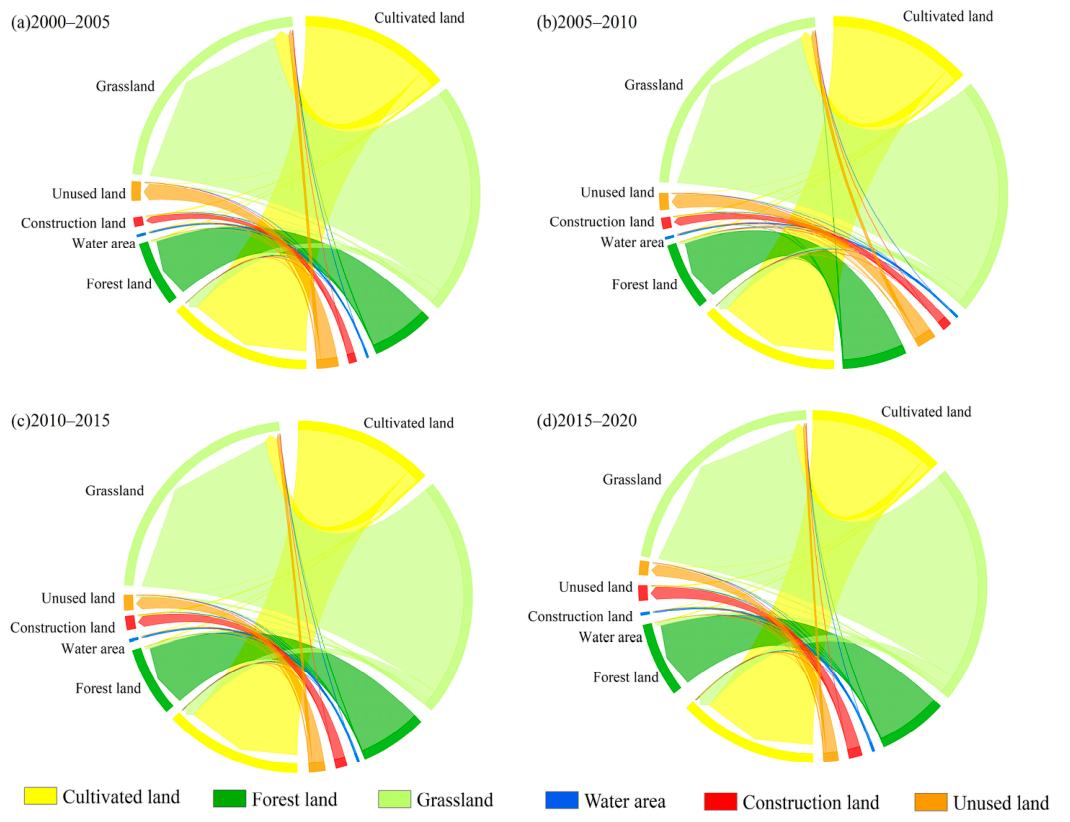
Land use transfer patterns varied clearly among the four time intervals from 2000 to 2020 (Figure 4). During 2000–2005, land use conversion was intensive and was dominated by large-scale bidirectional conversion between cropland and grassland. Cropland-to-grassland conversion was the main flow, reaching 2.15 × 10⁴ km2, while 1.42 × 10⁴ km2 of grassland was converted to cropland. In the same period, 1540.40 km2 was converted to construction land, and unused land-to-grassland conversion reached 5699.85 km2.
During 2005–2010, cropland–grassland exchange remained dominant, accompanied by marked transitions from unused land into grassland and from grassland into forest land. Total cropland outflow reached 1.94 × 10⁴ km2, with the largest flow to grassland (15,884.13 km2). Grassland was mainly converted to cropland (13,433.62 km2) and forest land (3030.19 km2). Unused land-to-grassland conversion reached 5925.44 km2. Among the sources of new construction land, cropland contributed the largest area, at 1998.98 km2, accounting for 71.99%. During 2010–2015, land use transfer slowed but continued to show an ecological conversion trend. Cropland-to-grassland conversion reached 1.73 × 10⁴ km2, while forest land-to-cropland conversion was only 755.72 km2. Unused land-to-grassland conversion reached 4671.09 km2. During 2015–2020, land conversion showed stronger bidirectional adjustment. Cropland-to-grassland conversion decreased to 1.32 × 10⁴ km2, whereas grassland-to-cropland conversion increased to 1.77 × 10⁴ km2, becoming the largest cross-class conversion pathway in this period. Construction land expansion remained largely irreversible across all stages. From 2015 to 2020, new construction land mainly came from cropland (1340.76 km2) and grassland (585.70 km2). During the same period, unused land-to-grassland conversion decreased to 3910.97 km2.

3.1.2. Multi-Scenario Land Use Prediction for 2030

PLUSs showed that land use patterns across the study area differed markedly among the four development scenarios in 2030 (Table 4). Under ND, land cover change followed the historical trajectory. Compared with 2020, construction land increased by 39.69%, with a net gain of 7632.69 km2. Forest land also continued to expand, increasing from 15.30% in 2020 to 15.77% in 2030, with a net gain of 2996.38 km2 (3.13%). By contrast, grassland, cropland, and unused land decreased by 2.08% (6369.59 km2), 1.52% (2781.76 km2), and 8.62% (1540.83 km2), respectively.
Under RD, construction land showed the largest expansion among all scenarios, increasing by 79.53% with a net gain of 15,293.22 km2. Forest land increased slightly from 15.30% to 15.58%, with a net gain of 1797.11 km2 (1.88%). Grassland and cropland decreased by 3.65% (11,206.73 km2) and 2.43% (4451.11 km2), respectively. Under CP, cropland increased by 10.71% relative to 2020, with a net gain of 19,645.15 km2, reaching 20.30 × 10⁴ km2. Forest land also increased by 3.00%, with a net gain of 2874.33 km2. Construction land expansion was limited, increasing from 3.07% to 3.55%, with a growth rate of 15.49% (2978.12 km2), which was lower than that under ND. However, grassland decreased by 7.26%, with a net loss of 22,291.05 km2. Under EP, water, forest land, grassland, and cropland all increased. Their areas increased by 6.84% (211.10 km2), 3.25% (3112.92 km2), 0.41% (1252.70 km2), and 1.25% (2285.87 km2), respectively. Unused land decreased most sharply, by 48.48% (8666.56 km2). Construction land expansion was also the lowest among the scenarios, increasing by only 9.38% (1803.98 km2).
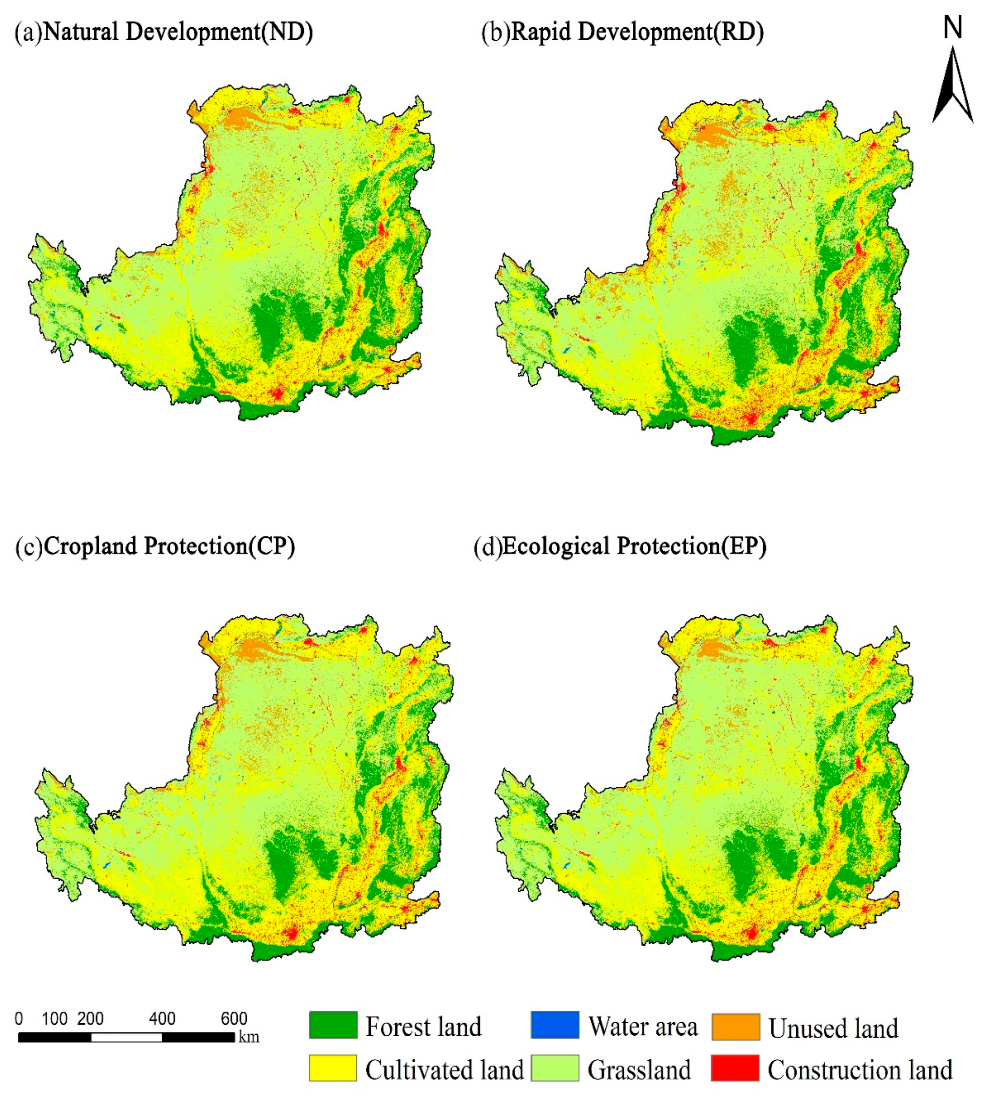
In 2030, land use patterns across the Loess Plateau exhibited pronounced differences among development scenarios, and the distribution characteristics of major land use categories generally corresponded to the regional topographic background (Figure 5). Under ND, the existing land use structure was largely maintained, with forest and grassland concentrated in the southeast, cropland intermixed with grassland across the middle part of the study area, while unused land remained primarily distributed in the northwest. Forest land was mainly distributed along the northern Qinling, Ziwuling, Lüliang, and Taihang mountain ranges. Cropland and grassland dominated the central loess tablelands and hilly–gully areas. Construction land was scattered mainly across the Guanzhong Plain, Fenhe Valley, and Yinchuan Plain, while water bodies were mainly concentrated within the Yellow River mainstream and major tributary networks. Under RD, construction land expanded most clearly, especially around large metropolitan areas, including Xi’an, Taiyuan, and Lanzhou, where red patches became denser and showed local outward expansion. Cropland and grassland contracted in parts of the central hilly Loess Plateau and around the Hetao Plain, whereas southeastern mountain forest land and northwestern unused land remained relatively stable. Under CP, cropland became more continuous in the central tablelands and northern dry farming areas. Agricultural land expanded toward adjacent grassland and forest margins. Construction land expansion was limited and remained mainly around existing urban areas, showing slower growth than under ND. Unused land along the margin of the Mu Us Sandy Land decreased slightly, while the spatial pattern of water changed little. Under EP, forest and grassland expansion was more pronounced relative to the remaining development scenarios. Southeastern forest land and central grassland showed local northward and westward extension, and green patches in the central hilly–gully region became more connected. Unused land in the northwestern Mu Us desert margin and adjacent aeolian sandy zones decreased and was partly converted to grassland. Construction land expansion was strongly restricted and remained largely within the existing urban framework. Cropland in tableland areas remained generally stable, and the water pattern changed only slightly.

3.2. Spatial–Temporal Dynamics of Regional Carbon Storage

3.2.1. Temporal Changes in Carbon Storage

Regional ecosystem carbon storage showed a steady upward trend, increasing from 5.780 Pg in 2000 to 5.893 Pg in 2020, representing a total gain of 0.113 Pg. By land use type, grassland remained the largest carbon pool. Its carbon storage peaked at 2.835 Pg in 2010 and then declined slightly. Forest land showed the largest continuous increase, growing from 1.211 Pg in 2000 to 1.405 Pg in 2020. Cropland carbon storage decreased from 1.727 Pg to 1.592 Pg. Carbon storage in construction land increased by 0.049 Pg, whereas that in unused land decreased to 0.036 Pg. Scenario simulations for 2020–2030 showed that regional carbon storage in 2030 ranked as EP > CP > ND > RD. EP had the highest projected carbon storage, reaching 5.962 Pg, an increase of 0.069 Pg compared with 2020. CP reached 5.914 Pg, while ND remained nearly unchanged at 5.893 Pg. RD was the only scenario associated with a decline in ecosystem carbon storage, decreasing to 5.858 Pg, which was 0.035 Pg lower than the 2020 level (Table 5).

3.2.2. Spatial Distribution in Carbon Storage

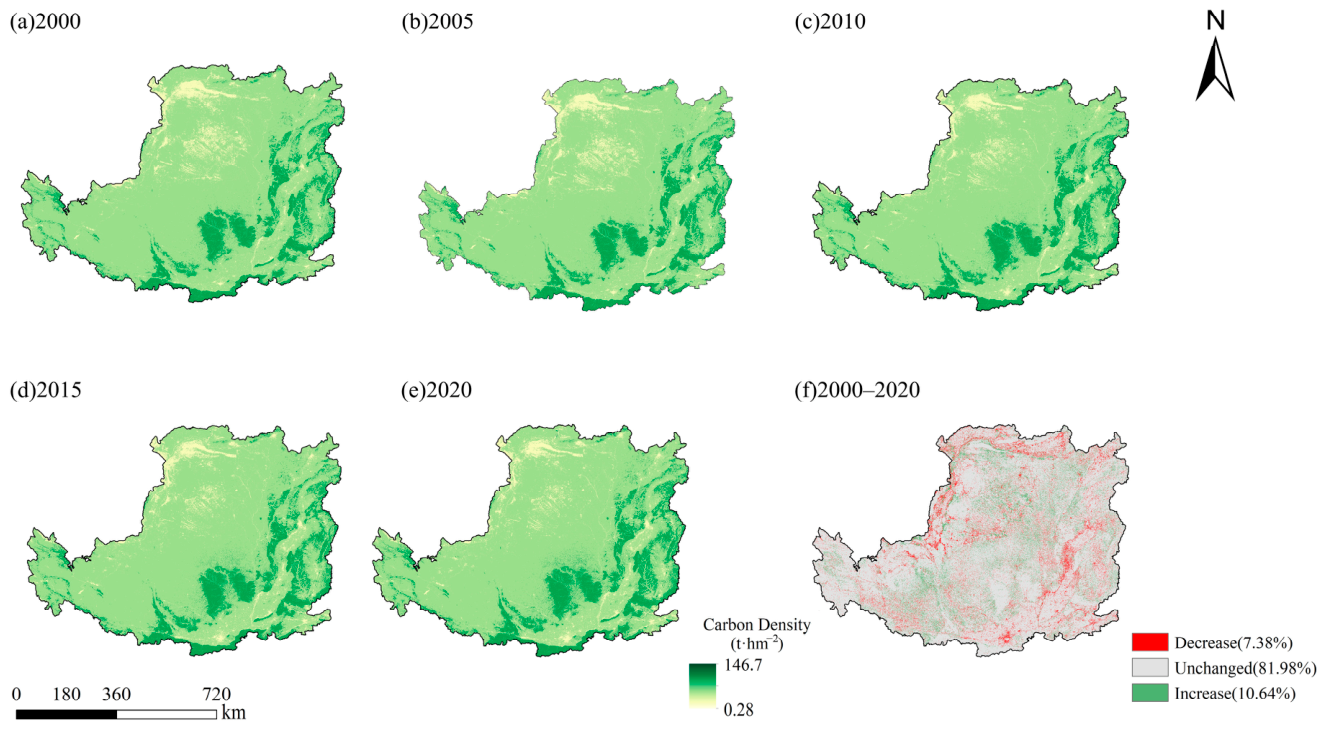
Carbon storage displayed distinct spatial heterogeneity across the Loess Plateau during 2000–2020 (Figure 6a–e), with higher values in the southeast and lower values in the northwest. High carbon-density areas, with values up to approximately 146.7 t·hm−2, were mainly distributed in forested or high-vegetation areas along the northern Qinling Mountains, Lüliang Mountains, and Ziwuling. Their spatial distribution was broadly consistent with the main mountain belts. Medium carbon-density areas covered much of the central hilly–gully region, whereas low carbon-density areas, with values close to 0.28 t·hm−2, were primarily distributed across the northwestern aeolian sandy areas, the margin of the Mu Us Sandy Land, and urban construction patches around Xi’an, Taiyuan, and Lanzhou.
The carbon storage change map for 2000–2020 (Figure 6f) showed that most of the study area remained unchanged, while local increases and decreases occurred in different regions. Increased carbon storage was mainly observed in parts of the central Loess Plateau, including restoration-related areas around Yan’an, Yulin, and Qingyang. These increases appeared as local patches or belts rather than large continuous areas. Decreased carbon storage was scattered in several regions, including urban expansion areas such as the Guanzhong Plain and Fenhe Valley, as well as certain parts of the Hetao Plain and Ningxia Plain. Combined with land use transfer results, these decreases may be related to construction land expansion and local conversion between cropland and grassland. Except for the aforementioned areas with pronounced changes, approximately 81.98% of the entire region exhibited relatively stable carbon storage throughout 2000–2020.
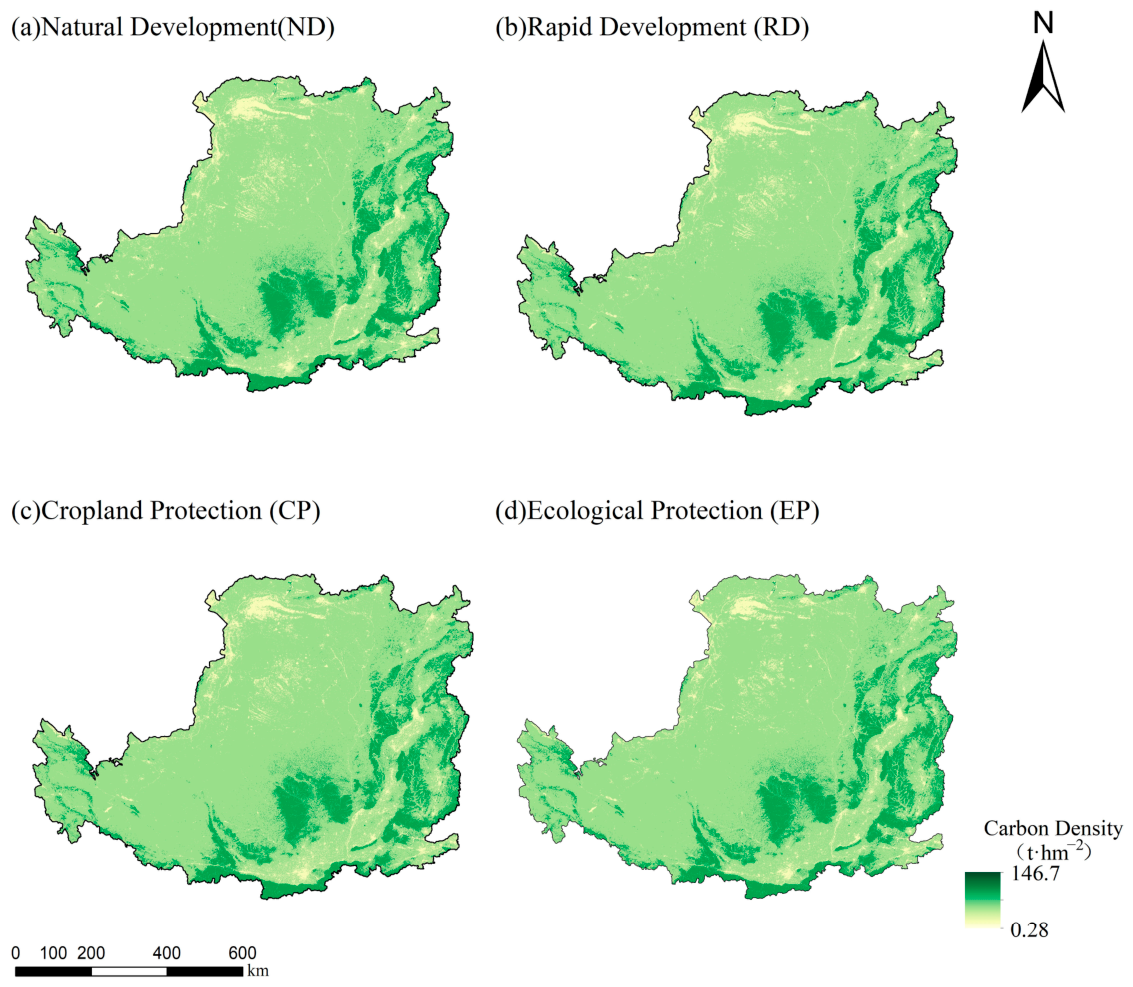
Under the 2030 multi-scenario simulations, carbon storage across the Loess Plateau continued to exhibit a spatial pattern characterized by higher values in the southeast and lower values in the northwest (Figure 7). Under ND, carbon storage followed the historical spatial pattern. Areas with relatively high carbon storage were primarily distributed along the northern Qinling Mountains, Lüliang Mountains, and Ziwuling, while patchy low-value areas appeared in the central region and urban belts around the Guanzhong Basin. In the ND scenario, low-carbon areas occurred as scattered patches in the central part and near the Guanzhong urban belt. In RD, low-value patches expanded around the Guanzhong Plain, Fenhe Valley, and Yinchuan Plain, reflecting the growth of construction land. However, these low-carbon patches were mainly fragmented rather than forming continuous spatial clusters. Under CP, medium-level carbon storage zones expanded across the central tableland region and northern cultivated areas, while some high-carbon patches located along the margins of forest and grassland ecosystems exhibited increased fragmentation. Under EP, high- and medium–high-value areas associated with forest land and grassland showed local expansion toward the northwest. Green patches in the central hilly–gully region became more connected than under the other scenarios. In this scenario, low-value patches related to construction land expansion were relatively limited. Overall, scenario differences in 2030 were mainly reflected in the extent and connectivity of areas with contrasting carbon storage levels in hilly Loess areas and basin regions.

3.2.3. Effects of Land Use Transitions on Carbon Storage

Carbon storage varied according to land use transition scenarios. Forest carbon storage increased mainly because grassland was converted to forest land, with transition areas of 3893.49 km2 in 2010–2015 and 4949.99 km2 in 2015–2020 (Figure 3 and Figure 4). Cropland carbon storage recovered from 1.564 Pg in 2015 to 1.592 Pg in 2020, largely driven by grassland-to-cropland conversion during 2015–2020 (1.77 × 10⁴ km2). After 2010, grassland carbon storage declined as grassland shifted to forest land and cropland. Meanwhile, construction land expansion occupied cropland and grassland, leading to carbon losses in converted areas.
Under the 2030 scenarios, carbon storage changes differed clearly among scenarios. Under ND, land use conversion followed the historical trajectory, and total carbon storage remained nearly stable with slight growth. Under EP, extensive transformation of unused land into forest and grassland covered ecosystems, with the area of unused land decreasing by 8666.56 km2, produced the largest carbon increase among all scenarios. Under CP, cropland carbon storage increased to 1.762 Pg, while grassland carbon storage decreased to 2.557 Pg. Under RD, construction land expansion was accompanied by decreases in cropland, grassland, and forest land, causing total carbon storage to fall below the 2020 baseline.

3.3. Carbon Storage Driving Mechanism Analysis Based on XGBoost-SHAP

3.3.1. Feature Importance Ranking and Global Driver Identification

To identify the dominant factors influencing carbon storage distribution on the Loess Plateau, a total of 18 driving factors were incorporated according to the region’s fragmented terrain, semi-arid climate, and intensive human activities. Pre, Tmp, and PET were used to characterize hydrothermal conditions, while Ele and Slope represented topographic effects. Sand, Silt, Clay, and SE were used to describe soil texture and erosion processes. NPP represented biomass input. POPD and GDP were used to characterize socioeconomic pressure, whereas DR, DM, DHE, DNR, DSR, and DUR quantified accessibility conditions and human disturbance.
Hyperparameter optimisation was conducted prior to model evaluation. The optimal XGBoost regression model employed 50 boosting iterations, a maximum tree depth of 5, and a learning rate of 0.1. Because the dependent variable was grid-level carbon storage density rather than a categorical class label, model performance was evaluated using regression-appropriate metrics, including R2, RMSE, and MAE. In the training dataset, R2, RMSE, and MAE reached 0.93, 0.21, and 0.11, respectively. The corresponding values for the testing dataset were 0.89, 0.26, and 0.17. These results indicate that the XGBoost regression model achieved good predictive performance in estimating the spatial variation in carbon storage density, while the relatively small discrepancy between training and testing performance suggests no obvious overfitting. To further examine the potential influence of spatial autocorrelation on model evaluation and interpretation, Global Moran’s I tests were conducted for both observed carbon storage and model residuals. Observed carbon storage showed significant positive spatial autocorrelation (Moran’s I = 0.5309, p = 0.0010; Figure S3), confirming the spatial clustering of carbon storage across the Loess Plateau. In contrast, Moran’s I value of the XGBoost residuals decreased to −0.0111 (p = 0.0180; Figure S4), indicating that residual spatial dependence was substantially weakened after incorporating environmental and socioeconomic explanatory variables.
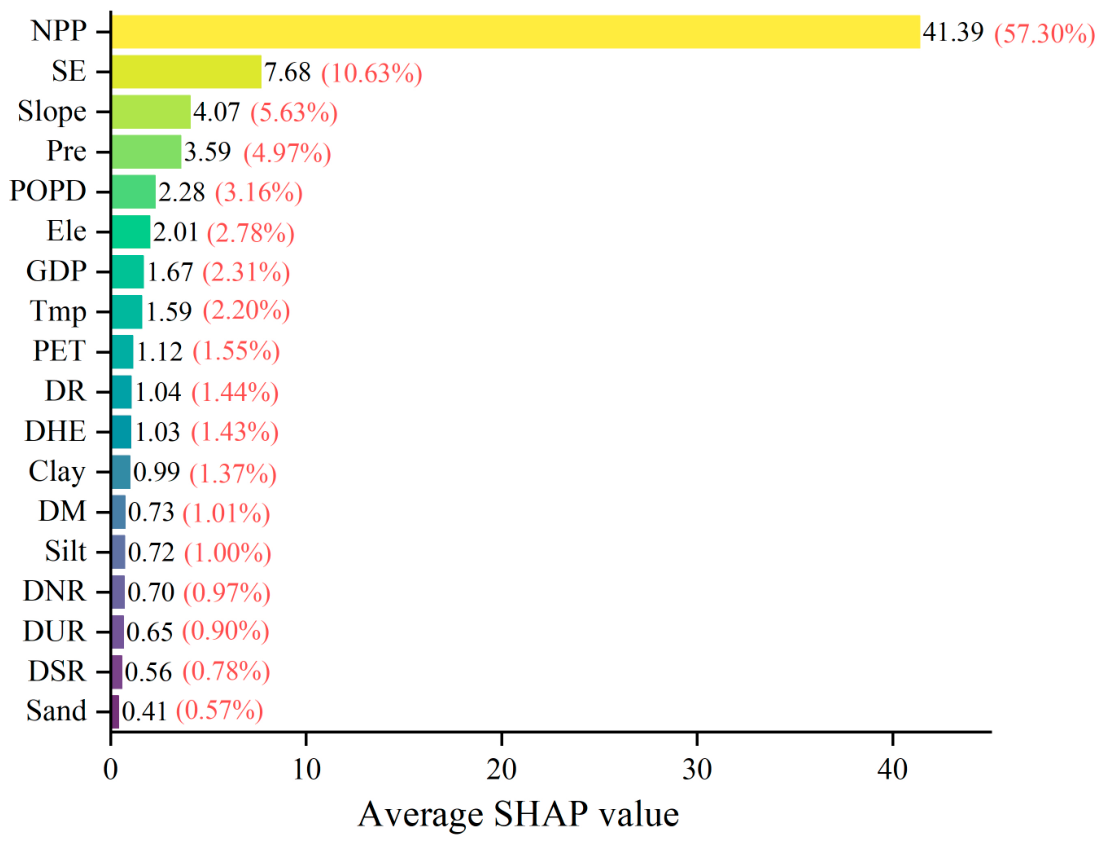
SHAP global feature importance results indicated that natural environmental variables played a dominant role in controlling regional carbon storage patterns (Figure 8). Among all explanatory variables, NPP exhibited the strongest influence, showing a mean SHAP magnitude of 41.39, while its single-factor contribution reached 57.3%, substantially higher than those of the remaining factors. SE and slope ranked second and third, with mean SHAP values of 7.68 and 4.07, accounting for 10.6% and 5.6%, respectively. Among the climatic and socioeconomic factors, Pre and POPD showed relatively strong explanatory power, with mean SHAP values of 3.59 and 2.28 and contributions of 5.0% and 3.2%, respectively. Ele, GDP, Tmp, and PET followed, with contributions ranging from 1.6% to 2.8%. Other variables, including DR, soil texture factors (Clay, Silt, and Sand), and multilevel road accessibility variables (DHE, DNR, DSR, and DUR), had mean SHAP values below 1.1 and made limited global contributions to regional carbon storage variation.

3.3.2. Contribution and Response Characteristics of Driving Factors

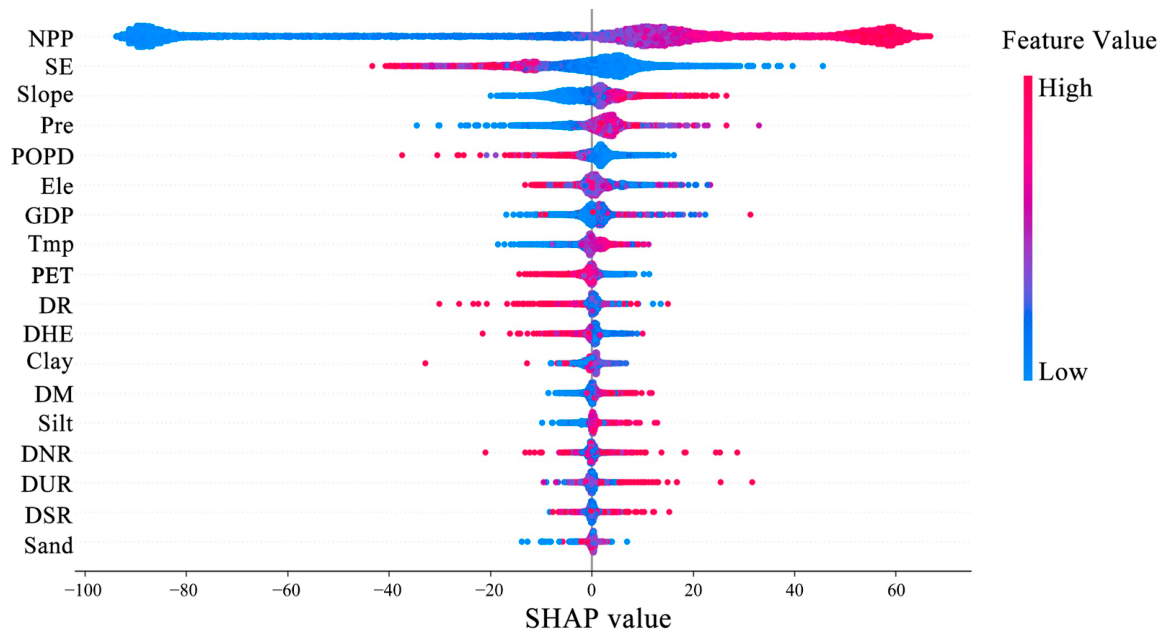
According to the SHAP beeswarm plot (Figure 9), the response direction and contribution behaviour of individual driving variables were further examined across different regions of the Loess Plateau. Distinct response characteristics and influence mechanisms were observed among different categories of explanatory factors.
First, biomass input and physical disturbance factors showed clear directional responses. NPP had the strongest positive effect. Its points covered the widest SHAP value range, with samples associated with higher NPP values mainly distributed within the positive SHAP interval, whereas low-value samples were primarily clustered in the negative interval. This indicates that higher vegetation productivity contributed strongly to increased carbon storage. In contrast, SE showed a clear negative effect. Most high-value SE samples were located in the negative SHAP range, indicating that stronger erosion intensity was associated with lower carbon storage. Second, topographic and climatic factors mainly reflected positive regulation and habitat limitation. Slope and Pre showed broadly consistent positive response patterns. Their high carbon areas were predominantly located on the positive side of the SHAP axis, indicating that higher values increased the positive contribution to carbon storage. Tmp also showed a positive effect. In contrast, Ele values were distributed on both sides of zero, but samples with relatively high elevation values were more frequently aggregated within the negative SHAP interval, suggesting that high-elevation areas generally made negative contributions. High PET values were also mainly associated with negative SHAP values, indicating an inhibitory effect.
In addition, socioeconomic and accessibility factors showed complex nonlinear distributions and distance-decay patterns. Among the socioeconomic factors, POPD was negatively associated with carbon storage, with samples characterized by high population density values mainly distributed within the negative SHAP interval. GDP showed a more complex distribution. Although its points covered a relatively wide range, high-value samples were more clearly clustered on the positive side of zero, suggesting that higher economic development may correspond to higher carbon storage contributions above certain levels. Among the accessibility factors, DM showed a clear positive effect. Greater distance from mining areas, represented by higher feature values, corresponded to higher positive SHAP values. By contrast, high-value samples of DR and DHE were mainly concentrated in the negative SHAP range, indicating negative distance-decay effects. DUR also showed a nonlinear response, with high-value samples tending to occur in the positive range. For DNR and DSR, high- and low-value samples were intermingled around zero and did not show a single directional relationship, suggesting more complex and limited explanatory effects. Finally, soil texture factors had relatively low independent explanatory power for the overall carbon storage pattern. High Clay values generally tended to occur in the negative SHAP range. In contrast, Silt and Sand showed highly compact point distributions, with most points clustered near zero. This indicates that their independent effects on regional spatial variation in carbon storage were very limited.

4. Discussion

4.1. Methodological Framework and Model Advantages

LUCC-driven changes in carbon storage are central to understanding ecosystem responses under global environmental change [61]. Here, PLUS, InVEST, and XGBoost-SHAP were combined into a modelling and attribution workflow that links land use simulation, carbon storage estimation, and driver interpretation. This workflow allowed us to examine carbon storage dynamics on the Loess Plateau and identify the mechanisms shaping its spatial heterogeneity.
This framework has three main advantages. First, future-oriented land use simulation enhanced the systematic and predictive capability of carbon storage assessment. Unlike many previous studies that primarily assessed carbon storage responses to LUCC dynamics using historical data [62,63], this study dynamically incorporated climate variables within different SSP-RCP pathways into PLUS-based land use simulation. This enabled the simulation of land use area dynamics and spatial pattern evolution driven jointly by climatic variation and socioeconomic development processes. The integrated framework overcame the shortcomings associated with simple historical trend extrapolation and enabled comparison of the potential effects of different development scenarios on carbon storage.
Second, the simulated carbon storage values were generally within a reasonable range. The carbon storage estimated for the Loess Plateau, such as 5.893 Pg in 2020, was consistent with previous regional studies in the same order of magnitude [64]. When compared with the whole Yellow River Basin, carbon storage on the Loess Plateau accounted for nearly 80% of the basin’s total, which was reported to be about 7.335 Pg [47,59]. This proportion is consistent with the role of the Loess Plateau as a major ecological carbon sink region across the Yellow River Basin, supporting the numerical robustness of the modelling framework at a broad spatial scale. Furthermore, comparison with field observations reported for the Loess Plateau showed that the corrected grassland soil organic carbon density (83.56 t·hm−2) fell within the observed range of 67.78–102.23 t·hm−2 [65]. The corrected forest biomass carbon density (49.18 t·hm−2) was lower than the values reported for mature natural forests in the Ziwuling region (88.11–95.20 t·hm−2; [66,67]. However, this difference is expected because the cited measurements were obtained from mature natural forest ecosystems with relatively high biomass accumulation, whereas the contemporary forest landscape of the Loess Plateau is dominated by extensive young and middle-aged plantations established under the GFGP. Consequently, the regional average forest biomass carbon density is expected to be substantially lower than that of mature natural forests. These results further support the regional applicability of the carbon-density parameterisation scheme. In addition, the higher below-ground biomass carbon density than above-ground biomass carbon density for construction land in Table 2 may be explained by the mixed-pixel nature of this land-use category, which includes residential greenery, roadside vegetation, shelterbelts, and urban-rural transitional vegetation, together with the relatively high root-to-shoot ratios of vegetation under semi-arid conditions.
Third, accurate land use simulation provided a reliable basis for carbon storage estimation. The PLUS framework produced a simulation accuracy reaching 95.25%, exceeding the performance levels previously reported for the CLUE-S (~76.82%) and FLUS (~84.70%) models [68]. The projected carbon storage ranking across scenarios was consistent with earlier studies: EP > CP > ND > RD. EP, CP, and ND showed varying degrees of increase, whereas RD showed a decline. This scenario ranking was generally consistent with previous findings obtained from studies conducted in the Loess Plateau [64] and broader Yellow River Basin region [47].

4.2. Carbon Storage Change and Its Response to Land Use Change

During the 2000–2020 period, ecosystem carbon storage throughout the Loess Plateau showed a persistent increasing trend, increasing from 5.780 Pg to 5.893 Pg (Table 5). Carbon storage reached its highest level in 2020, which was closely associated with the continuous expansion of forest areas and the relatively stable distribution pattern of grass-covered ecosystems throughout 2000–2020 (Figure 3). The GFGP, driven by national ecological restoration policy, was a major factor contributing to this increase. Since 2000, extensive areas of marginal sloping cropland on the Loess Plateau have been gradually transformed into forest and grassland ecosystems (Table 4 and Figure 4). Because forest and grass-covered ecosystems generally maintain higher carbon accumulation capacity than cropland and barren surfaces, the continuous conversion toward vegetation-dominated landscapes substantially improved ecosystem carbon sequestration potential across the region. Carbon storage stored in forest ecosystems rose from 1.211 Pg to 1.405 Pg during the study period [43,47]. The spatial change map (Figure 6) showed carbon storage increases in central Loess Plateau areas, including Yan’an and Yulin, indicating the spatial effect of long-term ecological restoration. Similar large-scale greening effects on the Loess Plateau have also been identified through satellite-based research [69,70]. However, the decline in grassland carbon storage from 2.835 Pg in 2010 to 2.758 Pg in 2020 indicates that the regional carbon pool remained sensitive to urban expansion and land use restructuring (Table 5). The transfer matrix (Figure 4) indicated intensive land use exchanges during 2010–2020. Grassland-to-cropland conversion reached 3.28 × 10⁴ km2, making it a major process of ecological land loss during this period. Meanwhile, construction land continued to expand, occupying cropland and grass-covered areas characterized by relatively elevated carbon density values. Built-up land area expanded by 4532.44 km2 during 2010–2020, with cropland and grassland contributing a large share of the converted area. This shift from ecological or agricultural land to impervious and artificial production space contributed to spatial carbon storage losses [47]. The decline in grassland area after 2010 also suggests that carbon sink enhancement in water-limited fragile regions may be constrained by water availability. Uncontrolled vegetation expansion can intensify deep soil water depletion and push the carbon sequestration potential of ecological restoration toward physiological limits [43,71]. This finding supports a water-limited restoration strategy in semi-arid regions and agrees with recent evidence that vegetation carrying capacity on the Loess Plateau is nearing its environmental threshold [72]. Unlike arid regions dominated mainly by natural processes, the Loess Plateau is a semi-arid landscape strongly shaped by ecological engineering. Its carbon storage dynamics reflect not only land use conversion, but also the interaction among ecological restoration benefits, urban development pressure, and water-resource carrying capacity [37].
The spatial pattern of carbon storage showed a clear southeast-to-northwest contrast. High-carbon areas were mainly located in forest-dominated mountain belts, including the northern Qinling Mountains, Ziwuling, Huanglong Mountain, and the eastern Lüliang Mountains. Low-carbon areas occurred mostly near the Mu Us Sandy Land margin, the Longxi Loess Plateau, and the arid to semi-arid parts of Ningxia and Gansu (Figure 6). This spatial contrast was closely linked to precipitation gradients and vegetation distribution [38,47]. Greater moisture availability in the southeast favoured dense forest development, and forest soils with higher organic carbon further reinforced the high-carbon zones [73]. Because forest land had the highest carbon density among all land use classes, its clustered distribution largely determined the main high-carbon core. By contrast, limited water availability in the northwest restricted vegetation growth, leaving much of this area covered by sparse grassland and unused land. Consequently, both vegetation and soil contributed less to carbon sequestration in this part of the plateau [71]. This result is consistent with previous studies showing that carbon storage heterogeneity on the Loess Plateau is shaped by both precipitation gradients and large-scale ecological restoration. The southern and eastern forested mountains, together with the central GFGP implementation zones, therefore formed the main regional carbon sink areas [52].

4.3. Carbon Storage Responses Under Different Scenarios

The 2030 simulations showed that carbon storage varied substantially among land use scenarios on the Loess Plateau (Figure 5 and Figure 7). This indicates that future carbon sequestration potential depends strongly on how land use structure is adjusted.
ND represented a continuation of the historical land use trajectory. By 2030, carbon storage under this scenario reached 5.893 Pg, remaining almost unchanged from 2020 (Table 5). This indicates that ongoing ecological restoration could compensate for part of the carbon loss associated with urban expansion, maintaining the regional carbon pool near equilibrium. Similar upward or stable trends under natural evolution have also been reported for the Loess Plateau by Liu et al. (2023) and Zhu et al. (2025), who reported continued carbon storage growth under natural evolution on the Loess Plateau [23,38]. RD revealed a strong trade-off between intensive economic development and carbon sequestration capacity. Under this scenario, construction land expanded to the highest level among all scenarios (3.452 × 10⁴ km2), encroaching on forest land, grassland, and high-quality cropland. Total carbon storage decreased to the lowest value, 5.858 Pg (Table 5). This pattern supports previous findings that urbanisation-induced land-surface conversion is a major risk for regional carbon sink loss [7,52]. Uncontrolled urban expansion may cause carbon losses that exceed the gains from local ecological restoration. This result is consistent with Liu et al. (2023), who identified impervious surface expansion as a key cause of carbon storage decline on the Loess Plateau [23]. The results further emphasise the importance of defining limits for urban expansion and restricting the loss of ecological land resources within dry and semi-dry regions [49]. CP showed a pronounced management-driven influence on carbon storage, with total carbon storage increasing to 5.914 Pg. Cropland rebounded to 2.030 × 10⁵ km2 under strict protection (Table 4 and Table 5 and Figure 5), but grassland carbon storage decreased to the lowest level among all scenarios. This suggests that a single cropland protection target may compete spatially with grassland conservation in the ecologically sensitive Loess Plateau. Existing research has demonstrated that transitions among land use categories directly regulate regional carbon accumulation and loss processes. If ecological patch integrity is not considered, cropland protection alone may have limited effects on overall carbon sink enhancement [48]. These findings also have important implications for future ecological governance and grassland management on the Loess Plateau. From a policy perspective, grassland conservation should receive greater attention in future ecological governance on the Loess Plateau. Although cropland protection is essential for ensuring food security, excessive expansion or rigid protection of cropland may inadvertently reduce grassland area and weaken regional carbon-sink functions. Given that grasslands occupy a substantial proportion of the Loess Plateau and contribute considerably to ecosystem stability and carbon sequestration [23,74], future land-management policies should seek a better balance between food-production objectives and ecological conservation goals. More importantly, ecological restoration strategies should be adapted to regional environmental conditions. In the arid and semi-arid northwestern Loess Plateau, priority should be given to preventing the conversion of natural grasslands and promoting the recovery of degraded grasslands through appropriate grazing management and ecological restoration measures. In the relatively humid southeastern areas, efforts should focus on improving vegetation quality and enhancing the connectivity of ecological patches. Such differentiated management strategies would better align regional land-use optimization with the national Ecological Protection and High-Quality Development Strategy for the Yellow River Basin [75], helping maintain ecosystem resilience while simultaneously supporting long-term carbon-neutrality objectives. The results of the EP scenario provide further evidence supporting the effectiveness of this conservation-oriented pathway. EP produced the largest carbon sequestration benefit among the four scenarios. Under this scenario, unused land was redirected toward forest and grassland, while ecological land conversion was constrained; together, these changes raised total carbon storage to the scenario maximum of 5.962 Pg (Table 5 and Figure 7). This result indicates that continuing and optimising the GFGP, while integrating desertification control with carbon sink enhancement, is central to climate adaptation and dual-carbon implementation on the Loess Plateau [3,23,52]. Factor contribution analysis by Liu and Zhao (2018) also suggested that forest expansion served as the dominant driving force behind regional carbon storage growth, providing support for continued ecological restoration in this region [76]. This finding is also consistent with recent studies emphasizing that ecosystem conservation and restoration are more effective pathways for maintaining ecosystem functions and long-term ecological resilience than compensatory approaches alone [77]. The superior performance of the EP scenario further supports the importance of conservation-oriented land-use management for sustaining ecosystem functions while simultaneously enhancing regional carbon storage.
Overall, differentiated carbon sink enhancement strategies should be developed for the Loess Plateau, with ecological restoration priorities adapted to regional environmental characteristics, including forest–grassland restoration in the southeast, tableland conservation across the middle Loess Plateau, and desertification mitigation within northwestern dryland areas. Future land management should prioritise spatial optimisation under ecological protection scenarios. Under the constraint of regional water-resource carrying capacity, management should shift from single land use type protection to system-level carbon sequestration, thereby enhancing the long-term carbon sink potential of the region. Although land use policy settings remain the primary source of scenario differences, the incorporation of SSP-RCP-specific climate projections indicates that future climate conditions may further amplify or constrain the effectiveness of alternative land-management strategies. The regionalized climate projections presented in Table 3 show that the four SSP-RCP pathways provide different temperature and precipitation backgrounds for future land-use development. For example, RD, associated with SSP5-8.5, shows the highest projected mean annual temperature, which may intensify water stress and ecological vulnerability in semi-arid areas, consistent with evidence that revegetation on the Loess Plateau is approaching sustainable water-resource limits [43]. By contrast, EP and CP are associated with relatively higher precipitation backgrounds, which may provide more favorable hydrothermal conditions for vegetation restoration and carbon accumulation, as soil moisture availability strongly regulates land carbon uptake variability [78]. Therefore, future carbon-sink management should consider not only land-use planning and ecological restoration policies, but also the potential modifying effects of climate change on vegetation growth, water availability, and carbon sequestration potential. Nevertheless, the scenario results also indicate that favorable climatic conditions alone cannot guarantee higher carbon storage if land-use allocation competes with ecological space, as shown by the CP scenario.

4.4. Nonlinear Driving Mechanisms of Spatial Carbon Storage Variation

XGBoost-SHAP analysis (Figure 8 and Figure 9) showed that carbon storage variation on the Loess Plateau was jointly shaped by environmental conditions and human disturbance. NPP was the dominant predictor, contributing 57.3% of the total explanatory importance. High-NPP samples had strongly positive SHAP values, indicating that biomass accumulation was the main pathway through which regional carbon sinks increased. The spatial variation in NPP strongly shaped the accumulation of carbon storage, which is consistent with the conclusion of Xu et al. (2018) that carbon sequestration potential in Chinese terrestrial ecosystems is mainly controlled by biomass productivity [79]. SE showed a strong negative effect, with high-value samples concentrated in the negative SHAP range and a contribution of 10.6%. This indicates that intense physical erosion can remove and reduce surface carbon pools [80], consistent with the importance of soil and water conservation in ecological restoration on the Loess Plateau. Bai et al. (2026), in their investigation of GFGP-induced influences on soil organic carbon (SOC) erosion, reported that large-scale vegetation restoration reduced carbon loss risk by increasing surface cover and improving soil structure [81]. The negative effect of SE in the present study further emphasises the critical role of soil erosion control in sustaining the stability of regional ecosystem carbon pools on the Loess Plateau. Meteorological variables (Pre, Tmp, and PET) together explained 8.7% of model importance. Pre had a positive effect on carbon storage: SHAP values shifted from negative to positive as precipitation increased, indicating that vegetation carbon sequestration in semi-arid regions was strongly water-dependent [82]. In contrast, PET showed a negative effect. High evaporative demand can intensify soil water deficits and constrain vegetation growth [83]. Among the topographic factors, Slope showed a consistent positive effect. This was potentially associated with extensive GFGP implementation across steeper slope areas, where reduced cultivation disturbance and secondary vegetation recovery allowed higher carbon density to accumulate. By contrast, high Ele samples tended to cluster in the negative SHAP range. This asymmetric response suggests that climatic constraints may become the main limiting factor for carbon sequestration above certain elevation levels [84]. The machine-learning interpretation therefore revealed multi-factor interactions that are difficult to capture with conventional linear methods, and provided finer insight into the spatial variability of carbon storage on the Loess Plateau [85].
Among the socioeconomic factors, POPD and GDP were recognised as the dominant socioeconomic drivers influencing carbon storage distribution. Their SHAP contributions were higher than those of traffic accessibility and mining-related variables. This indicates that, although the natural background defines the broad regional distribution characteristics of carbon storage across the Loess Plateau, human activity intensity, represented by population concentration and economic scale, is an important factor causing local variation. POPD showed a clear negative effect. High-density samples were concentrated in the negative SHAP range, suggesting that residential activity and urban construction directly occupied or suppressed regional carbon pools [7]. In contrast, GDP showed a distinct ecological feedback pattern, with samples associated with higher GDP values mainly aggregated within the positive SHAP interval. Unlike the conventional pattern in which economic growth often causes carbon loss, counties with higher economic levels on the Loess Plateau, such as Yan’an and Yulin, may have greater fiscal capacity to support large-scale ecological projects. This may promote spatial coordination between economic development and ecological restoration [69,86]. Accessibility factors further refined the interpretation of carbon storage drivers. DM showed a positive response, indicating that a greater distance from mining sites was associated with higher positive contributions to carbon storage. This reflects the physical disturbance and spillover effects of energy and mineral exploitation on surrounding vegetation and soil carbon pools [87]. In terms of soil and water conservation, high-value samples of DR and DHE were both located in the negative SHAP range. This suggests that carbon storage tended to be higher near rivers and major transport corridors. The former may benefit from water supply and higher vegetation productivity [43], whereas the latter may reflect easier management and maintenance of ecological restoration projects along accessible corridors. High DUR samples were mainly distributed in the positive SHAP range, indicating that areas farther from frequent urban road disturbance were more likely to maintain high-carbon natural ecological conditions [88].
Overall, carbon storage change on the Loess Plateau is shaped by both environmental constraints and policy-driven human activities. Future planning should prioritise ecological barrier construction in high-erosion areas and make use of the fiscal and spillover advantages of economically developed areas. Strengthening regional ecological feedback mechanisms can help sustain carbon pool gains on the Loess Plateau.

4.5. Uncertainty Analysis and Future Perspectives

Carbon storage estimation results obtained in the present study still involve uncertainties originating from two primary aspects. First, the spatial heterogeneity of carbon density parameters requires further refinement. Although carbon density values were localised using multiple literature sources and adjusted according to the climate and soil conditions of the Loess Plateau, uncertainties associated with regional heterogeneity and the transferability of climate-correction functions may still exist. For example, different forest stand structures and grassland coverage levels may lead to substantial variation within the same land use type. Future work should integrate flux tower measurements with high-resolution remote sensing retrievals to build a spatially and temporally explicit carbon-density database, which would help reduce estimation uncertainty. Furthermore, we acknowledge that random training-testing partitions in machine learning may cause a systematic overestimation of predictive performance in prospective spatial extrapolation tasks. However, as the primary objective of the XGBoost model in this study is global spatial attribution rather than spatial extrapolation, we focused on evaluating whether spatial autocorrelation could substantially influence the SHAP-based attribution results. To further evaluate the potential influence of spatial autocorrelation on the XGBoost-SHAP analysis, Global Moran’s I was calculated for both actual carbon storage and model residuals using 15,000 randomly sampled pixels. The actual carbon storage exhibited strong positive spatial autocorrelation (Moran’s I = 0.5309, p = 0.0010), indicating pronounced spatial clustering across the Loess Plateau. In contrast, Moran’s I of the XGBoost residuals decreased substantially to −0.0111 (p = 0.0180), suggesting that the residual spatial dependence was very weak after incorporating climatic, topographic, vegetation, soil, accessibility, and socioeconomic variables. This result indicates that the model captured most of the spatially structured variation relevant to the SHAP-based attribution. Nevertheless, future work should further apply Spatial Block Cross-Validation (SBCV) or Spatial Leave-One-Out Cross-Validation (SLOO-CV) to more rigorously evaluate model transferability under spatial extrapolation conditions.
Second, the dynamic feedback between land use change and climate variability was not fully represented. Because the InVEST framework relies on fixed carbon-density coefficients, it was unable to comprehensively reflect how variations in precipitation and temperature influence carbon cycling processes. Future work should introduce climate models and couple them with ecological process models. Adjusting carbon-density parameters for each scenario would allow future modelling to better represent carbon changes under interacting climate and land-surface conditions. Overall, this study quantified carbon storage changes on the Loess Plateau with reasonable reliability under the available data and modelling framework. Future research should combine field plot validation with multi-model comparison to better examine interactions among water, vegetation, and carbon. Such work would strengthen the scientific basis for ecological protection, high-quality development in the Yellow River Basin, and carbon-neutral planning in ecologically fragile regions.
Third, the high explanatory power of NPP warrants cautious interpretation regarding independent causality versus ecological correlation. In the present study, NPP was not used as an input variable or calibration factor in the InVEST carbon storage estimation process, thereby avoiding direct circular dependence between carbon estimation and machine-learning attribution. However, NPP is inherently linked to vegetation productivity, biomass accumulation, and ecosystem functioning, all of which are closely associated with carbon storage. Consequently, the prominent SHAP contribution of NPP (57.3%) should be interpreted as reflecting its strong explanatory power for spatial carbon-storage patterns rather than evidence of an entirely independent causal mechanism. In this sense, NPP may act as an integrative indicator of long-term vegetation recovery and ecosystem productivity across the Loess Plateau. Future studies could further disentangle these complex causal pathways by integrating Structural Equation Modelling (SEM), causal inference approaches, or other process-based frameworks to better distinguish direct and indirect effects among climate, vegetation, land use, and carbon storage.
Finally, to further quantify the uncertainty associated with carbon-density parameters, a Monte Carlo simulation with 10,000 iterations was conducted by applying a coefficient of variation (CV) of 10% to the baseline carbon-density values. The simulation generated probabilistic estimates of total carbon storage under different future scenarios, with mean values of 5.889 Pg for ND, 5.858 Pg for RD, 5.913 Pg for CP, and 5.960 Pg for EP (Figure S5). Although parameter perturbations introduced uncertainty into the absolute carbon-storage estimates, the overall scenario ranking remained unchanged, with EP consistently exhibiting the highest mean carbon storage and RD the lowest. These results suggest that the projected impacts of alternative development pathways on carbon storage are relatively robust to reasonable parameter uncertainty. Combined with comparisons against field measurements reported in previous studies, the uncertainty analysis provides additional confidence in the reliability of the carbon-storage estimates presented in this study.

5. Conclusions

This study integrated PLUS and InVEST to examine carbon storage dynamics on the Loess Plateau and to simulate future changes under multiple scenarios. The main conclusions are as follows.
(1)
Carbon storage displayed a persistent upward trend together with a distinct spatial distribution characterized by higher values in the southeast and lower values in the northwest. From 2000 to 2020, total carbon storage in the study area increased from 5.780 Pg to 5.893 Pg. The EP scenario showed the greatest potential for enhancing regional carbon sinks. Under the EP scenario, carbon storage in 2030 reached the highest value among all scenarios, at 5.962 Pg. In contrast, the RD scenario showed a decline in carbon storage, with total carbon storage decreasing to 5.858 Pg.
(2)
The direction of land use conversion determined carbon gains and losses. Over the 20-year period, continuous forest land expansion was the main driver of regional carbon storage increase, whereas cropland and grassland loss caused local carbon loss. Although construction land accounted for a relatively small area, its rapid expansion posed a major risk to regional carbon sequestration capacity.
(3)
Spatial variation in carbon storage was shaped by both environmental background conditions and human disturbance. The XGBoost-SHAP results showed that NPP served as the most influential variable controlling carbon storage distribution across the Loess Plateau, contributing 57.3%. SE and Slope ranked second and third, contributing 10.6% and 5.6%, respectively. NPP had a strong positive effect on carbon storage, whereas SE had a clear negative effect.
(4)
Differentiated carbon sink enhancement strategies should be developed around the framework of “stabilising the south, enhancing the centre, and restoring the north”. Coordinated ecological governance and urban development can strengthen the Loess Plateau’s long-term carbon sink function while supporting regional ecological security and carbon neutrality goals.

Supplementary Materials

The following supporting information can be downloaded at https://www.mdpi.com/article/10.3390/land15061088/s1. Figure S1: Pixel-level confusion matrix between the simulated and observed land-use maps in 2020; Figure S2: Producer’s Accuracy (PA) and User’s Accuracy (UA) for each land-use category in the 2020 simulation; Figure S3: Moran’s I scatter plot of observed carbon storage; Figure S4: Moran’s I scatter plot of XGBoost model residuals; Figure S5: Probability distributions and 95% confidence intervals of carbon storage under four future scenarios based on 10,000 Monte Carlo simulations; Table S1: Producer’s Accuracy (PA), User’s Accuracy (UA), and F1-score for each land-use category.

Author Contributions

Conceptualization, X.B. and K.S.; methodology, K.S. and L.W.; software, K.S. and Y.F.; validation, K.S. and T.L.; formal analysis, K.S. and Y.Z.; investigation, K.S. and L.W.; resources, X.B. and T.L.; data curation, K.S. and Y.F.; writing—original draft preparation, K.S.; writing—review and editing, X.B., L.W. and Y.Z.; visualization, K.S. and Y.F.; supervision, X.B.; project administration, X.B.; funding acquisition, X.B. All authors have read and agreed to the published version of the manuscript.

Funding

This research was funded by the Central Government Guides Local Science and Technology Development Fund Projects of Shanxi Province, grant number YDZJSX2024D066; the National Natural Science Foundation of China, grant numbers 42107498 and 42401376; and the Ministry of Education Humanities and Social Sciences Youth Foundation Project, grant number 25YJCZH050. The APC was funded by the authors.

Data Availability Statement

The data presented in this study are available on request from the corresponding author due to the fact that the data are part of an ongoing research project.

Conflicts of Interest

The authors declare no conflicts of interest.

References

  1. Friedlingstein, P.; O’Sullivan, M.; Jones, M.W.; Andrew, R.M.; Hauck, J.; Olsen, A.; Peters, G.P.; Peters, W.; Pongratz, J.; Sitch, S.; et al. Global Carbon Budget 2020. Earth Syst. Sci. Data 2020, 12, 3269–3340. [Google Scholar] [CrossRef] [Scilit]
  2. Houghton, R.A.; House, J.I.; Pongratz, J.; van der Werf, G.R.; DeFries, R.S.; Hansen, M.C.; Le Quéré, C.; Ramankutty, N. Carbon emissions from land use and land-cover change. Biogeosciences 2012, 9, 5125–5142. [Google Scholar] [CrossRef] [Scilit]
  3. Bryan, B.A.; Gao, L.; Ye, Y.Q.; Sun, X.F.; Connor, J.D.; Crossman, N.D.; Stafford-Smith, M.; Wu, J.G.; He, C.Y.; Yu, D.Y.; et al. China’s response to a national land-system sustainability emergency. Nature 2018, 559, 193–204. [Google Scholar] [CrossRef] [Scilit] [PubMed]
  4. Ali, G.; Pumijumnong, N.; Cui, S.H. Valuation and validation of carbon sources and sinks through land cover/use change analysis: The case of Bangkok metropolitan area. Land Use Policy 2018, 70, 471–478. [Google Scholar] [CrossRef] [Scilit]
  5. Guerry, A.D.; Polasky, S.; Lubchenco, J.; Chaplin-Kramer, R.; Daily, G.C.; Griffin, R.; Ruckelshaus, M.; Bateman, I.J.; Duraiappah, A.; Elmqvist, T.; et al. Natural capital and ecosystem services informing decisions: From promise to practice. Proc. Natl. Acad. Sci. USA 2015, 112, 7348–7355. [Google Scholar] [CrossRef] [Scilit] [PubMed]
  6. Levy, P.E.; Friend, A.D.; White, A.; Cannell, M.G.R. The Influence of Land Use Change On Global-Scale Fluxes of Carbon from Terrestrial Ecosystems. Clim. Change 2004, 67, 185–209. [Google Scholar] [CrossRef] [Scilit]
  7. Seto, K.C.; Güneralp, B.; Hutyra, L.R. Global forecasts of urban expansion to 2030 and direct impacts on biodiversity and carbon pools. Proc. Natl. Acad. Sci. USA 2012, 109, 16083–16088. [Google Scholar] [CrossRef] [Scilit] [PubMed]
  8. Winkler, K.; Fuchs, R.; Rounsevell, M.; Herold, M. Global land use changes are four times greater than previously estimated. Nat. Commun. 2021, 12, 2501. [Google Scholar] [CrossRef] [Scilit] [PubMed]
  9. Wen, X.; Wang, J.J.; Han, X.J. Impact of land use evolution on the value of ecosystem services in the returned farmland area of the Loess Plateau in northern Shaanxi. Ecol. Indic. 2024, 163, 112119. [Google Scholar] [CrossRef] [Scilit]
  10. Zhao, H.F.; He, H.M.; Wang, J.J.; Bai, C.Y.; Zhang, C.J. Vegetation Restoration and Its Environmental Effects on the Loess Plateau. Sustainability 2018, 10, 4676. [Google Scholar] [CrossRef] [Scilit]
  11. Liang, X.; Guan, Q.F.; Clarke, K.C.; Liu, S.S.; Wang, B.Y.; Yao, Y. Understanding the drivers of sustainable land expansion using a patch-generating land use simulation (PLUS) model: A case study in Wuhan, China. Comput. Environ. Urban Syst. 2021, 85, 101569. [Google Scholar] [CrossRef] [Scilit]
  12. Wang, X.Z.; Wu, J.Z.; Liu, Y.L.; Hai, X.Y.; Shanguan, Z.P.; Deng, L. Driving factors of ecosystem services and their spatiotemporal change assessment based on land use types in the Loess Plateau. J. Environ. Manag. 2022, 311, 114835. [Google Scholar] [CrossRef] [Scilit]
  13. O’Neill, B.C.; Tebaldi, C.; van Vuuren, D.P.; Eyring, V.; Friedlingstein, P.; Hurtt, G.; Knutti, R.; Kriegler, E.; Lamarque, J.F.; Lowe, J.; et al. The Scenario Model Intercomparison Project (ScenarioMIP) for CMIP6. Geosci. Model Dev. 2016, 9, 3461–3482. [Google Scholar] [CrossRef] [Scilit]
  14. Shmelev, S.E.; Agbleze, L.; Spangenberg, J.H. Multidimensional Ecosystem Mapping: Towards a More Comprehensive Spatial Assessment of Nature’s Contributions to People in France. Sustainability 2023, 15, 7557. [Google Scholar] [CrossRef] [Scilit]
  15. Foley, J.A.; DeFries, R.; Asner, G.P.; Barford, C.; Bonan, G.; Carpenter, S.R.; Chapin, F.S.; Coe, M.T.; Daily, G.C.; Gibbs, H.K.; et al. Global Consequences of Land Use. Science 2005, 309, 570–574. [Google Scholar] [CrossRef] [Scilit] [PubMed]
  16. Gao, J.; Wang, L.C. Embedding spatiotemporal changes in carbon storage into urban agglomeration ecosystem management—A case study of the Yangtze River Delta, China. J. Clean. Prod. 2019, 237, 117764. [Google Scholar] [CrossRef] [Scilit]
  17. Baccini, A.; Goetz, S.J.; Walker, W.S.; Laporte, N.T.; Sun, M.; Sulla-Menashe, D.; Hackler, J.; Beck, P.S.A.; Dubayah, R.; Friedl, M.A.; et al. Estimated carbon dioxide emissions from tropical deforestation improved by carbon-density maps. Nat. Clim. Change 2012, 2, 182–185. [Google Scholar] [CrossRef] [Scilit]
  18. Nie, X.; Lu, B.; Chen, Z.P.; Yang, Y.W.; Chen, S.; Chen, Z.H.; Wang, H. Increase or decrease? Integrating the CLUMondo and InVEST models to assess the impact of the implementation of the Major Function Oriented Zone planning on carbon storage. Ecol. Indic. 2020, 118, 106708. [Google Scholar] [CrossRef] [Scilit]
  19. Lai, J.L.; Qi, S.; Chen, J.D.; Guo, J.C.; Wu, H.; Chen, Y.Z. Exploring the spatiotemporal variation of carbon storage on Hainan Island and its driving factors: Insights from InVEST, FLUS models, and machine learning. Ecol. Indic. 2025, 172, 113236. [Google Scholar] [CrossRef] [Scilit]
  20. Zhang, J.P.; Cao, P.H.; Roosli, R. Assessing land use and carbon storage changes using PLUS and InVEST models: A multi-scenario simulation in Hohhot. Environ. Sustain. Indic. 2025, 26, 100655. [Google Scholar] [CrossRef] [Scilit]
  21. Zhang, S.H.; Zhong, Q.L.; Cheng, D.L.; Xu, C.B.; Chang, Y.N.; Lin, Y.Y.; Li, B.Y. Landscape ecological risk projection based on the PLUS model under the localized shared socioeconomic pathways in the Fujian Delta region. Ecol. Indic. 2022, 136, 108642. [Google Scholar] [CrossRef] [Scilit]
  22. Peng, M.H.; Yang, Y.; Deng, Y.J.; Jize, D.D.; Chen, H.; Hai, Y.F.; Liu, G.J.; Wang, H.J.; Xie, T.H.; Li, H.; et al. The impact of the Grain-for-Green Programme on carbon storage in the Upper Yangtze River Basin based on the PLUS-InVEST model. Carbon Balance Manag. 2025, 20, 24. [Google Scholar] [CrossRef] [Scilit] [PubMed]
  23. Liu, K.; Zhang, C.Z.; Zhang, H.; Xu, H.; Xia, W. Spatiotemporal Variation and Dynamic Simulation of Ecosystem Carbon Storage in the Loess Plateau Based on PLUS and InVEST Models. Land 2023, 12, 1065. [Google Scholar] [CrossRef] [Scilit]
  24. Xiong, M.Q.; Li, F.J.; Liu, X.H.; Liu, J.F.; Luo, X.P.; Xing, L.Y.; Wang, R.; Li, H.Y.; Guo, F.Y. Characterization of Ecosystem Services and Their Trade-Off and Synergistic Relationships under Different Land-Use Scenarios on the Loess Plateau. Land 2023, 12, 2087. [Google Scholar] [CrossRef] [Scilit]
  25. Luo, X.Y.; Luo, X.; Yang, X.H.; Wang, J.; Liao, J.L.; He, Y.; Du, Y.; Yang, Y. Optimization of the Loess Plateau of the China Ecological Network Pattern Based on a PLUS Model. Land 2025, 14, 1488. [Google Scholar] [CrossRef] [Scilit]
  26. Willcock, S.; Martínez-López, J.; Hooftman, D.A.P.; Bagstad, K.J.; Balbi, S.; Marzo, A.; Prato, C.; Sciandrello, S.; Signorello, G.; Voigt, B.; et al. Machine learning for ecosystem services. Ecosyst. Serv. 2018, 33, 165–174. [Google Scholar] [CrossRef] [Scilit]
  27. Zhou, Q.; Fellows, A.; Flerchinger, G.N.; Flores, A.N. Examining Interactions Between and Among Predictors of Net Ecosystem Exchange: A Machine Learning Approach in a Semi-arid Landscape. Sci. Rep. 2019, 9, 2222. [Google Scholar] [CrossRef] [Scilit] [PubMed]
  28. Guo, H.; Zhou, X.; Dong, Y.; Wang, Y.H.; Li, S. On the use of machine learning methods to improve the estimation of gross primary productivity of maize field with drip irrigation. Ecol. Model. 2023, 476, 110250. [Google Scholar] [CrossRef] [Scilit]
  29. Yu, D.; Zhou, Z.C.; Chen, M.Y.; Liu, J.E.; Wang, N.; Zhu, B.B.; Cao, Y.X. Identifying the driving mechanisms of ecosystem health in a typical ecologically fragile region: A study based on the XGBoost–SHAP model. Ecol. Indic. 2025, 181, 114472. [Google Scholar] [CrossRef] [Scilit]
  30. Du, P.Y.; Huai, H.J.; Wu, X.Y.; Wang, H.J.; Liu, W.; Tang, X.M. Using XGBoost-SHAP for understanding the ecosystem services trade-off effects and driving mechanisms in ecologically fragile areas. Front. Plant Sci. 2025, 16, 1552818. [Google Scholar] [CrossRef] [Scilit] [PubMed]
  31. Huang, X.B.; Liu, X.S.; Jin, Y.H.; Gao, X.; Chen, Y.L. Identification and attribution analysis of integrated ecological zones based on the XGBoost-SHAP model: A case study of Chengdu, China. Ecol. Indic. 2025, 177, 113787. [Google Scholar] [CrossRef] [Scilit]
  32. Rudin, C. Stop explaining black box machine learning models for high stakes decisions and use interpretable models instead. Nat. Mach. Intell. 2019, 1, 206–215. [Google Scholar] [CrossRef] [Scilit] [PubMed]
  33. Lundberg, S.M.; Lee, S.-I. A unified approach to interpreting model predictions. In Proceedings of the 31st International Conference on Neural Information Processing Systems, Long Beach, CA, USA, 4–9 December 2017; pp. 4768–4777. [Google Scholar]
  34. Cui, J.; Xu, Y.Z.; Wang, M.Q.; Liu, A.J.; Sun, L.; Feng, X.Y.; Yang, Q.R.; Wang, S.; Liu, H.Q.; Lv, Y.J.; et al. Nonlinear threshold responses and spatial heterogeneity of soil organic carbon under contrasting pedoclimatic regimes. Front. Plant Sci. 2025, 16, 1703663. [Google Scholar] [CrossRef] [Scilit] [PubMed]
  35. Cheng, M.M.; Wang, Z.H.; Wang, S.D.; Liu, X.J.; Jiao, W.Z.; Zhang, Y. Determining the impacts of climate change and human activities on vegetation change on the Chinese Loess Plateau considering human-induced vegetation type change and time-lag effects of climate on vegetation growth. Int. J. Digit. Earth 2024, 17, 2336075. [Google Scholar] [CrossRef] [Scilit]
  36. Su, K.; Liu, H.J.; Wang, H.Y. Spatial–Temporal Changes and Driving Force Analysis of Ecosystems in the Loess Plateau Ecological Screen. Forests 2022, 13, 54. [Google Scholar] [CrossRef] [Scilit]
  37. Gao, G.Y.; Li, B.B.; Niklas, K.; Huang, Y.; Xu, M.; Liu, B.; Fu, B.-J. Deep soil carbon pool responses to climate change in the Chinese Loess Plateau. Sci. Bull. 2024, 70, 504–507. [Google Scholar] [CrossRef] [Scilit] [PubMed]
  38. Zhu, Y.; Dong, M.; Wang, X.W.; Chen, D.K.; Zhang, Y.C.; Liu, X.; Yang, K.; Luo, H. Spatiotemporal Distribution Characteristics of Soil Organic Carbon and Its Influencing Factors in the Loess Plateau. Agronomy 2025, 15, 2260. [Google Scholar] [CrossRef] [Scilit]
  39. Li, R.F.; Zhang, X.H.; Ji, W.J.; He, X.L.; Li, Z. Multivariate and scale-dependent controls of deep soil carbon after afforestation in a typical loess-covered region. J. Environ. Manag. 2024, 359, 120998. [Google Scholar] [CrossRef] [Scilit] [PubMed]
  40. Palansooriya, K.N.; Li, J.; Cai, Y.; Wang, Y.; An, Z.; Chang, S.X. Machine learning models predict organic fertilization effects on soil organic carbon stocks in global agroecosystems. Earth Crit. Zone 2025, 2, 100033. [Google Scholar] [CrossRef] [Scilit]
  41. Su, C.H.; Fu, B.J. Evolution of ecosystem services in the Chinese Loess Plateau under climatic and land use changes. Glob. Planet. Change 2013, 101, 119–128. [Google Scholar] [CrossRef] [Scilit]
  42. Sun, W.Y.; Ding, X.T.; Su, J.B.; Mu, X.M.; Zhang, Y.Q.; Gao, P.; Zhao, G.J. Land use and cover changes on the Loess Plateau: A comparison of six global or national land use and cover datasets. Land Use Policy 2022, 119, 106165. [Google Scholar] [CrossRef] [Scilit]
  43. Feng, X.M.; Fu, B.J.; Piao, S.L.; Wang, S.; Ciais, P.; Zeng, Z.Z.; Lü, Y.H.; Zeng, Y.; Li, Y.; Jiang, X.H.; et al. Revegetation in China’s Loess Plateau is approaching sustainable water resource limits. Nat. Clim. Change 2016, 6, 1019–1022. [Google Scholar] [CrossRef] [Scilit]
  44. Yang, H.X.; He, H.; Liu, B.; Yang, H.C.; Han, D.S. Multi-Scenario Land Use Simulation and Carbon Storage Assessment in the Arid Region of Northwest China Based on the PLUS-InVEST-Geodetector Model. Environ. Sci. 2026, 47, 3049–3060. (In Chinese) [Google Scholar]
  45. Niu, F.F.; Guo, J.; Luo, J.; Gou, X.P.; Liu, X.W.; Zhang, J. Simulation of Land Use Change and Prediction of Carbon Storage in Xinjiang Based on the GeoSOS-FLUS and InVEST Models. Arid. Land Geogr. 2025, 48, 2169–2182. (In Chinese) [Google Scholar]
  46. Alam, S.A.; Starr, M.; Clark, B.J.F. Tree biomass and soil organic carbon densities across the Sudanese woodland savannah: A regional carbon sequestration study. J. Arid Environ. 2013, 89, 67–76. [Google Scholar] [CrossRef] [Scilit]
  47. Wang, H.Y.; Wu, L.S.; Yue, Y.S.; Jin, Y.Y.; Zhang, B.B. Impacts of climate and land use change on terrestrial carbon storage: A multi-scenario case study in the Yellow River Basin (1992–2050). Sci. Total Environ. 2024, 930, 172557. [Google Scholar] [CrossRef] [Scilit] [PubMed]
  48. Zhao, S.H.; Zhou, D.M.; Wang, D.M.; Chen, J.K.; Gao, Y.J.; Zhang, J.; Jiang, J. Assessment and Multi-Scenario Prediction of Ecosystem Carbon Storage in the Weihe River Basin Based on the PLUS-InVEST Model. Chin. J. Appl. Ecol. 2024, 35, 2044–2054. (In Chinese) [Google Scholar] [CrossRef] [Scilit] [PubMed]
  49. Ren, Y.X.; Zhang, L.Y.; Li, X.; Zhang, G.Z.; Li, Y.L.; Lian, Z.Y. Spatiotemporal variations and driving mechanisms of carbon storage in Central Asia: Insights from the PLUS-InVEST models and machine learning. J. Environ. Manag. 2025, 389, 126123. [Google Scholar] [CrossRef] [Scilit] [PubMed]
  50. Kulaixi, Z.; Chen, Y.N.; Li, Y.P.; Wang, C. Dynamic Evolution and Scenario Simulation of Ecosystem Services under the Impact of Land-Use Change in an Arid Inland River Basin in Xinjiang, China. Remote Sens. 2023, 15, 2476. [Google Scholar] [CrossRef] [Scilit]
  51. Zuo, X.K.; Zhi, R.; Tang, R.Q.; Wang, H.X.; Zang, S.Y. Study on the Impact of Spatiotemporal Changes in the Ecological Environment on Grain Crops in the Subtropical Monsoon Climate Zone. Sustainability 2024, 16, 10301. [Google Scholar] [CrossRef] [Scilit]
  52. Liang, Y.J.; Hashimoto, S.; Liu, L.J. Integrated assessment of land-use/land-cover dynamics on carbon storage services in the Loess Plateau of China from 1995 to 2050. Ecol. Indic. 2021, 120, 106939. [Google Scholar] [CrossRef] [Scilit]
  53. Guo, W.; Teng, Y.J.; Li, J.; Yan, Y.G.; Zhao, C.W.; Li, Y.X.; Li, X. A new assessment framework to forecast land use and carbon storage under different SSP-RCP scenarios in China. Sci. Total Environ. 2024, 912, 169088. [Google Scholar] [CrossRef] [Scilit] [PubMed]
  54. An, Y.; Tan, X.L.; Ren, H.; Li, Y.Q.; Zhou, Z. Historical Changes and Multi-scenario Prediction of Land Use and Terrestrial Ecosystem Carbon Storage in China. Chin. Geogr. Sci. 2024, 34, 487–503. [Google Scholar] [CrossRef] [Scilit]
  55. National Development and Reform Commission; Ministry of Natural Resources. National Major Engineering Plan for Ecological Protection and Restoration (2021–2035). Available online: https://gi.mnr.gov.cn/202006/t20200611_2525741.html (accessed on 6 June 2026).
  56. Wu, J.Y.; Luo, J.G.; Zhang, H.; Qin, S.; Yu, M.J. Projections of land use change and habitat quality assessment by coupling climate change and development patterns. Sci. Total Environ. 2022, 847, 157491. [Google Scholar] [CrossRef] [Scilit] [PubMed]
  57. Guan, X.X.; Zhang, J.Y.; Bao, Z.X.; Liu, C.S.; Jin, J.L.; Wang, G.Q. Past variations and future projection of runoff in typical basins in 10 water zones, China. Sci. Total Environ. 2021, 798, 149277. [Google Scholar] [CrossRef] [Scilit] [PubMed]
  58. Zhou, Z.L.; Zhang, L.P.; Chen, J.; She, D.X.; Wang, G.S.; Zhang, Q.; Xia, J.; Zhang, Y.J. Projecting Global Drought Risk Under Various SSP-RCP Scenarios. Earth’s Future 2023, 11, e2022EF003420. [Google Scholar] [CrossRef] [Scilit]
  59. Wang, Z.Y.; Li, X.; Mao, Y.T.; Li, L.; Wang, X.R.; Lin, Q. Dynamic simulation of land use change and assessment of carbon storage based on climate change scenarios at the city level: A case study of Bortala, China. Ecol. Indic. 2022, 134, 108499. [Google Scholar] [CrossRef] [Scilit]
  60. Chen, T.Q.; Guestrin, C. XGBoost: A Scalable Tree Boosting System. In Proceedings of the 22nd ACM SIGKDD International Conference on Knowledge Discovery and Data Mining, San Francisco, CA, USA, 13–17 August 2016; pp. 785–794. [Google Scholar]
  61. Hasan, S.S.; Zhen, L.; Miah, M.G.; Ahamed, T.; Samie, A. Impact of land use change on ecosystem services: A review. Environ. Dev. 2020, 34, 100527. [Google Scholar] [CrossRef] [Scilit]
  62. Chang, X.Q.; Xing, Y.Q.; Wang, J.Q.; Yang, H.; Gong, W.S. Effects of land use and cover change (LUCC) on terrestrial carbon stocks in China between 2000 and 2018. Resour. Conserv. Recycl. 2022, 182, 106333. [Google Scholar] [CrossRef] [Scilit]
  63. Lai, L.; Huang, X.J.; Yang, H.; Chuai, X.W.; Zhang, M.; Zhong, T.Y.; Chen, Z.G.; Chen, Y.; Wang, X.; Thompson, J.R. Carbon emissions from land-use change and management in China between 1990 and 2010. Sci. Adv. 2016, 2, e1601063. [Google Scholar] [CrossRef] [Scilit] [PubMed]
  64. Liu, K.; Zhang, H.; Zhang, D.J.; Zheng, W.W.; Zhang, C.Z. Scenario Simulation and Driving Factors of Ecosystem Carbon Storage on the Loess Plateau—A Study Based on the PLUS–InVEST–Geodetector Model. China Environ. Sci. 2025, 45, 2159–2170. (In Chinese) [Google Scholar] [CrossRef]
  65. Dang, Y.A.; Li, S.Q.; Wang, G.D.; Shao, M.A. Distribution Characteristics of Typical Soil Organic Carbon and Microbial Carbon in the Loess Plateau. J. Nat. Resour. 2007, 22, 936–945. (In Chinese) [Google Scholar] [CrossRef]
  66. Yang, X.M.; Cheng, J.M.; Meng, L.; Han, J.J. Forest Carbon Storage and Carbon Density in Ziwuling Mountain of the Loess Plateau. J. Soil Water Conserv. 2010, 24, 123–126+131. (In Chinese) [Google Scholar] [CrossRef]
  67. Yang, X.M.; Cheng, J.M.; Meng, L. Carbon Storage and Density Features of Natural Forest of Pinus tabulaeformis f. shekannesis in the Loess Plateau. Sci. Soil Water Conserv. 2010, 8, 41–45+58. (In Chinese) [Google Scholar] [CrossRef]
  68. Liu, X.P.; Liang, X.; Li, X.; Xu, X.C.; Ou, J.P.; Chen, Y.M.; Li, S.Y.; Wang, S.J.; Pei, F.S. A future land use simulation model (FLUS) for simulating multiple land use scenarios by coupling human and natural effects. Landsc. Urban Plan. 2017, 168, 94–116. [Google Scholar] [CrossRef] [Scilit]
  69. Chen, C.; Park, T.J.; Wang, X.H.; Piao, S.L.; Xu, B.D.; Chaturvedi, R.K.; Fuchs, R.; Brovkin, V.; Ciais, P.; Fensholt, R.; et al. China and India lead in greening of the world through land-use management. Nat. Sustain. 2019, 2, 122–129. [Google Scholar] [CrossRef] [Scilit] [PubMed]
  70. Fu, B.J.; Wang, S.; Liu, Y.; Liu, J.B.; Liang, W.; Miao, C.Y. Hydrogeomorphic Ecosystem Responses to Natural and Anthropogenic Changes in the Loess Plateau of China. Annu. Rev. Earth Planet. Sci. 2017, 45, 223–243. [Google Scholar] [CrossRef] [Scilit]
  71. Jia, X.X.; Shao, M.A.; Zhu, Y.J.; Luo, Y. Soil moisture decline due to afforestation across the Loess Plateau, China. J. Hydrol. 2017, 546, 113–122. [Google Scholar] [CrossRef] [Scilit]
  72. Chen, Y.P.; Wang, K.B.; Fu, B.J.; Wang, Y.F.; Tian, H.W.; Wang, Y.; Zhang, Y. 65% cover is the sustainable vegetation threshold on the Loess Plateau. Environ. Sci. Ecotechnol. 2024, 22, 100442. [Google Scholar] [CrossRef] [Scilit] [PubMed]
  73. Hao, W.L.; Li, Z.S.; Li, B.B. Changes in Soil Carbon Sequestration and Its Driving Factors During Vegetation Restoration on the Loess Plateau. Bull. Soil Water Conserv. 2025, 45, 233–241. (In Chinese) [Google Scholar] [CrossRef]
  74. Chai, Q.L.; Ma, Z.Y.; Chang, X.F.; Wu, G.L.; Zheng, J.Y.; Li, Z.W.; Wang, G.J. Optimizing management to conserve plant diversity and soil carbon stock of semi-arid grasslands on the Loess Plateau. CATENA 2019, 172, 781–788. [Google Scholar] [CrossRef] [Scilit]
  75. Xu, Y.; Wang, C.S. Ecological Protection and High-quality Development in the Yellow River Basin: Framework, Path, and Countermeasure. Bull. Chin. Acad. Sci. 2020, 35, 875–883. (In Chinese) [Google Scholar] [CrossRef]
  76. Liu, G.H.; Zhao, Z.H. Analysis of Carbon Storage and Its Contributing Factors—A Case Study in the Loess Plateau (China). Energies 2018, 11, 1596. [Google Scholar] [CrossRef] [Scilit]
  77. Shmelev, S.E. Biodiversity Offset Schemes for Indonesia: Pro et Contra. Sustainability 2025, 17, 6283. [Google Scholar] [CrossRef] [Scilit]
  78. Humphrey, V.; Berg, A.; Ciais, P.; Gentine, P.; Jung, M.; Reichstein, M.; Seneviratne, S.I.; Frankenberg, C. Soil moisture–atmosphere feedback dominates land carbon uptake variability. Nature 2021, 592, 65–69. [Google Scholar] [CrossRef] [Scilit] [PubMed]
  79. Xu, L.; Yu, G.R.; He, N.P.; Wang, Q.F.; Gao, Y.; Wen, D.; Li, S.G.; Niu, S.L.; Ge, J.P. Carbon storage in China’s terrestrial ecosystems: A synthesis. Sci. Rep. 2018, 8, 2806. [Google Scholar] [CrossRef] [Scilit] [PubMed]
  80. Olson, K.R.; Al-Kaisi, M.; Lal, R.; Cihacek, L. Impact of soil erosion on soil organic carbon stocks. J. Soil Water Conserv. 2016, 71, 61A–67A. [Google Scholar] [CrossRef] [Scilit]
  81. Bai, R.H.; Zhao, X.N.; Wang, X.Z.; Lv, W.W.; Li, J.W.; Yang, F.; Shangguan, Z.; Deng, L. SOC erosion reduction of the “Grain for green” program on the Loess Plateau, China. Soil Tillage Res. 2026, 256, 106863. [Google Scholar] [CrossRef] [Scilit]
  82. Bi, X.; Li, B.; Zhang, L.X.; Nan, B.; Zhang, X.S. Response of grassland productivity to climate change and anthropogenic activities in arid regions of Central Asia. PeerJ 2020, 8, e9797. [Google Scholar] [CrossRef] [Scilit] [PubMed]
  83. Huang, J.P.; Yu, H.P.; Guan, X.D.; Wang, G.Y.; Guo, R.X. Accelerated dryland expansion under climate change. Nat. Clim. Change 2016, 6, 166–171. [Google Scholar] [CrossRef] [Scilit]
  84. Wang, J.J.; Lv, W.B.; Miao, J.X.; Li, Z.H.; Xu, Z.J. Nonlinear responses and temporally varying threshold effects of county-level carbon storage on the Loess Plateau in China (1985–2019). Environ. Dev. Sustain. 2026. [Google Scholar] [CrossRef] [Scilit]
  85. Lundberg, S.M.; Erion, G.; Chen, H.; DeGrave, A.; Prutkin, J.M.; Nair, B.; Katz, R.; Himmelfarb, J.; Bansal, N.; Lee, S.-I. From local explanations to global understanding with explainable AI for trees. Nat. Mach. Intell. 2020, 2, 56–67. [Google Scholar] [CrossRef] [Scilit] [PubMed]
  86. Han, B.Y.; Wang, H.; Wang, Z.Z.; Hui, L.; Xia, Y.Q.; Liu, J.M.; Zhang, L.W.; Jiao, L.; Luo, Y. Coupling dynamics and feedback mechanisms between ecosystem service flows and socio-economic systems in the loess plateau. Appl. Geogr. 2025, 184, 103762. [Google Scholar] [CrossRef] [Scilit]
  87. Yang, B.Y.; Bai, Z.K.; Cao, Y.G.; Xie, F.; Zhang, J.J.; Wang, Y.N. Dynamic Changes in Carbon Sequestration from Opencast Mining Activities and Land Reclamation in China’s Loess Plateau. Sustainability 2019, 11, 1473. [Google Scholar] [CrossRef] [Scilit]
  88. Ibisch, P.L.; Hoffmann, M.T.; Kreft, S.; Pe’er, G.; Kati, V.; Biber-Freudenberger, L.; DellaSala, D.A.; Vale, M.M.; Hobson, P.R.; Selva, N. A global map of roadless areas and their conservation status. Science 2016, 354, 1423–1427. [Google Scholar] [CrossRef] [Scilit] [PubMed]
Figure 1. Location of the Loess Plateau, China.
Land 15 01088 g001
Figure 2. Technical framework integrating PLUS–InVEST and XGBoost–SHAP for carbon storage simulation and driving mechanism analysis.
Land 15 01088 g002
Figure 3. Spatial distribution and area composition of land use types on the Loess Plateau during 2000–2020. Note: The y-axis unit in panel (f) is 103 km2, and a scale break is applied between 16 and 160 × 103 km2 to facilitate visualization of land-use categories with substantially different areas.
Land 15 01088 g003
Figure 4. Land use transitions across the Loess Plateau during 2000–2020 based on chord diagrams.
Land 15 01088 g004
Figure 5. Land use patterns across the Loess Plateau under multiple 2030 development scenarios.
Land 15 01088 g005
Figure 6. Spatial patterns and dynamics of ecosystem carbon storage on the Loess Plateau from 2000 to 2020.
Land 15 01088 g006
Figure 7. Simulated spatial distribution of carbon storage on the Loess Plateau under different 2030 development scenarios.
Land 15 01088 g007
Figure 8. Global importance of carbon storage drivers based on SHAP values. Colored bars indicate the average SHAP values of drivers ranked by importance, and the red values in parentheses indicate the percentage contribution of each driver to the total average SHAP value. Abbreviations: NPP, net primary productivity; SE, soil erosion; Pre, precipitation; POPD, population density; Ele, elevation; GDP, gross domestic product; Tmp, temperature; PET, potential evapotranspiration; DR, distance to rivers; DHE, distance to highways; Clay, clay content; DM, distance to mining areas; Silt, silt content; DNR, distance to national roads; DUR, distance to urban roads; DSR, distance to provincial roads; Sand, sand content.
Land 15 01088 g008
Figure 9. Direction and magnitude of carbon storage drivers based on SHAP values. Abbreviations are the same as those described in Figure 8.
Land 15 01088 g009
Table 1. Data sources and descriptions for the multi-source datasets used in the PLUS-InVEST modeling framework (accessed on 19 May 2026).
Data TypeData NameFormatResolution/mData Source
Land use dataLand use dataRaster30Zenodo (https://zenodo.org/)
Natural factor dataElevationRaster30Geospatial Data Cloud (https://www.gscloud.cn)
SlopeRaster30Calculated based on the Digital Elevation Model
PrecipitationRaster1000National Tibetan Plateau Data Center (https://data.tpdc.ac.cn)
TemperatureRaster1000
Potential EvapotranspirationRaster1000
Future precipitation (SSP1-2.6, SSP2-4.5, SSP3-7.0, SSP5-8.5)Raster1000WorldClim (https://www.worldclim.org)
Future temperature (SSP1-2.6, SSP2-4.5, SSP3-7.0, SSP5-8.5)Raster1000
NPPRaster1000Resources and Environmental Science Data Center, Chinese Academy of Sciences (https://www.resdc.cn)
Soil ErosionRaster30Science Data Bank
(https://www.scidb.cn/)
Soil TextureSand contentRaster1000Resources and Environmental Science Data Center, Chinese Academy of Sciences
(https://www.resdc.cn)
Silt content
Clay content
Socio-economic dataPopulation DensityRaster1000WorldPop
(https://www.worldpop.org)
GDPRaster1000Resources and Environmental Science Data Center, Chinese Academy of Sciences
(https://www.resdc.cn)
Road networkVector-OpenStreetMap (https://www.openstreetmap.org)
River systemVector-Data Sharing and Service Portal
(https://data.casearth.cn/)
Mineral sitesVector National Geological Archives of China (https://www.ngac.cn/125cms/c/qggnew/index.htm)
Table 2. Carbon pool density values across major land use categories in the Loess Plateau (t · hm−2).
Land Use TypeAboveground Biomass CBelowground Biomass CSoil Organic CDead Organic Matter C
Cultivated land2.390.3682.171.89
Forest land39.429.7694.682.84
Grassland0.414.2583.561.63
Water area0.28000
Construction land1.183.0248.960
Unused land1.13018.920
Table 3. Regionalized climate projections for the Loess Plateau in 2030 under different SSP-RCP pathways.
Land Use ScenarioAssociated SSP-RCP PathwayMean Annual Temperature (°C)Annual Precipitation (mm)
Natural DevelopmentSSP2-4.59.43557.79
Rapid DevelopmentSSP5-8.59.56583.56
Cropland ProtectionSSP3-7.09.00605.49
Ecological ProtectionSSP1-2.69.11598.02
Table 4. Simulated land use areas in the Loess Plateau under different 2030 development scenarios (km2).
Land Use Type20202030 ND2030 RD2030 CP2030 EP
Cropland183,353.46180,571.70178,902.35202,998.61185,639.33
Forest land95,791.1598,787.5397,588.2698,665.4898,904.07
Grassland306,894.85300,525.26295,688.12284,603.80308,147.55
Water3085.803148.923211.873156.283296.89
Construction land19,228.6726,861.3634,521.8922,206.7921,032.65
Unused land17,875.4916,334.6616,316.9314,598.459208.93
Table 5. Carbon storage variation among major land use types in the Loess Plateau during 2000–2030 (Pg).
Year/ScenarioCultivated LandForest LandGrasslandWater AreaConstruction LandUnused LandTotal
20001.727051.211202.730940.000060.053470.057075.77980
20051.646561.242602.804100.000070.063960.050475.80775
20101.599931.289202.834970.000080.078130.042275.84458
20151.564411.337122.832520.000080.091840.038995.86497
20201.591691.405262.757450.000090.102220.035845.89254
2030 (ND)1.567541.449212.700220.000090.142790.032755.89261
2030 (RD)1.553051.431622.656760.000090.183520.032725.85775
2030 (CP)1.762231.447422.557170.000090.118050.029275.91423
2030 (EP)1.611541.450922.768710.000090.111810.018465.96153
Disclaimer/Publisher’s Note: The statements, opinions and data contained in all publications are solely those of the individual author(s) and contributor(s) and not of MDPI and/or the editor(s). MDPI and/or the editor(s) disclaim responsibility for any injury to people or property resulting from any ideas, methods, instructions or products referred to in the content.