Review

Reconstruction and Drivers of Change in Historical Land Use Intensity in China: A Review and Prospect

1
School of Public Administration, China University of Geosciences, Wuhan 430074, China
2
Hubei Key Laboratory of Environment and Culture in Yangtze Regions, China University of Geosciences, Wuhan 430074, China
3
China College of Resources and Environment, Shanxi University of Finance and Economics, Taiyuan 030006, China
4
Key Laboratory of Land Surface Pattern and Simulation, Institute of Geographic Sciences and Natural Resources Research, Chinese Academy of Sciences, Beijing 100101, China
*
Author to whom correspondence should be addressed.
Land 2026, 15(5), 891; https://doi.org/10.3390/land15050891
Submission received: 22 April 2026 / Revised: 17 May 2026 / Accepted: 19 May 2026 / Published: 21 May 2026
(This article belongs to the Topic Large-Scale and Long-Term Land Use and Land Cover Mapping)

Abstract

Reconstructing historical land use intensity and analyzing its driving forces are crucial for understanding the impacts of human activities on the environment. This review systematically assesses the research on reconstructing historical land use intensity in China, focusing on four dimensions: land use type, harvest frequency, input intensity, and output intensity. The analysis reveals significant imbalances in the development of these dimensions, with reconstruction methods for land use types being the most mature, while quantitative methods for input intensity remain the weakest. The approaches are generally evolving from qualitative to quantitative analysis. Furthermore, studies on the driving forces behind intensity changes are predominantly qualitative, lacking integrated quantitative analyses of multiple factors. To overcome these limitations, the paper proposes that future research should integrate multi-source proxy indicators to construct a comprehensive, multi-dimensional assessment system. This would enable the spatiotemporal reconstruction of land use intensity and facilitate quantitative analysis of its driving forces using spatial data analysis and machine learning methods.

1. Introduction

Historical land use change has significant climatic and environmental effects, leading to carbon emissions [1,2], global warming [3], biodiversity loss [4], and trade-offs among ecosystem services [5,6]. Therefore, the reconstruction of historical land use has received widespread attention from the fields of global change [7], historical geography [8], and land resource management [9], and international scientific initiatives have conducted extensive research on historical land use reconstruction. For example, the PAGES LandCover6k working group (https://pastglobalchanges.org/) has reconstructed global land use/cover change over the past several millennia using multi-source data such as pollen, archaeology, and historical records. The Global Land Programme (https://www.glp.earth/) has promoted international collaborative research focusing on land use intensity measurement, land change modeling, and land system sustainability assessment.
Changes in historical land use affect the environment through both the conversion of land types and the intensification of their use. These two aspects are interlinked: accumulated intensification can trigger fundamental type conversions, which in turn represent a deeper level of human intervention [10,11]. At the same time, even for the same land use type, differences in management practices, input levels, and output conditions lead to significantly different environmental effects [12,13,14]. Therefore, historical land use intensity is a comprehensive concept that measures the degree of human disturbance in land utilization, management, and protection [15], and its complete assessment needs to encompass both land use type conversion and changes in internal use levels.
As one of the world’s major centers of agricultural origin [16], China has a history of agricultural development spanning more than ten thousand years and a long tradition of grazing [17,18,19]. In the human–environment interaction, the continuous expansion of cropland area [20] and the increasing intensity of grazing [21] have been jointly driven by the long-term interplay of natural conditions and socio-economic and cultural factors. To decode the complex dynamics of historical land use, it is essential to reconstruct its intensity trajectory, analyze its spatiotemporal patterns, and identify the underlying drivers. This research will provide critical insights for safeguarding cropland and grassland sustainability in China, while also supplying essential parameters to improve the accuracy of global carbon cycle and climate models.
The absence of a review on the reconstruction of historical land use intensity and its driving forces in China hampers research into the spatiotemporal evolution of long-term human activities and their environmental effects. For instance, inadequate reconstructions of historical irrigation and fertilization increase uncertainties in global paleoclimate modeling [22], while poor constraints on historical harvest frequency compromise accurate estimations of agricultural greenhouse gas emissions [23]. Therefore, it is important to review the research progress on historical land use intensity. However, existing reviews have mostly focused on the reconstruction of historical land use area and spatial patterns. For instance, Fang et al. [24] systematically summarized the data and methodological progress in the reconstruction of historical cropland in China, while He et al. [25] reviewed the development process of historical land use/cover change research in China from qualitative research to timing, quantification, and positioning research. While they have paved the way for understanding changes in the extent of historical land use, it has largely overlooked variations in use intensity within the same land type, as well as the underlying driving mechanisms. This gap consequently constrains advances in reconstructing historical land use intensity and assessing its climatic and ecological effects in China. To address this, we systematically review the research progress on historical land use intensity in China and analyze its driving mechanisms, aiming to propel the field from a focus on area reconstruction toward a more integrated understanding of intensity.

2. Methods

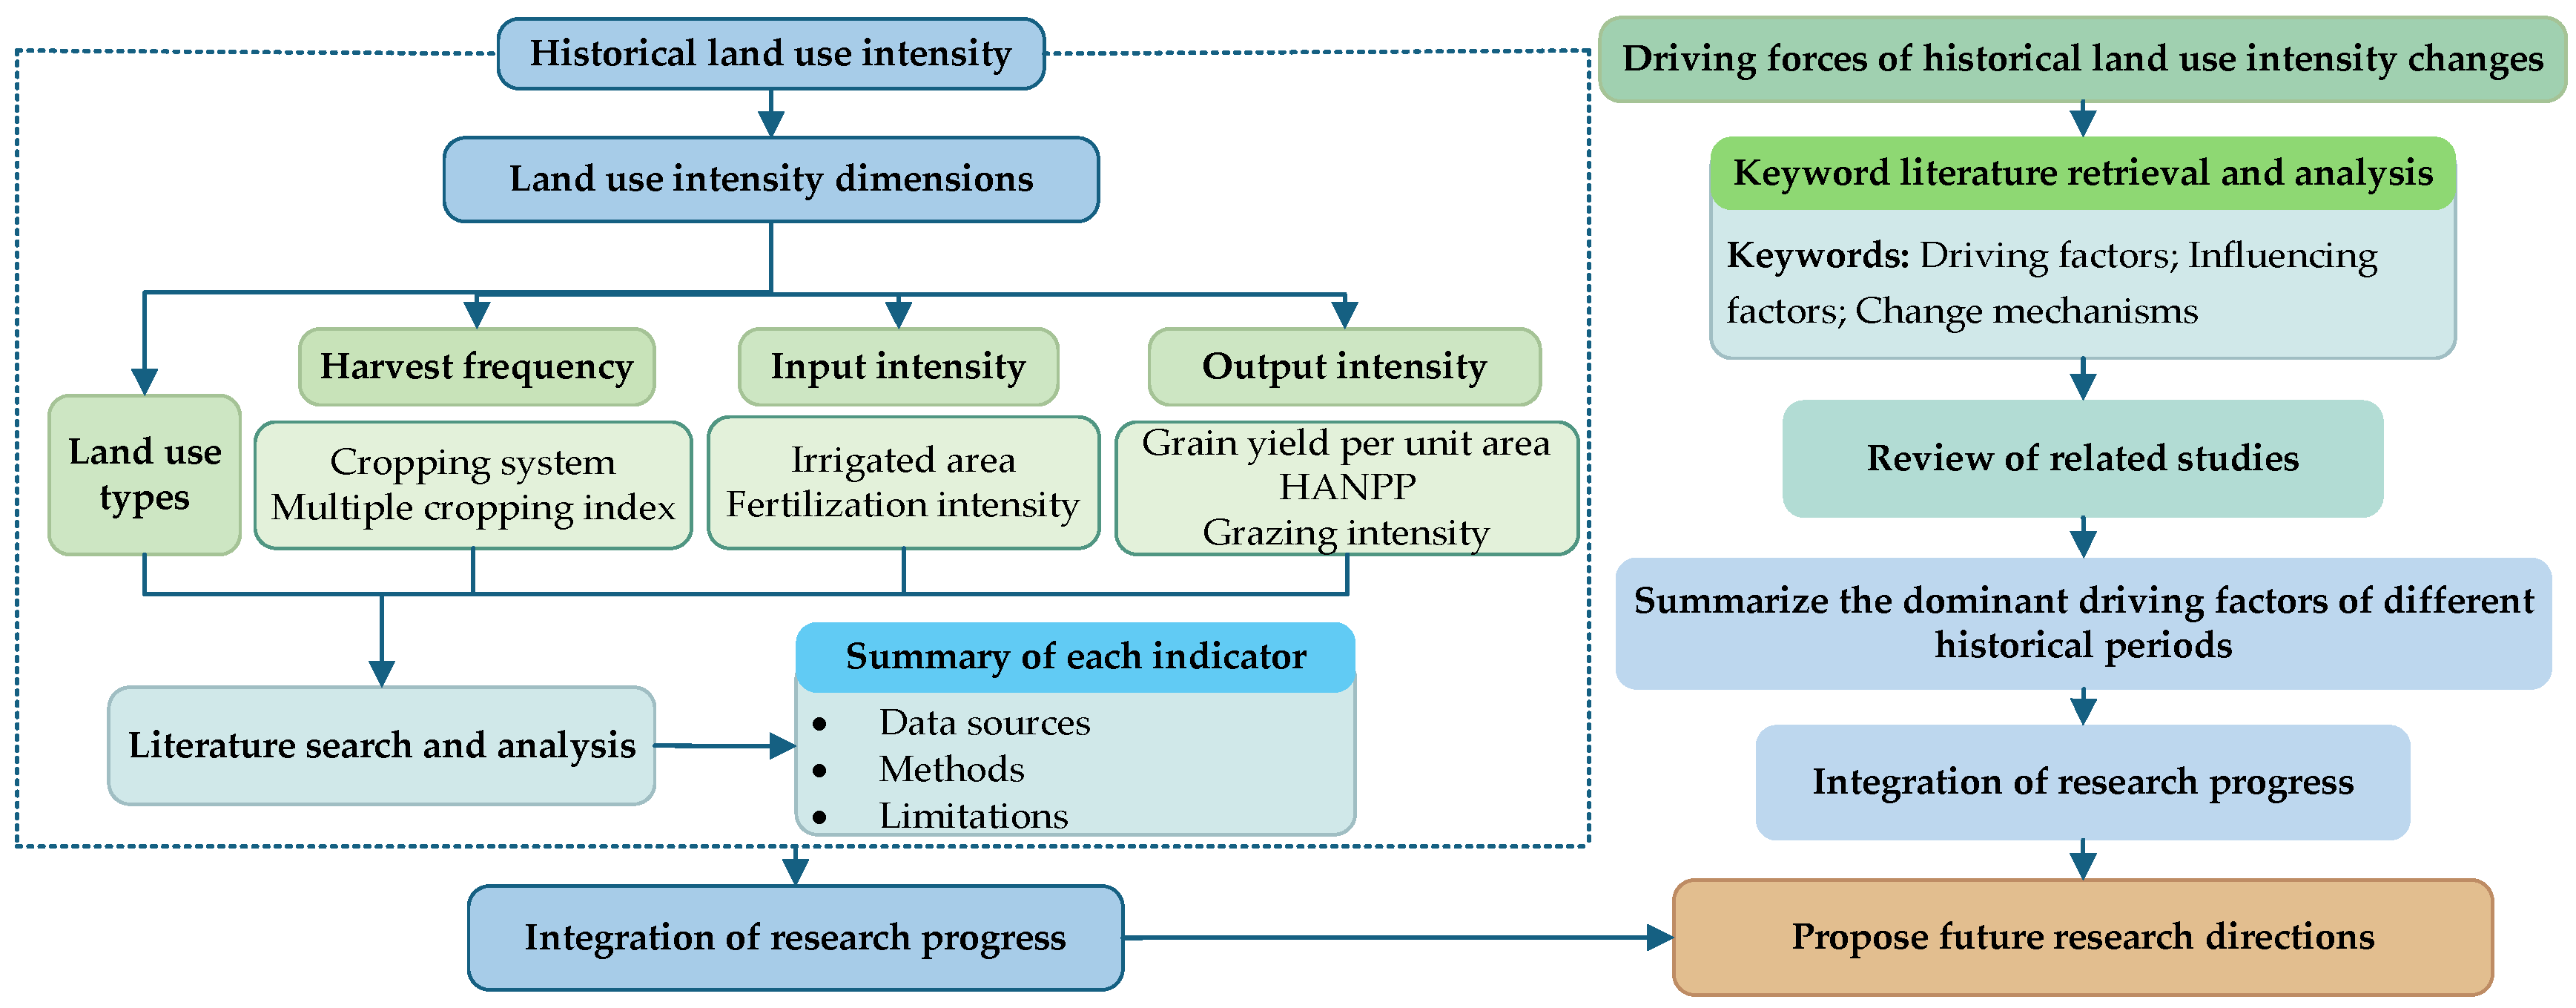
We conducted a systematic literature search using the Web of Science Core Collection and the China National Knowledge Infrastructure (CNKI) database. Our initial search strategy was structured around two thematic groups: terms related to land use intensity and its driving forces. For English databases, we used keywords such as “land use intensity”, “land use intensification”, and “historical land use”, and combined them with phrases like “historical reconstruction”, “driving forces”, “change mechanisms”, and “influencing factors”. Corresponding Chinese terms were then used for the CNKI database. After screening titles and abstracts, we read the full texts. Based on a preliminary analysis, we categorized historical land use intensity into four dimensions: land use types, harvest frequency, input intensity, and output intensity (Figure 1).
Building on this framework, we conducted dimension-specific searches. For harvest frequency, we used keywords including “cropping system,” “multiple cropping index,” and “cropping intensity.” For input intensity, we added “irrigated area,” “fertilization intensity,” and “agricultural machinery.” For output intensity, we searched for “grain yield per unit area” and “grazing intensity.” All queries were combined with broader terms like “historical reconstruction,” “driving forces,” “change mechanisms,” and “influencing factors.” Articles were screened against two eligibility criteria: (1) the study had to explicitly address historical land use intensity or at least one of the four defined dimensions; and (2) the study area had to be either China or global in scope. This process yielded 104 publications on historical land use intensity and 27 on its driving forces.
We performed a structured analysis of this corpus to synthesize the current state of research. Each dimension was evaluated in terms of data sources, reconstruction methods, and limitations, allowing us to identify cross-dimensional imbalances and methodological bottlenecks. We also systematically reviewed the main factors driving the evolution of land use intensity across different historical periods. This analysis forms the basis for identifying critical research gaps and proposing future directions.

3. Progress in Reconstructing Historical Land Use Intensity

To capture the multifaceted nature of human intervention in land systems, we analyze historical land use intensity through four dimensions: land use type, harvest frequency, input intensity, and output intensity. The research progress for each dimension is reviewed in the subsequent sections.

3.1. Land Use Types

The conversion of land use types serves as a primary macro-scale manifestation of land use intensification [26]. Such conversion—for instance, turning unused land into productive space—signifies not only a change in land cover but also increased inputs of labor and capital, reflecting heightened human impact at a broad scale. Consequently, studying historical land-use change is essential for understanding the extent and intensity of long-term human activities. The field has progressed from qualitative historical analysis [27] to quantitative reconstructions using multi-source data such as maps [28], natural archives [29], and remote sensing [30], producing datasets for global change research [31,32,33,34,35,36]. On this basis, Ellis et al. [37,38] integrated population data to create a classification of human-influenced biomes, allowing reconstruction of a global gradient in human disturbance. This marks a key step from analyzing land-use type toward assessing land-use intensity.
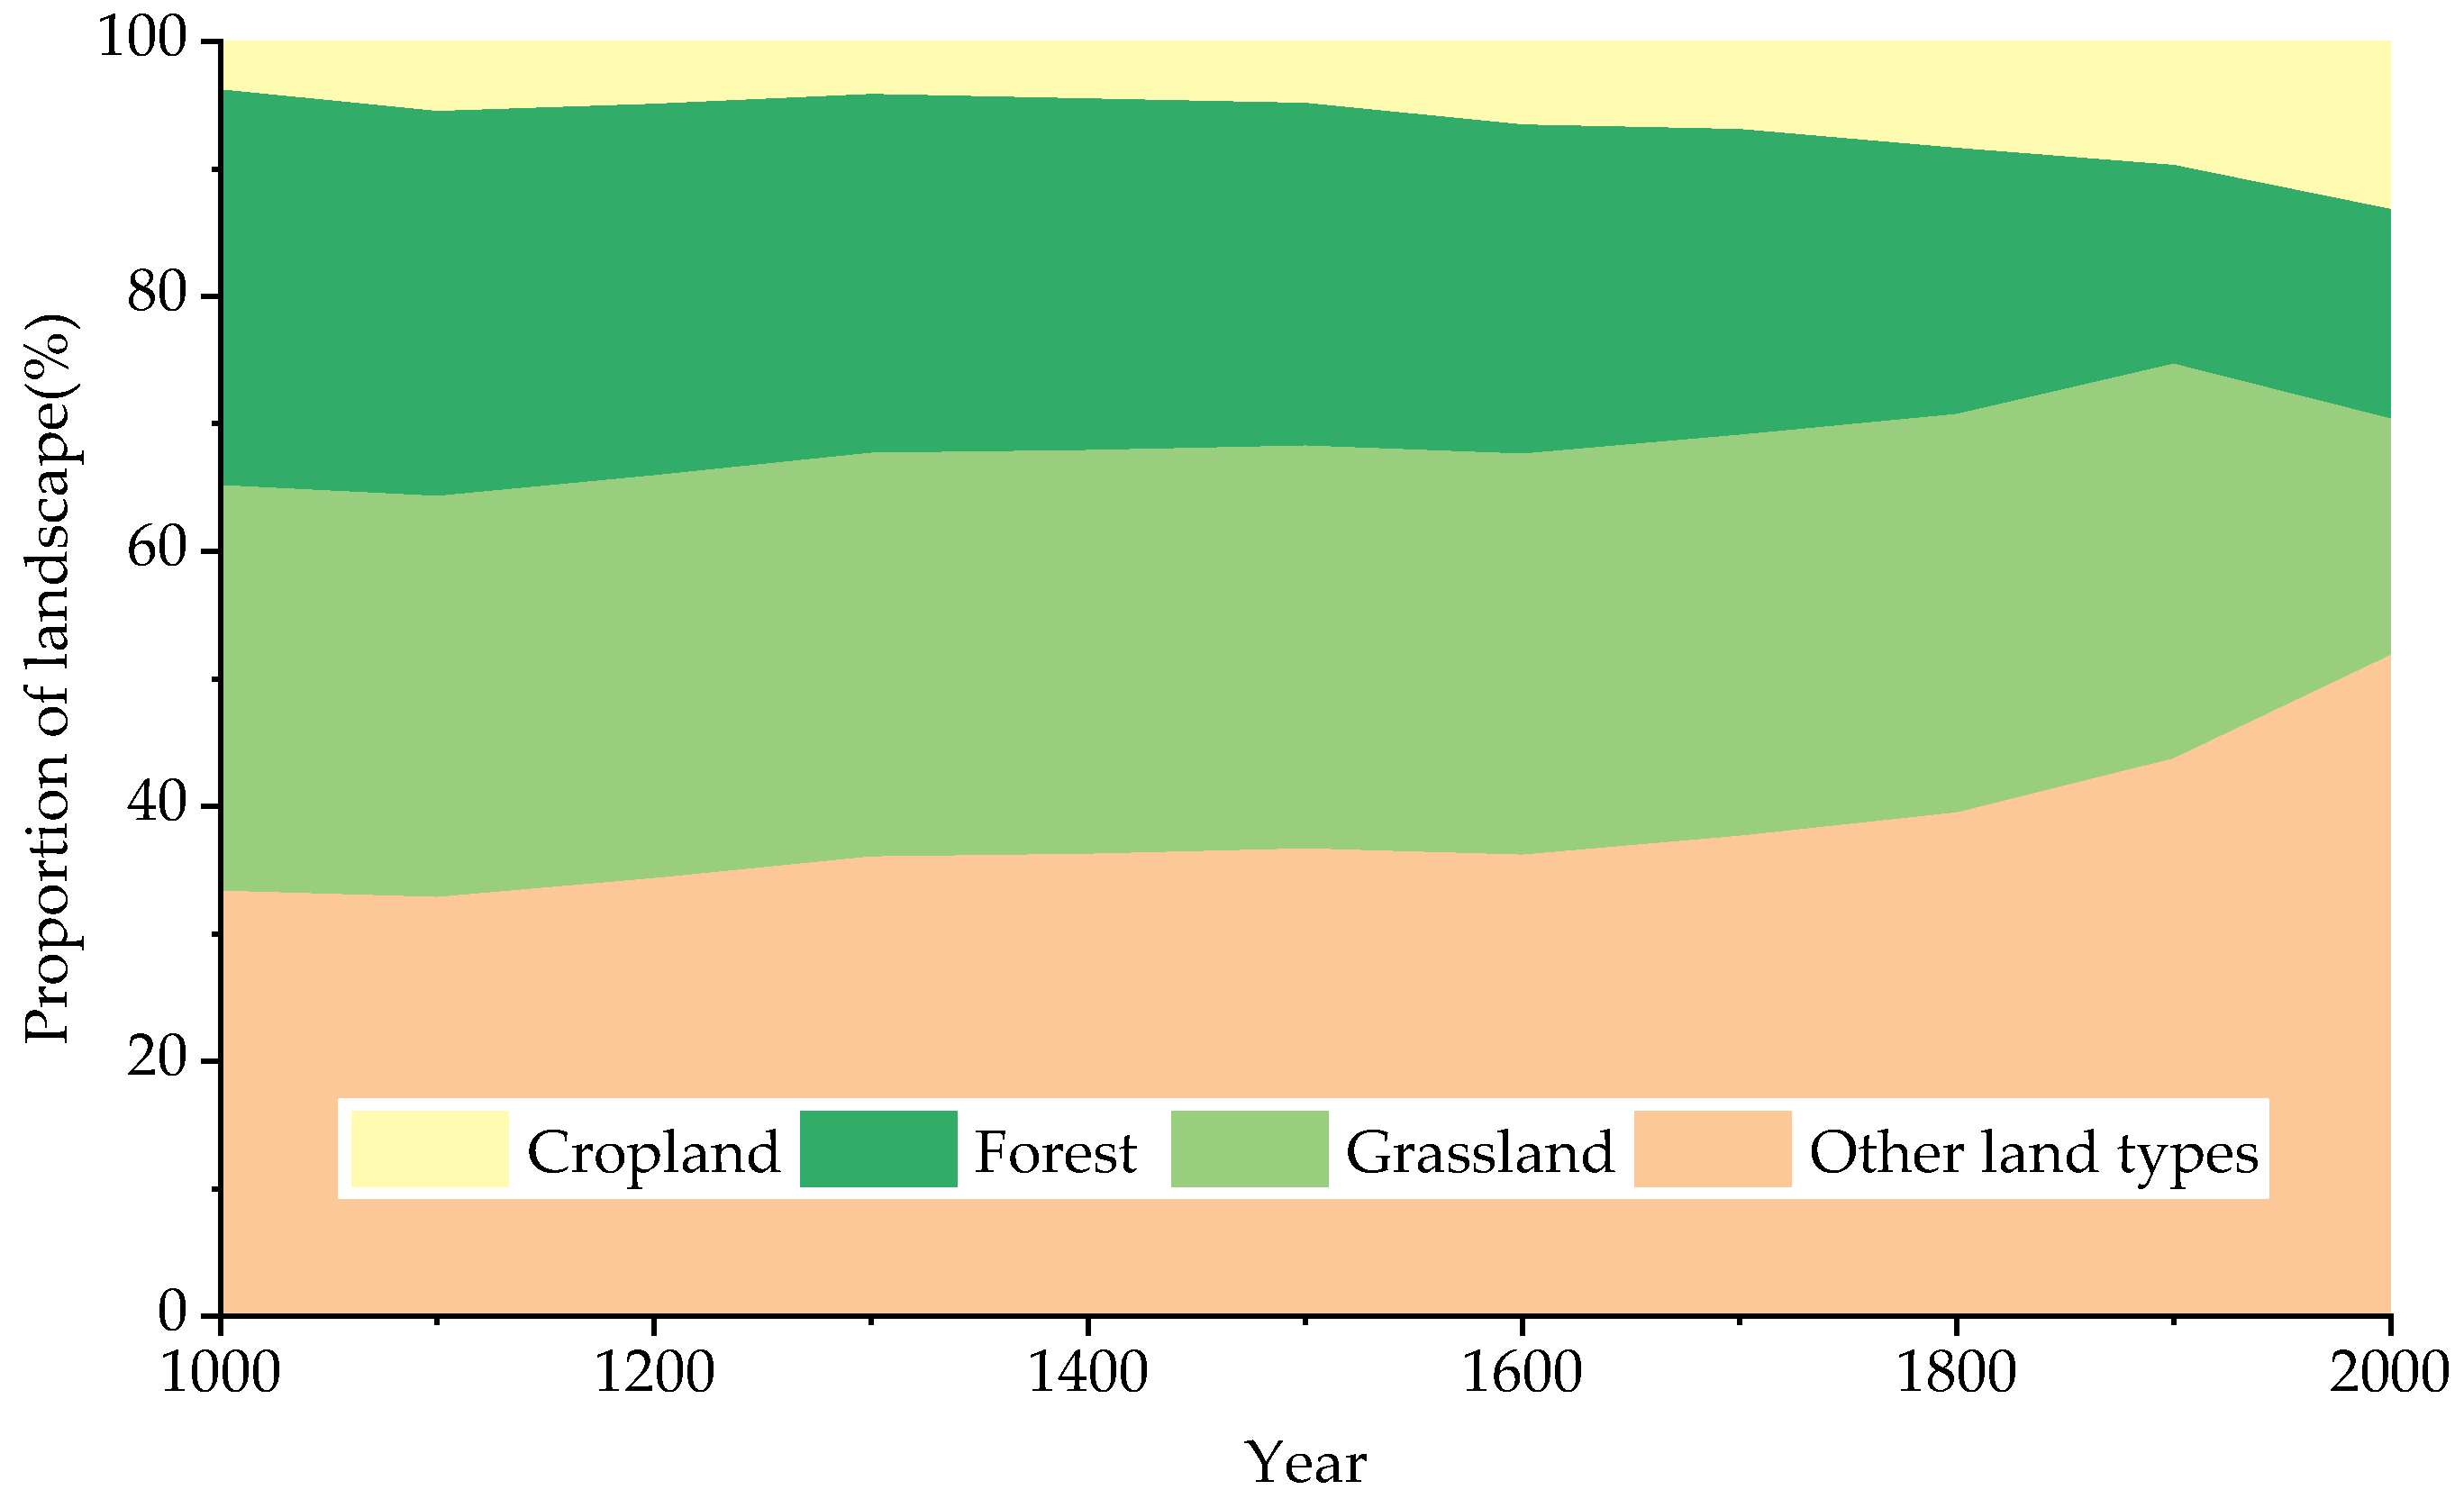
Historical land use in China shows clear transformation (Figure 2). Millennial-scale trends are marked by cropland expansion and a corresponding contraction of natural lands like forests and grasslands, indicating both the widening scope and intensification of human activity. Spatially, cropland originated in scattered patches within the Yellow River and Yangtze River basins. Following the Han (202 BCE–220 CE) and Tang (618–907 CE) dynasties, its expansion tracked the movement of political centers and the diffusion of agricultural technology. Subsequently, the population surge and introduction of New World crops (e.g., maize and sweet potato) during the Ming (1368–1644 CE) and Qing (1636–1912 CE) dynasties triggered large-scale development of mountainous and hilly areas [39]. This process signifies not only the spatial expansion of China’s agricultural civilization but also the intensification of human land use over time and space. Around 1800, land use patterns underwent a pronounced shift, marked by a rapid increase in developed land. Particularly evident was the expansion of built-up areas, which spread continuously from core agricultural and economic regions like the North China Plain, the Central Plains, and Shanghai, to cities across the country [40,41,42,43]. This shift marks a transformation in the primary driver of land use intensification in China—from a traditional model reliant on labor inputs and cropland expansion to a modern paradigm characterized by the rapid, capital-, technology-, and resource-intensive expansion of built-up land [44].
Although historical land use types reconstruction has achieved important progress in data foundation and spatial methods, enabling the identification of the expansion of human activity scope and the increase in land disturbance intensity, they mainly focus on macro-level land use conversions and thus struggle to capture the differences in management intensity within the same land use type. Therefore, building on land use type as the macro-level dimension, this review further introduces and analyzes three micro-level dimensions: harvest frequency, input intensity, and output intensity. By integrating these macro and micro perspectives, we aim to systematically reveal the evolutionary characteristics of historical land use intensity in China.

3.2. Harvest Frequency

Harvest frequency is a widely used indicator of land use intensity [45]. It was typically measured by the combination of cropping seasons on the same plot within a year (e.g., one, two, or three harvests in two years) [46]. By increasing the temporal use of land, the harvest frequency reflects the level of intensification in cropland management and serves as a practical measure of land use intensity [47,48]. The reconstruction of historical harvest frequency in China has primarily relied on three categories of data sources: archaeological remains and ancient agricultural texts, local gazetteers, and national statistical data. Methodologically, the research has evolved from early qualitative exploration toward quantitative calculation (Table 1).
Early studies were predominantly based on qualitative textual analysis of classical agricultural treatises, which summarized crop combinations and rotation patterns to trace the evolution of harvest frequency in China (Figure 3). This evolution reflects a long-term intensification of land use: from shifting cultivation in the Neolithic period (c. 8000 BCE) [20,49,50], to the short-term or periodic fallow rotation during the Xia, Shang, and Zhou dynasties (2070–771 BC) [51], and then to the continuous cropping system after the Spring and Autumn period (770–476 BC) [52,53,54,55,56,57]. Recently, scholars have utilized records from local gazetteers and journal literature to quantitatively reconstruct changes in harvest frequency of the North China Plain over the past 300 years [58]. This work provides a valuable methodological reference for conducting long-term studies on land-use intensity.
After the founding of the People’s Republic of China, with the establishment of the agricultural statistical system, scholars began to adopt quantitative methods to estimate harvest frequency [59,60]. For example, Huang [61] used statistical data to calculate the multiple cropping index of cropland in southern China over the 40 years after 1949, pointing out the potential for increasing land use intensity in southern China. Guo [62] assessed China’s potential multiple cropping index and found considerable potential for further agricultural intensification.
Table 1. Representative studies on historical harvest frequency in China.
LiteratureStudy PeriodStudy AreaMaterials and Methods
Li [20]Warring States–Qing DynastyChinaQualitative analysis based on historical documents. Simple, but the data are inaccurate.
Guo [51]Neolithic–Spring and Autumn PeriodChina
Tan [63]Han DynastyChina
Han [52]Xia–Qing DynastyChina
Xia [53], Wang [54]Qing DynastySuzhou, Taihu Lake Basin
Zhang and Mei [55], Wu [56]Ming–Qing DynastyJianghan Plain, Dongting Lake Plain, Huizhou
Min [57]Qing DynastyChina
Li et al. [58]Qing Dynasty–1980sThe North China Plain
Huang [61]1949–1990The 14 province–level divisions in southern ChinaQuantitative calculation using statistical data. Accurate but cannot reflect internal field differences.
Guo [62]1952–1992China
Liu [64]1949–2010China
In summary, the historical research on harvest frequency in China has yielded abundant results, yet limitations remain in data quality, the linkage between historical and modern data, and spatiotemporal accuracy. First, records of harvest frequency in ancient texts are mostly qualitative descriptions lacking unified quantitative standards, which may lead to differences in records for the same region [65], and most studies have directly relied on a single data source, affecting the accuracy of their results. Second, although some studies have attempted to link harvest frequency with the multiple cropping index [66], the historical harvest frequency records may only reflect the best planting conditions in specific areas rather than the overall regional level. Directly assigning numerical values to harvest frequency introduces bias. Furthermore, in terms of spatial scale, whether for harvest frequency or the multiple cropping index, existing studies have mostly used administrative units (provinces or counties) as the basic analysis units, with data being uniform within the same administrative unit, making it difficult to capture internal spatial differences, thereby limiting the precision and timeliness of findings. These shortcomings restrict our understanding of the long-term spatial evolution of land use intensity.

3.3. Input Intensity

Input intensity is one of the core dimensions for measuring land use intensity; it directly reflects the input level of labor, capital, and technology per unit of land area [67]. Compared with other dimensions, input intensity more directly characterizes the pathways of land use intensification and differences in input levels; even when output or harvest frequency is the same, the underlying input levels may differ [68,69]. Therefore, reconstructing input intensity is important for understanding the internal structure and evolutionary changes in historical land use intensity.
Irrigation improves agricultural growing conditions, thereby increasing land output, raising the level of agricultural intensification and land use intensity [70]. The long-term reconstruction of historical irrigated area has mainly relied on statistical data and documentary records, with interpolation applied for missing years [71], as exemplified by the global reconstruction of irrigated area from 1900 to 2005 [70]. Building on this framework, HYDE 3.2 [32] used population as a proxy, combined with climatic data and per capita irrigated area, to classify global cropland into irrigated and rain-fed categories. This provided a valuable research framework and more refined baseline data for subsequent irrigation studies. In contrast, research on historical irrigated area in China remains underdeveloped. Most existing work relies on descriptive accounts of the evolution of water conservancy facilities derived from historical records. A notable exception is the study by Li et al. [72], which reconstructed the irrigated cropland area in northern Anyang, Henan, from the Warring States period (475–221 BC) to 2015. Their method utilized relationships documented in local gazetteers and water conservancy archives between canal lengths, the number of canals, and irrigated area. The reconstruction demonstrated a generally fluctuating upward trend in irrigated area, disrupted only during periods of political turmoil, and reaching a historical peak after the founding of the People’s Republic of China. This trend indicates a long-term intensification of land use in the region.
The use of fertilizer optimizes land use patterns through the input of soil nutrients per unit area, and is therefore often used as an indicator to characterize agricultural productivity and land intensification levels [73]. The reconstruction of historical fertilization intensity has mainly adopted two approaches. One is based on statistical data, combined with crop types and harvest frequency, to allocate fertilizer application to cropland grids. For example, Nishina et al. [74] used FAO data to reconstruct a global gridded dataset of nitrogen fertilizer application from 1961 to 2010, finding that fertilization intensity in double-cropping areas in China was significantly higher than in single-cropping areas. Lu et al. [75] used data from the International Fertilizer Industry Association to reconstruct a long-term gridded dataset of global nitrogen and phosphorus fertilizer use from 1961 to 2013, finding that areas with high fertilizer input in China overlapped with high-intensity cropland use regions such as the North China Plain and the Middle-Lower Yangtze Plain. The other approach indirectly reconstructs historical fertilization intensity by using historical livestock numbers and manure recycling rates within the spatial extent of cropland [76,77].
The above review of input intensity research shows that existing studies have clarified the evolution characteristics of different historical stages in China based on irrigated area and fertilization intensity, revealing the interrelationship between input intensity and land use intensity. However, existing research still has limitations. In terms of irrigated cropland area reconstruction, using the relationship between canal length, number of canals, and irrigation scale recorded in historical documents faces difficulties in data acquisition and data continuity [78], making it difficult to achieve large-scale, long-term historical reconstruction. Although the historical reconstruction method by Li et al. [72] for Anyang County is worth noting, its assumption of a constant ratio between canal length and irrigation scale may lead to underestimation or overestimation of actual irrigated area. Moreover, global irrigation reconstruction datasets further amplify data uncertainties by applying interpolation for missing years [71]. In fertilization intensity studies, the manure recycling rate is simplified as a fixed parameter, lacking historical dynamics [79]. Historically, nutrient inputs in Chinese cropland also relied extensively on other organic fertilizers such as human excreta and green manure [80,81], yet existing reconstructions have mainly focused on indirect estimation using livestock, generally lacking quantification of these fertilizer sources, which leads to a systematic underestimation of historical fertilization intensity.

3.4. Output Intensity

Output intensity generally refers to the economic or physical output per unit area of land, with slight variations in meaning across different research fields [82,83]. It is considered an ideal indicator for land use intensity studies precisely because it is independent of productivity inputs [84]. Under consistent natural conditions, there is a positive correlation between land output intensity and land use intensity [85].
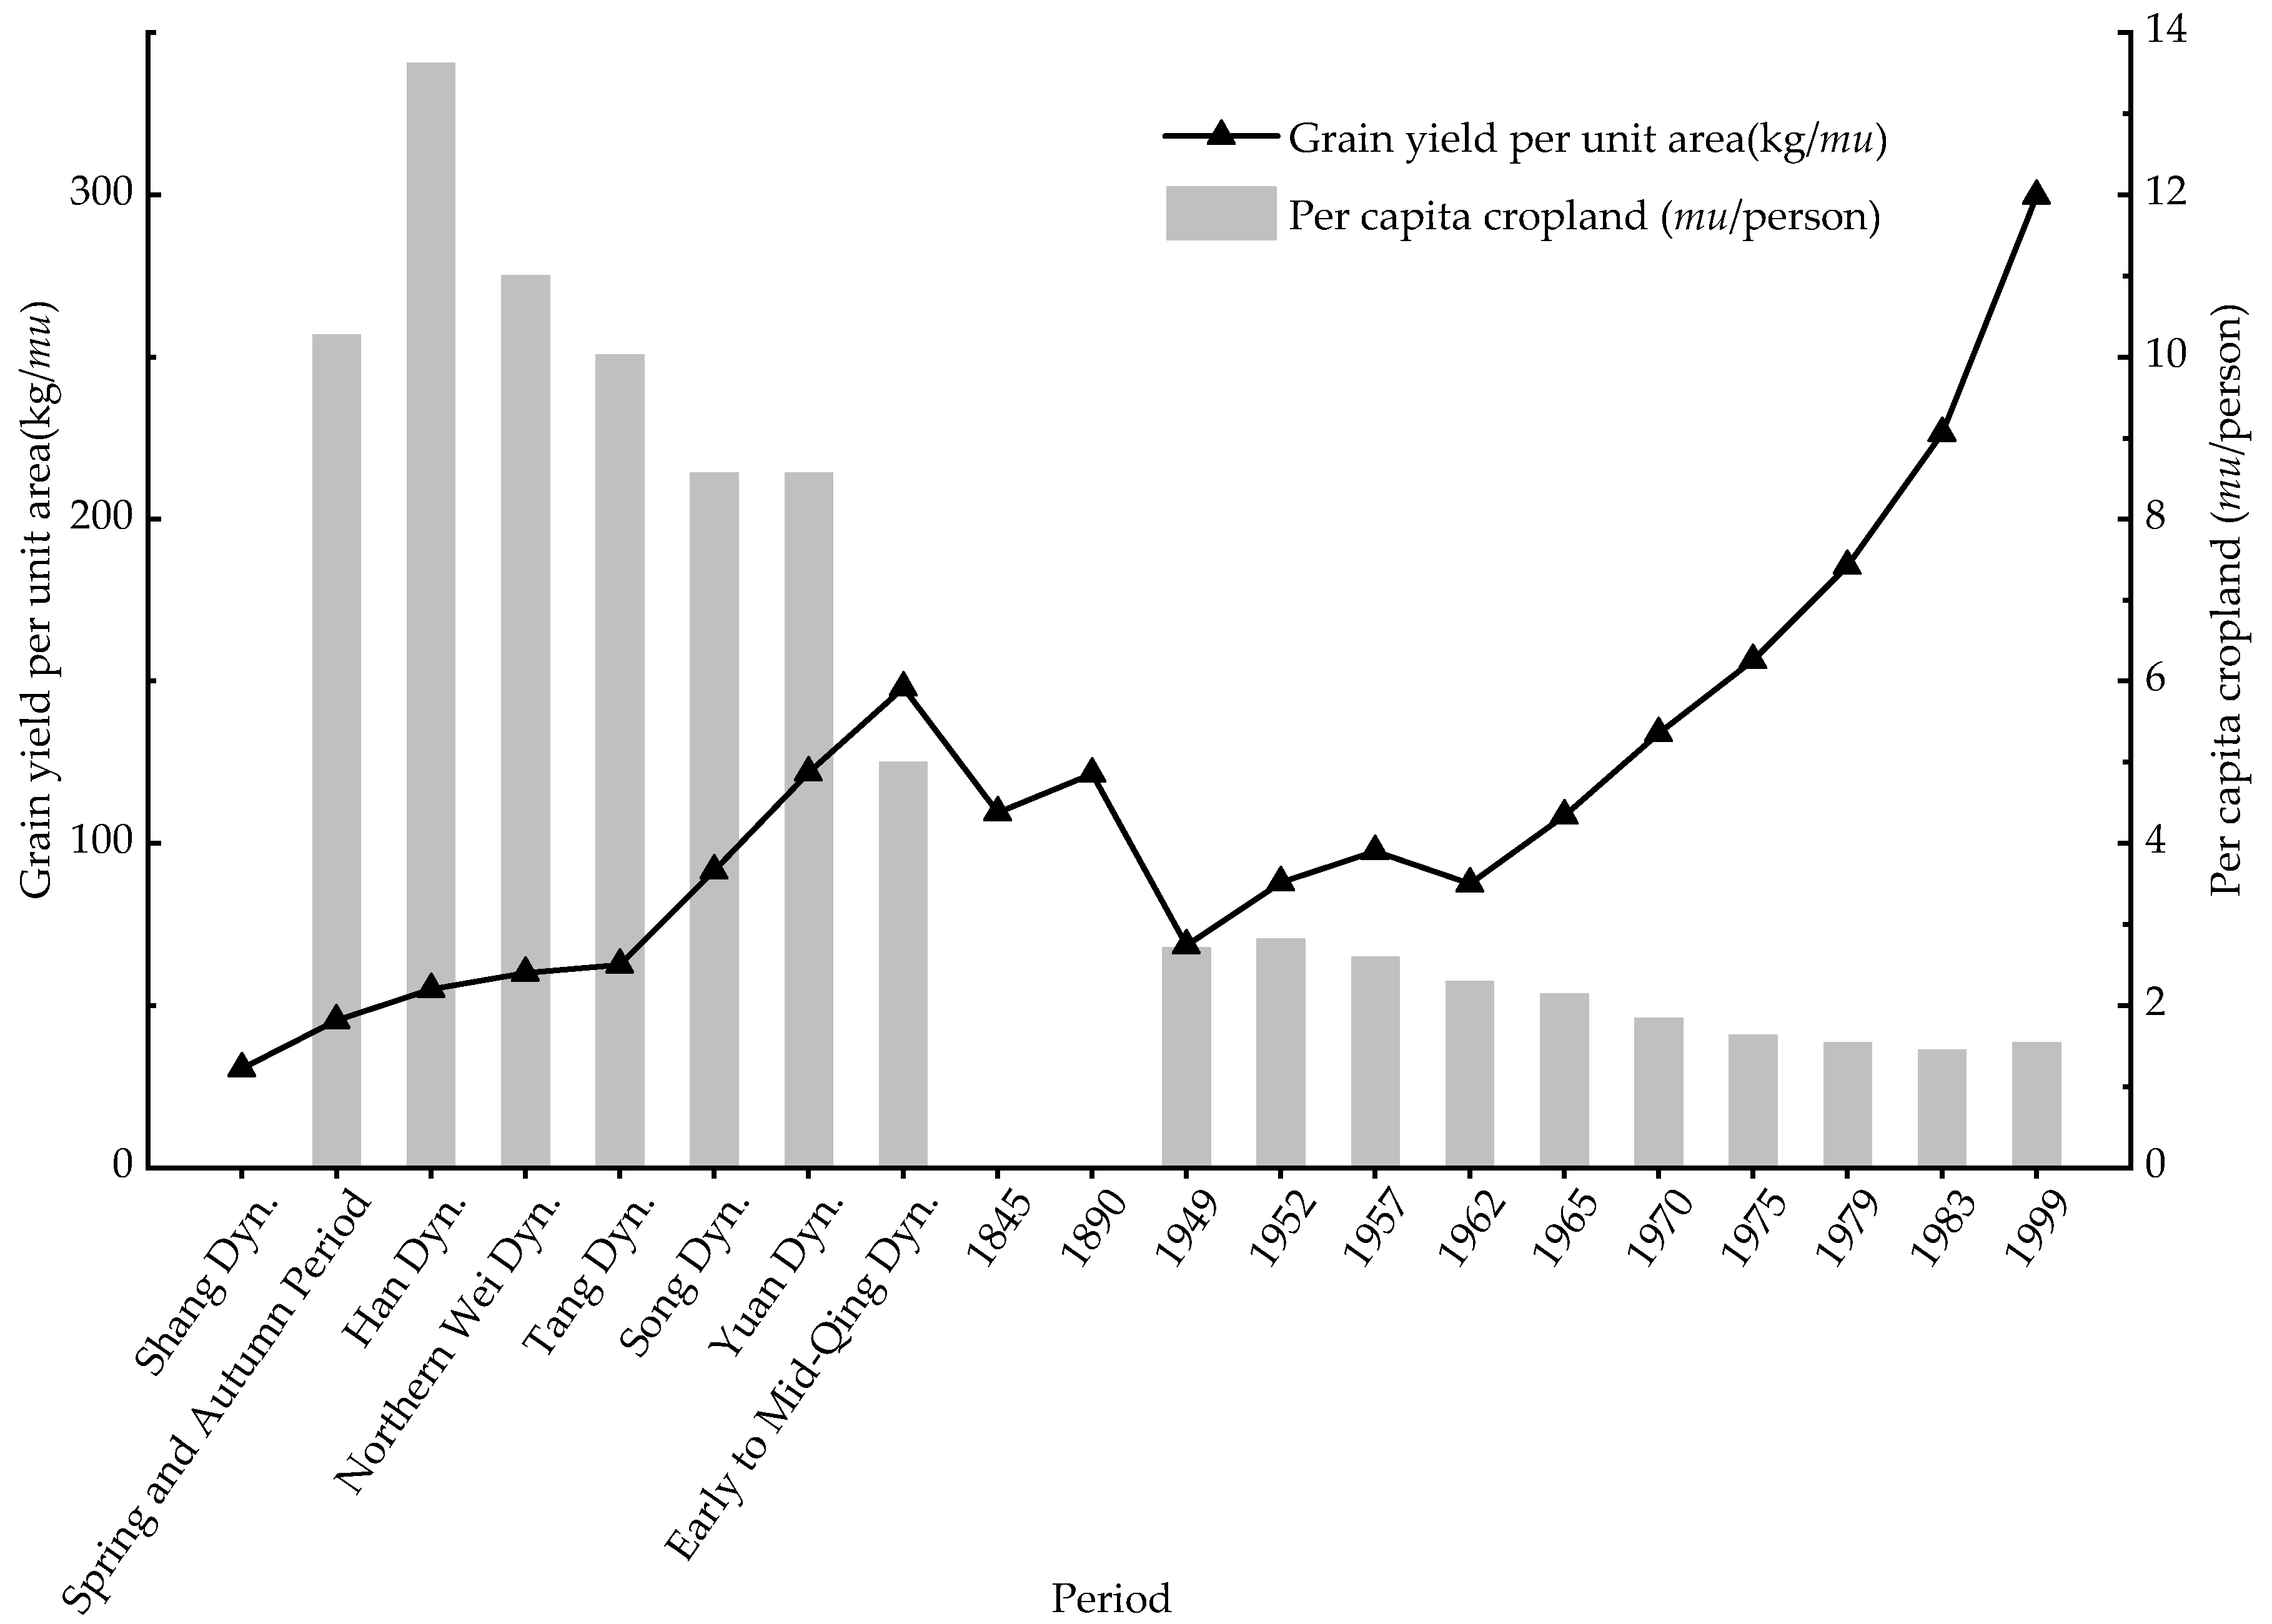
The most intuitive indicator for measuring historical cropland output intensity is grain yield per unit area, that is, the amount of grain harvested per unit area of land [44]. The reconstruction of historical grain yield per unit area has generally relied on historical documents [86], combined with regional reclaimed cropland area, to estimate historical grain yield levels. For example, Zhang et al. [87] suggested that a grain yield per unit area of less than 1 dan (ancient Chinese units of grain measurement, 1 dan ≈ 100 L) per mu (unit of area, 1 mu ≈ 667 m2) was a reasonable production level during the Western Han Dynasty (180–141 BC). Chen [88] estimated that the national average grain yield per unit area reached a new height during the Yuan Dynasty (1271–1368 CE). Reconstruction methods based solely on documents suffer from gaps, inaccuracies, and measurement inconsistencies across dynasties. To overcome this, scholars increasingly rely on tax and land rent records for indirect estimates of historical grain yield per unit area [89,90]. After the founding of the People’s Republic of China, national statistical data gradually improved, facilitating further research on grain yield per unit area in China [91,92,93].
Farmland management scale is correlated with grain yield per unit area [94]; therefore, from a long-term perspective, combining changes in grain yield per unit area with changes in per capita cropland can further reveal the intrinsic logic of the influence of grain yield per unit area on land use intensity. To clarify this relationship, we synthesize existing findings on historical per capita cropland [95,96,97] (Figure 4). From the Spring and Autumn period onward (770–221 BC), China saw a general decline in per capita cropland coupled with a rise in grain yield per unit area—a trend that stabilized post-1949. This inverse dynamic captures the essential process of rising land output intensity over China’s history.
Although using grain yield per unit area to measure historical land use intensity is simple and intuitive, it can only serve as an indicator of economic output from agricultural land and lacks an assessment of the ecological impact of human land use. Human production and living activities on land affect changes in the carbon cycle of terrestrial plant production [101,102]. Therefore, some scholars have proposed using Net Primary Productivity (NPP) to study the extent of human occupation of the Earth [103], and research on the reconstruction of historical NPP in China has also developed [104,105]. However, NPP changes are driven by both human activities and climate variability, making it an imperfect proxy for isolating human-induced ecosystem disturbance. To more directly quantify the human impact, scholars have proposed the indicator of Human Appropriation of Net Primary Production (HANPP). HANPP assesses the extent to which human activities alter the biomass flows in ecosystems, offering a productivity-based perspective for quantifying and mapping land use intensity [106].
The reconstruction of HANPP has mainly relied on remote sensing data and has been carried out using statistical models [107], parameter models [108], and process-based models [109]. Based on these methods, scholars have conducted extensive historical reconstruction work [110,111,112], yet the reconstruction of HANPP for historical periods in China remains relatively scarce, mostly focusing on the past few decades [113,114,115,116]. Global-scale HANPP studies provide a reference for understanding changes in land use intensity in China. Krausmann et al. [117] reconstructed global HANPP from 1910 to 2005, showing that HANPP in Asia doubled or even tripled during the 20th century. Stenzel et al. [118] further assessed planetary boundary transgressions related to biosphere integrity since 1600 using HANPP and ecological disruption risk indicators. Their findings indicate that China had already emerged as a global hotspot for both HANPP and ecological disruption risk by 1850. After 1950, ecological pressures intensified and expanded spatially, with even high-altitude regions of the Qinghai–Tibet Plateau—areas without direct land use—experiencing significant ecological risk.
Grazing intensity is a key indicator for measuring grassland use intensity, and is commonly quantified by the number of livestock per unit area of grassland [119,120]. The reconstruction of historical grazing intensity in China has mainly relied on three types of data sources and methods. The first type is the systematic compilation of livestock number records from historical documents. For example, Zhao et al. [121] estimated the scale of livestock in the northwestern Shanxi region from the Western Jin dynasty (226–316 CE) to the Northern Wei dynasty (386–534 CE). Wu [122] compiled the livestock numbers of some monasteries in the Tumed area during the 1950s. Xu and Lyu [123] cited the provincial livestock statistics systematically compiled by Buck from 1929 to 1933 when comparing China’s century-long economic changes. The second type uses livestock taxation standards in fiscal records or statistical relationships between population and per capita livestock numbers to indirectly estimate historical livestock numbers [124,125]. The third type is based on the inversion of fungal spores in soils and sediments [126], which has enabled quantitative reconstruction of grazing intensity over the past hundreds to thousands of years in some regions of China [127,128].
From the perspective of research progress on historical land use output intensity in China, it is clear that scholars have conducted extensive explorations and achieved certain advances in this field. They have carried out quantitative reconstructions of historical grain yield per unit area, introduced the HANPP indicator into historical land use intensity research to achieve spatially explicit analysis of output intensity, and realized long-term quantitative reconstruction of grazing intensity. These efforts have laid a foundation for in-depth studies on the evolution of historical land use intensity. However, existing research still has several limitations. Historical records of grain yield per unit area suffer from scattered and inaccurate documentation and inconsistencies in weights and measures [129,130]. The accuracy of grain measurement based on tax collection also varies [131], which constrains the accuracy of output intensity assessment. Although missing data can be back-calculated using available records [100], this approach further increases the uncertainty of the results. Moreover, the calculated results are mostly aggregate data at the administrative unit level and cannot reflect the internal heterogeneity within individual plots. Existing long-term HANPP studies are mostly based on a global perspective. Although they can reflect the general situation in China, the land use datasets used in the reconstruction process, such as HYDE and SAGE, have been shown to have significant biases in China [132,133], thus affecting the accuracy of HANPP reconstruction results for China. For grazing intensity reconstruction using fungal spores, the results are strongly influenced by the location of soil and sediment sampling [134], and the reconstructed results are mostly intensity sequences for small areas, without forming gridded data. Furthermore, the production, dispersal, preservation, and deposition processes of fungal spores are easily disturbed by external factors, making accurate quantification difficult [135]. Both of these issues affect the precision of the reconstruction.

3.5. Comparison of the Four Dimensions

A review of research on land use type, harvest frequency, input intensity, and output intensity reveals that, despite extensive exploration of each dimension, significant disparities exist in their data availability, methodological maturity, and spatiotemporal reconstruction accuracy. This imbalance hinders the development of a cohesive research system for historical land use intensity.
Regarding data availability, reconstructions based on land use types benefit from the most abundant sources. For harvest frequency, relatively rich records exist in historical texts and gazetteers, supplemented by modern statistical data on the multiple cropping index. Output intensity assessment relies on more limited or indirect data: grain yield records are incomplete, HANPP reconstructions depend largely on remote sensing, and grazing intensity utilizes proxies like historical registers and fungal spores. In contrast, input intensity suffers from the weakest data foundation, with pre-1949 information on irrigation and fertilization being particularly fragmented. These inherent data gaps and variations across dimensions make it impossible to accurately reconstruct the full trajectory of land use intensity by relying on any single indicator alone.
From the perspective of methodological maturity, the spatiotemporal reconstruction of land use types has developed a relatively standardized technical pathway [136]. Research on harvest frequency has preliminarily established a pathway for converting qualitative descriptions into quantitative calculations [66], enabling a preliminary connection between historical and contemporary data. For output intensity, the reconstruction of grain yield per unit area applies linear interpolation for missing years; the estimation methods for HANPP and grazing intensity are relatively mature. The methodological framework for input intensity is the weakest, as qualitative descriptions in historical records are difficult to accurately transform into quantitative data, and existing reconstructions mostly assume fixed irrigation capacity and stable manure recycling parameters, lacking historical dynamism.
From the perspective of spatiotemporal reconstruction accuracy, land use types have achieved fine-gridded reconstruction [36], with the highest spatial accuracy. The spatial reconstruction units for harvest frequency and grain yield per unit area are administrative regions, making it still difficult to achieve high-precision gridded reconstruction. The reconstructions of HANPP and grazing intensity are limited by data precision, leading to substantial uncertainties in spatial reconstruction [137,138]. Research on input intensity is the weakest; to achieve long-term, spatially explicit reconstruction, breakthroughs in data mining and methodological innovation are still needed.
In summary, significant disparities in data availability, methodological maturity, and spatiotemporal reconstruction accuracy exist across the four dimensions of land use intensity. Although land use intensity is inherently multi-dimensional, existing research has largely examined each dimension in isolation. While this has advanced understanding within individual dimensions, it has not effectively integrated the macro-scale transformation of land use types with micro-scale processes such as harvest frequency, input intensity, and output intensity. As a result, current studies cannot comprehensively or objectively capture the overall level of land use intensity across different historical periods and regions. Moving forward, it is essential to develop a multi-dimensional assessment framework and methods capable of integrating diverse indicators, in order to more fully and objectively represent the overall level and spatiotemporal evolution of historical land use intensity.

4. Progress in Research on the Driving Forces of Historical Land Use Intensity Change

The conceptual development of land use intensity is rooted in the analysis of socio-economic drivers [15]. Boserup’s 1965 theory, which placed population growth at the center of agricultural intensification [48], fundamentally advanced this concept. Prior to this, progress in understanding land use intensity and its drivers was limited. This review finds that, while reconstruction work across the four dimensions has accumulated some findings, research on historical driving forces remains underdeveloped. We therefore synthesize the progress in driver analysis for each dimension, identify the dominant drivers of land use intensity change across different historical periods in China, and provide a reference for subsequent research.
Among the four dimensions, the historical reconstruction of land use types is the most methodologically mature, and the analysis of its driving forces is the most developed. These approaches can be grouped into three main types: qualitative analysis of factors influencing land type change based on historical records [39]; semi-quantitative identification of abrupt changes using reconstructed land cover trends combined with archaeological and documentary evidence [139,140]; and fully quantitative research using spatial data and methods such as multiple regression analysis [141]. In contrast, analyses of the historical driving forces behind harvest frequency, input intensity, and output intensity are methodologically constrained, relying primarily on qualitative examination of historical records [142,143,144,145].
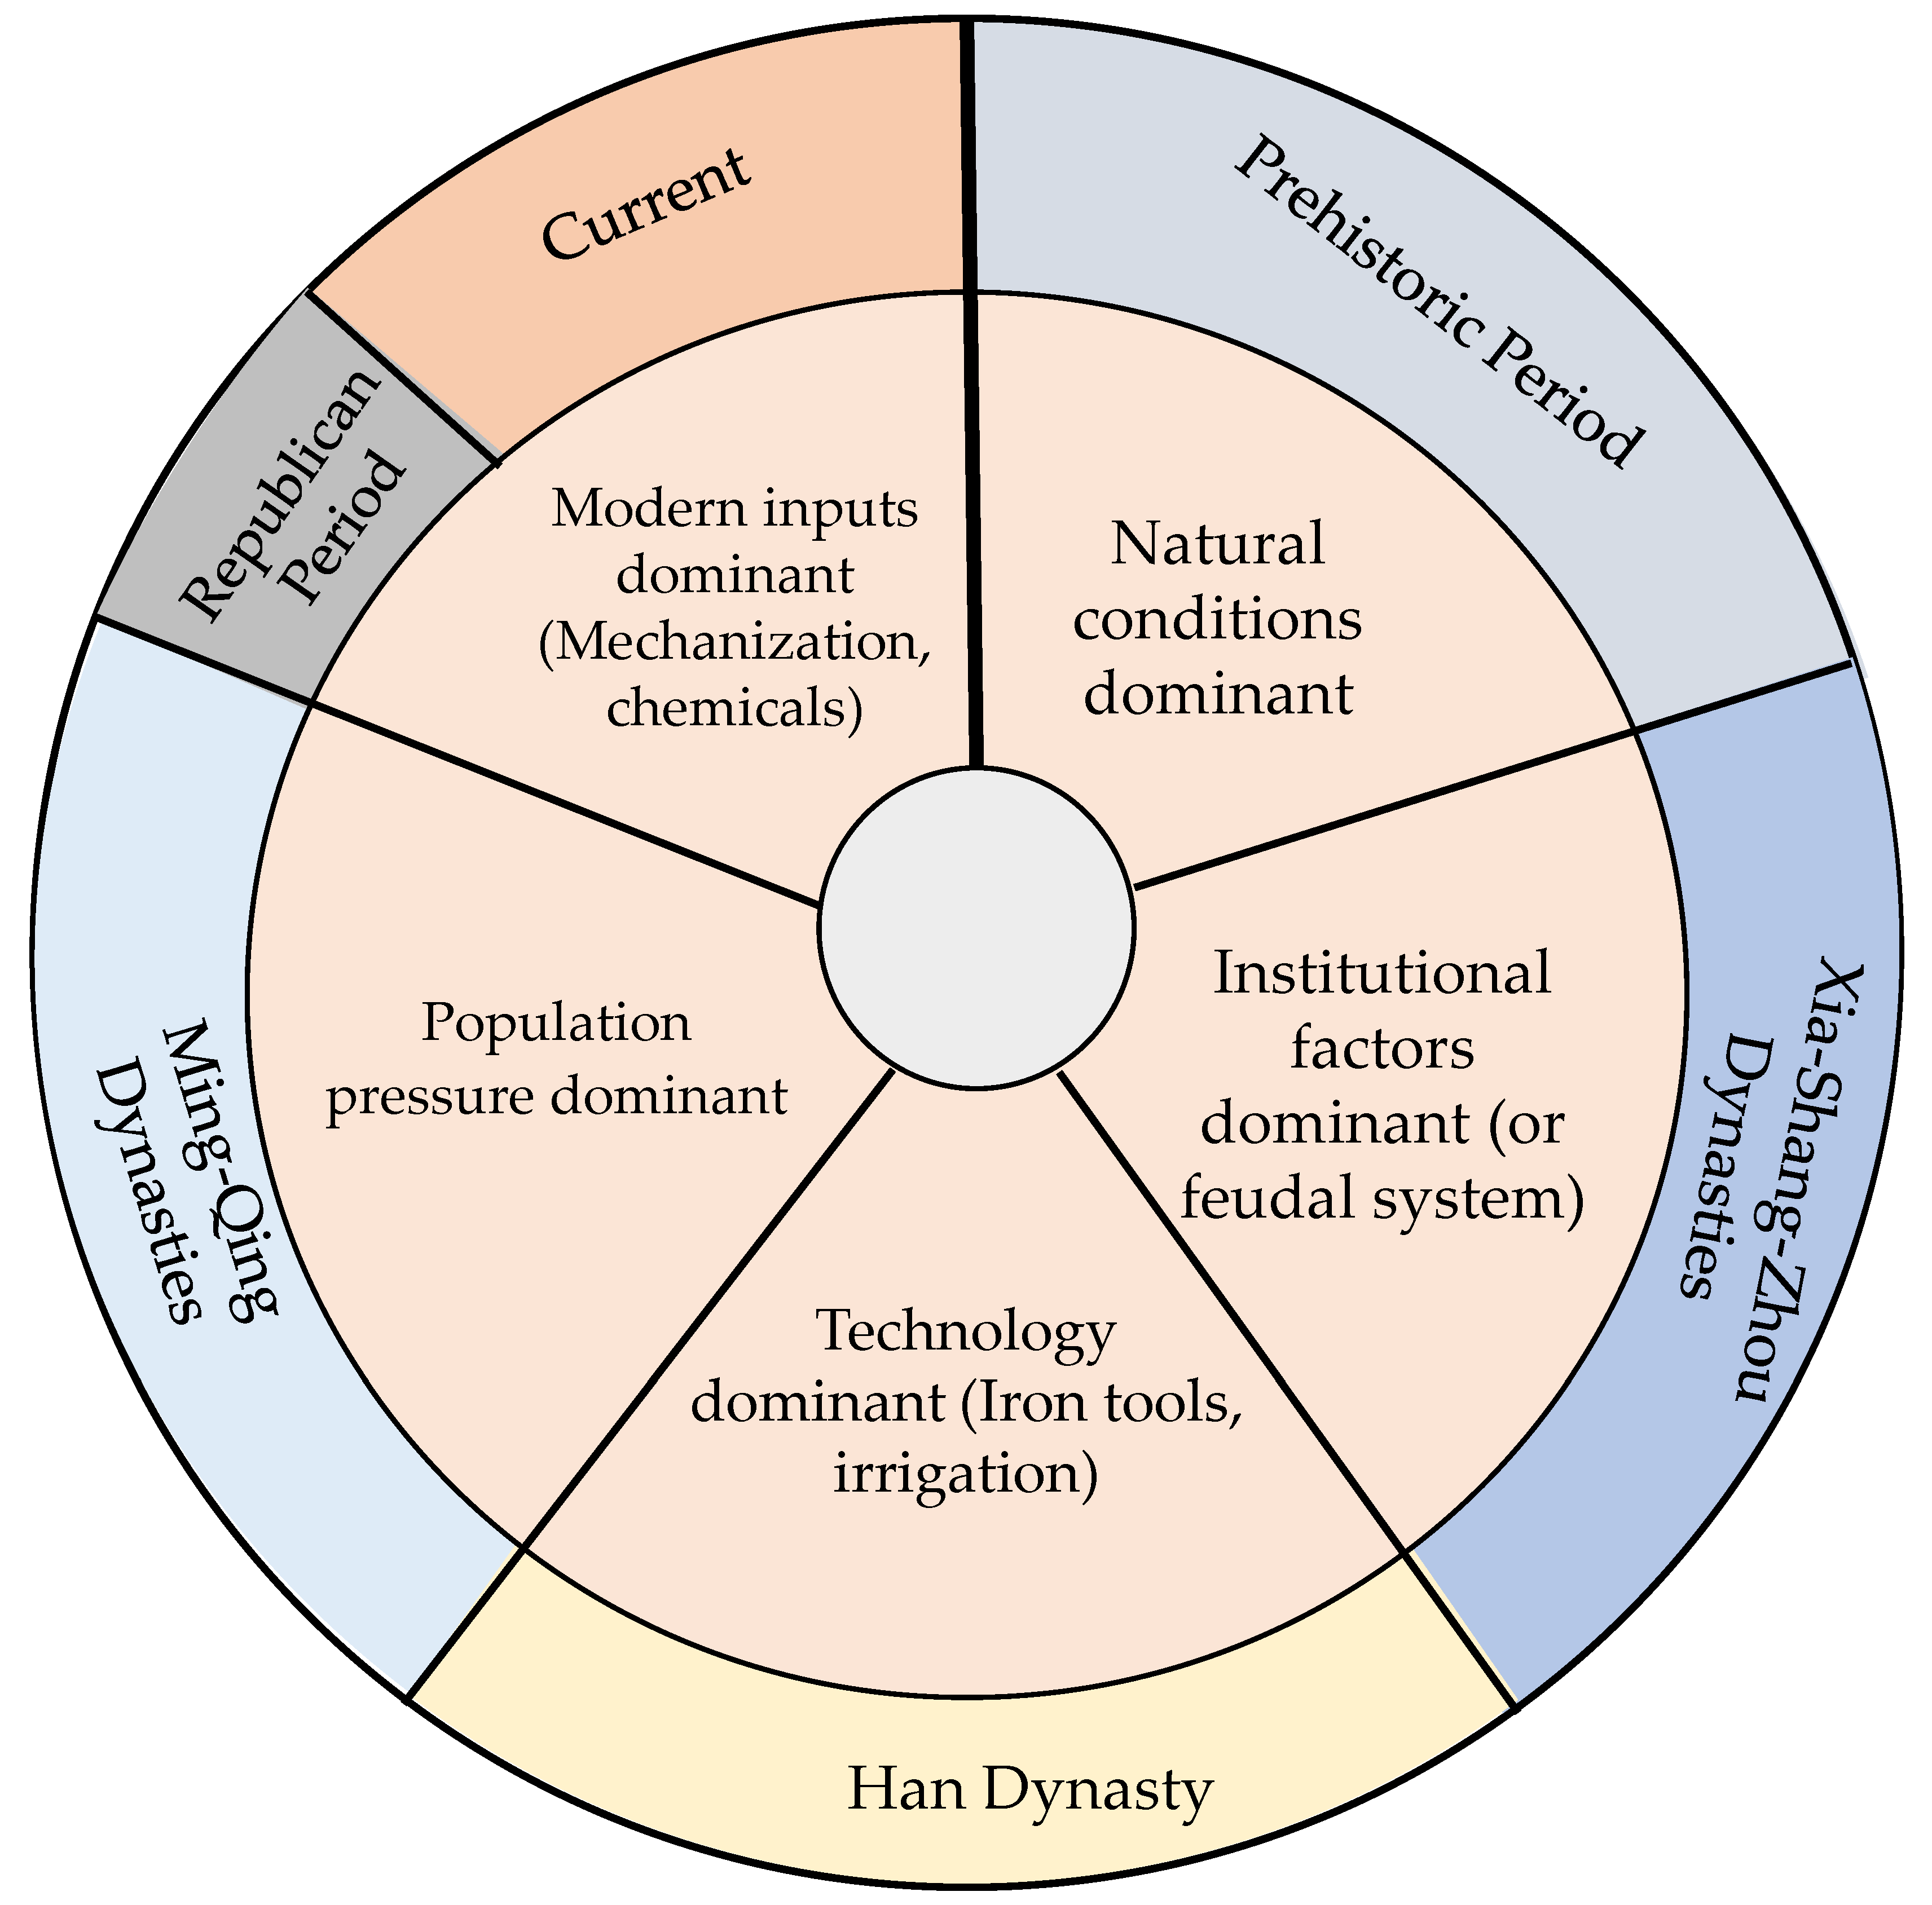
Land use intensity change is influenced by a complex set of climatic, technological, cultural, and institutional factors. As a dynamic process, it stems from their interaction, with dominant drivers shifting over time (Figure 5). This study comprehensively analyzes these factors across all dimensions to identify the principal drivers in different periods and regions, thereby deepening our understanding of historical land use change.
During the initial stage of agriculture, human land use was largely limited by natural conditions. In China, earliest agriculture emerged in the climatically suitable and flat basins of the Yellow River and Yangtze River [146]. With the establishment of feudal society during the Xia, Shang, and Zhou dynasties (2070–771 BC), agricultural land use was increasingly influenced by the feudal system on the basis of suitable natural conditions. The scope of agricultural reclamation and migration shrank, concentrating in the Yellow River Basin, but land use intensity did not increase significantly, and agriculture remained dominated by extensive cultivation with low yields per unit area [147]. After the Han Dynasty (202 BC–220 CE), despite political changes and the introduction of exotic crops from the Western Regions [148,149], the level of agricultural technology became the dominant factor influencing land use intensity. It drove the expansion of China’s agricultural area from the Yellow River Basin to the north of the Yangtze River and also extended agricultural cultivation in the south from the plains to mountainous and hilly areas [39]. Moreover, during this period, the popularization of iron tools, ox-drawn plows, and the improvement of irrigation facilities pushed Chinese agriculture toward intensive cultivation, and land use intensity increased [146]. By the Ming and Qing dynasties (1368–1912 CE), the main driving factors for the increase in agricultural land use intensity shifted again. Although climate affected crop growth [150,151], the introduction of new species promoted land use in mountainous areas [152,153], and fertilization and breeding techniques increased crop yields [154], the most important factor was the surge in population, which drove agricultural intensification [155,156]. Since the Republic of China period, agricultural production conditions have significantly improved, and the input of modern factors such as chemical fertilizers and agricultural machinery has become key to improving land use efficiency [58,157]. However, agricultural production remains constrained by natural climatic conditions, and land use intensity cannot increase without limit [64,158].
In summary, research on the driving forces behind historical land use intensity remains underdeveloped. With the exception of land use types—where driver analysis is relatively advanced—studies on harvest frequency, input intensity, and output intensity are largely qualitative. This approach lacks quantitative assessment of individual factor contributions and makes it difficult to clarify inter-factor relationships. Furthermore, even when long-term spatial datasets are available, systematic driver analysis is seldom conducted. As a result, current explanations remain descriptive and broad in scale, with limited application of spatial econometric methods to measure factor effects or account for spatial heterogeneity.

5. Prospects

In the context of global environmental change and human-nature relationships, it is essential to quantitatively reconstruct historical land use intensity, clarify its long-term evolution, and identify its driving factors. However, current research has predominantly focused on reconstructing the macro-scale patterns of land use types. Studies on the micro-level dimensions (harvest frequency, input intensity, and output intensity) are often limited to single indicators, with national-scale, multi-dimensional quantitative reconstructions remaining scarce. Furthermore, research on driving forces is largely qualitative, lacking a framework to quantitatively link intensity indicators with their drivers, and insufficiently examining multi-factor interactions.
Research on historical land use intensity is inherently interdisciplinary, drawing on diverse data sources—including ancient documents, archaeological finds, statistics, and remote sensing—and involving fields such as geography, history, ecology, and geographic information science. To overcome current limitations, integrate macro-level type changes with micro-level intensity, and advance the reconstruction and driver analysis of historical land use intensity, strengthened interdisciplinary collaboration and the integration of multi-source data and methods are necessary [136]. This will improve data accuracy and move beyond single-indicator approaches. The following sections outline prospects in three key areas: constructing an indicator system, achieving long-term spatiotemporal data reconstruction, and advancing driving force analysis.

5.1. Prospects for Constructing a Land Use Intensity Indicator System

The multidimensional nature of historical land use intensity is hampered by inconsistent data and methodologies across indicators, making single-dimensional assessments unreliable. A breakthrough requires developing an integrated system that combines macro and micro perspectives with multi-source data.
It is necessary to determine the role of historical land use type data as a macro-scale spatial framework. Existing spatial datasets of historical land use types can provide long-term, spatially explicit information on human activity ranges [31,32,33,34,35,36], establishing a unified spatial baseline for intensity assessment. At the micro-scale, cropping intensity is closely related to ancient state taxation and food security, and is systematically recorded in historical documents. It also corresponds to the modern multiple cropping index [66], thereby providing fundamental data support for research on historical land use intensity. For input intensity and output intensity, direct indicators such as fertilizer application rates and HANPP were not actually used in historical periods, so we need to seek proxies, such as the frequency of organic fertilizer application, the frequency of green manure cultivation, and population density. Because these proxies are closely related to ancient agricultural production and socio-economic activities, historical documents contain records concerning them, which can compensate for the scarcity of direct historical data. Historical Chinese agricultural texts document systematic practices of fertilization and crop rotation, indicating well-developed field management. For instance, records show that wheat cultivation in certain regions during the late Ming and early Qing periods required two fertilizer applications [159], while hemp was fertilized every ten days in the Southern Song era (1127–1279 CE), reflecting high-input practices [160]. The use of green manure is also attested, with texts describing a green manure-rice rotation system [161] and specific cycles integrating green manure with millet or vegetable cultivation [162]. Historical population records are even more abundant. Scholars have reconstructed long-term demographic datasets from these sources, providing a critical data foundation for research on historical land use intensity [31,163,164].
The land use intensity indicator system can be further refined and regionalized by incorporating location-specific proxies that reflect local environmental conditions and agricultural practices. This enhances the accuracy and representativeness of the reconstruction. For instance, in the Jiangnan agricultural region, the ratio of polders to cultivated land and pond density can capture regional differences in water management inputs, which are central to land use intensity there. Historical evidence indicates that during the Daoguang period (1820–1850 CE), polders constituted over 80% of the farmland in the Chaohu Lake Basin, underscoring the critical role of such landscape modifications in intensifying land use [165]. During the Qianlong period of the Qing Dynasty (1735–1796 CE), Pinghu County had 1129 polders, with an average of 368.26 mu of farmland per polder [166]. Fine-tuning regionalized indicators enables the historical land use intensity framework to better correspond with China’s diverse agricultural development patterns, thereby ensuring greater historical authenticity in reconstruction outcomes.

5.2. Prospects for Reconstructing Long-Term Spatiotemporal Data

To achieve the long-term spatial reconstruction of historical land use intensity in China, key challenges include fragmented data and inconsistent quantification standards across indicators. One approach to address this is historical interpolation, which estimates missing values based on trends from known data points, enabling the construction of continuous, complete time-series datasets. For example, Liu [100] used this method to estimate the grain yield per unit area during the Shang Dynasty (1600–1046 BC), providing a reference for research on early agricultural output intensity. At the same time, drawing on the data processing experiences of global datasets such as HYDE and KK10 [32,33], reasonable ranges of variation can be set for key parameters such as fertilizer application per unit area and irrigated area per unit, thereby ensuring the accuracy of quantitative reconstruction results. In spatial reconstruction, a habitability index based on natural factors can serve as a basic weighting layer to downscale aggregate administrative-unit data to grid cells. This initial allocation can then be refined by incorporating regional variables—such as pond density—to adjust the spatial distribution, thereby improving the historical plausibility of the reconstructed land-use patterns.
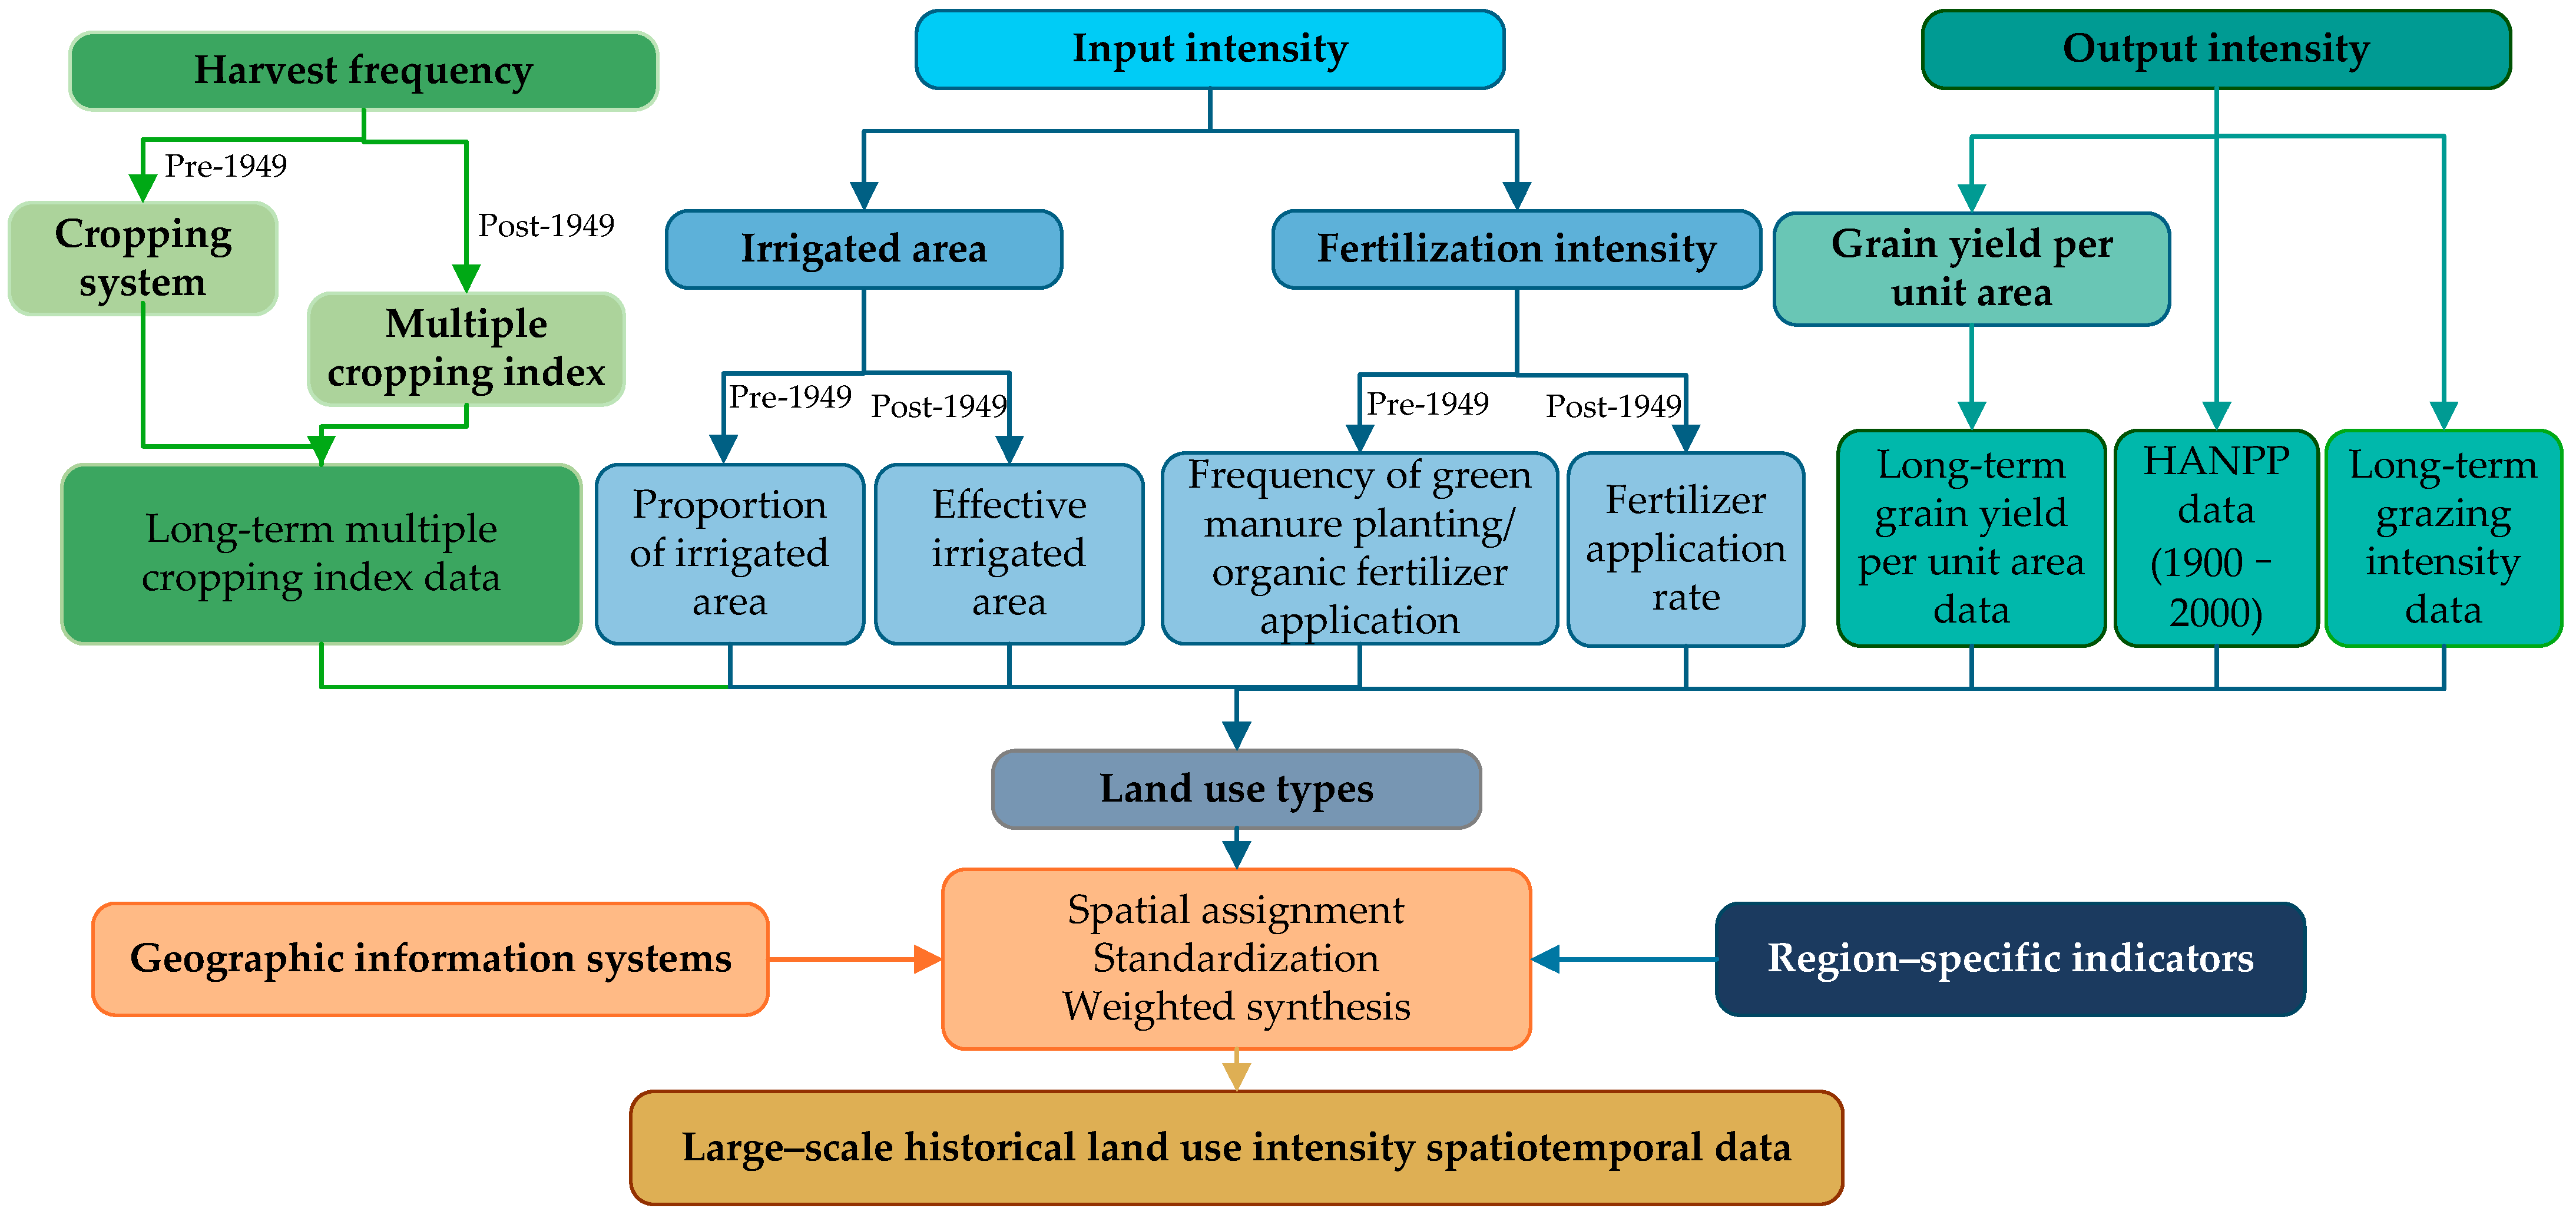
The assessment of historical land use intensity involves multiple dimensions, and the indicators of each dimension differ significantly in type, source, and structure. How to effectively integrate these dimensions and leverage their respective advantages is a key challenge in the reconstruction. Ellis et al. [37,38] established a global dataset of historical land use intensity using population density and land use types. Although this global-scale dataset has considerable uncertainty at the regional level, its methodological approach is worth learning from. Future research can build on these methods by using geographic information systems [167], taking spatial datasets of land use types as the base data, and performing spatial assignment, standardization, and weighted synthesis of various indicators for harvest frequency, input intensity, and output intensity [168]. Based on the natural conditions and agricultural production patterns of different regions, a differentiated indicator weighting system can be established, and a historical land use intensity index can be constructed through weighted integration, thereby achieving an accurate assessment of historical land use conditions across large regions in China (Figure 6).

5.3. Prospects for Analyzing Driving Forces

Building on the spatiotemporal reconstruction of historical land use intensity, the next critical step is to quantitatively identify its dominant driving factors across different periods. This is essential for understanding the long-term mechanisms of human environmental impact. Achieving this requires constructing a computable, integrated analytical framework capable of revealing the relative influence and spatiotemporal evolution of various natural and socio-economic factors.
To this end, a standardized, long-term database of driving factors must be developed. This involves systematically collating and integrating historical data, such as population density for demographic drivers, and annual accumulated temperature and precipitation for natural drivers. These have already been reconstructed as long-term datasets by previous scholars [31,32,169], providing a data foundation for quantitative research. For factors that are difficult to quantify, such as institutions and policies, we may use proxies such as tax records, transforming them into long-term quantitative data to study the impact of institutional changes on land use change. Furthermore, in data processing, we must ensure that the spatiotemporal resolution and coverage of each driving factor dataset are consistent with the reconstructed results of land use intensity, to facilitate subsequent quantitative analysis between the two. Regarding the methods for analyzing the relationship between driving factors and land use intensity, we can draw on findings from modern land use intensity studies. Based on GIS, we can perform correlation analysis between land use intensity data and quantitative data of various driving factors within a unified spatiotemporal grid. For instance, Xu et al. [170] used regression and spatial analysis to quantitatively examine the relationships between population density, temperature, precipitation, and land use intensity at the county level in China from 2000 to 2010, identifying the significance levels of each factor. Song et al. [171] applied geographic detectors and geographically weighted regression models to integrate quantitative driving factor data with spatial distribution data of land use intensity, providing methodological references for studying the spatial heterogeneity of driving forces in historical periods.
The application of spatiotemporal big data mining and machine learning can address the fragmentation of historical materials by automating multi-source data extraction, standardizing indicators, and uncovering complex nonlinear relationships. This helps overcome traditional methodological limits in modeling synergistic drivers, thereby transitioning the field from qualitative description to intelligent, high-precision quantitative analysis.

6. Conclusions

This review synthesizes research on reconstructing historical land use intensity in China, a region central to understanding long-term human–environment interactions. Analysis across four dimensions—land use type, harvest frequency, input intensity, and output intensity—reveals a significant development imbalance. Reconstructions of land-use types are most advanced, while quantifying historical input intensity remains the weakest. Furthermore, studies on driving forces are predominantly qualitative, lacking integrated quantitative frameworks. Key challenges include fragmented historical data, biases in global datasets when applied to China, and methodologies that often produce administrative-level averages incapable of capturing fine-scale spatial heterogeneity.
To advance the field, future work must: (1) build integrated multi-source databases; (2) develop standardized, multi-dimensional reconstruction indices; (3) apply spatial analysis and machine learning to quantify drivers; and (4) strengthen interdisciplinary collaboration. By promoting a shift from area to intensity reconstruction and from single-indicator to comprehensive assessment, this work aims to integrate China’s long-term land-use reconstruction insights into global land system science, support attribution research on global climate change, and inform the differentiation of historical responsibilities for carbon emission reductions across nations and regions.

Author Contributions

Conceptualization, S.L. and F.G.; methodology, F.G.; software, F.G., H.H. and Y.Q.; validation, F.G.; formal analysis, F.G.; investigation, F.G.; resources, F.G., Y.Q. and M.L.; data curation, F.G. and Y.Q.; writing—original draft preparation, F.G.; writing—review and editing, S.L. and H.H.; visualization, F.G.; supervision, S.L.; project administration, S.L.; funding acquisition, S.L. All authors have read and agreed to the published version of the manuscript.

Funding

This research was funded by the National Natural Science Foundation of China, grant numbers 42371260 and 42307562.

Data Availability Statement

Data sharing is not applicable.

Conflicts of Interest

The authors declare no conflicts of interest.

Abbreviations

The following abbreviations are used in this manuscript:
NPPNet Primary Productivity
HANPPHuman Appropriation of Net Primary Production

References

  1. Flint, E.P.; Richards, J.F. Historical Analysis of Changes in Land Use and Carbon Stock of Vegetation in South and Southeast Asia. Can. J. For. Res. 1991, 21, 91–110. [Google Scholar] [CrossRef] [Scilit]
  2. Yang, F.; He, F.; Li, S.; Li, M.; Wu, P. A New Estimation of Carbon Emissions from Land Use and Land Cover Change in China over the Past 300 Years. Sci. Total Environ. 2023, 863, 160963. [Google Scholar] [CrossRef] [Scilit] [PubMed]
  3. Bourgeon, G.; Nair, K.M.; Ramesh, B.R.; Seen, D.L. Consequences of Underestimating Ancient Deforestation in South India for Global Assessments of Climatic Change. Curr. Sci. 2012, 102, 1699–1703. [Google Scholar]
  4. Foley, J.A.; DeFries, R.; Asner, G.P.; Barford, C.; Bonan, G.; Carpenter, S.R.; Chapin, F.S.; Coe, M.T.; Daily, G.C.; Gibbs, H.K.; et al. Global Consequences of Land Use. Science 2005, 309, 570–574. [Google Scholar] [CrossRef] [Scilit]
  5. Pereira, H.M.; Navarro, L.M.; Martins, I.S. Global Biodiversity Change: The Bad, the Good, and the Unknown. Annu. Rev. Environ. Resour. 2012, 37, 25–50. [Google Scholar] [CrossRef] [Scilit]
  6. Tang, T.; Ge, J.; Shi, H.; Wang, L.; Cao, J.; Lee, X. Drought Frequency, Intensity, and Exposure Have Increased Due to Historical Land Use and Land Cover Changes. Commun. Earth Environ. 2025, 6, 398. [Google Scholar] [CrossRef] [Scilit]
  7. Pongratz, J.; Caldeira, K. Attribution of Atmospheric CO2 and Temperature Increases to Regions: Importance of Preindustrial Land Use Change. Environ. Res. Lett. 2012, 7, 034001. [Google Scholar] [CrossRef] [Scilit]
  8. Gaillard, M.-J.; Sugita, S.; Mazier, F.; Trondman, A.-K.; Broström, A.; Hickler, T.; Kaplan, J.O.; Kjellström, E.; Kokfelt, U.; Kuneš, P.; et al. Holocene Land-Cover Reconstructions for Studies on Land Cover-Climate Feedbacks. Clim. Past. 2010, 6, 483–499. [Google Scholar] [CrossRef] [Scilit]
  9. Li, S.; Gao, D.; Zhao, Z.; Hua, L. Croplands in Canada over the Past Millennium: A Geographically Explicit Reconstruction. Sci. China Earth Sci. 2025, 68, 1612–1623. [Google Scholar] [CrossRef] [Scilit]
  10. Lambin, E.F.; Meyfroidt, P. Global Land Use Change, Economic Globalization, and the Looming Land Scarcity. Proc. Natl. Acad. Sci. USA 2011, 108, 3465–3472. [Google Scholar] [CrossRef] [Scilit]
  11. Grau, H.R.; Aide, M. Globalization and Land-Use Transitions in Latin America. Ecol. Soc. 2008, 13, art16. [Google Scholar] [CrossRef] [Scilit]
  12. Allan, E.; Bossdorf, O.; Dormann, C.F.; Prati, D.; Gossner, M.M.; Tscharntke, T.; Blüthgen, N.; Bellach, M.; Birkhofer, K.; Boch, S.; et al. Interannual Variation in Land-Use Intensity Enhances Grassland Multidiversity. Proc. Natl. Acad. Sci. USA 2014, 111, 308–313. [Google Scholar] [CrossRef] [Scilit] [PubMed]
  13. Erb, K.-H.; Kastner, T.; Luyssaert, S.; Houghton, R.A.; Kuemmerle, T.; Olofsson, P.; Haberl, H. Bias in the Attribution of Forest Carbon Sinks. Nat. Clim. Change 2013, 3, 854–856. [Google Scholar] [CrossRef] [Scilit]
  14. Luyssaert, S.; Jammet, M.; Stoy, P.C.; Estel, S.; Pongratz, J.; Ceschia, E.; Churkina, G.; Don, A.; Erb, K.; Ferlicoq, M.; et al. Land Management and Land-Cover Change Have Impacts of Similar Magnitude on Surface Temperature. Nat. Clim. Change 2014, 4, 389–393. [Google Scholar] [CrossRef] [Scilit]
  15. Sun, F.; Zhang, Z.; Zuo, L.; Zhao, X.; Pan, T.; Zhu, Z.; Wang, X.; Liu, Y.; Wen, Q.; Hu, S.; et al. Current bottlenecks and prospects of the land use intensity. Pratacultural Sci. 2020, 37, 1259. [Google Scholar] [CrossRef]
  16. Wei, Y. Origin, Evolution and Spread of Crop Buckwheat. Sci. Agric. Sin. 2025, 58, 4305. [Google Scholar] [CrossRef]
  17. Wang, Z.; Ji, Z. Inheriting traditional Chinese organic agriculture and developing China’s ecological agriculture. Anc. Mod. Agric. 1995, 2, 1–10. [Google Scholar]
  18. Jiang, L. Coordinate of Qiantang River for Tracing the Origins of Yangtze River Civilization. Yangtze River Cult. Stud. 2025, 100–112. [Google Scholar]
  19. Huang, X.; Zhang, J.; Ren, L.; Zhang, S.; Chen, F. Intensification and Driving Forces of Pastoralism in Northern China 5.7 Ka Ago. Geophys. Res. Lett. 2021, 48, e2020GL092288. [Google Scholar] [CrossRef] [Scilit]
  20. Li, G. Some Issues in Ancient Chinese Farming Systems. Anc. Mod. Agric. 1989, 1, 1–7. [Google Scholar]
  21. Ren, W.; Liu, C.; Qin, F.; Li, Q.; Yi, G.; Chen, J.; Zhao, Y. Pastoral Intensification and Peatland Drying in the Northern Tianshan Since 1560: Evidence from Fungal Spore Indicators. Land 2025, 14, 1362. [Google Scholar] [CrossRef] [Scilit]
  22. Zhang, X.; Wang, F.; Zheng, J.; Li, S.; Ge, Q. Parameterizations of Human Activities in Paleoclimate Modeling: Current Status and Future Perspectives. Sci. China Earth Sci. 2026, 69, 1592–1604. [Google Scholar] [CrossRef] [Scilit]
  23. Tang, Y.; Sun, S.; Mo, F.; Crowther, T.W.; Yin, Y.; Zhao, J.; Wang, Y.; Wu, P. Cropping Pattern Switching Induces Disturbances in Spatiotemporal Greenhouse Gas Emissions and Water Demand. Eur. J. Agron. 2025, 170, 127734. [Google Scholar] [CrossRef] [Scilit]
  24. Fang, X.; Ye, Y.; Zhang, C.; Tang, C. Cropland cover change and its environmental impacts in the history of China. J. Palaeogeogr. (Chin. Ed.) 2019, 21, 160–174. [Google Scholar]
  25. He, F.; Li, M.; Yang, F. Main Progress in Historical Land Use and Land Cover Change in China during the Past 70 Years. J. Chin. Hist. Geogr. 2019, 34, 5–16. [Google Scholar]
  26. Wang, J.; Lin, Y.; Glendinning, A.; Xu, Y. Land-Use Changes and Land Policies Evolution in China’s Urbanization Processes. Land Use Policy 2018, 75, 375–387. [Google Scholar] [CrossRef] [Scilit]
  27. Ge, Q.; Dai, J.; He, F.; Zheng, J.; Man, Z.; Zhao, Y. Spatiotemporal Dynamics of Reclamation and Cultivation and Its Driving Factors in Parts of China during the Last Three Centuries. Prog. Nat. Sci. 2004, 14, 605–613. [Google Scholar] [CrossRef] [Scilit]
  28. Skaloš, J.; Weber, M.; Lipský, Z.; Trpáková, I.; Šantrůčková, M.; Uhlířová, L.; Kukla, P. Using Old Military Survey Maps and Orthophotograph Maps to Analyse Long-Term Land Cover Changes—Case Study (Czech Republic). Appl. Geogr. 2011, 31, 426–438. [Google Scholar] [CrossRef] [Scilit]
  29. Li, J.; Xu, Q.; Gaillard-Lemdahl, M.-J.; Seppä, H.; Li, Y.; Hun, L.; Li, M. Modern Pollen and Land-Use Relationships in the Taihang Mountains, Hebei Province, Northern China—A First Step towards Quantitative Reconstruction of Human-Induced Land Cover Changes. Veget. Hist. Archaeobot. 2013, 22, 463–477. [Google Scholar] [CrossRef] [Scilit]
  30. Wan, Z.; Yuan, B.; Wu, H.; Liu, L.; Zeng, J.; He, X. Dynamic Evolution of Century-Scale Land Use and Landscape Pattern Coupled with Historical Topographic Maps under AWCA-Markov Framework. CATENA 2025, 261, 109565. [Google Scholar] [CrossRef] [Scilit]
  31. Klein Goldewijk, K.; Beusen, A.; Van Drecht, G.; De Vos, M. The HYDE 3.1 Spatially Explicit Database of Human-induced Global Land-use Change over the Past 12,000 Years. Glob. Ecol. Biogeogr. 2011, 20, 73–86. [Google Scholar] [CrossRef] [Scilit]
  32. Klein Goldewijk, K.; Beusen, A.; Doelman, J.; Stehfest, E. Anthropogenic Land Use Estimates for the Holocene—HYDE 3.2. Earth Syst. Sci. Data 2017, 9, 927–953. [Google Scholar] [CrossRef] [Scilit]
  33. Kaplan, J.O.; Krumhardt, K.M.; Ellis, E.C.; Ruddiman, W.F.; Lemmen, C.; Goldewijk, K.K. Holocene Carbon Emissions as a Result of Anthropogenic Land Cover Change. Holocene 2011, 21, 775–791. [Google Scholar] [CrossRef] [Scilit]
  34. Kaplan, J.O.; Krumhardt, K.M.; Zimmermann, N. The Prehistoric and Preindustrial Deforestation of Europe. Quat. Sci. Rev. 2009, 28, 3016–3034. [Google Scholar] [CrossRef] [Scilit]
  35. He, F.; Yang, F.; Wang, Y. Reconstructing forest and grassland cover changes in China over the past millennium. Sci. China Earth Sci. 2025, 55, 95–110. [Google Scholar] [CrossRef] [Scilit]
  36. He, F.; Yang, F.; Zhao, C.; Li, S.; Li, M. Spatially explicit reconstruction of cropland cover for China over the past millennium. Sci. China Earth Sci. 2023, 53, 115–131. [Google Scholar] [CrossRef] [Scilit]
  37. Ellis, E.C.; Klein Goldewijk, K.; Siebert, S.; Lightman, D.; Ramankutty, N. Anthropogenic Transformation of the Biomes, 1700 to 2000. Glob. Ecol. Biogeogr. 2010, 19, 589–606. [Google Scholar] [CrossRef] [Scilit]
  38. Ellis, E.C.; Beusen, A.H.W.; Goldewijk, K.K. Anthropogenic Biomes: 10,000 BCE to 2015 CE. Land 2020, 9, 129. [Google Scholar] [CrossRef] [Scilit]
  39. Fang, X.; He, F.; Wu, Z.; Zheng, J. General characteristics of the agricultural area and fractional cropland cover changes in China for the past 2000 years. Acta Geogr. Sin. 2021, 76, 1732. [Google Scholar] [CrossRef]
  40. He, F.; Ge, Q.; Zheng, J. The Urban Land Area Change in China from 1820 to 1999. J. Geogr. Sci. 2002, 12, 427–434. [Google Scholar] [CrossRef] [Scilit]
  41. Wan, Z.; Wu, H. Spatial Utilization of Historical Topographic Map and Its Application in Land Reconstruction of Ancient Chinese Urban Land Use. Sci. Rep. 2024, 14, 11547. [Google Scholar] [CrossRef] [Scilit] [PubMed]
  42. Li, X.; Zhou, Y.; Hejazi, M.; Wise, M.; Vernon, C.; Iyer, G.; Chen, W. Global Urban Growth between 1870 and 2100 from Integrated High Resolution Mapped Data and Urban Dynamic Modeling. Commun. Earth Environ. 2021, 2, 201. [Google Scholar] [CrossRef] [Scilit]
  43. Zhuang, H.; Liu, X.; Li, B.; Wu, C.; Yan, Y.; Zeng, L.; Zheng, C. Mapping High-Resolution Global Gridded Population Distribution from 1870 to 2100. Sci. Total Environ. 2024, 955, 176867. [Google Scholar] [CrossRef] [Scilit]
  44. Miao, Y.; Liu, J.; Wang, R.Y. Occupation of Cultivated Land for Urban–Rural Expansion in China: Evidence from National Land Survey 1996–2006. Land 2021, 10, 1378. [Google Scholar] [CrossRef] [Scilit]
  45. Liu, L.; Kang, S.; Xiong, X.; Qin, Y.; Wang, J.; Liu, Z.; Xiao, X. Cropping Intensity Map of China with 10 m Spatial Resolution from Analyses of Time-Series Landsat-7/8 and Sentinel-2 Images. Int. J. Appl. Earth Obs. Geoinf. 2023, 124, 103504. [Google Scholar] [CrossRef] [Scilit]
  46. Liu, X.; Han, X. China’s Farming System Regionalizati; The University of Beijing Agricultural Press: Beijing, China, 1993; ISBN 978-7-109-02129-7. [Google Scholar]
  47. Chaianov, A.V.; Thorner, D.; Kerblay, B.H.; Smith, R.E.F. A.V. Chayanov on the Theory of Peasant Economy; The University of Wisconsin Press: Madison, WI, USA, 1986; ISBN 978-0-299-10574-7. [Google Scholar]
  48. Boserup, E. The Conditions of Agricultural Growth: The Economics of Agrarian Change Under Population Pressure; Reprint; Earthscan Publishing: London, UK, 2002; ISBN 978-1-85383-159-1. [Google Scholar]
  49. Hu, Z. On the Relationship between Agricultural Cultural Relics and the Study of Agricultural History. Anc. Mod. Agric. 2021, 2, 105–114. [Google Scholar]
  50. You, X. The Origin and Spread of Millets. Agric. Hist. China 1993, 3, 1–13. [Google Scholar]
  51. Guo, W. The Farming System of Primitive Agriculture in China. Agric. Hist. China 1991, 32–36. [Google Scholar]
  52. Han, M. Ancient Chinese Crop Planting System. Agric. Hist. China 2000, 91–99, 64. [Google Scholar]
  53. Xia, W. Reflections on Several Issues in the Development of Agriculture in Suzhou during the Mid-to-Late Ming Dynasty. Agric. Hist. China 1996, 49–58. [Google Scholar]
  54. Wang, J. Grain Production and Grain Shortage Issues in the Taihu Lake Basin during the Ming Dynasty. J. Chin. Hist. Geogr. 1998, 121–136, 2. [Google Scholar]
  55. Zhang, G.; Mei, L. Population Changes and the Development of Agricultural Economy in the Jianghan–Dongting Plain during the Ming and Qing Periods. J. Chin. Hist. Geogr. 1989, 97–113. [Google Scholar]
  56. Wu, Y. The Flood and Drought Calamities and Crops Plant of Huizhou Area in Ming Dynasties. Anc. Mod. Agric. 2007, 55–65. [Google Scholar]
  57. Min, Z. On the Agricultural Achievement in Qing Dynasty. Agric. Hist. China 2005, 60–66. [Google Scholar]
  58. Li, S.; Liu, Y.; Li, J.; Zhang, X. Mapping Cropping Patterns in the North China Plain over the Past 300 Years and an Analysis of the Drivers of Change. J. Geogr. Sci. 2024, 34, 2074–2088. [Google Scholar] [CrossRef] [Scilit]
  59. Zhu, X. A Methodology for Multiple Cropping Index Extraction Based on NDVI Time-Series. J. Nat. Resour. 2008, 23, 534. [Google Scholar] [CrossRef]
  60. Ge, Z.; Huang, J.; Lai, P.; Hao, B.; Zhao, Y.; Ma, M. Research progress on remote sensing monitoring of cultivated land cropping intensity. J. Geo-Inf. Sci. 2021, 23, 1169–1184. [Google Scholar] [CrossRef]
  61. Huang, G. On the Increase of Multiple Cropping Index of Cultivated Land in Southern China. Resour. Sci. 1995, 30–37. [Google Scholar]
  62. Guo, B. The Analysis for the Change of Multiple Cropping Index in China. Econ. Geogr. 1997, 8–13. [Google Scholar] [CrossRef]
  63. Tan, L. Discussion on Farming Techniques of Crops in Han Dynasty. J. Anhui Agric. Sci. 2010, 38, 2204–2205. [Google Scholar] [CrossRef]
  64. Liu, X. On the Potential of China’s Arable Land Planting Index (Multiple Cropping). Crops 1997, 1–3. [Google Scholar] [CrossRef]
  65. Xiao, L.; Yan, J. Reconstruction of poor/bumper autumn harvest index series based on historical chorography and its relationship with climate changein North China from 1736 to 1911. Acta Geogr. Sin. 2019, 74, 1777–1788. [Google Scholar] [CrossRef]
  66. Zhu, H.; Tian, H.; Lou, J. An Analysis on the Prospects and Threshold of Operation Scale of Family Farm in China. J. China Agric. Univ. (Soc. Sci.) 2016, 33, 65–73. [Google Scholar] [CrossRef]
  67. Li, X.; Zhu, H.; Tan, M.; Xin, L. Measurement of Land Use Intensity. Prog. Geogr. 2008, 12–17. [Google Scholar]
  68. Dullinger, I.; Essl, F.; Moser, D.; Erb, K.; Haberl, H.; Dullinger, S. Biodiversity Models Need to Represent Land-use Intensity More Comprehensively. Glob. Ecol. Biogeogr. 2021, 30, 924–932. [Google Scholar] [CrossRef] [Scilit]
  69. Zhang, W.; Li, H.; Huo, X.; Sun, D.; Zhou, L. Agricultural land use intensity based on emergy analysis. Trans. Chin. Soc. Agric. Eng. 2009, 25, 204–210. [Google Scholar]
  70. Siebert, S.; Kummu, M.; Porkka, M.; Döll, P.; Ramankutty, N.; Scanlon, B.R. A Global Data Set of the Extent of Irrigated Land from 1900 to 2005. Hydrol. Earth Syst. Sci. 2015, 19, 1521–1545. [Google Scholar] [CrossRef] [Scilit]
  71. Freydank, K.; Siebert, S. Towards Mapping the Extent of Irrigation in the Last Century: Time Series of Irrigated Area per Country; University of Frankfurt: Frankfurt am Main, Germany, 2008. [Google Scholar]
  72. Li, J.; Li, S.; Liu, Y.; Zhang, X. Reconstruction of the change of historical irrigated cropland in China’s central plains agricultural region:A case study of the north of Anyang City in Henan Province. Prog. Geogr. 2025, 44, 853–865. [Google Scholar] [CrossRef] [Scilit]
  73. Ludemann, C.I.; Wanner, N.; Chivenge, P.; Dobermann, A.; Einarsson, R.; Grassini, P.; Gruere, A.; Jackson, K.; Lassaletta, L.; Maggi, F.; et al. A Global FAOSTAT Reference Database of Cropland Nutrient Budgets and Nutrient Use Efficiency (1961–2020): Nitrogen, Phosphorus and Potassium. Earth Syst. Sci. Data 2024, 16, 525–541. [Google Scholar] [CrossRef] [Scilit]
  74. Nishina, K.; Ito, A.; Hanasaki, N.; Hayashi, S. Reconstruction of Spatially Detailed Global Map of NH4+ and NO3 Application in Synthetic Nitrogen Fertilizer. Earth Syst. Sci. Data 2017, 9, 149–162. [Google Scholar] [CrossRef] [Scilit]
  75. Lu, C.; Tian, H. Global Nitrogen and Phosphorus Fertilizer Use for Agriculture Production in the Past Half Century: Shifted Hot Spots and Nutrient Imbalance. Earth Syst. Sci. Data 2017, 9, 181–192. [Google Scholar] [CrossRef] [Scilit]
  76. Bouwman, L.; Goldewijk, K.K.; Van Der Hoek, K.W.; Beusen, A.H.W.; Van Vuuren, D.P.; Willems, J.; Rufino, M.C.; Stehfest, E. Exploring Global Changes in Nitrogen and Phosphorus Cycles in Agriculture Induced by Livestock Production over the 1900–2050 Period. Proc. Natl. Acad. Sci. USA 2013, 110, 20882–20887. [Google Scholar] [CrossRef] [Scilit]
  77. Zhang, B.; Tian, H.; Lu, C.; Dangal, S.R.S.; Yang, J.; Pan, S. Global Manure Nitrogen Production and Application in Cropland during 1860–2014: A 5 Arcmin Gridded Global Dataset for Earth System Modeling. Earth Syst. Sci. Data 2017, 9, 667–678. [Google Scholar] [CrossRef] [Scilit]
  78. Qing, C.; Zhang, J. The Rise and Fall of Jingqu and the Uncertainty of Guanzhong Irrigation Area Since Song and Yuan Dynasties: Centering on the”Jingqu Map” of the Past Dynasties. Agric. Hist. China 2024, 43, 117–131. [Google Scholar]
  79. Zhang, H.; Chai, J.; Li, Z.; Li, H.; Gibson, J.; Kumar, P.; Jin, G. Global effects of progress towards SDGs on steeply sloped land use and land cover. Fundam. Res. 2025. [Google Scholar] [CrossRef] [Scilit]
  80. Du, X.-H.; Song, Y.-M.; Cai, J.-A.; Zhu, Y.-G. Utilization of Human Excrement in Pre-Modern China, Its Theoretical Interpretations and Ecological Significance. Soil Ecol. Lett. 2024, 6, 240226. [Google Scholar] [CrossRef] [Scilit]
  81. Nagy, J.; Zseni, A.; Tóth, A.J. The Utilization of Human Excreta and Human Urine in the Agriculture as a Fertilizer. In Proceedings of the Architecture, Engineering and Technologies (AET), 3rd ed.; IEREK: Cairo, Egypt, 2019. [Google Scholar]
  82. Zhang, M.; Bi, J. Spatial Differences and Pattern Evolution of Urban Land Economic Density of the Yangtze River Delta Urban Agglomeration. J. Manag. 2020, 33, 17–26. [Google Scholar] [CrossRef]
  83. Li, W.; Xue, C.; Yao, S.; Zhu, R. Conservation tillage, cropping systems and land productivity for households on the Loess Plateau. Resour. Sci. 2017, 39, 1259–1271. [Google Scholar] [CrossRef] [Scilit]
  84. Shriar, A.J. Agricultural intensity and its measurement in frontier regions. Agrofor. Syst. 2000, 49, 301–318. [Google Scholar] [CrossRef] [Scilit]
  85. Netting, R.M. Smallholders, Householders: Farm Families and the Ecology of Intensive, Sustainable Agriculture; Stanford University Press: Stanford, CA, USA, 1995; ISBN 978-0-8047-2061-8. [Google Scholar]
  86. Yu, Y. A Study on the Average Grain Yield per Mu in Various Dynasties of China. J. Chongqing Norm. Univ. (Ed. Soc. Sci.) 1980, 3, 8–20. [Google Scholar]
  87. Zhang, L.; Zou, L. Discussion on Grain Production Level during the Emperor Wen and Jing in West Han Dynasty. Anc. Mod. Agric. 2015, 22–30. [Google Scholar]
  88. Chen, X. An Analysis of Grain Yield per unit area in the Yuan Dynasty. Hist. Res. 1995, 175–180. [Google Scholar]
  89. Wu, H. Based on the farming records, understand the grain yield per unit area in the early Qing period. Agric. Hist. China 1993, 20–27. [Google Scholar]
  90. Shi, Z. Estimates of Cultivated Land Area and Grain Output in the Early Qing Dynasty. Res. Chin. Econ. Hist. 1989, 47–62. [Google Scholar]
  91. Xie, Y.; Liu, J. Impacts of Climate on Grain Output Per Unit Area in China during the Year OF 1949~1992. J. Nat. Resour. 1997, 26–31. [Google Scholar]
  92. Dang, A.; Yan, S. A Study on the Temporal Changes of Grain Yield per Unit Area in China since the Founding of the Nation. China Rural. Surv. 1998, 9–13. [Google Scholar] [CrossRef]
  93. Wang, Y.; Li, J.; Wang, X. Change Law and Trend of Grain Production in China Since the Founding of the People’s Republic of China. J. Agric. Sci. Technol. 2021, 23, 1–11. [Google Scholar] [CrossRef]
  94. Tang, K.; Wang, J.; Chen, Z. The Impact of Farm Household Cultivated Land Operation Scale on Grain Yield and Production Costs: An Empirical Study Based on Different Periods and Regions. J. Manag. World 2017, 79–91. [Google Scholar] [CrossRef]
  95. Li, M.; He, F.; Yang, F.; Hao, R. Per Capita Cropland Estimations for Traditional Agricultural Areas of China over Past Millennium. Land 2024, 13, 1122. [Google Scholar] [CrossRef] [Scilit]
  96. Klein Goldewijk, K.; Dekker, S.C.; Van Zanden, J.L. Per-Capita Estimations of Long-Term Historical Land Use and the Consequences for Global Change Research. J. Land Use Sci. 2017, 12, 313–337. [Google Scholar] [CrossRef] [Scilit]
  97. Wu, H. A Study on Grain Yield per Unit Area in Chinese History (Revised and Expanded Edition); China Agriculture Press: Beijing, China, 2016; ISBN 978-7-109-22089-8. [Google Scholar]
  98. Pu, F. Assessment on the Level of Food Security in Traditional Agriculture Period of China. Agric. Hist. China 2007, 4, 19–30. [Google Scholar]
  99. Wu, Z. On the Surplus of Agricultural Labor in China. Financ. Econ. 1992, 11, 61–66. [Google Scholar]
  100. Liu, X. On the Development of Agriculture in the Shang Dynasty. Agric. Hist. China 1995, 14–24. [Google Scholar]
  101. Zheng, Z.; Kuang, J.; Chen, Y.; Chen, J.; Meng, X.; Ling, Z. A Review on Modeling Net Primar Productivity of Vegetation. J. Guangzhou Univ. (Nat. Sci. Ed.) 2024, 23, 13–24. [Google Scholar]
  102. Imhoff, M.L.; Bounoua, L.; DeFries, R.; Lawrence, W.T.; Stutzer, D.; Tucker, C.J.; Ricketts, T. The Consequences of Urban Land Transformation on Net Primary Productivity in the United States. Remote Sens. Environ. 2004, 89, 434–443. [Google Scholar] [CrossRef] [Scilit]
  103. Running, S.W. A Measurable Planetary Boundary for the Biosphere. Science 2012, 337, 1458–1459. [Google Scholar] [CrossRef] [Scilit]
  104. Li, Z.; Liu, G.; Wu, X. Reconstruction of Net Primary Productivity of Forests in Abies Faxoniana Forests in the Minjiang River Area, Miaoli, Western Sichuan over the Past 223 Years. Quat. Sci. 2014, 34, 830–847. [Google Scholar]
  105. Yang, Y.; Hua, Y.; Zhang, Q.; Wang, F. Reconstructing Net Primary Productivity in Northern Greater Khingan Range Using Tree Rings. Plants 2025, 14, 2768. [Google Scholar] [CrossRef] [Scilit]
  106. Haberl, H.; Erb, K.-H.; Krausmann, F. Human Appropriation of Net Primary Production: Patterns, Trends, and Planetary Boundaries. Annu. Rev. Environ. Resour. 2014, 39, 363–391. [Google Scholar] [CrossRef] [Scilit]
  107. Liu, Y.; Song, W. Mapping Human Appropriation of Net Primary Production in Agroecosystems in the Heihe River Basin, China. Agric. Ecosyst. Environ. 2022, 335, 107996. [Google Scholar] [CrossRef] [Scilit]
  108. Haberl, H.; Erb, K.H.; Krausmann, F.; Gaube, V.; Bondeau, A.; Plutzar, C.; Gingrich, S.; Lucht, W.; Fischer-Kowalski, M. Quantifying and Mapping the Human Appropriation of Net Primary Production in Earth’s Terrestrial Ecosystems. Proc. Natl. Acad. Sci. USA 2007, 104, 12942–12947. [Google Scholar] [CrossRef] [Scilit] [PubMed]
  109. Huang, X.; Luo, G.; Han, Q. Temporospatial Patterns of Human Appropriation of Net Primary Production in Central Asia Grasslands. Ecol. Indic. 2018, 91, 555–561. [Google Scholar] [CrossRef] [Scilit]
  110. deSouza, P.; Malhi, Y. Land Use Change in India (1700–2000) as Examined through the Lens of Human Appropriation of Net Primary Productivity. J. Ind. Ecol. 2018, 22, 1202–1212. [Google Scholar] [CrossRef] [Scilit]
  111. Mahbub, R.B.; Ahmed, N.; Rahman, S.; Hossain, M.M.; Sujauddin, M. Human Appropriation of Net Primary Production in Bangladesh, 1700–2100. Land Use Policy 2019, 87, 104067. [Google Scholar] [CrossRef] [Scilit]
  112. Gingrich, S.; Niedertscheider, M.; Kastner, T.; Haberl, H.; Cosor, G.; Krausmann, F.; Kuemmerle, T.; Müller, D.; Reith-Musel, A.; Jepsen, M.R.; et al. Exploring Long-Term Trends in Land Use Change and Aboveground Human Appropriation of Net Primary Production in Nine European Countries. Land Use Policy 2015, 47, 426–438. [Google Scholar] [CrossRef] [Scilit]
  113. Zhang, Y.; Pan, Y.; Li, M.; Wang, Z.; Wu, J.; Zhang, X.; Cao, Y. Impacts of Human Appropriation of Net Primary Production on Ecosystem Regulating Services in Tibet. Ecosyst. Serv. 2021, 47, 101231. [Google Scholar] [CrossRef] [Scilit]
  114. Qin, X.; Liu, W.; Mao, R.; Song, J.; Chen, Y.; Ma, C.; Li, M. Quantitative Assessment of Driving Factors Affecting Human Appropriation of Net Primary Production (HANPP) in the Qilian Mountains, China. Ecol. Indic. 2021, 121, 106997. [Google Scholar] [CrossRef] [Scilit]
  115. Zhang, F.; Pu, L.; Huang, Q. Quantitative Assessment of the Human Appropriation of Net Primary Production (HANPP) in the Coastal Areas of Jiangsu, China. Sustainability 2015, 7, 15857–15870. [Google Scholar] [CrossRef] [Scilit]
  116. Chen, A.; Li, R.; Wang, H.; He, B. Quantitative Assessment of Human Appropriation of Aboveground Net Primary Production in China. Ecol. Model. 2015, 312, 54–60. [Google Scholar] [CrossRef] [Scilit]
  117. Krausmann, F.; Erb, K.-H.; Gingrich, S.; Haberl, H.; Bondeau, A.; Gaube, V.; Lauk, C.; Plutzar, C.; Searchinger, T.D. Global Human Appropriation of Net Primary Production Doubled in the 20th Century. Proc. Natl. Acad. Sci. USA 2013, 110, 10324–10329. [Google Scholar] [CrossRef] [Scilit]
  118. Stenzel, F.; Ben Uri, L.; Braun, J.; Breier, J.; Erb, K.; Gerten, D.; Haberl, H.; Matej, S.; Milo, R.; Ostberg, S.; et al. Breaching Planetary Boundaries: Over Half of Global Land Area Suffers Critical Losses in Functional Biosphere Integrity. One Earth 2025, 8, 101393. [Google Scholar] [CrossRef] [Scilit]
  119. Houghton, R.A.; Lefkowitz, D.S.; Skole, D.L. Changes in the Landscape of Latin America between 1850 and 1985 I. Progressive Loss of Forests. For. Ecol. Manag. 1991, 38, 143–172. [Google Scholar] [CrossRef] [Scilit]
  120. Dahlström, A. Grazing Dynamics at Different Spatial and Temporal Scales: Examples from the Swedish Historical Record a.d. 1620–1850. Veget. Hist. Archaeobot. 2008, 17, 563–572. [Google Scholar] [CrossRef] [Scilit]
  121. Zhao, S.; Ren, S.; Su, Z. Study on Human Activities and Changes of Agro-pastoral From Western Jin Dynasty to Northern Wei Dynasty in Northwest Shanxi. Res. Soil. Water Conserv. 2002, 9, 30–33. [Google Scholar]
  122. Wu, Y. An Initial Inquiry into Monasteries′ Economy in Tumed Area in Mid—Twentieth Century. J. Inn. Mong. Univ. (Philos. Soc. Sci.) 2010, 42, 41–45. [Google Scholar] [CrossRef]
  123. Xu, Z.; Lyu, B. Centennial Change in China’s Smallholder Economy: A Comparative Analysis of Buck’s Farm Household Survey Data and Contemporary Survey Data. World Econ. Pap. 2026, 23–43. [Google Scholar]
  124. Li, J. Tangut and Tibetan’s Agriculture and Livestock Production in Shanxi Lu in Song Dynasty: Centered about Cultivated Areas and Livestock Numbers. Guizhou Ethn. Stud. 2015, 36, 163–166. [Google Scholar] [CrossRef]
  125. Du, C.; Wei, M. Social and Economic History of the Qinghai-Tibet Plateau; Social Sciences Academic Press: Beijing, China, 2019; ISBN 978-7-5201-4742-2. (In Chinese) [Google Scholar]
  126. Davis, O.K. Spores of the Dung Fungus Sporormiella: Increased Abundance in Historic Sediments and Before Pleistocene Megafaunal Extinction. Quat. Res. 1987, 28, 290–294. [Google Scholar] [CrossRef] [Scilit]
  127. Zhang, J.; Huang, X.; Zhang, S.; Ren, X.; Xiao, Y.; Wang, J.; Xiang, L.; Xu, Q.; Birks, H.J.B. Cycles of Grazing and Agricultural Activity during the Historical Period and Its Relationship with Climatic and Societal Changes in Northern China. Land Degrad. Dev. 2021, 32, 3315–3325. [Google Scholar] [CrossRef] [Scilit]
  128. Pan, Y.; Zha, X.; Huang, C.; Pang, J.; Zhou, Y.; Wang, N.; Zhao, Y. Vegetation Change and Grazing Activities since the Middle Holocene in the Zoige Basin, Eastern Tibetan Plateau, China. Quat. Sci. Rev. 2025, 357, 109330. [Google Scholar] [CrossRef] [Scilit]
  129. Zhang, R. On Weights and Measures Reflected from the Grain Yield per Mu in Han and Tang Dynasties. Anc. Mod. Agric. 2009, 47–51. [Google Scholar]
  130. Jiang, T. Several Issues in the Study of Grain Yield per Mu: A Case Study of the Qing Dynasty. Res. Chin. Econ. Hist. 2009, 8–14. [Google Scholar]
  131. Chen, X. Rediscovery of Per Mu Yield of Grain in Zhanguo, Qin and Han Dynasties. Agric. Hist. China 2020, 39, 63–72, 62. [Google Scholar]
  132. Li, M.; He, F.; Zhao, C.; Yang, F. Evaluation of Global Historical Cropland Datasets with Regional Historical Evidence and Remotely Sensed Satellite Data from the Xinjiang Area of China. Remote Sens. 2022, 14, 4226. [Google Scholar] [CrossRef] [Scilit]
  133. He, F.; Li, S.; Zhang, X.; Ge, Q.; Dai, J. Comparisons of Cropland Area from Multiple Datasets over the Past 300 Years in the Traditional Cultivated Region of China. J. Geogr. Sci. 2013, 23, 978–990. [Google Scholar] [CrossRef] [Scilit]
  134. Etienne, D.; Wilhelm, B.; Sabatier, P.; Reyss, J.-L.; Arnaud, F. Influence of Sample Location and Livestock Numbers on Sporormiella Concentrations and Accumulation Rates in Surface Sediments of Lake Allos, French Alps. J. Paleolimnol. 2013, 49, 117–127. [Google Scholar] [CrossRef] [Scilit]
  135. Cugny, C.; Mazier, F.; Galop, D. Modern and Fossil Non-Pollen Palynomorphs from the Basque Mountains (Western Pyrenees, France): The Use of Coprophilous Fungi to Reconstruct Pastoral Activity. Veget. Hist. Archaeobot. 2010, 19, 391–408. [Google Scholar] [CrossRef] [Scilit]
  136. Yang, Y.; Zhang, S.; Yang, J.; Chang, L.; Bu, K.; Xing, X. A Review of Historical Reconstruction Methods of Land Use/Land Cover. J. Geogr. Sci. 2014, 24, 746–766. [Google Scholar] [CrossRef] [Scilit]
  137. Peng, J.; Wang, Y.; Wu, J. Human Appropriation of Net Primary Production: An Approach for Ecological Assessment of Regional Sustainable Development. J. Nat. Resour. 2007, 153–158. [Google Scholar]
  138. Van Asperen, E.N.; Kirby, J.R.; Shaw, H.E. Relating Dung Fungal Spore Influx Rates to Animal Density in a Temperate Environment: Implications for Palaeoecological Studies. Holocene 2020, 30, 218–232. [Google Scholar] [CrossRef] [Scilit]
  139. Hou, G.; Lai, Z.; Xiao, J.; Chongyi, E. Reconstruction of Cultivated Land during Mid- Holocene in the Middle and Lower Reaches of Yellow River and Human Impact on Vegetations. J. Geogr. Sci. 2012, 22, 933–945. [Google Scholar] [CrossRef] [Scilit]
  140. Zhuang, Y.; Kidder, T.R. Archaeology of the Anthropocene in the Yellow River Region, China, 8000–2000 Cal. BP. Holocene 2014, 24, 1602–1623. [Google Scholar] [CrossRef] [Scilit]
  141. Yu, Y.; Wu, H.; Zhang, W.; Boivin, N.; Yu, J.; Zhang, J.; Zhou, X.; Luo, W.; Deng, C.; Ge, J.; et al. Climate and Cultural Evolution Drove Holocene Cropland Change in the Huai River Valley, China. iScience 2024, 27, 110841. [Google Scholar] [CrossRef] [Scilit]
  142. Han, M. China’s Historical Agricultural Geography; Peking University Press: Beijing, China, 2012; ISBN 978-7-301-19667-0. [Google Scholar]
  143. Wang, Y. Diagnosing the Complex Situation in Social Ecological System: Understanding the Self-Governance in Old China’s Irrigation. J. Tsinghua Univ. (Philos. Soc. Sci.) 2018, 33, 178–191+196. [Google Scholar] [CrossRef]
  144. Wang, B.; Geng, X. Rediscussion on the Formation of Two-year three cropping System in North China. Agric. Hist. China 2019, 38, 15–23. [Google Scholar]
  145. Leng, P. Survival Needs, Policy Guidance Economic Transformation and Technological Innovation: An Analysis of the Development of Eco-agriculturein Southern Jiangsu during the Ming and Qing Dynasties. J. Nanjing Agric. Univ. (Soc. Sci. Ed.) 2020, 20, 105–114. [Google Scholar] [CrossRef]
  146. Zhang, J.; Chen, C.; Yang, Y. Origins and Early Development of Agriculture in China. J. Natl. Mus. China 2014, 1, 6–16. [Google Scholar]
  147. Zhao, S. Historical Development and Geographic Distribution of Agriculture (Farming) in China. Geogr. Res. 1991, 1–11. [Google Scholar]
  148. Wang, Y. The History of the Character “Ren”: The Transformation of the Spiritual Symbols of Chinese Civilization. Henan Soc. Sci. 2026, 34, 87–97. [Google Scholar]
  149. Yang, L.; Dong, Y.; Yao, Y.; Guo, P.; Li, Q.; Zhao, K. Current Status and High-Quality Development Strategies for Grape Industry in Xi’an Region. Sino-Overseas Grapevine Wine 2025, 103–109. [CrossRef]
  150. Wang, B. Abrupt Climate Change from the Late Ming to the Early Qing Dynasties and the Transformation of Cropping Systems in Shandong: With a Discussion of the Two-Year-Three-Harvest System in North China. Agric. Archaeol. 2014, 6–15. [Google Scholar]
  151. Zheng, J.; Xiao, L.; Fang, X.; Hao, Z.; Ge, Q.; Li, B. How Climate Change Impacted the Collapse of the Ming Dynasty. Clim. Change 2014, 127, 169–182. [Google Scholar] [CrossRef] [Scilit]
  152. Li, J.; Wang, L. Impact of the Introduction of High-Yield Crops during the Ming and Qing Dynasties on the Southwestern Mountainous Areas: A Case Study of Northeastern Guizhou. Agric. Archaeol. 2013, 52–56. [Google Scholar]
  153. Li, X. Economic Geography of American Cereal Crops Since the Ming and Qing Dynasties; China Social Sciences Press: Beijing, China, 2022; ISBN 9787522700915. [Google Scholar]
  154. Li, B. Quantitative Analysis of Fertilizer Demand in Jiangnan during the Ming and Qing Dynasties: Part One of an Inquiry into Fertilizer Issues in Ming-Qing Jiangnan. Qing Hist. J. 1999, 30–38, 108. [Google Scholar]
  155. Li, G. Discussion on the Re-evaluation of Traditional Chinese Economy and My Thoughts. J. Chin. Hist. Stud. 2005, 9–39. [Google Scholar]
  156. Huang, P. The Peasant Family and Rural Development in the Yangzi Delta, 1350–1988; Stanford University Press: Stanford, CA, USA, 1990; ISBN 978-0-8047-1787-8. [Google Scholar]
  157. Guo, C.; Hui, F. On the Application Changes of Chemical Fertilizers and Organic Fertilizers in Southeast China in Modern Times. Agric. Hist. China 2012, 55–64. [Google Scholar]
  158. Yan, W. The Relationship Between Population Factors and Farming Systems in Ancient China. Agric. Hist. China 1994, 1–7. [Google Scholar]
  159. Shen, S. Collection of Ancient Chinese Agricultural Books; Jiangsu Phoenix Publishing House: Nanjing, China, 2024; ISBN 978-7-5506-4074-0. [Google Scholar]
  160. Chen, F.; Liu, M. Collation and Explanation of Chen Fu’s Agricultural Book; China Agriculture Press: Beijing, China, 2015; ISBN 978-7-109-20034-0. [Google Scholar]
  161. Wang, S. Guangzhi Yi; Basic Literature Series of the Maritime Silk Road: Guangzhou, China, 2022; ISBN 978-7-5010-7608-6. [Google Scholar]
  162. Jia, S.; Miao, Q.; Miao, G. Translation and Annotation of Qimin Yaoshu; Shanghai Chinese Classics Publishing House: Shanghai, China, 2020; ISBN 978-7-5325-9719-2. [Google Scholar]
  163. Zhang, X.; Wang, F.; Lu, W.; Li, S.; Zheng, J. Gridded Reconstruction of the Population in the Traditional Cultivated Region of China from 1776 to 1953. Sci. China Earth Sci. 2022, 65, 365–378. [Google Scholar] [CrossRef] [Scilit]
  164. Liu, X.; Harrison, S.P.; Min, R.; Farqan, M.; Zheng, M.; Jiang, L.; Li, H.; Ma, M.; Huang, X. Spatial Reconstructions of Population Density in Northwest China between 2 and 1949 CE. Glob. Planet. Change 2026, 260, 105375. [Google Scholar] [CrossRef] [Scilit]
  165. Chen, E. Research on the Agricultural Development of Chaohu Lake Basin During Ming and Qing Dynasties. Doctoral Dissertation, Nanjing Agricultural University, Nanjing, China, 2009. [Google Scholar]
  166. Wei, S. Exploring the Origins of Development in the Taihu Lake Basin; Jiangxi Education Publishing House: Nanchang, China, 1993; ISBN 978-7-5392-1180-0. [Google Scholar]
  167. Zhao, Y.; Chao, Z. A Review of Historical GIS and Its Trend. J. Geo-Inf. Sci. 2020, 22, 929–944. [Google Scholar]
  168. Qiu, B.; Liu, B.; Tang, Z.; Dong, J.; Xu, W.; Liang, J.; Chen, N.; Chen, J.; Wang, L.; Zhang, C.; et al. National-Scale 10-m Maps of Cropland Use Intensity in China during 2018–2023. Sci. Data 2024, 11, 691. [Google Scholar] [CrossRef] [Scilit]
  169. Harris, I.; Osborn, T.J.; Jones, P.; Lister, D. Version 4 of the CRU TS Monthly High-Resolution Gridded Multivariate Climate Dataset. Sci. Data 2020, 7, 109. [Google Scholar] [CrossRef] [Scilit]
  170. Xu, F.; Chi, G. Spatiotemporal Variations of Land Use Intensity and Its Driving Forces in China, 2000–2010. Reg. Environ. Change 2019, 19, 2583–2596. [Google Scholar] [CrossRef] [Scilit]
  171. Song, H.; Xin, L. Differentiation Characteristics and Influencing Factors of Farmland Use Intensity in China. Trans. Chin. Soc. Agric. Eng. 2021, 37, 212. [Google Scholar] [CrossRef]
Figure 1. Review framework for historical land use intensity reconstruction and its driving forces in China.
Land 15 00891 g001
Figure 2. Changes in land use and land cover types in China for the past 1000 years. Data on cropland distribution are cited from [36], while forest and grassland data are sourced from [35]. The proportions of other land types are calculated by subtracting the areas of cropland, forest, and grassland from the total land area of present-day China (9.6 million km2).
Land 15 00891 g002
Figure 3. Evolution of cropping patterns and harvest frequency in China for the past 8000 years.
Land 15 00891 g003
Figure 4. Changes in Historical Per Capita Cropland and Grain Yield in China. The per capita cropland data from the Spring and Autumn period to the mid-early Qing Dynasty are cited from [98], and the per capita cropland data from 1949 to 1983 are cited from [99], and the per capita cropland data for 1999 are from the China Statistical Yearbook. The grain yield data for the Shang Dynasty are cited from [100], and the grain yield per unit area data from the Spring and Autumn period to 1999 are cited from [97]. The major dynasties and their corresponding time spans are as follows: the Shang Dynasty, 1600–1046 BCE; the Spring and Autumn Periods, 770–221 BCE; the Han Dynasty, 202 BCE–220 CE; the Northern Wei Dynasty, 386–534 CE; the Tang Dynasty, 581–907 CE; the Song Dynasty, 960–1279 CE; the Yuan Dynasty, 1271–1368 CE; and the early to mid-Qing Dynasty, 1644–1796 CE. Per capita cropland data for the Shang Dynasty, 1845, and 1890 remains unavailable. Dyn. = Dynasty.
Land 15 00891 g004
Figure 5. Evolution of Dominant Driving Forces in Historical Land Use Intensity in China.
Land 15 00891 g005
Figure 6. Multi-dimensional assessment framework for historical land use intensity.
Land 15 00891 g006
Disclaimer/Publisher’s Note: The statements, opinions and data contained in all publications are solely those of the individual author(s) and contributor(s) and not of MDPI and/or the editor(s). MDPI and/or the editor(s) disclaim responsibility for any injury to people or property resulting from any ideas, methods, instructions or products referred to in the content.