Research on the Identification and Spatiotemporal Evolution of China’s Urban Life Cycle: From the Perspective of Organic Entities


Abstract
1. Introduction
2. Literature Review
3. Theoretical Connotation and Construction of Evaluation System
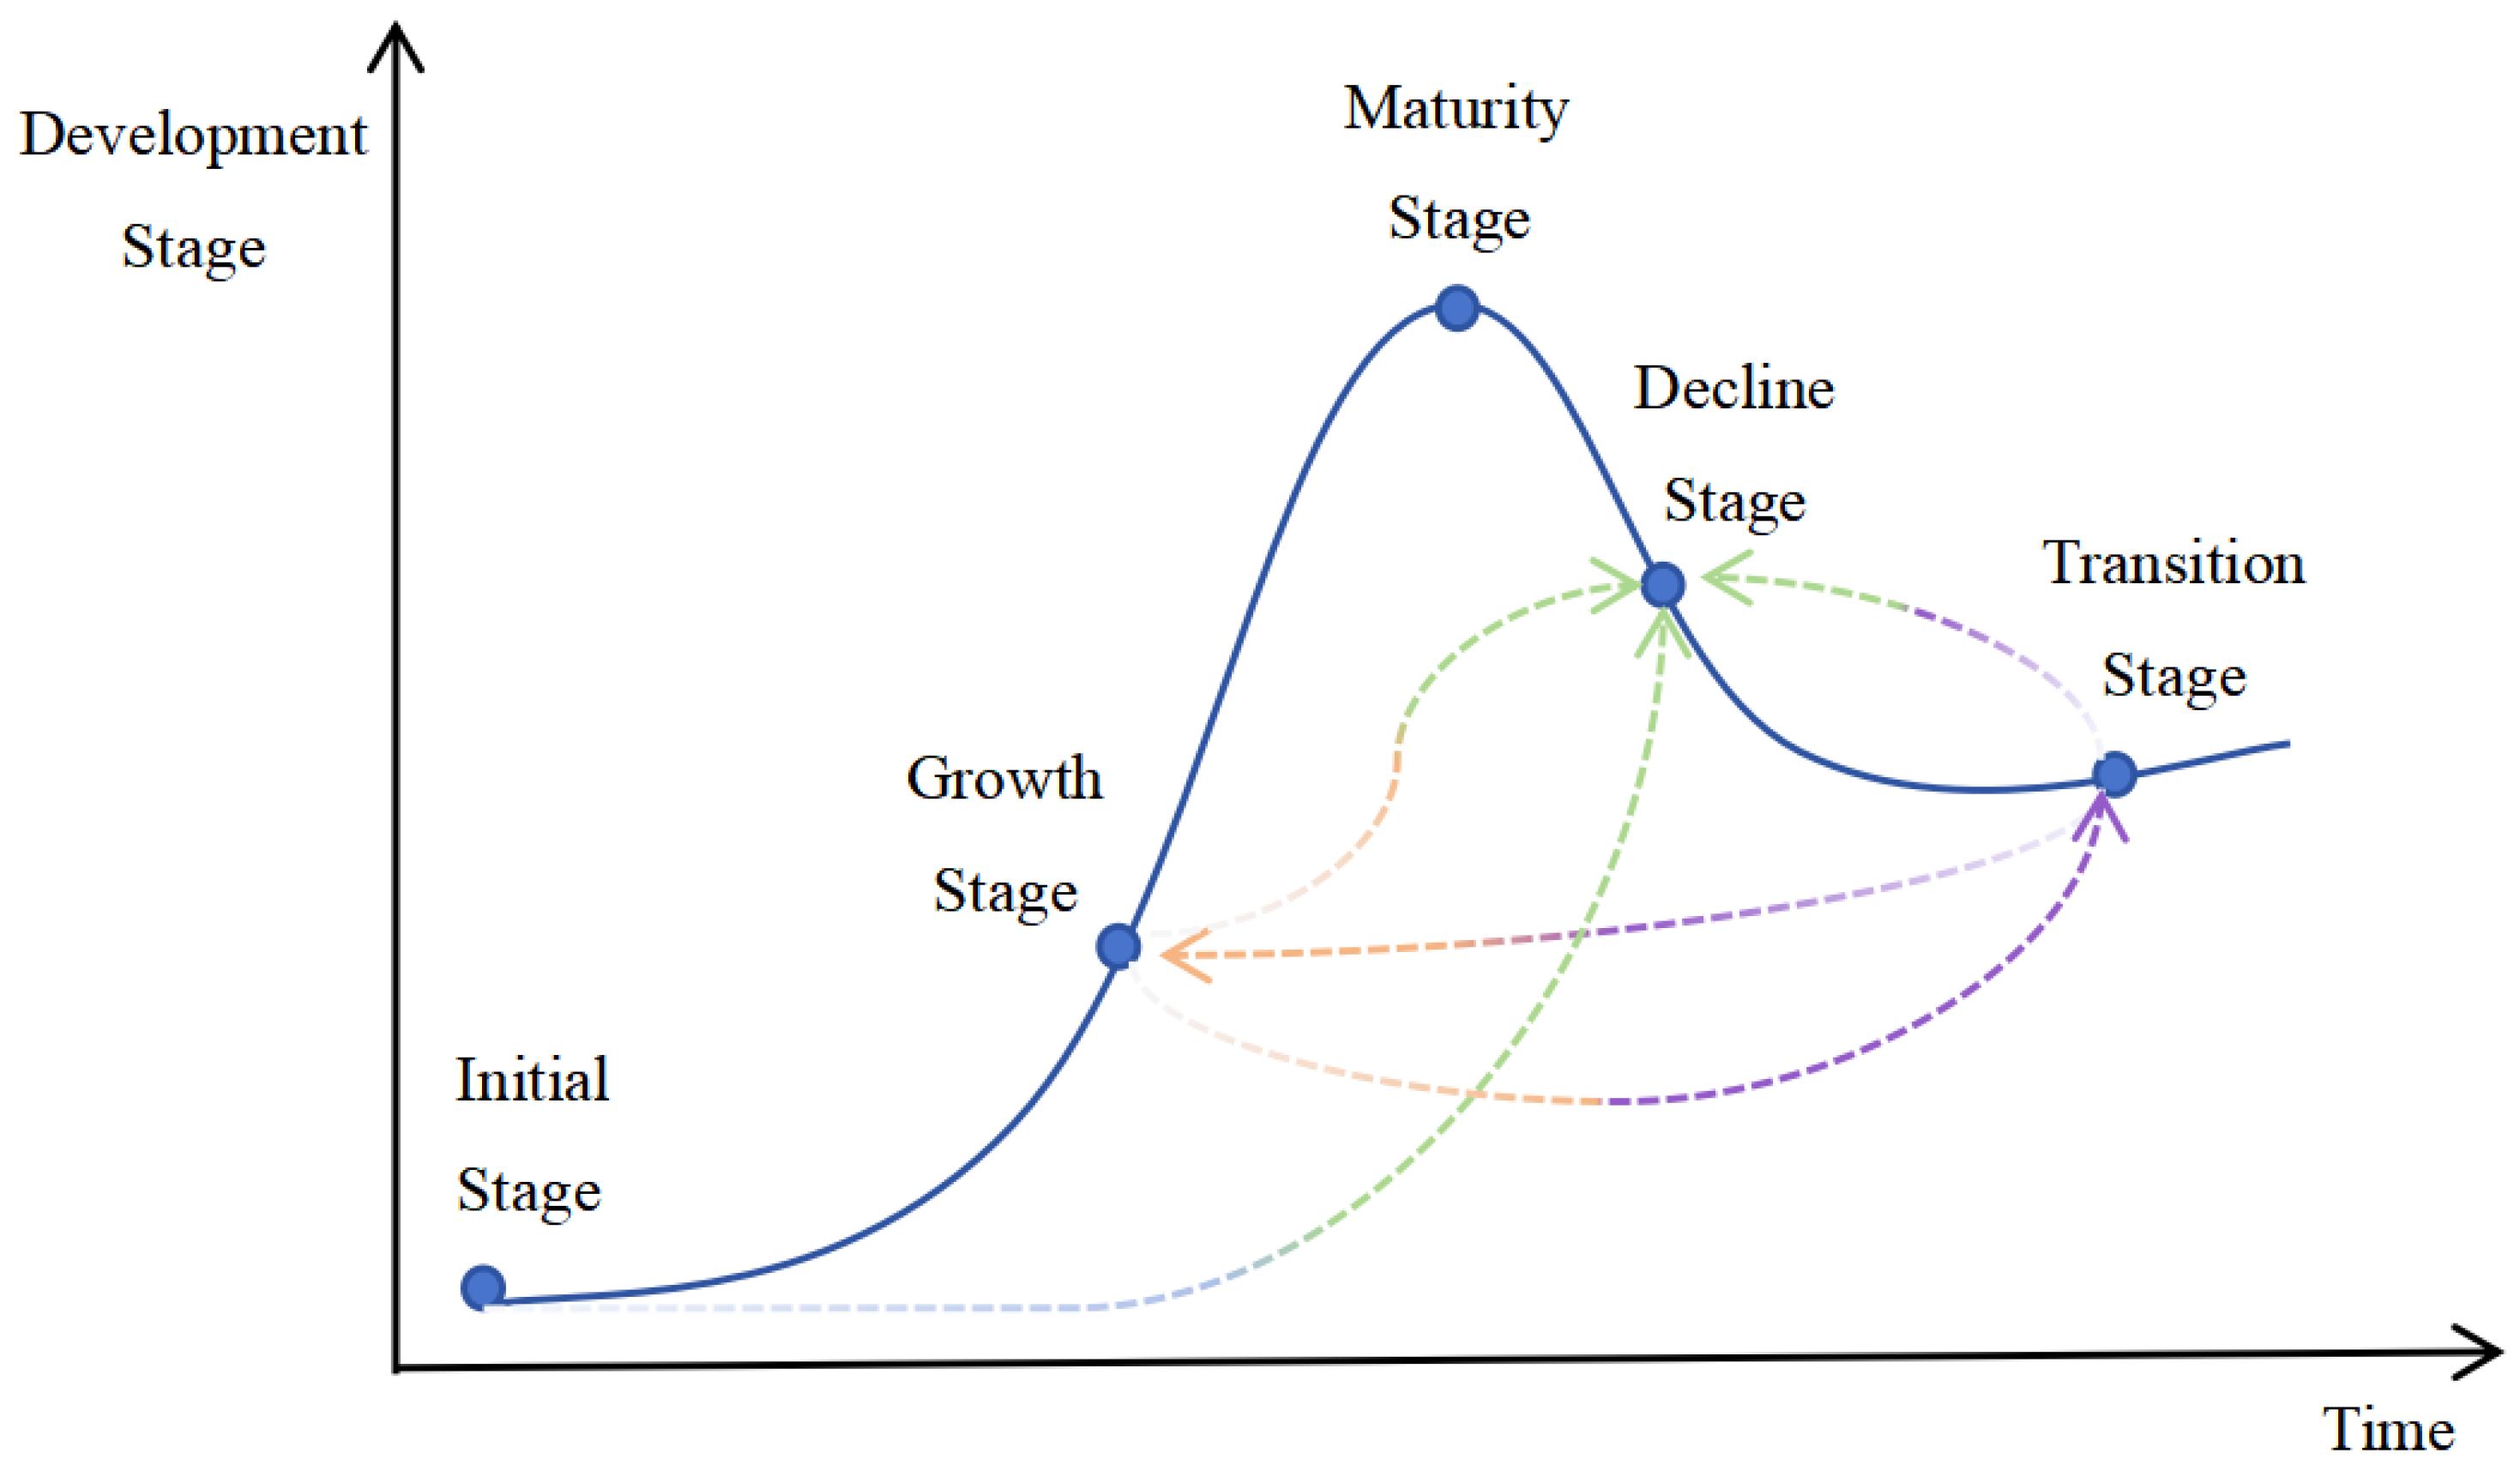
3.1. Theoretical Connotation
3.2. Construction of the Evaluation System
4. Evaluation Process of Urban Development Stages
4.1. Initial Identification of Development Stages Based on Fuzzy Comprehensive Evaluation
4.2. Calibration of Development Stages via Bi-Level K-Means Clustering
4.3. Steady-State Correction of Development Stages
5. Evaluation Results and Their Spatiotemporal Differences
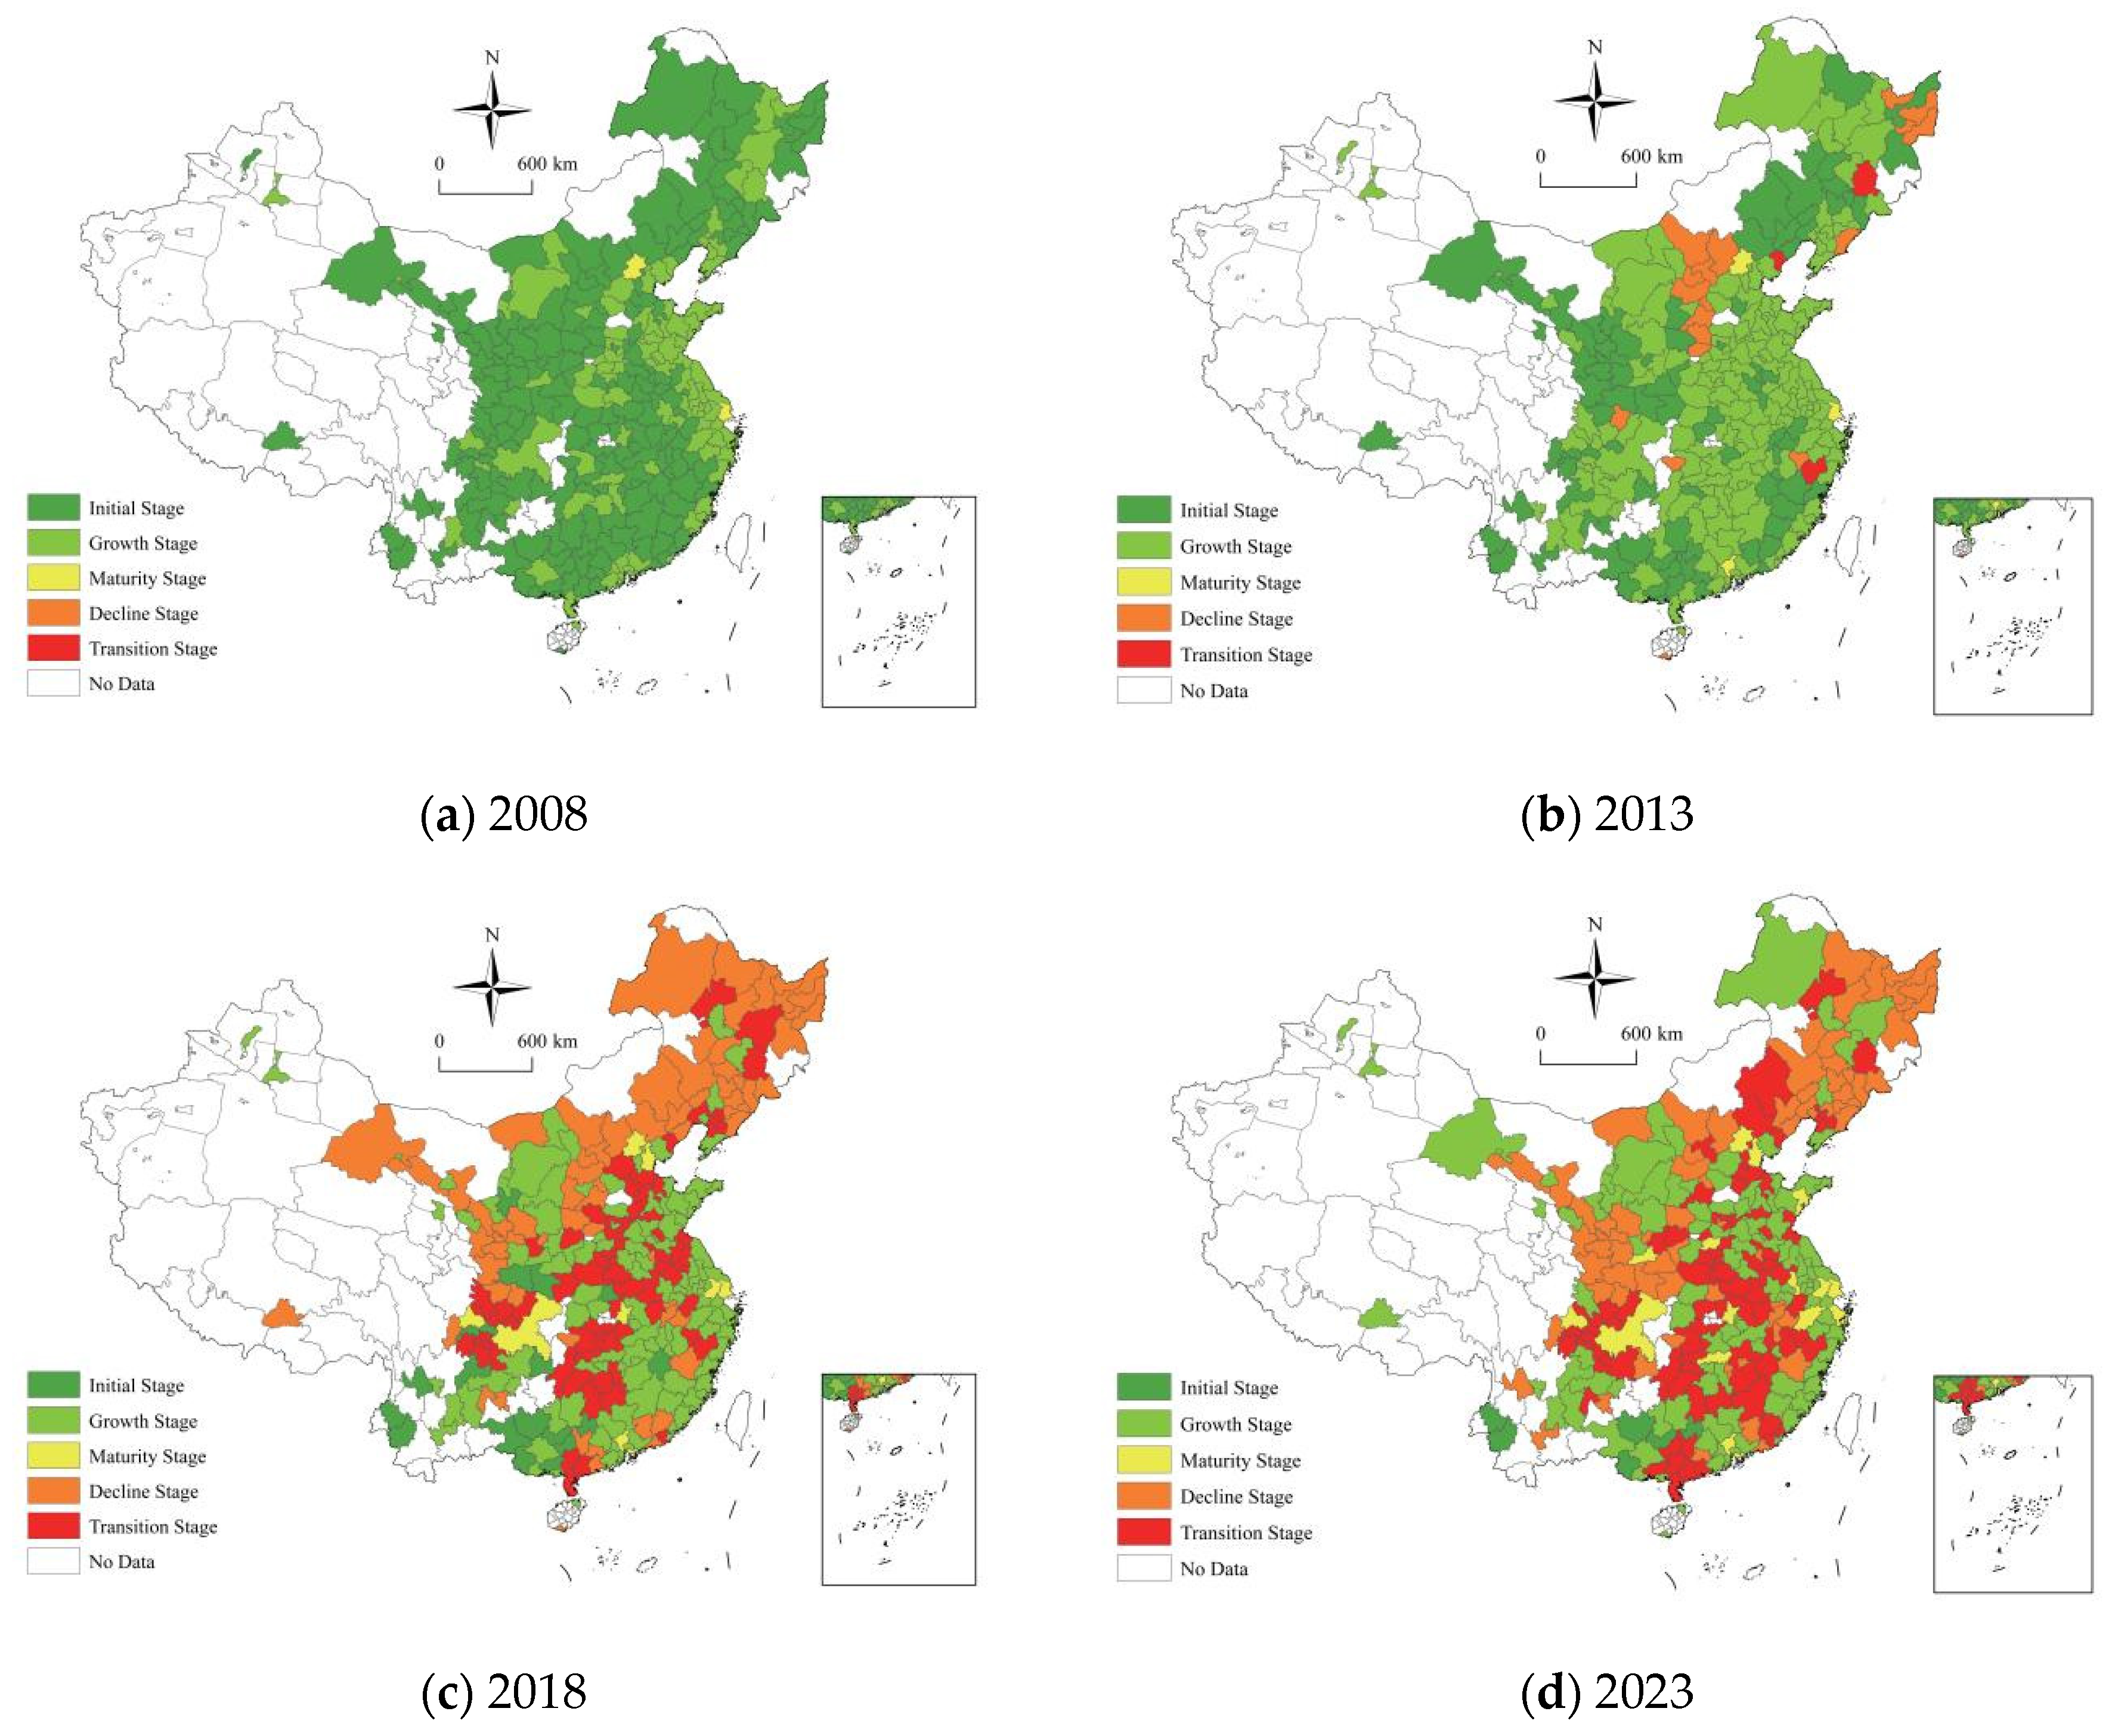
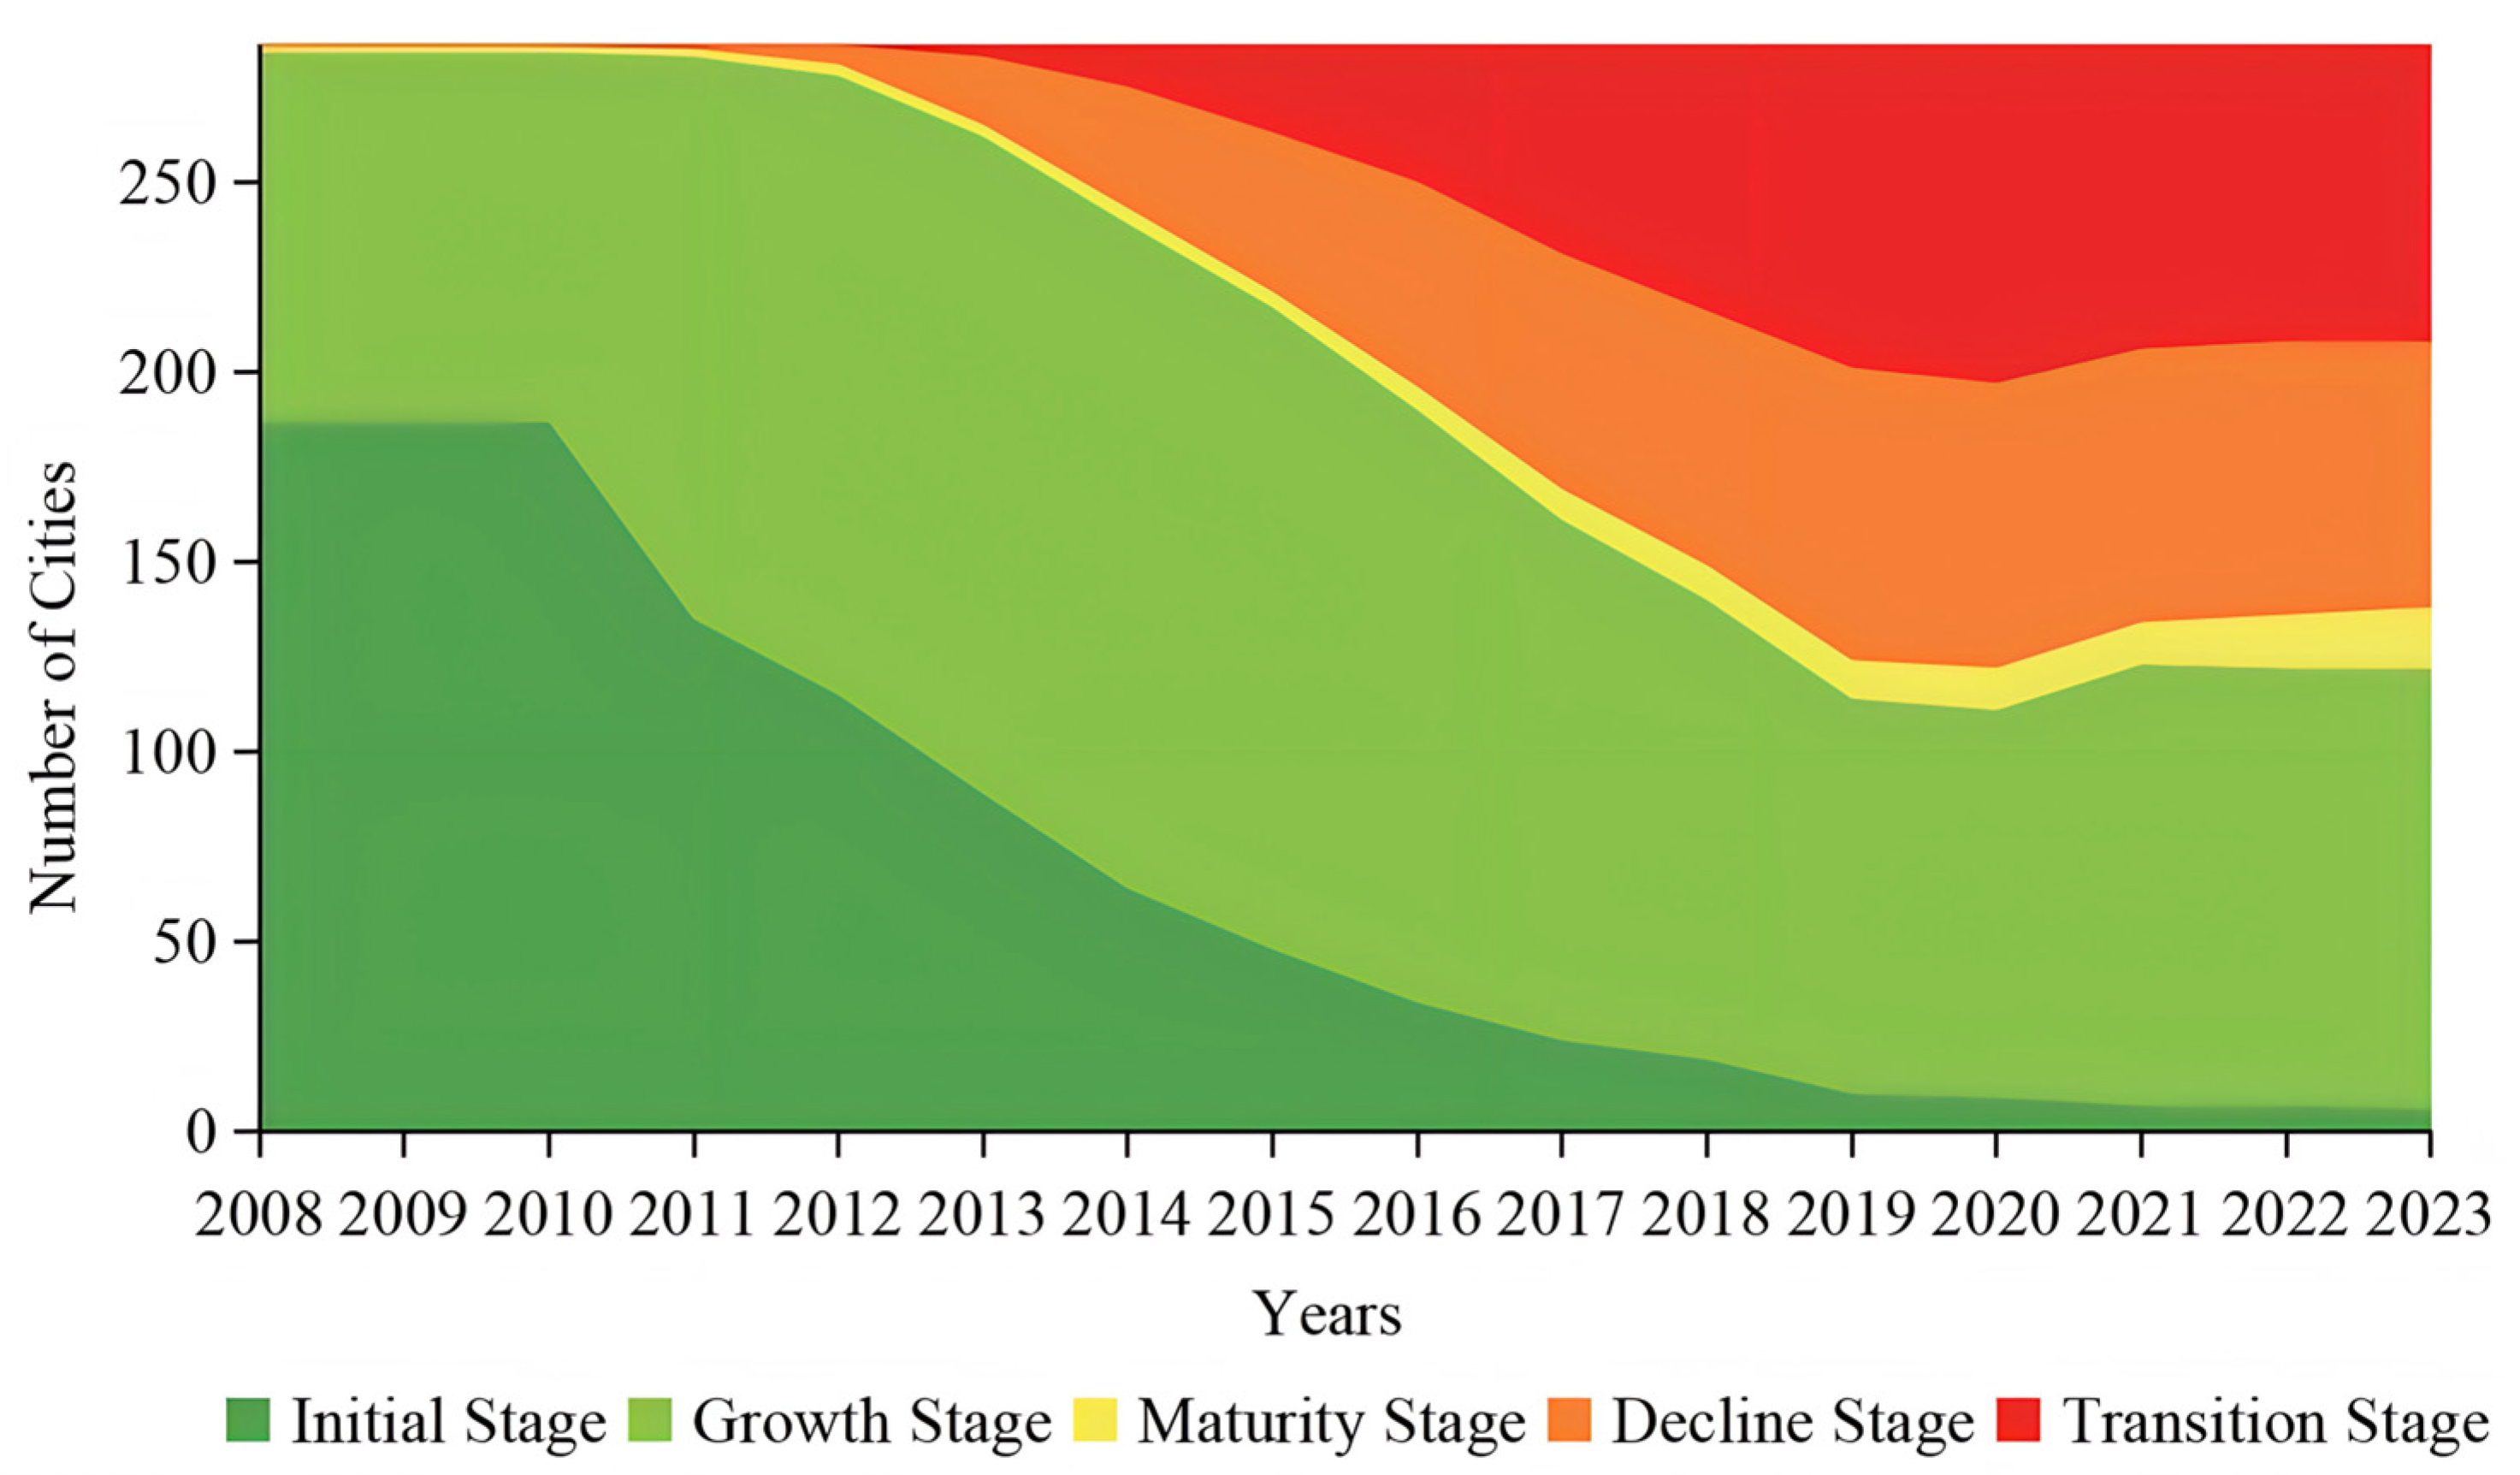
5.1. National Level
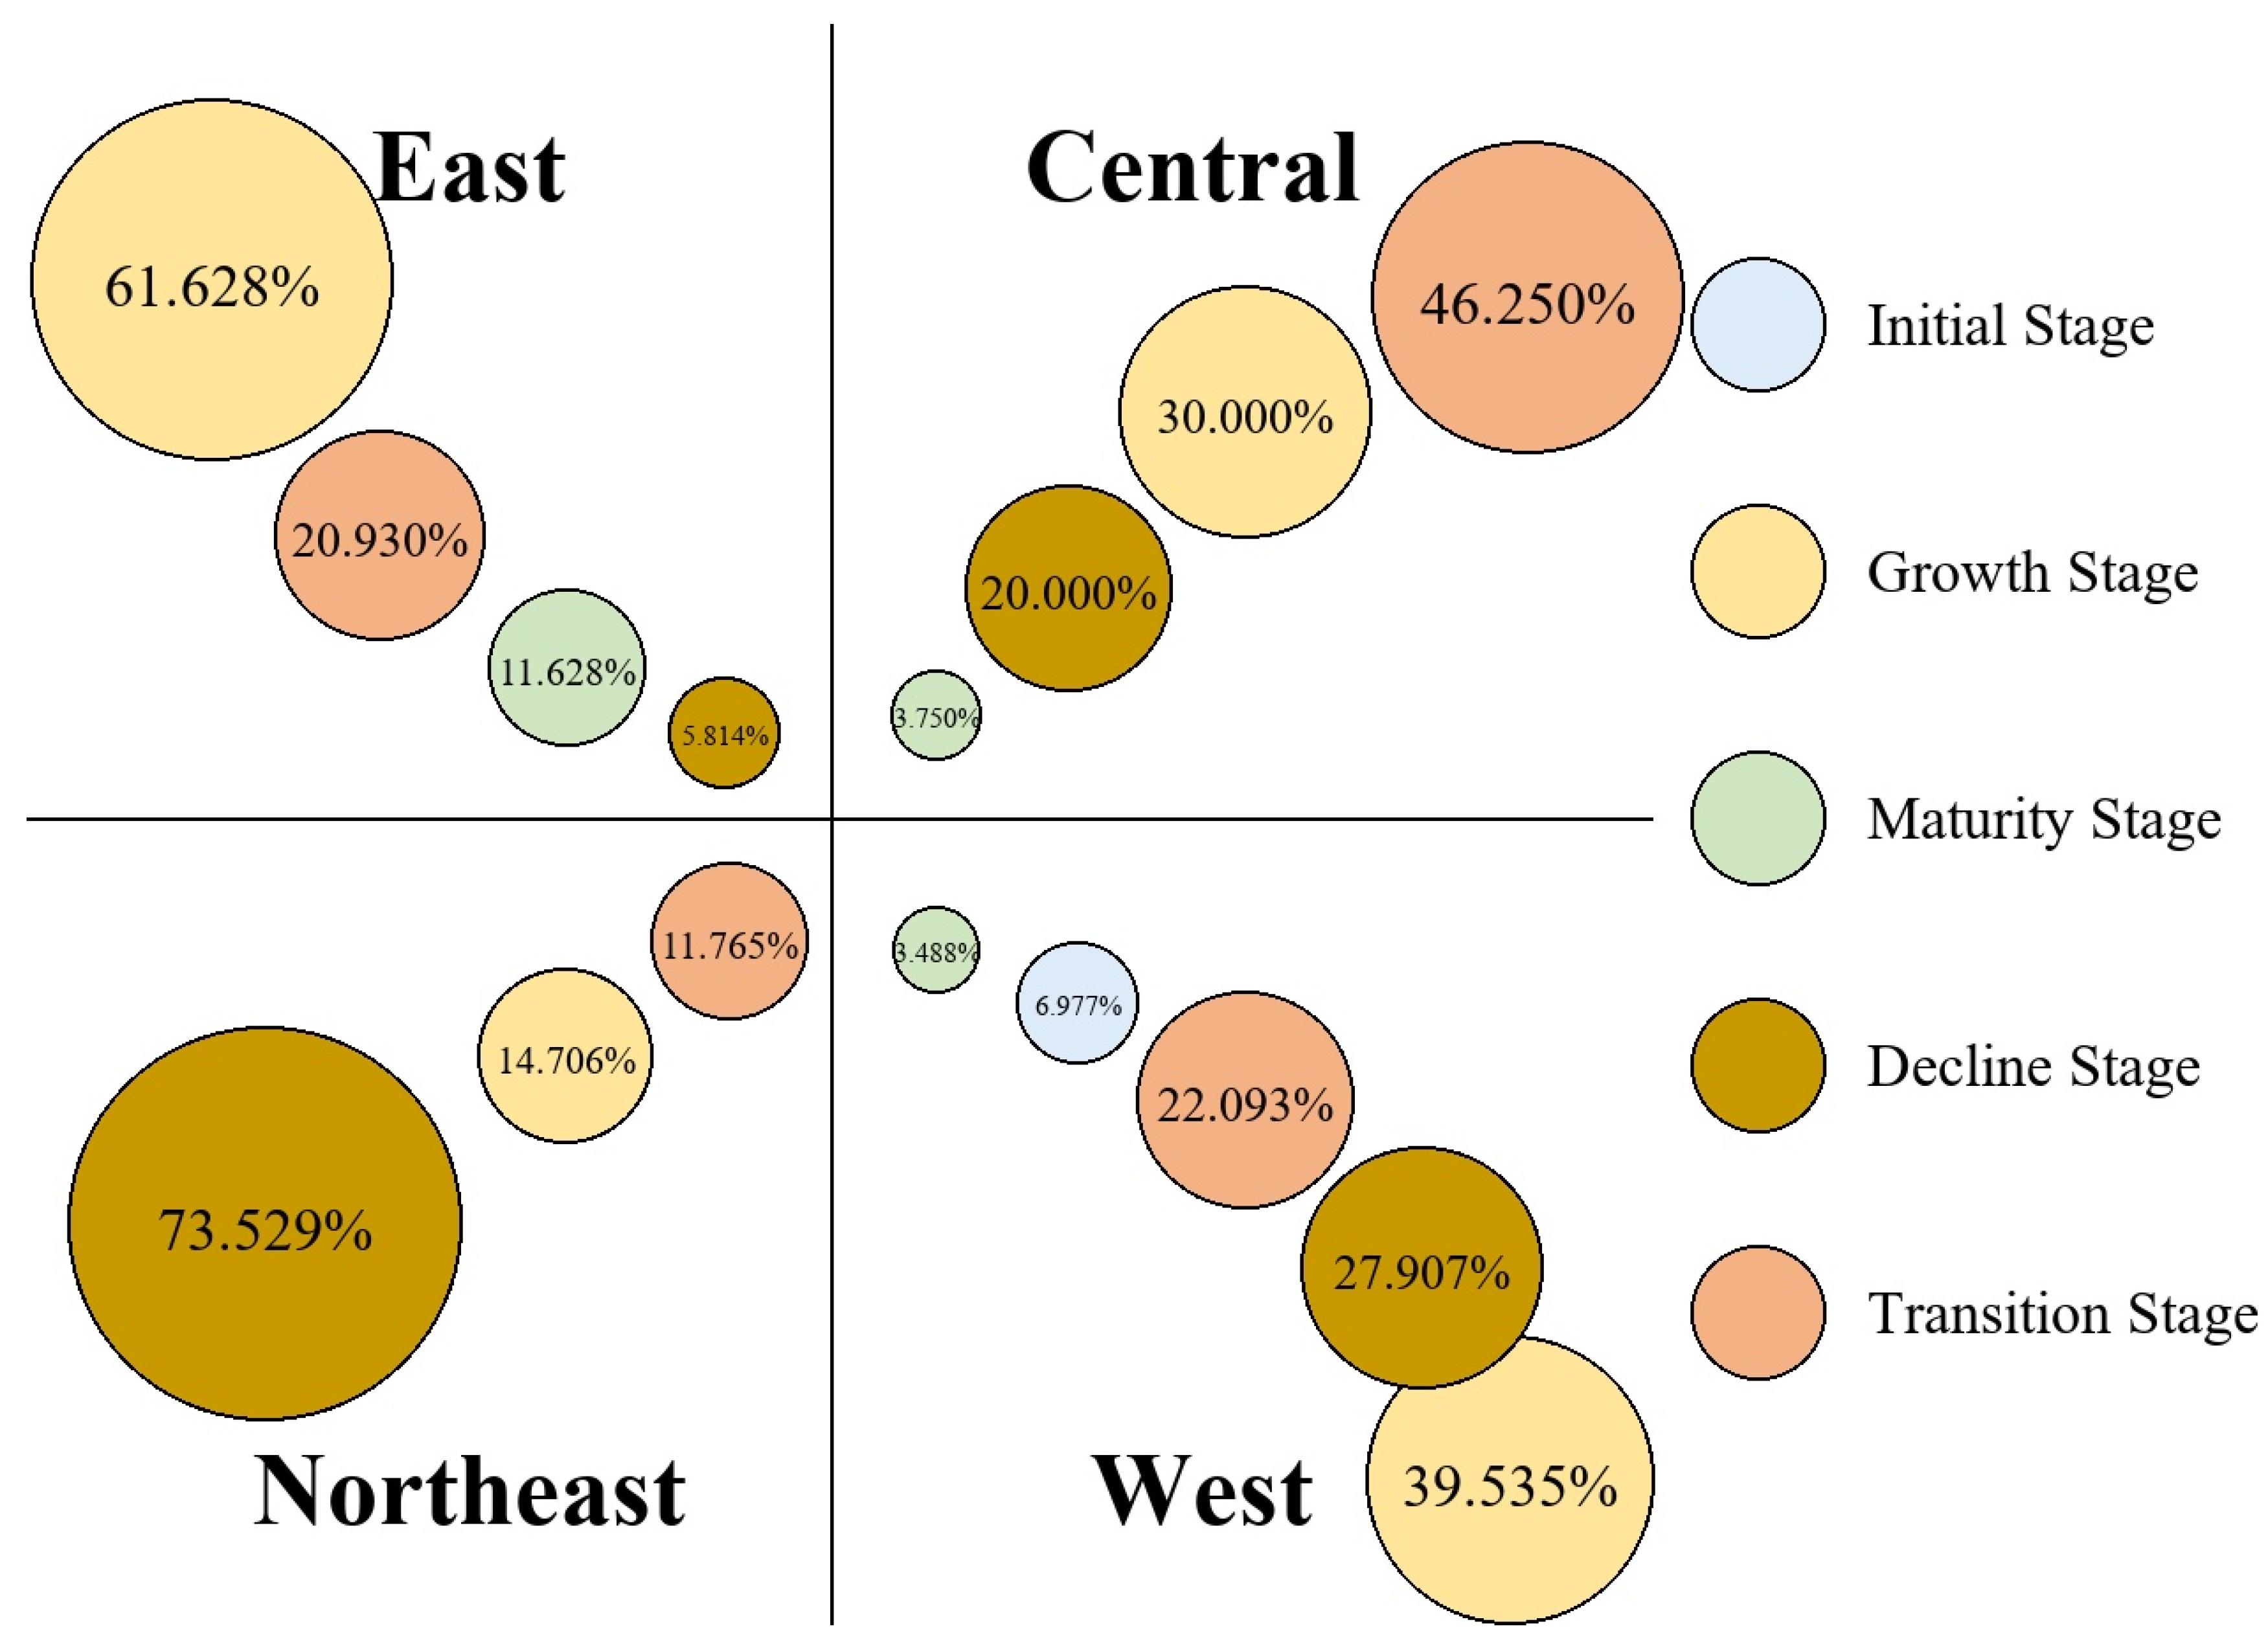
5.2. Regional Level
6. Discussion
7. Conclusions and Policy Recommendations
7.1. Research Conclusions
7.2. Policy Recommendations
Author Contributions
Funding
Data Availability Statement
Conflicts of Interest
References
- Central Urban Work Conference Held in Beijing, Xi Jinping Delivered an Important Speech[EB/OL]. Xinhuanet. 15 July 2025. Available online: https://www.news.cn/politics/leaders/20250715/628141404d134324af199c1235d29800/c.html (accessed on 5 May 2026).
- Chen, Z. Toward Balanced Growth with Economic Agglomeration: Empirical Studies of China’s Urban-Rural and Interregional Development; Springer: Heidelberg, Germany, 2015. [Google Scholar]
- Fan, J. Theory, Strategy and Path of China‘s Regional Coordinated Development During 15th Five-Year Plan Period. Bull. Chin. Acad. Sci. 2024, 39, 605–619. [Google Scholar]
- Mumford, L. The City in History: Its Origins, Its Transformations, and Its Prospects; Secker & Warburg: London, UK, 1961. [Google Scholar]
- Hall, P. The World Cities; Weidenfeld & Nicolson: London, UK, 1971. [Google Scholar]
- Kurokawa, K. Intercultural Architecture: The Philosophy of Symbiosis; Academy Editions: London, UK, 1991. [Google Scholar]
- Lu, S.; Zhang, W.Z.; Yu, J.H.; Li, J.M. The Identification of Spatial Evolution Stage of Resource-Based Cities and Its Development Characteristics. Acta Geogr. Sin. 2020, 75, 2180–2191. [Google Scholar]
- Sun, P.J.; Wang, K.W. Identification and Stage Division of Urban Shrinkage in the Three Provinces of Northeast China. Acta Geogr. Sin. 2021, 76, 1366–1379. [Google Scholar]
- Liu, X.Z.; Li, J.Z. Cluster Analysis for Urbanization Levels Based on Nonlinear Mapping Analysis. Ludong Univ. J. (Nat. Sci. Ed.) 2007, 23, 228–232. [Google Scholar]
- Wang, S.H.; Zhao, J.H. Divergent Trajectories of Urban Development in 287 Chinese Cities. OSF Prepr. 2018. [Google Scholar] [CrossRef] [Scilit]
- Zhu, L.; Wang, Q. Evaluation of High-Quality Economic Development Level and Obstacle Factor Diagnosis of Wanjiang City Belt. J. Jingchu Univ. Technol. 2023, 38, 50–59. [Google Scholar]
- Yang, Y.; Dou, Q.; Yao, Y. Measurement of High-Quality Development Level of Urban Agglomeration in the Yangtze River Delta. Stat. Decis. 2021, 37, 89–93. [Google Scholar]
- Li, F. Measurement of High-Quality Development Level of Urban Agglomeration in the Yangtze River Delta and Its Coupling Coordination Evolution Analysis. J. Jianghan Univ. (Soc. Sci. Ed.) 2023, 40, 78–91+127. [Google Scholar]
- Liu, K.; Shang, P. Measurement of High-Quality Development Level of China’s Urban Agglomerations and Its Spatial Correlation. J. Dongbei Univ. Financ. Econ. 2021, 37–46. [Google Scholar] [CrossRef]
- Qin, X.; Qin, X. Research on the Level of High-Quality Urban Development Based on Big Data Evaluation System: A Study of 151 Prefecture-Level Cities in China. Sustainability 2025, 17, 836. [Google Scholar] [CrossRef] [Scilit]
- Fan, H.; Wang, K. The Statistical Measurement System of High-Quality Development Level of Cities—Based on Yangtze River Delta Region of China. Asian J. Probab. Stat. 2022, 17, 1–10. [Google Scholar] [CrossRef] [Scilit]
- Wen, T.; Li, W.; Song, H.; Yue, H. Analysis on the difference of regional high-quality development in Beijing-Tianjin-Hebei city cluster. Procedia Comput. Sci. 2022, 199, 1184–1191. [Google Scholar]
- Huang, Z.; Sheng, L.; Qin, M.; Yu, X. Tiered Evolution and Sustainable Governance of High-Quality Development in Megacities: A System Dynamics Simulation of Chinese Cases. Urban Sci. 2026, 10, 49. [Google Scholar] [CrossRef] [Scilit]
- The State Council of the People’s Republic of China. National Plan for Sustainable Development of Resource-based Cities (2013–2020). Available online: http://www.gov.cn/zwgk/2013-12/03/content_2540070.htm (accessed on 5 May 2026).
- Yu, J.; Li, J.; Zhang, W. Identification and Comprehensive Classification of Resource-based Cities in China. Acta Geogr. Sin. 2018, 73, 677–687. [Google Scholar]
- Lyu, X.; Lu, X. Evaluation on Green Growth Capacity of Resource-based Cities. Sci. Res. Manag. 2016, 37, 89–97. [Google Scholar]
- Zhao, Y. Research on the Development Stage of China’s Resource-based Cities—From the Perspective of Green Transformation. Inq. Into Econ. Issues 2020, 74–84. [Google Scholar]
- Sun, Y. From resource curse to resilience restructuring: How does the innovation ecosystems‘ organicity reshape industrial transformation in resource-based regions? A case study of China’s π-shaped Curve Area. Appl. Geogr. 2026, 188, 103907. [Google Scholar] [CrossRef] [Scilit]
- Wang, M.; Qin, K.; Li, J.; Yang, S. Explaining the transmission mechanism of social-ecological systems adaptive cycling on path dependency in resource-based cities: Evidence from Shanxi Province, China. Sustain. Futures 2025, 9, 100449. [Google Scholar] [CrossRef] [Scilit]
- Wu, B.; Xu, Y. Towards sustainable development: Can industrial collaborative agglomeration become an accelerator for green and low-carbon transformation of resource-based cities in China? J. Clean. Prod. 2025, 381, 125199. [Google Scholar] [CrossRef] [Scilit]
- Kabisch, N.; Haase, D.; Haase, A. Urban population development in Europe, 1991–2008: The examples of Poland and the UK. Int. J. Urban Reg. Res. 2012, 36, 1326–1348. [Google Scholar] [CrossRef] [Scilit]
- Wiechmann, T.; Pallagst, K.M. Urban shrinkage in Germany and the USA: A comparison of transformation patterns and local strategies. Int. J. Urban Reg. Res. 2012, 36, 261–280. [Google Scholar] [CrossRef] [Scilit]
- Zhang, S.; Wang, C.; Wang, J.; Yao, S.M.; Zhang, F.; Yin, G.W.; Xu, X.Y. Comprehensive Measurement of Urban Shrinkage and Its Spatiotemporal Differentiation Characteristics in China. China Popul. Resour. Environ. 2020, 30, 72–82. [Google Scholar]
- Zhang, M.; Liu, Y.; Qu, J. Classification Identification and High-Quality Development of Shrinking Cities. J. Zhengzhou Univ. (Philos. Soc. Sci. Ed.) 2019, 52, 47–51. [Google Scholar]
- He, Q.; Wang, B.; Wu, C. Regulating Urban Functional Shrinkage in Chinese Cities Through Morphological Optimization: A Multi-Model Framework. Trans. GIS 2025, 29, e70100. [Google Scholar] [CrossRef] [Scilit]
- Chen, X.; Lang, W.; Yuan, Y.; Yan, G.; Hou, X. Conceptualizing the nexus between spatiotemporal shrinkage patterns of natural cities and driving mechanisms: Insights into urban shrinkage in Northeast China. Cities 2024, 152, 105179. [Google Scholar] [CrossRef] [Scilit]
- Ma, F.; Wan, L.; Piao, Y. Urban shrinkage, spatial growth, and urban innovation and entrepreneurship activities: Evidence from Chinese cities. Cities 2025, 167, 106400. [Google Scholar] [CrossRef] [Scilit]
- Jin, Y.; Liu, Y.; Zhou, G.; Sun, H.; Wu, H. How does urban shrinkage influence urban resilience? Empirical evidence from Northeast China. Habitat Int. 2026, 167, 103646. [Google Scholar] [CrossRef] [Scilit]
- Ma, F.; Yoon, H. Urban shrinkage and its drivers: Time-series clustering and a panel model of Chinese cities. World Dev. 2025, 196, 107191. [Google Scholar] [CrossRef] [Scilit]
- Sagi, A.; Gal, A.; Broitman, D.; Czamanski, D. An unsupervised machine learning approach to the spatial analysis of urban systems through neighbourhoods‘ dynamics. Land Use Policy 2024, 144, 107235. [Google Scholar] [CrossRef] [Scilit]
- Yu, M. Machine Learning in Urban Morphology and Urban Climate: Prospects and Applications: EGU26-11968. In Proceedings of the EGU General Assembly 2026, Vienna, Austria, 3–8 May 2026. [Google Scholar]
- Verovšek, Š.; Moškon, M. Context-Specific Urban Optimisations Through Data-Driven Classification: A Perspective on Methods and Applications. Land 2025, 14, 1505. [Google Scholar] [CrossRef] [Scilit]
- Northam, R.M. Urban Geography, 2nd ed.; John Wiley & Sons: New York, NY, USA, 1979; pp. 65–67. [Google Scholar]
- Institute of Party History and Literature of the CPC Central Committee. Excerpts from Xi Jinping’s Expositions on Urban Work; Central Literature Publishing House: Beijing, China, 2023; Volume 47. [Google Scholar]
- Kanbur, R.; Zhang, X. Fifty years of regional inequality in China: A journey through central planning, reform, and openness. Rev. Dev. Econ. 2005, 9, 87–106. [Google Scholar] [CrossRef] [Scilit]
- Démurger, S. Infrastructure development and economic growth: An explanation for regional disparities in China. J. Comp. Econ. 2001, 29, 95–117. [Google Scholar] [CrossRef] [Scilit]
- Wei, Y.D. Spatiality of regional inequality. Appl. Geogr. 2015, 61, 1–10. [Google Scholar] [CrossRef] [Scilit]
- Zhang, P. Revitalizing old industrial base of Northeast China: Process, policy and challenge. Chin. Geogr. Sci. 2008, 18, 109–118. [Google Scholar] [CrossRef] [Scilit]
- He, S.Y.; Lee, J.; Zhou, T.; Wu, D. Shrinking cities and resource-based economy: The economic restructuring in China’s rust belt. Cities 2017, 60, 75–83. [Google Scholar] [CrossRef] [Scilit]
- Yang, Z.; Dunford, M. City shrinkage in China: Scalar processes of urban and regional development. Urban Geogr. 2018, 39, 1542–1561. [Google Scholar]
- Xie, L.; Zhang, J.; Liu, Z. Understanding urban shrinkage in China: The case of Northeast China. J. Urban Plan. Dev. 2020, 146, 04020003. [Google Scholar]




| Target Layer | Primary Indicator | Secondary Indicator | Unit | Core Connotation | Impact Direction |
|---|---|---|---|---|---|
| Urban Development Stage | Spatial Carrying Capacity | Population Density | Person/square kilometer | Measure the intensity of land use and urban carrying pressure | + |
| Proportion of Built-up Area | % | Reflect the speed of urban expansion and intensity of spatial development | + | ||
| Population Development | Urbanization Rate | % | Reflect the degree of population agglomeration to cities, an important symbol of modernization | + | |
| Permanent Resident Population | 10,000 persons | Characterize the urban scale and population carrying capacity | + | ||
| Aging Degree | % | Reflect the change of population structure, posing challenges to labor supply and social security | − | ||
| Social Service Capacity | Number of Hospital Beds | Unit | Measure the supply capacity of medical resources | + | |
| Number of Urban Centers | Unit | Reflect the improvement and balance of urban public service functions | + | ||
| Highway Passenger Volume | 10,000 person-times | Reflect the level of transportation infrastructure and travel convenience of residents | + | ||
| Industrial Momentum | Proportion of Secondary Industry | % | Measure the level of industrialization and the status of manufacturing industry | + | |
| Proportion of Tertiary Industry | % | Reflect the development level of the service industry and the direction of transformation and upgrading | + | ||
| Number of Patent Authorizations | Unit | Characterize the innovation capacity and technological activity of the industry | + | ||
| Number of Industrial Enterprises above Designated Size | Unit | Reflect the industrial scale and agglomeration degree of enterprises | + | ||
| Total Profits of Industrial Enterprises above Designated Size | 100 million yuan | Measure industrial benefits and market competitiveness | + | ||
| Economic Vitality | GDP Scale | 100 million yuan | Measure the total urban economic output, the core basic indicator of development stage | + | |
| GDP Growth Rate | % | Reflect the speed and potential of economic growth, reveal the development momentum | + | ||
| Per Capita GDP | 10,000 yuan | Reflect the development quality and per capita wealth level of residents | + | ||
| Total Imports and Exports | 100 million yuan | Measure the level of opening-up and international competitiveness | + | ||
| Total Retail Sales of Consumer Goods | 100 million yuan | Reflect the scale of the consumer market and the pulling power of domestic demand | + | ||
| Local General Public Budget Expenditure | 100 million yuan | Demonstrate the financial strength and public service guarantee capacity | + |
| Primary Indicator | Indicator | Low | Medium | High |
|---|---|---|---|---|
| Spatial Carrying Capacity | Population Density (Person/square kilometer) | <173.54 | 173.54~512.25 | >512.25 |
| Proportion of Built-up Area (%) | <0.93 | 0.93~5 | >5 | |
| Population Development | Urbanization Rate (%) | <34.2 | 34.2~76.1 | >76.1 |
| Permanent Resident Population (10,000 persons) | <236 | 236~662.67 | >662.67 | |
| Aging Degree (%) | >6.69 | 6.69~15.71 | <15.71 | |
| Social Service Capacity | Number of Hospital Beds (Unit) | <10,722 | 10,722~29,608 | >29,608 |
| Number of Urban Centers (Unit) | <3 | 3~7 | >7 | |
| Highway Passenger Volume (10,000 person-times) | <2143.45 | 2143.45~10,028.2 | >10,028.2 | |
| Industrial Momentum | Proportion of Secondary Industry (%) | Tertiary share < Secondary share and Secondary share < 45% | Secondary share ≥ 45% | Tertiary share > Secondary share |
| Proportion of Tertiary Industry (%) | ||||
| Number of Patent Authorizations (Unit) | <3357 | 3357~10,033 | >10,033 | |
| Number of Industrial Enterprises above Designated Size (Unit) | <690.02 | 690.02~2030.04 | >2030.04 | |
| Total Profits of Industrial Enterprises above Designated Size (100 million yuan) | <17.92 | 17.92~427.13 | >427.13 | |
| Economic Vitality | GDP (100 million yuan) | <1354.37 | 1354.37~10,000 | >10,000 |
| GDP Growth Rate (%) | <4 | 4~15 | >15 | |
| Per Capita GDP (10,000 yuan) | <2.67 | 2.67~10.93 | >10.93 | |
| Total Imports and Exports (100 million yuan) | <261.28 | 261.28~1554.83 | >1554.83 | |
| Total Retail Sales of Consumer Goods (100 million yuan) | <521.13 | 521.13~1527.38 | >1527.38 | |
| Local General Public Budget Expenditure (100 million yuan) | <132 | 132~212.12 | >212.12 |
| Test Indicator | Tercile Method | Jenks Natural Breaks |
|---|---|---|
| Adjacent-stage agreement rate (difference <= 1) | 92.99% | 91.39% |
| Kappa coefficient | 0.741 | 0.559 |
| Weighted Kappa (linear weights) | 0.799 | 0.695 |
| Validation Item | Key Result | Interpretation |
|---|---|---|
| Elbow method | SSE reduction remains large from K = 2 to K = 3 (24.3%) and slows from K = 3 to K = 4 (16.3%). | K = 3 retains major structure while avoiding unnecessary fragmentation. |
| Silhouette coefficient | K = 3 reaches 0.2896; K >= 4 does not improve compactness. | Although K = 2 is coarser and slightly higher, K = 3 better captures intermediate stage differences. |
| Gap Statistic | Gap increases from 0.7029 at K = 2 to 0.8435 at K = 3. | K = 3 is supported as the minimum reasonable cluster number under the study’s theoretical design. |
| Cluster-size distribution | At K = 3, cluster sizes remain balanced; at K = 5, the smallest cluster contains only 8.4% of cities. | K = 3 improves interpretability and policy operability. |
| Initial-seed sensitivity | For K = 3, mean ARI = 0.8571 across 100 random seeds. | The clustering result is relatively stable under random initialization. |
| Subsample stability | For K = 3, the 90% random-subsample test yields mean ARI = 0.9177 (SD = 0.0683). | The identified cluster structure is robust to moderate sample perturbation. |
| Category | Economic Vitality | Industrial Momentum | Social Service Capacity | Population Development | Spatial Carrying Capacity |
|---|---|---|---|---|---|
| 1 | 1.755 | 1.890 | 2.051 | 1.974 | 1.470 |
| 2 | 1.366 | 1.519 | 1.540 | 1.673 | 1.187 |
| 3 | 2.304 | 2.638 | 2.328 | 2.373 | 2.326 |
| Development Level | Category | Scale | Structure | Speed | ||||
|---|---|---|---|---|---|---|---|---|
| GDP (100 Million) | Per Capita GDP (10,000) | Permanent Resident Population (10,000 Persons) | Proportion of Tertiary Industry (%) | Urbanization Rate (%) | Aging Degree (%) | GDP Growth Rate | ||
| High | 1 | 10487.34 | 37.91 | 947.30 | 55.15 | 94.38 | 5.20 | 10.09 |
| 2 | 5845.34 | 8.47 | 741.84 | 48.54 | 69.01 | 11.94 | 8.20 | |
| 3 | 22,308.52 | 13.44 | 1817.05 | 64.47 | 84.38 | 11.95 | 6.16 | |
| Medium | 1 | 1657.71 | 3.33 | 537.83 | 35.52 | 45.83 | 10.17 | 11.20 |
| 2 | 2724.22 | 8.63 | 338.40 | 45.06 | 67.26 | 12.15 | 7.36 | |
| 3 | 2257.95 | 5.08 | 460.73 | 46.60 | 54.11 | 14.82 | 5.64 | |
| Low | 1 | 1034.87 | 8.22 | 143.38 | 36.51 | 70.72 | 10.89 | 8.45 |
| 2 | 900.78 | 4.28 | 222.55 | 46.52 | 54.22 | 14.12 | 4.42 | |
| 3 | 664.76 | 2.47 | 296.46 | 34.24 | 41.02 | 9.10 | 12.44 | |
| Initial Stage | Growth Stage | Maturity Stage | Decline Stage | Transition Stage | |
|---|---|---|---|---|---|
| Eastern Region | 0.0% | 61.6% | 11.6% | 5.8% | 20.9% |
| Central Region | 0.0% | 30.0% | 3.8% | 20.0% | 46.3% |
| Western Region | 7.0% | 39.5% | 3.5% | 27.9% | 22.1% |
| Northeast Region | 0.0% | 14.7% | 0.0% | 73.5% | 11.8% |
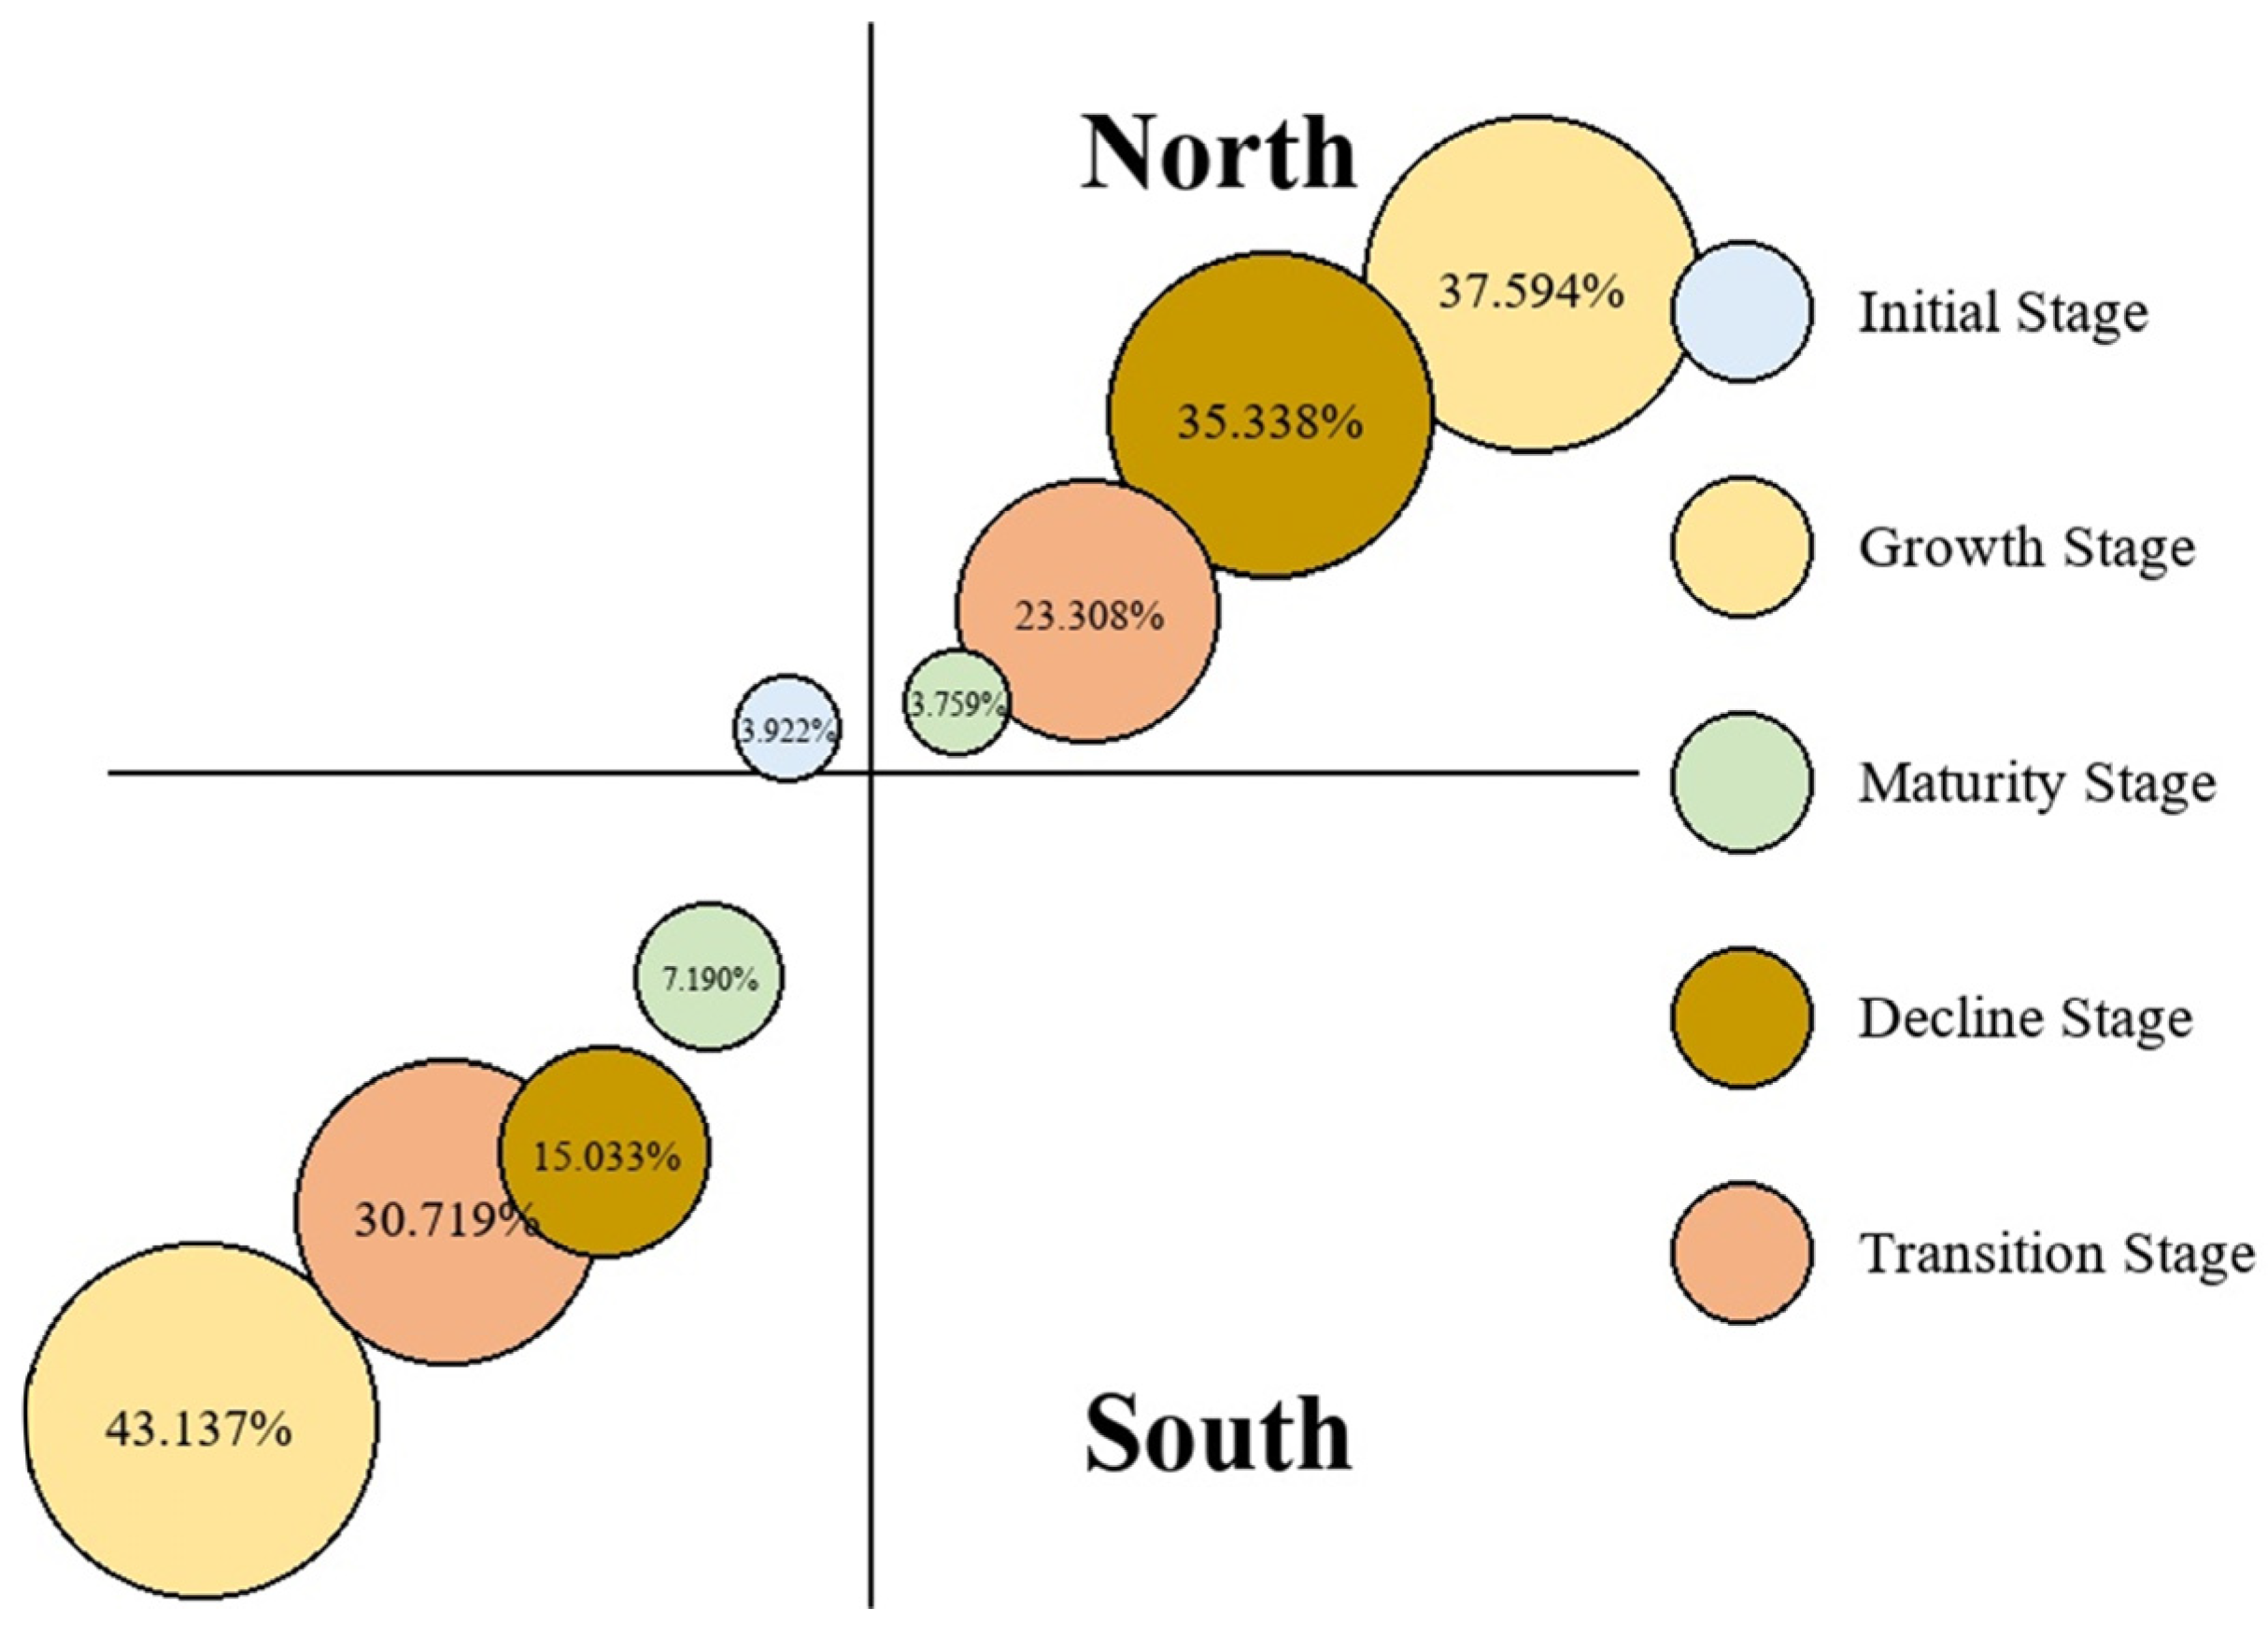
| Southern Region | 3.9% | 43.2% | 7.1% | 13.5% | 32.3% |
| Northern Region | 0.0% | 37.4% | 3.8% | 37.4% | 21.4% |
| Urban Agglomeration | Initial Stage | Growth Stage | Maturity Stage | Decline Stage | Transition Stage |
|---|---|---|---|---|---|
| Yangtze River Delta Urban Agglomeration | 0.0% | 63.0% | 18.5% | 7.4% | 11.1% |
| Beijing–Tianjin–Hebei Urban Agglomeration | 0.0% | 38.5% | 15.4% | 7.7% | 38.5% |
| Pearl River Delta Urban Agglomeration | 0.0% | 77.8% | 22.2% | 0.0% | 0.0% |
| Middle Reaches of the Yangtze River Urban Agglomeration | 0.0% | 40.7% | 7.4% | 11.1% | 40.7% |
| Chengdu–Chongqing Economic Circle | 0.0% | 12.5% | 12.5% | 6.3% | 68.8% |
Disclaimer/Publisher’s Note: The statements, opinions and data contained in all publications are solely those of the individual author(s) and contributor(s) and not of MDPI and/or the editor(s). MDPI and/or the editor(s) disclaim responsibility for any injury to people or property resulting from any ideas, methods, instructions or products referred to in the content. |
© 2026 by the authors. Licensee MDPI, Basel, Switzerland. This article is an open access article distributed under the terms and conditions of the Creative Commons Attribution (CC BY) license.
Share and Cite
Yuan, X.; Liu, S.; Li, Z.; Jiang, H. Research on the Identification and Spatiotemporal Evolution of China’s Urban Life Cycle: From the Perspective of Organic Entities. Land 2026, 15, 875. https://doi.org/10.3390/land15050875
Yuan X, Liu S, Li Z, Jiang H. Research on the Identification and Spatiotemporal Evolution of China’s Urban Life Cycle: From the Perspective of Organic Entities. Land. 2026; 15(5):875. https://doi.org/10.3390/land15050875
Chicago/Turabian StyleYuan, Xiaoling, Shuiting Liu, Zhaopeng Li, and Hao Jiang. 2026. "Research on the Identification and Spatiotemporal Evolution of China’s Urban Life Cycle: From the Perspective of Organic Entities" Land 15, no. 5: 875. https://doi.org/10.3390/land15050875
APA StyleYuan, X., Liu, S., Li, Z., & Jiang, H. (2026). Research on the Identification and Spatiotemporal Evolution of China’s Urban Life Cycle: From the Perspective of Organic Entities. Land, 15(5), 875. https://doi.org/10.3390/land15050875