Article

Carbon Balance of Pulse Crops in Rotation with Spring Wheat

by
Upendra M. Sainju
1,*,
Chloe Turner-Meservy
1 and
Menuka Maharjan
2,3
1
Northern Plains Agricultural Research Laboratory, Agricultural Research Service, United States Department of Agriculture (USDA), Sidney, MT 59270, USA
2
School of Forestry and Natural Resource Management, Institute of Forestry, Tribhuvan University, Kathmandu 44600, Nepal
3
Institute of Forestry, Tribhuvan University, Hetauda 44107, Nepal
*
Author to whom correspondence should be addressed.
Land 2026, 15(5), 842; https://doi.org/10.3390/land15050842
Submission received: 16 April 2026 / Revised: 11 May 2026 / Accepted: 13 May 2026 / Published: 14 May 2026

Abstract

Carbon footprint and C balance are used to understand whether an agroecosystem is a C source or sink. Our objective was to evaluate C inputs and outputs for determining C balance for pulse crops in rotation with spring wheat (Triticum aestivum L.) from 2021 to 2022 to 2024–2025 in the US northern Great Plains. Pulse crops (chickpea [Cicer arietinum L], lentil [Lens culinaris Medik.], and pea [Pisum sativum L.]) were rotated with spring wheat to form four crop rotations (chickpea–spring wheat, lentil–spring wheat, pea–spring wheat, and spring wheat–spring wheat). Straw C was 26–74% lower for pulse crops than spring wheat, but 19–23% greater for pea–spring wheat than chickpea–spring wheat and lentil–spring wheat. Root biomass and rhizodeposit C were 24–31% greater for spring wheat–spring wheat than chickpea–spring wheat and pea–spring wheat. Grain C was 21% greater for pea than chickpea, but 64–97% lower for pulse crops than spring wheat. Cumulative CO2 flux from May to April was 14–17% greater for spring wheat–spring wheat than chickpea–spring wheat and lentil–spring wheat. Soil C sequestration rate was greater for pea and spring wheat than chickpea and lentil, or greater for pea–spring wheat and spring wheat–spring wheat than other crop rotations. Carbon balance was 5–16% lower for pulse crops than spring wheat, or 9–16% lower for pulse crop–spring wheat rotations than spring wheat–spring wheat. Because of greater C input and C sequestration rate, spring wheat can reduce C loss compared to pulse crops, or continuous spring wheat can reduce the loss compared to pulse crop–spring wheat rotations.

1. Introduction

Pulse crops, such as chickpea, lentil, and pea, are increasingly used to replace fallow in dryland crop–fallow systems to increase annualized crop yield, soil health, and environmental quality in the semiarid region of the US Northern Great Plains [1,2,3]. Pulse crops, being legumes, fix N biologically from the atmosphere, which increases tissue N concentration compared to nonlegume crops [4,5]. As a result, pulse crop residues supply greater N than nonlegume (e.g., spring wheat) residues and reduce N fertilization rates for succeeding crops when pulse crops are rotated with nonlegume crops [4,5]. Other benefits of pulse crop–nonlegume rotations include increased water- and N-use efficiencies [1,6,7], reduced risk of crop failure, lower weed, disease, and pest pressure, and increased farm income [1,8,9] compared to crop–fallow and continuous nonlegume cropping.
The C balance of an agroecosystem, which involves C inputs and outputs and soil C sequestration rate, shows whether a system is a C source or sink [10,11]. Carbon inputs include inputs from crop straw, root, and rhizosphere; outputs include C removal from grain harvest and heterotrophic soil respiration; and the soil C sequestration rate which is calculated as the change in soil organic C (SOC) stock in a year [12,13,14]. Carbon is assimilated into different plant components, including straw, grain, root, and rhizodeposit during photosynthesis [15]. Carbon is removed from the plant either through grain harvest or from straw and grain when both are harvested. Carbon is also lost from the agroecosystem through soil respiration, which includes root respiration and mineralization of crop residue and soil organic matter [10,11]. A part of the crop residue, such as straw and root, returned to the soil, is converted into stable soil organic matter, but the unstable portion is mineralized by soil microorganisms, resulting in CO2 emissions [16,17]. Although root respiration is a major pathway of C loss from the agroecosystem, such loss is not accounted for in the calculation of C balance because it is not a part of C input, output, or storage in the soil [12,13].
Crop species and rotation can variably affect above- and belowground biomass production and C content. Straw and grain yields can be greater for pea than chickpea and lentil, but lower for pulse crops than spring wheat because pulse crops do not receive N fertilizers as spring wheat does [18,19,20]. As a result, straw and grain yields can be lower for pulse crop–spring wheat rotations than continuous spring wheat [8,21,22]. Gan et al. [23] found that root biomass C at 0–100 cm was 47–70% lower for pea than chickpea and lentil. Several researchers [24,25] showed that root biomass C at 0–100 cm was lower for pulse crops than spring wheat.
The emissions of CO2 from croplands can also be affected by crop species and rotation due to variations in the quality and quantity of crop residue returned to the soil [26,27]. The emissions can be greater for nonlegumes than legumes due to the increased amount of crop residue returned to the soil [27,28,29]. As a result, CO2 emissions can also be greater for continuous nonlegumes than legume-nonlegume rotations [27,28,29]. Several researchers [30,31], however, reported that crop rotation had no effect on CO2 emissions.
Most studies [10,11,15,32] reported that croplands are a source of C. However, maize (Zea mays L.) and wheat-based cropping systems can be a C sink due to increased C sequestration rates [33,34,35]. Dalmago et al. [34] reported that irrigated cropping systems were a C sink, but dryland cropping systems were a C source.
The eddy covariance method, which requires expensive equipment and large areas with fewer treatments and replications, has been frequently used to determine C balance from agroecosystems [10,11,15,32,36]. This method, however, may not be applicable for experiments with numerous treatments and replications conducted on small plots [37,38]. For such experiments, the static chamber method may be used to measure CO2 flux, although the method measures the flux frequently (at intervals of 3–14 d depending on the magnitude of the flux) compared with continuous measurement using the eddy covariance method [37,38].
Information on the C footprint and C balance under pulse crops and pulse crop–nonlegume rotations is lacking. In this study, we used the static chamber method to measure CO2 flux; C storage in grain, straw, root, and rhizodeposit as C inputs and outputs; and soil C sequestration rate as change in soil organic C (SOC) stock in a year for pulse crops and spring wheat as well as for pulse crops–spring wheat rotations from 2021 to 2025 in the US northern Great Plains. This study will provide much-needed information on C flows in the soil–plant–air continuum and C balance for pulse crops and pulse crop–spring wheat rotations to identify which cropping systems will gain C, thereby reducing C loss primarily through CO2 emissions in the US northern Great Plains. The research questions were as follows: (1) Do C footprints and C balance differ among pulse crops, among pulse crops and spring wheat, and among pulse crop–spring wheat rotations and continuous spring wheat? and (2) What are the best pulse crop species and rotations to reduce C loss from dryland agroecosystems? We hypothesized that C footprint, C sequestration rate, and C balance would be lower for chickpea and lentil than for pea, lower for pulse crops than spring wheat, and lower for pulse crops–spring wheat than continuous spring wheat. The objectives of this study were to (1) determine C storage in grain, straw, root, and rhizodeposit of pulse crops and spring wheat as well as for pulse crop–spring wheat and continuous spring wheat from 2021 to 2025; (2) measure CO2 flux and soil C sequestration rate during this period; and (3) calculate C balance based on C inputs, outputs, and sequestration rate for pulse crops, spring wheat, and pulse crop–spring wheat rotations in the US northern Great Plains.

2. Materials and Methods

2.1. Field Experimentation

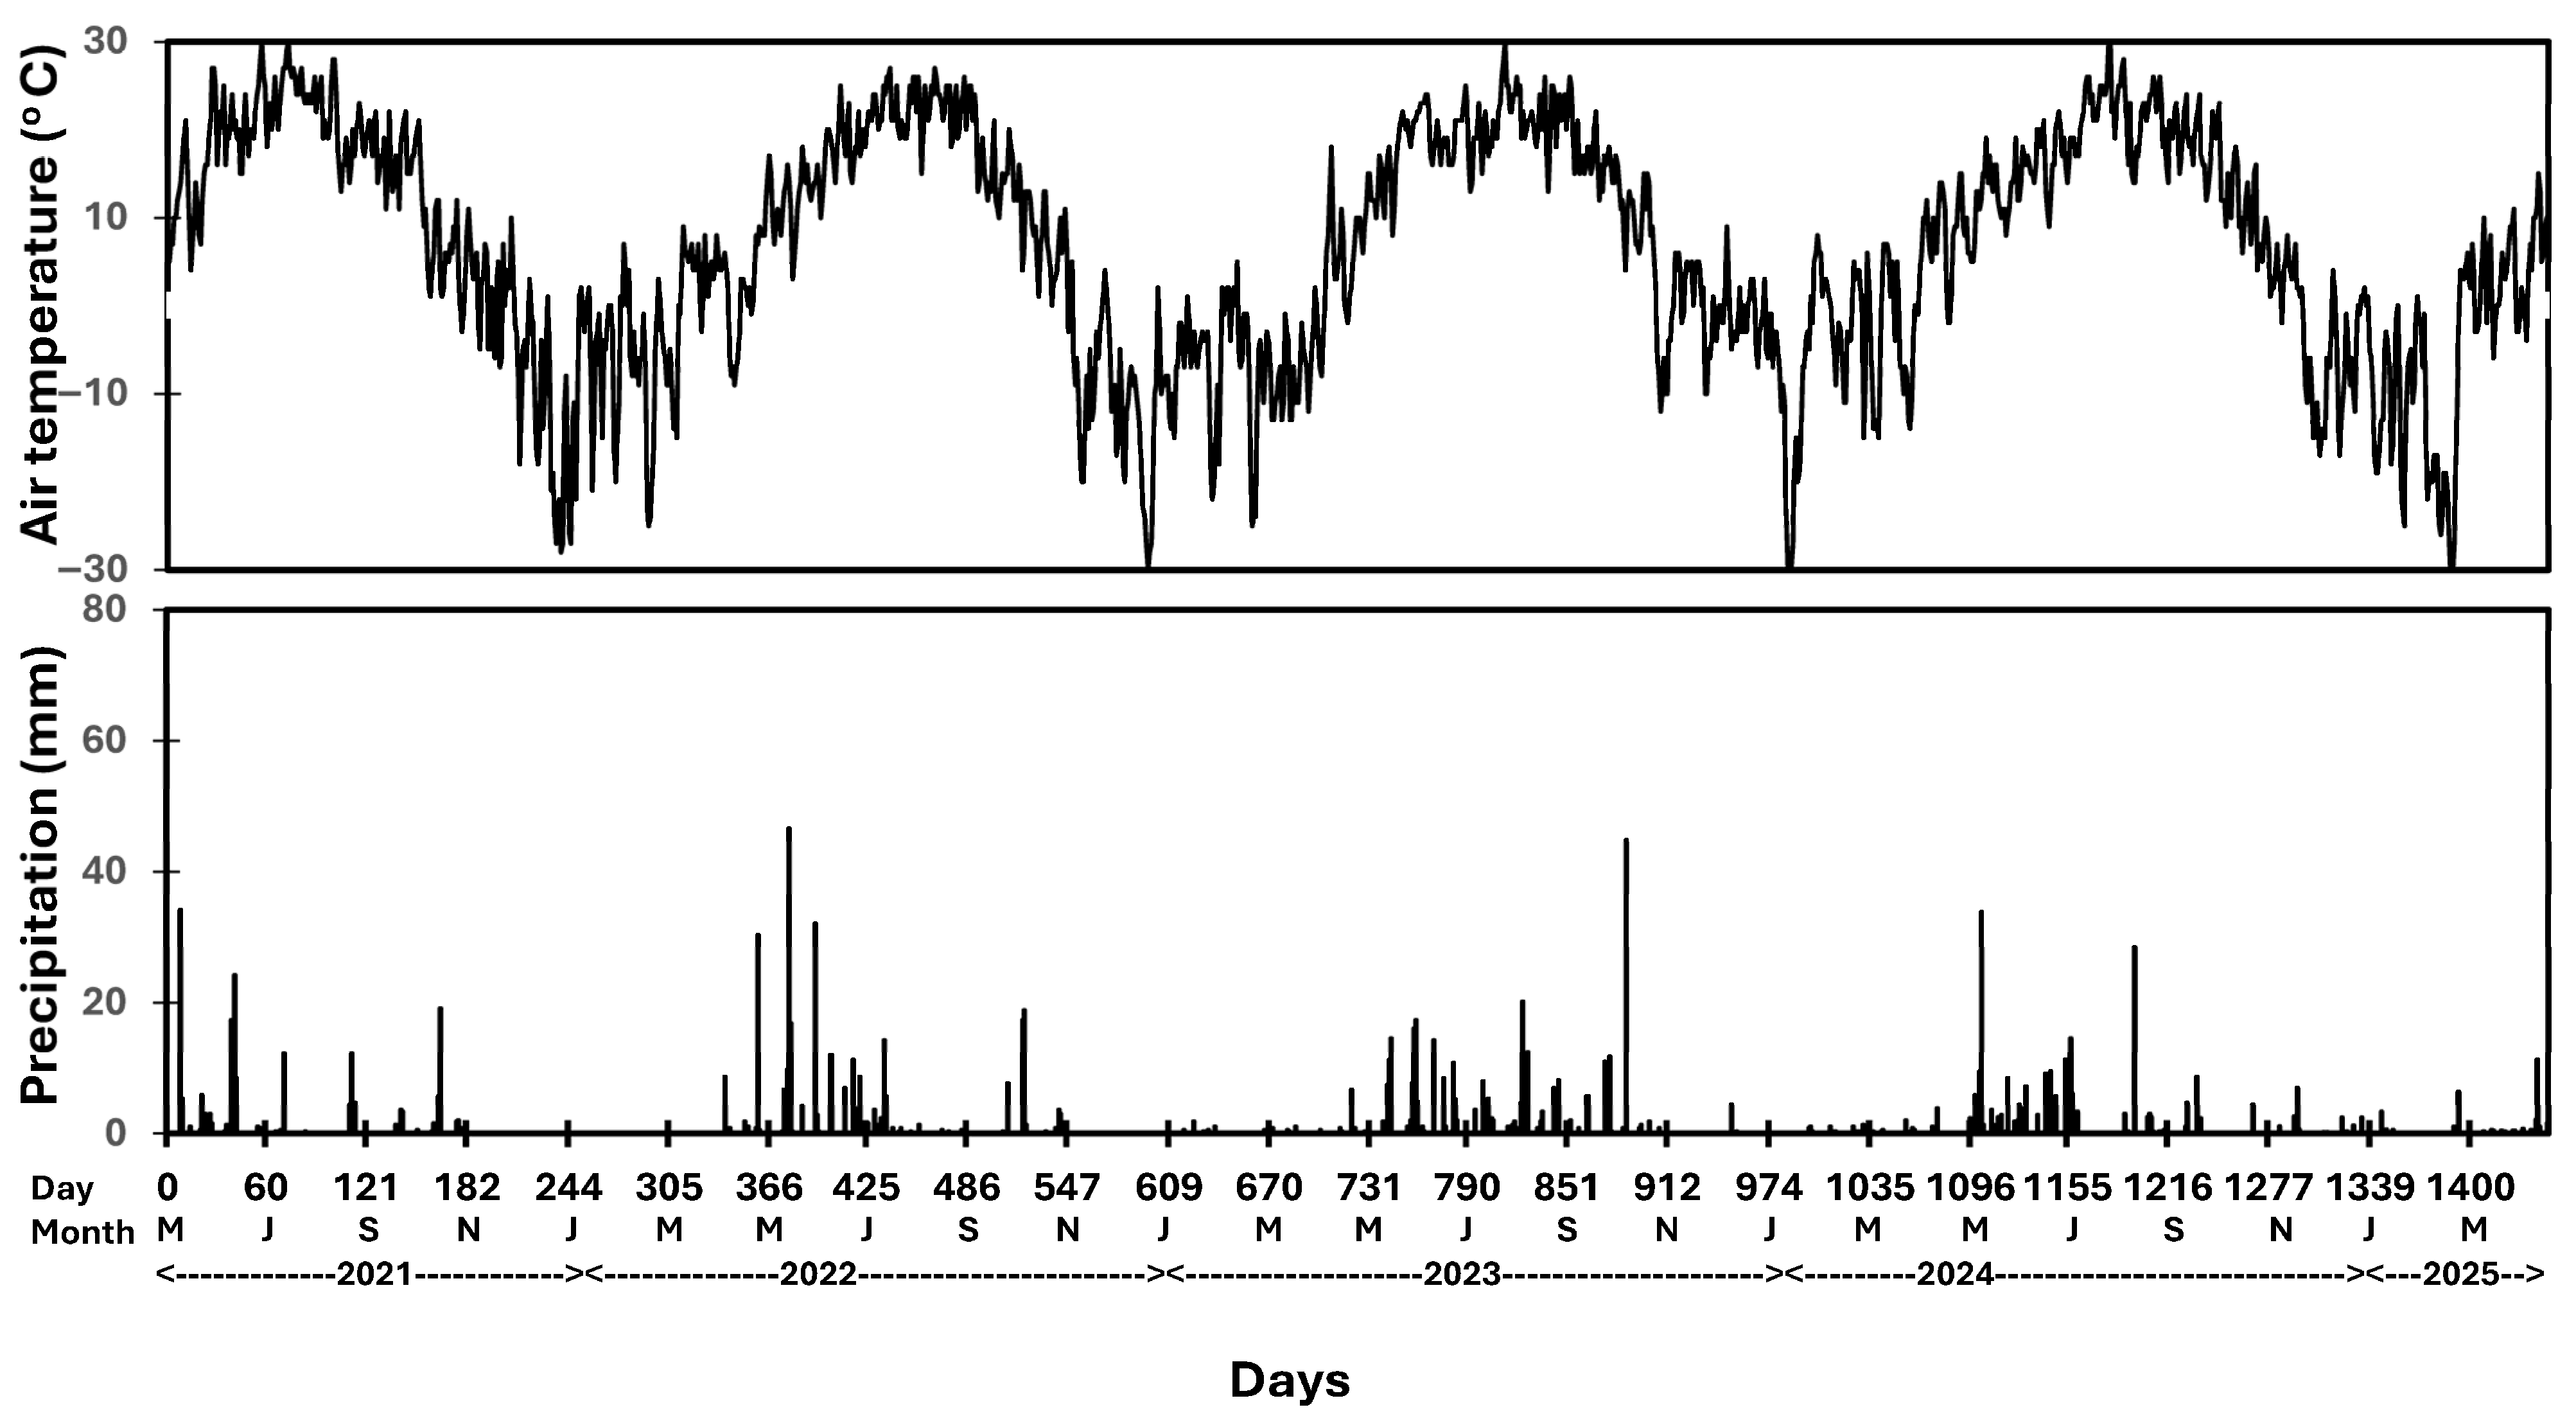
The field experiment was conducted from May 2021 to April 2025 at a site 11 km west of Sidney (48°33′ N, 104°50′ W), Montana, USA. The mean (30-yr average) annual air temperature at the site is 7 °C, and annual precipitation is 341 mm, of which 77% occurs in the crop growing season (April–August). During the study period, daily air temperature fluctuated from −30°C in December 2022, January 2023, and February 2024 to 30°C in June and July 2021, August 2023, and July 2024 (Figure 1). Total daily precipitation occurred mostly from May to October. Intense precipitation > 20 mm occurred in May, June, and October 2021; April, May, June, and October 2022; August and October 2023; and May and August 2024. Total annual precipitation from May to April was 230 mm in 2021–2022, 279 mm in 2022–2023, 330 mm in 2023–2024, and 263 mm in 2024–2025. The site had Williams loam (fine–loamy, mixed, superactive, frigid, Typic Argiustolls) soil with 350 g kg−1 sand, 325 g kg−1 silt, 325 g kg−1 clay, 13.2 g kg−1 organic matter, and 7.2 pH at the 0–20 cm depth. The site was previously cropped with continuous spring wheat under conventional tillage for 10 yr.
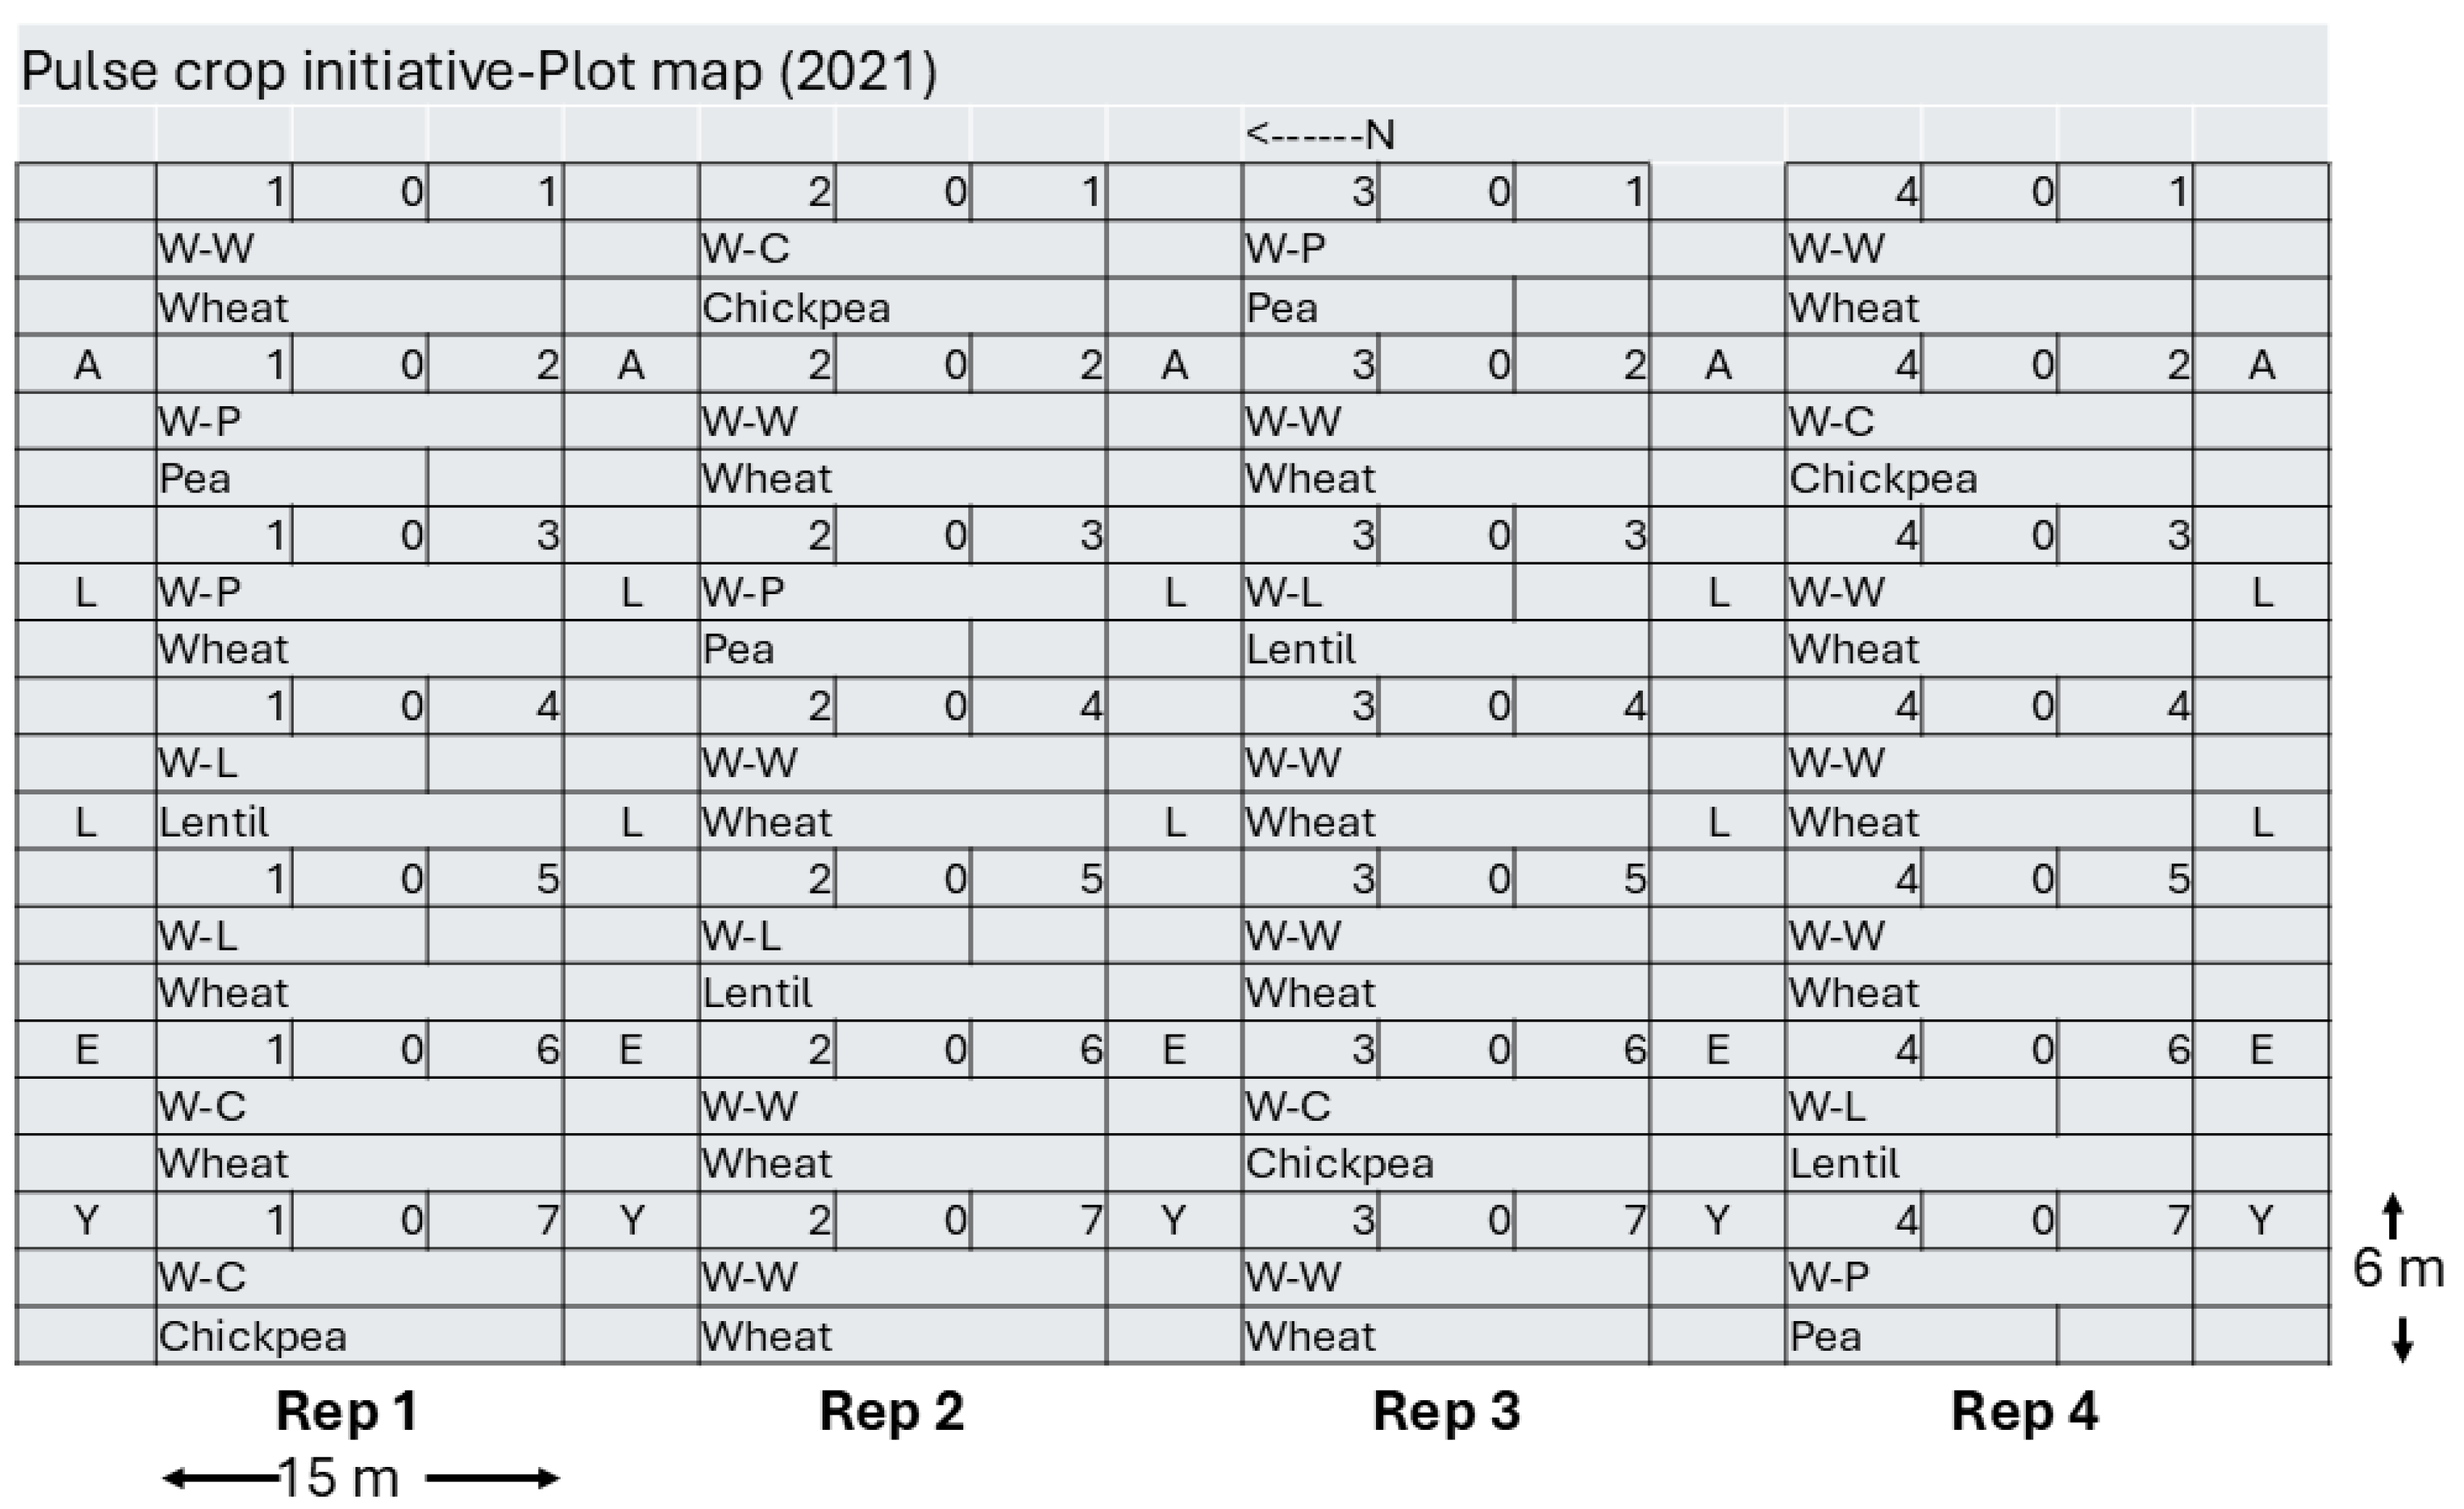
Three pulse crops (chickpea, lentil, and pea) and a control crop (spring wheat) were grown in rotation with spring wheat to form four crop rotations (chickpea–spring wheat, lentil–spring wheat, pea–spring wheat, and spring wheat–spring wheat) where both phases of the rotation appeared each year. Crops and crop rotations, considered as experimental units, were arranged in a randomized block design with four replications (Figure 2). The plot size was 15 m × 6 m.
From late April to early May 2021–2024, crops were planted using a no-till drill to a depth of 3.8 cm under the no-till condition. The seeding rate for chickpea (cv. Orion) was 200 kg ha−1, lentil (cv. Maxum red) 70 kg ha−1, pea (cv. Majoret) 180 kg ha−1, and spring wheat (cv. Vida) 80 kg ha−1. Crops were planted at a spacing of 20 cm. Pulse crops were treated with inoculants (Rhizobium leguminosarum for pea and lentil and Rhizobium ciceri for chickpea) before planting to enhance N fixation and yield. At seeding, all crops received P fertilizer as monoammonium phosphate (MAP) at 11 kg P ha−1 and K fertilizer as muriate of potash at 27 kg K ha−1, which were banded 5 cm to the side and 5 cm below the seeds. The application of MAP also supplied N at 5 kg N ha−1 for pulse crops. Spring wheat received a banded application of N fertilizers as urea and MAP at 100 kg N ha−1. To reduce the negative consequences of residual NO3-N on soil and environmental quality, N fertilization rate for spring wheat was adjusted to soil NO3-N content to a depth of 60 cm determined in the autumn of the previous year. Therefore, N fertilization rate for spring wheat included both soil and fertilizer N, which ranged from 70 to 85 kg N ha−1, depending on soil NO3-N content in previous years. Crops were grown in dryland conditions, and no irrigation was applied.
From late July to early August each year, plants were cut 2 cm above the ground from four 1 m rows randomly two days before grain harvest and separated into straw and grains. Straw yield was determined by oven-drying straw at 70 °C for 3 d and weighing. Grain yield was determined by harvesting grains with a self-propelled combine from an area of 11.0 m × 1.5 m after cleaning the grains and oven-drying a subsample at 70 °C for 7 d. After grain harvest, crop residue (such as straw) was returned to the soil. Straw and grain C concentrations were determined by using a C and N analyzer (LECO, St. Joseph, MI, USA) after grinding a sample of the straw and grain to 1 mm. Carbon storage in straw and grain was determined by multiplying C concentrations by their yields.

2.2. Root and Soil Sample Collections

To determine root biomass and C storage, soil samples were collected to a depth of 120 cm using a hydraulic probe (5.0 cm inside diameter) from five locations within a plot after crop harvest in September 2021–2024. Soil cores were divided into 0–15, 15–30, 30–60, 60–90, and 90–120 cm depth intervals. Each core was placed in tubes containing a screen (0.50 mm) and washed with water for 2 h using a hydropneumatic elutriator which removed clay and silt particles. Roots and sand particles left in the tube were transferred to a 1000 mL beaker containing 500 mL of distilled water. Roots that floated in the water were picked by using tweezers. Root samples collected from five locations within a plot were composited by depth intervals and oven-dried at 70 °C for 7 d, from which root biomass yield was determined. Carbon concentration in the root was determined using a C and N analyzer as described above after grinding roots to 1 mm. Carbon storage in the root was determined by multiplying root biomass by C concentration. Root biomass C at 0–120 cm was determined by summing root C storage from each depth layer. Rhizodeposit C was estimated as 8% of root biomass C [39].
To determine soil C sequestration rate, another set of soil samples was collected from the 0–10 cm depth using a hand probe (3.5 cm inside diameter) at five locations within a plot after crop harvest in April 2021 and 2025. In 2021, soil samples from all plots were composited into one sample to make a homogeneous sample so that the SOC stock is similar for all treatments at the beginning of the experiment where the effect of soil properties on SOC stock is eliminated. In 2025, at the end of the experiment, soil samples were analyzed separately for different treatments to determine the effect of treatment on SOC stock. The 0–10 cm depth of soil sampling was selected to match the depth at which the anchor of the static chamber used to measure CO2 flux was inserted into the soil. The other reason for collecting soil samples at 0–10 cm was the fact that C sequestration in dryland soils usually occurs at surface soil (<15 cm depth) for experiments < 5 yr [10,11,14]. Soil samples were composited, air-dried, ground, and sieved to 2 mm. A portion of the sample was oven-dried at 105 °C for 24 h, from which the bulk density was calculated by dividing the weight of the oven-dried soil by the volume of the core. The SOC concentration in soil samples was determined by using a C and N analyzer (LECO) as above, after further grinding a subsample to 0.5 mm and removing inorganic C by treating with 6 M HCl. The SOC stock was calculated by multiplying the SOC concentration by the bulk density and the thickness of the soil layer. The soil C sequestration rate was calculated by deducting the SOC stock in 2021 from the stock in 2025 and dividing by the number of years (4 yr).

2.3. Measurement of Carbon Dioxide Flux

The CO2 flux was measured from May 2021 to April 2025 using the static chamber method described by Parkin and Venterea [37]. The chamber included an anchor (20 cm tall, 20 cm inside diameter) and a cover (10 cm tall, 20 cm inside diameter), both made from polyvinyl chloride pipe. During chamber deployment in the plot, the anchor was inserted to a depth of 10 cm into the soil, exposing the other 10 cm above the surface. Each plot had two chambers per plot, one at each end of the plot, 1 m away from the edges, to reduce the spatial variability of CO2 fluxes. Anchors were removed during planting and fertilization and immediately deployed within a day near the same place for gas sampling. The cover with two ports, one for gas sampling and another for ventilation, which were closed with rubber septa, was placed over the anchor and tightly sealed by extending a rubber sheet attached to the cover during gas sampling. Gases were sampled during the morning hours (9 AM to 12 noon) to reduce the diurnal variability of CO2 flux. Samplings occurred at intervals of 3 d for 2 mo after planting, 7 d until crop harvest, 14 d until snowfall, 28 d during the winter, and 7 d during snowmelt in the spring throughout the year. The wider interval during the winter was used because CO2 flux is minimal during this period due to reduced microbial activity. Gases were sampled from the port using a needle attached to a 20 mL syringe at 0, 20, and 40 min intervals and transferred to a 12 mL pre-evacuated vial sealed with butyl rubber septa (Labco Ltd., High Wycombe, UK). A gas chromatograph (Varian, Palo Alto, CA, USA) attached with a thermoconductivity detector was used to determine CO2 concentration in the gas sample in the laboratory. The detection limit of the gas chromatograph was 350 to 2000 µL L−1 for CO2. Using the regression analysis of concentration vs. time from three standard gases (R2 ≥ 0.99, p ≤ 0.001), the CO2 flux for gas samples was determined from the change in linear concentration gradient over time [37]. Cumulative annual CO2 flux from May to April was calculated by linearly interpolating data points and integrating the underlying area [37,40]. Daily air temperature and precipitation were obtained from a meteorological station, 100 m from the study site.

2.4. Calculation of Carbon Balance

Carbon input from crop seed was calculated by multiplying C concentration of the seed determined by using the C and N analyzer as above by the seeding rate. Carbon input from urea fertilizer was determined by multiplying C concentration by the amount of urea applied to spring wheat in each year. Carbon input from precipitation was calculated by multiplying total annual precipitation by C concentration in the precipitation water, assuming that C concentration of the precipitation water was 5.5 mg L−1 [41]. The proportion of C output due to heterotrophic CO2 flux (Chr) [14] was calculated as:
Chr = Mean cumulative CO2 flux for fallow/mean cumulative CO2 flux for spring wheat and pulse crops
The numerator shows CO2 flux from microbial respiration and soil organic matter mineralization (heterotrophic respiration) during the fallow period when no crop was present. The denominator shows total CO2 flux from both autotrophic (root respiration) and heterotrophic respirations when a crop was present. The values for Chr for spring wheat (0.66) and pulse crops (0.79) were obtained from Sainju and Allen [14]. The C balance [13,14] was calculated as:
C balance = Total C input − total C output ± soil C sequestration rate
Total C input was calculated as the sum of C inputs from straw, root, rhizodeposit, crop seed, urea fertilizer, and precipitation. Total C output was calculated as the sum of C outputs from grain harvest, heterotrophic respiration (Chr × cumulative annual CO2 flux), and C lost through surface runoff and leaching. Carbon outputs from surface runoff and leaching were considered negligible because these losses are minimal in dryland cropping systems due to limited precipitation in the semiarid region [14]. The positive value of the soil C sequestration rate was used when C was gained in the soil for a crop or crop rotation from 2021 to 2025 and the negative value when C was lost. An agroecosystem is a C source if the C balance is negative and a C sink if the C balance is positive.

2.5. Data Analysis

Data for CO2 flux in a year was analyzed using the Analysis of Repeated Measures procedure in the SAS-MIXED model (SAS/STAT version 6.9) [42] after averaging data from two chambers per plot. Data were tested for normal distribution and homogeneity before analysis by using the above model. Crop or crop rotation (as the experimental unit) was considered as the fixed effect, replication as the random effect, and date of sampling as the repeated measure variable for data analysis. Data for C storage in grain, straw, root, and rhizosphere, cumulative annual CO2 flux, Chr, SOC, C sequestration rate, and C balance were analyzed as above by replacing the date of sampling by the year as the repeated measure variable. The covariance structure used was the First-Order Autoregressive model. For crop rotations, data were analyzed as above after averaging values for each crop phase within a rotation in a year. Means and interactions were separated using the least square means test when significant [42]. Statistical significance among crops and crop rotations was tested using a p value of ≤0.05, unless otherwise stated.

3. Results

3.1. Straw Carbon

Straw C was significantly affected by crop, year, and crop × year interaction (Table 1). Straw C was 47–66% greater for pea and spring wheat than chickpea and lentil in 2021–2022. In 2022–2023, straw C was 44% greater for chickpea than lentil and 49–63% greater for spring wheat than lentil and pea. In 2023–2024, straw C was 14–42% greater for pea than chickpea and lentil and 30–84% greater for spring wheat than pulse crops. In 2024–2025, straw C was 100–131% greater for lentil and pea than chickpea and 36–216% greater for spring wheat than pulse crops. Mean straw C across years was 23–43% greater for pea than chickpea and lentil and 26–74% greater for spring wheat than pulse crops.
Straw C was also significantly affected by crop rotation, year, and the crop rotation × year interaction (Table 1). In 2022–2023, straw C was 58–76% greater for chickpea–spring wheat and spring wheat–spring wheat than lentil–spring wheat. In 2024–2025, straw C was 33–47% greater for lentil–spring wheat, pea–spring wheat, and spring wheat–spring wheat than chickpea–spring wheat. There was no difference in straw C among crop rotations in 2021–2022 and 2023–2024. Mean straw C across years was 19–23% greater for pea–spring wheat than chickpea–spring wheat and lentil–spring wheat. Averaged across crops and crop rotations, straw C was lower in 2021–2022 than other years.

3.2. Grain Carbon

Grain C was also significantly affected by crop, year, and the crop × year interaction (Table 1). Grain C was 45% greater for spring wheat than pea in 2021–2022. In 2022–2023, grain C was 28–78% greater for chickpea than lentil and pea and 34–139% greater for spring wheat than pulse crops. In 2023–2024, grain C was 102–122% greater for spring wheat than pulse crops. In 2024–2025, grain C was 236–269% greater for lentil and pea than chickpea and 30–379% greater for spring wheat than pulse crops. Mean grain C across years was 21% greater for pea than chickpea and 64–97% greater for spring wheat than pulse crops. For crop rotations, grain C was significantly affected by year but not by crop rotation and the crop rotation × year interaction (Table 1). Averaged across crops and crop rotations, grain C was lower in 2021–2022 than other years.

3.3. Root Biomass and Rhizodeposit Carbon

Root biomass and rhizodeposit C to a depth of 120 cm were not affected by crop, year, and the crop × year interaction (Table 2). Root biomass C ranged from 0.35 Mg C ha−1 for lentil in 2021–2022 to 0.67 Mg C ha−1 for lentil in 2022–2023. Rhizodeposit C ranged from 0.02 Mg C ha−1 for chickpea in 2021–2022 to 0.05 Mg C ha−1 for lentil in 2022–2023 and 2024–2025.
Root biomass and rhizodeposit C to a depth of 120 cm were significantly affected by crop rotation but not by year and the crop rotation × year interaction (Table 2). Mean root biomass C across years was 32–45% greater for spring wheat–spring wheat than chickpea–spring wheat and pea–spring wheat. Similarly, mean rhizodeposit C across years was 67% greater for spring wheat–spring wheat than pea–spring wheat.

3.4. Carbon Inputs from Crop Seeds, Fertilizer, and Precipitation

Carbon inputs from crop seeds, urea fertilizer, and precipitation were minor (Table 3). Crop seed C was significantly greater for chickpea and pea than lentil and spring wheat. Similarly, crop seed C was significantly greater for chickpea–spring wheat than lentil–spring wheat and spring wheat–spring wheat. Because of the non-application of urea fertilizer to pulse crops, C contribution from urea was 0 Mg C ha−1 for pulse crops but was 0.02 Mg C ha−1 for spring wheat due to urea application. This resulted in 0.01 Mg C ha−1 of urea C for pulse crop–spring wheat rotations and 0.02 Mg C ha−1 for spring wheat–spring wheat. Carbon input from precipitation ranged from 0.01 Mg C ha−1 in 2021–2022 and 2024–2025 to 0.02 Mg C ha−1 in 2022–2023 and 2023–2024.

3.5. Soil Carbon Sequestration

Because of the SOC measurement of composite samples for all plots at the beginning of the experiment, SOC was similar for all crops and crop rotations in 2021 (Table 4). In 2025, SOC was 3–6% greater for pea and spring wheat than lentil. Similarly, SOC was 3–4% greater for pea–spring wheat and spring wheat–spring wheat than lentil–spring wheat. As a result, C sequestration rate varied from −0.09 Mg C ha−1 yr−1 for lentil to 0.22 Mg C ha−1 yr−1 for spring wheat and was significantly greater for pea and spring wheat than chickpea and lentil. Similarly, C sequestration rate was significantly greater for pea–spring wheat and spring wheat–spring wheat than chickpea–spring wheat.

3.6. Carbon Dioxide Flux

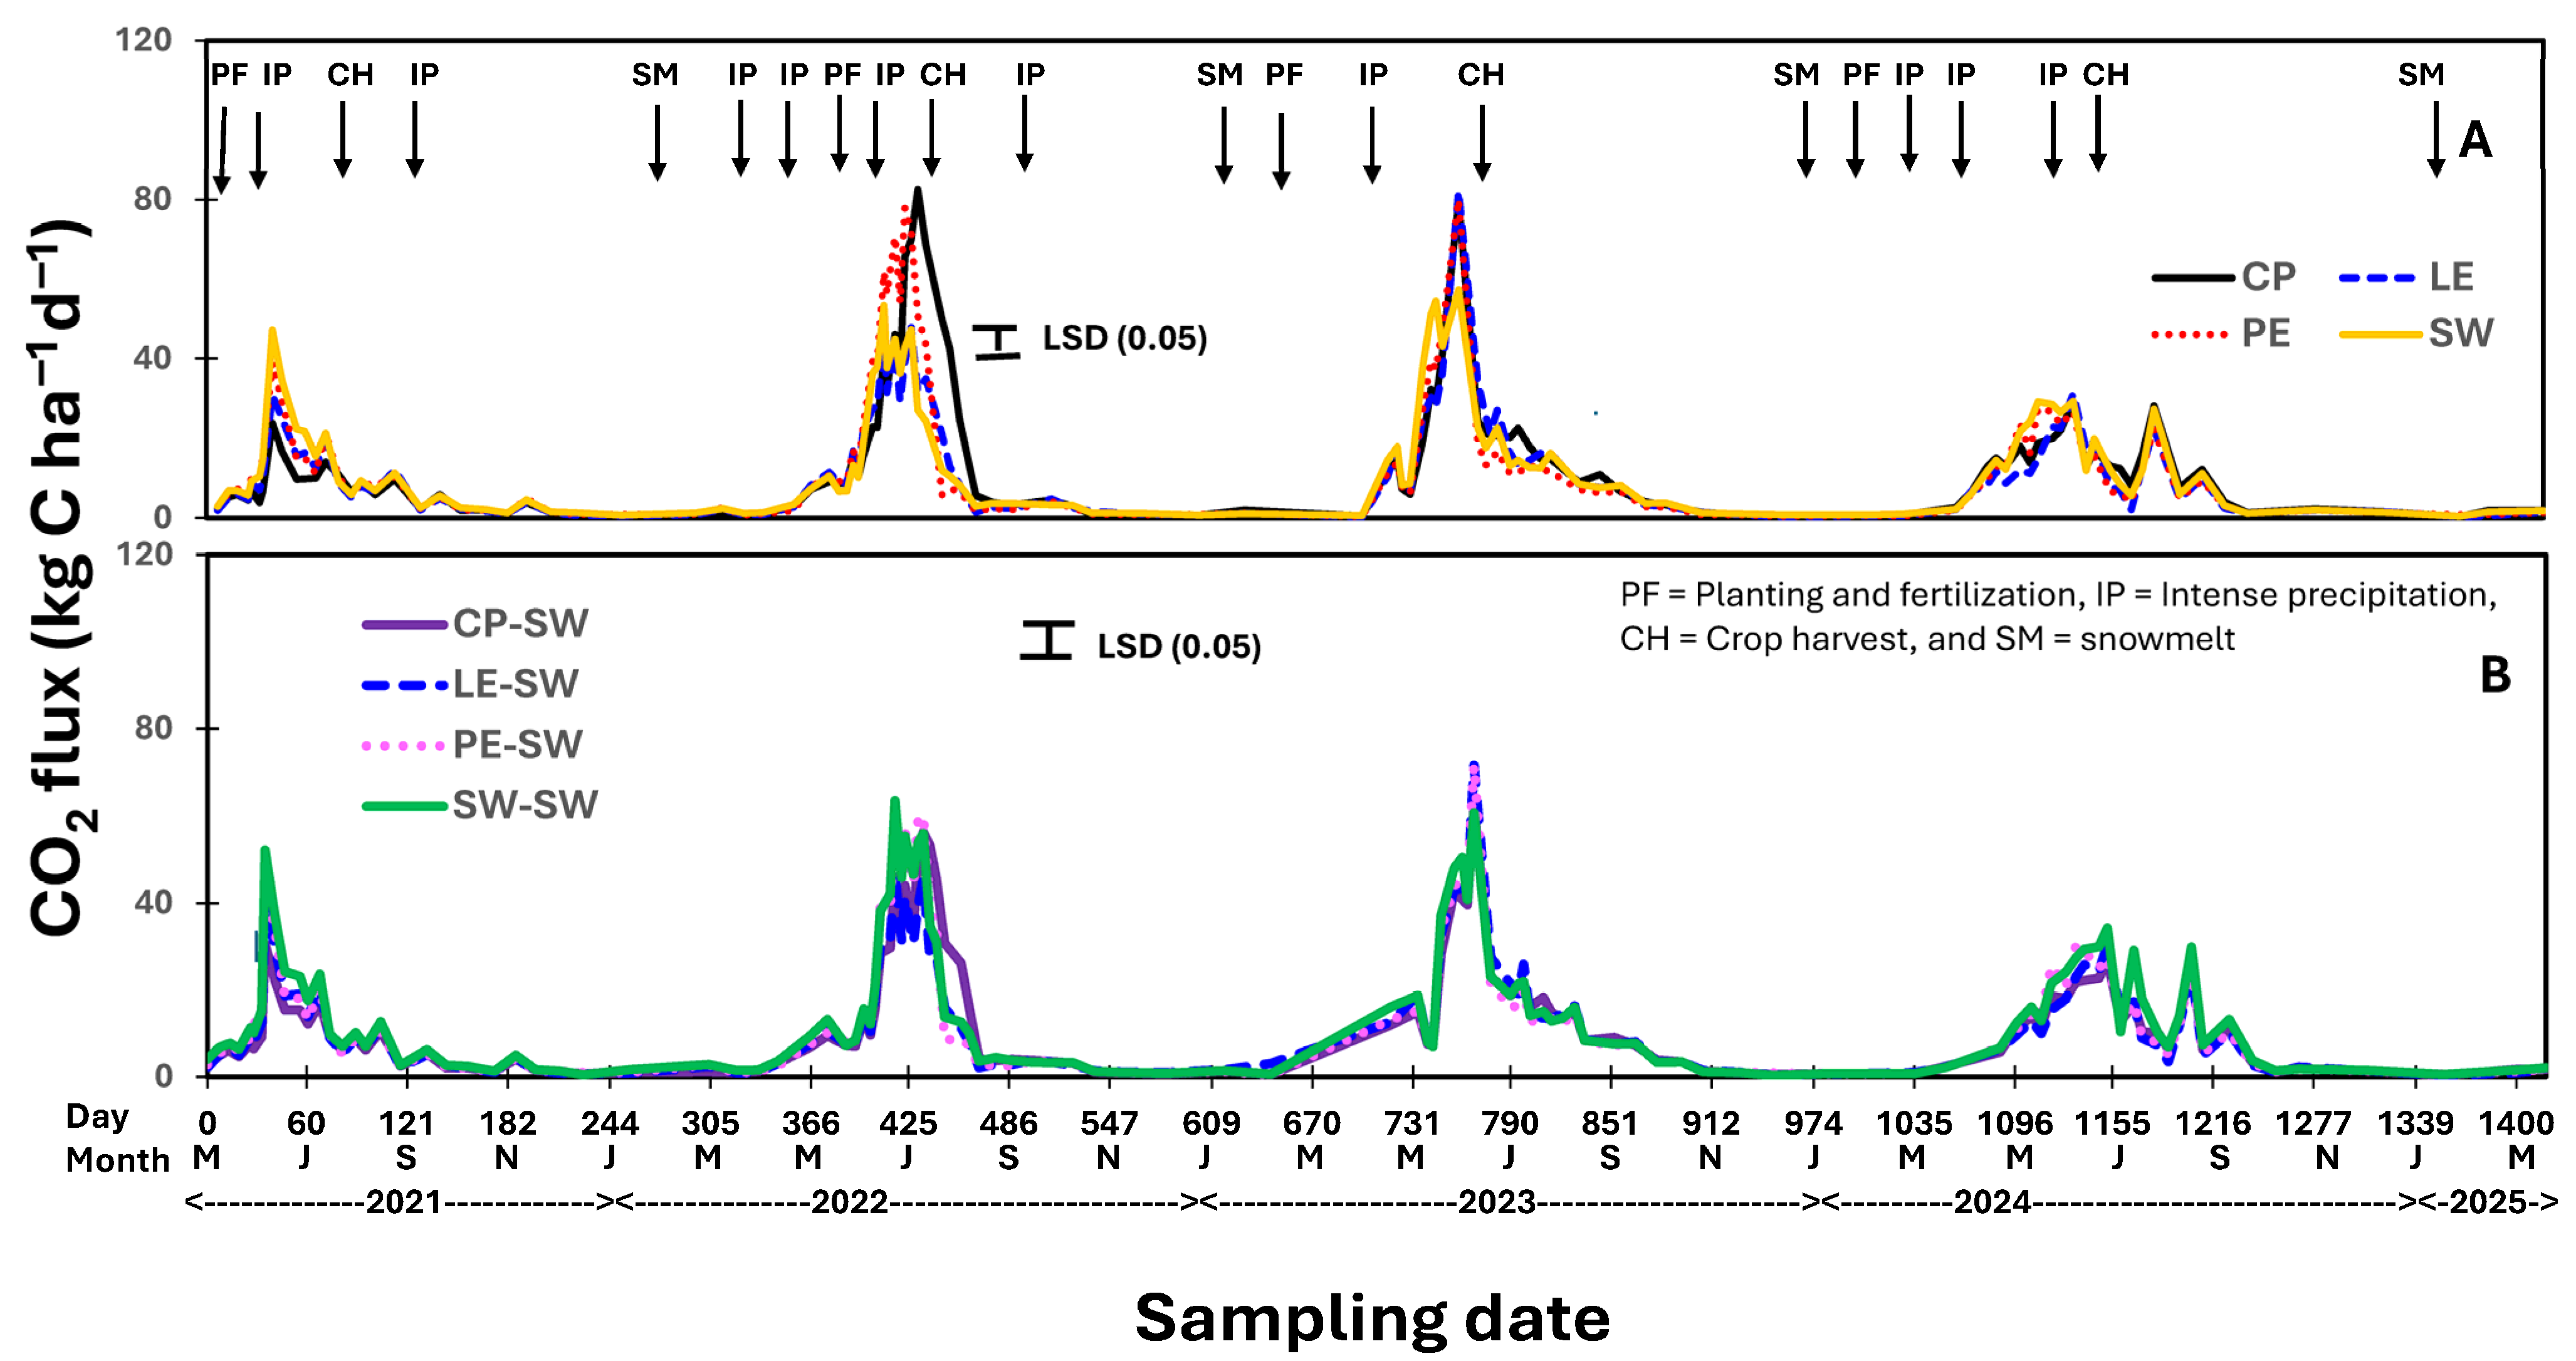
The CO2 flux occurred mostly during the crop growing season from May to September in each year (Figure 3). As much as 80 kg C ha−1 d−1 of CO2 flux was recorded for chickpea and pea in July 2022 and June 2023. The CO2 flux was significantly greater for pea and spring wheat than chickpea and lentil in June 2021 (Figure 3A). From June to August 2022, the flux was greater for chickpea and pea than lentil and spring wheat. In June and July 2023, the flux was greater for chickpea, pea, and lentil than spring wheat. In June 2024, the flux was greater for pea and spring wheat than chickpea and lentil.
For crop rotations, the CO2 flux was greater for spring wheat–spring wheat and lentil–spring wheat than chickpea–spring wheat and pea–spring wheat in June 2021 (Figure 3B). The flux was also greater for spring wheat–spring wheat than other crop rotations in June 2022 but was greater for chickpea–spring wheat, pea–spring wheat, and spring wheat–spring wheat than lentil–spring wheat in July and August 2022. In June 2023, the flux was greater for chickpea–spring wheat and pea–spring wheat than lentil–spring wheat and spring wheat–spring wheat. In July 2024, the flux was greater for spring wheat–spring wheat than other crop rotations.
Cumulative annual CO2 flux from May to June was significantly affected by year and the crop × year interaction (Table 5). Cumulative CO2 flux was 53% greater for spring wheat than chickpea in 2021–2022. In 2022–2023, cumulative CO2 flux was 37–39% greater for chickpea than lentil and spring wheat. In 2024–2025, cumulative CO2 flux was 26% greater for spring wheat than lentil. For crop rotations, cumulative CO2 flux was significantly affected by crop rotation, year, and the crop rotation × year interaction. In 2021–2022, cumulative CO2 flux was 43% greater for spring wheat–spring wheat than chickpea–spring wheat. In 2022–2023, cumulative CO2 flux was 21–27% greater for chickpea–spring wheat, pea–spring wheat, and spring wheat–spring wheat than lentil–spring wheat. In 2024–2025, cumulative CO2 flux was 23–27% greater for spring wheat–spring wheat than chickpea–spring wheat and lentil–spring wheat. Mean cumulative CO2 flux across years was 14–17% greater for spring wheat–spring wheat than chickpea–spring wheat and lentil–spring wheat. Averaged across crops and crop rotations, cumulative CO2 flux was lower in 2021–2022 than other years.

3.7. Carbon Balance

Carbon balance remained negative for all crops and crop rotations in all years (Table 6). Carbon balance was significantly affected by crop, year, and the crop × year interaction. In 2022–2023, C balance was 27–37% greater for lentil than chickpea and pea and 15–41% greater for spring wheat than pulse crops. There was no significant difference in C balance among crops in 2021–2022, 2023–2024, and 2024–2025. Mean C balance across years was 12% greater for lentil than pea and 12–16% greater for spring wheat than chickpea and pea.
For crop rotations, C balance was also significantly affected by crop, year, and the crop × year interaction (Table 6). In 2022–2023, C balance was 17–29% greater for lentil–spring wheat and spring wheat–spring wheat than chickpea–spring wheat and pea–spring wheat. There was no significant difference in C balance among crop rotations in 2021–2022, 2023–2024, and 2024–2025. Averaged across years, C balance was 8% greater for lentil–spring wheat than pea–spring wheat and 9–16% greater for spring wheat–spring wheat than pulse crop–spring wheat rotations. Averaged across crops and crop rotations, C balance was greater in 2021–2022 than other years.

4. Discussion

4.1. Carbon Inputs

4.1.1. Straw Carbon

Increased straw yield may have resulted in greater straw C input for pea than chickpea and lentil in most years (Table 1), as straw C concentration was not significantly affected by crop, year, and crop × year interaction. Some researchers [18,19,20] have reported that straw yield was greater for pea than chickpea and lentil in dryland cropping systems in western Montana, USA and western Canada. Similarly, greater straw yield may have increased straw C for spring wheat than for pulse crops. This was probably due to increased N fertilization rate for spring wheat compared to minimal N fertilization rate for pulse crops from MAP that supplied P. The results align with those reported by numerous researchers [14,18,19,20] who showed that straw yield and C content are greater for spring wheat than pulse crops. Straw C can vary from one year to next due to variable precipitation in dryland cropping systems [14]. This could be the reason for lower straw C in 2021–2022 when annual precipitation was lower than other years. Straw C values of 0.58 and 0.73 Mg C ha−1 for pea and spring wheat, respectively, observed in this study were between 0.12 and 1.11 Mg C ha−1 reported by several researchers in eastern Montana, USA and western Canada [14,43].
Greater straw C for pea than chickpea and lentil also resulted in increased straw C for pea–spring wheat compared to chickpea–spring wheat and lentil–spring wheat (Table 2). However, greater straw C for spring wheat than pea did not translate into increased straw C for spring wheat–spring wheat compared to pea–spring wheat, probably because straw C for spring wheat was greater following pea in the pea–spring wheat than following spring wheat in the spring wheat–spring wheat rotation. Increased N supplied by pea residue due to its higher tissue N concentration compared to spring wheat residue, lower water requirement for pea, and lower disease and pest pressure may have enhanced straw yield [44,45]. This may have increased straw C for spring wheat following pea compared to following spring wheat [14], thereby resulting in the non-significant difference in straw C between pea–spring wheat and spring wheat–spring wheat rotations.

4.1.2. Root Biomass and Rhizodeposit Carbon

Similar patterns of root growth into the soil may have resulted in the non-significant effect of crop, year, and the crop × year interaction in root biomass and rhizodeposit C at 0–120 cm (Table 2). This indicates that the patterns of growth and C accumulation differ between below- and aboveground biomass for pulse crops and spring wheat. It is also likely that spatial variability for growth and C accumulation is greater for below- than aboveground biomass, thereby resulting in the non-significant effect of treatment on root biomass C. This contradicts the results reported by Sainju and Allen [14] who found that root biomass and rhizodeposit C at 0–100 cm were higher for spring wheat than pea during the year with above-average precipitation, but the trends reversed during the year with below-average precipitation. The results are also in contrast to those observed by several researchers [24,25] who showed that root biomass C at 0–100 cm was lower for pea than chickpea and lentil, and lower for pulse crops than spring wheat. Our root biomass C values of 0.37 Mg C ha−1 for pea to 0.67 Mg C ha−1 for lentil in 2022–2023 at 0–120 cm were between 0.12 and 0.75 Mg C ha−1 at 0–100 cm for same crops reported by several researchers [14,23] in eastern Montana, USA and western Canada.
Greater spatial variability of root growth also may have resulted in the non-significant effect of year and the crop × year interaction on root biomass and rhizodeposit C (Table 2). However, greater root biomass and rhizodeposit C for spring wheat following spring wheat than following pulse crops may have increased root biomass and rhizodeposit C for spring wheat–spring wheat compared to chickpea–spring wheat and pea–spring wheat. Our results comply with those reported by several researchers [24,25] who found that root biomass C at 0–100 cm was greater for spring wheat–spring wheat than pulse crop–spring wheat rotations in western Canada.

4.1.3. Crop Seed, Fertilizer, and Precipitation Carbon

A higher seeding rate increased crop seed C for chickpea and pea compared to lentil and spring wheat, as seed C concentration was similar for all crops (Table 3). Seeding rates were greater for chickpea and pea (180–200 kg ha−1) than lentil and spring wheat (70–80 kg ha−1) in all years. This resulted in greater seed C for chickpea–spring wheat than lentil–spring wheat and spring wheat–spring wheat. Non-application of urea fertilizer to pulse crops led to lower fertilizer C for pulse crop–spring wheat rotations than spring wheat–spring wheat. Greater annual precipitation resulted in higher precipitation C in 2022–2023 and 2023–2024 (279–330 mm) than 2021–2022 and 2024–2025 (230–263 mm).

4.2. Carbon Outputs

4.2.1. Grain Carbon

Greater grain yield may have increased grain C for chickpea compared to lentil and pea in 2022–2023 and increased for lentil and pea compared to chickpea in 2024–2025 (Table 1). Increased N fertilization rate may have enhanced grain yield and, therefore, grain C for spring wheat compared to pea in 2021–2022 and compared to pulse crops in other years. Greater grain C for spring wheat than pea in dryland cropping systems in eastern Montana, USA, was also observed by Sainju and Allen [14]. However, this did not translate into greater grain C for spring wheat–spring wheat than pulse crop–spring wheat rotations, probably because grain yield and C storage were greater following pulse crops than following spring wheat, resulting in the non-significant difference in grain C among crop rotations in all years. This was probably due to the rotational benefits of pulse crops for spring wheat, such as increased soil water and N availability and reduced weed and disease pressure [19,20] in pulse crop–spring wheat rotations. Reduced precipitation resulted in lower grain C in 2021–2022 than other years.

4.2.2. Carbon Dioxide Flux

Enhanced root and microbial respirations and increased mineralization of soil organic matter may have promoted CO2 flux during the crop growing season in the summer (May–September) (Figure 3) when air temperature and precipitation were greater (Figure 1). Increased soil temperature and water content due to higher air temperature and precipitation stimulate microbial activity that favors organic matter mineralization [14,46]. About half of the total CO2 flux in croplands results from root respiration [46,47,48]. The peak CO2 flux of 80 kg C ha−1 d−1 for chickpea and pea in July 2022 and 2023 complies with the range of 80–160 kg C ha−1 d−1 reported for pea and spring wheat in eastern Montana and western Canada [14,47]. Absence of crops during the fallow period and lower air temperature and precipitation may have reduced CO2 flux from October to April in each year.
The greater root biomass and/or SOC stock may have increased CO2 flux for spring wheat and pea compared to chickpea and lentil in July 2021 and June 2024 (Figure 3A). Although root biomass C was not affected by crop species in any year, it was slightly greater for pea and spring wheat than chickpea and lentil in 2021–2022 (Table 2). The SOC stock in 2025 and C sequestration rate were greater for pea and spring wheat than chickpea and lentil (Table 4). It is likely that increased root respiration due to higher root biomass C and greater soil organic matter mineralization due to enhanced SOC stock increased CO2 flux for pea and spring wheat in July 2021 and June 2024. Greater CO2 flux for spring wheat than pea due to higher root biomass C and SOC stock was also reported by Sainju and Allen [14]. In contrast, greater CO2 flux for chickpea and pea than lentil and spring wheat in July 2022, and greater for pulse crops than spring wheat in June and July 2023 was probably due to rapid mineralization of pulse crop residues stemming from higher tissue N concentration or lower C/N ratio compared to spring wheat residue. Crop residues with higher N concentration or lower C/N ratio mineralize more rapidly than residues with lower N concentration or higher C/N ratio [49]. Greater CO2 flux for pea and spring wheat than chickpea and lentil may have increased the flux for pea–spring wheat and spring wheat–spring wheat than chickpea–spring wheat and lentil–spring wheat in June and July 2021–2024.
The greater peak CO2 flux in June and July probably resulted in higher cumulative annual CO2 flux for spring wheat than chickpea in 2021–2022 and for spring wheat than lentil in 2024–2025 (Figure 3, Table 5). Similarly, greater peak CO2 flux from June to August may have increased cumulative CO2 flux for chickpea compared to lentil and spring wheat in 2022–2023. This led to greater cumulative CO2 flux for spring wheat–spring wheat than chickpea–spring wheat in 2021–2022, greater for chickpea–spring wheat, pea–spring wheat, and spring wheat–spring wheat than lentil–spring wheat in 2022–2023, and greater for spring wheat–spring wheat than lentil–spring wheat and chickpea–spring wheat in 2024–2025. Increased CO2 flux for continuous spring wheat compared to lentil–spring wheat has been reported by several researchers [14,47]. Lower precipitation also may have decreased cumulative CO2 flux in 2021–2022 compared to other years.

4.3. Soil Carbon Sequestration

Increased straw C returned to the soil likely enhanced SOC stock for pea and spring wheat compared to chickpea and lentil in 2025 (Table 3), as straw C was greater for pea and spring wheat than chickpea and lentil in 3 out of 4 years (Table 1). Carbon inputs from root biomass and rhizodeposit can also influence SOC stock, but these parameters did not vary among crops and years (Table 2). Studies conducted by numerous researchers [50,51,52] have shown that increased amount of crop residue returned to the soil can increase SOC stock, with greater SOC stock for crops that returned higher crop residue to the soil. As a result, soil C sequestration rate was also greater for pea and spring wheat than chickpea and lentil because SOC stock at the beginning of the experiment in 2021 remained similar among crops. The greater SOC stocks for pea and spring wheat also resulted in increased SOC stocks for pea–spring wheat and spring wheat–spring wheat compared to lentil–spring wheat in 2025, resulting in higher C sequestration rates.

4.4. Carbon Balance

The negative C balance for all crops and crop rotations (Table 6) resulted from greater C outputs compared to C inputs and soil C sequestration rates, which indicates that pulse crops, spring wheat, and pulse crop–spring wheat rotations were largely a C source for dryland cropping systems in the semiarid region of the US northern Great Plains. Studies based on eddy covariance and static chamber methods have shown that dryland wheat-based cropping systems are largely a C source or C neutral [14,15,36,53,54,55]. The C balance values of −5.65 Mg C ha−1 yr−1 for pea in 2022–2023 to −1.54 Mg C ha−1 yr−1 for chickpea in 2021–2022 were within the range of −6.30 to −1.04 Mg C ha−1 yr−1 for spring wheat- and pea-based cropping systems reported by some researchers [14,36,55,56,57].
The greater C balance for lentil than chickpea and pea and greater for spring wheat than pulse crops in 2022–2023 was probably due to larger total C input compared to total output and/or a higher soil C sequestration rate. This resulted in a higher C balance for lentil–spring wheat and spring wheat–spring wheat than chickpea–spring wheat and pea–spring wheat in 2022–2023. The higher mean C balance across years for spring wheat than chickpea and pea suggests that spring wheat can reduce C loss compared to pulse crops, probably by increasing C inputs and C sequestration rate. Similarly, greater C balance for spring wheat–spring wheat than pulse crop–spring wheat rotations suggests that continuous spring wheat can reduce C loss compared to pulse crop–spring wheat rotations, probably by increasing C inputs and C sequestration rate. The results of this study comply with those found by several researchers [33,58] who showed that continuous nonlegume cropping increased C balance compared to legume–nonlegume rotations due to higher soil C sequestration rates, but in contrast to those observed by Sainju and Allen [14] who found that crop and crop rotation did not affect C balance.
The greater C balance in 2021–2022 than other years suggests that crops and crop rotations can reduce C loss during years with lower precipitation in dryland cropping systems. Cropping systems can increase C loss during years with higher precipitation, such as from 2022 to 2025, a fact similar to those reported by several researchers [14,36]. It is likely that C outputs from grain C removal and heterotrophic respiration exceeded C inputs from straw, root, and rhizodeposit, resulting in greater C loss during wet years.
Although pulse crops and pulse crop–spring wheat rotations exhibited carbon sources, producers can reduce C loss by growing spring wheat compared to pulse crops or using continuous spring wheat compared to pulse crop–spring wheat rotations. For agroecosystems to become a C sink, crops with greater crop residue returned to the soil and higher root biomass, such as perennial crops, may be needed to rotate with annual crops.
Some uncertainty for the calculation of C balance remain due to the use of an estimated C value for rhizodeposit C, the need for a fallow plot to determine heterotrophic respiration, and neglecting C losses through leaching and surface runoff. The values for C sequestration rate can vary for crops due to the high spatial and temporal variability of SOC stock, for which long-term experiments may be needed to observe C sequestration at deep soil layers. Because of the accounting of C sequestration rate, the method used in this study may provide more accurate values of C balance in agroecosystems compared to the eddy covariance method, which does not account for soil C sequestration rate.

5. Conclusions

Results of this study showed that C input as straw returned to the soil was greater for spring wheat than pulse crops or greater for pea–spring wheat than chickpea–spring wheat and lentil–spring wheat, but root biomass and rhizodeposit C did not vary among crops and crop rotations. Carbon inputs from crop seeds, fertilizer, and precipitation were minimal. Carbon output from grain removal was also greater for spring wheat than pulse crops but did not vary among crop rotations. Cumulative annual CO2 flux did not vary among crops but was greater for continuous spring wheat than chickpea–spring wheat and lentil–spring wheat. Based on the homogeneity of soil samples at the start of the experiment, soil C sequestration rate was greater for pea and spring wheat than chickpea and lentil, or greater for pea–spring wheat and continuous spring wheat than lentil–spring wheat. As a result, all crops and crop rotations exhibited a C source. Carbon balance was greater for spring wheat than pulse crops or greater for continuous spring wheat than pulse crop–spring wheat rotations. Nonlegume crops, such as spring wheat, can reduce C loss compared to pulse crops, or continuous spring wheat can reduce the loss compared to spring wheat-pulse crop rotations.

Supplementary Materials

The following supporting information can be downloaded at: https://www.mdpi.com/article/10.3390/land15050842/s1.

Author Contributions

Conceptualization, U.M.S.; Methodology, U.M.S., C.T.-M. and M.M.; Validation, U.M.S. and M.M.; Formal analysis, U.M.S.; Investigation, U.M.S., C.T.-M. and M.M.; Resources, U.M.S.; Data curation, U.M.S., C.T.-M. and M.M.; Writing—original draft, U.M.S.; Writing—review & editing, U.M.S., C.T.-M. and M.M.; Visualization, U.M.S., C.T.-M. and M.M.; Supervision, U.M.S. and C.T.-M.; Project administration, U.M.S.; Funding acquisition, U.M.S. All authors have read and agreed to the published version of the manuscript.

Funding

This research was funded by USDA-ARS, Pulse Crop Health Initiative (No. 3032-05-10).

Data Availability Statement

The original contributions presented in this study are included in the article/Supplementary Materials. Further inquiries can be directed to the corresponding author.

Acknowledgments

We sincerely acknowledge the help and support provided by Michael Johnson and Wayne Adkins for field plot management and by Nancy Webb, Courtney Hoffman, Dora Alvarez, Magaret Duffy, and Connie Tabbert for data collection in the field and analysis in the laboratory. We also acknowledge funding for this project from USDA-ARS, Pulse Crop Health Initiative (No. 3032-05-10). Mention of trade names or commercial products in this publication is solely for the purpose of providing specific information and does not imply recommendation or endorsement by USDA. The USDA is an equal opportunity employer.

Conflicts of Interest

The authors declare no conflicts of interest.

Abbreviations

GHG, greenhouse gas; MAP, monoammonium phosphate; and SOC, soil organic C.

References

  1. Miller, P.R.; Bekkerman, A.; Jones, C.A.; Burgess, M.H.; Holmes, J.A.; Engel, R.E. Pea in rotation with wheat reduced uncertainty of economic returns in southwest Montana. Agron. J. 2015, 107, 541–550. [Google Scholar] [CrossRef]
  2. Huang, J.W.; Afshar, R.K.; Tao, A.F.; Chen, C. Efficacy of starter N fertilizer and rhizobia inoculant in dry pea production in a semiarid temperature environment. Soil Sci. Plant Nutr. 2017, 63, 248–253. [Google Scholar]
  3. Koeshall, S.T.; Easterly, A.C.; Werle, R.; Stepanovic, S.; Creech, C.F. Replacing fallow with field pea in wheat production systems across western Nebraska. Agron. J. 2022, 114, 3329–3346. [Google Scholar] [CrossRef]
  4. Zentner, R.P.; Campbell, C.A.; Biederbeck, V.O.; Miller, P.R.; Selles, F.; Fernandez, M.R. In search of a sustainable cropping system for the semiarid Canadian prairies. J. Sustain. Agric. 2001, 18, 117. [Google Scholar] [CrossRef]
  5. Lemke, R.L.; Zhong, Z.; Campbell, C.A.; Zentner, R. Can pulse crops play a role in mitigating greenhouse gases from North American agriculture? Agron. J. 2007, 99, 1719–1725. [Google Scholar] [CrossRef]
  6. Lenssen, A.W.; Sainju, U.M.; Jabro, J.D.; Allen, B.L.; Stevens, W.B. Dryland pea productivity and soil water responses to tillage, crop rotation, and weed management practice. Agron. J. 2018, 110, 1843–1853. [Google Scholar] [CrossRef]
  7. Sainju, U.M.; Ghimire, R.; Mishra, U.; Jagadamma, S. Reducing nitrous oxide emissions and optimizing nitrogen-use efficiency in dryland crop rotations with different nitrogen rates. Nutr. Cycl. Agroecosyst. 2020, 116, 381–395. [Google Scholar] [CrossRef]
  8. Lafond, G.P.; May, W.E.; Holzapfel, C.B.; Lemke, R.J.; Lupwayi, N.Z. Intensification of field pea production: Impact on agronomic performance. Agron. J. 2011, 103, 396–403. [Google Scholar] [CrossRef]
  9. Chen, C.; Neill, K.; Burgess, M.; Bekkerman, A. Agronomic benefit and economic potential of introducing fall-seeded pea and lentil into conventional wheat-based crop rotations. Agron. J. 2012, 104, 215–224. [Google Scholar] [CrossRef]
  10. Clais, P.; Wattenbach, M.; Vuichard, N.; Smith, P.; Piao, S.L.; Don, A.; Luyssaest, S.; Janssens, A.; Bondeau, A.; Dechow, R. The European carbon balance. Part 2. Croplands. Glob. Change Biol. 2010, 16, 1409–1428. [Google Scholar]
  11. Lokupitiya, E.; Paustian, K.; Easter, M.; Williams, S.; Andren, O.; Katterer, T. Carbon balance in US croplands during the last two decades of the twentieth century. Biogeochemistry 2012, 107, 207–225. [Google Scholar] [CrossRef]
  12. Guzman, J.G.; Al-Kaisi, M.M. Residue removal and management practices effect on soil environment and carbon budget. Soil Sci. Soc. Am. J. 2014, 78, 609–623. [Google Scholar] [CrossRef]
  13. Cates, A.M.; Jackson, R.D. Cover crop effects on net ecosystem carbon balance in grain and silage maize. Agron. J. 2018, 110, 30–38. [Google Scholar] [CrossRef]
  14. Sainju, U.M.; Allen, B.L. Carbon footprint and carbon balance of three long-term dryland cropping sequences. Soil Sci. Soc. Am. J. 2024, 88, 1405–1418. [Google Scholar] [CrossRef]
  15. Liebig, M.A.; Saliendra, N.Z.; Archer, D.W. Carbon fluxes from a spring wheat-corn-soybean crop rotation under no-tillage management. Agrosyst. Geosci. Environ. 2022, 5, e20291. [Google Scholar] [CrossRef]
  16. Schlesinger, W.H.; Andrews, J.A. Soil respiration and the global carbon cycle. Biogeochemistry 2000, 78, 7–20. [Google Scholar] [CrossRef]
  17. Ding, W.; Cai, Y.; Cai, Z.; Yagi, K.; Zhang, X. Soil respiration under maize crops: Effects of water, temperature, and nitrogen fertilization. Soil Sci. Soc. Am. J. 2007, 71, 944–951. [Google Scholar] [CrossRef]
  18. Cutforth, H.W.; McConkey, P.G.; Ulrich, D.; Miller, P.R.; Angadi, S.V. Yield and water-use efficiency of pulses seeded directly into standing stubble in the semiarid Canadian prairie. Can. J. Plant Sci. 2002, 82, 681–686. [Google Scholar] [CrossRef]
  19. Miller, P.R.; Gan, Y.; McConkey, B.G.; McDonald, C.L. Pulse crops for the northern Great Plains: I. Grain productivity and residual effects on soil water and nitrogen. Agron. J. 2003, 95, 972–979. [Google Scholar] [CrossRef]
  20. Lenssen, A.W.; Johnson, J.D.; Carlson, G.R. Cropping sequence and tillage system influences annual crop production and water use in semiarid Montana, USA. Field Crops Res. 2007, 100, 32–43. [Google Scholar] [CrossRef]
  21. Guinet, M.; Nicorlardot, B.; Voisin, A.S. Nitrogen benefit of ten legume pre-crops for wheat assessed by field measurements and modeling. Eur. J. Agron. 2020, 120, e126151. [Google Scholar] [CrossRef]
  22. Liu, K.; Bandara, M.; Hamel, C.; Knight, J.D.; Gan, Y.T. Intensifying crop rotations with pulse crops enhance system productivity and soil organic carbon in semiarid environments. Field Crops Res. 2020, 248, e107657. [Google Scholar] [CrossRef]
  23. Gan, Y.; Liang, G.; Wang, X.; McConkey, B. Lowering carbon footprint of durum wheat by diversifying cropping systems. Field Crops Res. 2011, 122, 199–206. [Google Scholar] [CrossRef]
  24. Gan, Y.T.; Campbell, C.A.; Janzen, H.H.; Lemke, R.; Liu, L.P.; Basnyat, P.; McDonald, C.L. Root mass for oilseed and pulse crops: Growth and distribution in the soil profile. Can. J. Soil Sci. 2009, 89, 883–893. [Google Scholar] [CrossRef]
  25. Liu, L.T.; Knight, J.D.; Lemke, R.L.; Farrell, R.E. Quantifying the contributions of above- and belowground residues of chickpea, faba ban, lentil, field pea, and wheat to nitrogen nutrition of a subsequent wheat crop. Field Crops Res. 2014, 313, e109412. [Google Scholar] [CrossRef]
  26. Mosier, A.R.; Halvorson, A.D.; Reule, C.A.; Liu, X.J. Net global warming potential and greenhouse gas intensity in irrigated cropping systems in northeastern Colorado. J. Environ. Qual. 2006, 35, 1584–1598. [Google Scholar] [CrossRef]
  27. Sainju, U.M.; Jabro, J.D.; Caesar-TonThat, T. Tillage, cropping sequence, and nitrogen fertilization effects on dryland soil carbon dioxide emission and carbon content. J. Environ. Qual. 2010, 37, 98–106. [Google Scholar] [CrossRef]
  28. Omonode, R.A.; Vyn, T.J.; Smith, D.R.; Hegysmgi, P.; Gal, A. Soil carbon dioxide and methane fluxes from long-term tillage systems in continuous corn and corn-soybean rotations. Soil Tillage Res. 2007, 95, 182–195. [Google Scholar] [CrossRef]
  29. Alluvione, F.; Halvorson, A.D.; DelGrosso, S. Nitrogen, tillage, and crop rotation effects on carbon dioxide and methane fluxes from irrigated cropping systems. J. Environ. Qual. 2009, 38, 2023–2033. [Google Scholar] [CrossRef] [PubMed]
  30. Hernandez-Ramirez, G.; Brouder, S.M.; Smith, D.R.; van Scoyoz, G.E. Greenhouse gas fluxes in eastern corn belt soil: Weather, nitrogen source, and rotation. J. Environ. Qual. 2009, 38, 941–954. [Google Scholar] [CrossRef] [PubMed]
  31. Sainju, U.M.; Caesar-Tonthat, T.; Lenssen, A.W.; Barsotti, J.L. Dryland soil greenhouse gas emissions affected by cropping sequence and nitrogen fertilization. Soil Sci. Soc. Am. J. 2012, 76, 1741–1757. [Google Scholar] [CrossRef]
  32. Wesmeier, M.; Hubner, R.; Kogel-Knabner, I. Stagnating crop yields. An overlooked risk for the carbon balance of agricultural soils. Sci. Total Environ. 2015, 536, 1045–1051. [Google Scholar] [CrossRef] [PubMed]
  33. Song, J.; Hui, Y.; Yu, C.D.; Zhang, Q.; Zhou, Y.Q.; Li, Y.; Liu, X.H.; Zhu, L.L.; Hui, D.F.; Won, S.Q. Carbon balance under four double season cropping systems in North China Plain. Plant Soil 2017, 421, 319–336. [Google Scholar] [CrossRef]
  34. Dalmago, H.J.; Lathuilliere, M.J.; de Aruda, P.H.Z.; da Silva, A.; da Sallo, F., Jr.; Couto, E.G.; Johnson, M.S. Carbon exchange in rainfed and irrigated cropland in Brazilian Cerrado. Agric. For. Meteorol. 2022, 316, 108881. [Google Scholar] [CrossRef]
  35. Veeck, G.P.; Dalmago, G.A.; Bremm, T.; Buligon, L.; Jacques, R.J.S.; Fernandes, J.M.; Santi, A.; Vargas, P.R.; Roberti, D.R. CO2 flux in a wheat-soybean succession in subtropical Brazil: A carbon sink. J. Environ. Qual. 2022, 51, 899–915. [Google Scholar] [CrossRef]
  36. Gebremedhin, M.T.; Loescher, H.W.; Tsegaye, T.D. Carbon balance of no-till soybean and winter wheat cover crop in the southeastern USA. Agron. J. 2012, 104, 1321–1335. [Google Scholar] [CrossRef]
  37. Parkin, T.B.; Venterea, R.T. Chamber-based trace gas flux measurements. In Sampling Protocols; Follett, R.P., Ed.; USDA: Washington, DA, USA, 2010; pp. 1–39. Available online: www.ars.usda.gov/research/GRACEnet (accessed on 5 February 2021).
  38. Colliers, S.M.; Ruark, M.D.; Oates, S.G.; Jokela, W.E.; Dell, C.J. Measurement of greenhouse gas flux from agricultural soils using static chambers. J. Vis. Exp. 2014, 90, 52110. [Google Scholar]
  39. Kisselle, K.W.; Garette, C.J.; Fu, S.; Hendrix, P.F.; Crossley, D.A.; Coleman, D.C.; Potter, R.L. Budgets for root-derived C and litter-derived C. Comparison between conventional tillage and no-tillage soils. Soil Biol. Biochem. 2001, 33, 1067–1075. [Google Scholar] [CrossRef]
  40. Liebig, M.A.; Tanaka, D.L.; Gross, J.R. Fallow effects on soil carbon and greenhouse gas flux in central North Dakota. Soil Sci. Soc. Am. J. 2010, 74, 358–365. [Google Scholar] [CrossRef]
  41. Siudek, P.; Frankowski, M.; Srepak, J. Seasonal variations of dissolved organic carbon in precipitation over urban and forest sites in central Poland. Environ. Sci. Poll. Res. 2015, 22, 11087–11096. [Google Scholar] [CrossRef]
  42. Littell, R.C.; Milliken, G.A.; Stroup, W.W.; Wolfinger, R.D.; Schabenberger, O. SAS for Mixed Models; SAS Inst. Inc.: Cary, NC, USA, 2006. [Google Scholar]
  43. Ngidi, A.; Shimelis, H.; Chaplot, V.; Shamuyarira, K.; Figlan, S. Biomass allocation and carbon storage in the major cereal crops: A meta-analysis. Crop Sci. 2024, 64, 2064–2080. [Google Scholar] [CrossRef]
  44. Miller, P.R.; Waddington, J.; McDonald, C.L.; Derksen, D.A. Cropping sequence affects wheat productivity on the semiarid northern Great Plains. Can. J. Plant Sci. 2002, 82, 307–318. [Google Scholar] [CrossRef]
  45. Lenssen, A.W.; Sainju, U.M.; Jabro, J.D.; Iversen, W.M.; Allen, B.G.; Evans, R.G. Crop diversification, tillage, and management system influence spring wheat yield and water use. Agron. J. 2014, 106, 1445–1454. [Google Scholar] [CrossRef]
  46. Rochette, P.; Flanagan, L.B.; Gregorich, E.G. Separating soil respiration into plant and soil components using analyses of the natural abundance of carbon-13. Soil Sci. Soc. Am. J. 1999, 63, 1207–1213. [Google Scholar] [CrossRef]
  47. Curtin, D.; Wang, H.; Selles, F.; McConkey, B.G.; Campbell, C.A. Tillage effects on carbon fluxes in continuous wheat and fallow-wheat rotations. Soil Sci. Soc. Am. J. 2000, 64, 2080–2086. [Google Scholar] [CrossRef]
  48. Zhang, Q.; Lei, H.M.; Yang, D.W. Seasonal variation in soil respiration, heterotrophic respiration, and autotrophic respiration of wheat and maize rotation crop rotation in north China Plain. Agric. For. Meteor. 2013, 180, 34–43. [Google Scholar] [CrossRef]
  49. Kuo, S.; Sainju, U.M.; Jellum, E.J. Winter cover crop effects on soil organic carbon and carbohydrate. Soil Sci. Soc. Am. J. 1997, 61, 145–152. [Google Scholar] [CrossRef]
  50. Zuber, S.M.; Behnke, G.D.; Nafzieger, E.D.; Villamil, M.B. Carbon and nitrogen content of soil organic matter and microbial biomass under long-term crop rotation and tillage in Illinois, USA. Agriculture 2018, 8, e8030037. [Google Scholar] [CrossRef]
  51. Rigon, J.P.G.; Calonego, J.C. Soil carbon fluxes and balance of crop rotations under long-term no-till. Carbon Bal. Manag. 2020, 15, e19. [Google Scholar] [CrossRef] [PubMed]
  52. Chahal, I.; Peng, Y.J.; Hooker, D.C.; van Eerd, L.L. Long-term tillage and crop rotation effect on soil carbon and nitrogen stocks in southwestern Ontario. Can. J. Soil Sci. 2025, 105, e168. [Google Scholar] [CrossRef]
  53. Conant, R.T.; Paustian, K.; Garcia-Olivia, F.; Janzen, H.H.; Jeranullo, V.J.; Johnson, D.E.; Kulshrestha, S.N. Agricultural and grazing lands. In The First State of Carbon Cycle Report. The North American Carbon Budget and Implications for the Global Carbon Cycle; King, A.W., Ed.; National Oceanic and Atmospheric Administration, National Climatic Data Center: Ashville, NC, USA, 2007; pp. 107–116. [Google Scholar]
  54. Houghton, R.A. Balancing the global carbon budget. Ann. Rev. Earth Planet. Sci. 2007, 35, 313–347. [Google Scholar] [CrossRef]
  55. Sainju, U.M.; Ghimire, R.; Dangi, S. Soil carbon dioxide and methane emissions and carbon balance with crop rotation and nitrogen fertilization. Sci. Total Environ. 2021, 775, 145902. [Google Scholar] [CrossRef]
  56. Anthoni, P.M.; Freibauer, A.; Kolle, O.; Schalee, E.D. Winter wheat carbon exchange in Thringia, Germany. Agric. For. Meteorol. 2004, 121, 55–67. [Google Scholar] [CrossRef]
  57. Moureaux, C.; Debacq, A.; Hoyaux, J.; Suleau, M.; Tourneur, D.; Vancutsem, F.; Bodson, B.; Aubinet, M. Carbon balance assessment of a Belgian winter wheat crop. Glob. Change Biol. 2008, 14, 1353–1366. [Google Scholar] [CrossRef]
  58. Menefee, D.; Scott, R.L.; Abraha, M.; Alfieri, J.G.; Baker, J.; Browning, D.M.; Chen, J.; Gonet, J.; Johnson, J.M.F.; Miller, C.R.; et al. Unravelling the effects of management and climate on carbon fluxes of US croplands using the Long-term Agroecosystem Network. Agric. For. Meteorol. 2022, 326, e109154. [Google Scholar] [CrossRef]
Figure 1. Daily air temperature and precipitation from May 2021 to April 2025 at the study site.
Land 15 00842 g001
Figure 2. Plot map of the study area with crops (chickpea [C], lentil [L], pea [P], and spring wheat [W]) and crop rotations (W-P, spring wheat–chickpea; W-L, spring wheat–lentil; W-P, spring wheat–pea; and W-W, spring wheat–spring wheat). Rep denotes replication.
Land 15 00842 g002
Figure 3. Soil CO2 flux as affected by (A) crop and (B) crop rotation under pulse crops, spring wheat, and pulse crop–spring wheat rotations from May 2021 to April 2025. The letters with arrows at the tops are PF, planting and fertilization; IP, intense precipitation (>20 mm); CH, crop harvest; and SM, snowmelt. Crops are CP, chickpea; LE, lentil;, PE, pea, and SW, spring wheat.
Land 15 00842 g003
Table 1. Effect of pulse crop and spring wheat, pulse crop–spring wheat rotation, and year on crop straw and grain C. Mean values are averaged across years. Sources of variance are CO, crop; RT, crop rotation; and YR, year.
CropStraw C (Mg C ha−1)Grain C (Mg C ha−1)
2021–20222022–20232023–20242024–2025Mean2021–20222022–20232023–20242024–2025Mean
Chickpea0.32 b a0.59 ab0.43 c0.32 c0.42 c0.67 ab1.05 b1.01 b0.39 c0.78 c
Lentil0.32 b0.41 c0.51 c0.64 b0.47 c0.60 ab0.59 d1.01 b1.31 b0.88 bc
Pea0.53 a0.45 bc0.61 b0.74 b0.58 b0.58 b0.82 c0.92 b1.44 b0.94 b
Spring wheat0.47 a0.67 a0.79 a1.01 a0.73 a0.84 a1.41 a2.04 a1.87 a1.54 a
Significancep values
CO<0.001 <0.001
YR<0.001 <0.001
CO × YR<0.001 <0.001
Crop rotation
Chickpea–spring wheat0.410.67 a0.600.64 b0.58 b0.751.241.501.111.15
Lentil–spring wheat0.370.38 b0.670.85 a0.56 b0.721.031.601.631.25
Pea–spring wheat0.520.56 ab0.760.92 a0.69 a0.711.131.631.731.30
Spring wheat–spring wheat0.450.60 a0.640.94 a0.66 ab0.861.311.651.671.37
Significancep values
RT0.034 0.393
YR<0.001 <0.001
RT × YR0.047 0.511
a Numbers followed by different letters within a column in a set are significantly different at p ≤ 0.05 by the least square means test.
Table 2. Effect of pulse crop and spring wheat, pulse crop–spring wheat rotation, and year on crop root and rhizodeposit C. Mean values are averaged across years. Sources of variance are CO, crop; RT, crop rotation; and YR, year.
CropRoot Biomass C (Mg C ha−1)Rhizodeposit C (Mg C ha−1)
2021–20222022–20232023–20242024–2025Mean2021–20222022–20232023–20242024–2025Mean
Chickpea0.390.390.430.400.400.020.030.040.030.03
Lentil0.350.670.460.540.510.030.050.040.050.04
Pea0.430.370.440.400.410.030.030.040.030.03
Spring wheat0.480.550.430.480.480.040.040.030.040.04
Significancep values
CO0.183 0.261
YR0.525 0.396
CO × YR0.612 0.661
Crop rotation
Chickpea–spring wheat0.410.520.400.440.44 b a0.030.040.030.040.04 ab
Lentil–spring wheat0.400.610.470.490.49 ab0.030.050.040.040.04 ab
Pea–spring wheat0.420.340.440.400.40 b0.030.030.040.030.03 b
Spring wheat–spring wheat0.610.690.440.570.58 a0.050.060.040.050.05 a
Significancep values
RT0.006 0.008
YR0.167 0.094
RT × YR0.338 0.361
a Numbers followed by different letters within a column in a set are significantly different at p ≤ 0.05 by the least square means test.
Table 3. Carbon inputs from crop seed, urea fertilizer, and precipitation for pulse crops in rotation with spring wheat from 2021 to 2022 to 2024–2025.
CropCrop Seed
(Mg C ha−1)
Urea Fertilizer (Mg C ha−1)Precipitation (Mg C ha−1)
2021–20222022–20232023–20242024–20252021–20222022–20232023–20242024–2025
Chickpea0.08 a00000.010.020.020.01
Lentil0.03 b00000.010.020.020.01
Pea0.07 a00000.010.020.020.01
Spring wheat0.03 b0.020.020.020.020.010.020.020.01
Crop rotation
Chickpea–spring wheat0.06 a0.010.010.010.010.010.020.020.01
Lentil–spring wheat0.03 b0.010.010.010.010.010.020.020.01
Pea–spring wheat0.05 ab0.010.010.010.010.010.020.020.01
Spring wheat–spring wheat0.03 b0.020.020.020.020.010.020.020.01
a Numbers followed by different letters within a column in a set are significantly different at p ≤ 0.05 by the least square means test.
Table 4. Effect of pulse crop and spring wheat, pulse crop–spring wheat rotation, and year on soil organic C (SOC) and C sequestration rate at the 0–10 cm depth. Sources of variance are CO, crop; RT, crop rotation; and YR, year.
CropSOC (Mg C ha−1)C Sequestration Rate
(Mg C ha−1 yr−1)
20212025
Chickpea25.425.5 ab a0.02 b
Lentil25.425.0 b−0.09 c
Pea25.426.1 a0.16 a
Spring wheat25.426.4 a0.22 a
Significancep values
CO <0.001<0.001
YR <0.001<0.001
CO × YR <0.001<0.001
Crop rotation
Chickpea–spring wheat25.426.0 ab0.13 ab
Lentil–spring wheat25.425.7 b0.07 b
Pea–spring wheat25.426.3 a0.20 a
Spring wheat–spring wheat25.426.4 a0.22 a
Significancep values
RT <0.001<0.001
YR <0.001<0.001
RT × YR <0.001<0.001
a Numbers followed by different letters within a column in a set are significantly different at p ≤ 0.05 by the least square means test.
Table 5. Effect of pulse crop and spring wheat, pulse crop–spring wheat rotation, and year on cumulative CO2 flux. Mean values are averaged across years. Sources of variance are CO, crop; RT, crop rotation; and YR, year.
CropCumulative C2O Flux (Mg C ha−1)
2021–20222022–20232023–20242024–2025Mean
Chickpea2.17 b a7.65 a5.784.35 ab4.99
Lentil2.60 ab5.51 b5.863.68 b4.41
Pea3.04 ab7.51 ab5.344.08 ab4.99
Spring wheat3.31 a5.59 b6.104.63 a4.91
Significancep values
CO0.108
YR<0.001
CO × YR<0.001
Crop rotation
Chickpea–spring wheat2.55 b6.39 a5.714.19 b4.71 bc
Lentil–spring wheat2.94 ab5.28 b6.114.06 b4.60 c
Pea–spring wheat3.21 ab6.50 a5.834.50 ab5.01 ab
Spring wheat–spring wheat3.65 a6.68 a6.045.14 a5.38 a
Significancep values
RT0.006
YR<0.001
RT × YR<0.011
a Numbers followed by different letters within a column in a set are significantly different at p ≤ 0.05 by the least square means test.
Table 6. Effect of pulse crop and spring wheat, pulse crop–spring wheat rotation, and year on C balance (mean ± standard deviation). Mean values are averaged across years. Sources of variance are CO, crop; RT, crop rotation; and YR, year.
CropC Balance (Mg C ha−1)
2021–20222022–20232023–20242024–2025Mean
Chickpea−1.54 (±0.12)−5.96 (±0.25) c a−4.57 (±0.32)−2.96 (±0.18)−3.76 (±0.73) bc
Lentil−2.00 (±0.08)−4.15 (±0.36) b−4.68 (±0.19)−3.05 (±0.30)−3.47 (±0.89) ab
Pea−1.75 (±0.10)−5.65 (±0.19) c−4.41 (±0.30)−3.97 (±0.16)−3.94 (±1.46) c
Spring wheat−1.77 (±0.28)−3.54 (±0.30) a−4.53 (±0.39)−3.30 (±0.37)−3.29 (±1.05) a
Significancep values
CO<0.001
YR<0.001
CO × YR<0.001
Crop rotation
Chickpea–spring wheat−1.66 (±0.18)−4.66 (±1.40) b−4.56 (±0.30)−3.14 (±0.31)−3.50 (±1.08) bc
Lentil–spring wheat−1.92 (±0.07)−3.89 (±0.39) a−4.63 (±0.27)−3.21 (±0.39)−3.41 (±1.05) b
Pea–spring wheat−1.77 (±0.09)−4.73 (±0.19) b−4.55 (±0.44)−3.71 (±0.33)−3.69 (±0.80) c
Spring wheat–spring wheat−1.65 (±0.58)−3.37 (±0.44) a−4.29 (±0.25)−3.07 (±0.59)−3.09 (±1.07) a
Significancep values
RT0.006
YR<0.001
RT × YR0.029
a Numbers followed by different letters within a column in a set are significantly different at p ≤ 0.05 by the least square means test.
Disclaimer/Publisher’s Note: The statements, opinions and data contained in all publications are solely those of the individual author(s) and contributor(s) and not of MDPI and/or the editor(s). MDPI and/or the editor(s) disclaim responsibility for any injury to people or property resulting from any ideas, methods, instructions or products referred to in the content.