Article

Matching Supply and Demand of Ecosystem Services in the Pinglu Canal Economic Zone from the Perspective of the Water–Energy–Food Nexus

1
Key Laboratory of Environment Change and Resources Use in Beibu Gulf, Ministry of Education, Nanning Normal University, Nanning 530001, China
2
School of Natural Resources and Surveying, Nanning Normal University, Nanning 530001, China
*
Author to whom correspondence should be addressed.
Land 2026, 15(5), 823; https://doi.org/10.3390/land15050823
Submission received: 11 April 2026 / Revised: 7 May 2026 / Accepted: 9 May 2026 / Published: 12 May 2026
(This article belongs to the Section Water, Energy, Land and Food (WELF) Nexus)

Abstract

Global climate change and rapid socio-economic development have increasingly exacerbated the imbalance between ecosystem service (ES) supply and demand. Taking the Pinglu Canal Economic Zone as a case study and employing a water–energy–food (WEF) nexus perspective, this study selected three key ESs—water yield, carbon sequestration, and food supply. The InVEST model, supply–demand index (SDI), Pearson correlation analysis, and four-quadrant model were integrated to systematically reveal the spatiotemporal patterns, correlation characteristics, and spatial matching of ES supply and demand from 2005 to 2020. Scale effects and appropriate management scales were clarified through municipal, county, and grid scale comparisons, and a comprehensive management zoning scheme was constructed using a “zoning–classification–grading” framework. The results show that water yield and food supply exhibited an overall increasing trend, while carbon sequestration supply remained stable. Demand for all three services showed continuous growth, with a spatial pattern of “high in the central area and low in the surrounding areas”, consistent with population and economic agglomerations. The county scale was the most effective at capturing local supply–demand characteristics. A “zoning–classification–grading” spatial governance system was constructed based on dominant functions, supply–demand status, and control priority. This study can provide a scientific basis for territorial spatial planning and integrated ecosystem management in the Pinglu Canal Economic Zone and similar regions.

1. Introduction

Ecosystem services (ESs) refer to the services or products that humans obtain directly or indirectly from ecosystems [1,2,3]. Water, energy, and food are essential basic resources for human survival and development. They form a complex interaction characterized by interdependence, limitation, sensitivity, and vulnerability [4,5], providing important ESs for humanity. The Bonn Conference first referred to this interdependent and interconnected relationship as the “water–energy–food nexus” [6]. The security of the integrated water–energy–food (WEF) system [7,8] is of great significance for achieving regional sustainable development. ES supply refers to the capacity of ecosystems to produce ecological products and services, while ES demand refers to the total amount of ecological products and services used and consumed by humans [9]. ESs provide water resources, energy, and food to ensure the security of the WEF nexus. The increasing human demand for “water, energy, and food” places growing pressure on the supply of related ESs.
In recent years, the scale and speed of urbanization have continued to expand, leading to increasingly serious mismatches between ES supply and demand. This has resulted in a series of problems, including population pressure, environmental pollution, and biodiversity loss, severely threatening regional sustainable development [10,11,12,13]. Climate change and food security are two of the greatest challenges facing humanity [14]. Using remote sensing imagery, economic statistics, and meteorological data, scholars have quantified ES supply and demand and identified spatial matching patterns. Common methods include model construction, expert participatory decision-making, value assessment, and land use estimation, supported by tools such as the InVEST model, equivalent factor methods, the supply–demand ratio index, and four-quadrant analysis [15]. In terms of research scale, ES assessments have covered countries [4,16,17], watersheds [18,19,20], cities [21,22,23,24,25,26], and counties [27,28]. Regarding research objects, ES assessment studies have included vegetation, soil, water systems, and other geographical elements [29,30,31], providing a more scientific and comprehensive basis for ESs. Although existing research has achieved fruitful results in supply–demand assessment, spatial matching, and relationship identification, there is still room for expansion. Most studies focus on administrative units or natural watersheds, paying insufficient attention to linear economic zones under strong human disturbance, such as large-scale artificial canals. Although some studies have begun to introduce the WEF nexus perspective [4,6,8,21,25,32], most remain at the level of independent assessment of resource elements, rarely systematically incorporating the resource coupling effects under the nexus framework into the measurement and analysis of ES supply–demand matching.
In the context of global sustainable development, biodiversity conservation [33,34], environmental pollution [35], land degradation [36], and water resource security [37,38,39] have become core issues. The Kunming–Montreal Global Biodiversity Framework, adopted in 2022, clearly states that by 2030, at least 30% of degraded ecosystems globally must be effectively restored, emphasizing the intrinsic link between ES supply and human well-being. China’s 14th Five-Year Plan and the Outline of the Beautiful China Construction Goals by 2035 have further incorporated “improving ecosystem quality and stability” into the national strategy, explicitly proposing the provision of more high-quality ecological products to meet the people’s growing needs for a beautiful ecological environment [40]. This essentially reflects the fundamental problem of achieving spatial matching and functional coordination between ES supply and human demand. As a major national project during the 14th Five-Year Plan period, the Pinglu Canal carries the transportation function of connecting the southwestern hinterland with the Beibu Gulf waterway. By connecting the Xijiang River and the Qinzhou water system, it runs through Guangxi, linking the Yujiang River and the Beibu Gulf, constructing a “water artery” with important ecological regulation functions [41]. The construction of the Pinglu Canal involves the ecological reshaping of the Qinzhou Bay land–sea ecotone. Scientific planning and spatial layout will directly affect mangrove wetland protection, the maintenance of migratory biological corridors, and coastal defense capabilities [42,43], thereby supporting fishery resource supply and coastal regulation services. Against this background, how to coordinate the three basic resource systems of “water, energy, and food” to achieve spatial matching between ES supply and regional development needs has become a key scientific issue that urgently needs to be addressed for the sustainable development of the Pinglu Canal Economic Zone. Although existing studies have introduced the WEF nexus perspective into ES assessments, most remain at the level of independent evaluation of single resources, lacking a systematic coupling framework that embeds resource interactions into the measurement and spatial matching analysis of ES supply and demand. To address this gap, this study proposes an ES-WEF analytical framework with three distinctive innovations: (1) it explicitly incorporates the interdependence of water, energy, and food into the selection and measurement of key ESs; (2) it constructs a cross-resource supply–demand matching index that captures the coupling effects among the three systems; and (3) it develops a ‘zoning–classification–grading’ governance system that translates the nexus perspective into spatially explicit management strategies.
Figure 1 presents the research framework of this study. The framework adopts a WEF nexus perspective with multi-scale analysis (municipal, county, and grid scales) and consists of four components: data sources, methods, main contents, and key conclusions. Data sources include land use data, precipitation, evapotranspiration, root data, NDVI, and population spatial distribution data. Methods are divided into three parts: supply side, demand side, and supply–demand matching. On the supply side, the InVEST model is used to assess water yield and carbon sequestration, and the NDVI downscaling method is used to assess food supply. On the demand side, water demand, carbon demand (energy consumption × emission factor + population downscaling), and food demand (per capita consumption + population downscaling) are calculated based on statistical data combined with population downscaling. Supply–demand matching applies the supply–demand index (SDI), four-quadrant analysis, multi-scale comparison, and Pearson correlation analysis. Main contents cover the spatiotemporal patterns of ES supply and demand (trends from 2005 to 2020), as well as scale effects and correlation analysis (municipal/county/grid comparison, supply/demand/SDI correlations). Key conclusions include: water yield and food supply increased, while carbon demand grew rapidly, narrowing the supply–demand surplus; supply is “high in the south, low in the north,” while demand is “high in the central area, low in the surrounding areas”; the county scale is optimal; a “zoning–classification–grading” governance system was constructed; and differentiated strategies are proposed for water, energy, and food zones.

2. Materials and Methods

2.1. Study Area

The Pinglu Canal Economic Zone is located in the southern part of the Guangxi Zhuang Autonomous Region, China (20°54′ N–26°23′ N, 104°26′ E–112°03′ E). It covers five cities: Nanning, Guigang, Qinzhou, Fangchenggang, and Beihai, comprising 29 county-level administrative units, with a total area of approximately 53,800 km2 [44]. The terrain of the region is generally flat, slightly tilting from north to south, with a dense river network, representing a typical low-hilly plain landscape. The climate is a southern subtropical monsoon climate, with an average annual temperature of 21–23 °C and an average annual precipitation of about 1500 mm [45]. The rainy and hot seasons coincide, providing superior conditions for agricultural production, making it one of the important food-producing areas in Guangxi. By the end of 2024, the permanent population of the region was approximately 19.5798 million, and the gross regional product (GDP) reached 1249.55 billion yuan. Its economic structure presents a significant “dual” characteristic: inland areas such as Nanning and Guigang are traditional agricultural and manufacturing centers, while coastal cities such as Qinzhou, Beihai, and Fangchenggang, relying on port advantages, have formed heavy industry clusters dominated by petrochemicals, metallurgy, and clean energy. With the Qinzhou Port Economic Circle as the growth pole, they jointly constitute the industrial pattern of regional development.
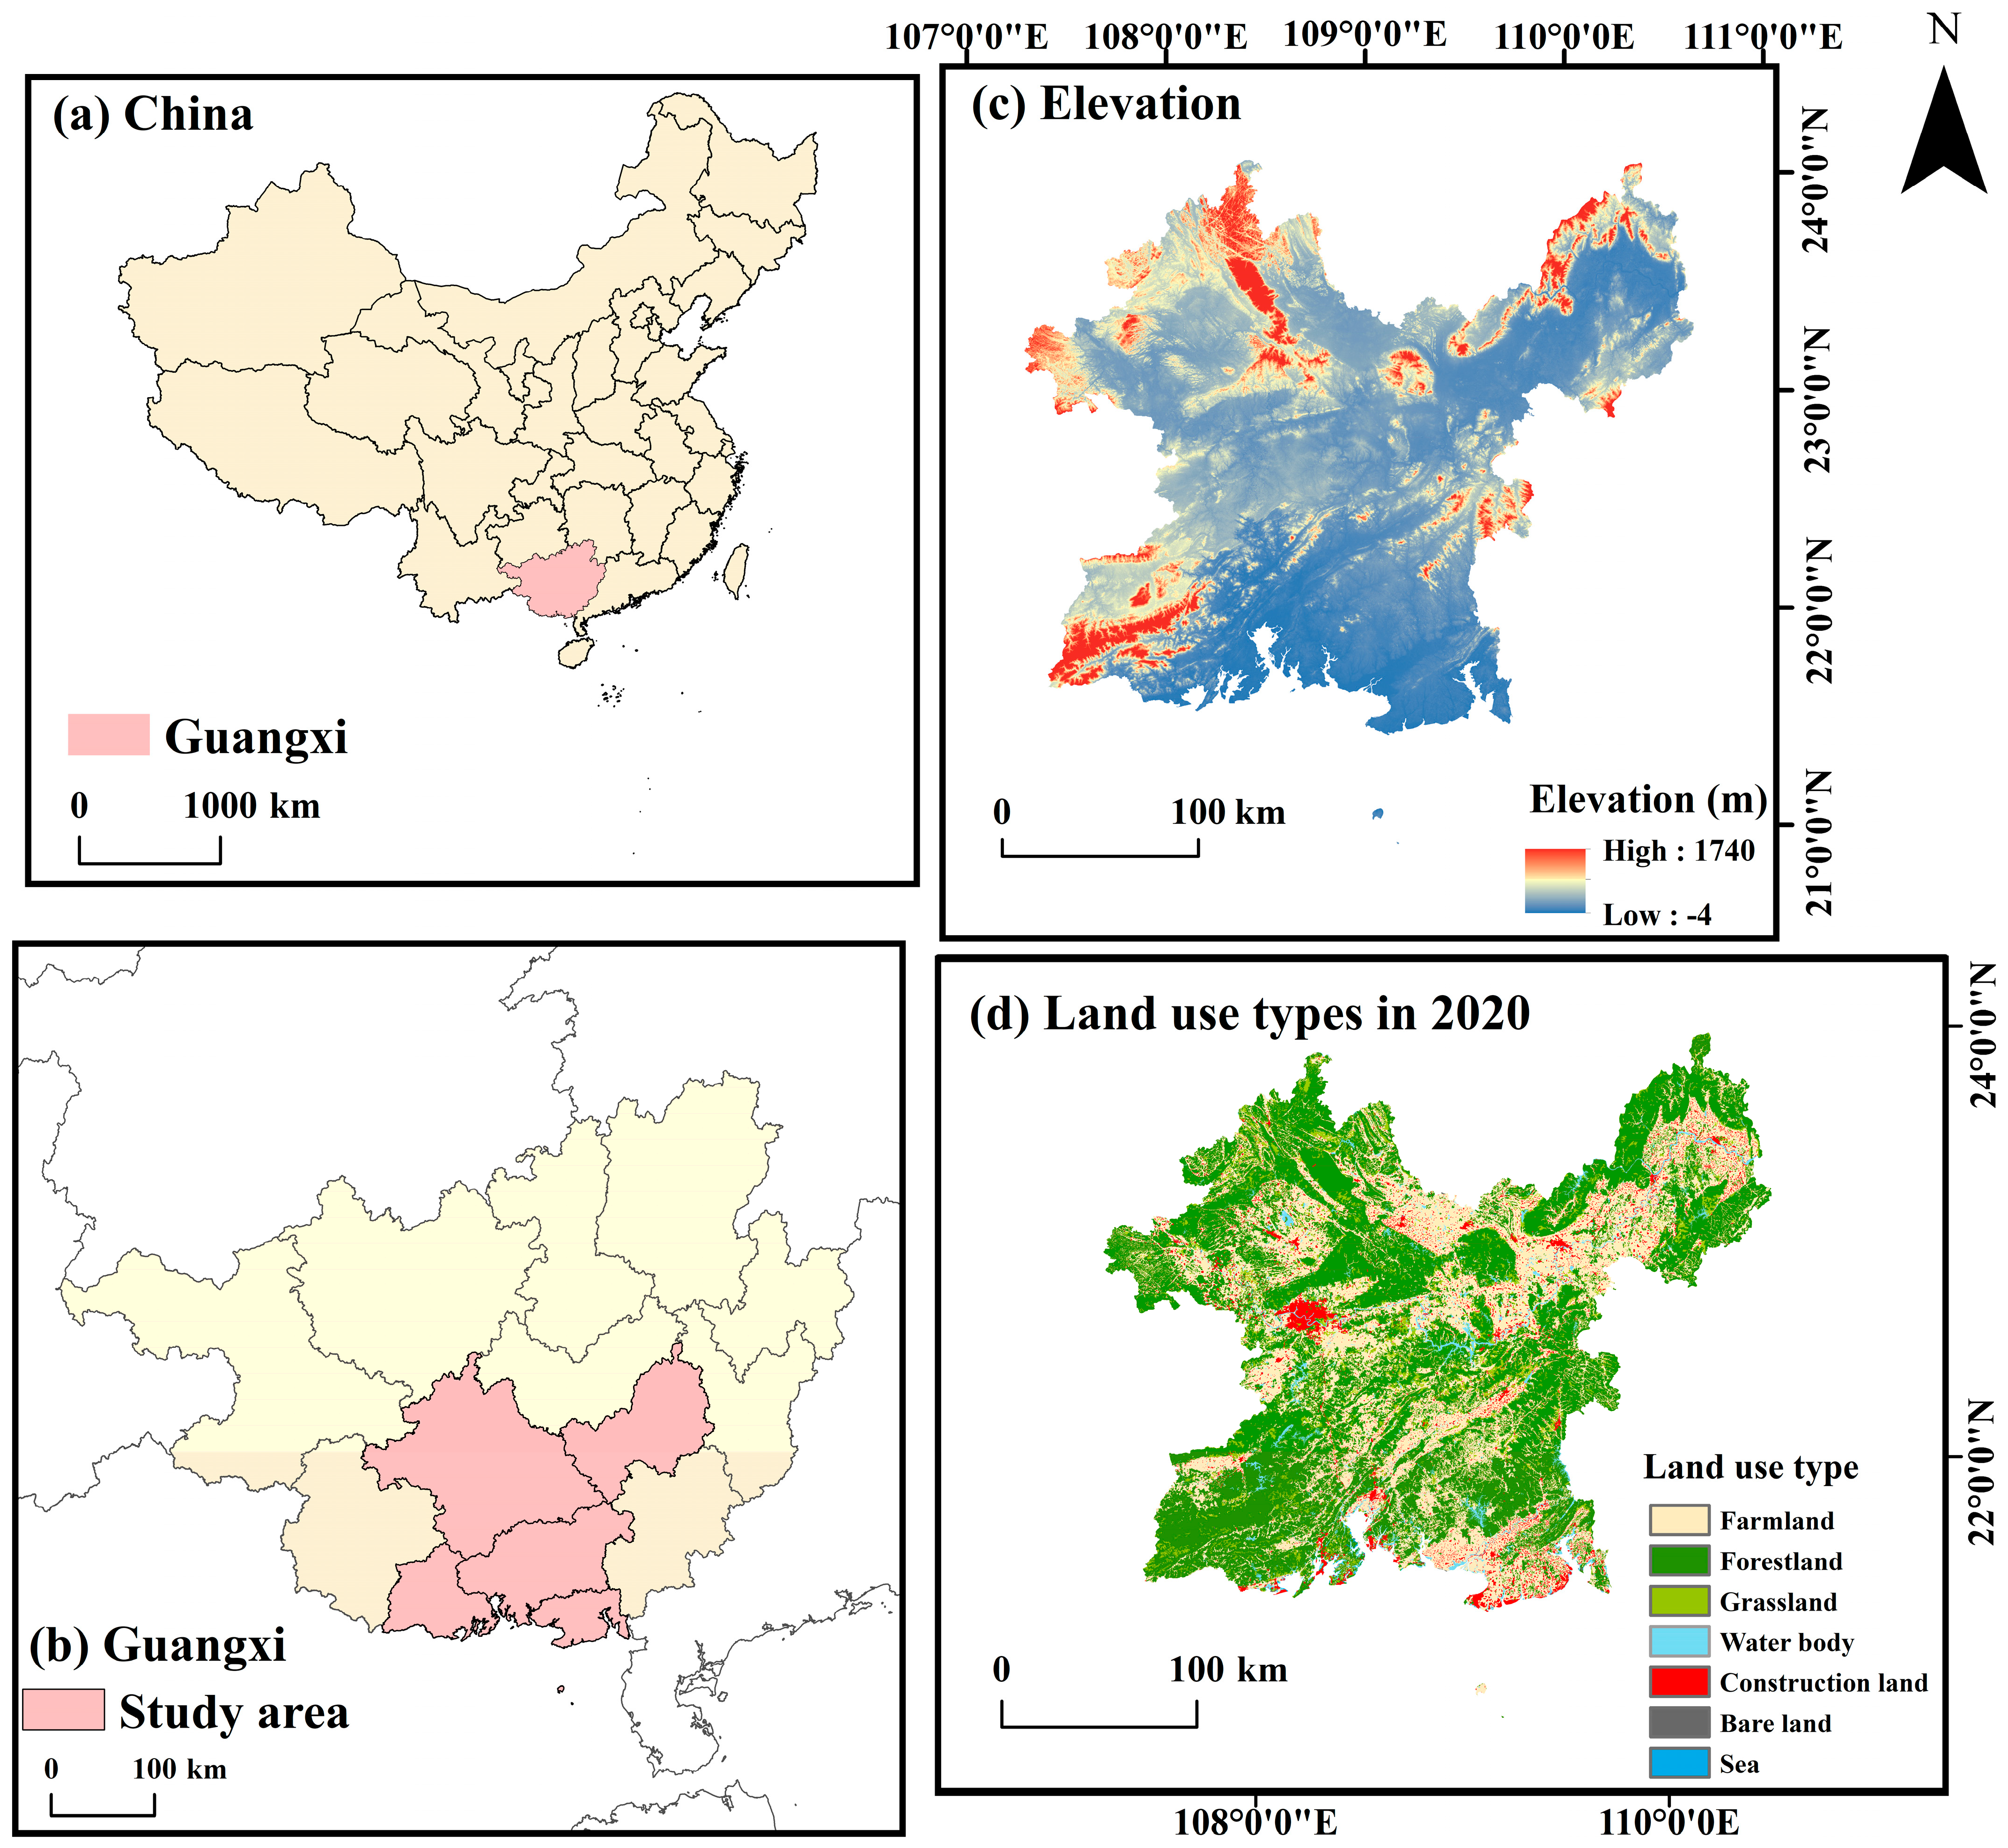
Based on land use data from 2005 to 2020, the cultivated land area in the Pinglu Canal Economic Zone showed a decreasing trend year by year due to the expansion of construction land. The forest land area also decreased slightly but remained relatively stable in ecological barrier areas such as the Shiwandashan Mountains in the south [46]. There is an obvious spatial substitution relationship between the two: some cultivated land has been returned to forest, while some forest land has been converted to construction land, reflecting the resource competition and functional trade-offs between food security, ecological protection, and economic development. The geographical location, DEM, and land use status of the study area are shown in Figure 2.

2.2. Data Sources

This study used multi-source data to analyze the water yield, carbon sequestration, and food supply–demand services in the Pinglu Canal Economic Zone. The data sources are shown in Table 1. Carbon storage mainly includes four carbon pools: aboveground biomass, belowground biomass, soil, and dead organic matter. Parameter references were obtained from the literature [47,48].

2.3. Calculation of Ecosystem Service Supply

The InVEST model (version 3.15.1) was used to assess water yield and carbon sequestration services. The selection of key parameters followed established practices in the Guangxi region. Specifically, the plant evapotranspiration coefficient (Kc), maximum root depth, and plant available water content (PAWC) for the water yield module were derived from localized parameter sets reported in previous studies [49]. For carbon sequestration, the carbon density values for each land use type (including aboveground biomass, belowground biomass, soil, and dead organic matter) were also obtained from field-measured and model-derived results in Guangxi [47,48]. For land use types without local measurements (e.g., urban built-up land), carbon density values were referenced from empirical studies in neighboring provinces and national-scale assessments. The data sources listed in Table 1 provide links to the original input parameters.

2.3.1. Water Yield Service

The water yield service mainly includes three aspects: vegetation interception of precipitation, water retention by the litter layer, and soil water storage. Parameters such as maximum root depth, plant evapotranspiration coefficient, and plant available water content used empirical values from relevant studies. The Annual Water Yield module of the InVEST model was used to estimate the regional water yield. The specific calculation formula is as follows:
Y i = 1 A E T i P i     × P i
where Yi is the annual water yield of grid unit (mm); AETi is the actual annual evapotranspiration of grid unit i (mm); and Pi is the annual precipitation of grid unit i (mm).

2.3.2. Carbon Sequestration Service

The supply of carbon sequestration services refers to the ability of ecosystems to fix carbon dioxide from the atmosphere through vegetation, soil, etc. The carbon sequestration service supply was quantified using the Carbon Storage and Sequestration module of the InVEST model. This module divides the carbon storage of each land use type into four basic carbon pools: aboveground biomass, belowground biomass, soil, and litter. The formula is as follows:
C i = C a b o v e + C b e l o w + C s o i l + C d e a d
where Ci is the carbon sequestration of grid unit i (ton/hm2), Cabove is the carbon stored in aboveground biomass (ton/hm2), Cbelow is the carbon stored in belowground biomass (ton/hm2), Csoil is the carbon stored in soil (ton/hm2), and Cdead is the carbon stored in dead organic matter (ton/hm2).

2.3.3. Food Supply

Food supply service is an important component of ecosystems. Studies have shown a significant linear correlation between crop yield and the NDVI index. Therefore, the spatial distribution of food supply in the study area was allocated based on the food yield data from yearbooks combined with the ratio of NDVI grid values to the total NDVI of cropland. The formula is as follows:
G i = N D V I i N D V I s u m   ×   G s u m
where Gi is the crop yield allocated to the i-th grid, Gsum is the total crop yield, NDVIi is the NDVI of the i-th cropland grid, and NDVIsum is the sum of NDVI over the cropland of the study area.

2.4. Calculation of Ecosystem Service Demand

2.4.1. Water Demand

Water demand is the total water demand for agricultural, industrial, domestic, and other activities. The total water demand was then disaggregated into each grid using population spatial distribution data. The specific calculation formulas are as follows:
T D w t = D a t + D i t + D d t + D f t
where TDtw is the total water demand in year t (m3), D a t is the agricultural water demand in year t (m3), i D i t is the industrial water demand in year t (m3), D d t is the domestic water demand in year t (m3), D f t is the ecological environment water demand, D p w t is the per capita water demand in year t (m3/person), popt is the permanent population in year t (persons), D W g t is the water demand of the grid in year t (m3), and P g t is the population of the grid in year t (persons).
It should be noted that the disaggregation of total water demand into grids using population spatial distribution data assumes that per capita water consumption is spatially uniform within each administrative unit. This assumption may underestimate water demand in industrial-intensive areas with low population density but high water use per unit area. Similar approaches have been adopted in previous studies. Future refinement could incorporate industrial heatmaps or nighttime light data to improve spatial accuracy.

2.4.2. Carbon Sequestration Demand

The measurement of carbon sequestration service demand mainly uses energy consumption multiplied by the corresponding carbon emission factor to obtain the total carbon emissions. Then, the per capita carbon emission is calculated. Finally, the per capita carbon emission is multiplied by the population spatial distribution to obtain the carbon emissions of different grids. The specific calculation formulas are as follows:
D p c t = T D c t p o p t
D C g t = D p c t × P P O P ( i )  
where D p c t is the per capita carbon emission (t), T D c t is the total carbon emission in year t (t), popt is the permanent population in year t (persons), D C g t is the carbon emission of grid g in year t (t), and PPOP(i) is the grid population density (persons/hm2).

2.4.3. Food Demand

The demand for food supply service can be obtained by multiplying the per capita food consumption by the population density. The specific calculation formula is as follows:
D C P ( i ) = D p c f d × P P O P ( i )  
where DCP(i) is the food demand of grid unit i (t/hm2), Dpcfd is the per capita food consumption (t), and PPOP(i) is the grid population density (persons/hm2).
Equation (7) assumes that per capita food consumption is constant across all grids within the study area. This assumption follows the standard practice in ES demand assessment at regional scales, where detailed household-level consumption data are often unavailable. However, it may introduce bias in areas with significant income or dietary differences. The per capita food consumption value used in this study is derived from the Guangxi Statistical Yearbook and is consistent with the regional average.

2.5. Assessment of ES Supply–Demand Matching

The ES supply–demand ratio can link ecosystem supply and human demand, thereby revealing the surplus or deficit of ESs.
S D I j = E S j E D j E S j + E D j
where SDIj is the ES supply–demand ratio in region j, and ESj, EDj represent the supply and demand of ESs, respectively. DIj > 0 indicates a surplus of ESs, SDIj < 0 indicates a deficit, and SDIj = 0 indicates a balance.

2.6. ES Matching Patterns Based on the Four-Quadrant Model

The four-quadrant model is a tool that combines quantitative and qualitative analysis. Originally used to analyze real estate markets, it has gradually been applied to fields such as ESs, water resource value, and landscape ecological service quality. This study used the four-quadrant model to explore the supply and demand of ESs. The supply and demand were standardized using Z-scores, and a two-dimensional coordinate system was constructed with the standardized supply as the x-axis and demand as the y-axis. Four spatial matching types were obtained based on quadrant analysis: high supply–high demand (H-H), high supply–low demand (H-L), low supply–high demand (L-H), and low supply–low demand (L-L), and visualized spatially.
x = ( x i x ¯ ) / s
where x is the standardized supply or demand, xi is the supply or demand in region i, x is the average value of the region, and s is the standard deviation.
To eliminate the influence of supply and demand dimensions, the supply and demand of the original data were normalized. The normalized values were then accumulated to obtain the total ES supply and demand in the study area.
Where E S S D i is the total ES supply and demand, E S S D i j is the normalized result for region j, E S D i j is the original ES supply or demand, and m a x E S D j and m i n i E S D j are the maximum and minimum values of the original ESs, respectively.

2.7. Correlation Analysis

To reveal the interrelationships among ESs in the Pinglu Canal Economic Zone, Pearson correlation coefficients were used at different scales. This study focused on three ESs—water yield (WY), carbon sequestration (CS), and food supply (FP)—and calculated the correlation coefficient matrix for each pair.
r 1,2 = p = 1 n ( E S 1 E S ¯ 1 ) ( E S 2 E S ¯ 2 ) p = 1 n ( E S 1 E S ¯ 1 ) 2 p = 1 n ( E S 2 E S ¯ 2 ) 2
where r1,2 is the correlation coefficient between ESs1 and ESs2, and n is the number of samples. The value of r ranges from −1 to 1. r > 0 indicates a positive correlation, r < 0 indicates a negative correlation, and r = 0 indicates no correlation.

2.8. Comprehensive Zoning for ES Supply and Demand

This study combined ES functions, supply–demand matching relationships, and matching patterns to propose a comprehensive zoning model for ES management. Based on the results of the ES-related models, an appropriate scale was selected as the zoning object, and combined zoning types were divided through spatial overlay. According to the SDI value of ESs, the study area was divided into three main functional zones. Then, based on the ES supply–demand matching model, it was divided into four strategic classification zones. Finally, according to the comprehensive ES supply–demand value and using the natural breaks method, it was divided into three high-level governance zones. This zoning approach can highlight the dominant functions and supply–demand balance relationships of regional spaces while reflecting the relationships among the three, which is conducive to strengthening regulatory effects.

3. Results

3.1. Temporal Variation Characteristics of ES Supply and Demand

From the supply side, the supply capacity of carbon sequestration (CS) and food supply (FP) services continued to steadily strengthen. By 2020, the supply increased by 7.01% and 54.31%, respectively, compared with 2005, indicating that land use structure optimization and agricultural management measures during the study period were generally conducive to carbon accumulation and food production capacity improvement. The supply of water yield (WY) services showed significant interannual fluctuations, peaking in 2015 due to abundant precipitation before falling to below the initial level in 2020, which is closely related to regional climate fluctuations and water resource regulation. From the demand side, the demand for all three services showed a continuous growth trend, with clear differences in growth rates. Water resource demand increased the most, growing by approximately 80.07% in 2020 compared with 2005, reflecting the enormous water pressure brought by rapid industrialization and urbanization. Carbon sequestration demand increased by 63.10%, indicating an increasingly difficult situation regarding regional carbon emission control. In contrast, food demand was less affected by changes in population and dietary structure, remaining stable overall, with only a 2.09% increase in 2020 compared with 2005. From the perspective of supply–demand relationships, the three services were generally in a state of supply exceeding demand (regional overall SDI > 0) during the study period, but the development trends showed differentiation (Table 2). The SDI of water yield services showed a fluctuating downward trend due to surging demand and unstable supply. The SDI of carbon sequestration services continued to decline, and the surplus space for supply and demand significantly narrowed. The SDI of food services steadily increased, the supply–demand surplus significantly expanded, and the regional food security foundation was solid.

3.2. Spatial Distribution Patterns of ES Supply and Demand

3.2.1. Spatial Distribution Pattern of ES Supply

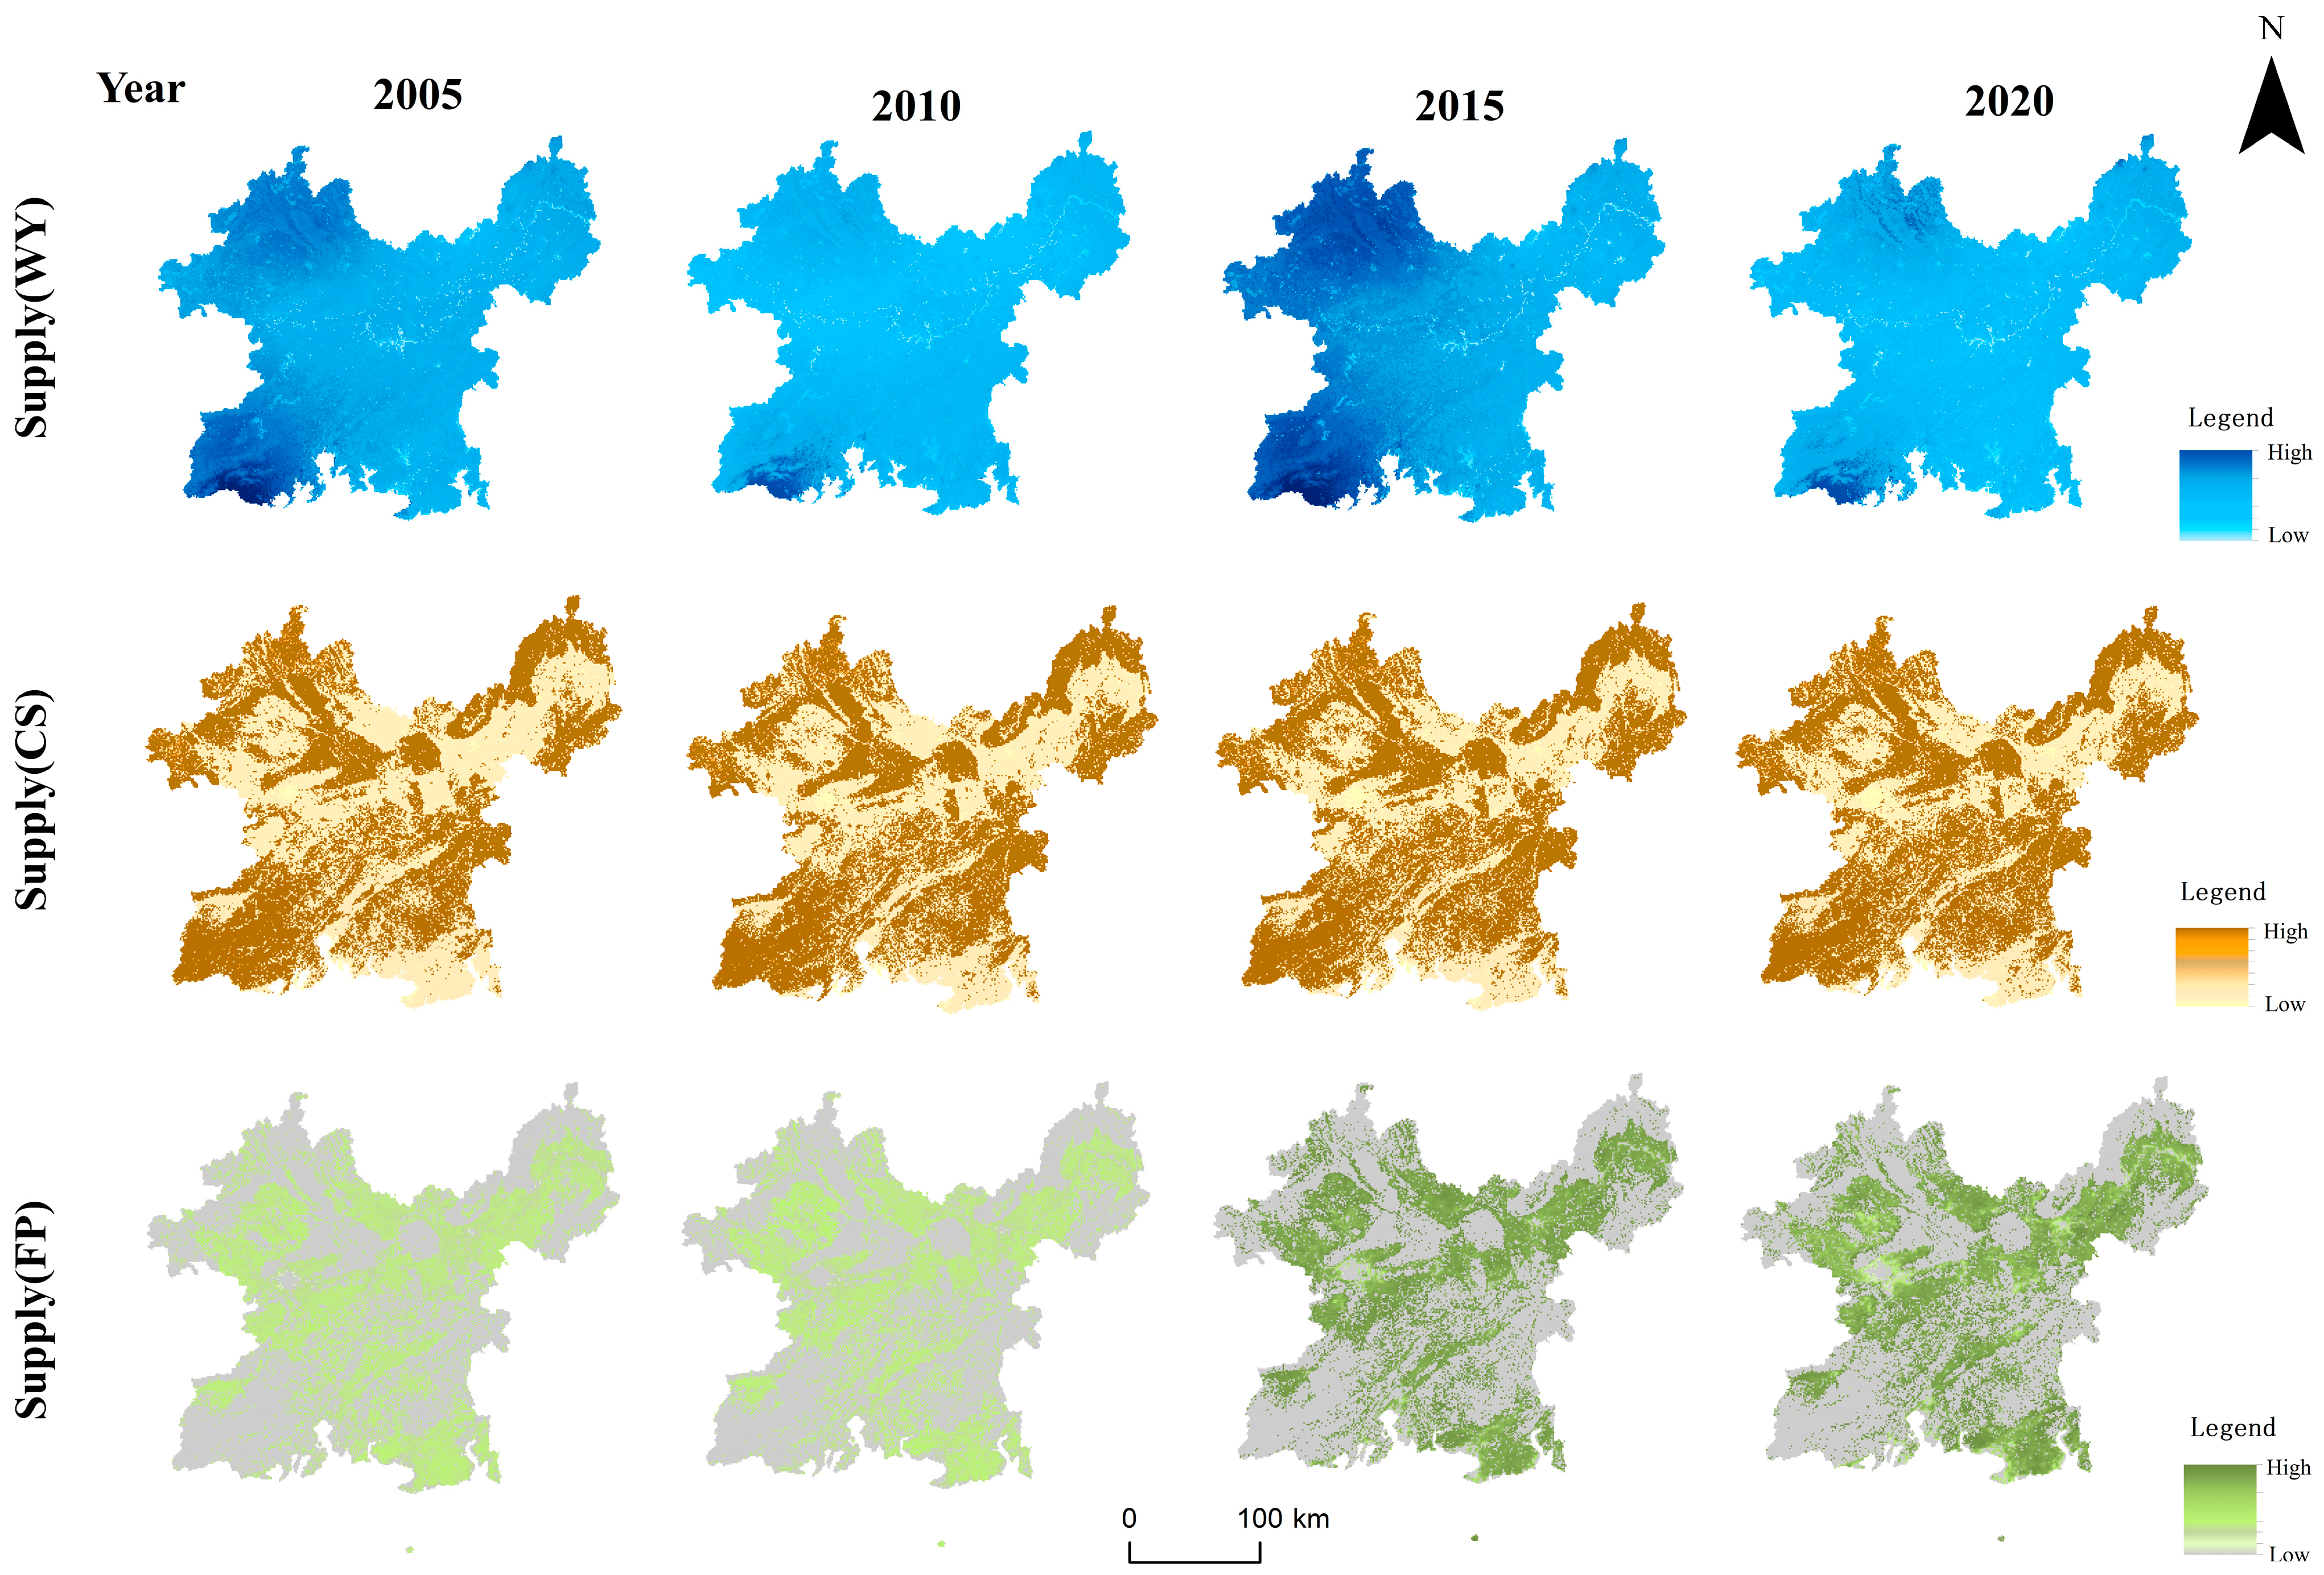
The spatial distribution of different types of ESs varied (Figure 3). The supply of water yield services showed a clear spatial characteristic of “overall fluctuation, high in the south and low in the north”, with high-value areas stably distributed in the southern part of the study area, which is directly related to the spatial differences in regional precipitation. The wet year of 2015 brought the water yield supply to its peak, while the trough in 2020 highlighted the instability of the water resource supply. The high-value areas of carbon sequestration supply were concentrated and stably distributed in ecological lands such as forests and wetlands in the southern and western parts, where vegetation coverage is high, and carbon sink functions are strong. Conversely, the carbon sequestration supply capacity in areas with concentrated construction land was generally low. The spatial distribution of food supply services was highly consistent with the cropland pattern. High-value areas were contiguously distributed in the northern plain agricultural areas, such as Guigang and Nanning, and showed an optimization trend over time from “low-level equilibrium” to “high-level agglomeration”, indicating an improvement in the spatial efficiency of food production. The formation of the above spatial patterns is closely related to natural geographical processes. The “high in the south, low in the north” pattern of water yield supply is primarily controlled by the spatial differentiation of precipitation, with mean annual rainfall in the southern coastal areas (∼2200 mm) significantly higher than that in the northern hinterland (∼1200 mm). The spatial coincidence of high-value carbon sequestration areas with ecological land (forests and wetlands) reflects the decisive role of vegetation cover in carbon sink capacity. The consistency between food supply and cropland patterns indicates that agricultural land use type is the most direct factor determining regional food production capacity.

3.2.2. Spatial Distribution Pattern of ES Demand

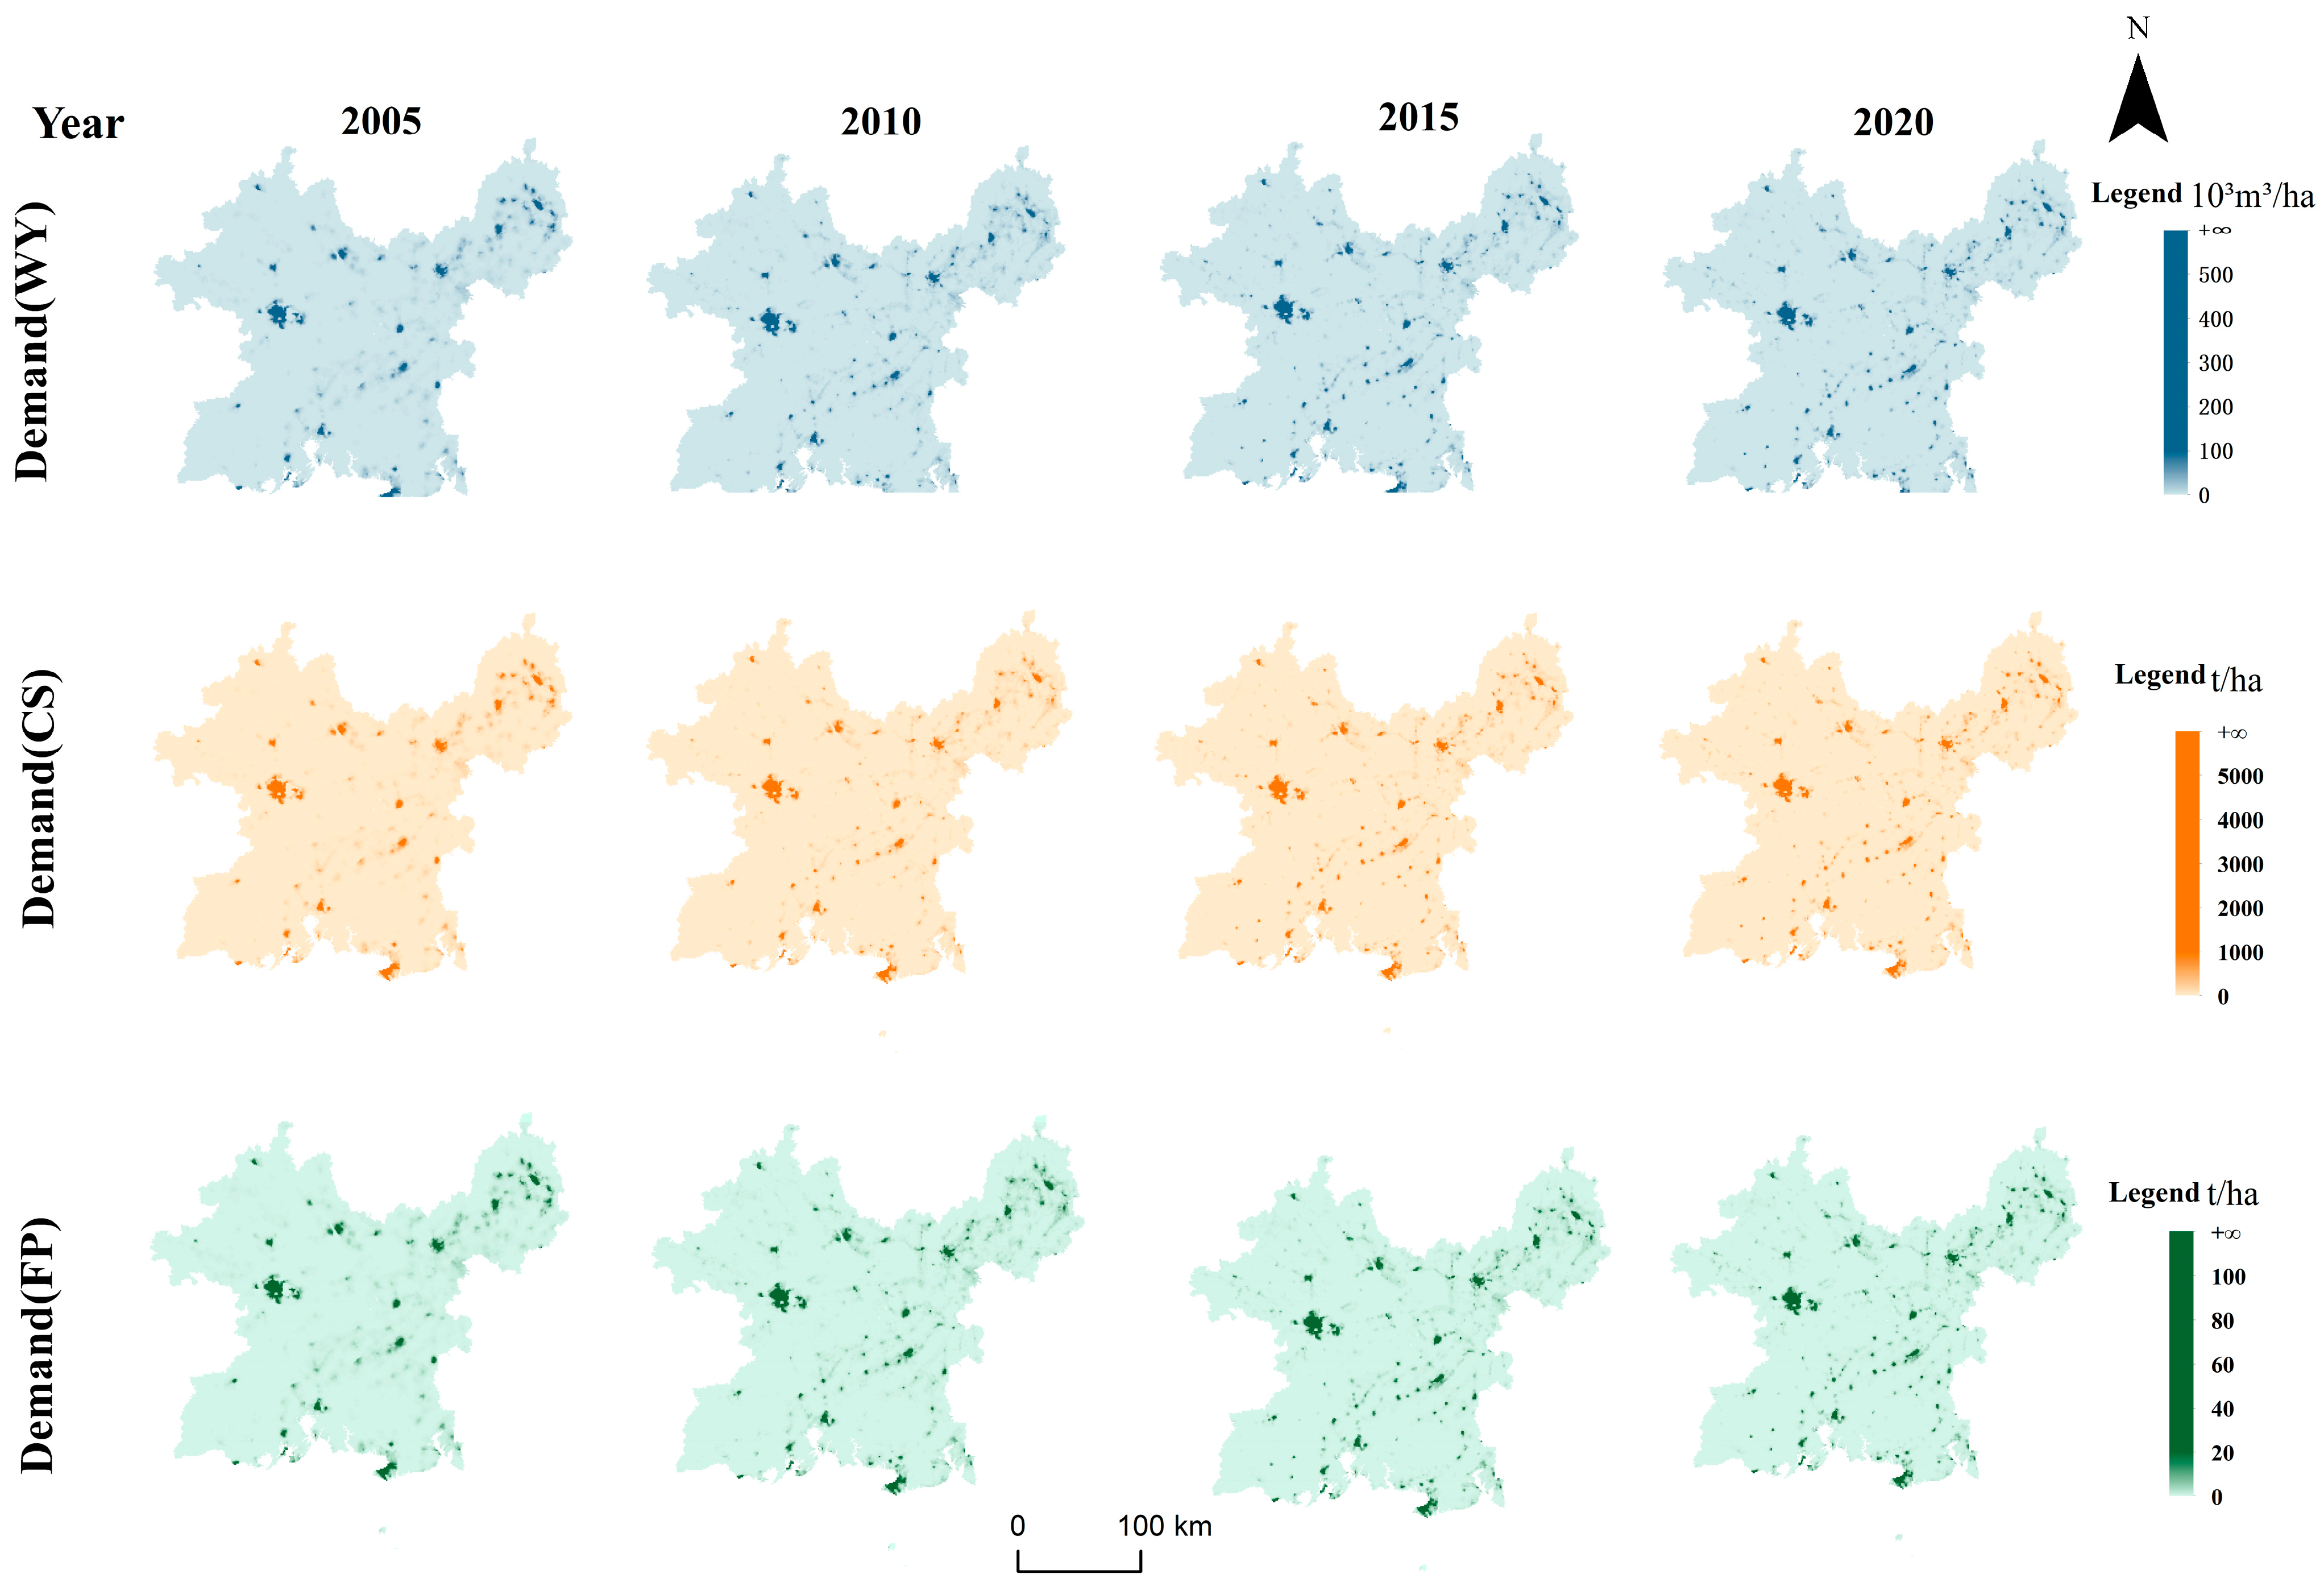
The spatial patterns of demand for the three services were highly similar, all showing a typical characteristic of “high in the central area and low in the surrounding areas” (Figure 4), which is highly consistent with the spatial agglomeration of population density and economic activities. High-value areas of water resource demand were centered on core cities such as Nanning and Qinzhou, intensifying in a “patchy–belt” manner with industrial and urban expansion. High-value areas of carbon sequestration demand gradually expanded from point-like distributions in major cities in the early period to a “contiguous patchy” distribution covering the Nanning–Guigang–Qinzhou urban belt, reflecting the spatial spread of regional energy consumption and carbon emissions. High-value areas of food demand were highly coincident with urban built-up areas and surrounding densely populated areas, showing a “point-cluster” distribution with a relatively stable pattern. The common pattern of “high in the central area and low in the surrounding areas” across the three demand types reveals the mandatory driving force of human activities on ES demand. The central cities of Nanning, Guigang, and Qinzhou, as agglomeration areas of population and economic activities, have much higher intensities of industrial water consumption, energy use, and food consumption than surrounding counties and cities. This pattern has been continuously strengthened with the advancement of urbanization from 2005 to 2020, reflecting the spatial coupling between demand-side pressures and population-economic agglomerations.

3.2.3. Spatial Distribution Pattern of the ES Supply–Demand Ratio

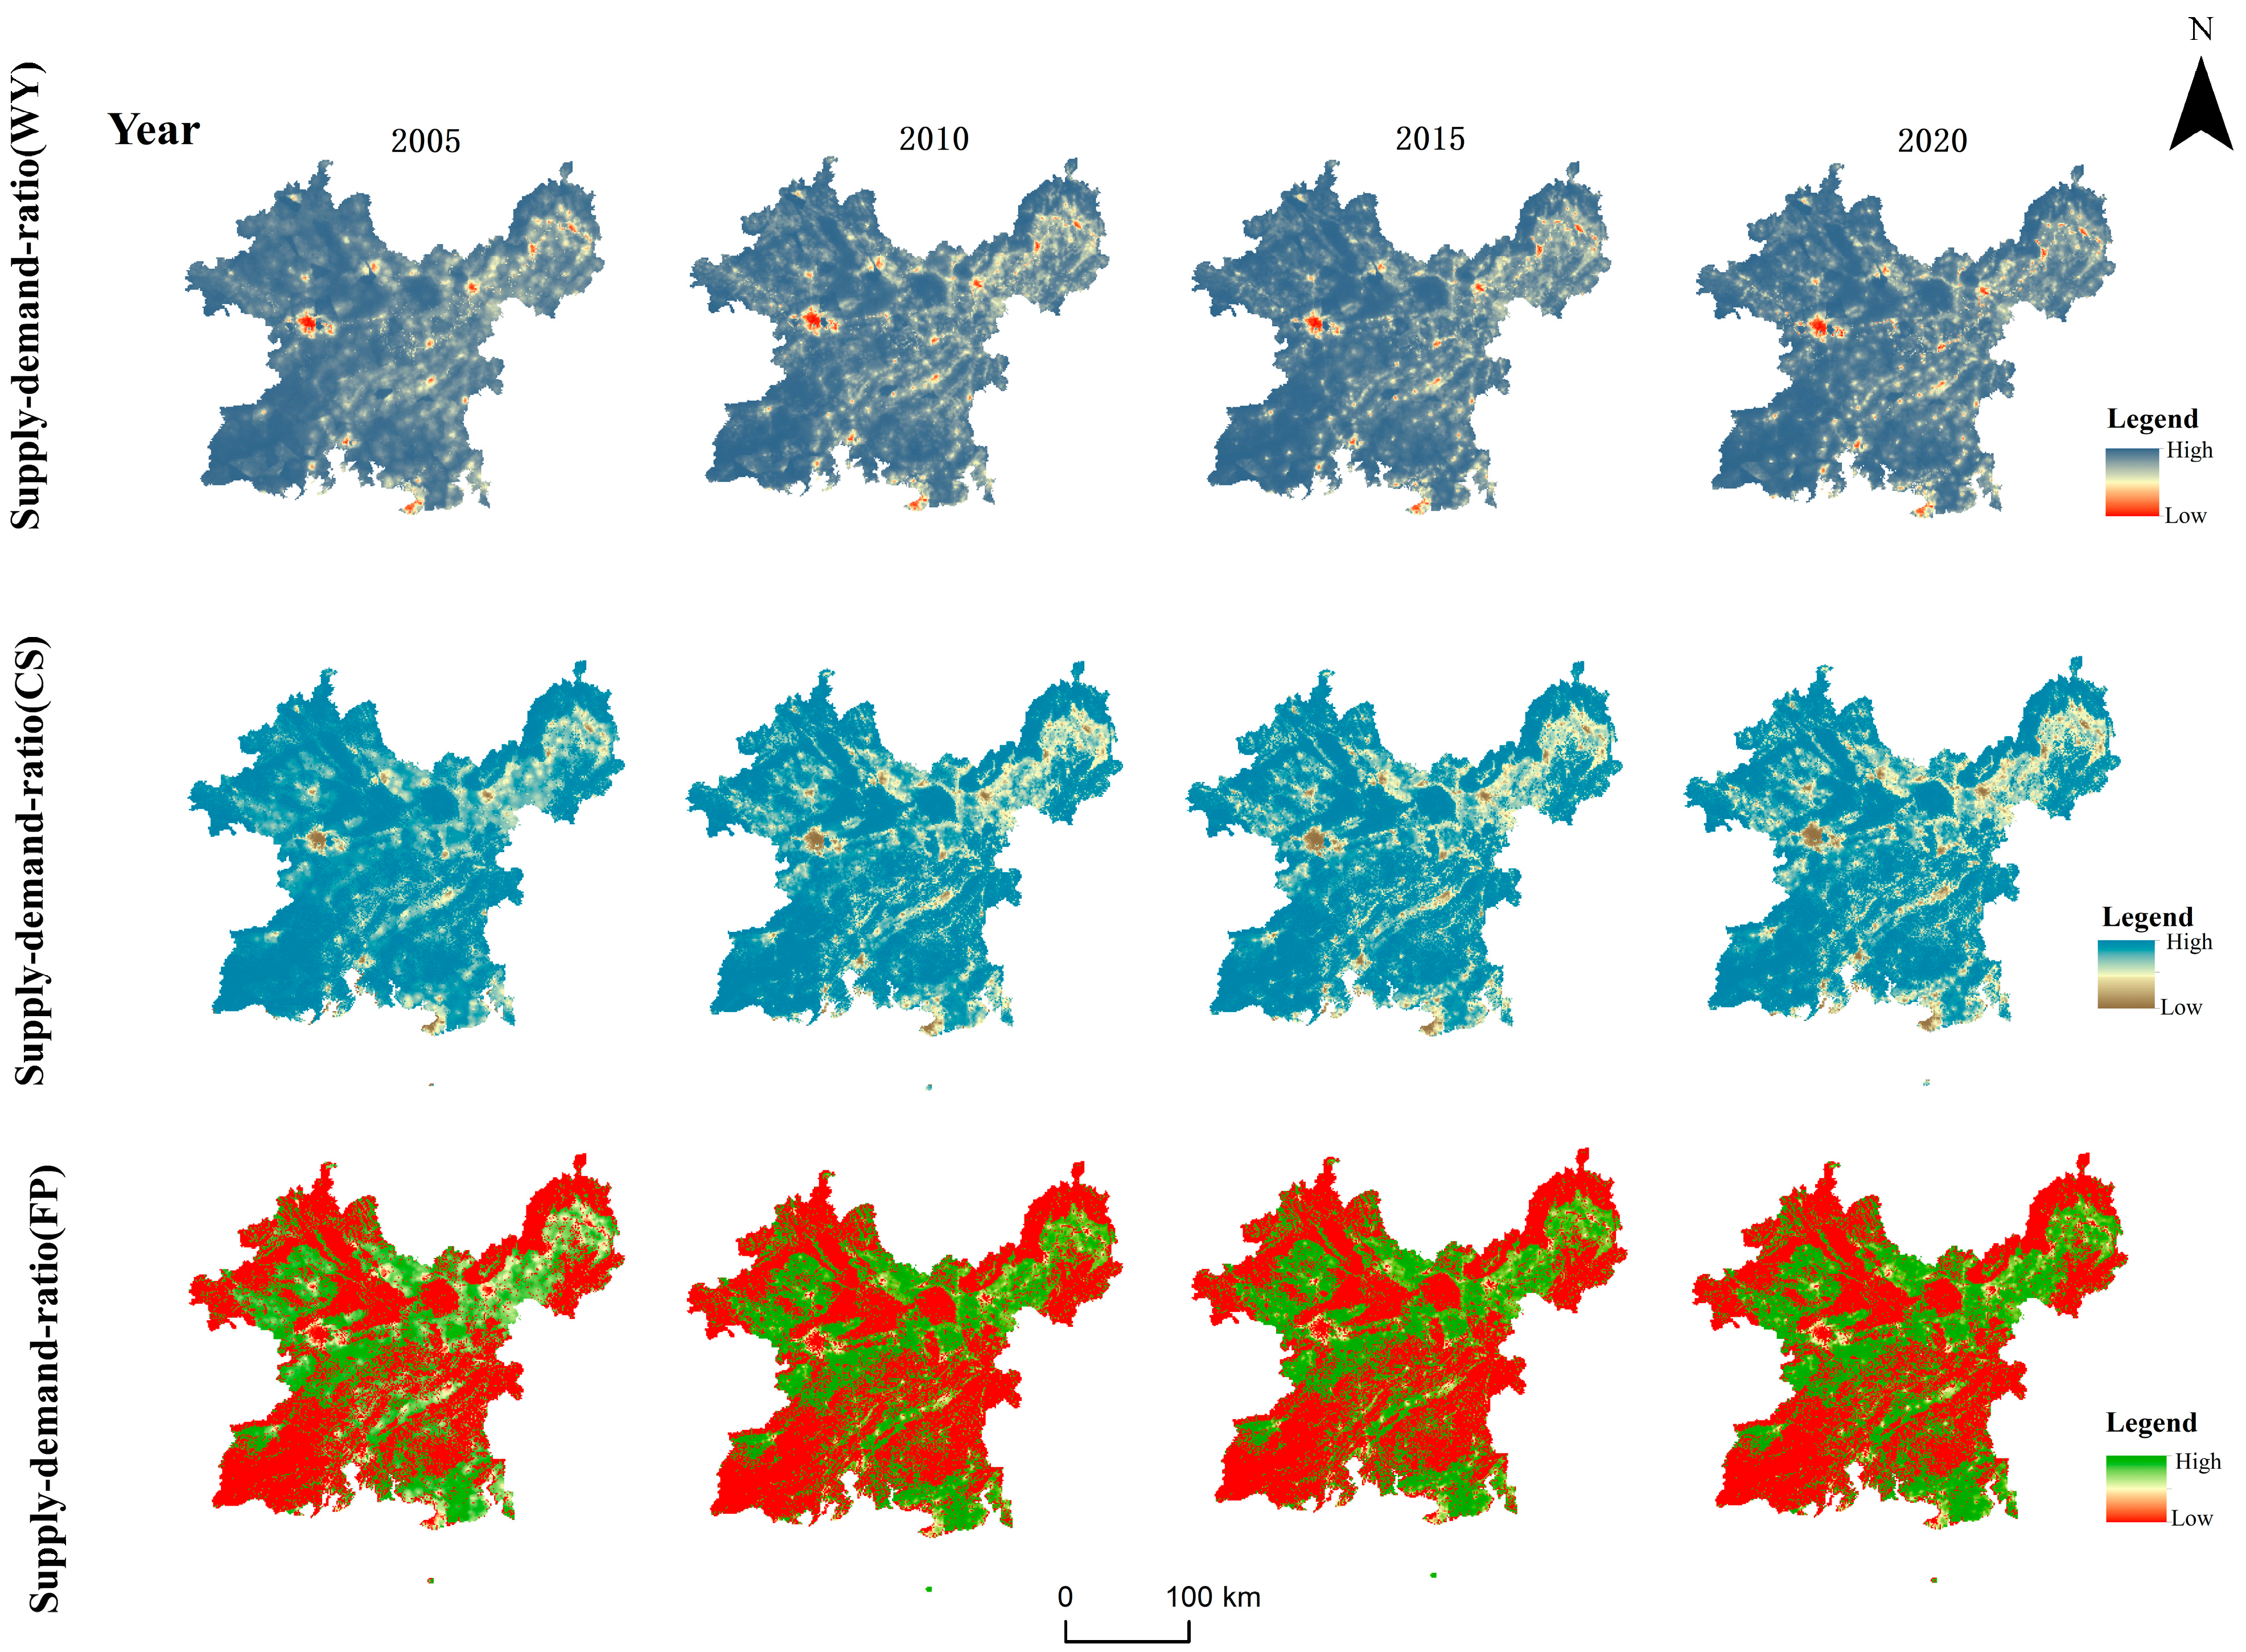
The spatial distribution of the SDI revealed obvious regional differentiation and spatial mismatch (Figure 5). Quantitatively (Table 3), the regional SDI for water yield fluctuated between 0.7485 and 0.7832 over the study period, while the SDI for carbon sequestration declined steadily from 0.7343 to 0.6631. Spatially (Figure 5), positive SDI areas for water yield were mainly located in the southern water conservation areas, while negative value areas were concentrated in the central urban agglomerations such as Nanning and Qinzhou, indicating a prominent contradiction between high-intensity urban water demand and unstable local water supply. The spatial pattern of the SDI for carbon sequestration showed a characteristic of “high in the surrounding areas and low in the central area”. High-value areas were located on the southern coast and in western forests with good ecological backgrounds, while low-value areas overlapped with the high-carbon-emission urban belt. The positive SDI areas for food services were highly concentrated in the northern food-producing areas, forming a solid “north-to-south” supply pattern.
The fundamental cause of SDI spatial differentiation lies in the spatial decoupling between supply and demand. The supply–demand contradiction for water yield mainly occurs in urban centers where supply is relatively insufficient, but demand is highly concentrated. The overlap between carbon sequestration deficit areas and the high-carbon-emission urban belt indicates that energy consumption structure optimization and carbon emission reduction are key to alleviating the carbon supply–demand imbalance. The spatial consistency between high SDI areas for food supply and major food-producing areas reflects the dominant role of agricultural comparative advantage in the regional division of labor.

3.3. Comparative Analysis of ES Supply and Demand at Different Scales

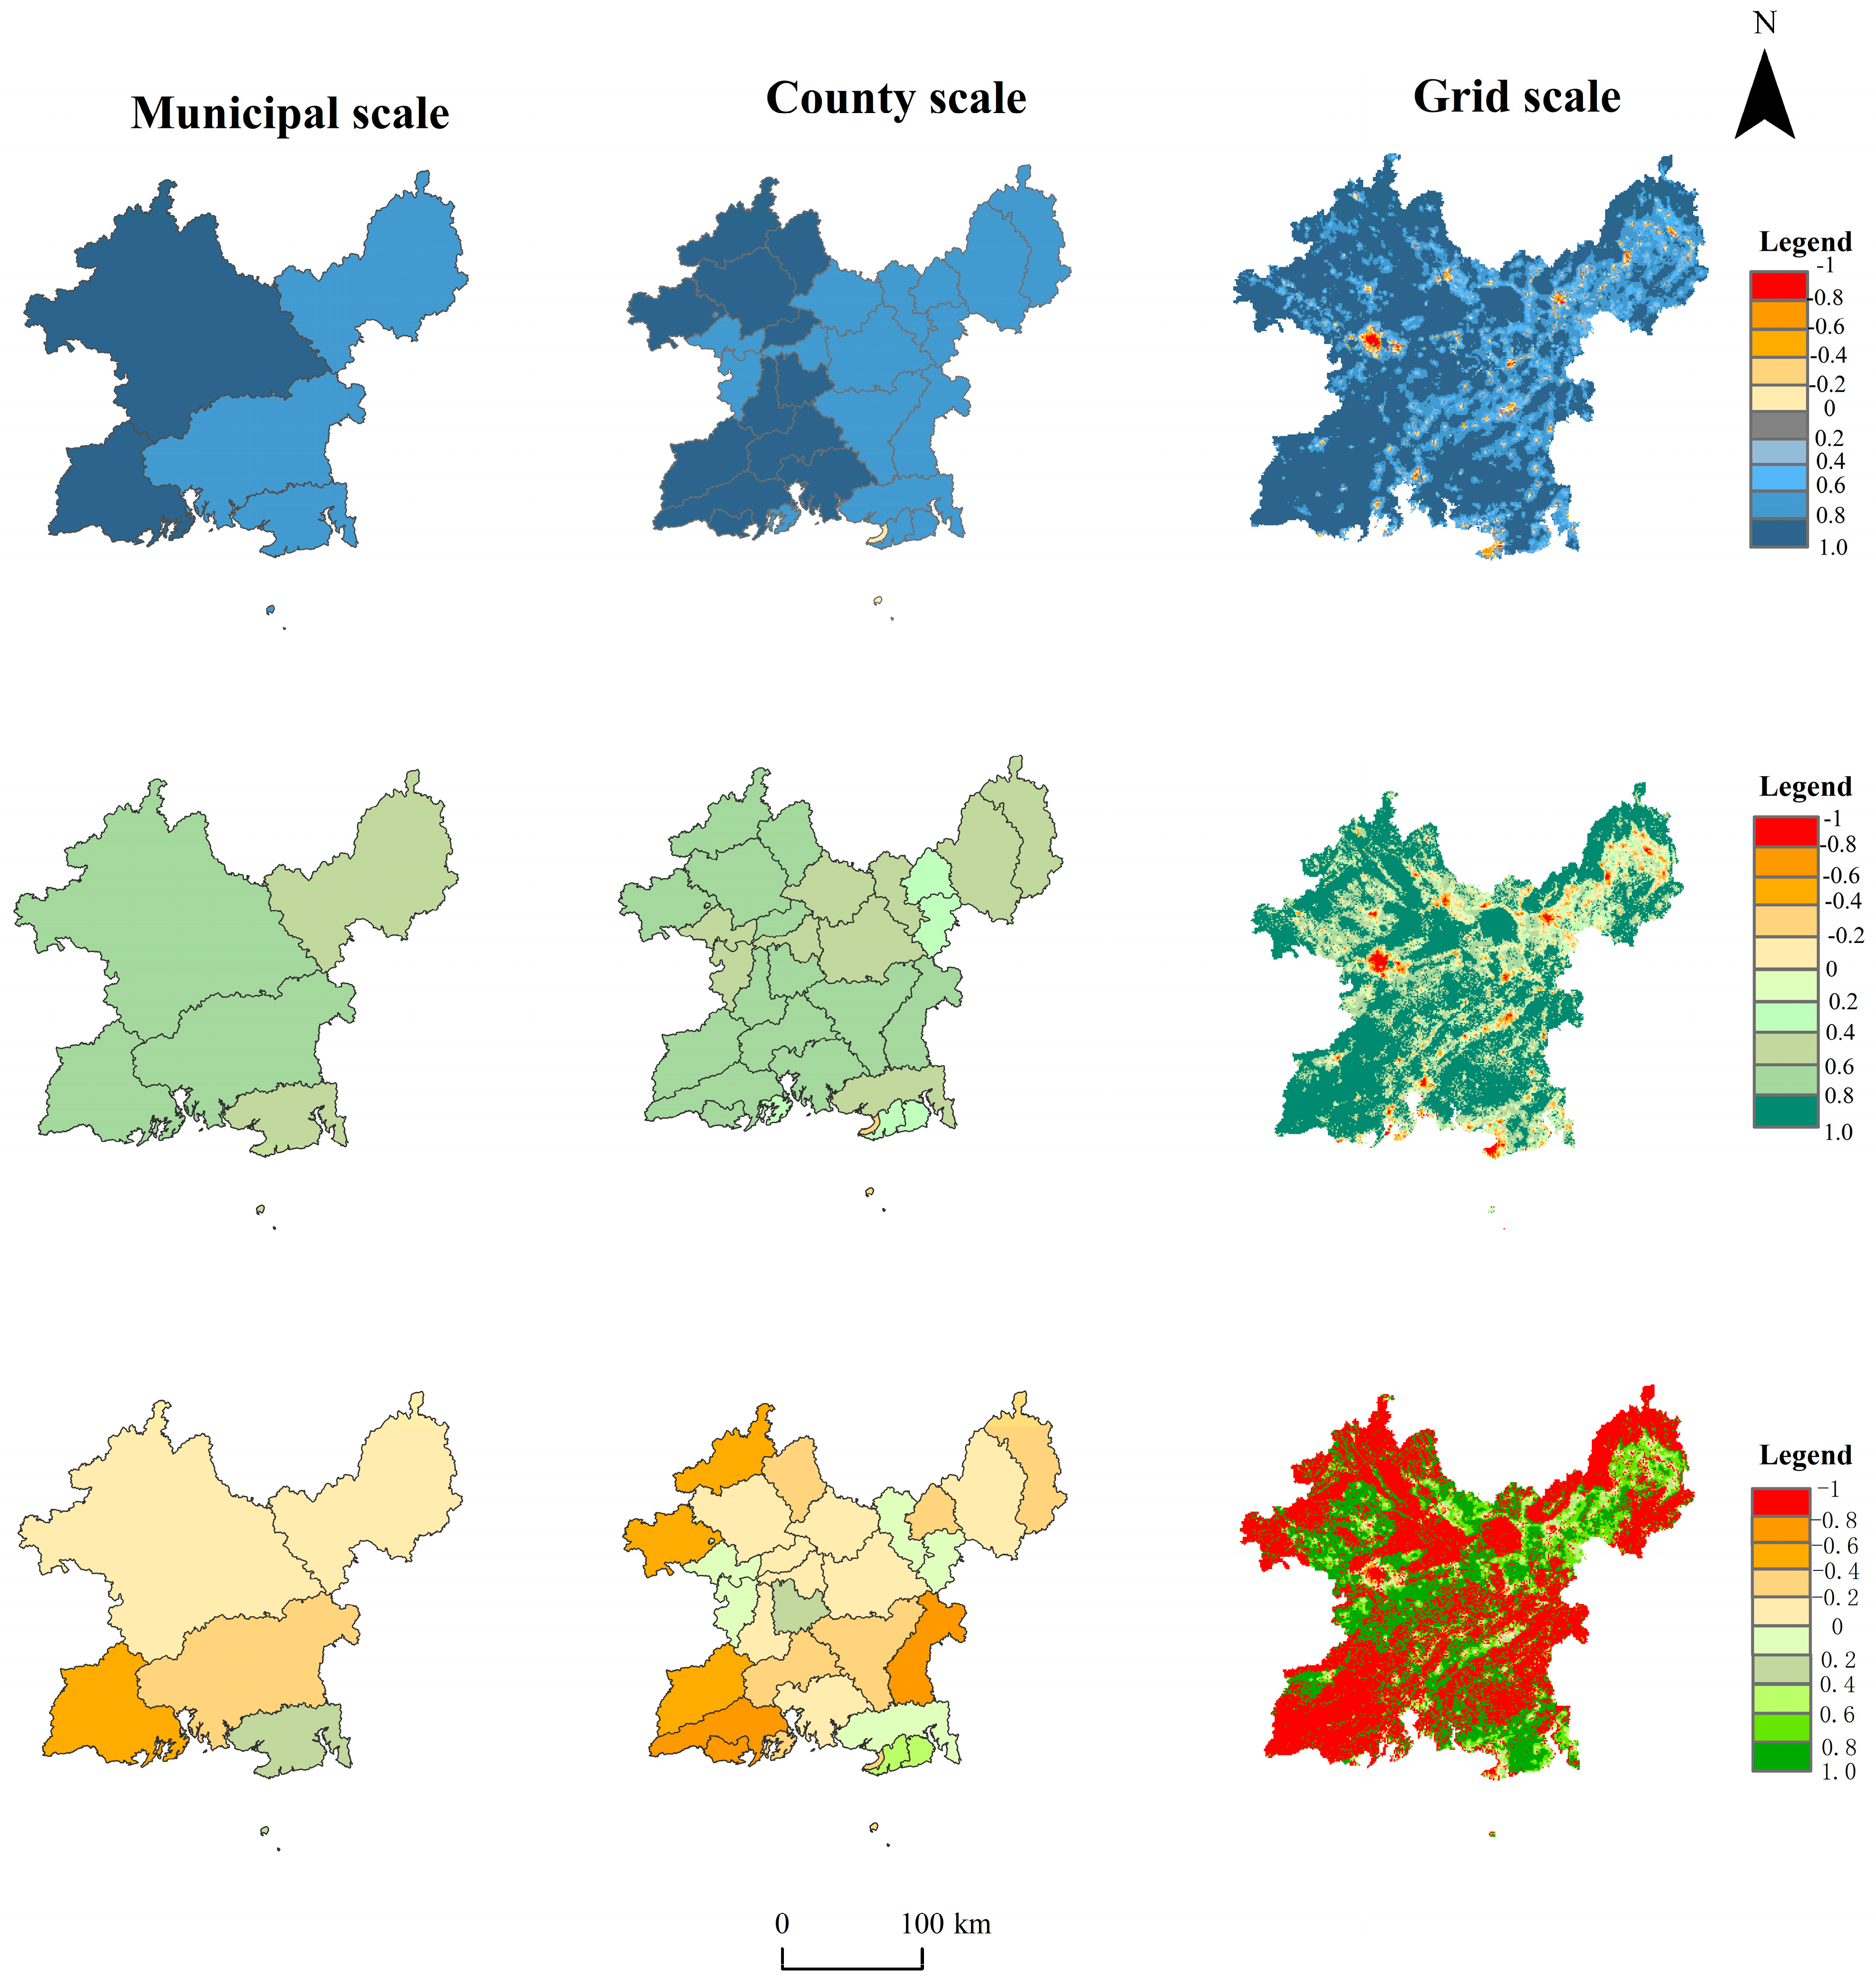
Multi-scale analysis showed that the supply, demand, and supply–demand ratio of ESs all exhibited significant scale-dependent characteristics (Figure 6). At the municipal scale, the supply pattern showed an overall “high in the south, low in the north” outline, while demand showed an agglomeration pattern with a “single core in the central area”. At the county scale, local details of supply began to appear, such as internal differences in major food-producing areas; the demand pattern was further refined, showing the agglomeration of multiple county centers. At the grid scale, the spatial heterogeneity of supply and demand reached its highest level, clearly identifying fine differences within cities, cropland patches, and ecological patches.
The spatial heterogeneity of the SDI significantly increased with scale refinement. The municipal scale reflected the overall surplus or deficit status of the region, while the county scale could more accurately reveal local supply–demand contradictions, such as which specific counties had more urgent water or carbon balance problems. The grid scale further exposed extreme conflicts at the micro-unit level. Overall, the county scale achieved the best balance between overall understanding and local identification, making it the most suitable administrative unit for implementing differentiated ecological control.

3.4. Correlation Analysis of ES Supply and Demand

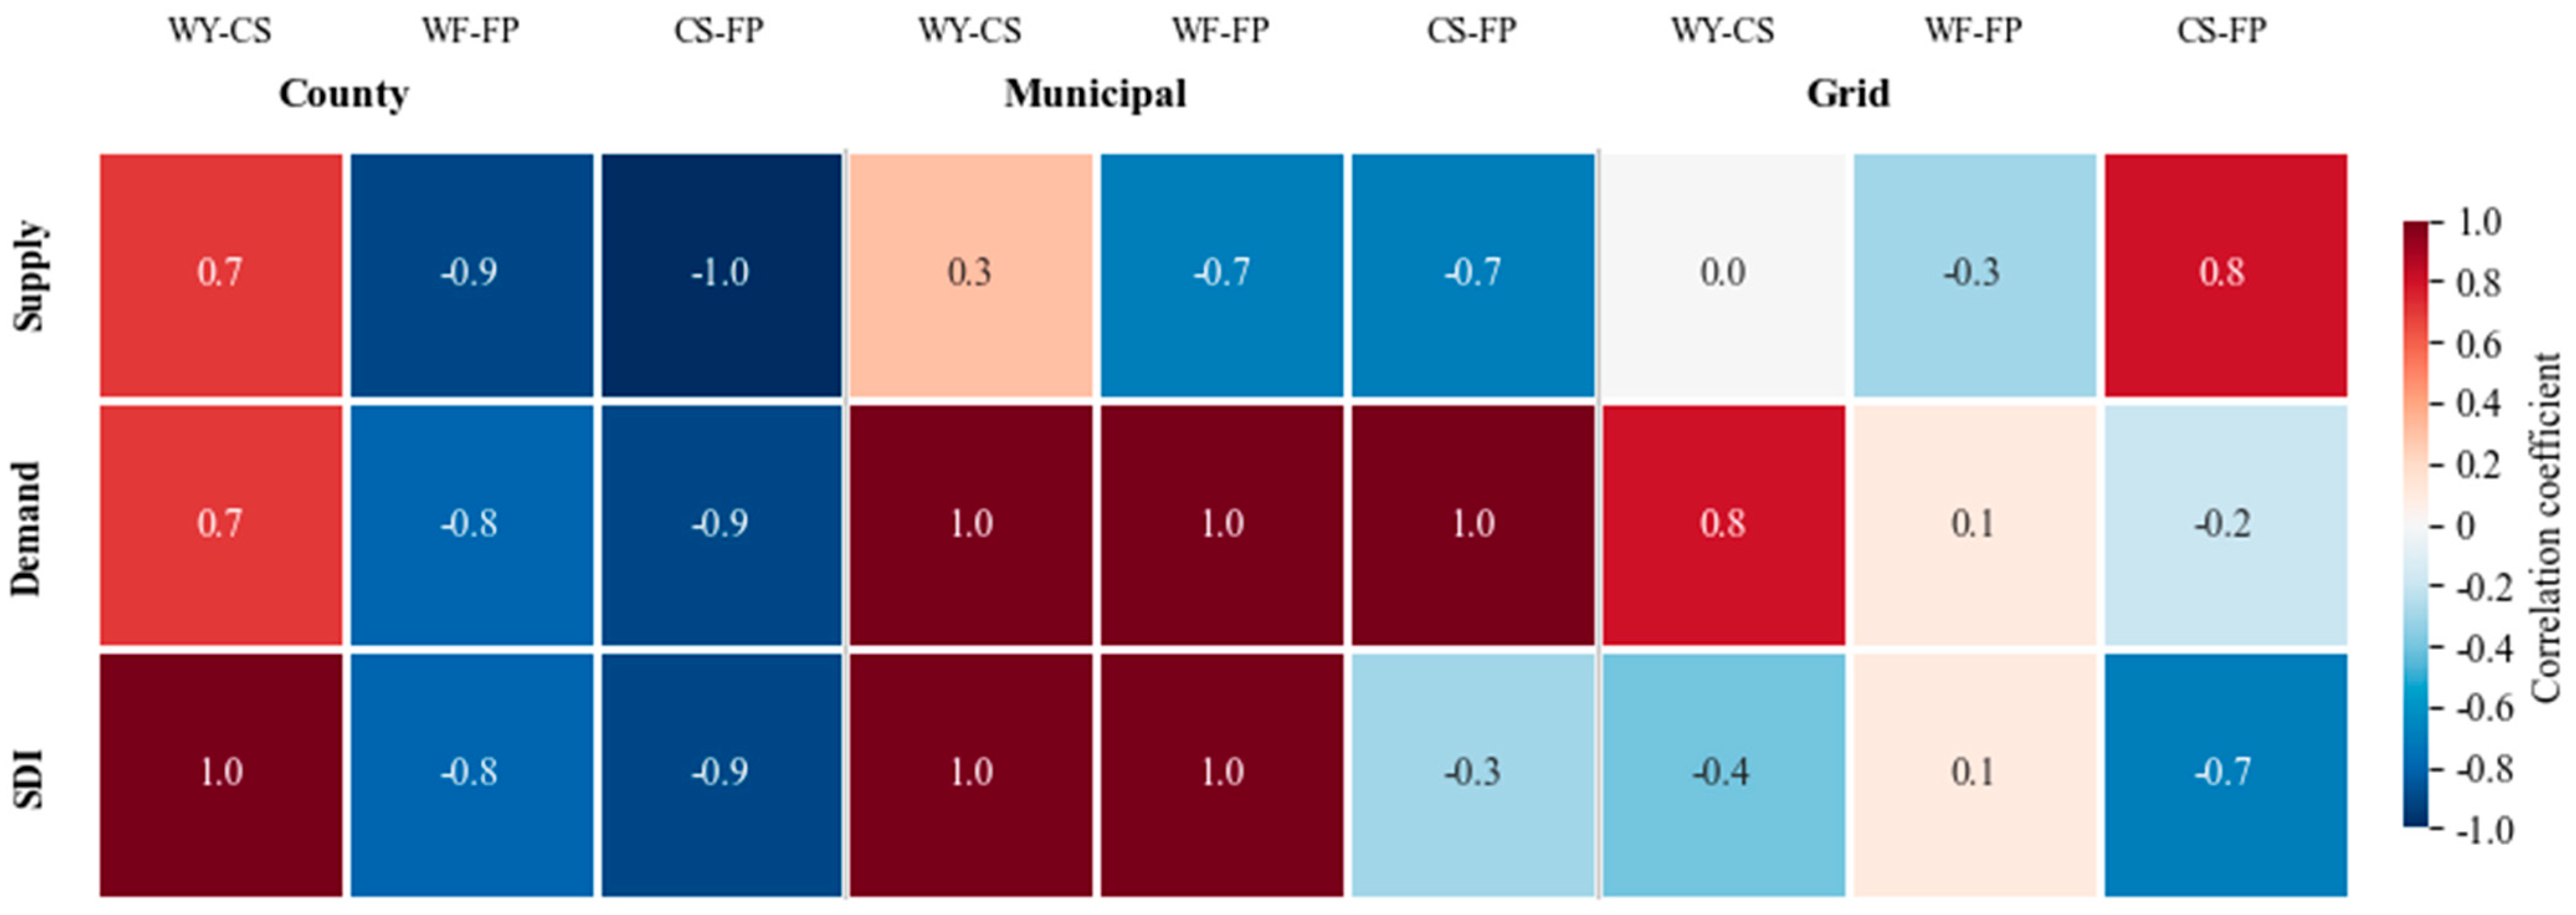
Pearson correlation analysis revealed the interactions among the three services at different scales (Figure 7; Table 4). The results showed that the correlations among ES supplies had significant scale dependence, with trade-offs or synergies changing with spatial scale.
Supply side: At the municipal scale, water yield (WY) and carbon sequestration (CS), as well as CS and food supply (FP), showed strong negative correlations (r = −0.86, −0.96), reflecting significant functional competition and trade-offs among these services at the macro level. At the county scale, the negative correlations weakened but remained present (r = −0.68 to −0.69). Notably, at the grid scale, CS and FP turned into a significant positive correlation (r = 0.85), indicating that at the micro land use unit level, higher vegetation cover (beneficial for carbon sequestration) might have a synergistic basis with improved agricultural production efficiency (food supply) (Figure 7).
Demand side: The demands for the three ESs showed stable positive correlations at all scales, with the strongest correlation at the county scale (r > 0.95). This indicates that human demand for water, energy, and food significantly overlaps spatially, jointly driven by population agglomeration and economic activities. The differences in the strength of demand correlations across scales suggest that ES demand more often presents a regional overall pattern rather than a local isolated phenomenon (Figure 7).
Supply–demand index (SDI): The correlations of the supply–demand matching status also showed clear scale differentiation. At the municipal and county scales, the SDI of WY was significantly positively correlated with the SDI of CS (r = 0.95), indicating that the coordination status of various service supply–demand balances was relatively synchronized at these scales. However, at the grid scale, the SDI of CS and FP showed a significant negative correlation (r = −0.70), revealing a possible direct resource competition or land use conflict between maintaining carbon balance and ensuring food security at the micro-spatial unit level (Figure 7).
Overall, the correlations among ESs in the Pinglu Canal Economic Zone have obvious scale effects, with trade-offs dominating at the macro level and a mix of local synergies and conflicts appearing at the micro level. This result further confirms the spatial interdependence and dynamic coupling of the WEF nexus system, also providing a scientific basis for multi-scale collaborative governance and differentiated control.

3.5. Spatial Matching Patterns of ES Supply and Demand

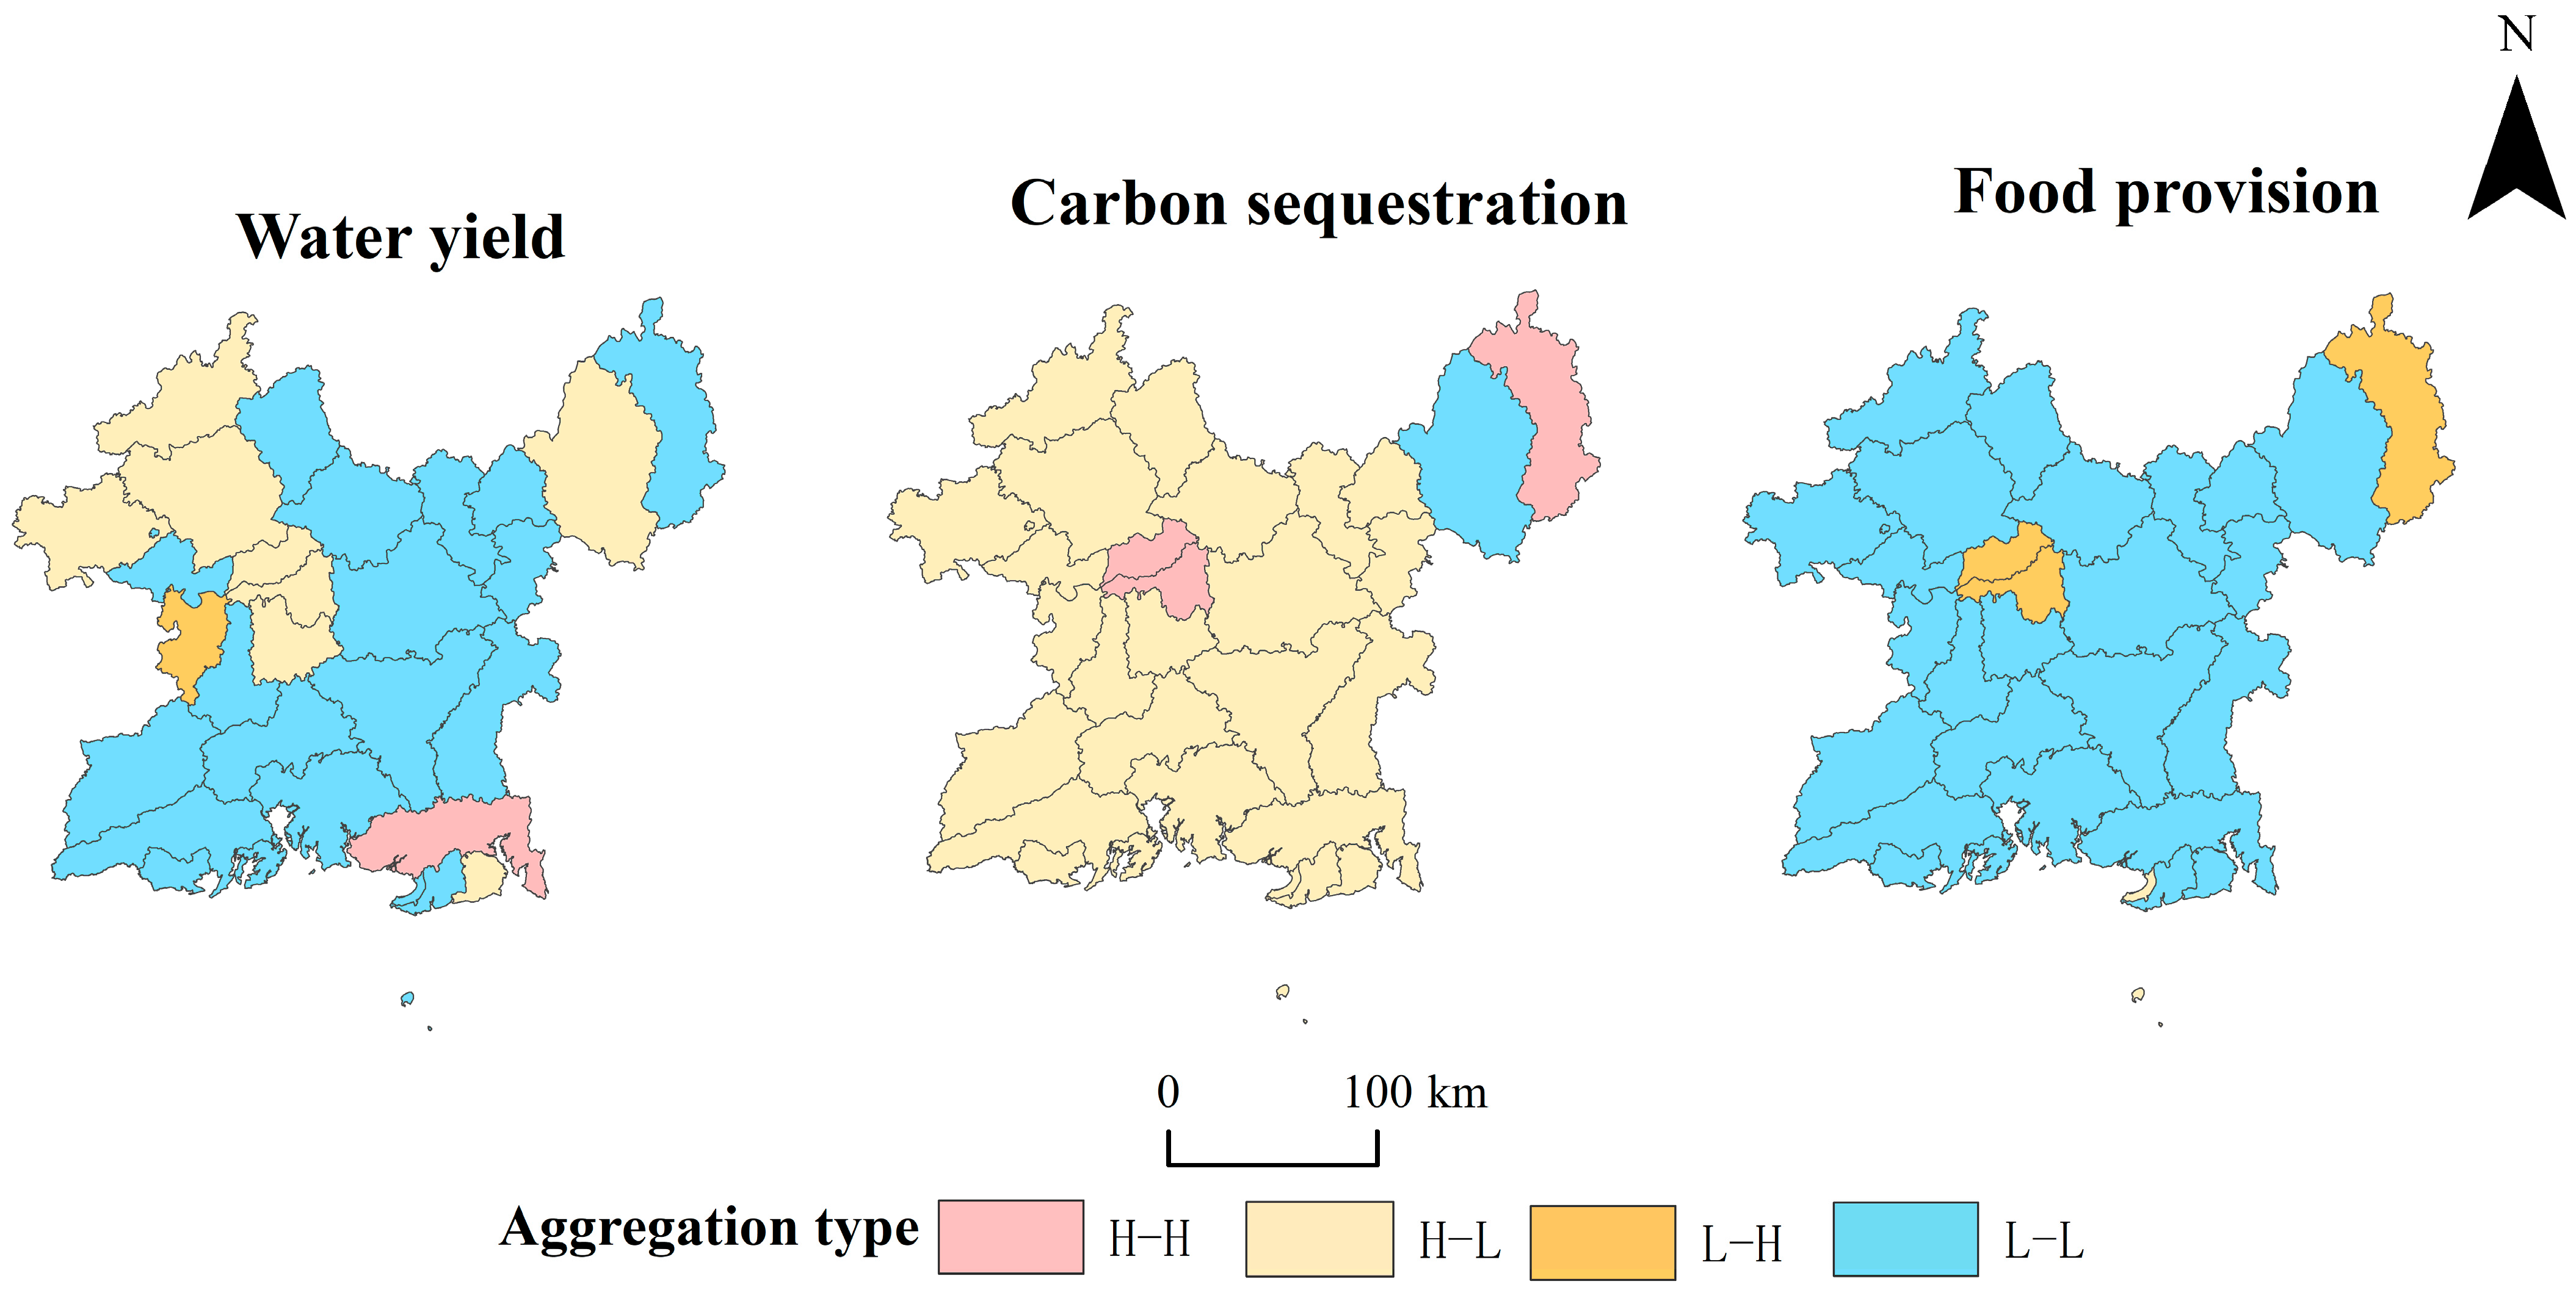
The four-quadrant analysis divided the study area into four supply–demand matching types (Figure 8): high supply–high demand (H-H), high supply–low demand (H-L), low supply–high demand (L-H), and low supply–low demand (L-L). For water yield services, the H-H type was distributed in a “point-like” manner in central cities such as Nanning and Qinzhou, while the L-H type was concentrated in the central urban agglomerations, exposing urban water pressure. The H-L type was located in the southern water source areas, which are important water protection areas. For carbon sequestration services, the H-L type was dominant, widely distributed in the southern and western ecological areas. The H-H and L-H types were concentrated in the urban belt, reflecting the complex relationship between carbon emissions and carbon sequestration capacity in urban areas. For food services, the H-H type was contiguously distributed in the northern food base, while the H-L type was located in areas with concentrated cropland but sparse population. The L-H type was scattered around the urban periphery, revealing the impact of urbanization on local food self-sufficiency.

3.6. Comprehensive Zoning Management of ES Supply and Demand

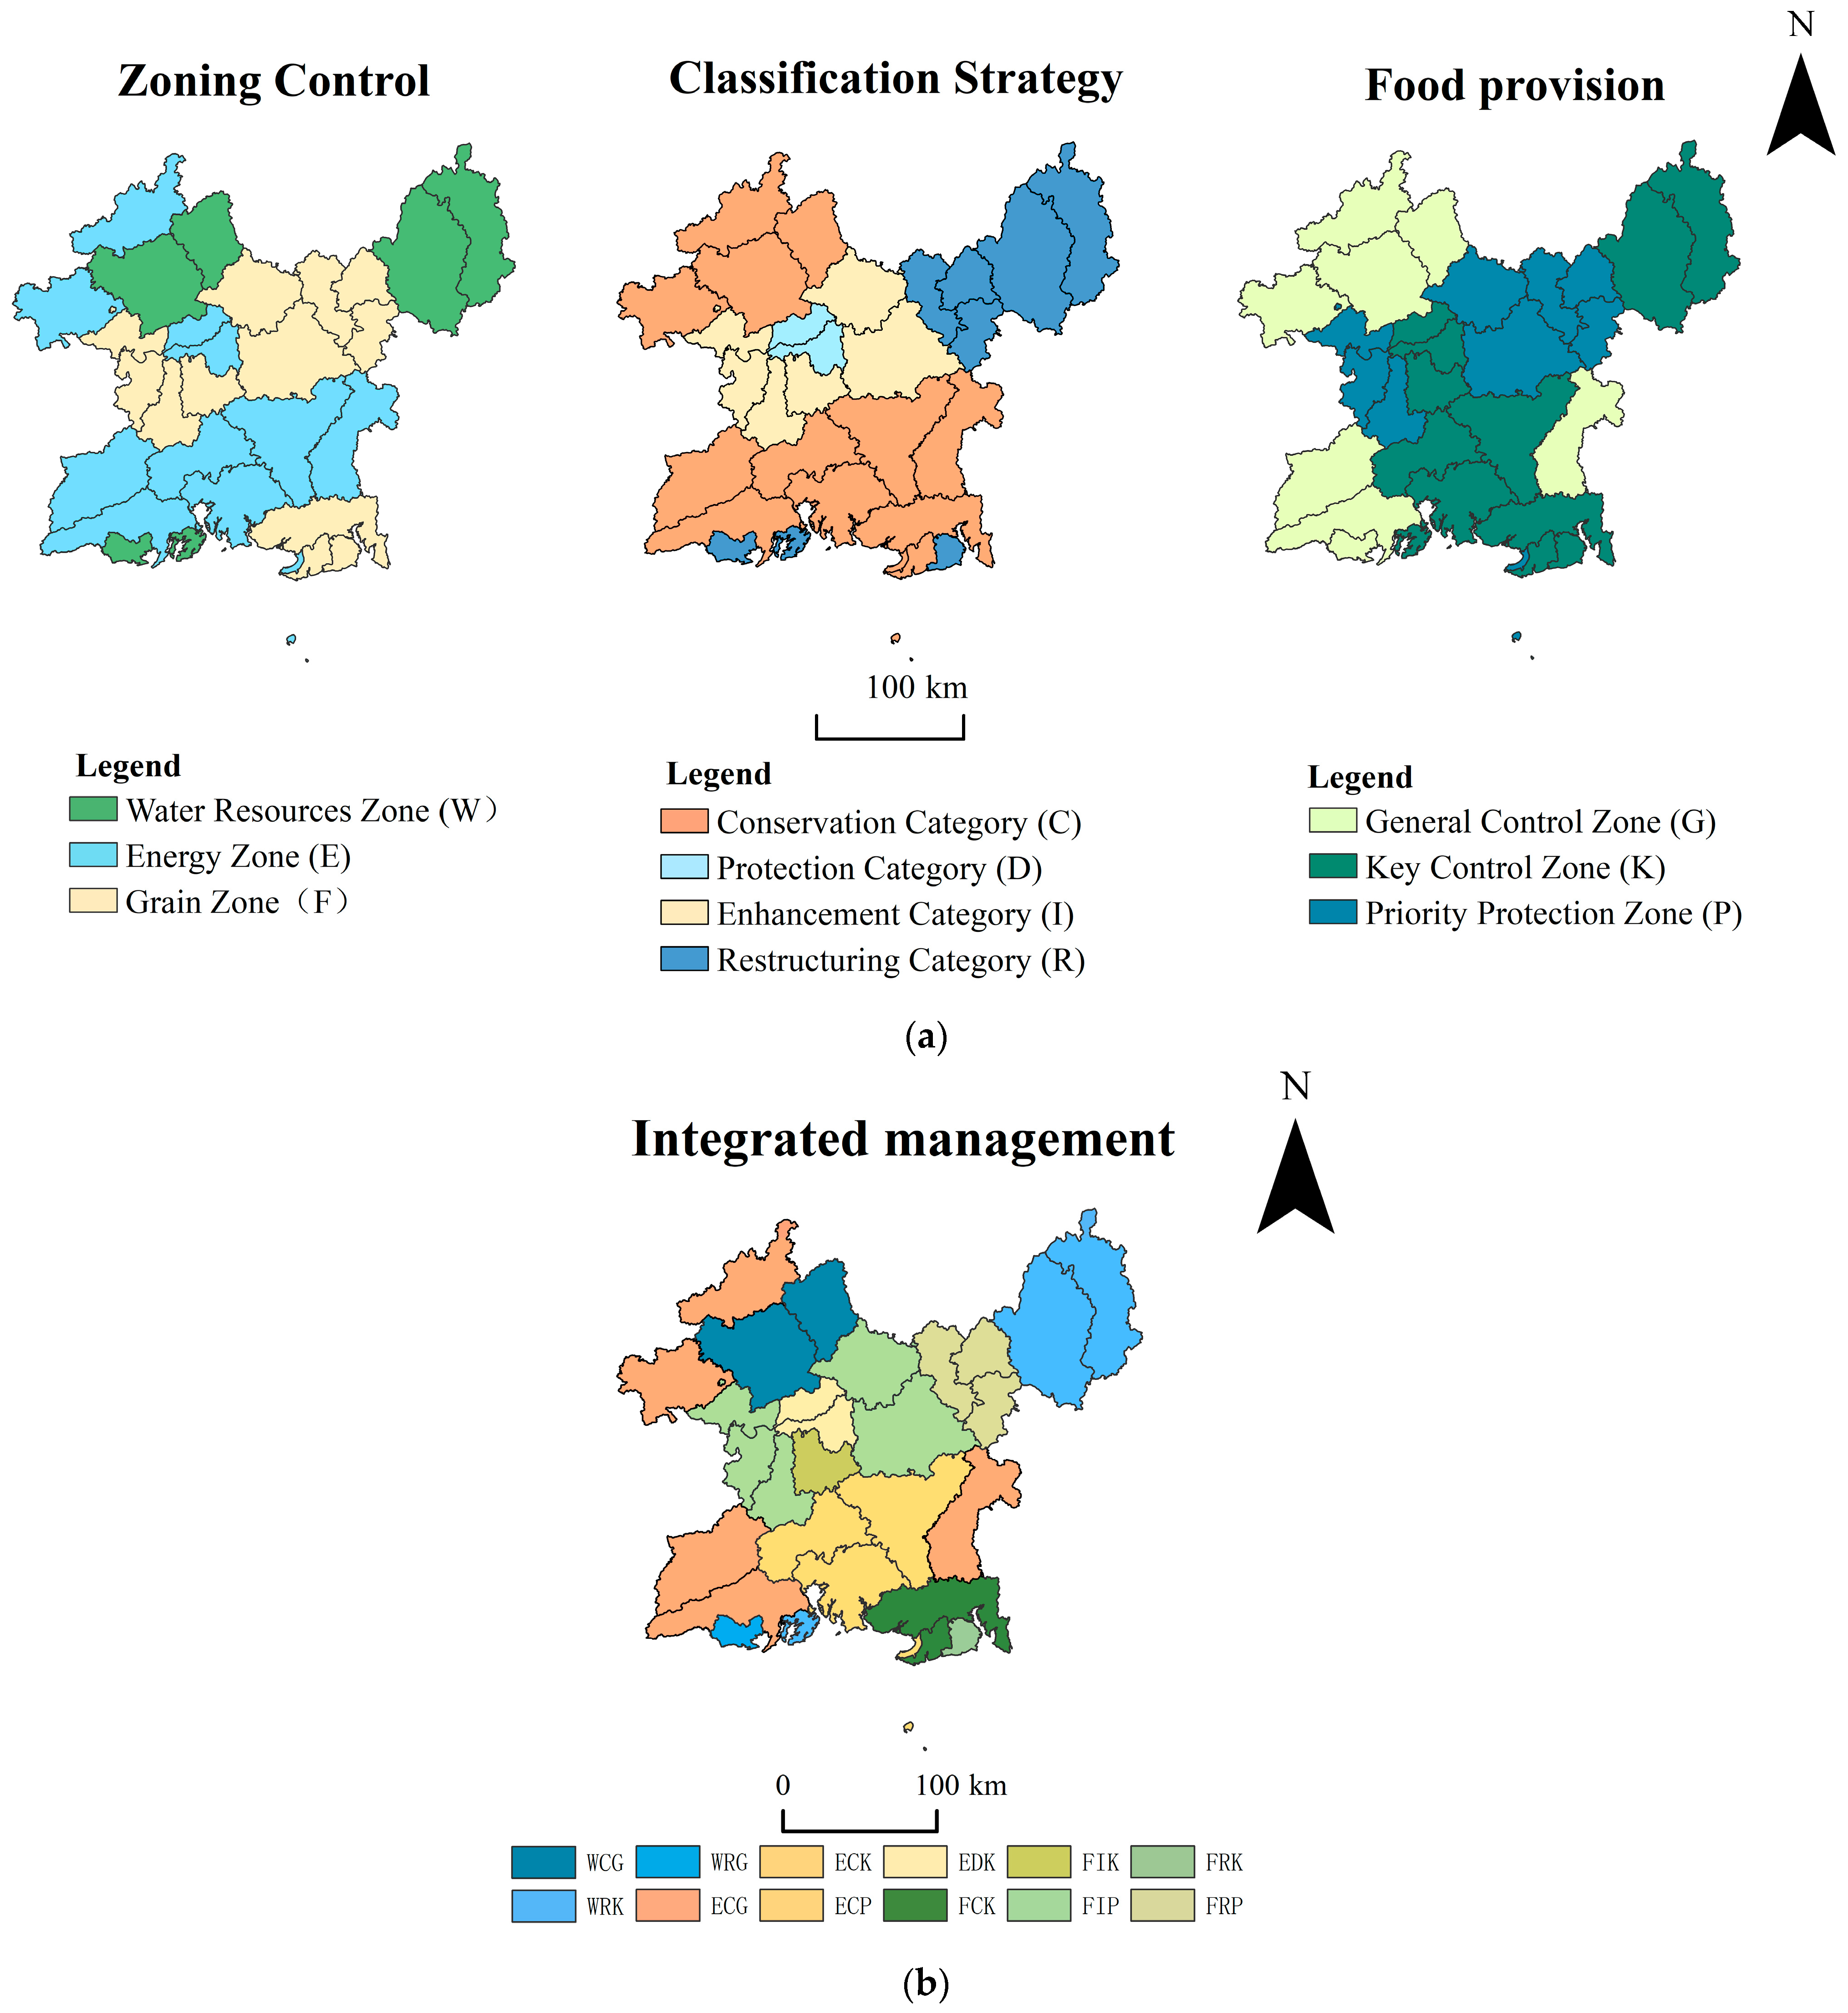
The comprehensive management zoning results are shown in Figure 9. Figure 9a presents the spatial distribution of county-scale integrated management zoning based on the “zoning–classification–grading” framework, while Figure 9b provides the corresponding legend of zoning types. The zoning control results show that the energy zone accounted for the highest proportion of the area (42.10%), mainly distributed in the forest areas and wetlands in the southern part of the study area, as well as the central ecological function maintenance zone; the food production zone accounted for 33.04%, concentrated and contiguously distributed in the northern and central-western cropland concentration areas; and the water yield zone accounted for 24.87%, mainly located in the southern water conservation areas and the dense river network in the west (Figure 9a). The classification strategy results show that the protection category accounted for the largest proportion (54.50%), widely distributed in the southern high-supply–low-demand areas; the improvement category (22.40%) and the restructuring category (20.10%) were concentrated in the central urban agglomerations and industrial concentration areas, reflecting the pressure for structural optimization; and the amelioration category accounted for a relatively low proportion (3.01%) and was sporadically distributed (Figure 9b). The grading governance structure was dominated by key control areas (40.96%), covering the Nanning–Guigang–Qinzhou urban belt; general control areas (34.32%) were distributed in cropland concentration areas; and priority protection areas (24.72%) were distributed in key ecological function areas (Figure 9b). In the integrated management zoning, the area proportions of the dominant types were as follows: ECG (23.41%) > FIP (17.77%) > ECK (15.45%) > WRK (13.96%) > WCG (9.96%), with the remaining types accounting for smaller proportions. The results indicate that energy and food production have prominent functions in regional integrated management, while water resource management also plays an important regulatory role in key areas.
Based on the integration results, the following differentiated control recommendations are proposed. For energy zones, the focus should be on improvement and protection categories, optimizing the industrial structure, and enhancing the carbon sequestration capacity of ecosystems. For food production zones, protection and key control should be strengthened to stabilize the cropland supply function and prevent encroachment by urban expansion. For water yield zones, a strategy that balances protection and improvement should be implemented to enhance water conservation and allocation efficiency, alleviating the water supply–demand contradiction in the central urban agglomerations. Through the coordinated “zoning–classification–grading” control, the coordinated development of the water–energy–food system in the Pinglu Canal Economic Zone can be promoted, supporting regional sustainable management and spatial optimization decisions.

4. Discussion

4.1. Rationality and Limitations of ES Supply–Demand Assessment

The scientific assessment of ES supply–demand relationships is the foundation of regional ecological management and spatial optimization. In the current context of global climate change and rapid urbanization, large-scale, multi-factor ES quantification research is increasingly valued. Compared with value assessment methods, the material quality assessment method is more intuitive and comparable in depicting the actual spatial patterns of ES supply and demand, especially suitable for the systematic analysis of basic resources such as water, energy, and food. This study quantitatively assessed the supply and demand of water yield, carbon sequestration, and food supply services in the Pinglu Canal Economic Zone from 2005 to 2020. The results showed that during the study period, water yield and food supply generally showed an increasing trend, while carbon sequestration supply remained stable and demand increased significantly, narrowing the supply–demand surplus. These changes are closely related to regional precipitation fluctuations, improved cropland use efficiency, and the implementation of forest and wetland protection policies. The growth rate of carbon sequestration supply lagged behind the increase in carbon emissions, reflecting the pressure of carbon emission reduction during regional development. On the demand side, this study used actual water consumption, carbon emissions, and food consumption as demand indicators, avoiding the spatial homogenization bias that might arise from using only population or GDP as proxy indicators. The results showed that the demand for all three services continued to grow, with high-value areas concentrated in economically active areas such as Nanning, Guigang, and Qinzhou, highly synchronized with the regional urbanization and industrialization processes, verifying the spatial rationality of the demand assessment. However, this study still has some limitations. On the one hand, the temporal resolution is low, making it difficult to capture supply–demand dynamics within a year or over shorter periods. On the other hand, carbon sequestration demand was represented only by energy-related carbon emissions, excluding other sources such as industrial processes and agricultural activities, which may underestimate the overall carbon pressure. Furthermore, the key assumptions of the demand and food supply models warrant critical discussion. First, regarding water demand, the use of population as the sole disaggregation factor ignores spatial variations in industrial water intensity. For example, the Qinzhou port industrial zone, despite moderate population density, consumes disproportionately large amounts of water for petrochemical and metallurgical processes. This leads to a potential underestimation of local water demand pressure. Second, the food demand model assumes uniform per capita consumption, which does not account for urban–rural differences in dietary structure. Urban residents typically consume more animal products, which have higher embedded food requirements than direct food consumption. Third, the NDVI-based downscaling method for food supply (Equation (3)) assumes a stable linear relationship between NDVI and food yield over time and space. While this assumption is widely used, it may not fully capture interannual variations in agricultural management practices, such as fertilizer application or irrigation. Future research could integrate higher spatiotemporal resolution data and multi-source carbon emission inventories to improve the comprehensiveness and accuracy of the assessment.

4.2. Scale Effects of ES Supply–Demand Matching

ES supply and demand often exhibit spatial mismatches, which are influenced not only by natural endowment patterns but also by the spatial scale of the assessment unit. Through multi-scale analysis, this study found that the supply–demand relationship of ESs in the Pinglu Canal Economic Zone showed obvious scale dependence. At the municipal scale, there was a strong trade-off between water yield and carbon sequestration, as well as between carbon sequestration and food supply. At the county and grid scales, local synergies and conflicts coexisted. In particular, at the grid scale, the supply–demand balance of carbon and food showed a significant negative correlation. This indicates that resource competition and functional conflicts are more prominent at the micro-unit level, while the macro scale is more likely to reflect overall coordination. Further analysis of the supply–demand ratio revealed that the contradiction between water supply and demand is most prominent in urban agglomerations such as Nanning and Qinzhou, forming a clear spatial differentiation from the southern water conservation areas. The study also shows that the county scale achieves a good balance in revealing local supply–demand characteristics and identifying management priorities, making it a suitable scale for implementing differentiated ecological control in the Pinglu Canal Economic Zone. This provides a scale basis for cross-administrative collaborative ecosystem governance and aligns with the current territorial spatial planning orientation of “city–county linkage and refined management”. The scale effect fundamentally arises from the different spatial autocorrelation characteristics of ES supply and demand. The supply side, controlled by natural geographical processes, tends to exhibit spatial continuity at coarser scales. The demand side, driven by socio-economic activities, exhibits stronger spatial heterogeneity at finer scales. Therefore, as the analysis unit is refined from municipal to county to grid, the coefficient of variation for demand increases faster than that for supply, leading to significant changes in the spatial pattern of supply–demand matching. This finding has important implications for management: the municipal scale is suitable for macro-strategic planning, the county scale for differentiated control implementation, and the grid scale for precise identification of ecological risk hotspots.

4.3. Synergistic ES Management Strategies

The comprehensive zoning results based on the “zoning–classification–grading” framework show that ES management in the Pinglu Canal Economic Zone should follow the logic of combining “dominant function–supply–demand status–control priority” to implement differentiated and systematic spatial governance. For water yield services, protection of the southern water conservation areas should be strengthened, and water resource allocation and water-saving utilization in the central urban agglomerations should be optimized to alleviate the pressure of the “north supply–south demand” mismatch. For carbon sequestration services, ecological protection and restoration should be implemented in the southern forests and wetlands, while low-carbon industrial transformation and energy structure optimization should be promoted in the central urban agglomerations. For food supply, the production capacity of the northern concentrated cropland areas should be consolidated, cropland protection and quality improvement should be implemented, and the encroachment of urban expansion on cropland should be prevented. In terms of management measures, protective control can be implemented in high-supply–low-demand areas based on the four-quadrant matching types, structural reconstruction and efficiency improvement can be promoted in low-supply–high-demand areas, and the ecological background of low-supply–low-demand areas can be gradually improved. Furthermore, a cross-regional ecological compensation mechanism based on ecosystem service flows should be explored. Through fiscal transfers and policy coordination, important ecological function areas can be incentivized to continuously provide ESs, promoting coordinated development across the entire basin. Future research could further integrate dynamic simulation and multi-scenario analysis to provide decision support for territorial spatial optimization and WEF system synergy in the Pinglu Canal Economic Zone.
Taking Qinnan District (located in the WRK/ECK overlapping zone) as an example, this area faces both water supply–demand contradiction and carbon deficit. Based on the “zoning–classification–grading” scheme, the following specific measures are recommended: (1) For water resources, increase the industrial cooling water recycling rate, and prioritize the use of reclaimed water from the Qinzhou Port wastewater treatment plant for landscaping; (2) For carbon reduction, promote waste heat recovery and utilization projects in the Qinzhou Port petrochemical industrial park. (3) Establish a cross-regional ecological compensation mechanism, with Qinnan District paying ecological service compensation to the Shiwandashan Reserve to incentivize upstream areas to maintain forest carbon sink functions. Taking Hengzhou City (located in the FCK/FIP zone) as another example, this area is a typical major food-producing county with a food supply SDI of 0.62 but faces the risk of cropland encroachment by urban expansion. The following measures are recommended: (1) Delineate permanent basic cropland red lines to ensure that the food planting area remains stable. (2) Promote rice–green manure rotation to reduce fertilizer application by 20%; (3) Establish a dual “food–ecology” assessment mechanism that incorporates cropland ecological protection into the performance evaluation system of local governments. These measures have been piloted in other counties and cities in Guangxi and have good operability and promotional value.

4.4. Driving Mechanisms Behind Spatial Patterns of ES Supply–Demand

The spatial patterns described in Section 3.2 are not random but are systematically shaped by three interacting drivers: natural endowment, policy interventions, and market forces. For water yield services, the persistent “high in the south, low in the north” supply pattern is primarily controlled by precipitation gradients, with mean annual rainfall in the southern coastal areas (∼2200 mm) being nearly double that of the northern hinterland (∼1200 mm). However, the emergence of supply–demand deficits in the Nanning–Qinzhou urban agglomeration is driven by anthropogenic factors: industrial water withdrawal increased by 156% between 2005 and 2020, while domestic water demand grew by 89%, outpacing the natural replenishment rate. For carbon sequestration, the spatial mismatch between high-supply areas (southern forests/wetlands) and high-demand areas (central urban belt) reflects a classic “ecosystem service flow” problem. The Shiwandashan forest area, despite accounting for only 12% of the region’s land area, contributes approximately 34% of the total carbon sequestration supply yet receives no direct benefit from the carbon sink services it provides to downstream urban areas. This spatial decoupling is exacerbated by the lack of cross-jurisdictional payment mechanisms. For food supply, the consolidation of the “north-to-south” supply pattern is driven by two opposing forces: on the supply side, agricultural modernization and land consolidation have increased yields in traditional food-producing counties (Guigang, Hengzhou) by 37% since 2005; on the demand side, rapid population growth in coastal cities (Qinzhou, Beihai, Fangchenggang) has expanded the market for food products. The persistence of this pattern is facilitated by transportation infrastructure, particularly the Nanning–Beihai Expressway and the planned Pinglu Canal itself, which reduce transaction costs for north–south food flows.

4.5. Transferability of the Framework to Other Regions and Canal Corridors

The ES-WEF nexus framework developed in this studymay be applicable to other regions, particularly linear economic zones and canal corridors that experience similar tensions between infrastructure development, resource security, and ecological protection. Three components of the framework are transferable. First, the “zoning–classification–grading” governance scheme can be adapted to other regions by adjusting the threshold values for SDI classification based on local ecological and socio-economic conditions. Second, the integration of the three focal ESs (water yield, carbon sequestration, food supply) is applicable to any region where water, energy, and food security are co-dependent, although the specific choice of ESs may need to be tailored to local resource endowments (e.g., replacing food supply with livestock provisioning in pastoral regions). Third, the multi-scale analysis approach (municipal–county–grid) can be replicated to identify the most appropriate management scale in other administrative contexts. For other planned or existing canal corridors, such as the Grand Canal in China, the following adaptations are recommended. (1) emphasize water yield and water quality services more heavily, as canal construction directly alters hydrological regimes; (2) incorporate sediment regulation services if the canal traverses erosion-prone areas; (3) adjust the food supply module to account for changes in agricultural land use driven by canal-induced land conversion..

4.6. Future Research Directions

Based on the limitations and findings of this study, future research can be advanced in the following directions:
(1) Dynamic simulation and scenario prediction. This study analyzes only four time nodes (2005, 2010, 2015, 2020). Future research could integrate longer time-series remote sensing data and use land use change models (e.g., CA-Markov, PLUS) to simulate ES supply–demand patterns under different scenarios (e.g., natural development, ecological protection, economic development) at key target years such as 2030 and 2035.
(2) Ecosystem service flow and beneficiary area identification. Our study found that carbon sequestration services from the Shiwandashan forest area do not directly benefit downstream urban areas, but the service flow pathways and beneficiary ranges have not been quantified. Future research could use atmospheric transport models (e.g., HYSPLIT) to track the spatial flow of carbon sequestration services or use water allocation models to quantify the flow of water supply services, providing a scientific basis for establishing cross-regional ecological compensation mechanisms.
(3) Dynamic feedback mechanisms of WEF coupling. While this study established a coupled analysis framework for water–energy–food, it did not simulate the dynamic feedback relationships among them. Future research could construct a system dynamics model to simulate cascading effects such as “water scarcity → constrained energy production → insufficient irrigation for food” and identify critical vulnerable nodes in the WEF system.
(4) Multi-source data fusion and artificial intelligence methods. To address the limitations of carbon demand estimation, future research could integrate satellite-based atmospheric CO2 concentration data (e.g., OCO-2, GOSAT), nighttime light data, and POI data, using machine learning methodsto achieve higher-precision spatialization of carbon emissions.
(5) Quantitative research on ecological compensation standards. The comprehensive zoning in this study provides a spatial framework for ecological compensation but does not provide specific compensation standards. Future research could combine ecosystem service valuation and willingness-to-pay surveys to explore joint compensation pricing mechanisms for multiple services (water–carbon–food).

5. Conclusions

Based on the WEF nexus perspective, this study quantified the supply–demand relationships of water yield, carbon sequestration, and food supply services in the Pinglu Canal Economic Zone from 2005 to 2020. It revealed the spatiotemporal heterogeneity of each service at different scales and conducted comprehensive ES zoning based on a “zoning–classification–grading” framework, proposing policy recommendations for integrated ecosystem management. The main conclusions are as follows:
(1) From a temporal perspective, the supply and supply–demand ratio of water yield and food supply services showed an overall increasing trend, while demand continued to grow. Carbon sequestration supply remained stable, but demand increased significantly, and the supply–demand surplus gradually narrowed, indicating increasing pressure for carbon emission reduction over time.
(2) Regarding spatial distribution patterns, water yield supply exhibited a pattern of “high in the south and low in the north”, while demand showed a pattern of “high in the central area and low in the surrounding areas”, consistent with the distribution of population and economic activities. High-value areas of carbon sequestration supply were concentrated in forests and wetlands, while high-value demand areas expanded from point-like to patchy distributions along the urban belt. Food supply was highly consistent with cropland distribution, showing an evolutionary trend towards “high-level agglomeration”, and its demand distribution overlapped with populated areas.
(3) The supply–demand relationships of ESs showed significant spatial heterogeneity across different scales, with the county scale best reflecting local supply–demand characteristics. The spatial matching patterns of water yield, carbon sequestration, and food services were dominated by H-L (high supply–low demand) and L-L (low supply–low demand) types, while H-H (high supply–high demand) agglomeration areas significantly overlapped with urban agglomerations.
(4) Comprehensive zoning based on “zoning–classification–grading” indicated that energy zones and food production zones dominate regional integrated management, with key control areas covering a wide range. Differentiated control strategies should be implemented: water yield zones should strengthen water conservation and allocation; carbon sequestration zones should promote structural optimization and efficiency improvement; and food production zones should consolidate the advantages of major producing areas and prevent encroachment. These measures can promote the coordinated and sustainable development of the WEF system in the Pinglu Canal Economic Zone.

Author Contributions

Conceptualization, Y.L. (Yurou Liang) and B.H.; Methodology, Y.L. (Yurou Liang); Software, Y.L. (Yurou Liang); Validation, Y.L. (Yurou Liang), X.K. and Y.L. (Yinyin Lao); Formal analysis, Y.L. (Yurou Liang); Investigation, Y.L. (Yurou Liang); Resources, Y.L. (Yurou Liang); Data curation, Y.L. (Yurou Liang); Writing—original draft, Y.L. (Yurou Liang); Writing—review & editing, Y.L. (Yurou Liang); Visualization, Y.L. (Yurou Liang); Supervision, B.H.; Project administration, B.H.; Funding acquisition, B.H. All authors have read and agreed to the published version of the manuscript.

Funding

This research was funded by National Natural Science Foundation of China grant number 42571364; Guangxi Science and Technology Major Project grant number AA23062039-2 and Guangxi Science and Technology Major Project grant number AA24263011-3.

Data Availability Statement

The original contributions presented in this study are included in the article. Further inquiries can be directed to the corresponding author.

Conflicts of Interest

The authors declare no conflict of interest.

Abbreviations

The following abbreviations are used in this manuscript:
ESsEcosystem services
WEFWater–energy–food
SDISupply–demand index
WYWater yield
CSCarbon sequestration
FPFood supply
NDVINormalized difference vegetation index
GDPGross domestic product

References

  1. Luo, C.; Li, X. Assessment of Ecosystem Service Supply, Demand, and Balance of Urban Green Spaces in a Typical Mountainous City: A Case Study on Chongqing, China. Int. J. Environ. Res. Public Health 2021, 18, 11002. [Google Scholar] [CrossRef] [PubMed]
  2. Yan, X.; Liu, C.; Han, Z.; Li, X.; Zhong, J. Spatiotemporal assessment of ecosystem services supply–demand relationships to identify ecological management zoning in coastal city Dalian, China. Environ. Sci. Pollut. Res. 2023, 30, 63464–63478. [Google Scholar] [CrossRef] [PubMed]
  3. Zhang, X.; Li, X.; Wang, Z.; Liu, Y.; Yao, L. A study on matching supply and demand of ecosystem services in the Hexi region of China based on multi-source data. Sci. Rep. 2024, 14, 1. [Google Scholar] [CrossRef]
  4. Gong, D.; Huang, M.; Ge, Y.; Lin, H.; Zhang, L.; Altan, O. Operationalizing SDGs through the Water-Energy-Food Nexus: Multi-level assessment of ecosystem service supply-demand patterns in China. Ecol. Indic. 2025, 179, 114235. [Google Scholar] [CrossRef]
  5. Yin, D.; Yu, H.; Shi, Y.; Zhao, M.; Zhang, J.; Li, X. Matching supply and demand for ecosystem services in the Yellow River Basin, China: A perspective of the water-energy-food nexus. J. Clean. Prod. 2023, 384, 135469. [Google Scholar] [CrossRef]
  6. Ding, T.; Chen, J. Evaluating supply-demand matching of ecosystem services considering water-energy-food nexus and synergies/trade-offs in the Hangzhou of China. Environ. Sci. Pollut. Res. 2023, 30, 54568–54585. [Google Scholar] [CrossRef]
  7. Mondal, S.; Mishra, A.K.; Leung, R.; Cook, B. Global droughts connected by linkages between drought hubs. Nat. Commun. 2023, 14, 144. [Google Scholar] [CrossRef]
  8. Qin, J.X.; Duan, W.L.; Chen, Y.N.; Dukhovny, V.A.; Sorokin, D.; Li, Y.P.; Wang, X.X. Comprehensive evaluation and sustainable development of water-energy-food-ecology systems in Central Asia. Renew. Sustain. Energy Rev. 2022, 157, 112061. [Google Scholar] [CrossRef]
  9. Dang, G.; Hu, J.; Li, G. Identifying the coupling coordination relationship and driving forces between urbanization and the supply–demand of ecosystem service: A case study of the Gansu Province. Sci. Rep. 2026, 16, 12828. [Google Scholar] [CrossRef]
  10. Wei, X.; Abulizi, A.; Yuan, L.; Wang, J.; Bai, S.; Tang, S.; Yerkenhazi, A. A study on ecological risk identification based on ecosystem service supply and demand in Xinjiang. Sci. Rep. 2025, 15, 1. [Google Scholar] [CrossRef]
  11. Chen, W.; Chi, G. Spatial mismatch of ecosystem service demands and supplies in China, 2000–2020. Environ. Monit. Assess. 2022, 194, 4. [Google Scholar] [CrossRef]
  12. Li, F.; Xin, Q.; Fu, Z.; Sun, Y.; Xiong, Y.J. A Refined supply-demand framework to quantify variability in ecosystem services related to surface water in support of sustainable development goals. Earths Fut. 2024, 12, 114235. [Google Scholar] [CrossRef]
  13. Watson, S.C.L.; Somerfield, P.J.; Knights, A.M.; Edwards-Jones, A.; Nunes, J.; Pascoe, C.; Mcneill, C.L.; Schratzberger, M.; Thompson, M.S.A.; Couce, E.; et al. The global impact of offshore wind farms on ecosystem services. Ocean Coast. Manag. 2024, 249, 107023. [Google Scholar] [CrossRef]
  14. Xia, F.; Yang, Y.; Zhang, S.; Yang, Y.; Li, D.; Sun, W.; Xie, Y. Influencing factors of the supply-demand relationships of carbon sequestration and grain provision in China: Does land use matter the most? Sci. Total Environ. 2022, 832, 154979. [Google Scholar] [CrossRef]
  15. Yongxiu, S.; Shiliang, L.; Fangning, S.; Yi, A.; Mingqi, L.; Yixuan, L. Spatio-temporal variations and coupling of human activity intensity and ecosystem services based on the four-quadrant model on the Qinghai-Tibet Plateau. Sci. Total Environ. 2020, 743, 140721. [Google Scholar] [CrossRef]
  16. Wu, X.; Liu, S.; Zhao, S.; Hou, X.; Xu, J.; Dong, S.; Liu, G. Quantification and driving force analysis of ecosystem services supply, demand and balance in China. Sci. Total Environ. 2019, 652, 1375–1386. [Google Scholar] [CrossRef] [PubMed]
  17. Cui, X.; Zeng, J.; Wu, J.; Chen, W. The nexus between urbanization and ecosystem services balance in China: A coupling perspective. Environ. Monit. Assess. 2024, 196, 7. [Google Scholar] [CrossRef]
  18. Gai, Y.; Zhao, H.; Wang, F.Q. Analysis of supply-demand changes and driving factors of ecosystem services in the Yellow River Basin. Environ. Sci. 2025, 46, 3672–3680. [Google Scholar] [CrossRef]
  19. Zhang, C.; Yang, G.Q.; Chen, D.L.; Zhang, H. Spatiotemporal characteristics of coupling between ecosystem service supply-demand balance and resident well-being in the middle reaches of the Yangtze River. Trans. Chin. Soc. Agric. Eng. 2024, 40, 356–368. [Google Scholar]
  20. Zhang, C.; Sun, X.; Zhang, H.; Deng, C.; Zhao, K.; Jin, Y.; Chen, D. Supply-demand balance of ecosystem services in the middle reaches of the Yangtze River based on land use change. J. Soil Water Conserv. 2024, 38, 227–238. [Google Scholar] [CrossRef]
  21. Li, B.; Zhang, X.; Luo, Z.; Ma, J.; Yang, Y.; Chen, F. Matching supply and demand of ecosystem services based on water-energy-food nexus: A case study of the urban agglomeration on the northern slope of the Tianshan Mountains. Arid. Land Geogr. 2025, 48, 571–585. [Google Scholar]
  22. Ke, Q.; Zhou, Q.; Zhuang, B.Y.; Sun, C. Construction of ecological security pattern in the Guangdong-Hong Kong-Macao Greater Bay Area based on supply-demand balance of ecosystem services. Acta Ecol. Sin. 2024, 44, 1765–1779. [Google Scholar] [CrossRef]
  23. Deng, L.; Yang, J.; Yin, X.; Jia, K.; Sun, J.; Shu, S.; Huang, A. The relationship between ecosystem service supply and demand and its response to multi-scale urbanization in the Guangdong-Hong Kong-Macao Greater Bay Area. Acta Ecol. Sin. 2024, 44, 9094–9107. [Google Scholar] [CrossRef]
  24. Ye, F.; Fang, X.; Gong, B. Ecological security pattern in the Shaanxi-Gansu-Ningxia region from the perspective of ecosystem service supply-demand matching. Arid. Zone Res. 2026, 43, 188–199. [Google Scholar] [CrossRef]
  25. Zhang, Z.; Zhang, Y.; Hu, Y.; Gao, J. Spatiotemporal distribution of ecosystem service supply-demand relationship based on water-energy-food nexus: A case study of the Yangtze River Delta Ecological Green Integrated Development Demonstration Zone. Acta Ecol. Sin. 2023, 43, 9430–9445. [Google Scholar] [CrossRef]
  26. Ma, L.; Zhang, F.; Teng, L.; Li, Q. Spatiotemporal evolution and trade-offs/synergies of ecosystem service supply and demand in Bayingolin Mongol Autonomous Prefecture. J. Agric. Resour. Environ. 2025, 42, 543–552. [Google Scholar] [CrossRef]
  27. Fan, Y.; Dou, P.; Tian, Y.; He, L.; Lin, S. County-level ecological protection and restoration zoning in Fujian low mountain and hilly areas based on ecosystem service supply-demand relationship. Chin. J. Ecol. 2025, 40, 1–13. [Google Scholar]
  28. Nie, T.; Gong, Y.; Ding, Z.Y.; Hou, H. Supply-demand evaluation of urban ecosystem services at community scale: A case study of Jiading District, Shanghai. Chin. J. Ecol. 2025, 44, 3239–3250. [Google Scholar] [CrossRef]
  29. Ma, H.; Weiss, M.; Malik, D.; Berthelot, B.; Yebra, M.; Nolan, R.; Mialon, A.; Zeng, J.; Quan, X.; Tagesson, H.; et al. Satellite canopy water content from sentinel-2, landsat-8 and modis: Principle, algorithm and assessment. Remote Sens. Environ. 2025, 326, 114801. [Google Scholar] [CrossRef]
  30. Teng, Y.; Chen, G.; Su, M.; Zhang, Y.; Li, S.T.; Xu, C. Ecological management zoning based on static and dynamic matching characteristics of ecosystem services supply and demand in the Guangdong-Hong Kong-Macao Greater Bay Area. J. Clean. Prod. 2024, 448, 141599. [Google Scholar] [CrossRef]
  31. Liu, H.; Zhu, J.; Zeng, L.; Gou, M.; Chen, B.; Lv, J.; Xiao, W. Identification of urban ecological security pattern based on ecosystem services supply-demand. Ecosyst. Health Sustain. 2024, 10, 0146. [Google Scholar] [CrossRef]
  32. An, Z.; Sun, C.; Hao, S. Matching supply and demand of ecosystem services in Northeast China from the perspective of water-energy-food nexus. Acta Ecol. Sin. 2024, 44, 4170–4186. [Google Scholar] [CrossRef]
  33. Lei, G. The Kunming-Montreal Global Biodiversity Framework and the solution of Chinese Biosphere Reserve Network. Bull. Chin. Acad. Sci. 2025, 40, 1536–1545. [Google Scholar] [CrossRef]
  34. Zang, M.; Liu, L.; Ma, Y.; Xu, X.; Hu, F.; Lu, X.; Li, J.; Yu, C.; Liu, Y. Urban biodiversity conservation in China under the Kunming-Montreal Global Biodiversity Framework. Biodivers. Sci. 2025, 33, 144–153. [Google Scholar]
  35. Jiang, W.; Marggraf, R. A theoretical rethinking of ecosystem services from the perspective of social-ecological system. iScience 2025, 28, 112309. [Google Scholar] [CrossRef] [PubMed]
  36. Giuliani, M.; Lamontagne, J.R.; Hejazi, M.I.; Reed, P.M.; Castelletti, A. Unintended consequences of climate change mitigation for African river basins. Nat. Clim. Chang. 2022, 12, 187–192. [Google Scholar] [CrossRef]
  37. Yuan, J.; Huang, S.; Zhang, M.; Li, H.; Hu, M. XGBoost-SHAP analysis of coupling coordination between new urbanization and water security resilience in the Yangtze River Economic Belt. J. Soil Water Conserv. 2026, 40, 1–19. [Google Scholar] [CrossRef]
  38. Zhang, Q.; Liu, G.; Zhan, C.; Ren, X.B. Improving water security guarantee capacity of the South-to-North Water Diversion Project for national water network construction. Bull. Chin. Acad. Sci. 2026, 41, 371–380. [Google Scholar] [CrossRef]
  39. Ren, F.; Wu, H.; An, M. Spatiotemporal evolution assessment of agricultural water security in Northeast China under future climate scenarios. J. Soil Water Conserv. 2026, 40, 1–16. [Google Scholar] [CrossRef]
  40. Wang, J.; Qin, C.; Su, J.; Xiong, S.G. Design and application of the indicator system for the Beautiful China construction goals. Environ. Prot. 2022, 50, 12–17. [Google Scholar] [CrossRef]
  41. Tang, W.; Zhai, Y.; Wu, G. Construction of ecological corridor of Pinglu Canal. Water Transp. Eng. 2025, 1, 9–15. [Google Scholar]
  42. Peng, X.; Zheng, Z.; Huang, W. Construction scheme of ecological conservation area in Shaping River section of the Western Land-Sea New Corridor (Pinglu) Canal. Pearl River 2025, 46, 31–33. [Google Scholar]
  43. Han, Z.; Zhang, N.; Xiao, Y.; Cheng, J.; Tang, W. Environmental impact identification and evaluation index system for major canal projects. J. Environ. Eng. Technol. 2022, 12, 1860–1866. [Google Scholar]
  44. Wen, S.; Hu, B.; Xie, W.; Gao, C. Land Use Scenario Simulation and Habitat Quality Change in Pinglu River Eco-nomic Belt Based on PLUS-InVEST Model. Environ. Sci. 2025, 46, 5122–5133. [Google Scholar] [CrossRef]
  45. Zhong, H.; Lu, R.; Luo, M.; Wang, P.; Zhang, L. Management of ecological functional zoning for land use along China’s Pinglu Canal under ecological supply-demand balance and threshold regulation. J. Environ. Manag. 2025, 398, 128300. [Google Scholar] [CrossRef]
  46. Huang, Q.; Hu, B.; Xie, Y.; Ruan, R.; Lai, J. Spatiotemporal Variations and Driving Factors of Ecosystem Health in the Pinglu Canal Economic Zone. Land 2026, 15, 85. [Google Scholar] [CrossRef]
  47. Zhou, J.; Lu, D.; Xu, Y.; Liang, S.; Huang, H. Spatiotemporal evolution of carbon storage in the coastal area of Beibu Gulf, Guangxi based on InVEST and GIS models. Mar. Environ. Sci. 2024, 43, 715–722+732. [Google Scholar] [CrossRef]
  48. Li, X.; Qin, M.; Pang, Y.; Wu, X.; Jiang, H. Multi-scenario simulation and zoning control countermeasures of carbon storage in Guangxi territorial space. J. Guangxi Univ. (Nat. Sci. Ed.) 2023, 48, 1352–1365. [Google Scholar] [CrossRef]
  49. Zhou, W.; Liu, G.; Pan, J. Distribution of available soil water capacity in China. J. Geogr. Sci. 2005, 15, 3–12. [Google Scholar]
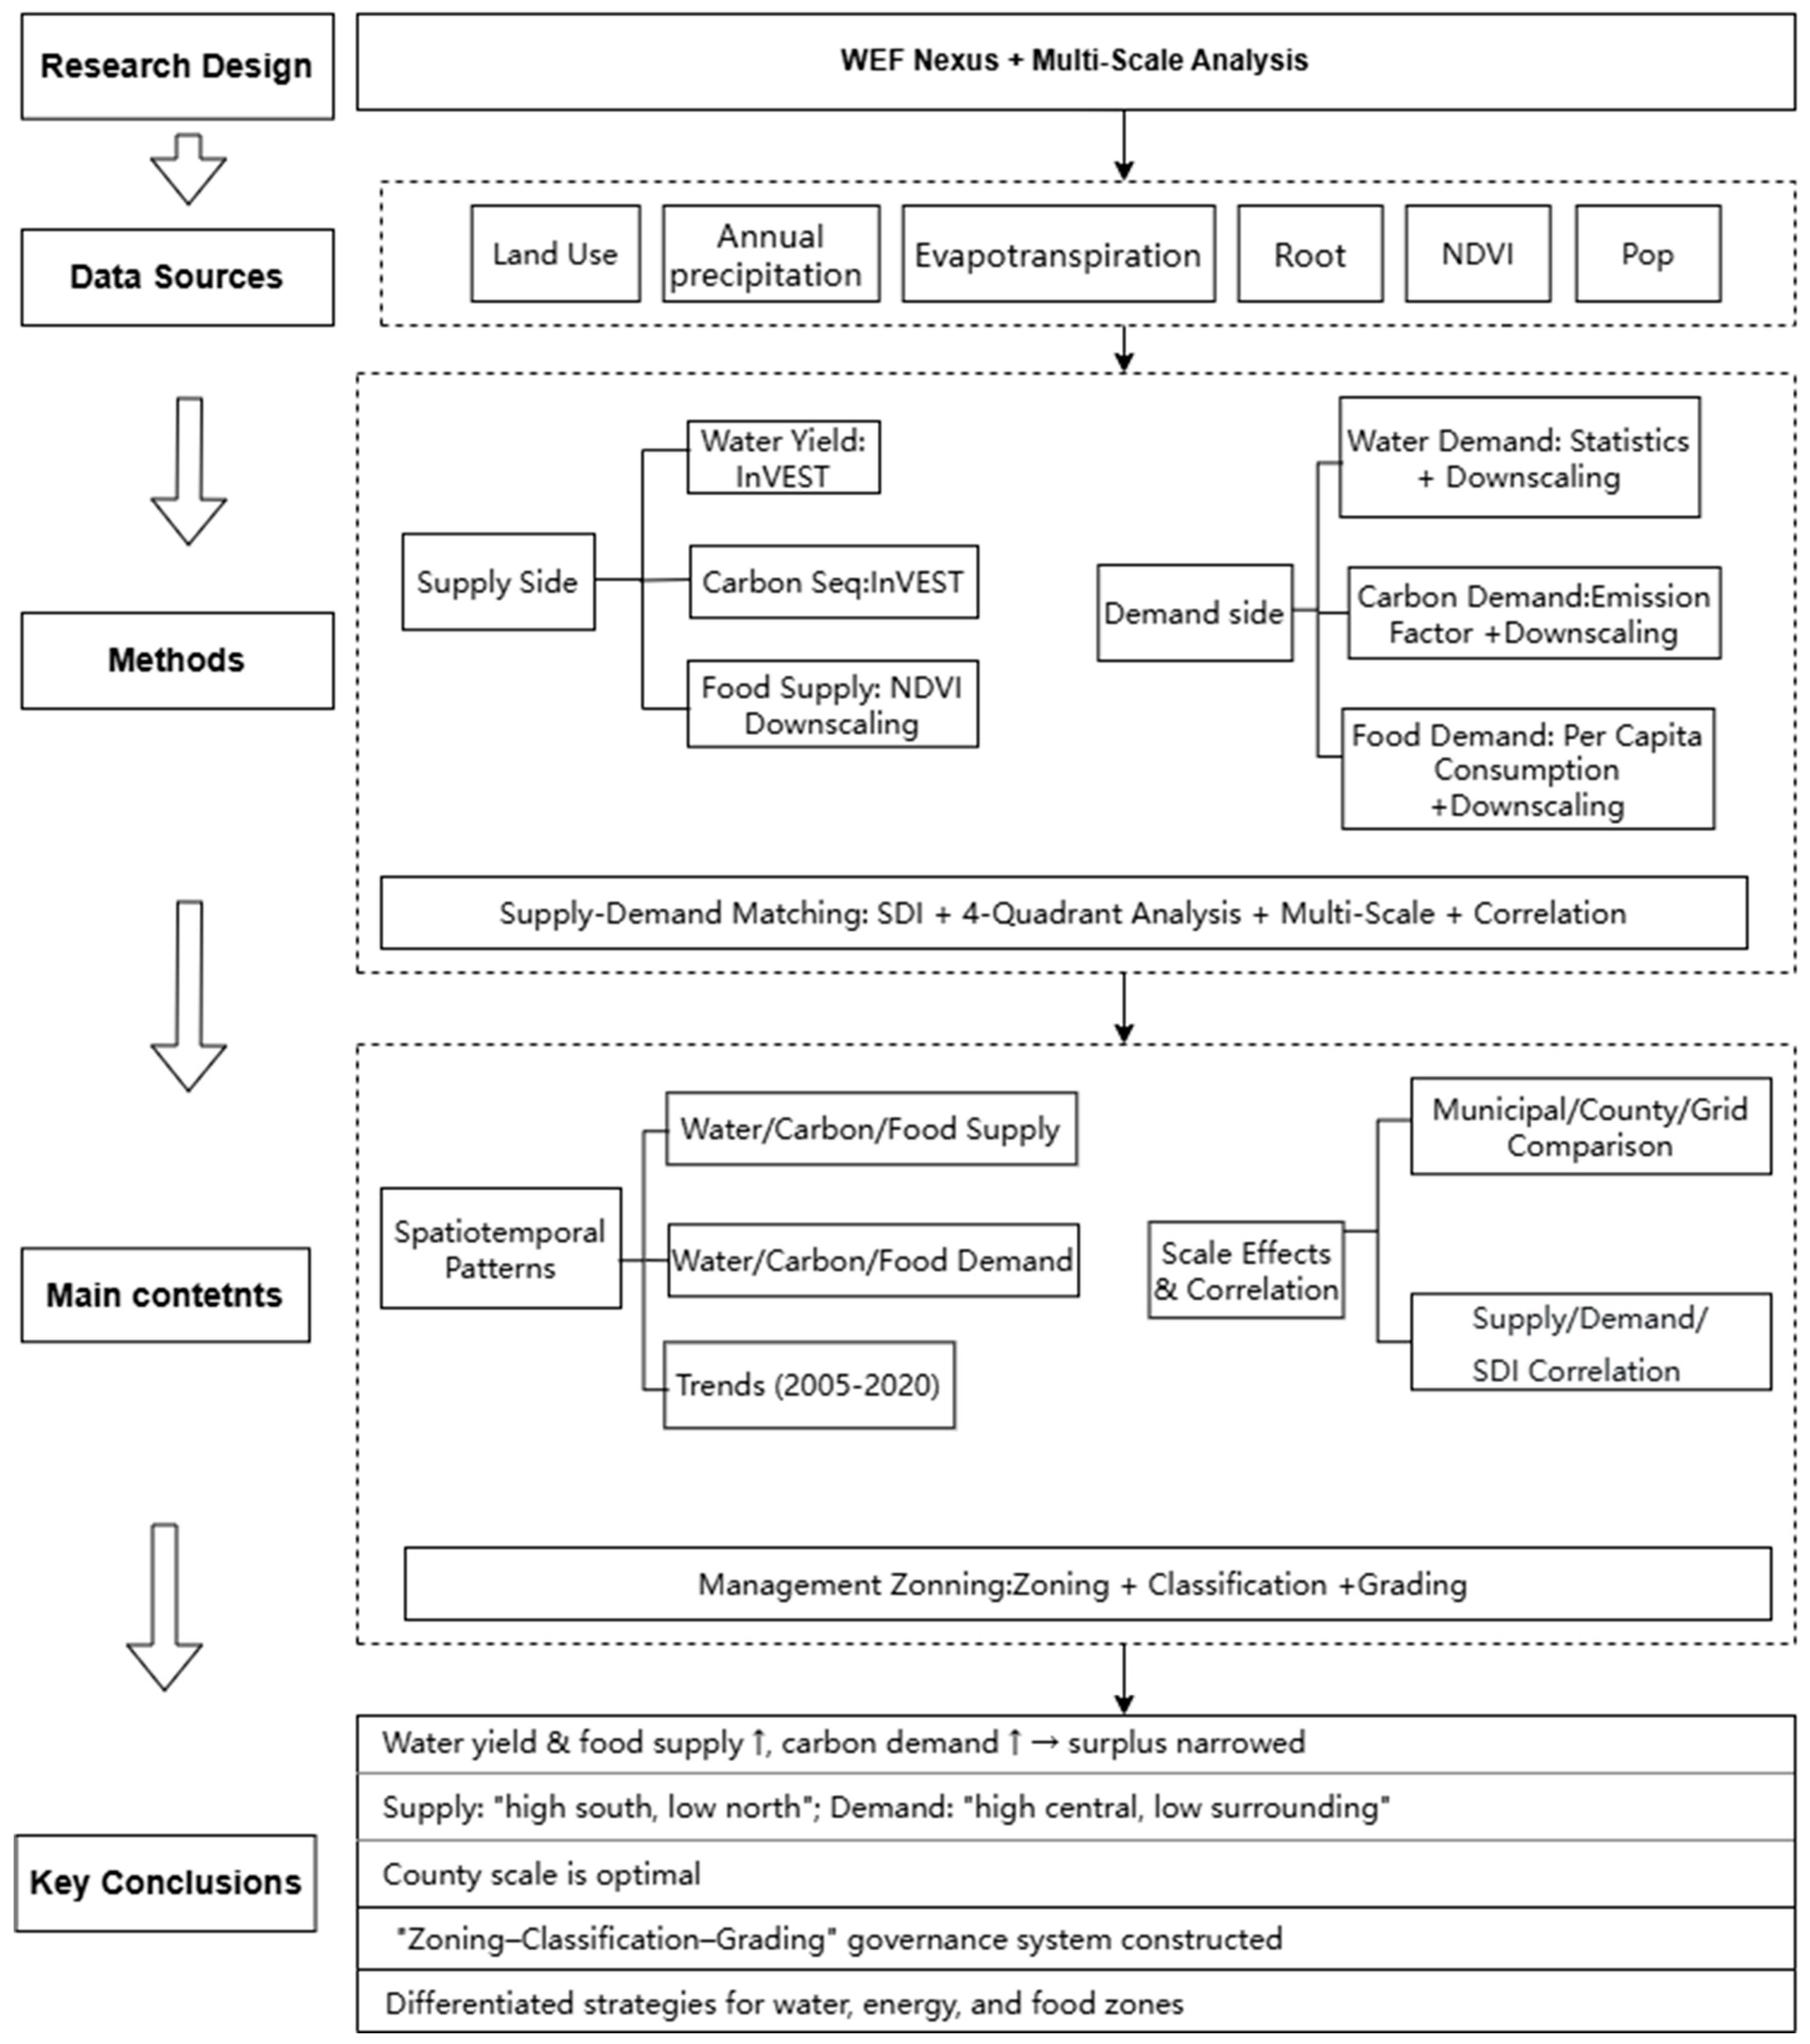
Figure 1. The framework of the research.
Land 15 00823 g001
Figure 2. Study area overview. (a) Location of Guangxi in China; (b) Location of the Pinglu Canal Economic Zone in Guangxi; (c) DEM; (d) Land use in 2020.
Land 15 00823 g002
Figure 3. Spatial Distribution Patterns of Water Yield, Carbon Storage, and Food Supply from 2005 to 2020.
Land 15 00823 g003
Figure 4. Spatial Distribution Patterns of Water, Energy, and Food Demand.
Land 15 00823 g004
Figure 5. Spatial Matching Patterns of Water, Energy, and Food Supply–Demand from 2005 to 2020.
Land 15 00823 g005
Figure 6. Matching Patterns of Water, Energy, and Food Supply–Demand at Different Scales.
Land 15 00823 g006
Figure 7. The correlation of ES supply, demand, and supply–demand matching relationships at different scales.
Land 15 00823 g007
Figure 8. Spatial Matching Patterns of Water Yield, Carbon Sequestration, and Food Supply–Demand Services.
Land 15 00823 g008
Figure 9. (a): Spatial distribution of integrated management zoning for water yield, carbon sequestration, and food at the county level. (b): Legend of integrated management zoning types at the county level. Abbreviations. WCG: Water Resource General Control Zone; WRK: Water Resource Key Restructuring Zone; WRG: Water Resource General Restructuring Zone; ECG: Energy General Control Zone; ECK: Energy Key Control Zone; ECP: Energy Priority Protection Zone; EDK: Energy Key Protection Zone; FCK: Food Key Control Zone; FIK: Food Key Improvement Zone; FIP: Food Priority Improvement Zone; FRK: Food Key Restructuring Zone; FRP: Food Priority Restructuring Zone.
Land 15 00823 g009
Table 1. Data types and sources.
Data NameData SourcePurposeData FormatResolution
Land use dataResource and Environmental Science Data Center, CAS http://www.resdc.cn/ (accessed on 15 September 2025)Land use dataRaster30 m
Annual precipitation dataNational Tibetan Plateau Data Center https://data.tpdc.ac.cn (accessed on 3 November 2025)Precipitation erosion factorRaster1 km
Evapotranspiration dataNational Tibetan Plateau Data Center https://data.tpdc.ac.cn/ (accessed on 3 November 2025)Evapotranspiration parameterRaster1 km
Root dataWorld Soil Database https://gaez.fao.org/pages/hwsd (accessed on 4 November 2025)Maximum root depth, plant evapotranspiration, plant available water contentRaster1 km
NDVI dataGeoVis Earth Open Platform https://open.geovisearth.com/ (accessed on 10 November 2025)Food productionRaster1 km
Water consumption, energy consumption, food consumptionGuangxi Statistical Yearbook, Water Resources Bulletin
http://tjj.gxzf.gov.cn/tjsj/tjnj/
(accessed on 15 November 2025)
Water demand, energy demand, food demandStatisticalAdministrative unit
Population densityWorldPop https://hub.worldpop.org/ (accessed on 18 November 2025)Spatial distribution of populationRaster1 km
Carbon emissionsChina Carbon Accounting Database https://www.ceads.net.cn/data/ (accessed on 26 November 2025)Energy demandStatisticalAdministrative unit
Table 2. Supply and Demand of Ecosystem Services in the Pinglu Canal.
TypeWY (107 m3)CS (107 t)FP (t)
SupplyDemandSDISupplyDemandSDISupplyDemandSDI
20055433.26918.180.770565.606.720.73435.342.390.3814
20105272.051068.100.748567.617.320.72545.162.540.3403
20156344.881036.420.783269.999.650.68666.862.390.4832
20204629.801653.280.768870.2010.960.66318.242.440.5430
Table 3. Ecosystem Services Supply–Demand Index Table for the Pinglu Canal.
YearWYCSFP
20050.77050.7343−0.2716
20100.74850.7254−0.2813
20150.78320.6866−0.2813
20200.76880.6631−0.2267
Table 4. Correlation of ES Supply, Demand, and Supply–Demand Matching at Different Scales.
ScaleTypeWY-CSWF-FPCS-FP
MunicipalSupply0.69−0.86−0.96
Demand0.69−0.84−0.89
SDI0.95−0.82−0.90
CountySupply0.34−0.69−0.68
Demand0.980.970.95
SDI0.950.95−0.29
GridSupply0.028−0.280.85
Demand0.820.13−0.21
SDI−0.440.07−0.70
Disclaimer/Publisher’s Note: The statements, opinions and data contained in all publications are solely those of the individual author(s) and contributor(s) and not of MDPI and/or the editor(s). MDPI and/or the editor(s) disclaim responsibility for any injury to people or property resulting from any ideas, methods, instructions or products referred to in the content.