Article

Effects of Land Use on Soil Parameters and Carbon Dynamics in Surface Soil of Ecosystems of Rila Mountains, Bulgaria


1
Forest Research Institute, Bulgarian Academy of Sciences, 1756 Sofia, Bulgaria
2
Department of Ecology, Protection and Remediation of the Environment, Faculty of Ecology and Landscape Architecture, University of Forestry, 1797 Sofia, Bulgaria
*
Author to whom correspondence should be addressed.
Land 2026, 15(5), 821; https://doi.org/10.3390/land15050821 (registering DOI)
Submission received: 3 April 2026 / Revised: 2 May 2026 / Accepted: 8 May 2026 / Published: 12 May 2026

Abstract

This study quantifies how different land-use types influence surface soil characteristics (0–5 cm) and the dynamics of soil organic carbon (SOC) and nitrogen in the mountainous ecosystems of the Rila Mountains. Across 54 forest and agricultural plots, pH, bulk density, coarse fraction, C:N ratio, SOC, total nitrogen (TN), and their respective stocks were assessed using standard analytical methods and statistical tests (Shapiro–Wilk, ANOVA, Kruskal–Wallis, correlation and regression analysis). Land use significantly affected all soil parameters except pH. Forest soil showed lower bulk density and lower SOC stocks compared with grasslands. Unmown meadows exhibited the highest SOC and TN concentrations and stocks, while potato fields recorded the highest bulk density and elevated TN stocks, reflecting intensive management impacts on surface soil properties. Forest soils displayed species-specific patterns, with Scots pine and Silver fir showing comparatively lower SOC and TN stocks attributable to historical degradation and site limitations. As the study focused on the uppermost soil layer (0–5 cm), the results should be interpreted more as indicators of surface soil dynamics rather than as estimates of total topsoil carbon and nutrient storage. Correlation analysis revealed strong positive relationships among SOC, TN, and the C:N ratio, and strong negative relationships between SOC and both bulk density and coarse fraction in managed agricultural lands. The findings demonstrate that minimizing soil disturbance and maintaining permanent vegetation cover—particularly through conservation of unmanaged grasslands—offer great capacity for enhancing the soil organic matter accumulation in mountainous ecosystems.

1. Introduction

Soil is a key natural resource supporting plant growth for food and raw materials, regulating water through filtration and storage, and playing an important role in the nutrient and carbon cycles [1,2]. Additionally, soil serves as a habitat for diverse organisms, provides structural support for infrastructure, and contributes to climate regulation and the mitigation of natural hazards such as flooding [1]. Soil’s properties and its ability to provide various ecosystem services [3] are of particular importance for sensitive ecosystems such as those in mountainous areas. Mountain soils are highly vulnerable due to steep slopes, shallow profiles, and intense climatic pressures that accelerate erosion, nutrient loss, and structural degradation [4,5,6].
In addition to the inherent natural pressures on soil systems related to the natural characteristics of the mountainous landscape, the anthropogenic impacts on soils are also considerable, particularly in the context of deforestation or unsustainable land use [7,8]. Land-use changes are a primary driver of soil physicochemical property alterations [9], often leading to increased erosion, sedimentation, and overall land degradation [10,11,12], thereby reducing land productivity [13].
Another implication of land-use changes and subsequent land management regimes is related to the organic matter dynamics and soil carbon sequestration potential [14,15]. This is of particular importance in the context of increasing atmospheric CO2 emissions. Soils store approximately twice as much carbon as the atmosphere and nearly three times more than vegetation, making them a critical component of the global carbon cycle [16,17]. In a global meta-analysis study, Guo & Gifford (2002) [7] reported that soil carbon (C) stocks declined by an average of 9% due to land conversion across all land-use categories, although the responses varied widely among specific transitions. For example, C increased after conversions from forest to pasture (+8%), crop to plantation (+18%), crop to secondary forest (+53%), and crop to pasture (+19%). In contrast, C stocks declined following transitions from pasture to plantation (−10%) and forest to plantation (−13%), with the largest losses occurring when forest or pasture were converted to cropland (−42% and −59%, respectively). These trends are further confirmed by more recent global meta-analysis by Beillouin et al. (2023) [18], who reported the conversion of forest lands, grasslands, and wetlands to croplands consistently resulted in large SOC losses, with a mean change of −25% and SOC gains are significant when croplands are converted to forests (+57%) and grasslands (+26%). These outcomes highlight that land-use and -management decisions determine whether soils function as carbon sources or sinks [19], with direct implications for soil fertility, ecosystem functioning, and climate mitigation. However, the effect of land-use conversions on SOC is considerably determined by the local soil and climate conditions; thus, regional studies on how specific land-use practices modify fundamental soil parameters are essential.
This paper aims to study and assess the influence of land use and land conversion on soil properties and the carbon and nitrogen dynamics in surface soil as the most biologically active zone [20] and to determine the interrelationships between certain soil parameters. It should be acknowledged, however, that the focus on the uppermost soil layer, while appropriate for detecting recent management-induced changes [21], does not represent the full topsoil carbon and nutrient dynamics [22], and the findings should be interpreted within this constraint. Understanding these patterns is important for developing effective land management strategies that mitigate soil degradation and enhance ecosystem resilience in mountainous areas. This research is particularly relevant given that mountainous ecosystems are inherently fragile and highly susceptible to anthropogenic disturbances, making them critical areas for studying the long-term impacts of land-use change on ecosystem services such as soil conservation and carbon storage [23]. Furthermore, increasing soil organic carbon is important for carbon sequestration, addressing climate change, improving land productivity, enriching soil biological and chemical properties, and supporting microbial communities [24]. These benefits collectively contribute to ecological restoration efforts and the mitigation of global environmental challenges.

2. Materials and Methods

2.1. Study Area

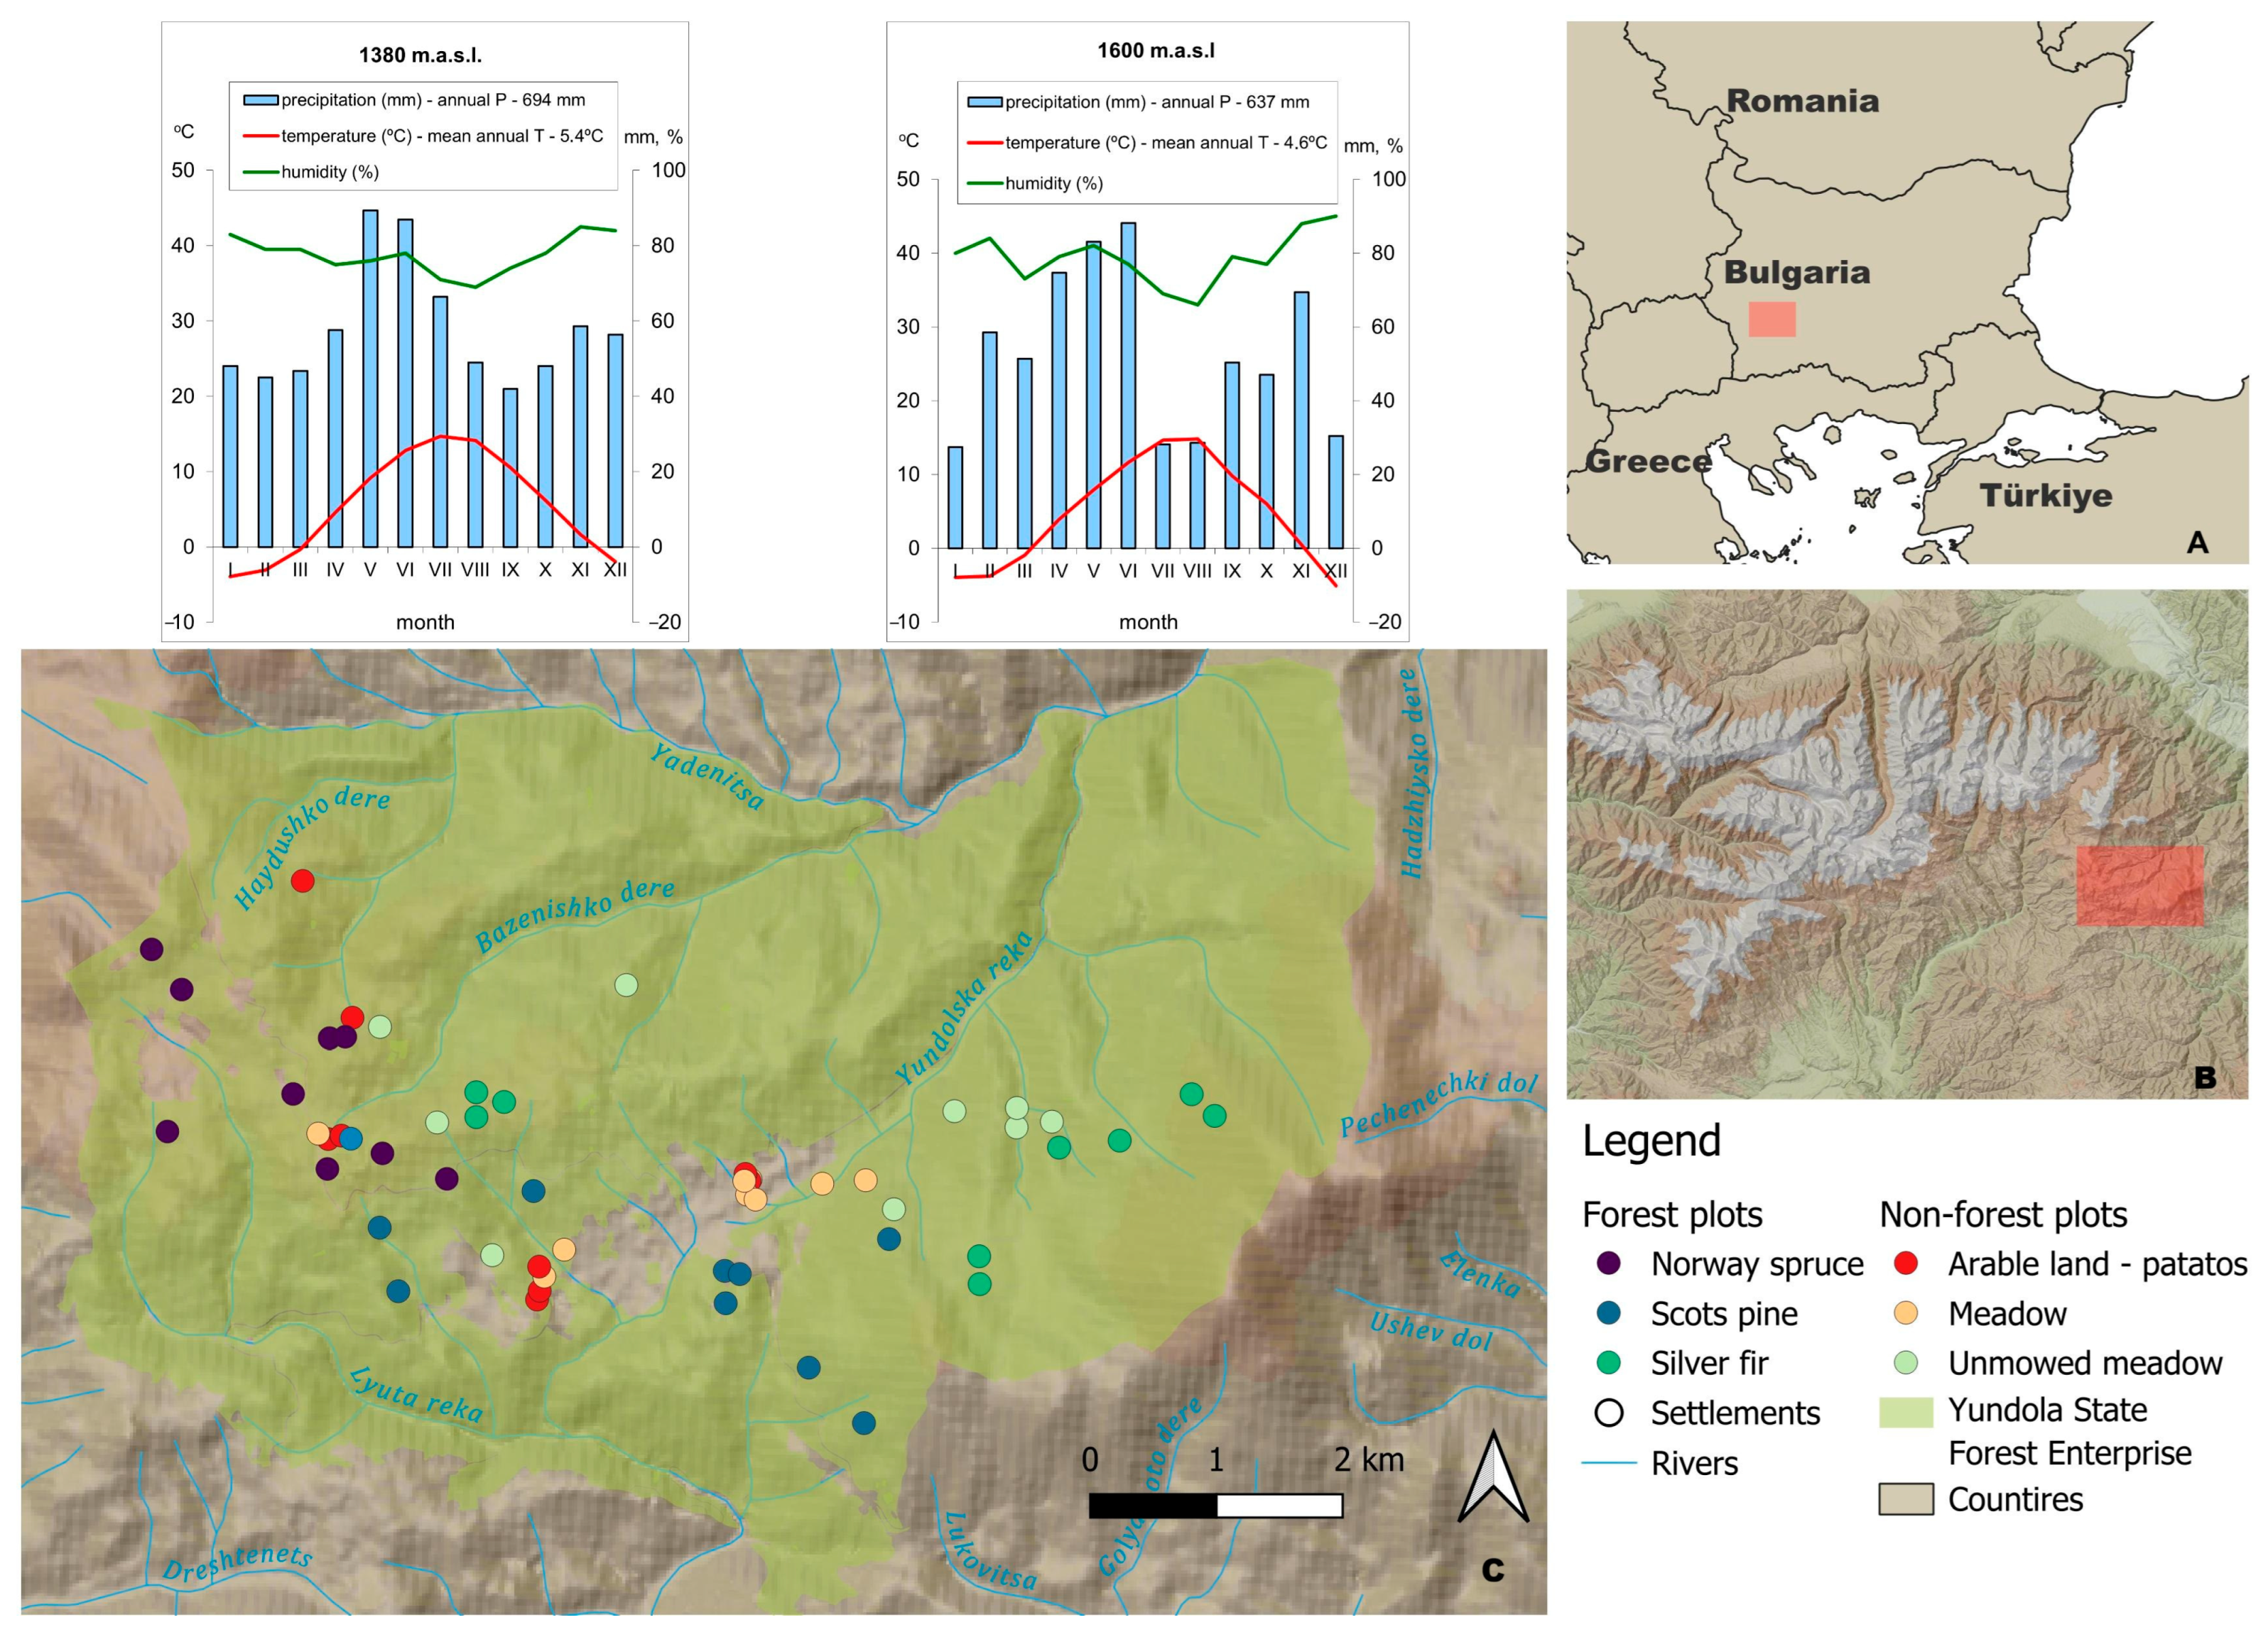
The study area encompasses parts of Yundola’s village territory (around 5200 ha), spread around the eastern and southeastern ridges of the Rila Mountains, as well as the western and northwestern ridges of the Rhodope Mountains (Figure 1). An evident characteristic of the topography in the region is its elevated altitude and substantial topography complexity. The mean altitude of the territory is 1479 m, with a maximum elevation difference of 804 m.
The climate is categorized as mountainous, with cold winters and relatively cool summers. Thermal conditions are highly seasonal due to winter–summer radiation differences. The greatest air temperature fluctuations occur at the end of the growing season (Figure 1). On average, temperatures stay above 0 °C for 255 days, above 5 °C for 191 days, and above 10 °C for 122 days. The active temperature sum averages 2105° (above 5 °C) and 1595° (above 10 °C). The growing season lasts about 5.3–5.9 months at elevations of 1380–1600 m. The precipitation regime exhibits two peaks in May (89.3 mm) and November (58.6 mm), with lows in September (41.9 mm) and February (45.1 mm). At 1600 m above sea level, July and August are critical months for drought, whereas at 1380 m, the diagram does not show any dry periods (Figure 1). Average annual relative humidity is 78%, with about 12 days below 30% and 100 days above 80% each year.
The vegetation is indicative of the middle mountain belt, where beech and coniferous forests dominate at altitudes ranging from 700 to 2000 m above sea level. Most of the area (92.3%) is located within the middle mountain forests area according to the Bulgarian classification of forest vegetation zones, which are characterized by beech, fir, and spruce (1200–1700 m above sea level). The soils across the area are classified as Cambisols (WRB, 2022), consistent with the typical pedological conditions for the mid-montane elevation in Bulgaria [25,26], developed on metamorphic and magmatic rocks such as gneisses and granites.
A total of 54 sample plots (SPs) of varying land-use types have been established, including 27 located in woodlands (Pinus sylvestris L., Picea abies (L.) Karst., and Abies alba Mill.) and the remaining 27 situated on agricultural lands, encompassing potato fields, annually mown meadows, and unmown meadows. All 54 sample plots were distributed within an altitudinal range of 1300–1700 m a.s.l., where Dystric–Eutric Cambisols predominate [27].

2.2. Sampling Design and Laboratory Analysis

The study focuses on the uppermost soil layer (0–5 cm), which is the most biologically active soil layer, characterized by high microbial activity, rapid decomposition, and dynamic carbon cycling, making it especially responsive to management practices, land-use changes, and environmental fluctuations [28,29,30]. The sample plots have a size of 900 m2. From each plot, a composite sample for the surface soil layer (0–5 cm) has been collected. In addition, a dedicated core sample in two replicates has been extracted as suggested by Cools and De Vos (2013) [31] to determine the bulk density for 0–5 cm following the Kachinsky method [32].
The soil samples were oven-dried at 105 °C (ISO 11465:1993) [33] and then processed for physicochemical analysis. The following properties were analyzed: pH in H2O (ISO 10390:2005) [34], nitrogen content (Kjeldahl method), and carbon content (modified Turin method). Carbon and nitrogen stocks were derived using the IPCC GPG-LULUCF formula [35]—Equation (1), which has been adapted for nitrogen stocks by Ellert & Bettany (1995) [36].
S O C   s t o c k   l a y e r = ( S O C l a y e r ·   B u l k   D e n s i t y   ·   D e p t h l a y e r ·   ( 1 F r a g ) · 10 ) l a y e r
where
  • SOC stock layer—SOC stock in a layer, tons C∙ha−1;
  • SOC layer—SOC content, gC∙kg−1 soil;
  • Bulk Density—g∙cm−3;
  • Depth layer—sampled depth, m;
  • Frag—coarse fraction (particles with a diameter > 2 mm), %/100.

2.3. Statistical Analysis

The analysis started with deriving the basic statistical parameters: mean; median; minimum and maximum values; standard error; confidence interval ±95%; lower and upper quantile; coefficient of variance (CV). The data was checked for normal distribution using Shapiro–Wilk test. The analysis continued with parametric (one-way ANOVA) and non-parametric (Kruskal–Wallis) statistical tests to check if there is statistically significant difference between the means of the groups defined by the land-use types. Duncan’s test was used to identify the differences between groups after a positive one-way ANOVA. The analysis continued with exploring the relationship between the variables applying correlation analysis and linear regression. The processing of data and the statistical analysis were done in R programming.

3. Results

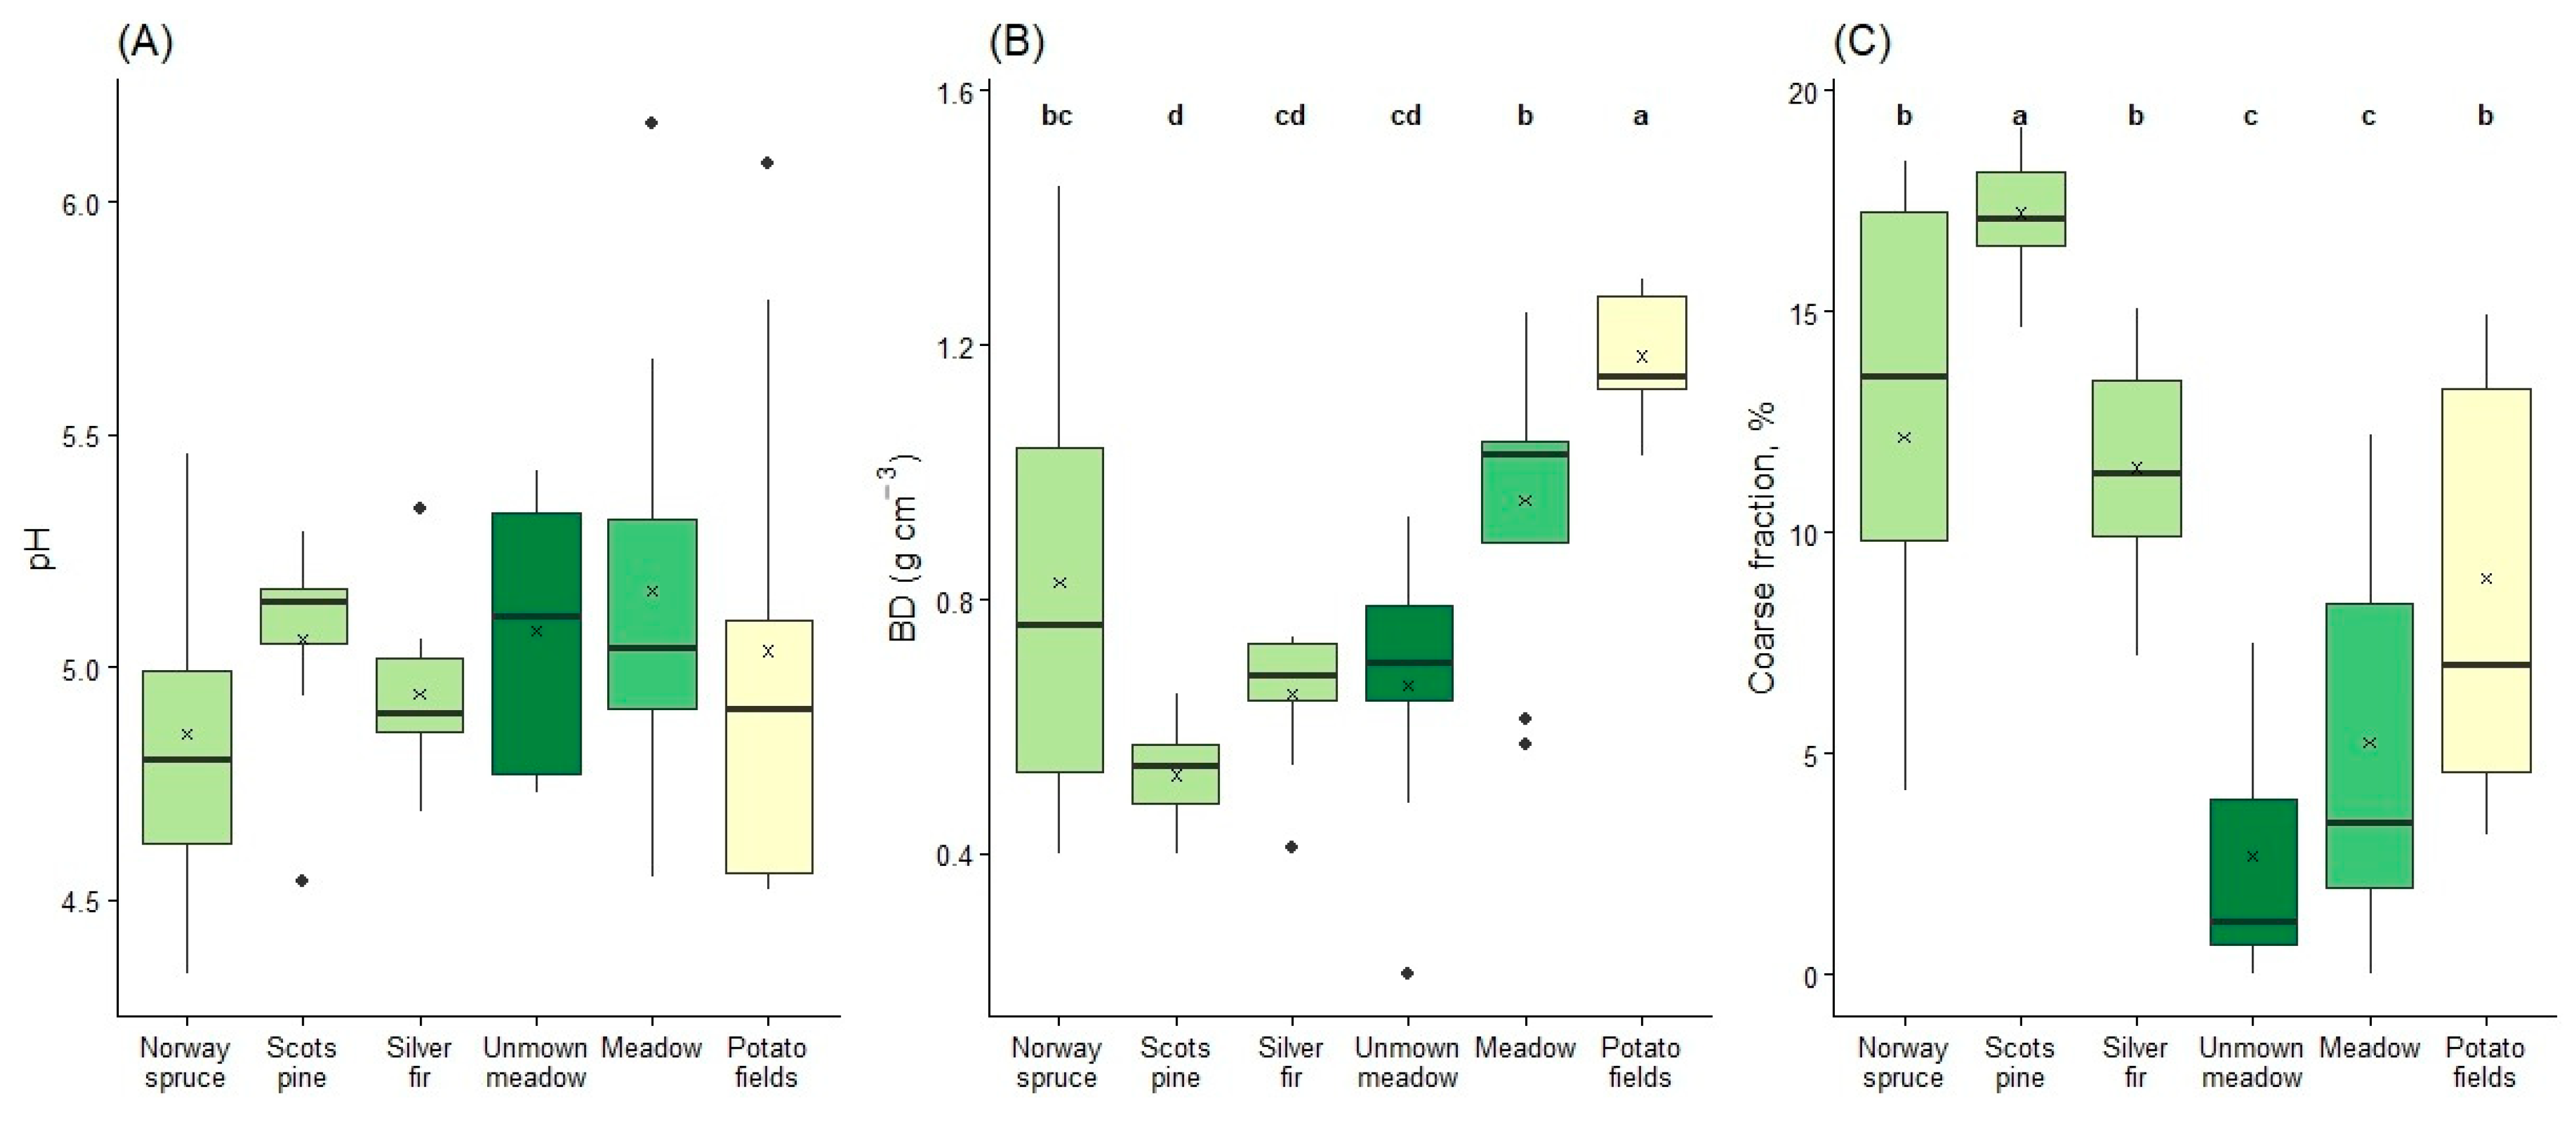
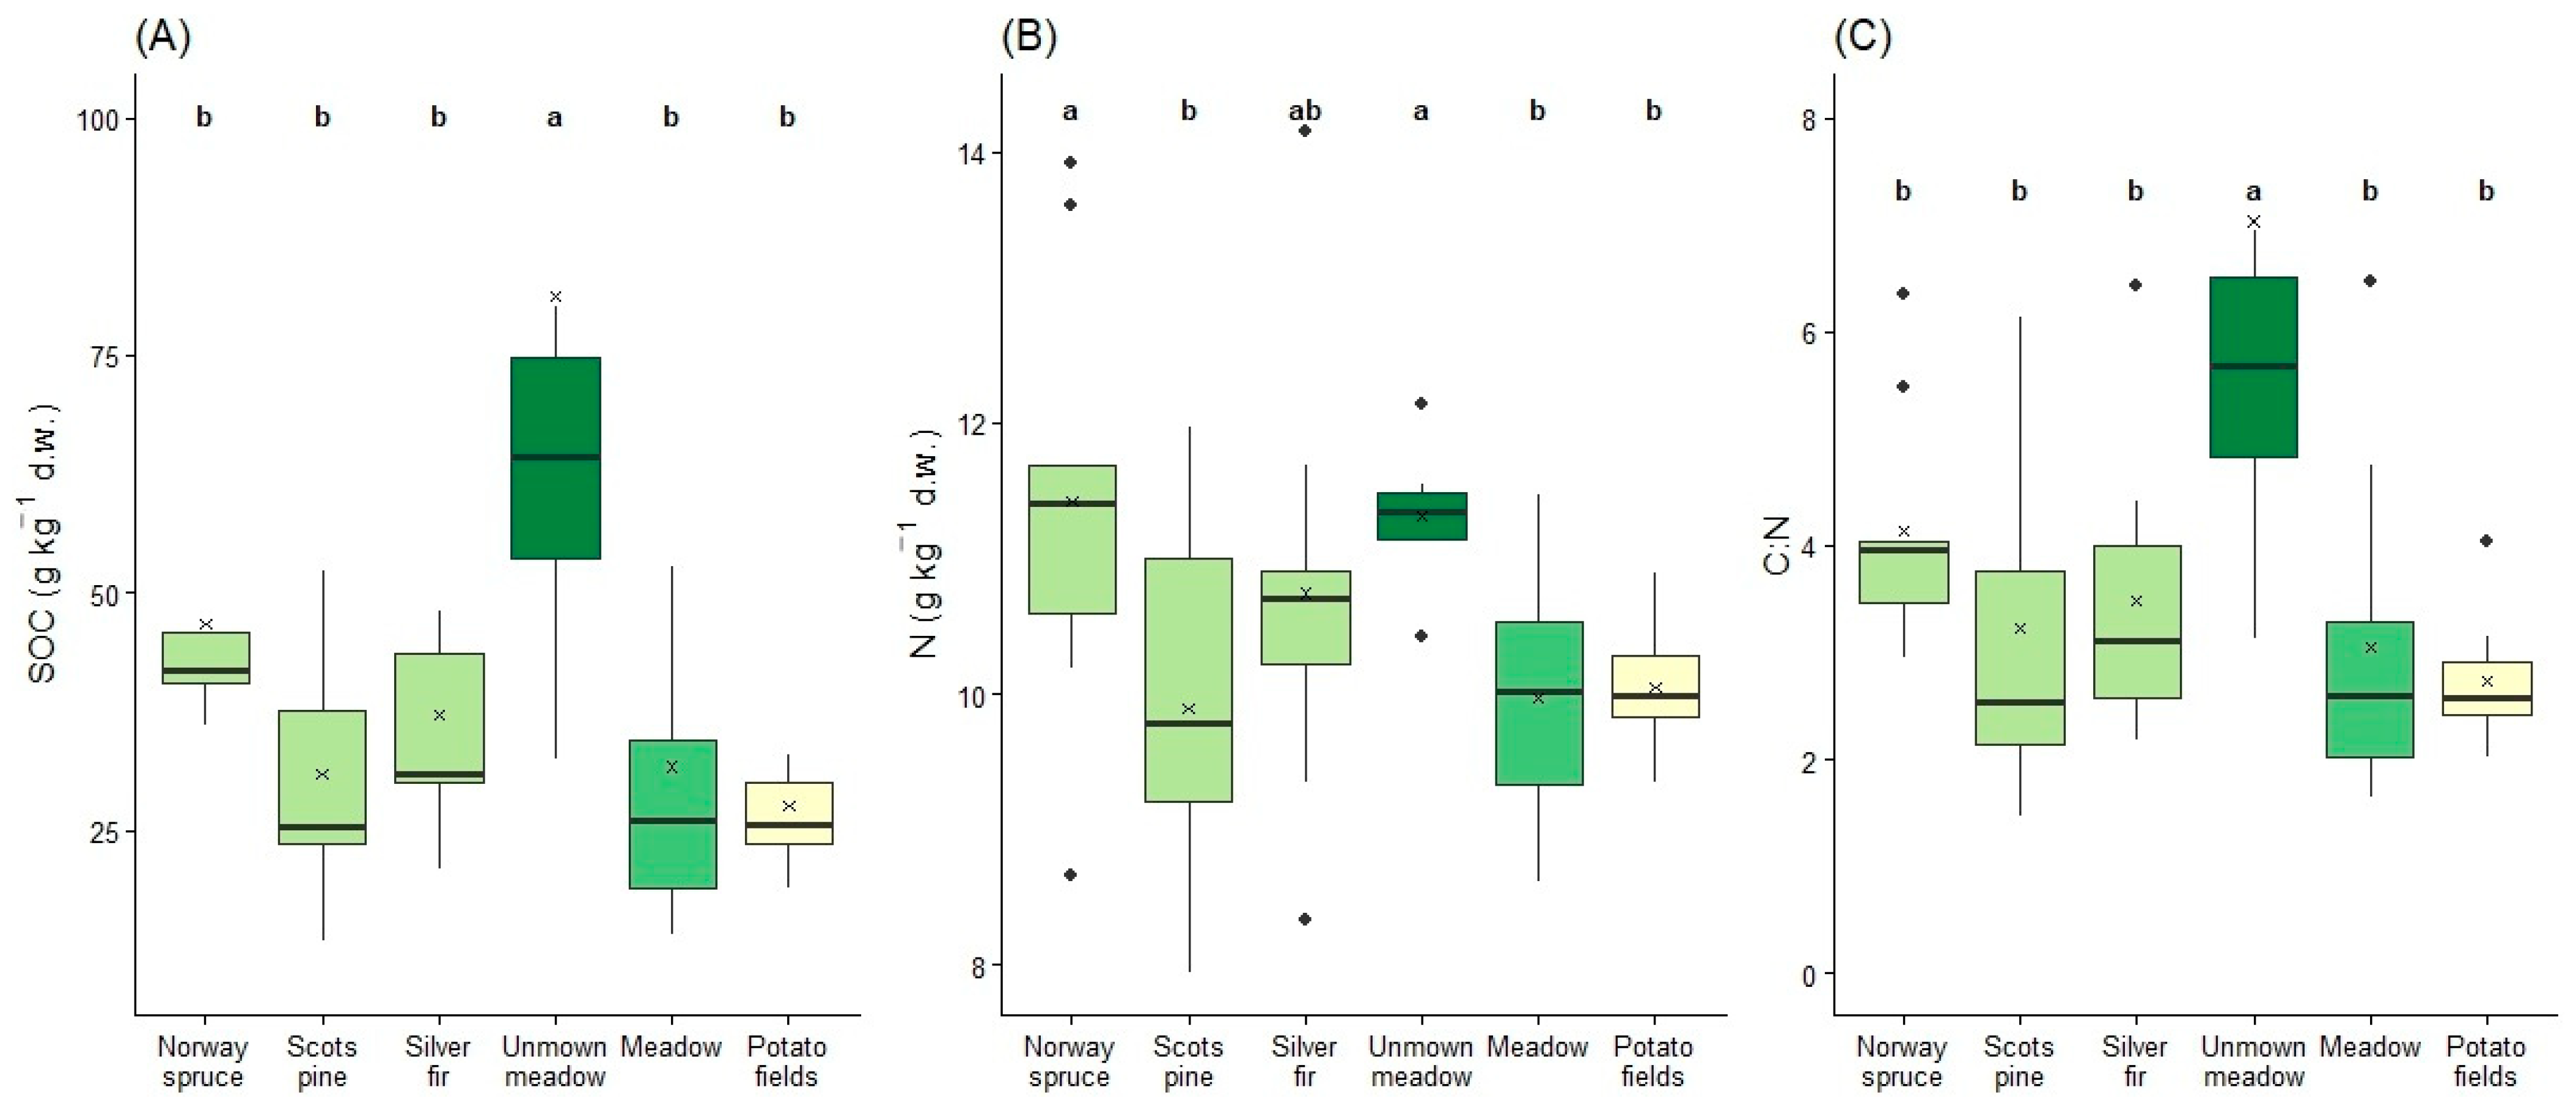
The analysis of the two main characteristics of the normal distribution, specifically the mean and variance, shows that the parameters such as pH and N content exhibited low CV, indicating relatively stable distributions and minimal dispersion around the mean. The pH of the analyzed soils was strongly acidic with mean values between 4.86 and 5.07 across all the land-use types (Table 1). The mean total nitrogen content varied between 9.88 g∙kg−1 and 11.42 g∙kg−1 dry weight within the analyzed land uses. Both pH and total nitrogen content exhibited coefficients of variation below 15% (Table 1), indicating relatively low dispersion around the mean (Figure 2A and Figure 3B).
In contrast, the means of bulk density, coarse fraction, SOC content, SOC stock and C:N ratio exhibited large variation among the different land uses (Table 1), thereby signifying relative heterogeneity across sampling sites. These observations are also indicative of the natural landscape variability present within the region.
The bulk density is greatest in potato fields with a mean value of 1.18 g∙cm−3 followed by meadows with a mean of 0.96 g∙cm−3 (Table 1). Unmown meadows have a much lower average bulk density (0.66 g∙cm−3) than meadow sites, but their coefficient of variation is higher (CV 32% versus CV 25%). Forest soils are on average less compacted compared with the managed agricultural lands with mean values of bulk density of 0.52 g∙cm−3 in Scot pine sites, 0.63 g∙cm−3 in Silver fir sites and 0.83 g∙cm−3 in Norway spruce (Table 1). The increased CV observed in Norway spruce indicates greater spatial variability in bulk density across these sites.
The average content of the coarse fraction in the studied areas varies from 2.67% to 8.95% in managed and unmanaged agricultural lands, compared to 11.46% to 17.22% in forests (Table 1). The CVs in the agricultural lands are over 54%, reaching 111%, which reflects the high variability of this parameter, particularly in the complex and diverse landscapes of mountainous areas.
Carbon content in the surface soil layer (0–5 cm) differs across all studied land-use types. Managed agricultural lands (potato fields and meadows) show the lowest mean carbon concentration (27.69 g∙kg−1 dry weight), while unmown meadows have the highest mean value (81.26 g∙kg−1 dry weight). Among forest plots, the differences in average carbon values are smaller compared to the grassy lands. The highest mean carbon content is observed in Norway spruce plots (46.68 g∙kg−1 dry weight), and in Scots pine the lowest (Table 1). Forest plots show relatively consistent carbon levels, with CVs ranging from 25% to 43%. In contrast, agricultural fields exhibit wider variation, with CVs between 62% and 79%, except potato fields where the CV is 27% (Table 1).
In terms of SOC stock in the surface soil layer, the highest mean (21.44 t C∙ha−1) is still reported for the unmown meadows, while the lowest mean (6.50 t C∙ha−1) is observed for the Scots pine sites. This observation is also valid for the total nitrogen stock (TN stock), where the variation is bigger than the N content and the CVs range between 7% for potato sites and 49% for Norway spruce. The highest mean nitrogen stock is estimated for potato sites (5.39 t N∙ha−1), whereas the lowest is for the pine plots—2.16 (t N∙ha−1).
The results for the C:N ratio indicate that potato fields exhibit the lowest average ratio (2.73), while unmown meadows demonstrate the highest average value (7.03). Regarding forest ecosystems, the average values of the ratios are between 3.22 and 4.14, with CVs spanning 27% to 50%. Grassland ecosystems (meadows and unmown meadows) show higher variability, with CVs between 52% and 73%, while potato fields present the lowest variation at 22% (Table 1).
The higher CVs for some of the soil parameters necessitated checking the normality of the distributions of the analyzed data. The results revealed no significant deviations from a normal distribution for SOC and C:N ratio within meadow sites. In contrast, the Shapiro–Wilk test indicates departures from normality in several land-use types: specifically, SOC for Norway spruce, bulk density and SOC stock for Silver fir, and pH values for Scots pine (Table 2). For unmown meadow sites, the data exhibited non-normal distribution for multiple parameters, including coarse fraction, C:N ratio, total nitrogen stock (TN stock), SOC, and SOC stock.
Given the heterogeneity of the dataset in terms of its normal distribution, both ANOVA and Kruskal–Wallis tests were applied to assess the differences among groups (Table 3).
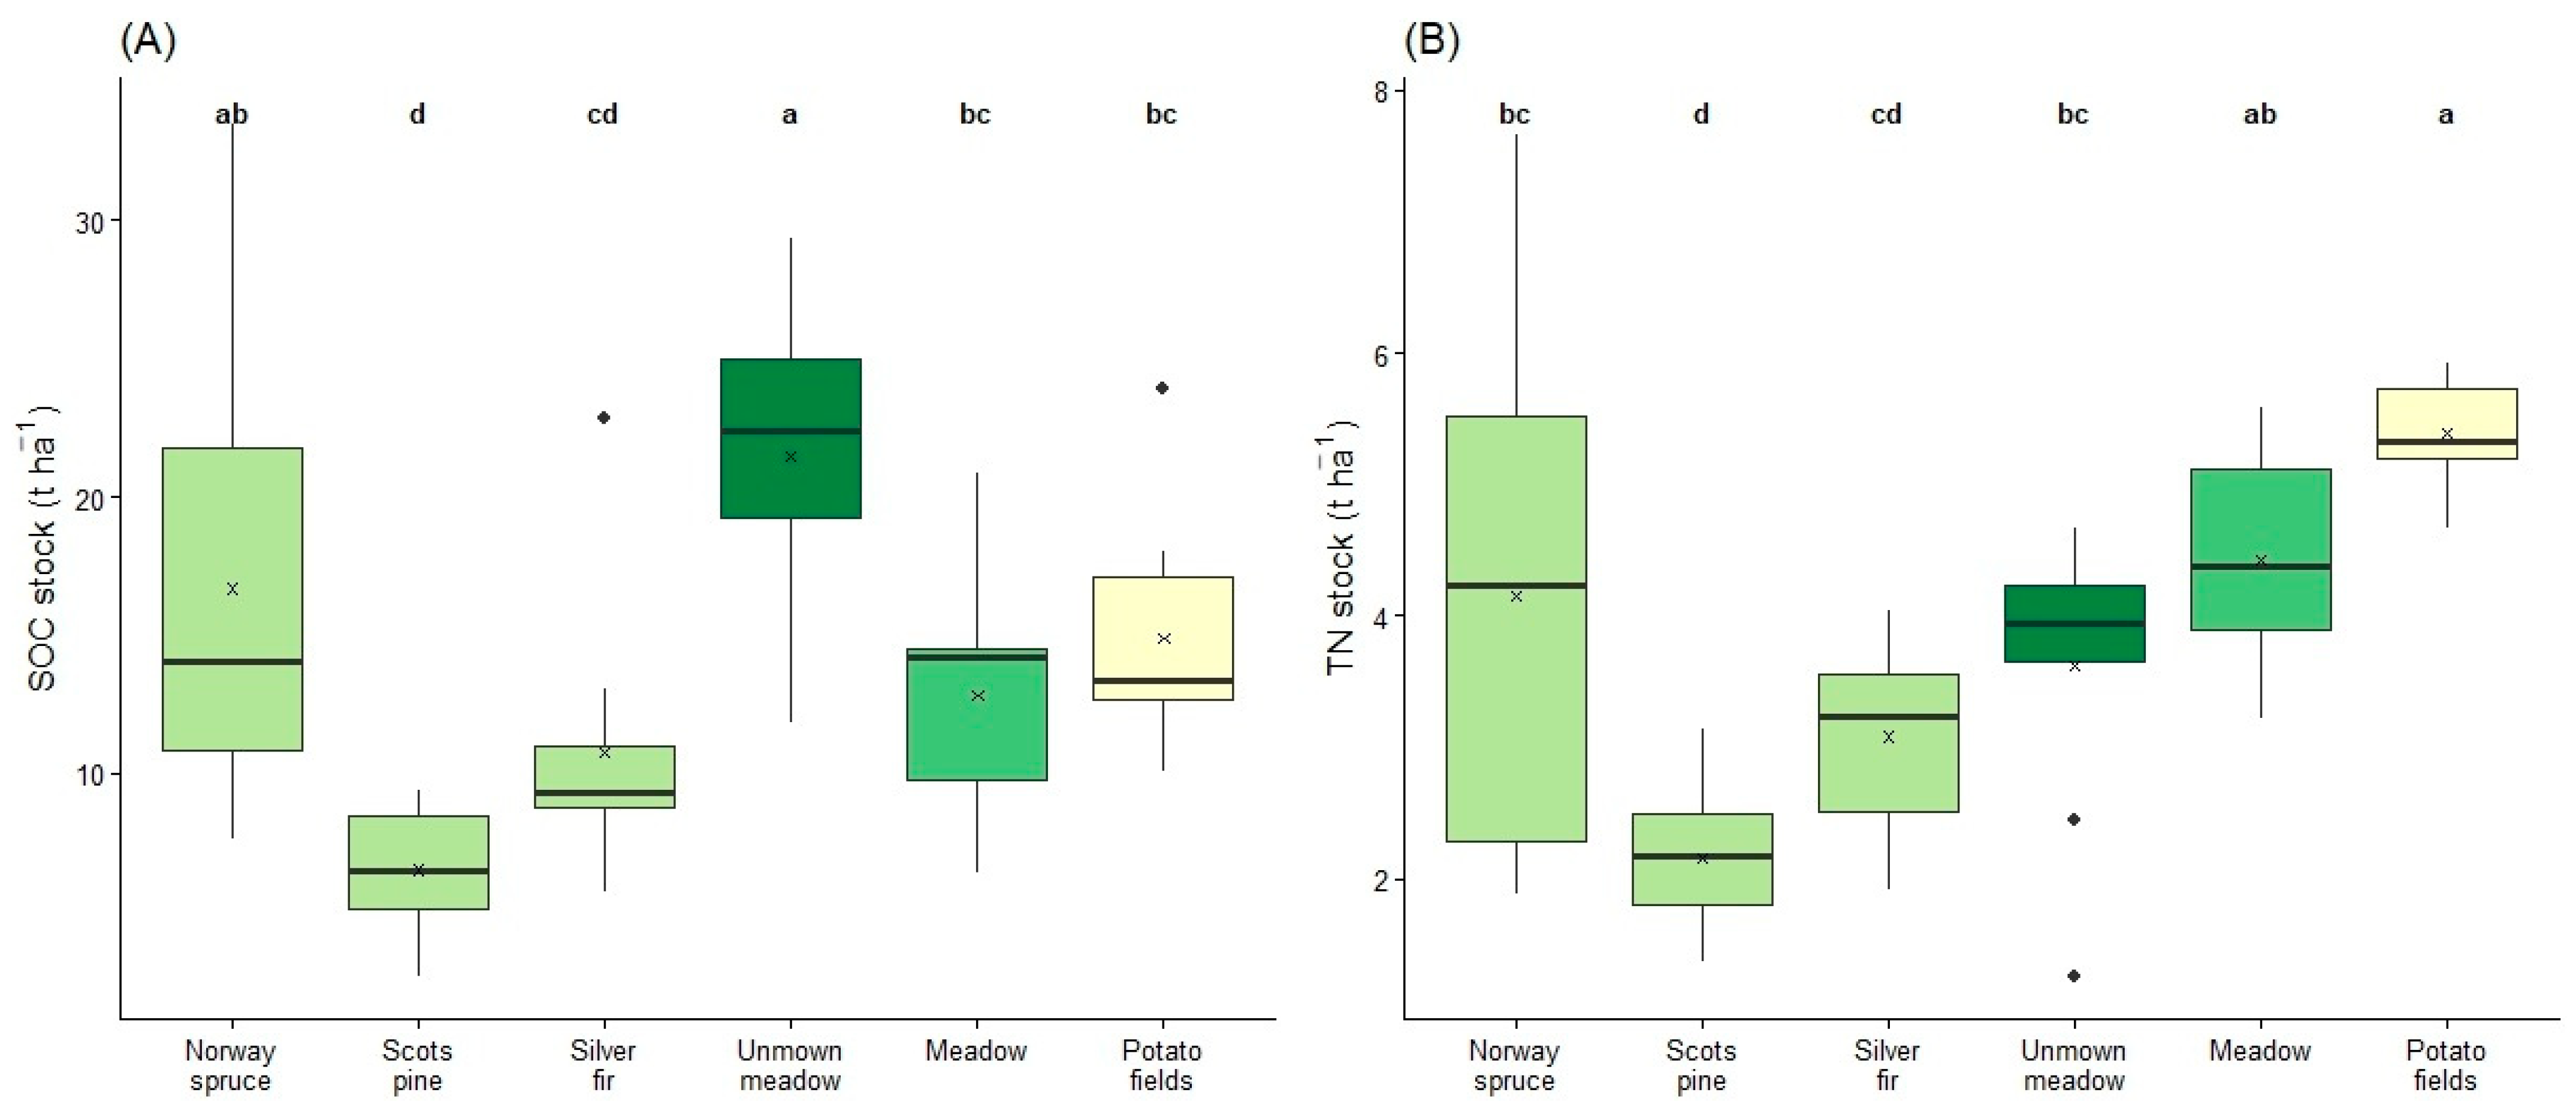
As both methods produced consistent results, indicating that land use significantly influences all the soil properties examined with the exception of pH, Duncan’s test was then used for post hoc comparisons to identify specific group-level differences. These results are visually represented in Figure 2, Figure 3 and Figure 4, where boxplots show the distribution of each variable together with a grouping letter, defined by the post hoc Duncan test after a positive ANOVA result. The letters in the figures indicate which subsets are statistically distinct from one another, reflecting variations attributable to land-use categories.
Pearson’s correlation coefficient analysis revealed consistently strong positive relationships across land-use types (Table 4), most notably between SOC and C:N (R = 0.91 ** ÷ 0.99 **) and between BD and TN stock (R = 0.91 ** ÷ 0.99 **). The analysis was conducted both collectively across all sample plots and within specific groups based on land-use and -management combinations to determine key relationships. For instance, forest plots (n = 27) and agricultural lands (n = 27) were assessed as distinct categories. Managed lands (n = 18), including potato fields and meadows, were also examined independently. Additionally, the influence of outliers was evaluated by analyzing all unmown meadows (n = 9) and subsequently excluding the outlier from this group (n = 8) for comparative purposes. Like this, the SOC was positively correlated with total N (R = 0.38 ** ÷ 0.97 **) and with SOC stock (R = 0.57 ** ÷ 0.83 *), while SOC stock also showed strong associations with C:N (R = 0.51 ** ÷ 0.83 *) and TN stock (R = 0.50 ** ÷ 0.89 **). Negative correlations were mainly observed in managed and unmanaged agricultural soils, where SOC, N, and C:N were strongly inversely related to BD, CF, and TN stock (R = −0.42 * to −0.75 **). Forest soils showed no significant negative relationships. In potato fields and meadows, SOC, N, and C:N remained tightly coupled (R = 0.91 ** ÷ 0.99 **), with additional positive correlations between BD and CF (R = 0.75 **) and between TN stock and BD (R = 0.91 **). Unmown meadows (n = 9) exhibited the strongest sensitivity to individual values but maintained the same overall structure: very strong SOC–C:N (R = 0.99 **) and SOC–N (R = 0.83 **) correlations, alongside pronounced significant correlation negative relationships between SOC, C:N and BD or TN stock (R = −0.81 ** to −0.84 **).
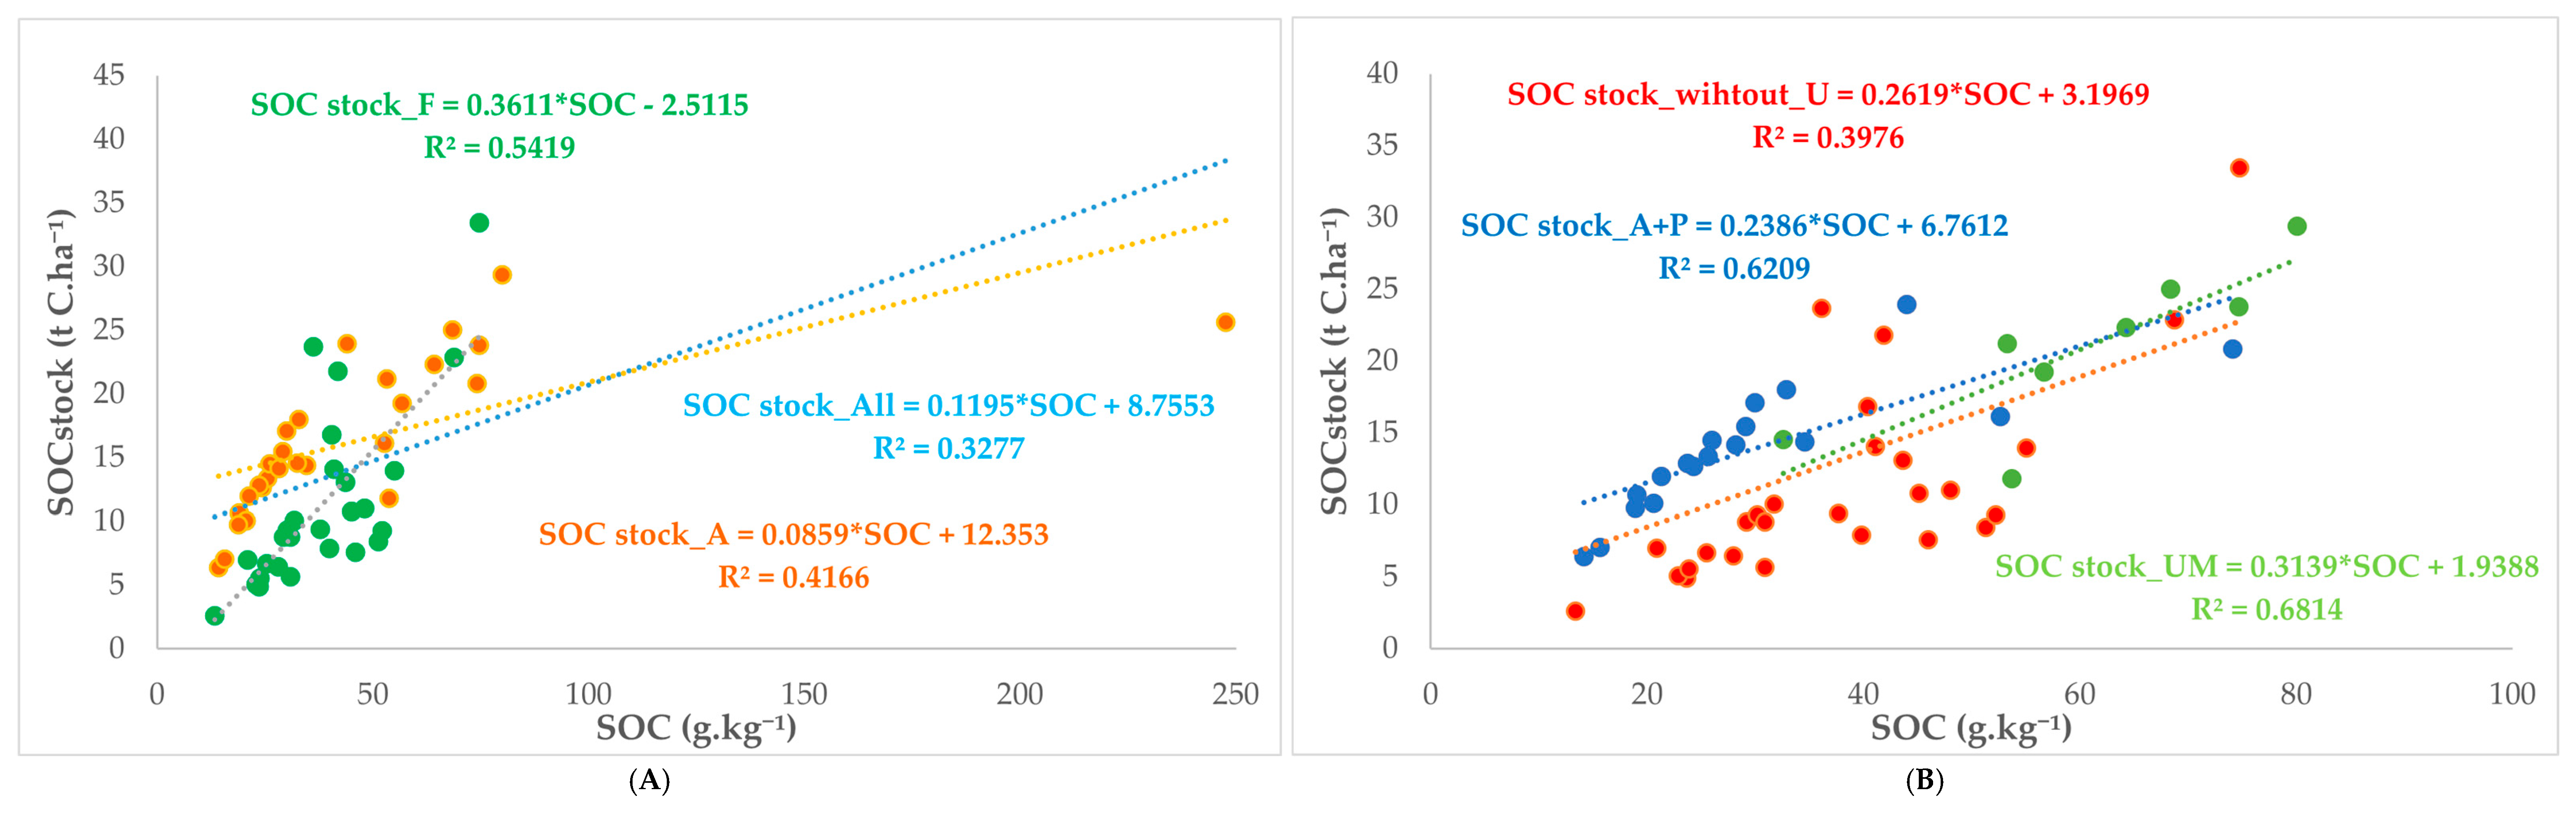
The results of the entire linear regression analysis are presented in Appendix A (see Table A1, Table A2, Table A3, Table A4, Table A5, Table A6 and Table A7). The equations employed for the evaluation of the relationship of SOC stock in the uppermost layer using SOC concentration are presented in Figure 5A,B. The coefficient of determination (r2) is lowest in the linear function involving all sample plots (r2 = 0.33, n = 54). This is followed by the regression involving agricultural areas (r2 = 0.42, n = 27) and forest areas (r2 = 0.54, n = 27). The coefficient of determination is comparatively low in the regression analysis of data for all areas except unmown meadows (r2 = 0.40, n = 45). The most robust prediction is achievable in the function incorporating plots with potatoes and meadows (r2 = 0.62, n = 18) (Figure 5B). Conversely, the correlation coefficient determining the relationship in unmown meadows is statistically insignificant (Table 4), which necessitates the exclusion of the outlier. The regression, which incorporates solely unmown meadows and excludes the outlier, is based on a relatively small sample (r2 = 0.68, n = 8), which makes it less reliable.

4. Discussion

Our study confirmed that land-use change constitutes a significant factor for alteration among various soil parameters in the surface soil layer. From all of the analyzed parameters, only pH values showed no significant difference between the analyzed groups of land use. The study showed that the pH values vary slightly. This could be attributed to natural characteristics of soil acidity predefined by the parent rock. The bedrock in the study area is predominantly composed of silicate-rich metamorphic rocks, which are known to weather slowly, releasing base cations gradually [37]. The active soil acidity ranges from 4.34 to 6.17, which classifies the examined brown forest soils as highly acidic to acidic. This is in line with other studies from the region [38,39] and across the Rila Mountains [40] and Western Rhodopes [21]. In addition to the parental material, the acidity of the soils could also be attributed to litter quality and the legacy of land use in the region. Land-use changes and management practices are known to affect soil properties. However, this study found no significant differences in average pH across the land uses examined, although there is greater variation in pH in arable plots and meadows compared to forest and unmown meadow sites (Figure 2A). This might be due to lasting effects from the long-term legacy of land use—the area was managed as forest for many centuries. Coniferous forests typically create more acidic soil conditions than deciduous forests [41,42]. The higher concentrations of recalcitrant compounds like lignin in coniferous needles [43,44], along with the usually higher C:N ratio in litterfall compared to the deciduous leaf litter [45], favors a slow decay of the organic matter which releases organic acid during decomposition. For the Yundola region, this is confirmed by published data on the concentration of trace elements of the aboveground litterfall, which shows that the C:N ratio in needles and wood fraction is high—60 and 65, respectively [38].
Regarding physical characteristics, both bulk density and coarse fraction exhibited statistically significant differences in mean values across the studied land-use categories (Table 3). Bulk density is divided into five distinct subsets (Figure 2B), where arable fields represent the group with the highest bulk density values, ranging from 1.03 to 1.30 g cm−3. This range exceeds 75% of the observations recorded in meadows and spruce forests and surpasses all values recorded for the remaining land-use types. Spruce plantations constitute a separate subset, with values falling within the lower part of the range observed for meadows. Meadows themselves display considerable internal variability, with bulk density ranging from 0.57 to 1.25 g·cm−3. More than three-quarters of meadow measurements exceed the median value observed for spruce. At their upper end, the meadow values for bulk density closely approach the maximum recorded for unmown meadows and surpass the bulk density values associated with both Scots pine and Silver fir stands. The observed tendency of bulk density being higher in cropland > meadows > woodland is consistent with large-scale studies on bulk density across Europe [46]. The higher bulk density in managed agricultural lands is mainly due to soil compaction related to land-management practices, as well as low input of organic matter compared to forest stands and unmanaged grassland [47,48,49].
Regarding the content of the coarse fragments (>2.0 mm), the analysis identifies three distinct subsets (Figure 2C). Soils beneath Scots pine exhibit the highest skeleton content. A separate subset includes soil under Norway spruce and Silver fir trees, as well as those found in potato fields. Among forest land uses, fir stands demonstrate the lowest coarse fraction content. The third subset comprises meadows and unmown meadows, where the content of coarse fragments is particularly low. The relatively high percentage of the coarse fraction in the forest soils could be attributed to erosion of the fine soil particles on mountain slopes, as most sampling plots are located on inclines of 11–20°. Although potato fields belong to the middle subset, their coarse fragment content is relatively high compared to what is expected for cultivated lands. This is likely a result of deep tillage practices [50] that bring stones to the surface [51], combined with vulnerability to erosion during periods of bare soil exposure in spring and autumn. The low coarse fragment content in grassland soils—both meadows and unmown grasslands—reflects the stabilizing effect of permanent vegetation cover, which prevents fine-earth loss, and the absence of soil disturbance practices.
The SOC content across the studied land-use categories indicates potential losses of SOC attributable to decomposition and erosion processes associated with the prevailing land-use and -management practices in the Yundola area. The analysis of variance (ANOVA) confirmed that land-use type has a statistically significant effect on SOC content in the surface soil layer (0–5 cm). However, the post hoc Duncan test identified only two distinct subsets, separating only the unmown meadows in a single group with the highest SOC values (Figure 3A). All remaining land-use types were grouped into a single subset, with mean SOC values ranging from 27.69 g∙kg−1 dry weight to 46.68 g∙kg−1 dry weight. This observation suggests a relatively limited differentiation in SOC content among the remaining land categories despite differences in management intensity. The SOC content in forest soils ranges from below 20 g∙kg−1 to 50 g∙kg−1 dry weight, which is consistent with large-scale observations for forest soils across Europe, where organic carbon concentrations in the soil of mid-mountain ranges fall between 2% and 5% [52]. Potato fields and meadows exhibit comparable SOC concentrations, although both land-use types record generally lower values than forest plots. This pattern is probably indicative of the combined effect of reduced organic matter inputs and greater susceptibility to SOC losses through tillage and erosion in managed non-forest lands [53].
Considering the link between the C accumulation and soil nitrogen dynamics, the observation of similar patterns of both C and N content in soils is expected. In contrast to SOC content, the Duncan grouping for total nitrogen concentration distinguishes three distinct groups (Figure 3B). The highest nitrogen concentration is observed in unmown meadows and spruce stands. Regarding the unmown meadows, this could be partially explained by the presence of legume cover (Trifolium sp., Lotus sp., Vicia sp.) [54] supporting high biomass productivity and accumulation of organic matter [55] due to the absence of biomass removal. The lowest nitrogen concentration is observed in the agricultural lands—both potato fields and meadows, categorized together in another subset following Duncan’s test. This is attributed to the continuous nutrient export following potato and hay harvest and erosion processes associated with different management practices [56]. This is also confirmed by the results on the C:N ratio which provides insight into organic matter quality and decomposition. The lowest mean ratio (2.73) is observed in potato fields (Figure 3C), suggesting faster turnover and nitrogen mineralization due to application of nitrogen fertilizers [57,58] and tillage practices [59]. The relatively low concentration of nitrogen in meadow sites is associated with nitrogen depletion following frequent mowing [60] combined with the absence of inorganic fertilization. Typically, in Yundola’s region the meadows are not amended with inorganic fertilizers and are mowed once per year which is consistent with general practice across Europe [61].
The nitrogen concentration in soils among the three types of forest stands differ significantly, categorizing them in three distinct groups following Duncan’s test (Figure 3B). This result suggests that the patterns of nitrogen in soil are mainly influenced by species-specific litter input and decomposition processes instead of management practices [62], especially in the absence of pollution sources, as seen in Yundola. The lowest total nitrogen concentration among the forest stands is observed in Scots pine, followed by Spruce and Silver fir, which also reflects the observed nitrogen content in the litterfall of these species [63]. The C:N ratio in forest plots, however, is rather low—the mean is around 4 (Figure 3C)—compared to other studies on brown forest soils across Bulgaria [64,65]. This is mainly attributed to the lower SOC concentration observed in forest soils in the area indicating that the soil is far from its natural equilibrium. The reason could be related to long-lasting anthropogenic activity in the area: active forestry, long-term grazing legacy during the past centuries. Most of the Scots pine stands in the Yundola region have been reforested over the past century, aiming to restore the area’s natural forest cover after the unsustainable forest management in the period before the XX century [66,67].
The combined effects of the SOC and TN concentrations, together with the altered physical properties previously discussed, contribute to a more comprehensive assessment of carbon and nitrogen availability across the studied land-use types. An inherent limitation of the study is its focus on the shallowest soil layer only, which restricts the capacity for a comprehensive topsoil assessment. Referring to the SOC and TN stocks of the uppermost soil layer (0–5 cm), the analysis identified five distinct subsets (Figure 4), reflecting the strong land-use signal [68] which is mainly linked to alterations in the physical properties. The results are consistent with other observations reporting that woodland and grassland soils store more organic carbon compared to arable lands [69,70,71]. Unmown meadows constitute a distinct subset, characterized by the highest SOC stock values in the upper 0–5 cm layer (11.8–29.4 t∙ha−1). This range exceeds more than 75% of the observed values in the subsequent subset, which pertains to Norway spruce stands (Figure 4A). The high SOC stock values recorded in unmown meadows are predominantly attributable to elevated SOC concentrations, given that both bulk density and coarse fragment content are notably low in these plots—factors that would otherwise lead to a dilution of organic carbon stocks. The distribution of SOC stocks in unmown meadows is characterized by the presence of a distinct outlier, reflecting considerable within-group variability (Figure 4A). This is consistent with the spatial heterogeneity inherent to unmanaged grassland ecosystems [72], where the absence of regular mowing and soil disturbance promotes uneven accumulation of organic residues [53]. The contributing factors likely include variability in the distribution of plant biomass, microtopographic differences that create locally distinct moisture and decomposition regimes, and the patchy establishment of leguminous and herbaceous vegetation [73]. Together, these processes generate spatially variable organic matter inputs that are not homogenized by management intervention, resulting in localized patches of particularly high SOC accumulation.
The spruce stands also demonstrate considerable variability in the observed SOC stock in the surface (0–5 cm) soil layer (7.6–33.5 t∙ha−1) (Figure 4A). This is further substantiated by the extensive distribution of the observed coarse fraction and bulk density in the spruce forest plots (Figure 2B,C). The two managed agricultural land-use types (potato fields and meadows) form an intermediate subset, with potato fields showing slightly higher SOC stocks in the uppermost 0–5 cm soil layer (12.6–17.1 t∙ha−1) compared to meadows (9.8–14.5 t∙ha−1), mainly attributed to the higher bulk density (Figure 2B). Silver fir stands constitute a separate group characterized by predominantly low SOC stock levels, with more than three quarters of the values below 11 t ha−1, except for a single plot—22.9 t∙ha−1 (Figure 4A).
The lowest SOC stocks in the surface soil layer (0–5 cm) are observed under Scots pine stands (2.6–9.4 t∙ha−1), forming a distinct subset and highlighting the limited carbon storage in the surface soil layer. The relatively low SOC stocks observed in certain forest plots—particularly those under Silver fir and Scots pine—reflect a combination of historical land degradation, incomplete ecosystem recovery, and inherent site limitations. Historical records from the Yundola region confirm that these areas were subject to intensive deforestation during the XVIII–XIX centuries, primarily to support grazing [66]. The period of unsustainable resource use resulted in severe soil degradation, the effects of which probably persist in the current SOC stocks despite approximately 100 years of forest recovery following the establishment of the forest plantations. It should be noted, however, that the present study is limited to the uppermost 0–5 cm soil layer, which is the primary link between the atmosphere, vegetation, and deeper soil horizons. While this layer is highly responsive to recent land-use and -management changes, it does not capture the full depth of the topsoil, and therefore the long-term legacy effects of historical deforestation and subsequent reforestation on SOC distribution throughout the entire topsoil profile cannot be fully assessed from these data alone. Deeper soil layers may retain distinct imprints of historical land use that are not reflected in surface measurements, and future studies incorporating full topsoil profile sampling would provide a more comprehensive picture of SOC recovery trajectories in the region. Site characteristics further constrain SOC accumulation under Scots pine, as this species is known to colonize and thrive on nutrient-poor, shallow soils with inherently low organic matter content [74]. The pine plantations in the study area received limited silvicultural interventions during their development, meaning stand density was not actively managed to optimize conditions for organic matter accumulation. The observed stand densities in the pine plantations of the sample plots range from 0.7 to 1.0. Furthermore, Scots pine maintains a more open canopy structure compared to Norway spruce and Silver fir, resulting in reduced litterfall and consequently lower annual carbon inputs to the soil surface [75].
The highest TN stocks in the uppermost 0–5 cm soil layer were observed in the cultivated potato fields, where three quarters of the values exceeded those of all other land-use types, except for one spruce plot (7.7 t∙ha−1). The elevated soil nitrogen levels observed in potato fields are attributable to the routine application of inorganic nitrogen fertilizers. Potato is among the most nitrogen-demanding arable crops [76], requiring substantial nitrogen inputs to support optimal vegetative growth and yield [77,78]. However, nitrogen use efficiency in potatoes is known to be low [79,80]. Therefore, a significant fraction of the applied nitrogen is not recovered by the harvested biomass and remains in the soil [79], contributing to elevated total nitrogen concentrations in the surface soil layer. This residual nitrogen, accumulated over repeated growing seasons, is therefore reflected in the soil nitrogen measurements recorded for potato plots in the present study. In addition, the higher TN stock in the surface soil layer is also attributed to the alterations in physical properties due to land management and more specifically the increase in bulk density compared to the other land uses. The observation is also confirmed by the correlation analysis and the strong positive relationship between the bulk density and the TN stock (Table 4).
Meadows and unmown meadows constitute the subsequent two distinct groups in terms of TN stock in the uppermost soil layer. Meadows display broader variability around the median, with the interquartile range spanning 3.9–5.1 t∙ha−1, while unmown meadows exhibit a more compact distribution varied between 3.7 and 4.2 t∙ha−1, punctuated by two notably low outlying values of 1.3 and 2.5 t∙ha−1 (Figure 4B), which likely reflect the spatial heterogeneity in organic matter accumulation discussed previously. Among the forest plots, the spruce stands cluster into a common subset due to similar TN levels to those of unmown meadow. Forest soils under Silver fir and Scots pine form two additional and separate subsets. Silver fir shows higher TN stocks (1.9–4.0 t∙ha−1), with 75% of the values exceeding 75% of those in spruce, whereas Scots pine exhibits the lowest TN stocks (1.4–3.1 t∙ha−1). The differentiation of the forest plots in three distinct groups, combined with the positive correlations between the SOC and TN stocks observed in forest soil (Table 4), underlines the role of the organic inputs—primarily leaf litter and woody debris—in supporting nutrient retention and SOC accumulation.
The observed consistently strong positive relationships between SOC and C:N ratio across land-use types (Table 4) show that the increase in SOC is associated with a change in litter quality and organic matter composition [22,81,82,83]. The content and stability of organic carbon in soils, especially in mountainous areas, is significantly influenced by temperature conditions and the duration of snow cover [84]. Soil moisture and temperature also determine the rate at which organic matter decomposes, although higher temperatures do not always lead to accelerated decomposition [85]. The observed correlation between BD and TN stocks indicates that nitrogen storage is strongly driven by soil compaction and consequent changes in soil porosity. BD is considered an indicator of soil health and structural condition, with lower BD values generally associated with healthier soils that have higher SOC and TN stocks [86]. BD tends to increase with soil depth and is negatively correlated with SOC and TN, suggesting that more compacted soils may have reduced nutrient availability [87,88]. However, our study has limitations in terms of the soil depth at which changes are detected (0–5 cm), which prevent us from confirming these observations within the scope of the current study; however, similar analyses in the region [39,40] and the country [64,89] suggest that this also applies to the soils in the Rila Mountains.
Positive associations of SOC stock with SOC, N, C:N and TN stock are detected within most of the specific groups analyzed (Table 4), indicating that the quantity and quality of organic matter play a key role in the retention of nutrients. Similar positive correlations have also been found by Lacatusu et al. (2024) [90] and Paltineanu et al. (2024) [91]. The full dataset (n = 54, Table 4) reveals that SOC and C:N have negative correlations with BD and CF. The physical structure of organic matter accounts for its influence on soil properties. The association between SOC and BD stems from the comparatively lower density of organic matter, which is considerably lighter than mineral particles such as sand, silt, and clay. As SOC increases, it effectively “dilutes” the mineral content, leading to a reduction in overall bulk density. Additionally, elevated SOC levels enhance soil porosity by promoting the formation of larger aggregates, resulting in a greater number of macropores and air spaces. These changes contribute to a looser, lighter soil texture and further decrease in BD.
The relationship between SOC and CF is logical since sites with high CF content have limited root volume and organic matter accumulation. Conversely, stonier soils tend to be better drained and aerated, accelerating the oxidation of carbon and maintaining low SOC levels [92,93,94]. This suggests that accumulation of organic matter is sensitive to physical disturbance and coarse-textured substrates which limit stabilization potential.
This study shows that SOC stock in the uppermost layer (0–5 cm) is shaped by SOC concentration, nitrogen availability, and soil physical properties, with land-use context determining the strength and direction of these relationships (Figure 5, Table A1, Table A2, Table A3, Table A4, Table A5, Table A6 and Table A7). Regression functions predicting SOC stock from SOC further emphasized these differences. The performance was weakest when all plots were pooled and improved when analyses were restricted to more homogeneous land-use groups, particularly potatoes and meadows (Figure 5B).

5. Conclusions

This study conducted in the Yundola region confirms that soil physical properties and carbon–nitrogen dynamics are strongly governed by the land-use pattern, although the analysis is confined to surface soil processes within the uppermost 0–5 cm layer and does not capture subsurface dynamics. This represents an inherent limitation of the study, as the sampled layer, while highly responsive to recent land-use and -management changes, does not reflect the full topsoil profile. Consequently, the observed patterns in SOC and TN stocks should be interpreted as indicative of surface-layer responses rather than as a comprehensive assessment of total topsoil carbon and nitrogen reserves. Future studies incorporating full topsoil profile sampling—typically to 30 cm depth—are necessary to confirm and extend the present observations, particularly with respect to the long-term legacy effects of historical land use on SOC recovery trajectories.
Soil pH was found to be mainly governed by parent material and long-term land-use legacy, showing limited sensitivity to current management practices. On the contrary, both bulk density and coarse fragment content exhibited strong responses to land-use type, with values reflecting the combined influence of soil disturbances, vegetation cover and erosion processes. Arable soils recorded the highest bulk density, consistent with compaction associated with tillage and lower organic matter inputs, while unmown meadows and forest soils generally displayed more favorable physical conditions. These structural differences influenced SOC and TN stocks, emphasizing the central role of soil physical properties in regulating surface nutrient storage.
Unmown meadows were identified as the most effective land use for SOC accumulation in the surface layer, combining elevated SOC concentrations with low bulk density and minimal coarse fragment content in the uppermost (0–5 cm) soil layer. Forest soils exhibited strong species-specific patterns, with Scots pine and Silver fir displaying lower SOC and TN stocks due to site limitations, historical degradation, and litter input differences. The extent to which these patterns extend beyond the 0–5 cm layer remains an open question that merits targeted investigations. The managed agricultural lands showed intermediate SOC stocks but elevated TN stocks, driven partially by organic and inorganic nitrogen fertilization and its associated residual soil nitrogen, with bulk density emerging as an important mediating factor.
The findings show that management practices which limit soil disturbance and maintain a permanent vegetation cover, like the conservation or restoration of unmanaged grasslands, offer favorable conditions for improving soil carbon storage in mountainous regions such as Yundola. In land-use contexts characterized by strong historical legacies and susceptibility to erosion, physical soil indicators should be systematically integrated into land-use planning, carbon accounting frameworks, and ecosystem restoration strategies. Nevertheless, the generation of robust policy recommendations and reliable carbon stock estimates will necessitate further research. Such studies should aim to resolve the full topsoil depth, thereby facilitating a more comprehensive understanding of how land use influences carbon and nitrogen dynamics across the entire rooting zone.

Author Contributions

Conceptualization, L.S. and E.T.; methodology, E.T.; formal analysis, E.T., L.S.; writing—original draft preparation, L.S. and E.T.; writing—review and editing, L.S. and E.T.; visualization, L.S. and E.T.; funding acquisition, L.S. All authors have read and agreed to the published version of the manuscript.

Funding

This research was funded by Bulgarian National Science Fund under the project KΠ-06-KOCT/21 (13.08.2024).

Data Availability Statement

The dataset is available upon request.

Conflicts of Interest

The authors declare no conflicts of interest.

Abbreviations

The following abbreviations are used in this manuscript:
BDBulk density
CFCoarse fraction
SOCSoil organic carbon
SOC stockSoil organic carbon stock
SPSample plot
TNTotal nitrogen
TN stockTotal nitrogen stock

Appendix A

Table A1. Regression equations derived from the whole dataset; n = 54 (all studied plots).
Y = a ∗ x + b r2
SOC = 9.7334 ∗ N − 60.24670.14
SOC = 12.0854 ∗ C/N − 5.11290.98
SOC = −42.0013 ∗ BD + 76.18660.15
SOC = −1.9374 ∗ CF + 61.20190.12
SOC = 2.743 ∗ SOC stock + 4.60780.33
N = 0.0146 ∗ SOC + 9.94040.14
N = 0.0846 ∗ SOC stock + 9.39240.21
C/N = 0.0809 ∗ SOC + 0.50360.98
C/N = −3.6522 ∗ BD + 6.86860.16
C/N = −0.1565 ∗ CF + 5.45100.12
C/N = 0.2116 ∗ SOC stock + 1.01650.29
C/N = −0.5649 ∗ TN stock + 6.0950.09
BD = −0.0035 ∗ SOC + 0.94770.15
BD = −0.045 ∗ C/N + 0.97790.16
BD = 0.0131 ∗ SOC stock + 0.61840.09
BD = 0.1955 ∗ TN stock + 0.05660.88
CF = −0.0644 ∗ SOC + 12.35870.12
CF = −0.7783 ∗ C/N + 12.68620.12
CF = −0.391 ∗ SOC stock + 15.02720.20
SOC stock = 2.4502 ∗ N − 12.04250.21
SOC stock = 1.3777 ∗ C/N + 8.40480.29
SOC stock = 6.9409 ∗ BD + 8.28610.09
SOC stock = −0.5119 ∗ CF + 18.76340.20
SOC stock = 2.362 ∗ TN stock + 4.85460.24
TN stock = −0.1612 ∗ C/N + 4.44070.09
TN stock = 4.5269 ∗ BD + 0.18170.88
TN stock = 0.1036 ∗ SOC stock + 2.3710.24
Table A2. Regression equations derived from the whole dataset without the outlier; n = 53.
Y = a ∗ x + b r2
SOC = 6.1763 ∗ N − 26.35540.21
SOC = 11.1905 ∗ C/N − 1.97660.92
SOC = −17.6612 ∗ BD + 53.03650.09
SOC = −0.9531 ∗ CF + 48.04220.11
SOC = 1.8834 ∗ SOC stock + 13.05530.54
N = 0.0335 ∗ SOC + 9.23660.21
N = 0.0817 ∗ SOC stock + 9.42080.19
C/N = 0.0825 ∗ SOC + 0.44150.92
C/N = −1.7218 ∗ BD + 5.03260.11
C/N = −0.0776 ∗ CF + 4.39580.10
C/N = 0.1422 ∗ SOC stock + 1.69910.42
BD = −0.005 ∗ SOC + 1.00530.09
BD = −0.0662 ∗ C/N + 1.05220.11
BD = 0.0169 ∗ SOC stock + 0.58180.15
BD = 0.1931 ∗ TN stock + 0.06740.88
CF = −0.1121 ∗ SOC + 14.13500.11
CF = −1.2379 ∗ C/N + 14.29710.10
CF = −0.3661 ∗ SOC stock + 14.78220.17
CF = −1.1626 ∗ TN stock + 14.27560.08
SOC stock = 0.2878 ∗ SOC + 2.47760.54
SOC stock = 2.3018 ∗ N − 10.62840.19
SOC stock = 2.9467 ∗ C/N + 2.90620.42
SOC stock = 9.0888 ∗ BD + 6.24320.15
SOC stock = −0.4758 ∗ CF + 18.27950.17
SOC stock = 2.8009 ∗ TN stock + 2.82800.34
TN stock = 4.5455 ∗ BD + 0.16400.88
TN stock = −0.066 ∗ CF + 4.49900.08
TN stock = 0.1223 ∗ SOC stock + 2.18670.34
Table A3. Regression equations derived from all studied plots except unmown meadows; n = 45.
Y = a ∗ x + b r2
SOC = 4.4198 ∗ N − 11.19190.16
SOC = 10.5259 ∗ C/N − 0.19400.89
SOC = 1.518 ∗ SOC stock + 16.13350.40
N = 0.0364 ∗ SOC + 9.14460.16
N = 0.0835 ∗ SOC stock + 9.3850.15
C/N = 0.0843 ∗ SOC + 0.39240.89
C/N = −1.3686 ∗ BD + 4.46050.10
C/N = 0.1097 ∗ SOC stock + 1.97680.26
BD = −0.0748 ∗ C/N + 1.07640.10
BD = 0.0271 ∗ SOC stock + 0.49360.29
BD = 0.1938 ∗ TN stock + 0.08290.90
CF = −1.1109 ∗ TN stock + 15.27230.09
SOC stock = 1.7479 ∗ N − 5.88240.15
SOC stock = 2.3635 ∗ C/N + 4.45490.26
SOC stock = 10.6800 ∗ BD + 3.48430.29
SOC stock = 2.7292 ∗ TN stock + 1.83820.45
TN stock = 4.6298 ∗ BD + 0.01030.90
TN stock = −0.0835 ∗ CF + 4.75970.09
TN stock = 0.1654 ∗ SOC stock + 1.80350.45
Table A4. Regression equations derived from forest plots only; n = 27.
Y = a ∗ x + b r2
SOC = 9.4496 ∗ C/N + 4.06870.82
SOC = 1.5007 ∗ SOC stock + 21.29520.54
N = 0.6163 ∗ TN stock + 8.75620.32
C/N = 0.0869 ∗ SOC + 0.29300.82
C/N = 0.1052 ∗ SOC stock + 2.42880.29
BD = 0.0279 ∗ SOC stock + 0.35070.57
BD = 0.1656 ∗ TN stock + 0.14790.88
SOC stock = 2.7523 ∗ C/N + 1.34470.29
SOC stock = 20.3413 ∗ BD − 2.25220.57
SOC stock = 3.7975 ∗ TN stock − 0.58340.64
TN stock = 0.5268 ∗ N − 2.49920.32
TN stock = 5.3391 ∗ BD − 0.42780.88
TN stock = 0.1681 ∗ SOC stock + 1.23040.64
Table A5. Regression equations derived from agricultural plots only; n = 27.
Y = a ∗ x + b r2
SOC = −118.0884 ∗ BD + 157.21540.56
SOC = −30.2093 ∗ TN stock + 182.20530.54
SOC = −3.9706 ∗ CF + 69.19380.18
SOC = 4.8514 ∗ SOC stock − 32.57400.42
SOC = 36.0066 ∗ N − 329.09160.52
SOC = 12.4486 ∗ C/N − 6.31070.99
N = −2.2775 ∗ BD + 12.56980.52
N = −0.4336 ∗ TN stock + 12.38410.27
N = −0.0909 ∗ CF + 10.95280.23
N = 0.0146 ∗ SOC + 9.75940.52
N = 0.1812 ∗ C/N + 9.66750.52
N = 0.1342 ∗ SOC stock + 8.24370.79
C/N = −9.4860 ∗ BD + 13.13610.56
C/N = −2.4267 ∗ TN stock + 15.14350.54
C/N = −0.3190 ∗ CF + 6.06530.18
C/N = 0.3897 ∗ SOC stock − 2.10970.42
C/N = 2.8924 ∗ N − 25.92900.52
C/N = 0.0803 ∗ SOC + 0.50690.99
BD = −0.0593 ∗ C/N + 1.18750.56
BD = −0.0048 ∗ SOC + 1.15750.56
BD = −0.2271 ∗ N + 3.30530.52
BD = −0.0222 ∗ SOC stock + 1.29770.22
BD = 0.0420 ∗ CF + 0.69830.50
BD = 0.2480 ∗ TN stock − 0.17640.90
CF = −2.5646 ∗ N + 32.39680.23
CF = −0.0453 ∗ SOC + 7.74030.18
CF = −0.5637 ∗ C/N + 8.02600.18
CF = 2.3694 ∗ TN stock − 4.99620.29
CF = 11.8839 ∗ BD − 5.48560.50
SOC stock = −9.7414 ∗ BD + 25.48080.22
SOC stock = 1.0690 ∗ C/N + 11.81120.42
SOC stock = 5.8754 ∗ N − 44.97110.79
TN stock = −0.2211 ∗ C/N + 5.42410.54
TN stock = −0.0178 ∗ SOC + 5.31210.54
TN stock = −0.6304 ∗ N + 11.06220.27
TN stock = 0.1222 ∗ CF + 3.79310.29
TN stock = 3.6161 ∗ BD + 1.10080.90
Table A6. Regression equations derived from arable plots only (potato and meadows); n = 18.
Y = a ∗ x + b r2
SOC = −43.4513 ∗ BD + 76.15870.39
SOC = 2.6026 ∗ SOC stock − 6.33570.62
SOC = 18.008 ∗ N − 150.51660.83
SOC = 12.4486 ∗ C/N − 6.31070.99
N = 0.1518 ∗ SOC stock + 7.90560.83
N = 0.046 ∗ SOC + 8.64160.83
N = 0.5726 ∗ C/N + 8.35130.83
C/N = −3.4904 ∗ BD + 6.62480.39
C/N = 0.2091 ∗ SOC stock − 0.0020.62
C/N = 1.4466 ∗ N − 11.58410.83
C/N = 0.0803 ∗ SOC + 0.50690.99
BD = −0.0091 ∗ SOC + 1.3390.39
BD = −0.1131 ∗ C/N + 1.39640.39
BD = 0.0325 ∗ CF + 0.83820.57
BD = 0.2362 ∗ TN stock − 0.09040.83
CF = 3.2219 ∗ TN stock − 8.71950.29
CF = 17.3921 ∗ BD − 11.49940.57
SOC stock = 2.97 ∗ C/N + 5.25560.62
SOC stock = 5.4484 ∗ N − 40.67840.83
TN stock = 0.0891 ∗ CF + 4.27550.29
TN stock = 3.4932 ∗ BD + 1.17350.83
Table A7. Regression equations derived from unmown meadow plots only; n = 9.
Y = a ∗ x + b r2
SOC = −253.0788 ∗ BD + 249.41350.70
SOC = −47.6001 ∗ TN stock + 253.67490.66
SOC = 116.9218 ∗ N − 1241.25880.68
SOC = 12.446 ∗ C/N − 6.29380.99
N = −1.6352 ∗ BD + 12.39760.58
N = −0.2777 ∗ TN stock + 12.3170.45
N = 0.0574 ∗ SOC stock + 10.08070.49
N = 0.0058 ∗ SOC + 10.83810.68
N = 0.0725 ∗ C/N + 10.80140.68
C/N = −20.3334 ∗ BD + 20.54490.70
C/N = −3.8242 ∗ TN stock + 20.88640.66
C/N = 9.3954 ∗ N − 99.23760.68
C/N = 0.0803 ∗ SOC + 0.50570.99
BD = −0.0028 ∗ SOC + 0.88830.70
BD = −0.0343 ∗ C/N + 0.90560.70
BD = −0.3575 ∗ N + 4.70830.58
BD = 0.1909 ∗ TN stock − 0.02690.97
SOC stock = 8.6176 ∗ N − 76.03380.49
TN stock = −0.0138 ∗ SOC + 4.74480.66
TN stock = −0.1719 ∗ C/N + 4.83170.66
TN stock = −1.6188 ∗ N + 21.93230.45
TN stock = 5.0888 ∗ BD + 0.2410.97

References

  1. Smith, P.; Cotrufo, M.F.; Rumpel, C.; Paustian, K.; Kuikman, P.J.; Elliott, J.A.; McDowell, R.; Griffiths, R.I.; Asakawa, S.; Bustamante, M.; et al. Biogeochemical Cycles and Biodiversity as Key Drivers of Ecosystem Services Provided by Soils. SOIL 2015, 1, 665–685. [Google Scholar] [CrossRef]
  2. Wiesmeier, M.; Urbanski, L.; Hobley, E.; Lang, B.; von Lützow, M.; Marin-Spiotta, E.; van Wesemael, B.; Rabot, E.; Ließ, M.; Garcia-Franco, N.; et al. Soil Organic Carbon Storage as a Key Function of Soils—A Review of Drivers and Indicators at Various Scales. Geoderma 2019, 333, 149–162. [Google Scholar] [CrossRef]
  3. Pereira, P.; Bogunovic, I.; Muñoz-Rojas, M.; Brevik, E.C. Soil Ecosystem Services, Sustainability, Valuation and Management. Curr. Opin. Environ. Sci. Health 2018, 5, 7–13. [Google Scholar] [CrossRef]
  4. Hagedorn, F.; Mulder, J.; Jandl, R. Mountain Soils under a Changing Climate and Land-Use. Biogeochemistry 2010, 97, 1–5. [Google Scholar] [CrossRef]
  5. Egli, M.; Poulenard, J. Soils of Mountainous Landscapes. In International Encyclopedia of Geography; Wiley: Hoboken, NJ, USA, 2016; pp. 1–10. [Google Scholar]
  6. Singh, R.; Gupta, I.; Raina, R.; Mahajan, P.; Srivastava, P.; Singh, V.K.; Batish, D.R. Mountain Soils and Climate Change: Importance, Threats and Mitigation Measures. In Understanding Soils of Mountainous Landscapes; Elsevier: Amsterdam, The Netherlands, 2023; pp. 3–21. [Google Scholar]
  7. Guo, L.B.; Gifford, R.M. Soil Carbon Stocks and Land Use Change: A Meta Analysis. Glob. Change Biol. 2002, 8, 345–360. [Google Scholar] [CrossRef]
  8. Murty, D.; Kirschbaum, M.U.F.; Mcmurtrie, R.E.; Mcgilvray, H. Does Conversion of Forest to Agricultural Land Change Soil Carbon and Nitrogen? A Review of the Literature. Glob. Change Biol. 2002, 8, 105–123. [Google Scholar] [CrossRef]
  9. Smith, P.; House, J.I.; Bustamante, M.; Sobocká, J.; Harper, R.; Pan, G.; West, P.C.; Clark, J.M.; Adhya, T.; Rumpel, C.; et al. Global Change Pressures on Soils from Land Use and Management. Glob. Change Biol. 2016, 22, 1008–1028. [Google Scholar] [CrossRef]
  10. Borrelli, P.; Robinson, D.A.; Fleischer, L.R.; Lugato, E.; Ballabio, C.; Alewell, C.; Meusburger, K.; Modugno, S.; Schütt, B.; Ferro, V.; et al. An Assessment of the Global Impact of 21st Century Land Use Change on Soil Erosion. Nat. Commun. 2017, 8, 2013. [Google Scholar] [CrossRef] [PubMed]
  11. Singh, R. Impact of Climate and Land Use Land Cover Changes on Soil Erosion. In Soil and Water Conservation Structures Design; Springer Nature: Singapore, 2023; pp. 415–441. [Google Scholar]
  12. Nesa, M.M.; Propa, S.M.; Sen, S.; Abdullah, H.M. Land Use Change and Soil Erosion: Challenges and Way Forward to Management. In Climate Change and Soil-Water-Plant Nexus; Springer Nature: Singapore, 2024; pp. 547–571. [Google Scholar]
  13. Dengiz, O. Potential Impact of Land Use Change on Land Productivity Dynamics with Focus on Land Degradation in a Sub-Humid Terrestrial Ecosystem. Theor. Appl. Climatol. 2018, 133, 73–88. [Google Scholar] [CrossRef]
  14. Smith, P. Soil Organic Carbon Dynamics and Land-Use Change. In Land Use and Soil Resources; Springer: Dordrecht, The Netherlands, 2008; pp. 9–22. [Google Scholar]
  15. Ramesh, T.; Bolan, N.S.; Kirkham, M.B.; Wijesekara, H.; Kanchikerimath, M.; Srinivasa Rao, C.; Sandeep, S.; Rinklebe, J.; Ok, Y.S.; Choudhury, B.U.; et al. Soil Organic Carbon Dynamics: Impact of Land Use Changes and Management Practices: A Review. In Advances in Agronomy; Elsevier: Amsterdam, The Netherlands, 2019; pp. 1–107. [Google Scholar]
  16. Batjes, N.H. Total Carbon and Nitrogen in the Soils of the World. Eur. J. Soil Sci. 1996, 47, 151–163. [Google Scholar] [CrossRef]
  17. Scharlemann, J.P.; Tanner, E.V.; Hiederer, R.; Kapos, V. Global Soil Carbon: Understanding and Managing the Largest Terrestrial Carbon Pool. Carbon Manag. 2014, 5, 81–91. [Google Scholar] [CrossRef]
  18. Beillouin, D.; Corbeels, M.; Demenois, J.; Berre, D.; Boyer, A.; Fallot, A.; Feder, F.; Cardinael, R. A Global Meta-Analysis of Soil Organic Carbon in the Anthropocene. Nat. Commun. 2023, 14, 3700. [Google Scholar] [CrossRef]
  19. Lal, R. Soil Carbon Sequestration Impacts on Global Climate Change and Food Security. Science 2004, 304, 1623–1627. [Google Scholar] [CrossRef] [PubMed]
  20. Seeber, J.; Tasser, E.; Rubatscher, D.; Loacker, I.; Lavorel, S.; Robson, T.M.; Balzarolo, M.; Altimir, N.; Drösler, M.; Vescovo, L.; et al. Effects of Land Use and Climate on Carbon and Nitrogen Pool Partitioning in European Mountain Grasslands. Sci. Total Environ. 2022, 822, 153380. [Google Scholar] [CrossRef] [PubMed]
  21. Zhiyanski, M.; Glushkova, M.; Ferezliev, A.; Menichetti, L.; Leifeld, J. Carbon Storage and Soil Property Changes Following Afforestation in Mountain Ecosystems of the Western Rhodopes, Bulgaria. IForest 2016, 9, 626–634. [Google Scholar] [CrossRef]
  22. Bojko, O.; Kabala, C. Organic Carbon Pools in Mountain Soils—Sources of Variability and Predicted Changes in Relation to Climate and Land Use Changes. Catena 2017, 149, 209–220. [Google Scholar] [CrossRef]
  23. Gao, J.; Tang, X.; Lin, S.; Bian, H. The Influence of Land Use Change on Key Ecosystem Services and Their Relationships in a Mountain Region from Past to Future (1995–2050). Forests 2021, 12, 616. [Google Scholar] [CrossRef]
  24. Govers, G.; Merckx, R.; Van Oost, K.; van Wesemael, B. Soil Organic Carbon Management for Global Benefits: A Discussion Paper 2013. Presented at the Workshop ‘Soil Organic Carbon Benefits: A Scoping Study’, Nairobi, Kenya, 10–12 September 2012; pp. 1–53. [Google Scholar]
  25. Penkov, M.; Donov, V.; Boyadjiev, T.; Andonov, T.; Ninov, N.; Jolevski, M.; Antonov, G.; Gencheva, S. Classification and Diagnostic of Soil in Bulgaria in Connection with Land Division; Zemizdat: Sofia, Bulgaria, 1992. [Google Scholar]
  26. Malinova, L.; Petrova, K. Petrohan Training and Experimental Forest Range Cambisols Classification. For. Ideas 2019, 25, 147–160. [Google Scholar]
  27. Bogdanov, S.; Baubekova, G.; Daribayeva, S.; Tauakelov; Grigorova-Pesheva, B. Study of Soils in Mountain Ecosystems in Yundola, Bulgaria. Ecol. Balk. 2024, 16, 140–148. [Google Scholar]
  28. He, X.; Shi, F.; Xu, T.; Song, F. Variations in Soil Organic Carbon Pool Structure in the Humus Layer Influenced by Soil Nutrient Stoichiometry under Nitrogen Addition Treatments: Evidence from a Temperate Korean Pine Plantation in Northeast China. For. Ecol. Manag. 2025, 585, 122687. [Google Scholar] [CrossRef]
  29. Kurganova, I.N.; Telesnina, V.M.; Lopes de Gerenyu, V.O.; Lichko, V.I.; Ovsepyan, L.A. Changes in the Carbon Stocks, Microbial and Enzyme Activities of Retic Albic Podzol in Southern Taiga during Postagrogenic Evolution. Eurasian Soil Sci. 2022, 55, 895–910. [Google Scholar] [CrossRef]
  30. Addesso, R.; Araniti, F.; Bloise, A.; Mininni, A.N.; Dichio, B.; López-González, D.; Elshafie, H.S.; Ellerbrock, R.H.; Schnee, L.S.; Filser, J.; et al. Soil Organic Matter Quality in an Olive Orchard Differently Managed for 21 Years: Insights into Its Distribution through Soil Aggregates and Depth. Agric. Ecosyst. Environ. 2025, 380, 109388. [Google Scholar] [CrossRef]
  31. Cools, N.; De Vos, B. Forest Soil. In Developments in Environmental Science; Elsevier: Amsterdam, The Netherlands, 2013; pp. 267–300. [Google Scholar]
  32. Kachinsky, N. Soil Physics; High School: Moscow, ID, USA, 1965. [Google Scholar]
  33. ISO 11465:1993; Soil Quality—Determination of Dry Matter and Water Content on a Mass Basis—Gravimetric Method. ISO: Geneva, Switzerland, 1993.
  34. ISO 10390:1994; Soil Quality—Determination of pH. ISO: Geneva, Switzerland, 1994.
  35. Penman, J. Good Practice Guidance for Land Use, Land-Use Change and Forestry; Institute for Global Environmental Strategies for the IPCC: Hayama, Japan, 2003; ISBN 4887880030. [Google Scholar]
  36. Ellert, B.H.; Bettany, J.R. Calculation of Organic Matter and Nutrients Stored in Soils under Contrasting Management Regimes. Can. J. Soil Sci. 1995, 75, 529–538. [Google Scholar] [CrossRef]
  37. Ramos, C.G.; Hower, J.C.; Blanco, E.; Oliveira, M.L.S.; Theodoro, S.H. Possibilities of Using Silicate Rock Powder: An Overview. Geosci. Front. 2022, 13, 101185. [Google Scholar] [CrossRef]
  38. Malinova, L.; Petrova, K.; Grigorova-Pesheva, B. Assessment of Soil and Litter Parameters in Yundola Stationary Sample Plot for Intensive Monitoring of Forest Ecosystems. For. Ideas 2021, 27, 145–156. [Google Scholar]
  39. Kirova, L. Carbon Content and Stock in Soils under Intensively Managed Pastures in Rila. For. Sci. 2024, 2, 39–50. [Google Scholar]
  40. Stoeva, L.; Zhiyanski, M. Comparative Assessment of SoilGrids System with Regional Soil Data for Advancing Ecosystem Reporting in Bulgaria. One Ecosyst. 2024, 9, e133091. [Google Scholar] [CrossRef]
  41. Zhang, Y.; Zhou, J.; Chen, H. Global Trajectories of Forest Soil Acidification: A Scientometric Synthesis of Drivers, Impacts and Sustainable Solutions. Forests 2025, 16, 733. [Google Scholar] [CrossRef]
  42. Abdullah, H.; Skidmore, A.K.; Siegenthaler, A.; Neinavaz, E. High-Resolution Prediction of Soil PH in European Temperate Forests Using Sentinel-2 and Ancillary Environmental Data. Sci. Rep. 2025, 15, 28509. [Google Scholar] [CrossRef] [PubMed]
  43. Klavins, L.; Almonaitytė, K.; Šalaševičienė, A.; Zommere, A.; Spalvis, K.; Vincevica-Gaile, Z.; Korpinen, R.; Klavins, M. Strategy of Coniferous Needle Biorefinery into Value-Added Products to Implement Circular Bioeconomy Concepts in Forestry Side Stream Utilization. Molecules 2023, 28, 7085. [Google Scholar] [CrossRef]
  44. Popescu (Stegarus), D.; Frum, A.; Dobrea, C.; Cristea, R.; Gligor, F.; Vicas, L.; Ionete, R.; Sutan, N.; Georgescu, C. Comparative Antioxidant and Antimicrobial Activities of Several Conifer Needles and Bark Extracts. Pharmaceutics 2023, 16, 52. [Google Scholar] [CrossRef]
  45. Kavvadias, V.A.; Alifragis, D.; Tsiontsis, A.; Brofas, G.; Stamatelos, G. Litterfall, Litter Accumulation and Litter Decomposition Rates in Four Forest Ecosystems in Northern Greece. For. Ecol. Manag. 2001, 144, 113–127. [Google Scholar] [CrossRef]
  46. Panagos, P.; De Rosa, D.; Liakos, L.; Labouyrie, M.; Borrelli, P.; Ballabio, C. Soil Bulk Density Assessment in Europe. Agric. Ecosyst. Environ. 2024, 364, 108907. [Google Scholar] [CrossRef]
  47. Hamza, M.A.; Anderson, W.K. Soil Compaction in Cropping Systems. Soil Tillage Res. 2005, 82, 121–145. [Google Scholar] [CrossRef]
  48. Yang, P.; Dong, W.; Heinen, M.; Qin, W.; Oenema, O. Soil Compaction Prevention, Amelioration and Alleviation Measures Are Effective in Mechanized and Smallholder Agriculture: A Meta-Analysis. Land 2022, 11, 645. [Google Scholar] [CrossRef]
  49. Botta, G.F.; Nardon, G.F.; Guirado Clavijo, R. Soil Sustainability: Analysis of the Soil Compaction under Heavy Agricultural Machinery Traffic in Extensive Crops. Agronomy 2022, 12, 282. [Google Scholar] [CrossRef]
  50. Maas, A.; Fuller, K.B.; Hatzenbuehler, P.; McIntosh, C. An Exploration of Preferences for Soil Health Practices in Potato Production. Farming Syst. 2023, 1, 100054. [Google Scholar] [CrossRef]
  51. Poesen, J.; Lavee, H. Rock Fragments in Top Soils: Significance and Processes. Catena 1994, 23, 1–28. [Google Scholar] [CrossRef]
  52. Baritz, R.; Seufert, G.; Montanarella, L.; Van Ranst, E. Carbon Concentrations and Stocks in Forest Soils of Europe. For. Ecol. Manag. 2010, 260, 262–277. [Google Scholar] [CrossRef]
  53. Geisseler, D.; Lazicki, P.A.; Scow, K.M. Mineral Nitrogen Input Decreases Microbial Biomass in Soils under Grasslands but Not Annual Crops. Appl. Soil Ecol. 2016, 106, 1–10. [Google Scholar] [CrossRef]
  54. Dimitrov, M. Classification of Vegetation in Yundola Experimental Forest Range; University of Forestry: Sofia, Bulgaria, 2022. [Google Scholar]
  55. Fornara, D.A.; Tilman, D. Plant Functional Composition Influences Rates of Soil Carbon and Nitrogen Accumulation. J. Ecol. 2008, 96, 314–322. [Google Scholar] [CrossRef]
  56. Livsey, J.; Alavaisha, E.; Tumbo, M.; Lyon, S.W.; Canale, A.; Cecotti, M.; Lindborg, R.; Manzoni, S. Soil Carbon, Nitrogen and Phosphorus Contents along a Gradient of Agricultural Intensity in the Kilombero Valley, Tanzania. Land 2020, 9, 121. [Google Scholar] [CrossRef]
  57. Wang, R.; Hu, Y.; Wang, Y.; Ali, S.; Liu, Q.; Guo, S. Nitrogen Application Increases Soil Respiration but Decreases Temperature Sensitivity: Combined Effects of Crop and Soil Properties in a Semiarid Agroecosystem. Geoderma 2019, 353, 320–330. [Google Scholar] [CrossRef]
  58. Kuśmierz, S.; Skowrońska, M.; Tkaczyk, P.; Lipiński, W.; Mielniczuk, J. Soil Organic Carbon and Mineral Nitrogen Contents in Soils as Affected by Their PH, Texture and Fertilization. Agronomy 2023, 13, 267. [Google Scholar] [CrossRef]
  59. Haddaway, N.R.; Hedlund, K.; Jackson, L.E.; Kätterer, T.; Lugato, E.; Thomsen, I.K.; Jørgensen, H.B.; Isberg, P.-E. How Does Tillage Intensity Affect Soil Organic Carbon? A Systematic Review. Environ. Evid. 2017, 6, 30. [Google Scholar] [CrossRef]
  60. Eriksen-Hamel, N.S.; Whalen, J.K. Fertilization and Mowing Effects on Unimproved Mixed-Species Hayfields in Quebec, Canada. Crop Sci. 2006, 46, 1955–1962. [Google Scholar] [CrossRef]
  61. Tälle, M.; Deák, B.; Poschlod, P.; Valkó, O.; Westerberg, L.; Milberg, P. Grazing vs. Mowing: A Meta-Analysis of Biodiversity Benefits for Grassland Management. Agric. Ecosyst. Environ. 2016, 222, 200–212. [Google Scholar] [CrossRef]
  62. Cools, N.; Vesterdal, L.; De Vos, B.; Vanguelova, E.; Hansen, K. Tree Species Is the Major Factor Explaining C:N Ratios in European Forest Soils. For. Ecol. Manag. 2014, 311, 3–16. [Google Scholar] [CrossRef]
  63. Vesterdal, L.; Schmidt, I.K.; Callesen, I.; Nilsson, L.O.; Gundersen, P. Carbon and Nitrogen in Forest Floor and Mineral Soil under Six Common European Tree Species. For. Ecol. Manag. 2008, 255, 35–48. [Google Scholar] [CrossRef]
  64. Kirova, L. Soils after Forestry Management Activities in Spruce Plantations. Silva Balc. 2024, 25, 37–60. [Google Scholar] [CrossRef]
  65. Hristov, B. Forest Soils of Bulgaria—Distribution, Properties and Usage. Balk. Ecol. 2023, 26, 245–256. [Google Scholar]
  66. Vachovski, H.; Dimitrov, S. Forest and Forest Management in Bulgaria During XX Century; Ministry of Agriculture and Forest: Sofia, Bulgaria, 2003.
  67. Kolev, N. The University Forest, Yundola Educational and Experimental Forestry; Tempora: Sofia, Bulgaria, 2007. [Google Scholar]
  68. Poeplau, C.; Don, A.; Vesterdal, L.; Leifeld, J.; Van Wesemael, B.; Schumacher, J.; Gensior, A. Temporal Dynamics of Soil Organic Carbon after Land-Use Change in the Temperate Zone—Carbon Response Functions as a Model Approach. Glob. Change Biol. 2011, 17, 2415–2427. [Google Scholar] [CrossRef]
  69. Saby, N.P.A.; Arrouays, D.; Antoni, V.; Lemercier, B.; Follain, S.; Walter, C.; Schvartz, C. Changes in Soil Organic Carbon in a Mountainous French Region, 1990–2004. Soil Use Manag. 2008, 24, 254–262. [Google Scholar] [CrossRef]
  70. Yu, H.; Song, W. Research Progress on the Impact of Land Use Change on Soil Carbon Sequestration. Land 2023, 12, 213. [Google Scholar] [CrossRef]
  71. De Rosa, D.; Ballabio, C.; Lugato, E.; Fasiolo, M.; Jones, A.; Panagos, P. Soil Organic Carbon Stocks in European Croplands and Grasslands: How Much Have We Lost in the Past Decade? Glob. Change Biol. 2024, 30, e16992. [Google Scholar] [CrossRef] [PubMed]
  72. Adler, P.; Raff, D.; Lauenroth, W. The Effect of Grazing on the Spatial Heterogeneity of Vegetation. Oecologia 2001, 128, 465–479. [Google Scholar] [CrossRef] [PubMed]
  73. Good, M.K.; Schultz, N.L.; Tighe, M.; Reid, N.; Briggs, S.V. Herbaceous Vegetation Response to Grazing Exclusion in Patches and Inter-Patches in Semi-Arid Pasture and Woody Encroachment. Agric. Ecosyst. Environ. 2013, 179, 125–132. [Google Scholar] [CrossRef]
  74. Houston Durrant, T.; de Rigo, D.; Caudullo, G. Pinus Sylvestris in Europe: Distribution, Habitat, Usage and Threats. In European Atlas of Forest Tree Species; San-Miguel-Ayanz, J., de Rigo, D., Caudullo, G., Houston Durrant, T., Mauri, A., Eds.; Publications Office of the EU: Luxembourg, 2016; pp. 132–133. [Google Scholar]
  75. Vesterdal, L.; Clarke, N.; Sigurdsson, B.D.; Gundersen, P. Do Tree Species Influence Soil Carbon Stocks in Temperate and Boreal Forests? For. Ecol. Manag. 2013, 309, 4–18. [Google Scholar] [CrossRef]
  76. Vos, J. Potato. In Crop Yield; Springer: Berlin/Heidelberg, Germany, 1999; pp. 333–354. [Google Scholar]
  77. Vos, J.; van der Putten, P.E.L. Effect of Nitrogen Supply on Leaf Growth, Leaf Nitrogen Economy and Photosynthetic Capacity in Potato. Field Crops Res. 1998, 59, 63–72. [Google Scholar] [CrossRef]
  78. Ierna, A.; Mauromicale, G. Sustainable and Profitable Nitrogen Fertilization Management of Potato. Agronomy 2019, 9, 582. [Google Scholar] [CrossRef]
  79. Vos, J. Nitrogen Responses and Nitrogen Management in Potato. Potato Res. 2009, 52, 305–317. [Google Scholar] [CrossRef]
  80. Milroy, S.P.; Wang, P.; Sadras, V.O. Defining Upper Limits of Nitrogen Uptake and Nitrogen Use Efficiency of Potato in Response to Crop N Supply. Field Crops Res. 2019, 239, 38–46. [Google Scholar] [CrossRef]
  81. Peng, Y.; Schmidt, I.K.; Zheng, H.; Heděnec, P.; Bachega, L.R.; Yue, K.; Wu, F.; Vesterdal, L. Tree Species Effects on Topsoil Carbon Stock and Concentration Are Mediated by Tree Species Type, Mycorrhizal Association, and N-Fixing Ability at the Global Scale. For. Ecol. Manag. 2020, 478, 118510. [Google Scholar] [CrossRef]
  82. Berg, B. Decomposition Patterns for Foliar Litter—A Theory for Influencing Factors. Soil Biol. Biochem. 2014, 78, 222–232. [Google Scholar] [CrossRef]
  83. Zhiyanski, M.; Glushkova, M.; Kirova, L.; Filcheva, E. Quantitative and Qualitative Features of Soil Humus in Mountain Treeline Ecosystems. Silva Balc. 2017, 1, 5–23. [Google Scholar]
  84. Bonfanti, N.; Poulenard, J.; Clément, J.-C.; Barré, P.; Baudin, F.; Turtureanu, P.D.; Pușcaș, M.; Saillard, A.; Raguet, P.; Hurdu, B.-I.; et al. Influence of Snow Cover and Microclimate on Soil Organic Carbon Stability in European Mountain Grasslands. Catena 2025, 250, 108744. [Google Scholar] [CrossRef]
  85. Lajtha, K.; Bowden, R.D.; Crow, S.; Fekete, I.; Kotroczó, Z.; Plante, A.; Simpson, M.J.; Nadelhoffer, K.J. The Detrital Input and Removal Treatment (DIRT) Network: Insights into Soil Carbon Stabilization. Sci. Total Environ. 2018, 640–641, 1112–1120. [Google Scholar] [CrossRef]
  86. Bresilla, B.; Zogaj, M.; Szegi, T.A.; Xhemali, B.; Gjinovci, G.; Racaj, F.; Husaj, Z. Effect of Pine Afforestation on Soil Physicochemical Properties Compared to Pasture Land: A Case Study in Kosovo. J. For. Sci. 2025, 71, 589–598. [Google Scholar] [CrossRef]
  87. Rotich, B.; Szegi, T.; Gelsleichter, Y.A.; Fuchs, M.; Ocansey, C.M.; Phenson, J.N.; Abdulkadir, M.; Kipkulei, H.; Wawire, A.; Mutuma, E.; et al. Variation in Soil Organic Carbon and Total Nitrogen Stocks Across Elevation Gradients and Soil Depths in the Mount Kenya East Forest. Land 2025, 14, 1217. [Google Scholar] [CrossRef]
  88. Deliboran, A. Carbon and Nitrogen Stocks of Olive Orchard Soils in Izmir Province. Tekirdağ Ziraat Fakültesi Derg. 2024, 21, 111–124. [Google Scholar] [CrossRef]
  89. Kirova, L.; Stoeva, L.; Stoyanov, T. Soil Carbon and Nitrogen Stocks under Anthropogenic Influence: A Case Study in European Beech Forests of Central Balkan Mountains (Stara Planina), Bulgaria. Ecol. Balk. 2025, 1, 141–150. [Google Scholar]
  90. Lăcătuşu, A.-R.; Domnariu, H.; Paltineanu, C.; Dunitru, S.; Vrînceanu, A.; Moraru, I.; Anghel, A.; Marica, D. Influence of Some Environmental Variables on Organic Carbon and Nitrogen Stocks in Grassland Mineral Soils from Various Temperate-Climate Ecosystems. Environ. Exp. Bot. 2024, 217, 105554. [Google Scholar] [CrossRef]
  91. Paltineanu, C.; Dumitru, S.; Vizitiu, O.; Mocanu, V.; Lăcătusu, A.-R.; Ion, S.; Domnariu, H. Soil Organic Carbon and Total Nitrogen Stocks Related to Land Use and Basic Environmental Properties—Assessment of Soil Carbon Sequestration Potential in Different Ecosystems. Catena 2024, 246, 108435. [Google Scholar] [CrossRef]
  92. Coucheney, E.; Casali, E.; Jarvis, N.; Koestel, J. Air-Filled Porosity, Its Connectivity and Relation to Particulate Organic Matter in Intact Soil Cores Controls Carbon Emissions near Saturation. Soil Tillage Res. 2025, 248, 106468. [Google Scholar] [CrossRef]
  93. Dor, M.; Fan, L.; Zamanian, K.; Kravchenko, A.N. Long-Term Land Use Conversion Influence on Soil Pore Structure and Organic Carbon. Agric. Ecosyst. Environ. 2025, 387, 109633. [Google Scholar] [CrossRef]
  94. Schlüter, S.; Leuther, F.; Albrecht, L.; Hoeschen, C.; Kilian, R.; Surey, R.; Mikutta, R.; Kaiser, K.; Mueller, C.W.; Vogel, H.-J. Microscale Carbon Distribution around Pores and Particulate Organic Matter Varies with Soil Moisture Regime. Nat. Commun. 2022, 13, 2098. [Google Scholar] [CrossRef]
Figure 1. Study area, locations of sample plots and meteorological information. The first overview map (A) situates the mountain within Bulgaria (red box). The second overview map (B) highlights the location of the study area within the mountain. Panel (C) provides detailed map of sampling points.
Land 15 00821 g001
Figure 2. Boxplots of soil parameters across land-use type: (A) pH; (B) bulk density; (C) coarse fraction. The letters above the boxplot indicate statistically distinct groups based on Duncan’s post hoc comparisons (p < 0.05). The mean value is presented as x, the line indicates the median value, and diamonds are outliers.
Land 15 00821 g002
Figure 3. Boxplots of soil parameters across land-use type: (A) SOC content; (B) N content; (C) C:N ratio. The letters above the boxplot indicate statistically distinct groups based on Duncan’s post hoc comparisons (p < 0.05). The mean value is presented as x, the line indicates the median value, and diamonds are outliers.
Land 15 00821 g003
Figure 4. Boxplots of soil parameters across land-use type: (A) SOC stock; (B) TN stock. The letters above the boxplot indicate statistically distinct groups based on Duncan’s post hoc comparisons (p < 0.05). The mean value is presented as x, the line indicates the median value, and diamonds are outliers.
Land 15 00821 g004
Figure 5. Relationships between SOC and SOC stock under different land uses: (A) overall data set n = 54 (blue), all forest plots n = 27 (green), all agricultural n = 27 (orange); (B) all except unmown meadows n = 45 (red), potatoes and meadows n = 18 (dark blue), and unmown meadows without outlier n = 8 (light green).
Land 15 00821 g005
Table 1. Descriptive statistics for soil parameters.
ParameterLand UsenMeanse±CI95%CV, %
pHNorway spruce94.860.120.277
Scots pine95.060.070.174
Silver fir94.940.060.144
Unmown meadow95.080.100.226
Meadow95.170.170.3910
Potato fields95.040.190.4311
Bulk Density,
g∙cm−3
Norway spruce90.830.130.3047
Scots pine90.520.030.0615
Silver fir90.650.040.0817
Unmown meadow90.660.070.1632
Meadow90.960.080.1825
Potato fields91.180.030.088
Coarse fraction,
%
Norway spruce912.161.814.1845
Scots pine917.220.511.189
Silver fir911.460.892.0623
Unmown meadow92.670.982.27111
Meadow95.241.493.4485
Potato fields98.951.613.7254
SOC,
g∙kg−1
Norway spruce946.683.939.0625
Scots pine930.954.4510.2743
Silver fir937.144.7811.0239
Unmown meadow981.2621.3149.1379
Meadow931.736.5915.2062
Potato fields927.692.525.8227
TN,
g∙kg−1
Norway spruce911.420.541.2414
Scots pine99.890.441.0213
Silver fir910.740.541.2315
Unmown meadow911.310.150.354
Meadow99.970.320.7510
Potato fields910.050.160.365
C:NNorway spruce94.140.370.8527
Scots pine93.220.541.2450
Silver fir93.490.451.0338
Unmown meadow97.031.713.9573
Meadow93.060.531.2252
Potato fields92.730.200.4722
SOC stock,
t C∙ha−1
Norway spruce916.682.806.4650
Scots pine96.500.751.7335
Silver fir910.731.683.8747
Unmown meadow921.441.844.2526
Meadow912.801.523.5136
Potato fields914.901.443.3229
TN stock,
t N∙ha−1
Norway spruce94.150.681.5649
Scots pine92.160.180.4125
Silver fir93.080.220.5121
Unmown meadow93.620.360.8430
Meadow94.420.280.6619
Potato fields95.390.130.317
Table 2. Shapiro–Wilk normality test results.
ParameterNorway SpruceScots PineSilver FirUnmown MeadowMeadowPotato Fields
pH0.6760.023 *0.1820.0800.5470.078
Bulk density0.3330.9760.025 *0.2590.2930.521
Coarse fraction0.2470.7190.6560.024 *0.3800.083
SOC0.008 *0.1240.0500.000 *0.049 *0.306
N0.6090.9170.3860.4220.9080.977
C:N0.0920.1080.1440.000 *0.049 *0.318
SOC stock0.3830.6170.016 *0.7890.7220.330
TN stock0.3870.9060.7280.036 *0.6530.631
(p-value—p = 0.05, * showing that the data is not normally distributed).
Table 3. ANOVA single-factor (land use) and Kruskal–Wallis test.
ParameterDfANOVAKruskal–Wallis
F-Valuep-ValueChi-sqp-Value
pH50.7490.5914.6900.455
Bulk density511.260.000 *27.3170.000 *
Coarse fraction516.070.000 *33.4540.000 *
SOC54.3080.003 *24.3450.000 *
N53.1290.016 *16.5640.005 *
C:N53.8980.005 *20.0420.001 *
SOC stock58.3110.000 *28.1160.000 *
TN stock59.8260.000 *28.9290.000 *
(* p-value < 0.05).
Table 4. Correlation analysis.
ParameterpHNC:NBDCFSOC StockTN Stock
All studied plots
n = 54
SOC−0.1300.378 **0.988 **−0.381 **−0.353 **0.572 **−0.248
pH−0.135−0.1130.175−0.003−0.0620.122
N0.259−0.123−0.0990.455 **0.172
C:N−0.405 **−0.349 **0.540 **−0.302 *
BD−0.0490.302 *0.940 **
CF−0.447 **−0.209
SOC stock0.495 **
All except unmown meadows
n = 45
SOC−0.1420.401 **0.942 **−0.271−0.0800.631 **−0.107
pH−0.142−0.0910.1850.028−0.0590.115
N0.100−0.0470.0590.382 **0.234
C:N−0.318 *−0.0810.509 **−0.233
BD−0.2110.539 **0.947 **
CF−0.241−0.305 *
SOC stock0.672 **
Forest plots
n = 27
SOC−0.0550.2110.906 **0.155−0.2960.736 **0.248
pH−0.0830.049−0.096−0.106−0.114−0.068
N−0.1910.291−0.0710.3730.570 **
C:N0.000−0.2850.537 **−0.012
BD−0.0330.755 **0.939 **
CF−0.244−0.148
SOC stock0.799 **
Agricultural plots
n = 27
SOC−0.1840.724 **0.999 **−0.750 **−0.424 *0.646 **−0.732 **
pH−0.196−0.1840.2130.319−0.1790.130
N0.724 **−0.721 **−0.483 *0.888 **−0.523 **
C:N−0.750 **−0.424 *0.646 **−0.733 **
BD0.708 **−0.467 *0.946 **
CF−0.3450.538 **
SOC stock−0.255
Managed lands
n = 18
(potato fields and meadows)
SOC−0.1330.910 **0.999 **−0.627 **−0.3390.788 **−0.387
pH−0.198−0.1340.2760.374−0.1220.119
N0.910 **−0.396−0.2500.909 **−0.064
C:N−0.628 **−0.3400.788 **−0.387
BD0.753 **−0.0720.908 **
CF0.0210.536 *
SOC stock0.238
Unmown meadows
n = 9
SOC−0.4840.825 **0.999 **−0.835 **−0.3870.449−0.811 **
pH−0.554−0.4840.2760.156−0.5170.240
N0.825 **−0.765 *−0.3910.703 *−0.671 *
C:N−0.835 **−0.3870.449−0.811 **
BD0.207−0.1070.985 **
CF−0.4810.086
SOC stock0.017
Unmown meadows
(without outlier)
n = 8
SOC−0.4300.965 **0.999 **−0.361−0.2740.826 *−0.135
pH−0.412−0.430−0.1000.021−0.458−0.175
N0.965 **−0.487−0.2310.731 *−0.261
C:N−0.361−0.2750.826 *−0.134
BD−0.1210.2160.958 **
CF−0.426−0.346
SOC stock0.444
(significance levels: ** p < 0.01; * p < 0.05).
Disclaimer/Publisher’s Note: The statements, opinions and data contained in all publications are solely those of the individual author(s) and contributor(s) and not of MDPI and/or the editor(s). MDPI and/or the editor(s) disclaim responsibility for any injury to people or property resulting from any ideas, methods, instructions or products referred to in the content.