Article

Land Use Classification in Rare Earth Mining Areas Based on Multi-Source Remote Sensing and Feature Optimization


1
School of Civil and Surveying and Mapping Engineering, Jiangxi University of Science and Technology, Ganzhou 341000, China
2
Jiangxi Province Key Laboratory of Water Ecological Conservation in Headwater Regions, Jiangxi University of Science and Technology, 1958 Ke-jia Road, Ganzhou 341000, China
*
Author to whom correspondence should be addressed.
Land 2026, 15(5), 797; https://doi.org/10.3390/land15050797
Submission received: 24 March 2026 / Revised: 1 May 2026 / Accepted: 5 May 2026 / Published: 8 May 2026

Abstract

Rare earth elements are vital, non-renewable strategic resources, and their exploitation has significant impacts on regional ecological security and sustainable development. To address the issue of insufficient accuracy in land use classification in rare earth mining areas, this study takes the Lingbei rare earth mining area in Dingnan County, Jiangxi Province, as a case study. Multi-source remote sensing data, including Sentinel-2 imagery, Sentinel-1 SAR data, nighttime light data, and DEM data, were integrated to construct a feature set combining spectral, textural, and topographic information. On this basis, this study developed a feature optimization framework that combines recursive feature elimination (RFE), mean decrease accuracy (MDA), and K-fold cross-validation (CV), termed RFE-MDA-CV. We designed nine feature combination schemes and compared them with the optimal feature subset. Their performance was systematically evaluated across four classifiers: RF, SVM, CART, and GBDT. The results were as follows: (1) the optimized feature set combined with the RF classifier consistently achieved the highest classification performance, with a mean OA of approximately 93.2% and a kappa coefficient of about 0.916, outperforming CART and SVM by around 4-5 percentage points; (2) land use remained generally stable between 2016 and 2023, but frequent conversions occurred between forest land, cropland, and impervious surfaces, mainly driven by urban expansion and mining activities; and (3) cross-regional experiments demonstrated that the proposed feature optimization framework has good applicability and transferability in mining areas with similar geomorphological and metallogenic conditions. Overall, the proposed RFE-MDA-CV method can be effectively implemented on the Google Earth Engine platform, significantly improving the accuracy and robustness of land use classification in rare earth mining areas, while providing reliable technical support for ecological monitoring and land resource management.

1. Introduction

China possesses abundant rare earth mineral resources, which serve as critical strategic materials for information technology, national defense, and new energy sectors [1]. With the continuously increasing global demand for rare earth elements, long-term extensive mining practices have severely degraded the ecological environment of mining areas. Remote sensing monitoring has revealed that commonly used techniques in rare earth extraction, such as pond leaching, heap leaching, and in situ leaching, have led to a range of ecological degradation issues, including soil erosion, acidification, and desertification [2,3,4]. These processes disrupt soil structure and intensify water and soil loss, further triggering ecological conflicts, particularly in southern China’s ion-adsorption rare earth deposits, which are characterized by rugged terrain and fragile hydrological conditions. Studies have shown that the rapid expansion of mining and construction land significantly impairs regional ecosystem service functions [5]. However, traditional field-based investigation methods fall short in meeting the demands for large-scale, long-term, and dynamic monitoring across diverse geomorphic regions, resulting in spatial and temporal gaps in ecological assessment. Therefore, establishing a remote sensing-based spatiotemporal monitoring system has become a necessary approach. Although previous studies have attempted to evaluate ecological impacts from perspectives such as policy effectiveness and ecological restoration, the high cost, limited spatial coverage, and poor temporal resolution of traditional field surveys still pose significant challenges to comprehensively understanding the ecological evolution of rare earth mining areas under large-scale and multi-temporal contexts. Therefore, conducting land use classification in rare earth mining areas is not only fundamental for identifying surface patterns and their spatiotemporal dynamics but also a critical prerequisite for revealing mining-induced disturbances, ecological degradation, and subsequent restoration processes.
In contrast, remote sensing-based monitoring technologies, owing to their high spatiotemporal resolution and strong capability for dynamic observation, have become an essential technical means for ecological and environmental monitoring in mining areas [6,7,8]. With the continuous improvement in multi-source remote sensing data acquisition, the capability for fine-scale identification of surface conditions in complex mining environments has been substantially enhanced. Among these data sources, hyperspectral imagery, characterized by its high spectral resolution, has demonstrated clear advantages in discriminating land cover types such as tailings areas, bare land, and vegetation, providing critical support for high-accuracy land use/land cover (LULC) classification [9,10]. Previous studies have shown that Sentinel-2 multispectral imagery exhibits significant advantages in detecting vegetation changes and surface disturbance features, while Sentinel-1 synthetic aperture radar (SAR), benefiting from its all-weather and day–night imaging capability, is effective in capturing variations in soil structure and moisture conditions. By integrating Sentinel-1 SAR and Sentinel-2 MSI data, the complementary strengths of spectral and structural information can be fully exploited, thereby significantly improving land cover classification accuracy under complex surface conditions [11,12,13]. Meanwhile, with the increasing diversity of remote sensing data, multi-source information such as SAR, LiDAR, thermal infrared, nighttime light, and meteorological data has gradually been incorporated into remote sensing analysis frameworks to construct a more comprehensive system for surface condition monitoring [14]. Among them, nighttime light data can represent the intensity of human activity in mining areas; digital elevation models (DEMs) assist in revealing microtopographic changes and erosion pathways; and thermal infrared remote sensing is capable of indicating the surface energy exchange status after disturbances. On this basis, multi-source data fusion enables a comprehensive characterization of complex surface processes in rare earth mining areas from multiple dimensions, including spectral responses, surface structural properties, topographic constraints, and human activity intensity. This facilitates more accurate identification of key LULC types such as mining disturbances, vegetation recovery, water body changes, and the expansion of built-up areas [15,16,17,18]. However, while enhancing information representation, multi-source remote sensing data also substantially increases the complexity of the feature space. In practical applications, discrepancies among different sensors in spatial resolution, temporal consistency, and spectral configurations can introduce geometric misregistration and temporal inconsistency, thereby affecting classification accuracy [19,20]. More importantly, rare earth mining areas are typically characterized by fragmented terrain, heterogeneous land cover, indistinct boundaries, and high spectral similarity among classes, which often leads to misclassification and omission errors when using conventional supervised classification methods in highly disturbed environments [21]. Therefore, LULC classification in rare earth mining areas is not a straightforward surface mapping task, but rather a highly complex problem jointly influenced by intricate topographic conditions, continuous mining disturbances, and mixed land cover types. In this context, effectively suppressing redundant information, extracting discriminative features, and improving the stability of feature selection within a high-dimensional multi-source feature space have become critical challenges for enhancing classification accuracy and model generalization in mining areas.
To address the aforementioned challenges, the advancement of machine learning technologies has provided strong support for the intelligent classification of remote sensing imagery. Mainstream models such as random forest (RF), support vector machine (SVM), and gradient boosting decision tree (GBDT) have been widely applied in classification tasks involving high-dimensional and multi-source remote sensing data. Among them, RF demonstrates superior performance in LULC classification due to its strong capabilities in handling high-dimensional data, resistance to overfitting, and ability to model nonlinear relationships among features [22,23,24,25]. However, it is worth noting that many existing studies rely heavily on full sets of original or manually constructed features for model training without effectively removing redundant or low-contribution features. This not only reduces model efficiency but also weakens the stability and generalizability of the classification results [26]. Moreover, high collinearity among features and the presence of noise often blur model decision boundaries, while the sparsity of high-dimensional data exacerbates the “curse of dimensionality," significantly increasing the risk of overfitting and classification ambiguity [27,28]. Therefore, establishing a scientifically sound and efficient feature selection mechanism to optimize the feature space structure has become a key strategy to enhance remote sensing classification performance. Currently, commonly used feature selection methods can be categorized into three groups: (1) statistical methods such as Pearson correlation coefficient and Jeffries–Matusita (JM) distance, which preliminarily filter features based on redundancy and correlation [29]; (2) recursive feature elimination (RFE), which iteratively removes less important features through nested model training to refine the feature subset [30]; and (3) feature importance evaluation methods based on RF or GBDT, which assess the contribution of each feature during the training process [31]. However, recent studies have shown that the effectiveness of feature selection methods is not universally applicable but rather depends on the underlying data structure, task objectives, and evaluation criteria. In particular, it is necessary to jointly consider factors such as feature relevance, redundancy, nonlinear interactions, and the stability of the selection results. Existing methods typically emphasize different aspects: Pearson/CFS-based approaches [32,33] rely on correlation heuristics and primarily focus on identifying linear redundancy; mRMR [34] aims to balance relevance and redundancy from a mutual information perspective; and Boruta [35] is more inclined toward robust variable selection. However, in rare earth mining areas characterized by complex land cover types, high spectral similarity, and dynamic change processes, these methods often struggle to simultaneously address redundancy suppression, nonlinear interaction modeling, and selection stability. This limitation has become a key bottleneck restricting further improvements in classification accuracy using multi-source remote sensing data. Therefore, for such complex mining scenarios, it is necessary to develop a systematic feature optimization strategy that integrates feature importance evaluation, iterative refinement, and robustness, enabling stable selection and effective representation of high-dimensional, multi-source features and thereby better supporting fine-scale LULC classification tasks.
Against this backdrop, this study proposes an integrated feature optimization algorithm, termed RFE–MDA–CV, which combines recursive feature elimination (RFE), mean decrease accuracy (MDA), and K-fold cross-validation (K-CV) to enhance the accuracy and robustness of land cover classification in typical rare earth mining regions. To this end, the Lingbei rare earth mining area in Ganzhou City, Jiangxi Province, China, was selected as a representative study area. Multiple sources of remote sensing data were jointly exploited, including Sentinel-2 multispectral imagery, Sentinel-1 SAR data, nighttime light imagery, and DEM data, from which multidimensional variables such as spectral bands, vegetation indices, texture features, and topographic factors were derived. Based on the optimized feature sets, four representative classifiers—RF, SVM, CART, and GBDT—were employed to construct nine different feature combination schemes. The performance of these schemes was systematically evaluated for land cover classification and temporal change analysis across multiple years from 2016 to 2023, thereby validating the effectiveness and robustness of the proposed framework. The results demonstrate that the proposed feature optimization framework exhibits strong adaptability and generalization capability in mining-area ecological monitoring scenarios and provides data support for understanding the socioeconomic drivers, policy regulation, and natural environmental influences on land use change in rare earth mining areas.
The primary methodological contributions of this study are summarized as follows:
(1) Unlike conventional approaches that rely on default full feature modeling, this study establishes a systematic feature optimization framework integrating RFE-MDA and K-fold cross-validation, thereby significantly improving classification accuracy and computational efficiency.
(2) By avoiding blind dependence on the complete feature set, the proposed framework mitigates high-dimensional feature redundancy and collinearity issues, providing a structured optimization pathway for LULC classification in complex and highly disturbed environments.
(3) Through feature optimization, the framework enhances model generalization capability and class separability, particularly improving the recognition performance of minority classes and spectrally confusing land cover types, thus providing reliable technical support for fine-scale land use monitoring in rare earth mining areas.

2. Study Area and Data

2.1. Overview of the Study Area

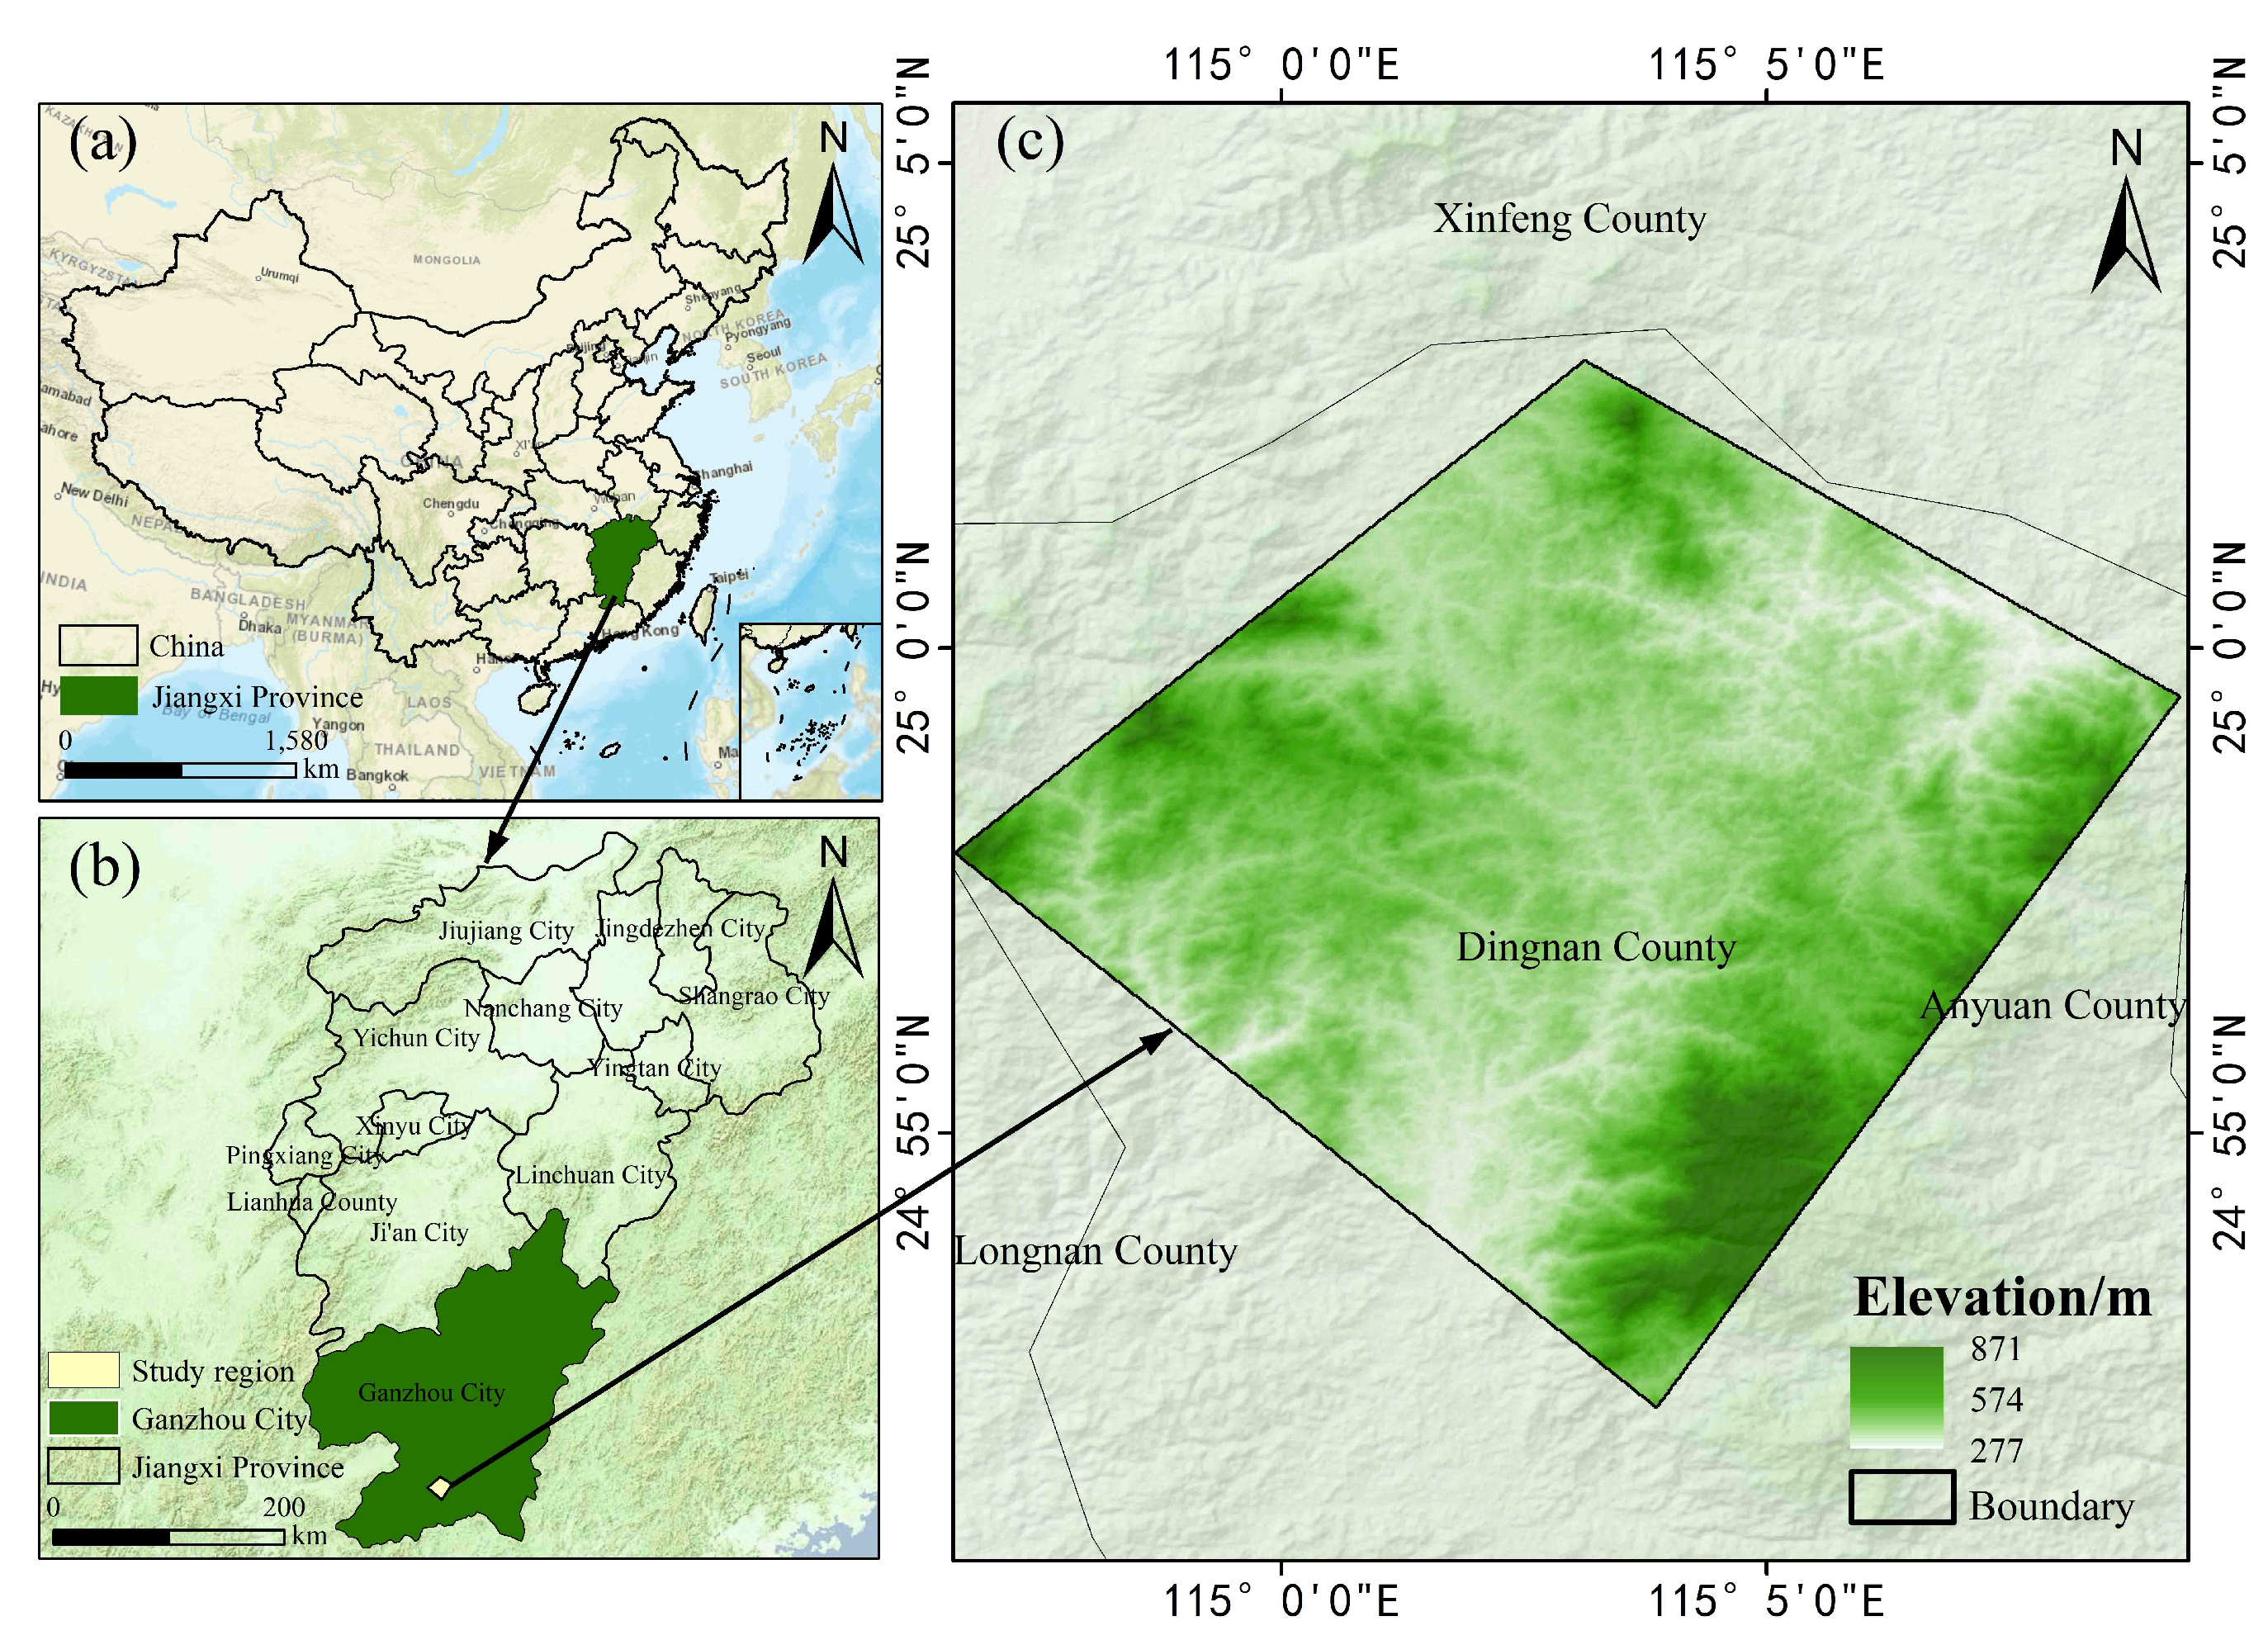
The southern Jiangxi region is one of China’s most significant production bases for ion-adsorption rare earth elements. Rare earth mineral deposits are distributed across 146 towns in 17 counties and districts of Ganzhou City, earning it the title of the “Kingdom of Rare Earths”. The region holds the highest reserves of ion-adsorption heavy rare earth elements in China [36]. The Lingbei mining area is located in Lingbei Town, Dingnan County, Ganzhou City, Jiangxi Province, between latitudes 24°51′24″ to 25°02′56″ N and longitudes 114°58′04″ to 115°10′56″ E, covering an area of approximately 200 km2. The terrain is primarily composed of mountains and hills, and the area falls within the subtropical monsoon climate zone, characterized by a warm and humid climate with abundant precipitation [37]. The region is endowed with favorable natural conditions, abundant resources, and rich mineral deposits. The specific geographical location is shown in Figure 1.
In the early stages, the mining area primarily adopted in situ leaching and heap leaching processes. Prolonged extensive mining operations led to large-scale stripping of surface vegetation and weathered crust ore bodies, resulting in numerous tailings piles, waste rock dumps, and exposed surfaces. These activities have consequently caused a series of ecological problems, including soil acidification, heavy metal accumulation, and particulate matter migration. Long-term leaching mining has severely fragmented the surface landscape, increased the difficulty of land reclamation, and slowed ecological restoration, highlighting the area’s typicality and representativeness. With the implementation of the General Plan for Mineral Resources of Jiangxi Province (2021–2025) [38], the mining area has gradually initiated ecological restoration and reclamation projects. In some regions, in situ leaching technology has been promoted to reduce surface disturbance and environmental pollution. However, a considerable number of tailings areas, bare lands, sedimentation ponds, and reclaimed plots remain. The land cover types are complex and spatially fragmented, and the spectral similarity between reclaimed and natural vegetation, as well as the pronounced seasonal variations between tailings and herbaceous areas, pose significant challenges for remote sensing classification and land cover identification. Therefore, selecting the Lingbei rare earth mining area as the study site not only facilitates the exploration of ecological degradation patterns under rare earth mining activities but also provides valuable scientific references for ecological monitoring and restoration management in similar mining regions.

2.2. Data Sources

Mining areas are characterized by high spectral similarity among surface materials, strong spatial fragmentation, and pronounced seasonal variability. These characteristics make single-source remote sensing classification prone to feature confusion, reduced accuracy, and increased difficulty in detecting dynamic changes. Additionally, due to complex terrain conditions and safety constraints, traditional field surveys are often unable to achieve large-scale and continuous acquisition of surface information. In contrast, multi-source remote sensing data fusion has become an important technical approach for revealing surface structural characteristics, as well as ecological degradation and reclamation processes in mining areas. The remote sensing satellite imagery used in this study was processed online using the Google Earth Engine (GEE) platform. Optical data were derived from Sentinel-2 MSI, which captures 13 spectral bands ranging from the visible to shortwave infrared regions with spatial resolutions of 10, 20, and 60 m. Only images with cloud coverage less than 5% were used. Radar data were obtained from Sentinel-1 Ground Range Detected (GRD) products in Interferometric Wide (IW) swath mode, with a spatial resolution of 10 m and a revisit cycle of approximately 6 days. These data offer all-weather and cloud-penetrating capabilities, complementing the limitations of optical imagery. Topographic variables were extracted from the SRTM global DEM, which has a spatial resolution of 30 m and provides stable elevation information for terrain analysis. Nighttime light data were sourced from the VIIRS Day/Night Band (DNB) monthly average radiance product, with a spatial resolution of 500 m. Detailed information on the datasets is provided in Table 1.

2.3. Data Preprocessing

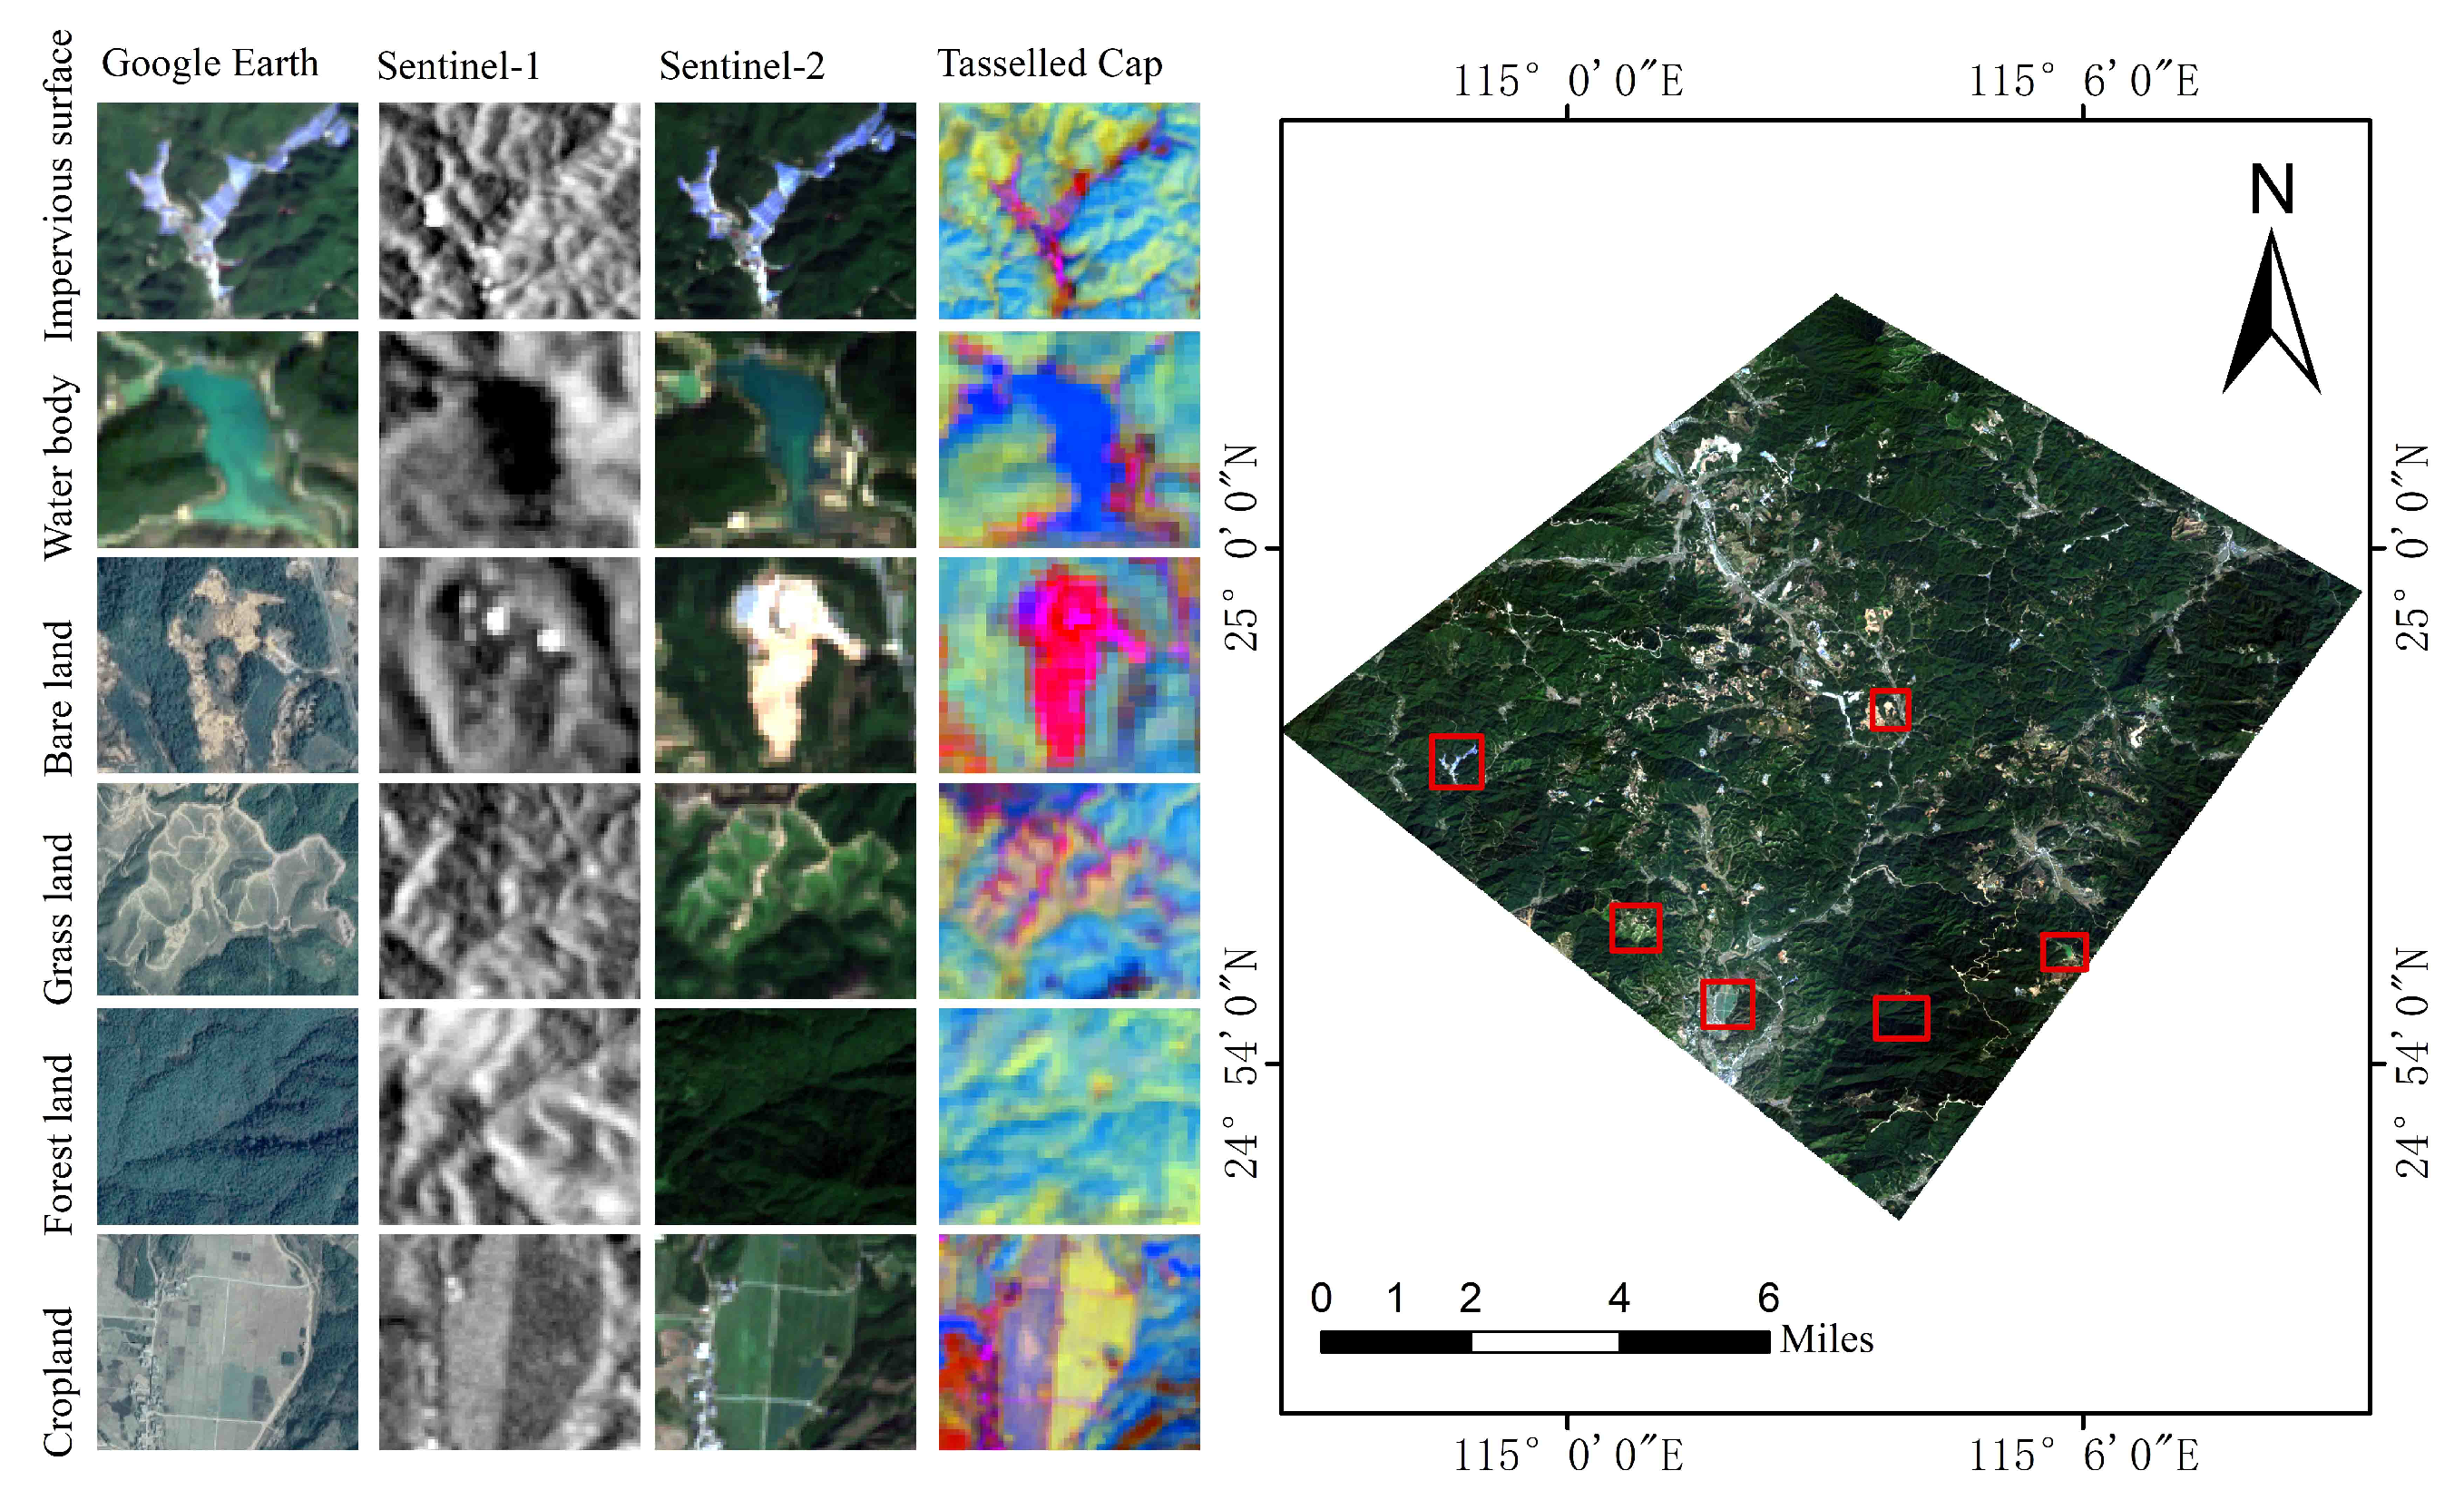
This study utilizes preprocessed data products available on the GEE platform, which have undergone orbit correction, thermal noise removal, radiometric calibration, and terrain correction. The backscatter coefficients are represented in linear units (power). For Sentinel-1, GRD products in IW swath mode with a spatial resolution of 10 m and VV polarization were used. Annual collections of VV polarized IW mode data from different years were selected from the COPERNICUS/S1_GRD dataset. Ascending and descending orbit data were merged, and the mean value of the entire collection was calculated to generate the average backscatter image for the study area. For Sentinel-2A imagery, cloud and cloud shadow masking were performed using the QA60 band. Surface reflectance values were scaled by dividing by 10,000 to convert them into real reflectance values ranging between 0 and 1. All bands with spatial resolutions of 20 m and 60 m were resampled to 10 m using the nearest neighbor method. All bands starting with “B” (including 60 m bands) were retained for analyses such as the tasseled cap transformation. The preprocessed Sentinel-2A images were then composited and flattened into an array format. Based on predefined tasseled cap coefficients, brightness, greenness, and wetness components were calculated. The composite image was separated into these individual components. In addition, spectral and vegetation indices were constructed to capture features such as vegetation cover, water bodies, and bare soil. Terrain attributes, including elevation and slope, were derived from the DEM to enhance topographic representation. Texture features were also generated to capture spatial heterogeneity. Finally, all processed layers, including the tasseled cap components, Sentinel-2A median composite, Sentinel-1 backscatter image, and VIIRS nighttime light data, were combined into a unified feature set. Training samples were extracted from the training dataset and divided into training and testing subsets to construct classification models for land use mapping in the Lingbei mining area. Figure 2 illustrates the land cover types represented by each input data stack.

3. Research Methods

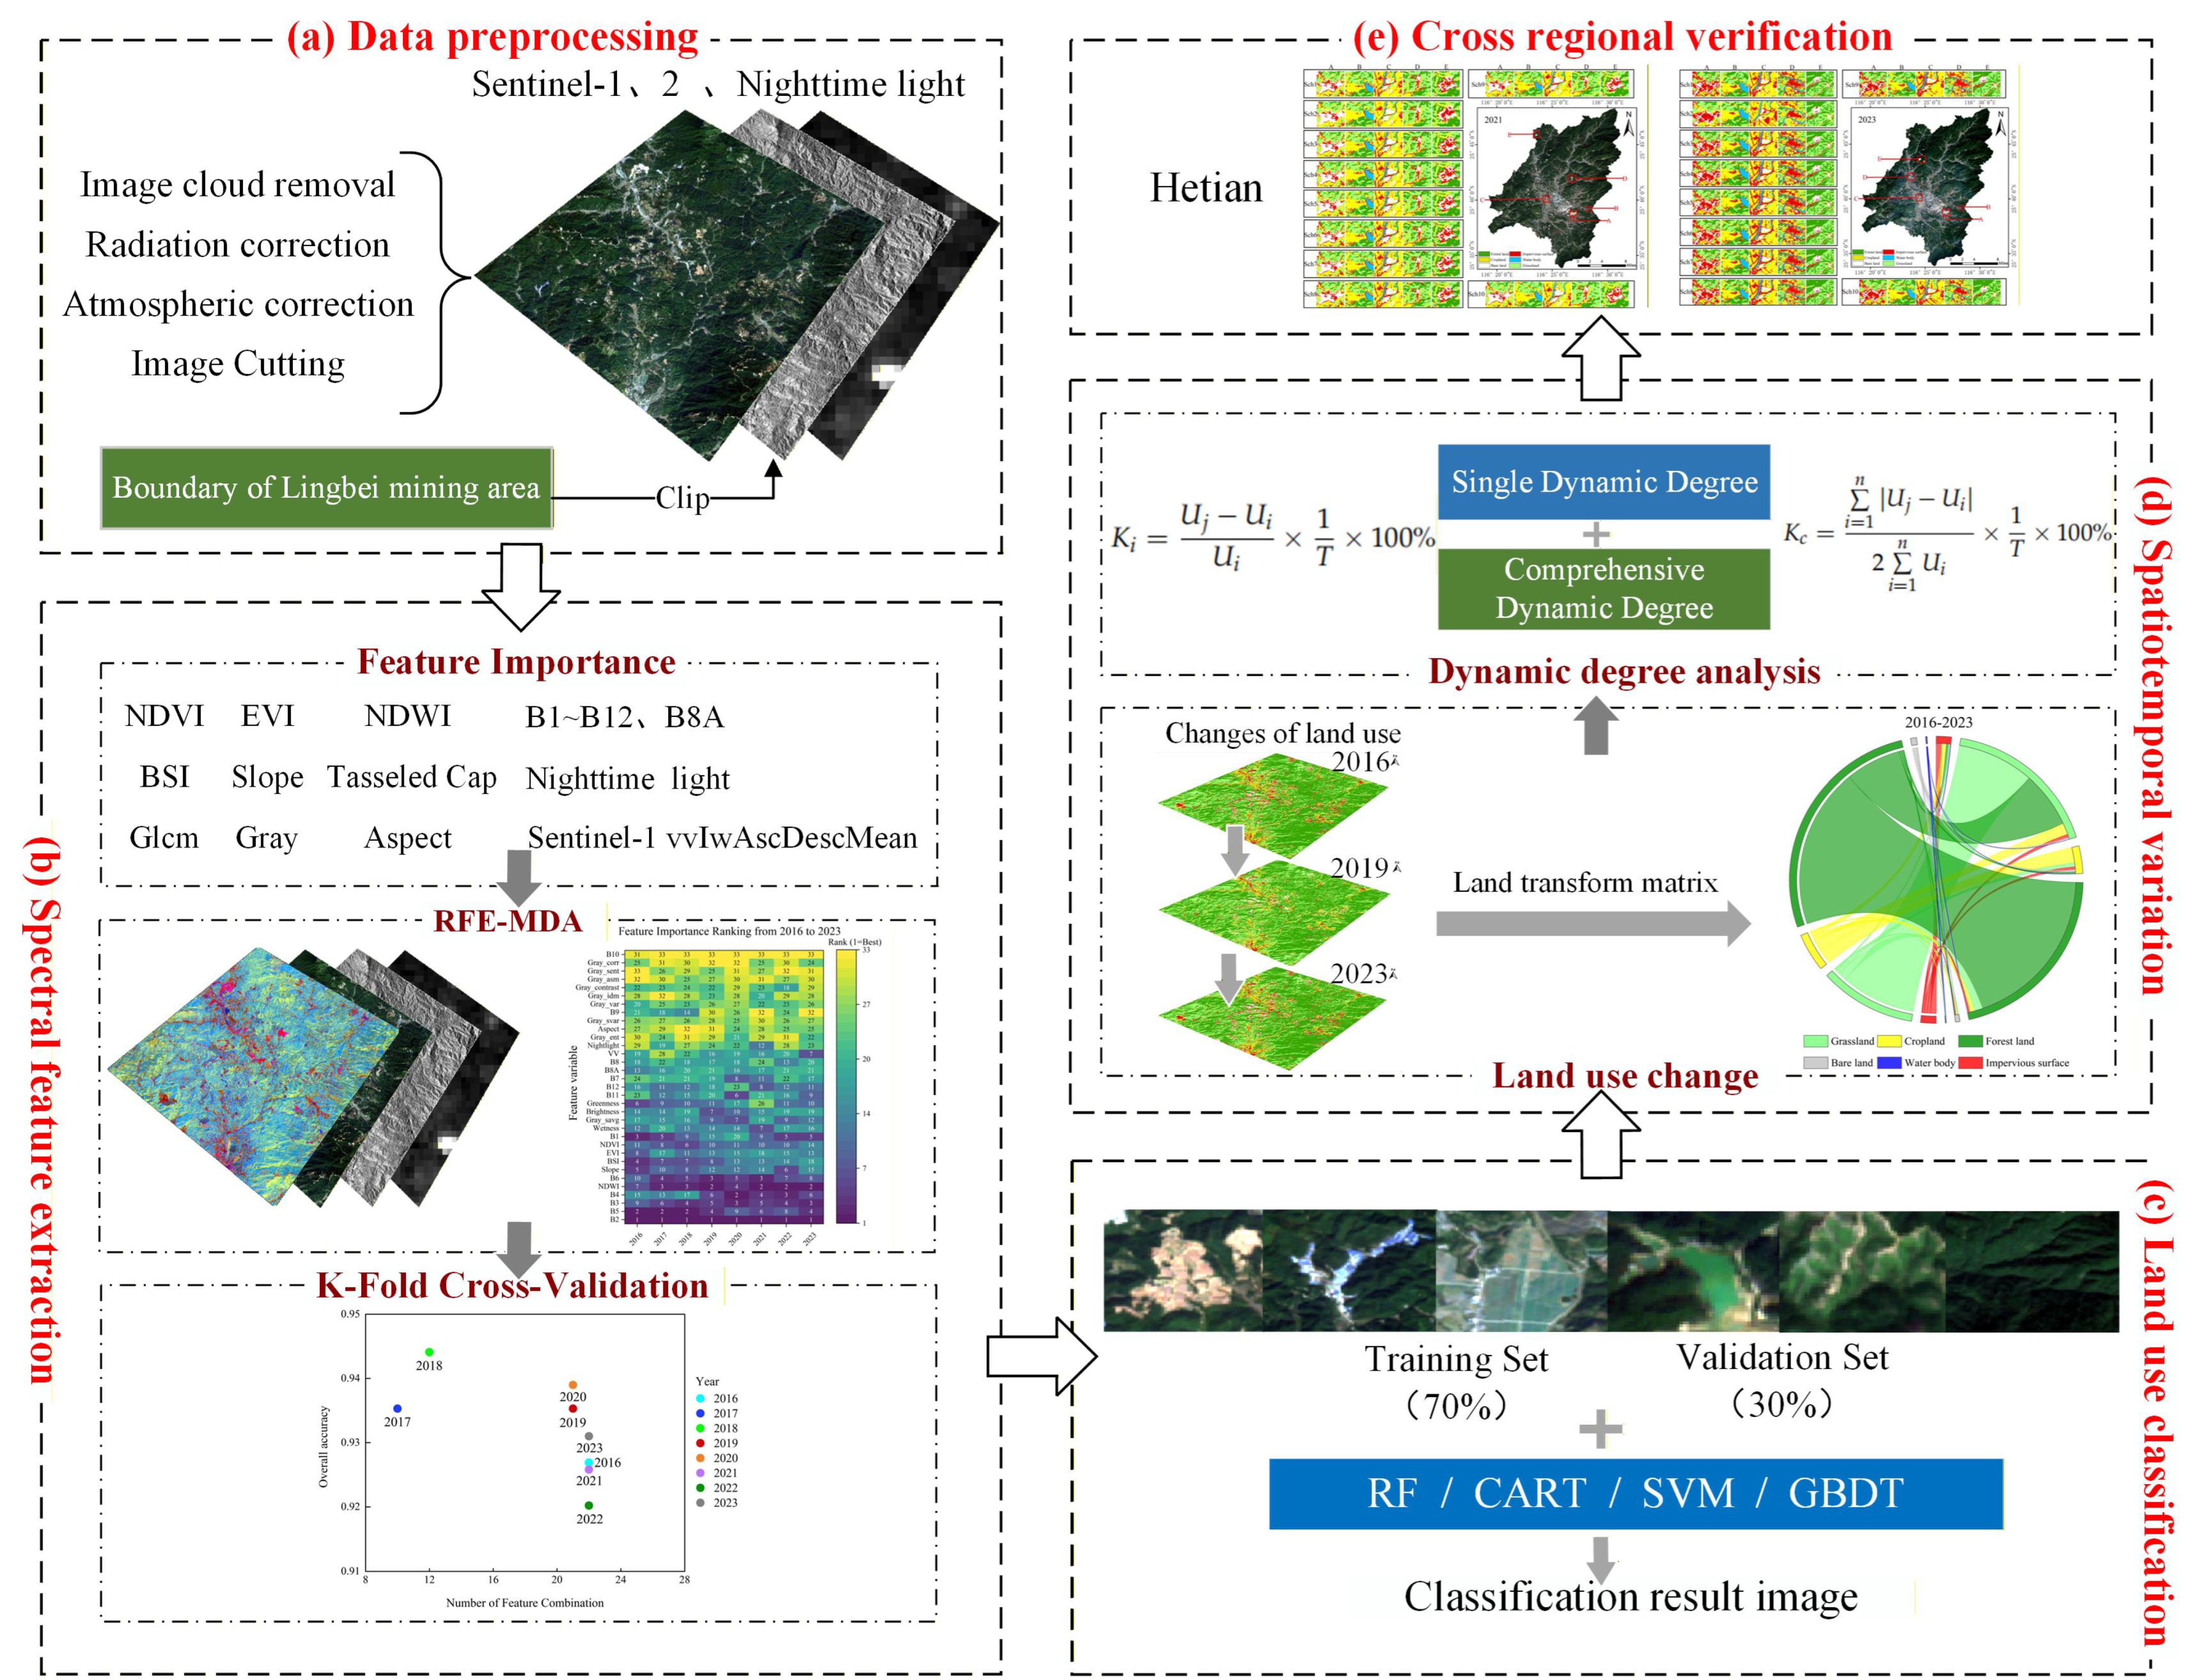
In this study, multi-source remote sensing data, including Sentinel-2A optical imagery, Sentinel-1 SAR data, nighttime light data, and DEM, were integrated to extract a comprehensive set of features, including spectral bands, spectral indices, texture measures, and topographic variables. After preprocessing, a feature variable set and multiple feature combination schemes were constructed for land use classification in the Lingbei rare earth mining area. A feature selection strategy, RFE-MDA-CV, was employed to identify the optimal feature subset. Classification was performed using the RF algorithm, and the results were compared with those obtained from SVM, CART, and GBDT classifiers. The objective is to determine the most suitable feature combinations and classification models for large-scale, fine-resolution land use mapping in mining areas. The optimized classification results were further analyzed to explore the spatial–temporal characteristics, patterns, and driving factors of land use change in the study area. A flowchart of the methods is illustrated in Figure 3.

3.1. Construction of the Multi-Source Feature System and Sample Design

3.1.1. Feature Selection

Considering the data sources and the characteristics of the study area, a total of 33 feature factors were selected for this study. These include 12 spectral bands from Sentinel-2A, three components from the tasseled cap transformation, four vegetation indices, texture indices, a nighttime light index, the VV polarized backscatter coefficient from Sentinel-1, and two topographic auxiliary factors. The selected feature factors are detailed in Table 2.
Vegetation indices (NDVI and EVI) and the greenness component derived from the tasseled cap transformation were primarily used to enhance the separability among forest, grassland, and cropland. The Normalized Difference Water Index (NDWI) effectively identifies water bodies, while the Bare Soil Index (BSI), together with the brightness and wetness components from the tasseled cap transformation, is highly sensitive to bare land, tailings, and mining-disturbed surfaces. Texture features were extracted based on the gray level co-occurrence matrix (GLCM), including angular second moment (gray_asm), contrast (gray_contrast), correlation (gray_corr), variance (gray_var), and inverse difference moment (gray_idm), which complement spectral information in representing spatial structure and thereby improve the detection of small-scale disturbed patches. In addition, the Sentinel-1 VV polarized backscatter coefficient provides information on surface roughness and structural characteristics, effectively compensating for the limited discriminative capability of spectral features between spectrally similar classes such as impervious surfaces and bare land. Nighttime light data characterizes the intensity of human activities and the degree of mining development, providing supplementary information for identifying impervious surfaces and other human activity-related land cover types. Together, these features form a comprehensive multi-source feature set, providing a solid foundation for LULC classification.

3.1.2. Sample Point Selection

In terms of sample construction, a multi-source cross-validated sample database was established, grounded in field surveys, primarily supported by remote sensing data, and supplemented by authoritative reference materials, in order to systematically ensure the accuracy and verifiability of the classification results. Sample points were primarily determined based on multiple rounds of field investigations and were subsequently cross-checked using multi-source remote sensing imagery to reduce uncertainty associated with single-source data.
To compensate for the temporal coverage and spatial continuity limitations of field surveys, Google Earth historical imagery was utilized to conduct long-term retrospective analysis of candidate samples, with particular emphasis on verifying the stability of land cover types. In addition, sample points were spatially overlaid with mineral resource distribution maps, mining license boundaries, and historical mine inspection records to validate their land surface evolution background from policy and management perspectives. For areas with interpretation uncertainty, supplementary information from mine inspection reports, publicly available ecological and environmental supervision documents, and open-source geospatial data, such as OpenStreetMap, was incorporated to enhance the overall reliability of sample labeling.
Regarding the construction of the classification scheme, this study referenced the Chinese Land Use Classification System and the International Geosphere Biosphere Programme (IGBP) global land cover classification standard while making appropriate adjustments based on the actual surface characteristics of rare earth mining areas. Ultimately, six land cover classes were defined for the Lingbei mining area: forest land, cropland, bare land, impervious surface (IS), water body, and grassland. The impacts of mining activities on the land surface are primarily manifested through changes in vegetation structure, differences in surface exposure, and alterations in physical surface properties, which can be characterized by the spatial distribution and temporal evolution of the aforementioned land use types. Sample selection followed the principles of “multi-source consistency, temporal stability, and spatial uniformity.” Based on comprehensive field survey results and multi-temporal Sentinel-1/2 remote sensing imagery, sample points were uniformly distributed in areas where land use types remained stable over time and could be reliably interpreted (Table 3). Finally, the sample dataset was randomly divided into a training set and a validation set, with 70% used for model training and 30% reserved for accuracy assessment, ensuring the objectivity and robustness of classification evaluation.

3.2. Feature Optimization Algorithm

Rare earth mining areas are characterized by complex land cover types, where tailings, bare land, reclaimed vegetation, and natural vegetation often exhibit high spectral similarity. In addition, mining activities lead to pronounced surface fragmentation and dispersed land cover patches, further increasing the uncertainty of classification boundaries. Moreover, multi-source remote sensing features typically exhibit strong inter-feature correlation, redundancy, and nonlinear interactions, making it difficult for a single feature selection method to simultaneously achieve redundancy suppression, information preservation, and result stability. To address the aforementioned issues, this study treated annual data from 2016 to 2023 as independent experimental units. An initial feature space was constructed based on Sentinel-2A, Sentinel-1, DEM, and nighttime light remote sensing data, from which multidimensional information, including spectral features, index-based features, and texture features, was extracted to form a candidate feature set comprising 33 variables. On this basis, a feature selection framework that integrates recursive feature elimination with mean decrease accuracy (RFE–MDA) and K-fold cross-validation (K-CV), termed RFE–MDA–CV, is proposed to automatically identify the most discriminative subset of features while maintaining classification accuracy. In this framework, mean decrease accuracy (MDA) quantifies the marginal contribution of each feature to classification accuracy and provides a robust measure of feature importance. At the beginning of each RFE iteration, MDA scores for all features are computed using an RF model trained on the full training dataset, offering a direct and reliable basis for determining which feature to eliminate while avoiding subjective threshold settings and better accommodating the high-dimensional and dynamic feature space in mining areas. Recursive feature elimination (RFE) enables a directed and iterative optimization process: guided by MDA, features are removed sequentially, and the importance of the remaining features is recalculated after each elimination, allowing the dynamic reassessment of feature interactions and the identification of redundant or complementary relationships. Cross-validation (CV) ensures stability under limited sample conditions by embedding the entire RFE–MDA procedure within a K-fold cross-validation framework. Specifically, feature selection is performed independently on each training fold, and the final feature subset is determined based on consistency across folds. This strategy effectively mitigates the variability of feature selection results caused by limited sample sizes in mining areas.
Specifically, in each iteration, an RF classifier is first trained using the current feature subset, and the MDA importance score of each feature is computed based on out-of-bag (OOB) samples. The features are then ranked according to their importance scores, and only the single feature with the lowest importance is removed in the current iteration to avoid potential information loss caused by excessive elimination in a single step. After feature removal, the model is retrained using the remaining feature subset, and the feature importance ranking is updated, initiating the next recursive iteration. Through this recursive loop of model training, importance evaluation, feature ranking, and one-by-one elimination model retraining, the feature dimensionality is gradually compressed. This process reduces feature redundancy while alleviating the adverse effects of high-dimensional feature spaces on classification performance. For feature importance evaluation, this study adopts the mean decrease in accuracy metric derived from the random forest model based on OOB samples. The feature importance is calculated as follows:
V ( i ) = n = 1 N X n X 0 N .
where V ( i ) represents the importance of the feature variable i, N denotes the number of decision trees, X n is the OOB error of the nth decision tree after adding noise to feature i, and X 0 is the OOB error of the nth decision tree before adding noise to feature i.
On this basis, to further optimize feature variable selection, the K-fold cross-validation (K-CV) algorithm was introduced to iteratively evaluate different feature combinations. The optimal feature subset and the stopping criterion of the algorithm were determined based on the cross-validation scores. In the K-CV framework, features with the lowest importance are progressively removed in an iterative manner, and the classification performance of the model under different feature combinations is evaluated. The feature combination that yields the highest score is regarded as the optimal feature subset. The procedure of K-fold cross-validation is described as follows. First, the complete training dataset S is partitioned into k mutually exclusive subsets, denoted as S1, S2, …, Sk. Then, in each iteration, one subset is selected as the validation set, while the remaining k-1 subsets are used for training. This process is repeated k times, and the average of the validation results is taken as the final performance metric. Through this process, K-fold cross-validation enables efficient utilization of limited samples, reduces the randomness in model evaluation, and improves the robustness and generalization ability of the feature selection results.
Overall, the proposed RFE–MDA–CV method achieves a systematic optimization of multi-source, high-dimensional feature spaces through the integrated use of recursive feature elimination, feature importance evaluation, and cross-validation. By enhancing the generalization ability of the classification model while alleviating feature redundancy and overfitting, this method provides a transparent, parameter-controllable, and easily reproducible feature optimization framework for remote sensing classification in complex land use scenarios of rare earth mining areas.

3.3. Land Use Classification Algorithms

Four commonly used machine learning classification methods—CART, RF, GBDT, and SVM—were employed for land use classification. The most suitable classification algorithm for the study area was subsequently determined.
Random forest (RF) is a non-parametric ensemble learning algorithm composed of multiple independent decision trees [39]. It employs the bootstrap method to randomly sample from the training dataset with replacement. During classification, the final result is determined through a majority voting process among all trees, thereby improving classification performance by integrating multiple decision trees.
Classification and regression trees (CARTs) are a tree-based classification algorithm that recursively partition the training data into smaller subsets based on predefined criteria [40]. The process continues until the resulting subsets contain only samples from the same class or meet certain stopping conditions. Support vector machines (SVMs), first introduced by Cortes and Vapnik [41], are a widely used supervised binary classification method. It identifies the optimal separating hyperplane to distinguish different classes, maximizing the margin between them. By incorporating kernel functions, SVM can effectively handle non-linearly separable data.
Gradient boosting decision trees (GBDTs) are a machine learning technique widely applied to regression and classification tasks [42]. It sequentially constructs a series of decision tree models based on the residuals (prediction errors) of previous models, as measured by a specified loss function. These models are then integrated to form a more robust predictive model [43].
This study conducted systematic experiments for land cover classification in the study area by evaluating several mainstream classification algorithms. Classifier parameter configurations were optimized through cross-validation and empirical analysis to enhance model discrimination and generalization performance. For the RF classifier, a series of experiments with varying numbers of decision trees (ranging from 50 to 100) were conducted. Results indicated that setting the number of trees to 100 achieved the highest classification accuracy while maintaining computational efficiency. This finding aligns with existing literature, which can effectively improve the stability and generalization performance of the model while maintaining the diversity of feature subspaces [44]. For the CART algorithm, the optimal maximum number of nodes was determined to be 50 based on multiple rounds of cross-validation. This configuration effectively reduced the risk of overfitting while ensuring node purity and classification accuracy. The GBDT classifier was configured with 50 weak learners. Experimental results showed that increasing the number of trees beyond this point led to diminishing returns on validation accuracy while significantly increasing computational costs. The SVM classifier was implemented using the libsvm interface provided by GEE, employing the default radial basis function (RBF) kernel [45]. This kernel demonstrates strong nonlinear classification capabilities in high-dimensional feature spaces. Although this interface does not offer explicit hyperparameter tuning options, extensive validation testing indicates that the default configuration exhibits robust adaptability and achieves high classification accuracy in land cover classification tasks. All optimal parameter settings were empirically validated on an independent validation dataset, significantly improving the reliability and generalization ability of the six-category land cover classification tasks.

3.4. Land Use Transition Matrix

The transition matrix can quantitatively describe land use changes and transformation processes [46]. To quantitatively analyze the transformations among different land use categories, this study performs a spatial overlay analysis based on land use classification results and calculates the transition areas between various types. The mathematical expression of the transition matrix is as follows:
S = S i j = S 11 S 12 S 1 n S 21 S 22 S 2 n S 3 n S n 1 S n 2 S n n .
In the equation, S represents the land use transition matrix, where S i j denotes the area converted from land use type i to type j. The diagonal elements represent unchanged areas, while the off-diagonal elements indicate transitions between different land use types.

3.5. Land Use Dynamic Degree

(1) Single Land Use Dynamic Degree
The single land use dynamic degree represents the rate of change of a specific land use type over a certain period [47], reflecting the level of activity of that land use type. The calculation formula is
K i = U j U i U i × 1 T × 100 % .
In the equation, K i represents the average annual change rate of a specific land use type during the study period.
(2) Comprehensive Land Use Dynamic Degree
The comprehensive land use dynamic degree is used to measure the overall change rate of all land use types in the entire study area during the study period [48]. It comprehensively considers the changes of various land use types and reflects the overall level of land use change in the region. The calculation formula is
K c = i = 1 n | U j U i | 2 i = 1 n U i × 1 T × 100 % .
In the equation, K c represents the average annual change rate of land use in the entire region during the study period. It is a composite indicator that reflects the overall changes of all land use types in the region. A higher value indicates more intense land use changes in the region.

4. Results and Analysis

4.1. Analysis of Feature Optimization Results

4.1.1. Feature Selection Based on RFE-MDA

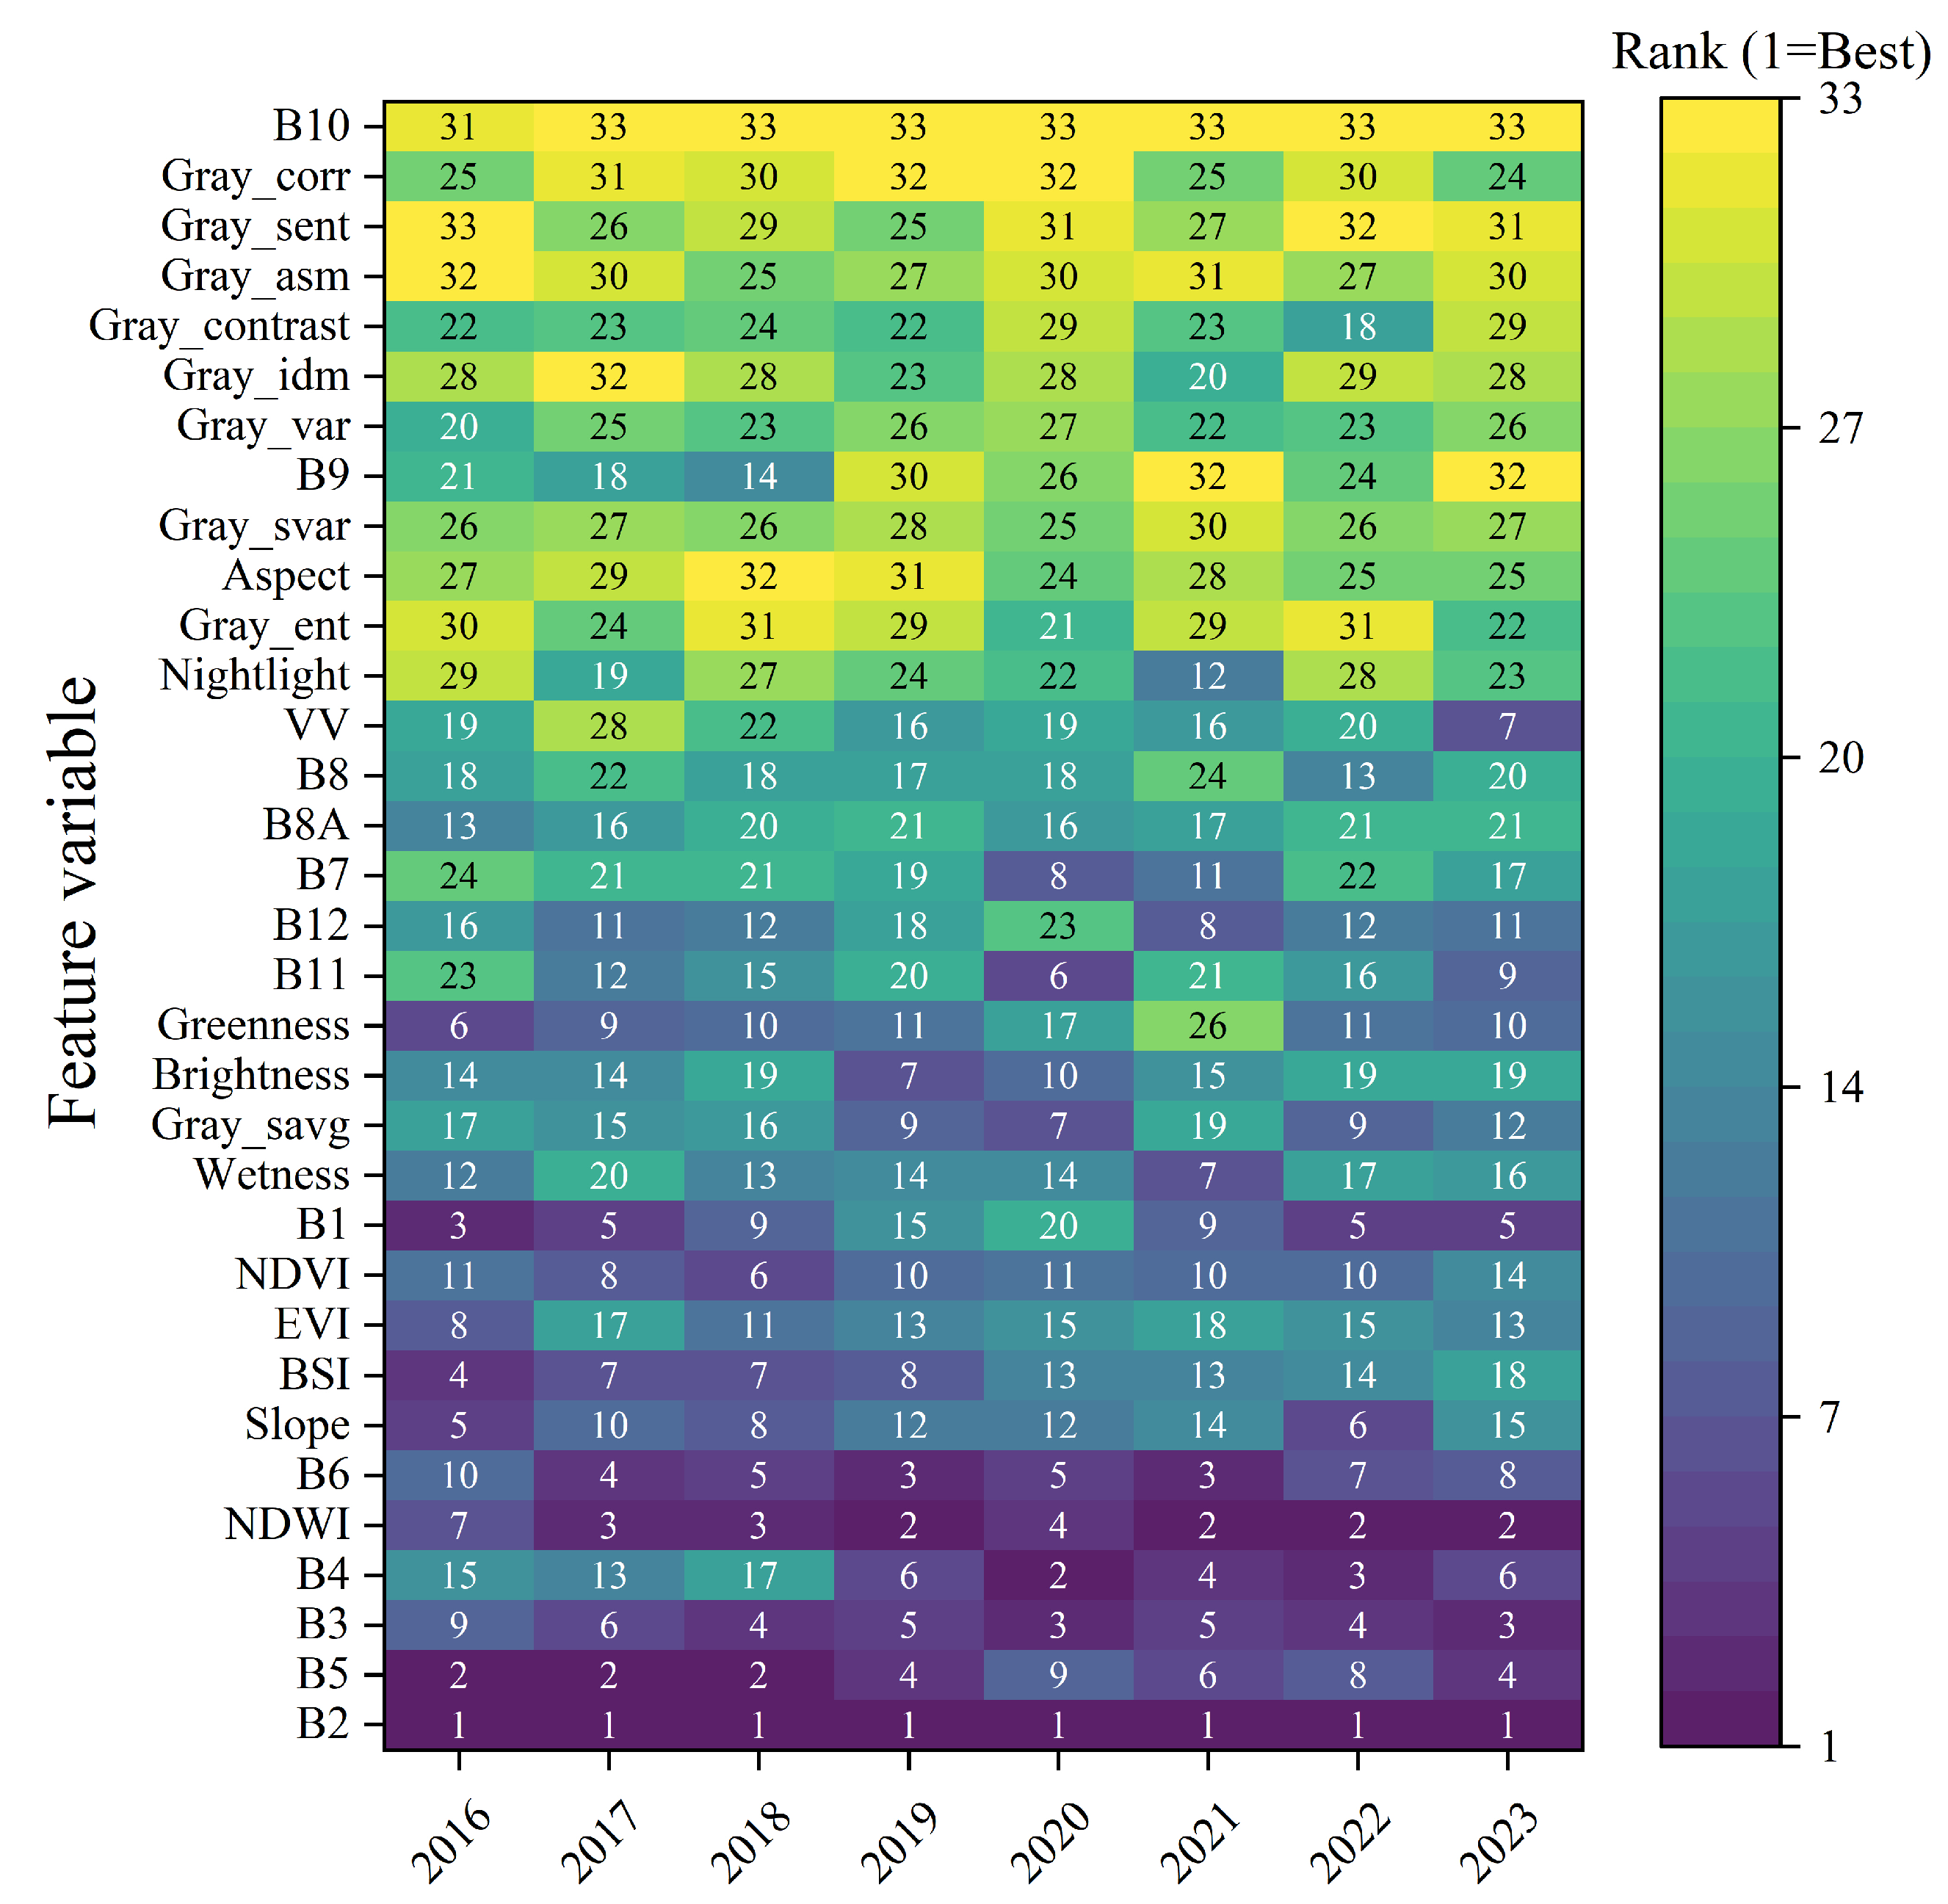
To effectively identify the most contributive feature variables for land use classification, this study employed RF-MDA to evaluate the average importance scores of 33 feature variables involved in land use classification from 2016 to 2023. Figure 4 presents the heatmap of feature importance rankings for the 33 variables over the study period, illustrating the relative ranking of each feature in annual land use classification tasks where lower values indicate higher importance (with 1 being the most important).
The results indicate that spectral features, particularly bands B2 to B5, exhibit the highest importance in classification tasks, significantly outperforming other variables. Vegetation and water indices, including NDWI, NDVI, BSI, EVI, greenness, brightness, and wetness, also show high stability and importance, indicating strong discriminative ability, which is consistent with empirical patterns in remote sensing classification. In contrast, texture features (e.g., GLCM-derived indicators) and nighttime light data exhibit greater interannual variability, suggesting limited influence on classification tasks, though they may provide complementary value for specific land cover types or particular years. Overall, spectral features and vegetation indices play a dominant role in land use classification, followed by topographic and nighttime light data, while texture features contribute relatively less. This analysis provides a valuable basis for optimizing classification models and improving classification accuracy. It should be noted that the differences in both the size and composition of the optimal feature subsets across different years primarily arise from interannual variations in surface conditions and training sample structures within the study area. During the period from 2016 to 2023, variations in mining disturbance intensity and the progress of ecological restoration in the rare earth mining area led to changes in the spatial distribution and proportional composition of land cover types, such as bare land, vegetation, and water bodies. These changes, in turn, affected the relative discriminative contributions of different feature variables in the classification task. Meanwhile, interannual differences in the class proportions and spatial distributions of the training samples also altered the model’s dependence on specific feature information. By incorporating a cross-validation-driven recursive elimination process, the RFE–MDA–CV method adaptively selects the most discriminative feature combination for each year. As a result, the optimal feature subsets vary across years, more faithfully reflecting the dynamic evolution of surface information structures in the mining area.

4.1.2. K-Fold Cross-Validation

Considering the impact of the number of cross-validation folds (k) on the classification accuracy of the RF model, this study designed nine cross-validation models with k values ranging from 2 to 10 (k = 2, 3, …, 10) based on the training sample data. For each model, the highest cross-validation score was extracted and compared to evaluate the classification performance under optimal conditions. The aim was to identify the optimal number of folds most suitable for the training samples in the study area. The maximum scores varied with different values of k. For instance, in 2016, the RF model achieved the best performance with k = 6, yielding the highest prediction accuracy. Therefore, k = 6 was selected as the optimal cross-validation parameter for feature subset selection in 2016. Similarly, the optimal values of k for other years were determined as follows: k = 10 for 2017; k = 5 for 2018; k = 8 for both 2019 and 2020; k = 9 for 2021 and 2023; and k = 4 for 2022.
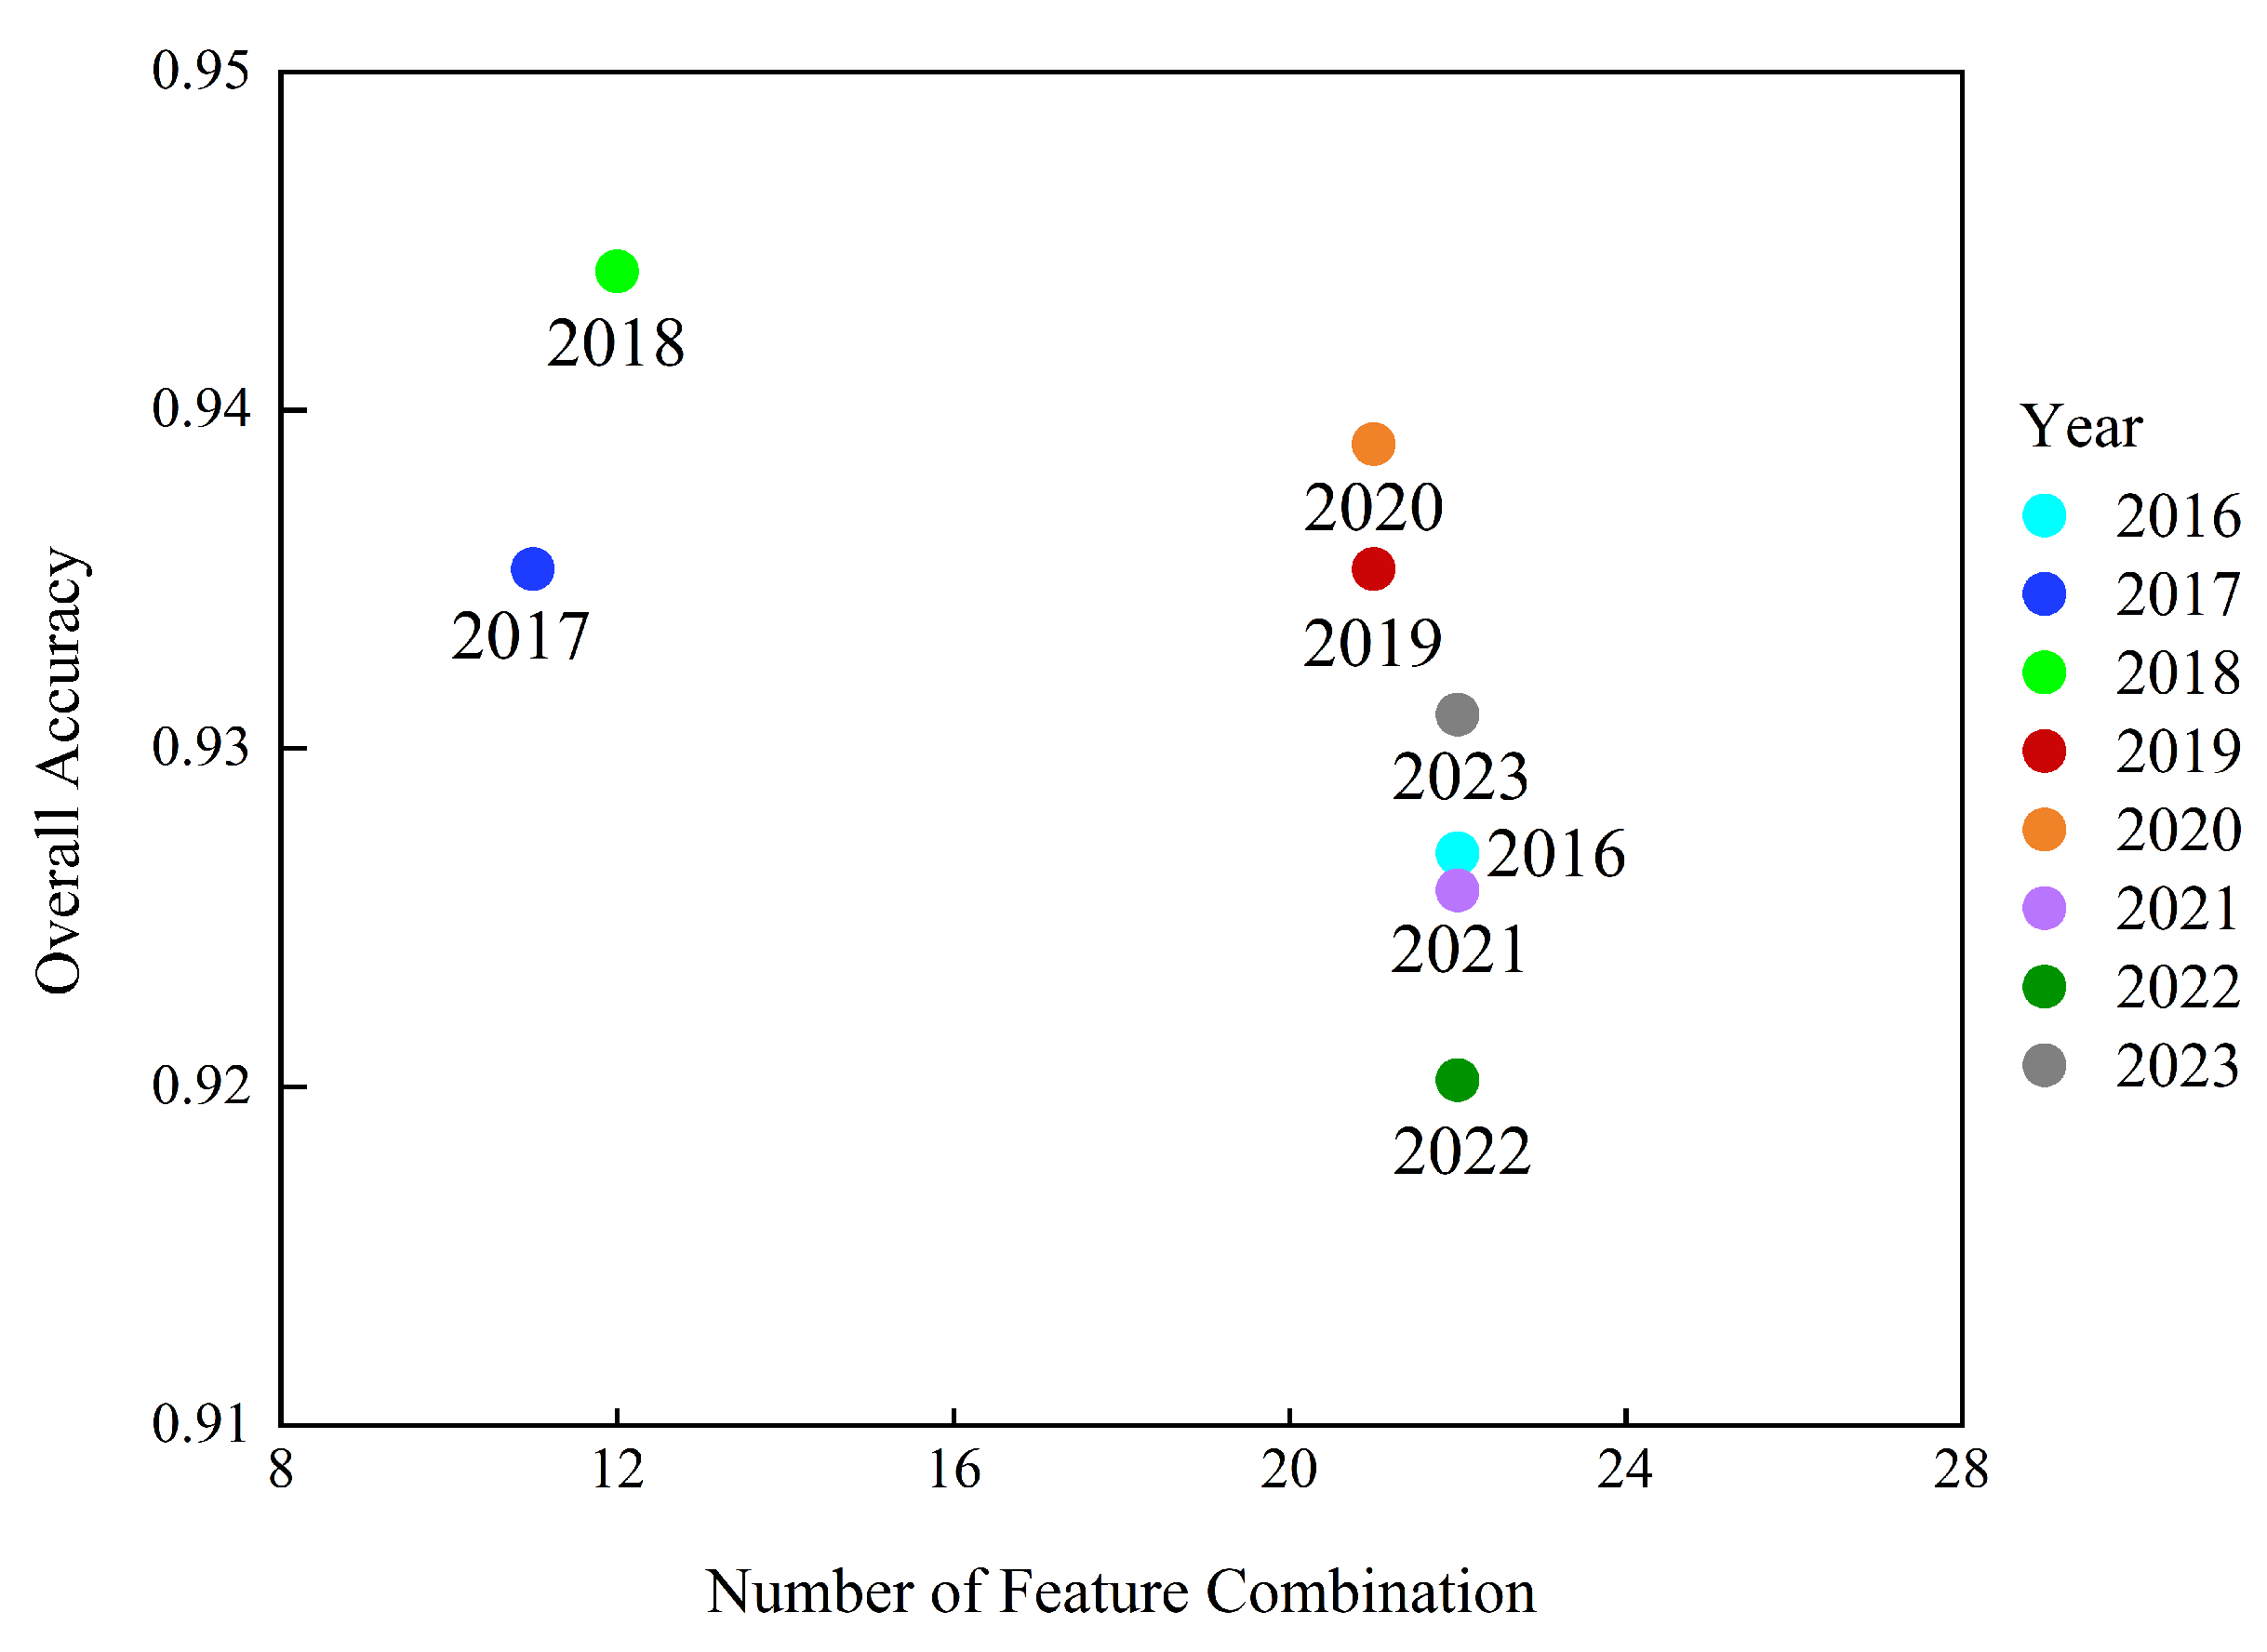
Using the RFE-MDA-CV algorithm, the optimal feature subsets were constructed by iteratively eliminating the least important features (as shown in Figure 4), allowing an analysis of the relationship between the number of feature combinations and classification accuracy. The resulting trends, illustrated in Figure 5, demonstrate that as the number of features increases, the classification accuracy gradually stabilizes, and further improvements become marginal. The feature selection results indicate that it is possible to reduce the involvement of irrelevant features while maintaining high classification accuracy, thereby improving classification efficiency. For the year 2019, the optimal number of features was determined to be 21, consisting of: B2, NDWI, B6, B5, B3, B4, brightness, BSI, gray_savg, NDVI, greenness, slope, EVI, wetness, B1, VV, B8, B12, B7, B11, and B8A. In 2020, the classification accuracy peaked when the feature subset included the following 21 variables: B2, B4, B3, NDWI, B6, B11, gray_savg, B7, B5, brightness, NDVI, slope, BSI, wetness, EVI, B8A, greenness, B8, VV, B1, and gray_ent. The optimal numbers of selected features for other years were as follows: 22 for 2016; 11 for 2017; 12 for 2018; 22 for 2021, 2022, and 2023.

4.2. Comparison of Feature Combination Results

To validate the effectiveness of the feature selection-based classification method and analyze the roles of vegetation indices, water indices, topographic indices, nighttime light remote sensing indices, radar features, tasseled cap transformation, and spectral features in classification, ten experimental schemes were designed for comparative study. The feature combinations used in each scheme are presented in Table 4. The scheme design followed the principle of from basic to integrated and from extended to optimized. Specifically, the first (Schemes 1–3), based on the original Sentinel-2A spectral features, topographic indices, textural indices, and vegetation indices were individually and jointly added to construct baseline schemes and evaluate their independent and combined effects. Subsequently (Scheme 4), the three basic feature types were integrated to examine their synergistic performance. Further (Schemes 5–8), based on Scheme 4, tasseled cap transformation components, Sentinel-1 VV polarization data, and nighttime light remote sensing data were progressively introduced to assess the marginal contributions of extended features. Scheme 9 integrated all features to compare the differences between the “full feature” and “optimized feature” configurations. Finally (Scheme 10), the feature set optimized through the RFE–MDA–CV algorithm was adopted to verify the effectiveness of the optimization approach in reducing feature dimensionality while maintaining or improving classification accuracy.
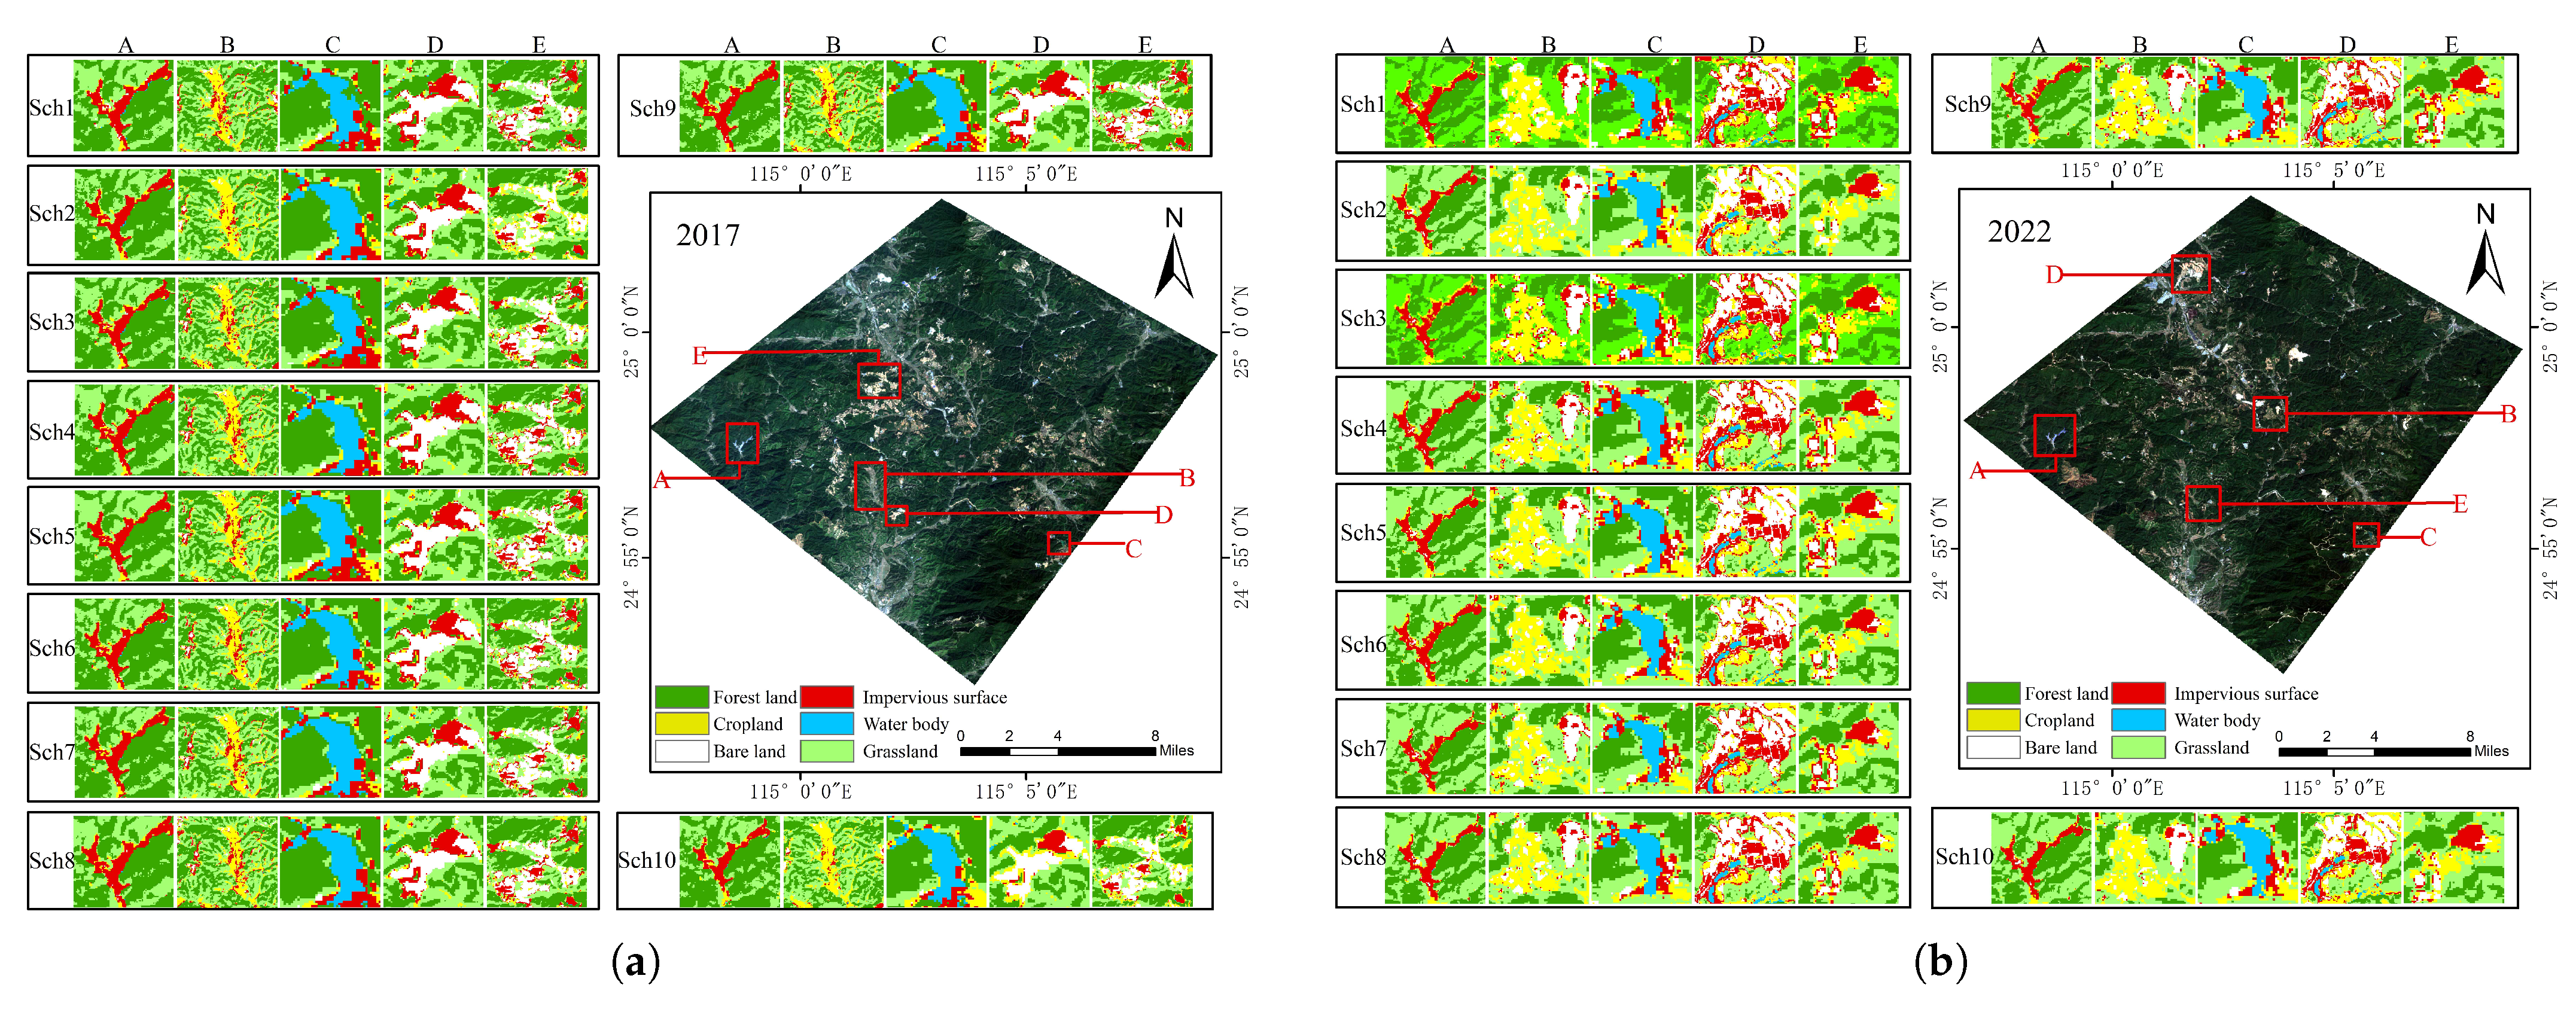
In this study, the land use classification results of the Lingbei mining area were evaluated using OA and the kappa coefficient. Table 5 presents the classification accuracies of the RF classifier under ten different feature combination schemes for the years 2017 and 2022. Figure 6 demonstrates the classification details of different feature combinations under the RF algorithm for 2017 and 2022. Among them, Scheme 10 achieved the highest OA (93.53% in 2017 and 92.02% in 2022) and kappa (0.9198 in 2017 and 0.9013 in 2022). Compared to single feature combinations, Scheme 10 improved OA by an average of 2.1 percentage points and the kappa by 0.027, indicating that the feature selection method significantly enhanced classification accuracy and reliability. These findings provide a valuable reference for land use classification studies in the Lingbei mining area and similar regions.
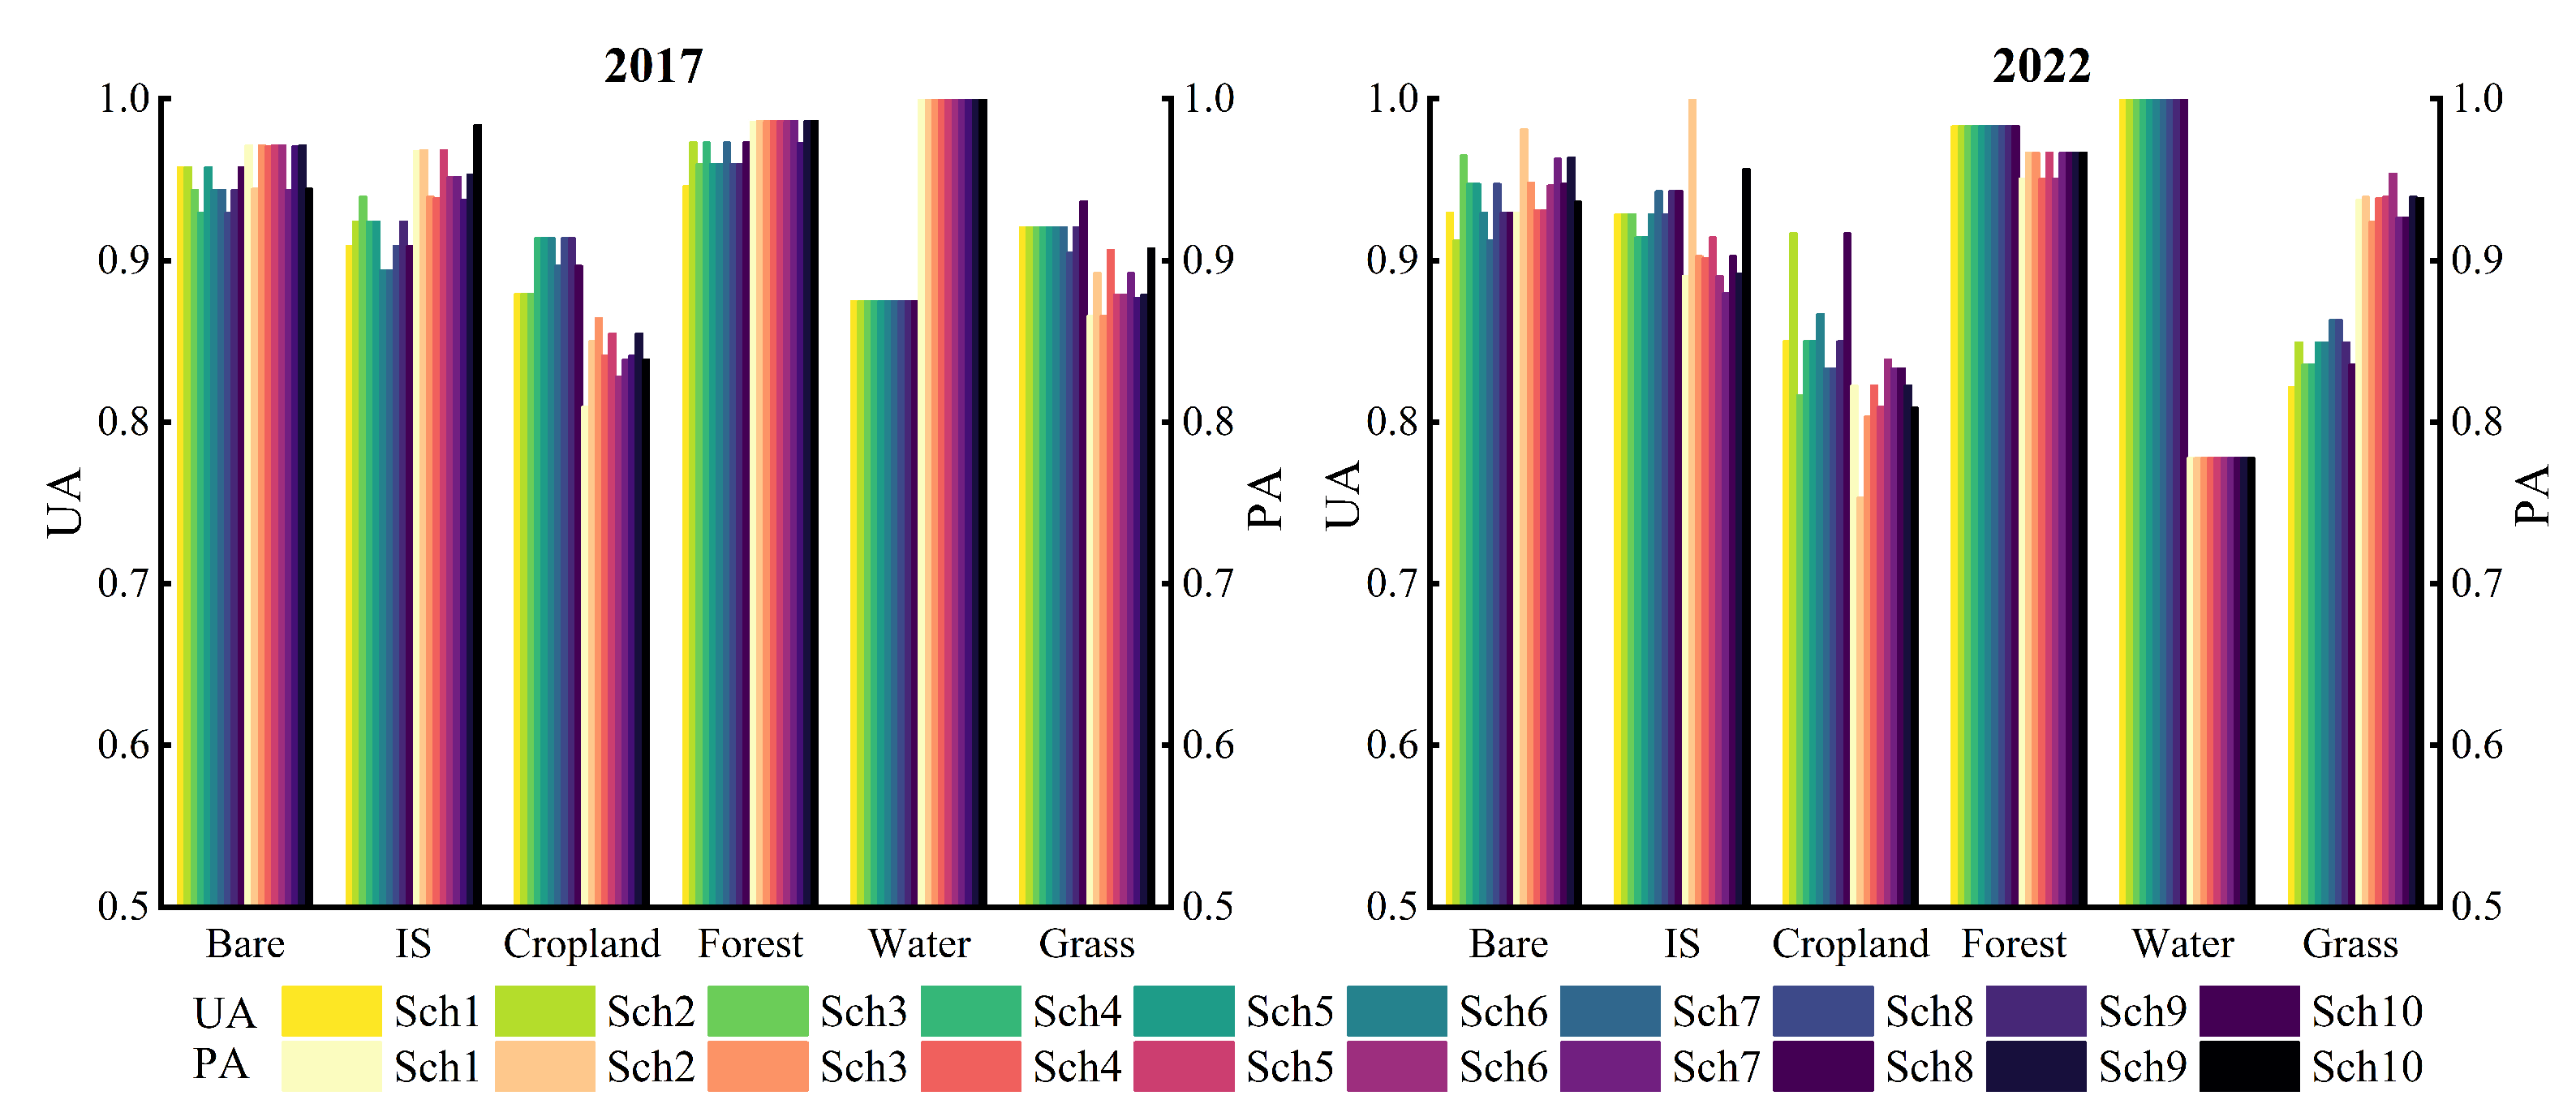
From the producer’s accuracy (PA) and user’s accuracy (UA) of each land cover type, Figure 7, it is evident that the classification performance of Schemes 1–4 is relatively similar, particularly in forest and bare land classification, although they show slight deficiencies in distinguishing between cropland and impervious surface (IS). Schemes 5, 7, and 9, which incorporated Sentinel-1 VV data, significantly improved classification accuracy, especially in distinguishing between impervious surfaces (such as buildings) and bare land. Schemes 6–9, which included nighttime light remote sensing indices, were particularly effective in differentiating urban buildings and impervious surfaces, resulting in improved performance in impervious surface identification. The inclusion of the tasseled cap transformation in Schemes 5, 8, and 9 further enhanced the classification stability and accuracy, particularly in identifying transitional areas between forest land and bare land. Scheme 9, which integrated all feature types, effectively distinguished between bare land, cropland, forest land, and impervious surface. However, the complex feature combination increased computational costs and imposed higher requirements for data preprocessing and model training. Scheme 10, through feature selection, identified the most influential features for classification, effectively improving classification accuracy while reducing the interference of redundant features, significantly enhancing the model’s robustness.

4.3. Comparison of Different Classification Algorithms

Table 6 presents the interannual variations in OA and kappa of Scheme 10 from 2016 to 2023 using four classification algorithms: RF, CART, SVM, and GBDT. The analysis indicates that RF consistently achieved the highest or near-highest accuracy across all years, with OA remaining within a relatively high range. Even in years characterized by pronounced land use confusion (e.g., 2020 and 2023), RF maintained an accuracy exceeding 92%, demonstrating strong stability. This finding is consistent with previous studies reporting the superior performance of RF in high-dimensional remote sensing classification tasks [49,50,51,52]. In contrast, CART, due to its single decision tree structure, exhibited relatively limited performance when handling complex feature spaces and variations in class distribution. Meanwhile, SVM and GBDT provided important performance benchmarks for comparison with RF.
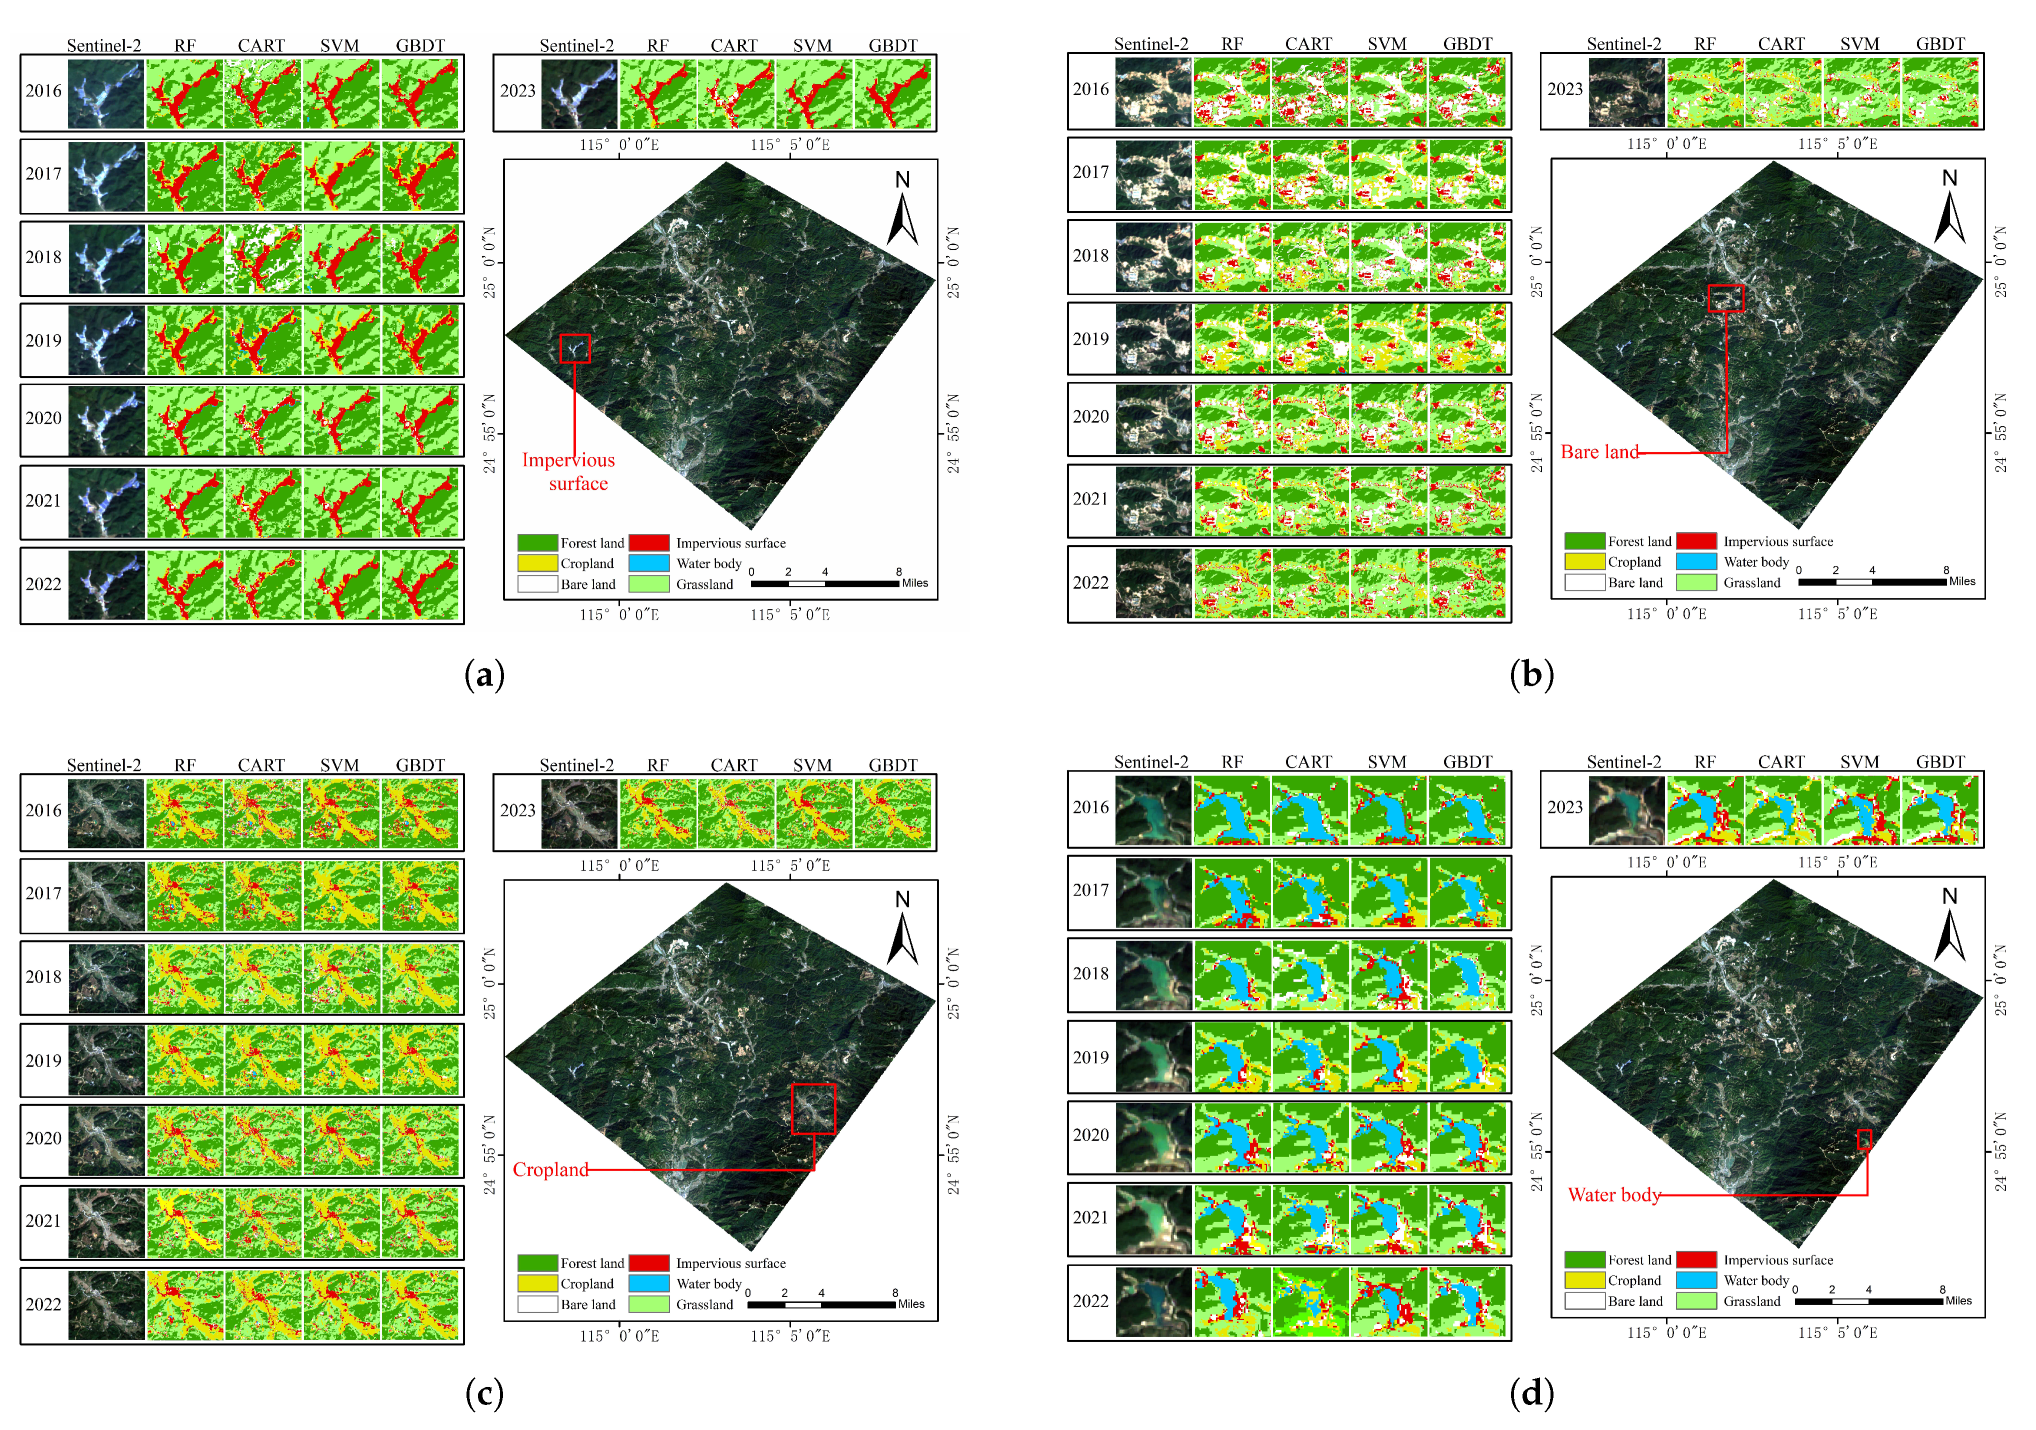
Figure 8 further illustrates the differences among the algorithms in terms of boundary delineation and regional integrity. RF demonstrates superior spatial continuity and boundary smoothness in transitional zones between impervious surfaces and bare land, effectively suppressing local noise and fragmentation. In contrast, CART tends to produce scattered misclassifications in areas with complex boundaries, while SVM exhibits a certain degree of over-segmentation for some land cover classes. Overall, RF achieves the best performance in the land use classification task, maintaining high accuracy while effectively reducing misclassification and spatial fragmentation.
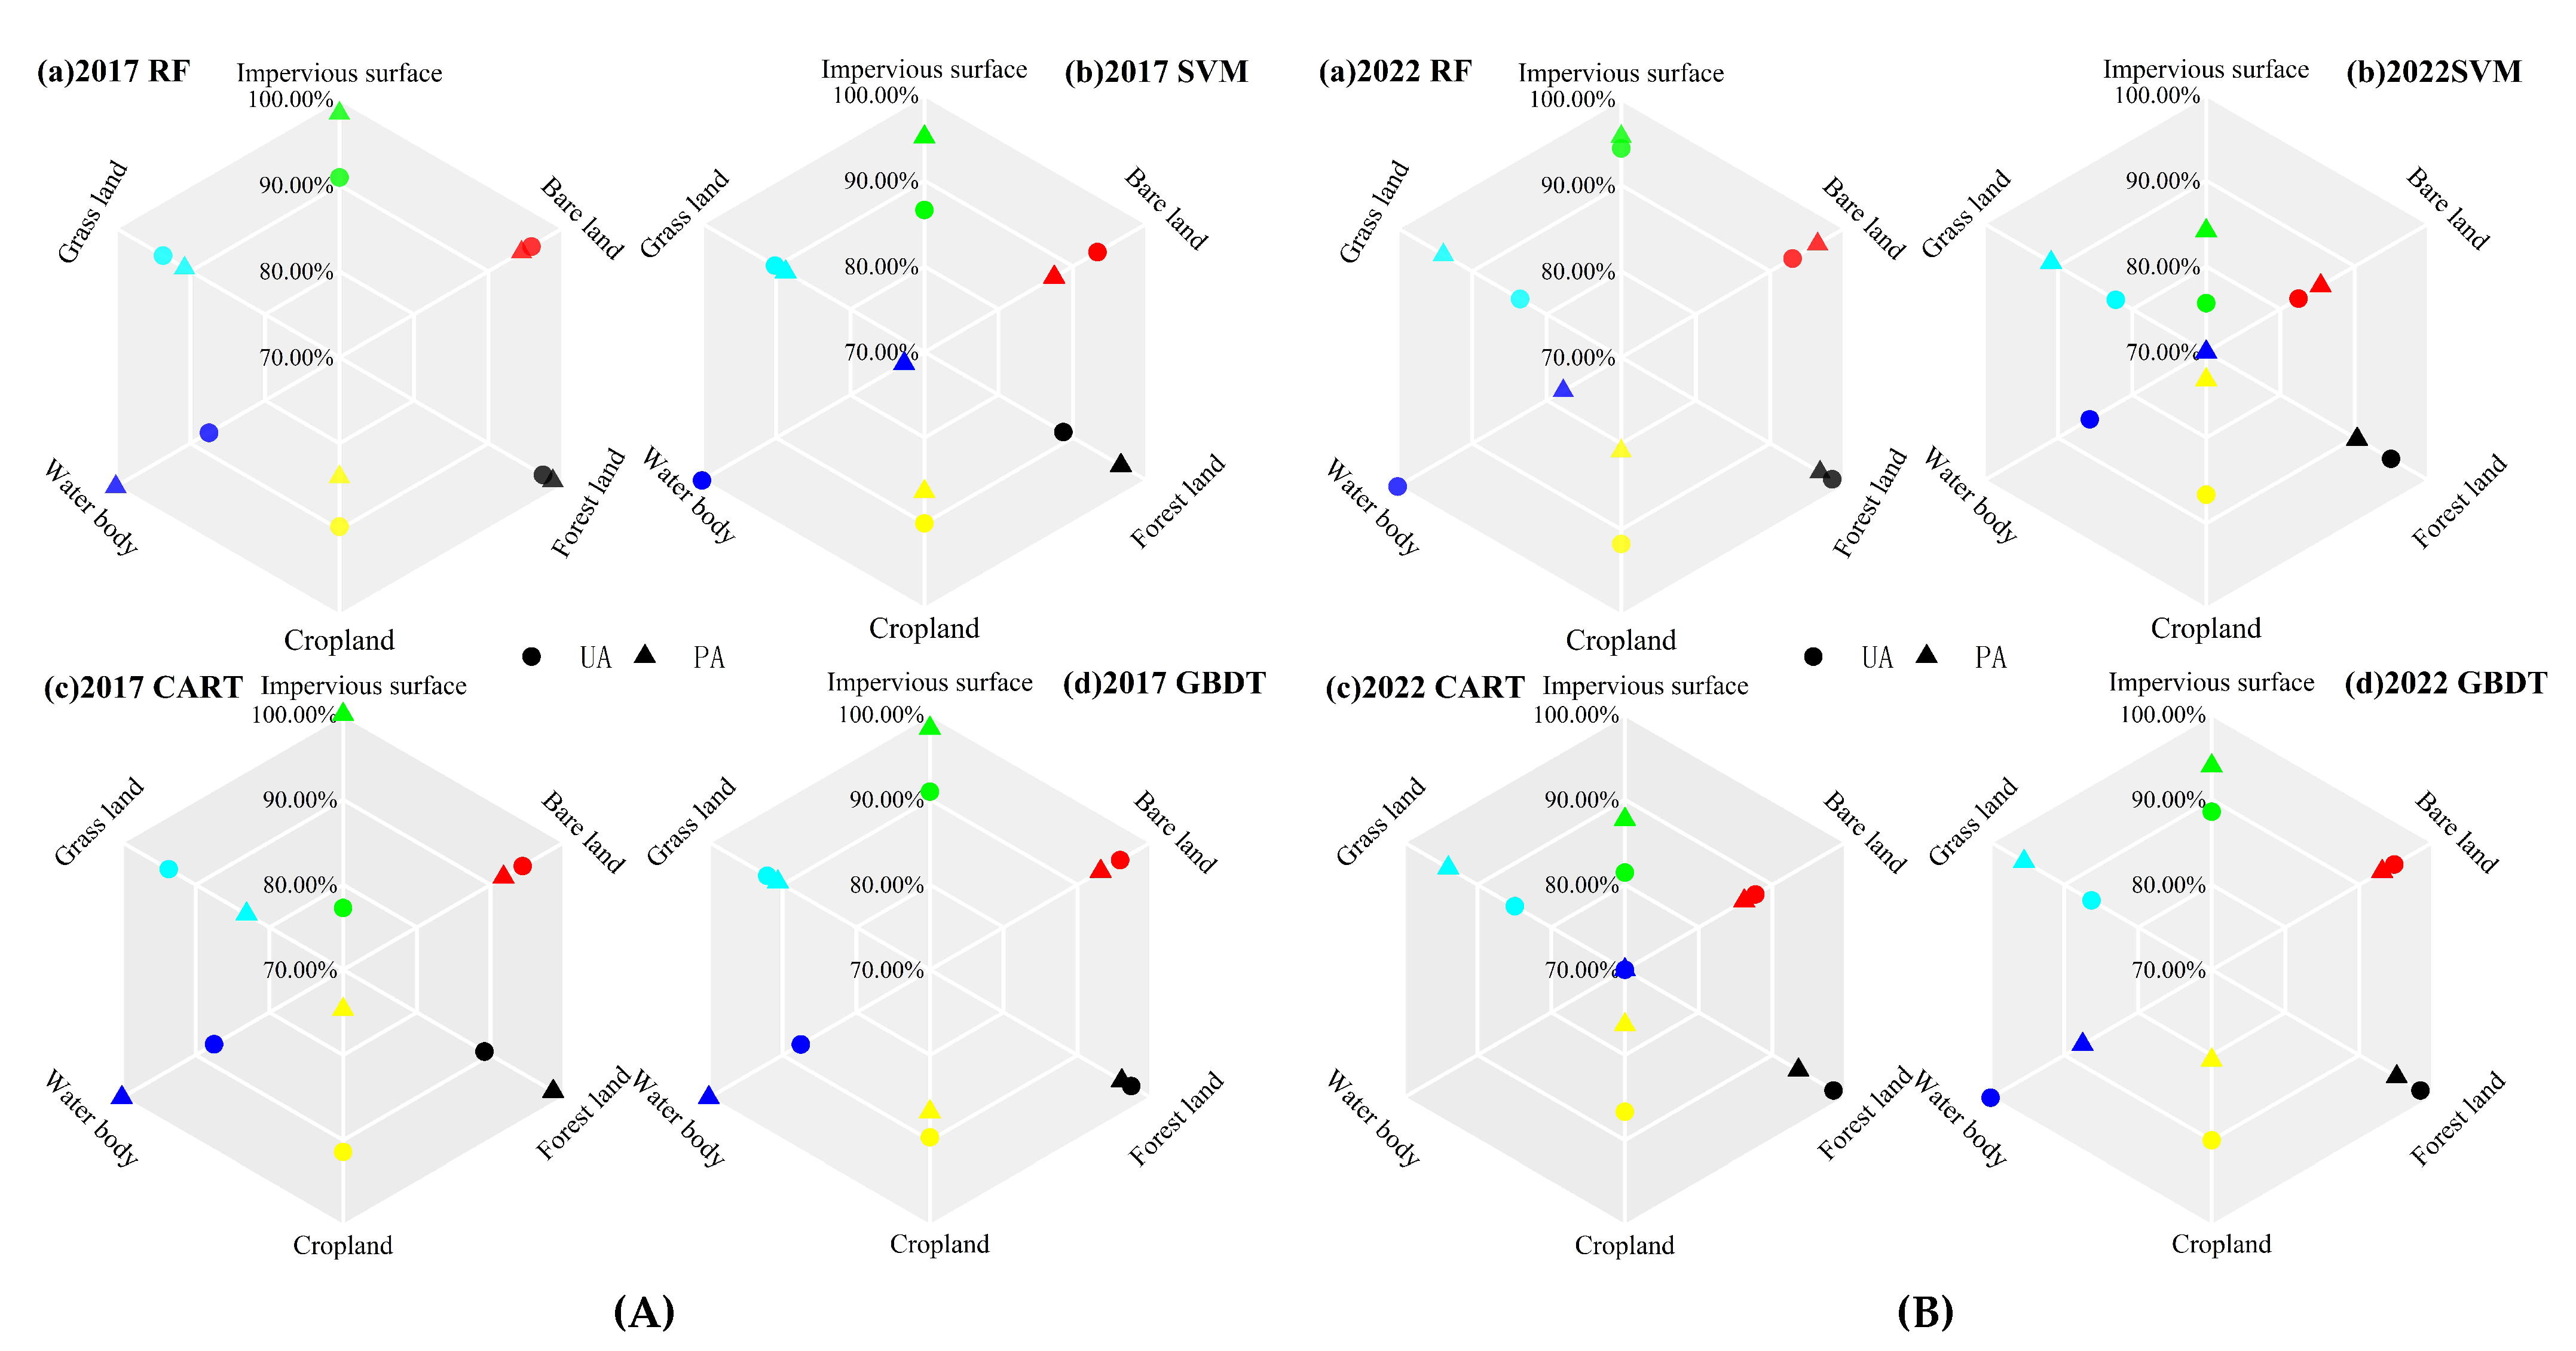
Figure 9 presents the PA and UA of six land cover types classified by different algorithms in 2017 and 2022. Overall, RF exhibits relatively stable performance across most classes, maintaining comparatively high accuracy levels. CART shows certain limitations in the water class, with UA around 70%. In the classification of impervious surfaces and water bodies, RF and GBDT demonstrate more robust performance, whereas SVM and CART exhibit confusion between spectrally similar classes in some cases. Cropland accuracy fluctuates in transitional areas due to spectral variability, and both bare land and grassland present misclassification challenges for all models because of their spectral similarity. In general, RF demonstrates a more balanced recognition capability under complex mining-area conditions.
In this study, CART, SVM, and GBDT were selected as core comparative algorithms to systematically evaluate and more clearly identify the source of RF’s advantages. By benchmarking RF performance against a diverse set of models, the study ensures that the conclusions drawn are both generalizable and persuasive. This multidimensional analysis of model performance differences provides a more comprehensive basis for model selection. In summary, RF outperformed other algorithms in land cover classification tasks due to its superior capability in feature handling and high adaptability to complex land surface patterns. Its remarkable robustness throughout the feature optimization processes across different years was also thoroughly validated.

4.4. Cross-Regional Generalization Capability Validation

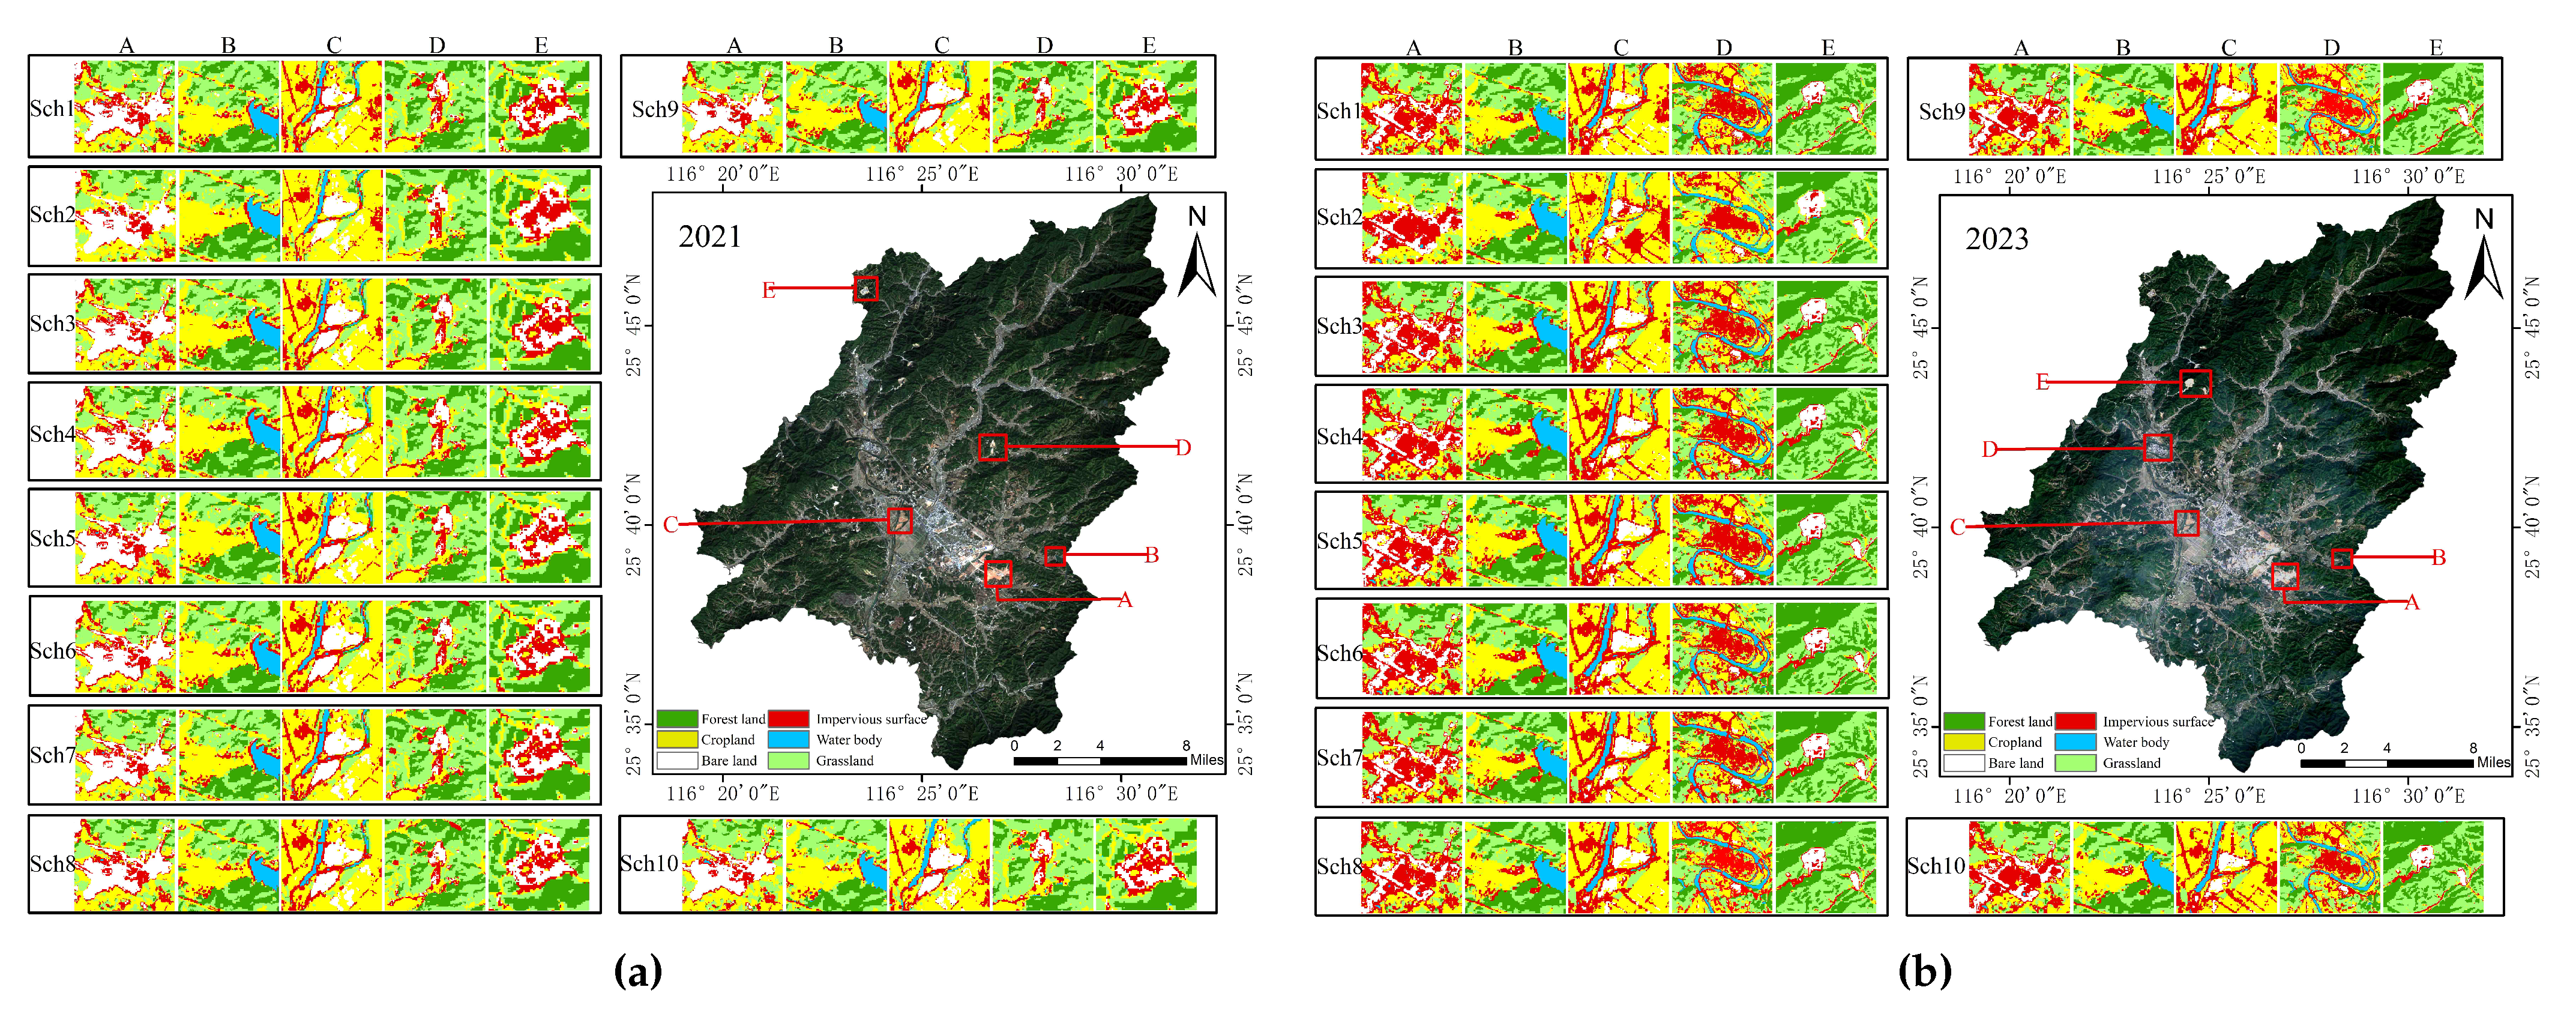
To evaluate the transferability of the proposed RFE–MDA–CV framework across different mining regions, the Hetian Town rare earth mining area in Changting County, Fujian Province, was selected as an external validation site. This area is also located in the hilly region of southern China and belongs to the weathered crust-type ion-adsorption rare earth deposit zone, making it highly comparable to the Lingbei mining area. In the experimental design, data from 2021 and 2023 were randomly selected, and classification experiments were conducted under consistent feature construction procedures and model parameter settings.
The feature optimization results indicate that, for the 2021 dataset, an 8-fold cross-validation strategy was employed to select the optimal feature subset, resulting in 27 selected features, including B2, B1, BSI, gray_savg, B4, B11, B3, B5, NDWI, greenness, NDVI, B12, EVI, brightness, gray_contrast, B8, VV, gray_svar, gray_idm, B6, gray_corr, wetness, NIGHTLIGHT, B9, gray_var, gray_sent, and B7. For the 2023 dataset, a 10-fold cross-validation strategy was adopted, and 23 features were retained, including EVI, BSI, B5, B4, B1, B2, NDWI, greenness, B11, B3, B8, NDVI, B12, B7, wetness, gray_var, gray_savg, VV, gray_contrast, gray_idm, brightness, B6, and slope. As shown in Table 7, Scheme 10 achieved the best performance in both years, with OA and kappa reaching 93.53% and 0.9199 in 2021 and 93.48% and 0.9188 in 2023, respectively. Further examination of the spatial distribution of the classification results Figure 10 shows that the overall pattern of land use types is consistent across the study area, with clear and continuous class boundaries. This suggests that the proposed feature optimization framework can maintain stable discriminative performance in this mining scenario. Overall, the cross-regional experiment provides preliminary evidence that the proposed method is applicable under similar geomorphological and metallogenic conditions and indicates a certain potential for regional extension.

4.5. Spatiotemporal Evolution Characteristics of Land Use

4.5.1. Temporal Changes in Land Use

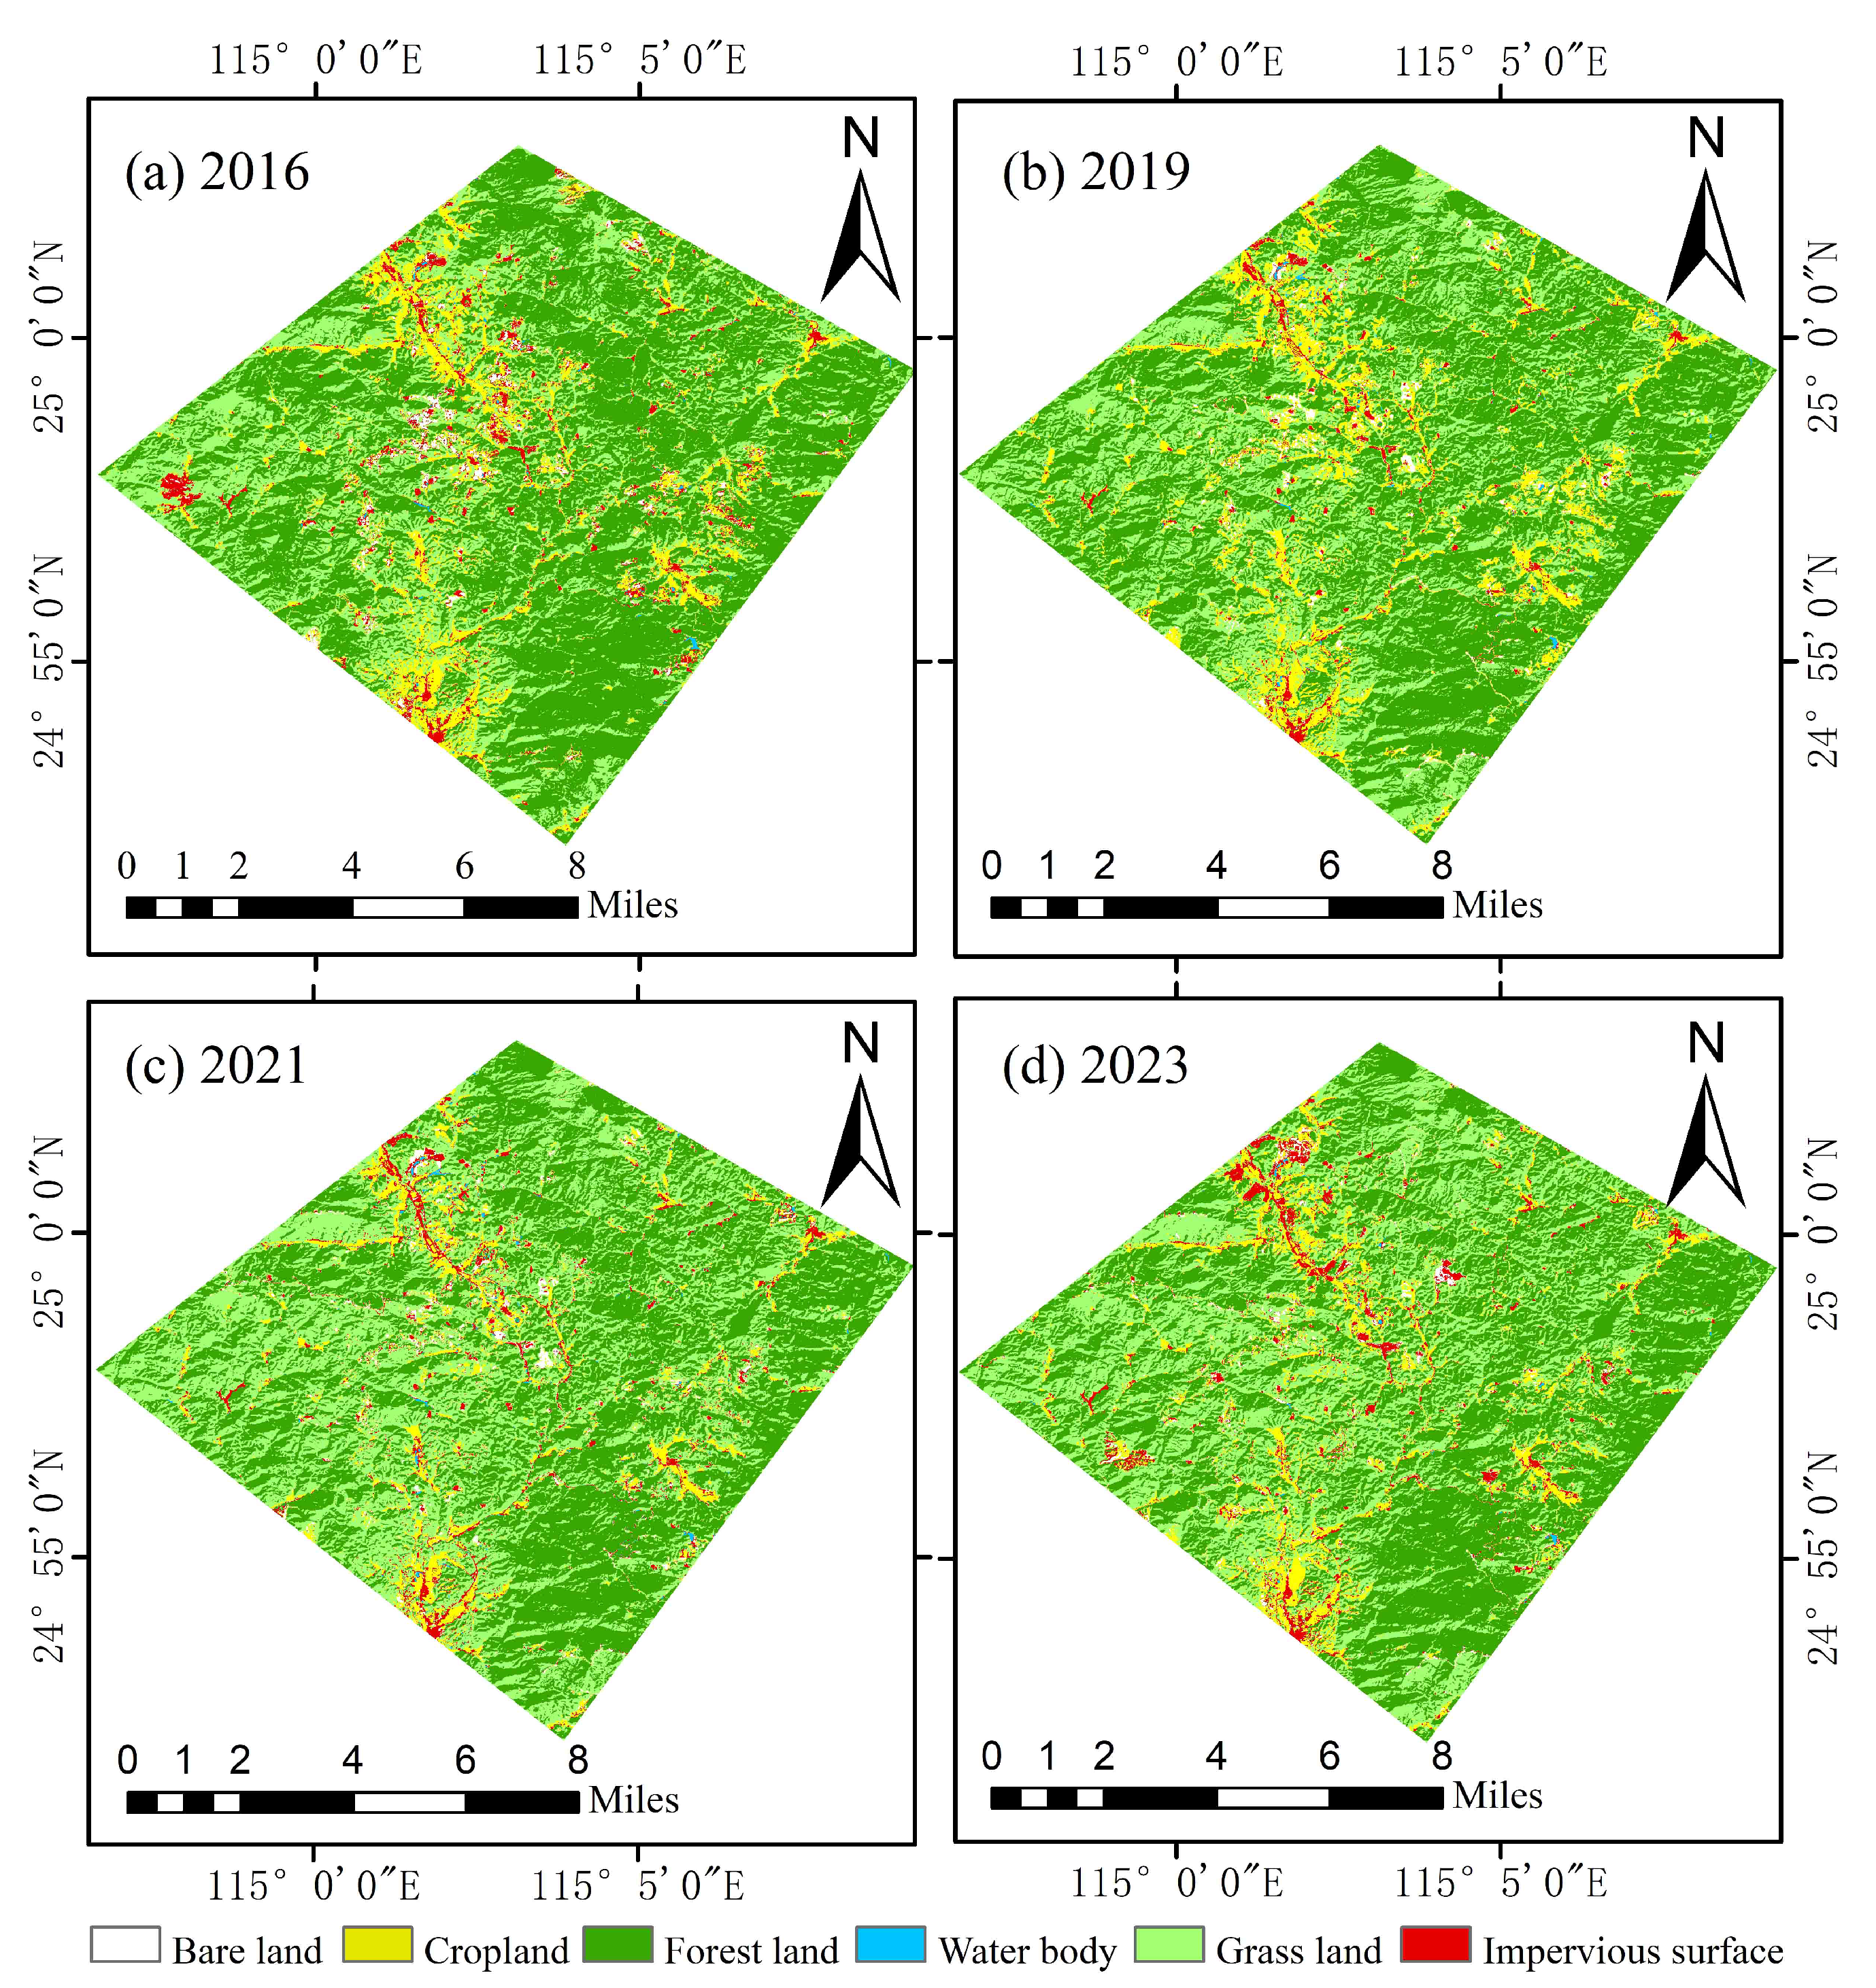
Based on the above classification accuracy evaluation results, this study employs the RF algorithm and the proposed selected feature combination to conduct a dynamic analysis of land use changes in the Lingbei mining area over the past decade. Figure 11 and Figure 12 display the land use classification results for the Lingbei mining area from 2016 to 2023.
Based on the data presented in Table 8 and illustrated in Figure 11, the land use area changes in the Lingbei mining area from 2016 to 2023 reveal frequent transitions among different land use types. From 2016 to 2023, forest land shows an overall decreasing trend, with a particularly sharp decline in 2020, when the forest area dropped to 99.38 km2. Cropland area fluctuates significantly during 2016–2023, decreasing from 20.82 km2 in 2016 to 15.11 km2 in 2023. Bare land area declines from 3.18 km2 to 2.43 km2 over the same period. The substantial reduction in bare land suggests a gradual decrease in mining development intensity, accompanied by large-scale land reclamation and ecological restoration activities. The water body area exhibits considerable fluctuations, with a short-term increase in 2017 followed by an overall declining trend. In general, forest land and cropland show relatively large variations, while bare land and impervious surfaces undergo structural adjustments. These changes are likely driven by the combined effects of regional development activities, policy adjustments, and ecological restoration measures.

4.5.2. Land Use Type Transition Analysis

From 2016 to 2023, land use transitions in the Lingbei mining area were primarily influenced by policy directives, land management practices, and natural succession processes. Significant changes in land use types were observed, revealing the process of grassland-dominant occupation triggered by policy-oriented ecological restoration. As shown in Table 9, all major ecological land categories exhibited a decreasing trend, except for grassland, which expanded by 63.7%. Notably, 92.9% of the newly added grassland area originated from the conversion of forest land and cropland. The water body shrank by 37%, with 35.60% of the original area fragmenting and transitioning into impervious surface (IS) and forest land. Cropland declined by 27.5%, largely due to cropland being converted into grassland as part of reforestation and ecological restoration programs. Forest land experienced a degradation of 20.30%, with a net loss of 34.88 km2. Although impervious surfaces showed a slight decrease of 1.45%, their internal spatial structure underwent significant reorganization, indicating a reduction in human activities and the implementation of ecological restoration policies within the mining area. These changes confirm the coexistence of hydrological fragmentation and cultivated land degradation, underscoring the need for a rigid, coordinated protection strategy involving water bodies, forest land, and cropland. Such an integrated approach is essential to balancing the ecological restoration benefits and the long-term sustainability of resources in mining-impacted regions.
The structure of land use transitions varied across different periods. From 2016 to 2023, the conversion among forested land, grassland, and impervious surfaces remained the dominant trend. The reduction in impervious surface reflects the restoration of the natural ecosystem. A key challenge for future land management and planning will be achieving a better balance between economic development and ecological conservation.

4.5.3. Land Use Dynamic Degree Analysis

Table 10 presents the dynamic degree characteristics of different LULC types in the Lingbei mining area from 2016 to 2023. Overall, impervious surfaces, bare land, and water bodies exhibit the most pronounced dynamic changes during 2017–2020, suggesting the occurrence of large-scale mining activities or significant surface disturbances during this period. In particular, the dynamic degrees of impervious surfaces and water bodies show synchronous increases and decreases in several years, indicating a certain degree of linkage in their area changes. In contrast, forest land, cropland, and grassland display relatively stable dynamic trends, with fluctuations occurring only in specific years. Cropland shows a noticeable decline in dynamic degree during 2019–2020, while remaining relatively stable in other years. Grassland demonstrates an overall trend of continuous positive growth. Water bodies increased briefly during 2018–2019 but declined rapidly thereafter, exhibiting relatively large fluctuations and higher instability. Furthermore, the comprehensive dynamic degree (Kc) curve remains generally stable, reaching a local peak only during 2018–2020. This indicates that although certain land use types experienced significant fluctuations, the overall land use change in the region remained within a relatively controlled and stable range. These findings indirectly suggest that land use dynamics in the Lingbei mining area are influenced by both anthropogenic disturbances and ecological regulation measures, reflecting the complex interplay between land development and environmental conservation.

4.5.4. Mining Activity Driving Analysis

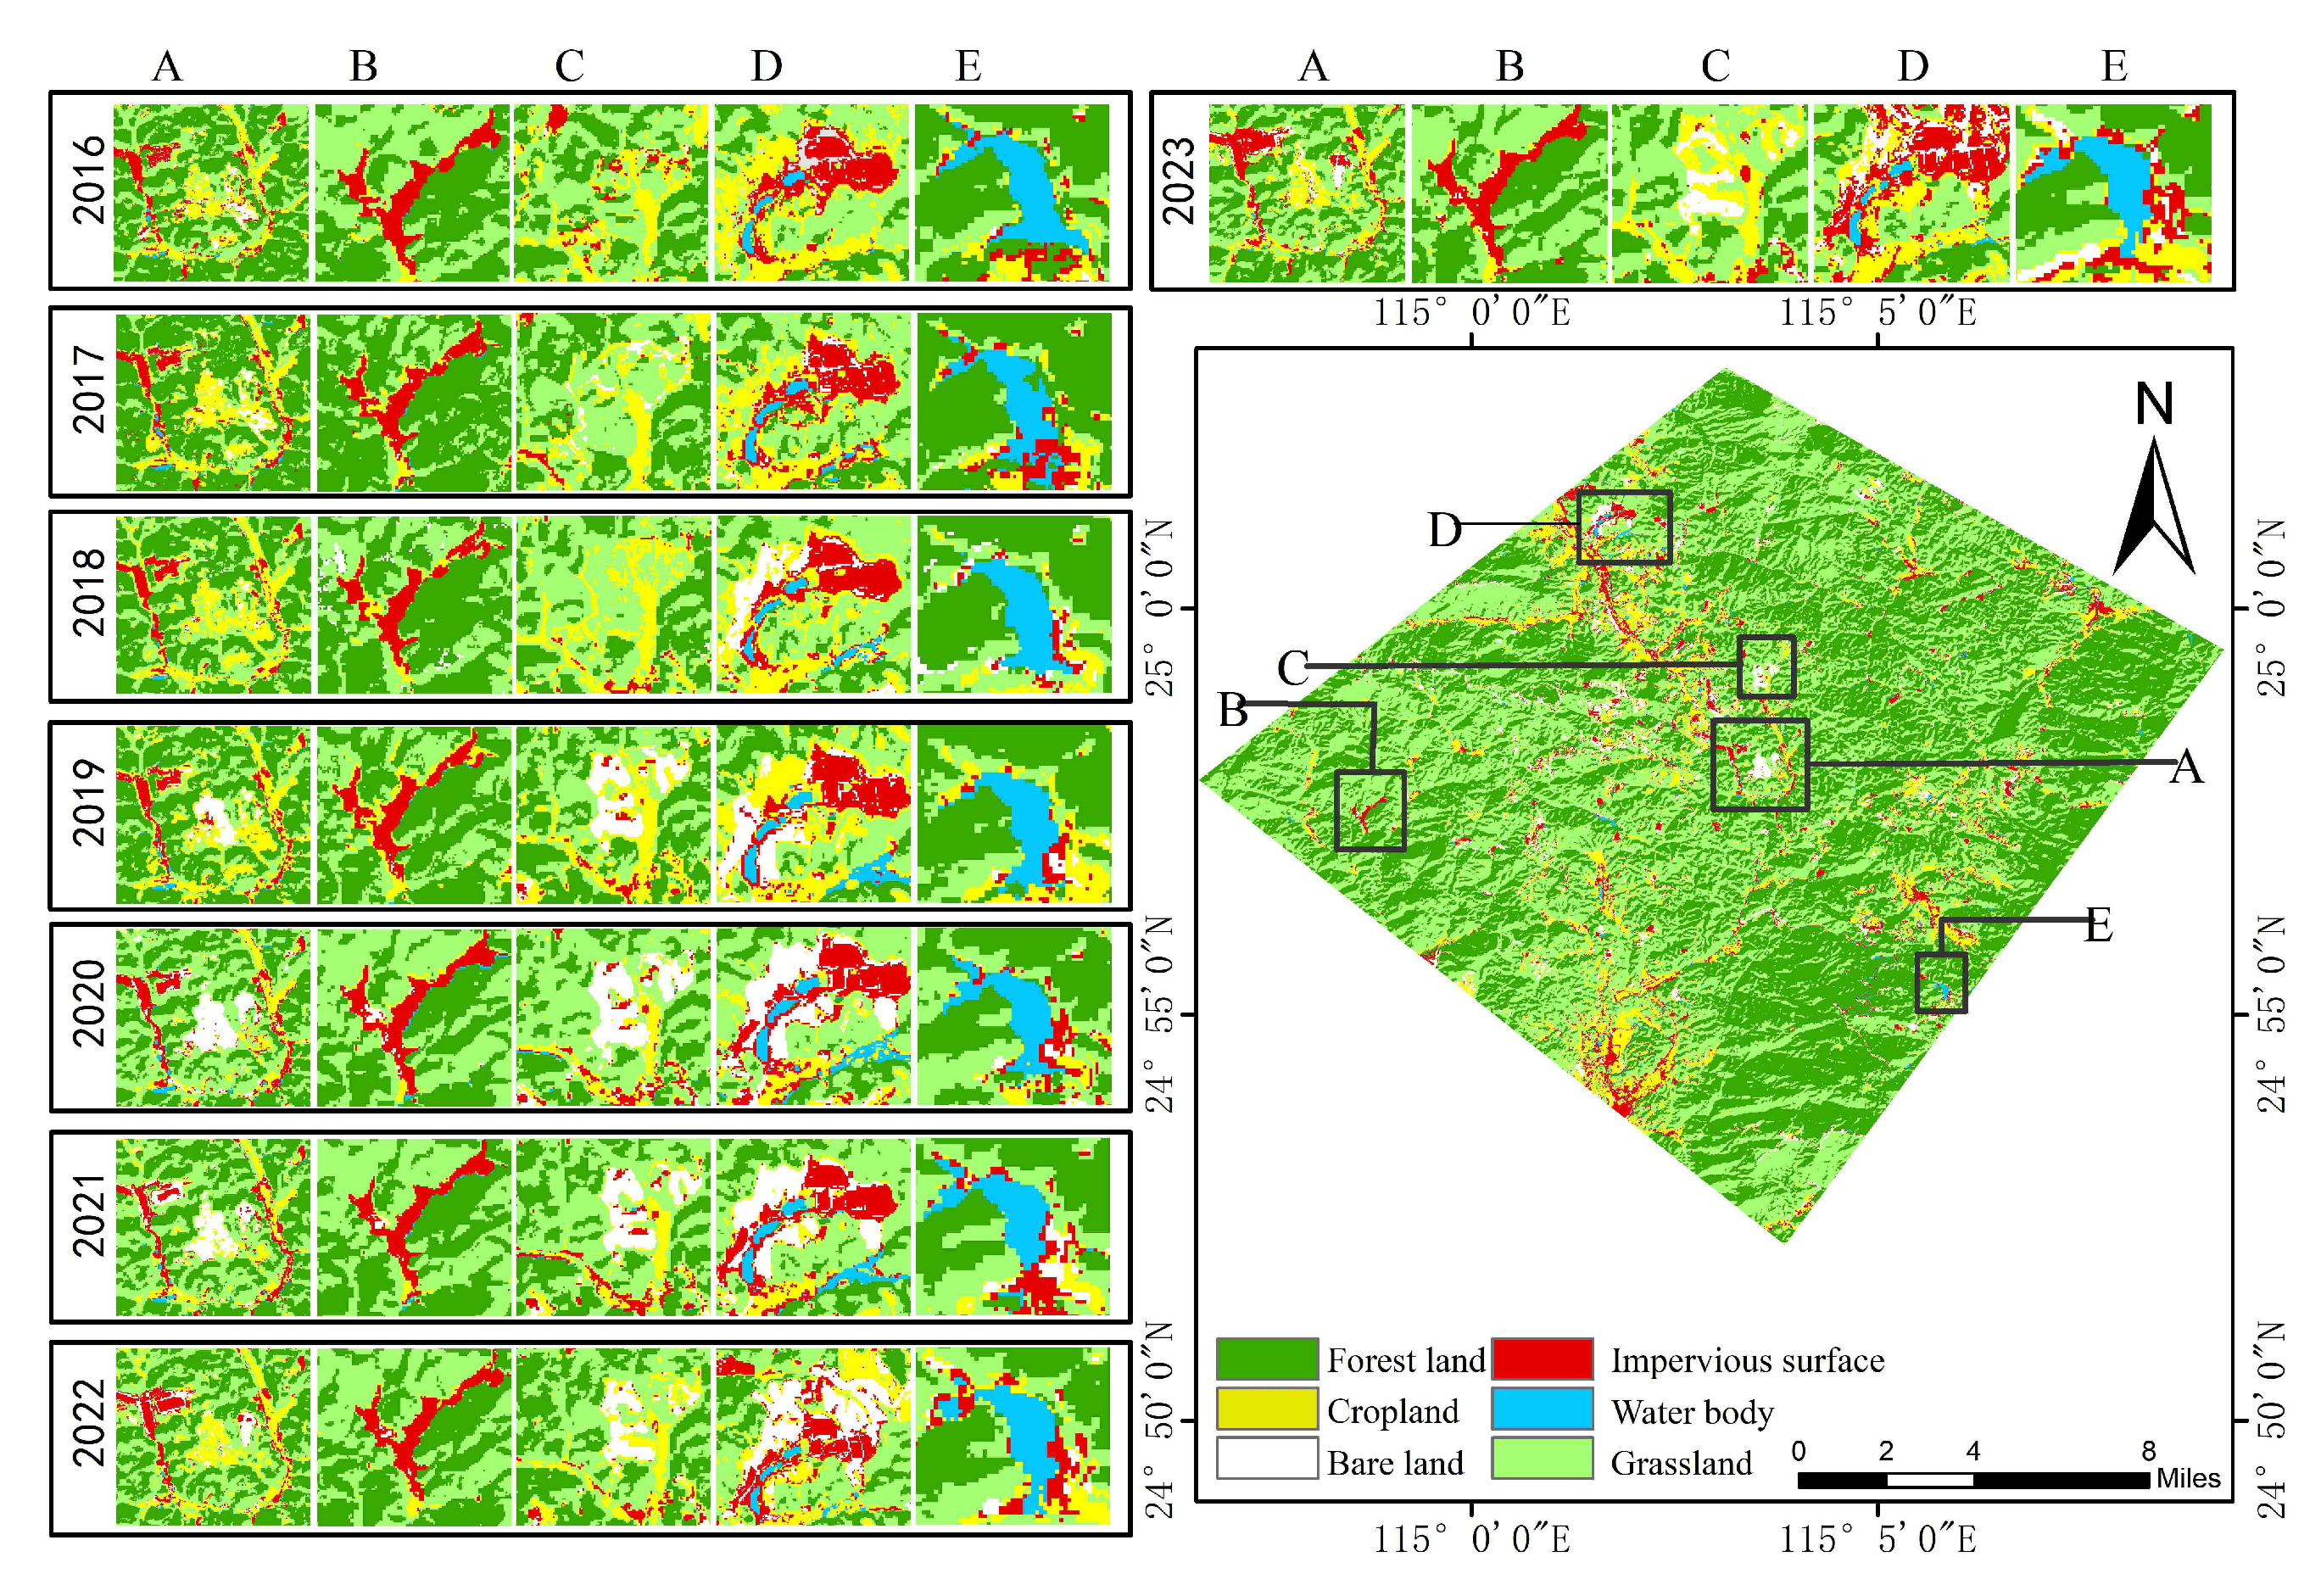
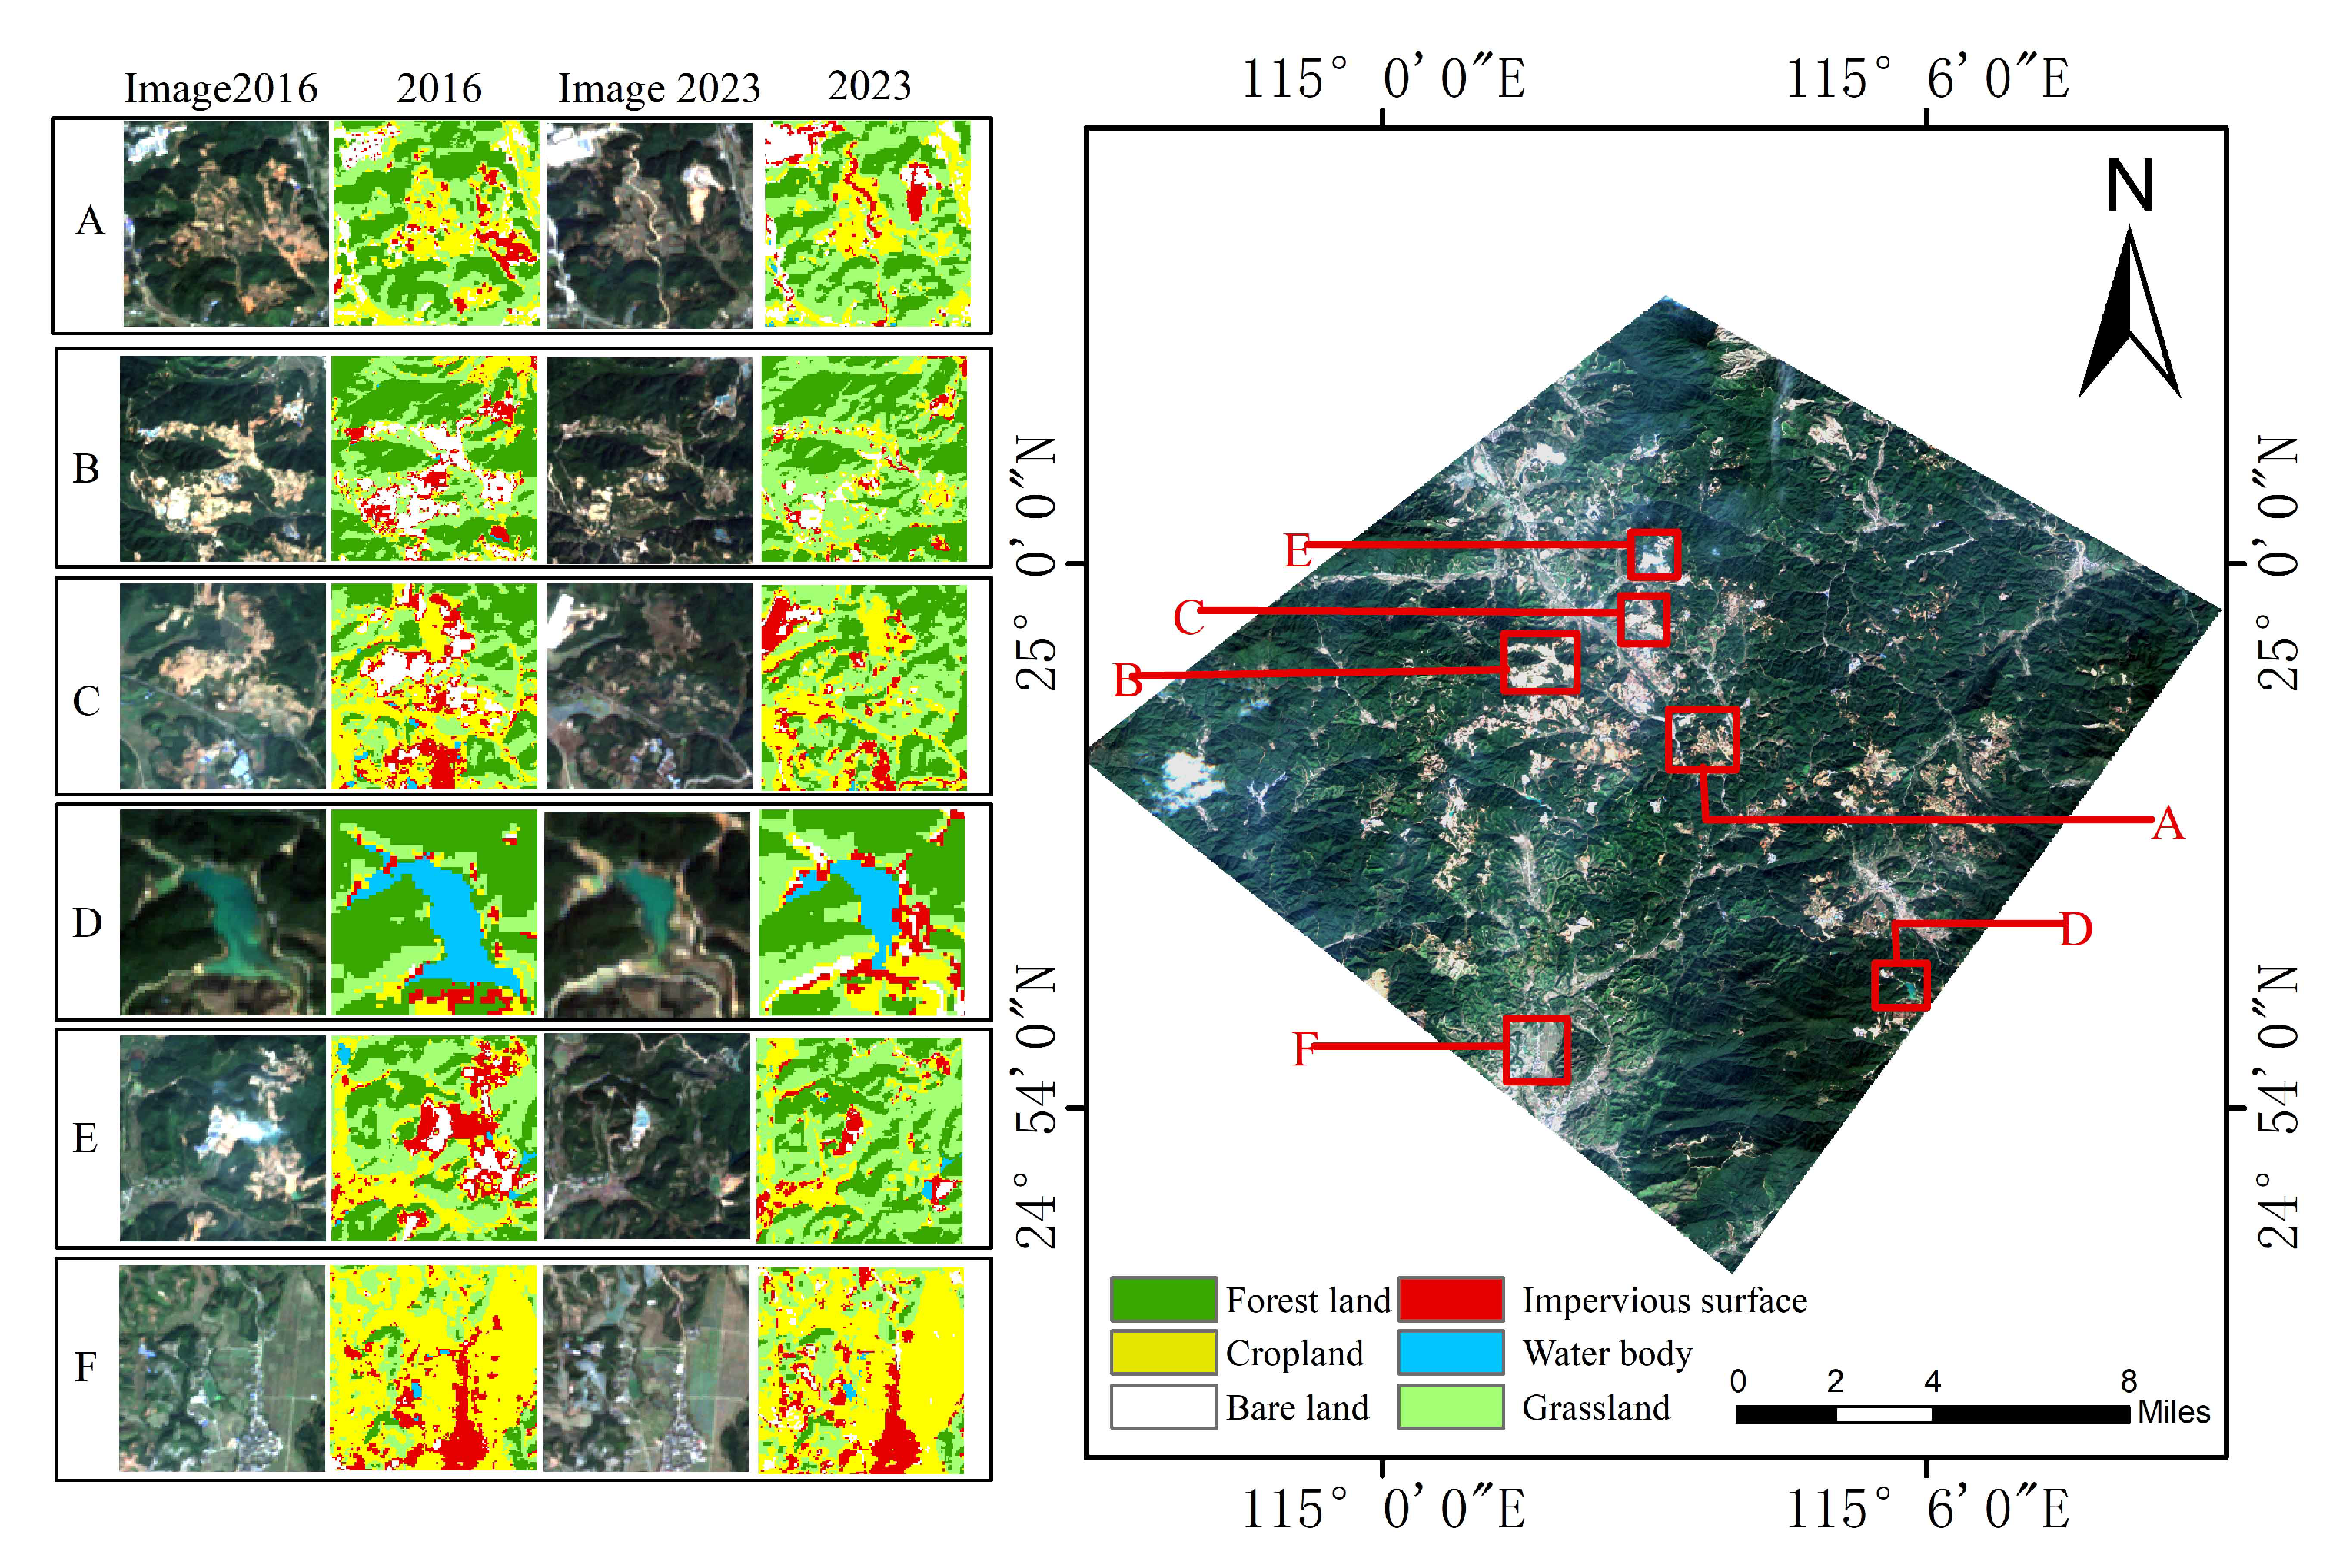
Based on the analyses of temporal land use change, land use transition, and dynamic degree, this section further investigates the driving mechanisms of land use change. By integrating Figure 13 (comparison of land use classification results in 2016 and 2023) with Table 8 (area changes), Table 9 (transition matrix), and Table 10 (land use dynamic degree), the relationship between land use change and mining activities in the study area is systematically analyzed.
First, from the perspective of mining expansion and its disturbance effects, regions A, B, C, and E in Figure 13 exhibit evident vegetation degradation and expansion of disturbed surfaces during 2016–2023. Specifically, Region A transitions from contiguous forest land to a fragmented pattern dominated by grassland and bare land patches, while Regions B, C, and E show a clear trend of conversion from forest land to grassland and impervious surfaces. These spatial patterns are consistent with the statistical results: as shown in Table 8, forest area decreased from 128.86 km2 in 2016 to 99.38 km2 in 2020, representing a net loss of 29.48 km2. The transition matrix further indicates that, from 2016 to 2023, 32.08 km2 of forest land was converted to grassland and an additional 0.36 km2 to bare land, suggesting that mining activities led to the stripping of original vegetation and its conversion into transitional land cover types. Meanwhile, the dynamic degree of impervious surfaces reached 42.72% during 2019–2020, reflecting intensified construction of mining roads, operational platforms, and associated infrastructure, thereby highlighting the direct impact of mining activities on surface structure.
Second, from the perspective of ecological restoration and land reclamation, regions E and F in Figure 13 show that some early-stage disturbed surfaces gradually transformed into grassland or forest by 2023, indicating a noticeable recovery trend in the mining area. This observation is also supported by statistical evidence: forest area increased from 99.38 km2 in 2020 to 108.57 km2 in 2022, representing a gain of 9.19 km2; meanwhile, bare land decreased from 3.71 km2 to 2.43 km2, a reduction of 1.28 km2. In addition, the grassland area expanded from 51.93 km2 in 2016 to 84.98 km2 in 2023, with an increase of 63.6%. The transition matrix further shows that newly increased grassland primarily originated from forest land and cropland conversion. These results indicate that land use change in the mining area reflects not only development-induced disturbances but also a coexistence of vegetation recovery through reclamation and natural succession, demonstrating the staged characteristics of ecological restoration.
Furthermore, regarding mining-related land cover types, the “bare land” category in this study primarily corresponds to tailings, waste dumps, and mining-disturbed surfaces. As shown in Figure 13, bare land patches in regions B, C, D, and E gradually decreased over time. Consistently, bare land area declined from 3.18 km2 in 2016 to 2.43 km2 in 2023, a reduction of 0.75 km2, suggesting a decrease in mining intensity and the gradual implementation of rehabilitation measures. In addition, water bodies decreased from 0.73 km2 to 0.45 km2, representing an overall reduction of approximately 38.4%. Combined with the disappearance of localized water bodies observed in Figure 13, this change is likely associated with the abandonment of mining sedimentation ponds and functional transformation of water bodies, further reflecting the impact of mining activities on the regional hydrological system.

5. Conclusions

This study proposes a feature optimization algorithm that integrates recursive feature elimination based on mean decrease in accuracy (RFE–MDA) with K-fold cross-validation (K-CV), referred to as RFE–MDA–CV, and applies it to high-accuracy land use classification and change analysis in the Lingbei rare earth mining area of Ganzhou City, Jiangxi Province, during the period 2016–2023. The main conclusions are summarized as follows:
(1) Within a multi-source feature framework, the RFE–MDA–CV algorithm effectively removes redundant features and constructs an optimal feature subset with concentrated discriminative power. The RF classifier trained on this optimized feature subset achieves the best performance, with high OA and kappa, demonstrating the clear advantages of the proposed method in improving classification accuracy and result stability.
(2) The synergistic integration of optical, SAR, and nighttime light data significantly enhances the discrimination of land cover types in complex mining environments. In particular, it improves the identification of spectrally similar and spatially interwoven classes such as bare land, vegetation, and impervious surfaces, highlighting the importance of multi-source data complementarity for fine-scale land use classification in mining areas.
(3) From 2016 to 2023, the land use pattern of the Lingbei mining area exhibits a stage-specific evolution characterized by grassland expansion and a stabilization trend in impervious surfaces. This pattern reflects the coexistence of sustained ecological restoration efforts and a slowdown in urban expansion. These results provide quantitative support for ecological restoration zoning and differentiated land management in mining areas.
(4) The cross-regional validation results indicate that, in the Hetian external rare earth mining area, the proposed feature optimization framework maintains high classification accuracy and stable performance, demonstrating its strong regional adaptability.
Overall, the proposed RFE–MDA–CV feature optimization strategy demonstrates substantial advantages in the selection and simplification of multidimensional remote sensing features and shows strong applicability for land use classification and change analysis in complex rare earth mining areas. By incorporating land use transition probability matrices, areas with high change frequency can be identified, providing a basis for delineating ecological conservation priority zones and formulating differentiated land management strategies. In future work, the classification and change detection results can be coupled with spatial control datasets such as ecological protection redlines and permanent basic farmland to simulate land use responses under different policy scenarios, thereby further enhancing the application value of the proposed approach in mining-area ecological governance and sustainable development.

Author Contributions

Conceptualization, X.C., B.L., Z.Y., Z.W. and W.H.; validation, B.L., Z.W. and Z.Y.; formal analysis, X.C. and B.L.; investigation, W.H., Z.W. and B.L.; data curation, B.L., Z.W. and W.H.; writing—original draft preparation, X.C., B.L. and Z.Y.; writing—review and editing, X.C., B.L., Z.W., Z.Y. and W.H. All authors have read and agreed to the published version of the manuscript.

Funding

This work was funded in part by the National Natural Science Foundation of China under Grant No. 42004158 and Grant No. 42461051, in part by the Natural Science Foundation of Jiangxi Province under Grant No. 20224BAB212025, and in part by the Science and Technology Research Project of the Education Department of Jiangxi Province under Grant No. GJJ2200803.

Data Availability Statement

The data that support the findings of this study are available from the corresponding author upon reasonable request.

Conflicts of Interest

The authors declare no conflicts of interest.

References

  1. Zhao, T.-Y.; Li, W.-L.; Kelebek, S.; Choi, Y.; Wu, C.-Q.; Zhang, W.-J.; Wang, C.-Y.; Zhao, Z.-W.; Sadri, F. A comprehensive review on rare earth elements: Resources, technologies, applications, and prospects. Rare Met. 2025, 44, 7011–7040. [Google Scholar] [CrossRef]
  2. Zhu, Z.; Zhao, S.; Li, Q.; Shi, Z.; Wu, Y.; Wang, L. Spatiotemporal evolution and prediction of land use change and carbon storage in ionic rare earth mining areas based on the YOLOv11–SegFormer–InVEST–PLUS integrated model. Ecol. Indic. 2025, 178, 113983. [Google Scholar] [CrossRef]
  3. Yang, W.; Zhou, Y.; Li, C. Assessment of ecological environment quality in rare earth mining areas based on improved RSEI. Sustainability 2023, 15, 2964. [Google Scholar] [CrossRef]
  4. Zhao, M.; Han, H.; Yang, T.; Li, Y. Research progress on bioleaching technology for ion-adsorption-type rare earth ores. Acta Chim. Sin. 2025, 83, 415. [Google Scholar] [CrossRef]
  5. Zhu, C.; Chen, Y.; Wan, Z.; Chen, Z.; Lin, J.; Chen, P.; Sun, W.; Yuan, H.; Zhang, Y. Cross-sensitivity analysis of land use transition and ecological service values in rare earth mining areas in southern China. Sci. Rep. 2023, 13, 22817. [Google Scholar] [CrossRef]
  6. Song, W.; Gu, H.; Li, F. Progress in the remote sensing monitoring of the ecological environment in mining areas. Int. J. Environ. Res. Public Health 2020, 17, 1846. [Google Scholar] [CrossRef]
  7. O’Donnell, M.S.; Whipple, A.L.; Inman, R.D.; Tarbox, B.C.; Monroe, A.P.; Robb, B.S.; Aldridge, C.L. Remote Sensing for Monitoring Mine Lands and Recovery Efforts; U.S. Geological Survey: Reston, VA, USA, 2024.
  8. Wang, X.; Zhang, Y.; Yu, Y.; Li, Y.; Lyu, H.; Li, J.; Cai, X.; Dong, X.; Wang, G.; Li, J. Monitoring of ecological environment changes in open-pit mines on the Loess Plateau from 1990 to 2023 based on RSEI. Ecol. Indic. 2025, 170, 113064. [Google Scholar] [CrossRef]
  9. Tang, H.; Fang, J.; Xie, R.; Ji, X.; Li, D.; Yuan, J. Impact of land cover change on a typical mining region using RSEI. Sustainability 2022, 14, 12694. [Google Scholar] [CrossRef]
  10. Gao, F.; Liu, S.; Gong, C.; Zhou, X.; Wang, J.; Dong, J.; Du, Q. Prototype-based information compensation network for multi-source remote sensing data classification. IEEE Trans. Geosci. Remote Sens. 2025, 63, 1–10. [Google Scholar]
  11. Valdivieso-Ros, C.; Alonso-Sarria, F.; Gomariz-Castillo, F. Effect of the synergetic use of Sentinel-1, Sentinel-2, LiDAR, and derived data in land cover classification of a semiarid Mediterranean area using machine learning algorithms. Remote Sens. 2023, 15, 312. [Google Scholar] [CrossRef]
  12. Dagne, S.S.; Hirpha, H.H.; Tekoye, A.T.; Dessie, Y.B.; Endeshaw, A.A. Fusion of Sentinel-1 SAR and Sentinel-2 MSI data for accurate urban land use/land cover classification in Gondar City, Ethiopia. Environ. Syst. Res. 2023, 12, 40. [Google Scholar] [CrossRef]
  13. De Fioravante, P.; Luti, T.; Cavalli, A.; Giuliani, C.; Dichicco, P.; Marchetti, M.; Chirici, G.; Congedo, L.; Munafò, M. Multispectral Sentinel-2 and SAR Sentinel-1 integration for automatic land cover classification. Land 2021, 10, 611. [Google Scholar] [CrossRef]
  14. Hasan, S.; Shi, W.; Zhu, X.; Abbas, S. Monitoring of land use/land cover and socioeconomic changes in South China using Landsat and nighttime light data. Remote Sens. 2019, 11, 1658. [Google Scholar] [CrossRef]
  15. Hong, F.; He, G.; Wang, G.; Zhang, Z.; Peng, Y. Monitoring of land cover and vegetation changes in Juhugeng coal mining area based on multi-source remote sensing data. Remote Sens. 2023, 15, 3439. [Google Scholar] [CrossRef]
  16. Nascimento, F.S.; Gastauer, M.; Souza-Filho, P.W.M.; Nascimento, W.R., Jr.; Santos, D.C.; Costa, M.F. Land cover changes in open-cast mining complexes based on high-resolution remote sensing data. Remote Sens. 2020, 12, 611. [Google Scholar] [CrossRef]
  17. Chen, W.; Li, X.; He, H.; Wang, L. A review of fine-scale land use and land cover classification in open-pit mining areas by remote sensing techniques. Remote Sens. 2017, 10, 15. [Google Scholar] [CrossRef]
  18. Chen, W.; Li, X.; Wang, L. Fine land cover classification in an open-pit mining area using optimized support vector machine and WorldView-3 imagery. Remote Sens. 2019, 12, 82. [Google Scholar] [CrossRef]
  19. Samadzadegan, F.; Javan, D. A critical review on multi-sensor and multi-platform remote sensing data fusion approaches: Current status and prospects. Int. J. Remote Sens. 2025, 46, 1327–1402. [Google Scholar] [CrossRef]
  20. Tang, Y.; Wang, Q.; Zhang, K.; Atkinson, P.M. Quantifying the effect of registration error on spatio-temporal fusion. IEEE J. Sel. Top. Appl. Earth Obs. Remote Sens. 2020, 13, 487–503. [Google Scholar] [CrossRef]
  21. Li, C.; Li, H.; Zhou, Y.; Wang, X. Detailed land use classification in a rare earth mining area using hyperspectral remote sensing data for sustainable agricultural development. Sustainability 2024, 16, 3582. [Google Scholar] [CrossRef]
  22. Jodhani, K.H.; Patel, D.; Madhavan, N. Land use/land cover classification for REL River using machine learning techniques. In Proceedings of the International Conference on IoT, Communication and Automation Technology (ICICAT); IEEE: Piscataway, NJ, USA, 2023; pp. 1–3. [Google Scholar]
  23. Yimer, S.M.; Bouanani, A.; Kumar, N.; Tischbein, B.; Borgemeister, C. Comparison of machine learning algorithms for land use/land cover mapping in a heterogeneous landscape. Adv. Space Res. 2024, 74, 2180–2199. [Google Scholar] [CrossRef]
  24. Vijay, A.; Varija, K. Spatio-temporal classification of land use and land cover changes using remote sensing and machine learning. Environ. Monit. Assess. 2024, 196, 459. [Google Scholar] [CrossRef] [PubMed]
  25. Nascimento, E.S.; Watanabe, F.S.Y.; Galo, M.L.B.T.; da Silva, E.A. Assessing land use and land cover changes arising from the 2022 water crisis in Southeast China. ISPRS Ann. Photogramm. Remote Sens. Spat. Inf. Sci. 2024, 10, 253–260. [Google Scholar]
  26. Wang, B.; Cao, C.; Kong, D. SGFNet: Redundancy-reduced spectral–spatial fusion network for hyperspectral image classification. Entropy 2025, 27, 995. [Google Scholar] [CrossRef]
  27. Theng, D.; Bhoyar, K.K. Feature selection techniques for machine learning: A survey of more than two decades of research. Knowl. Inf. Syst. 2024, 66, 1575–1637. [Google Scholar] [CrossRef]
  28. Schratz, P.; Muenchow, J.; Iturritxa, E.; Cortés, J.B.; Bischl, B.; Brenning, A. Monitoring forest health using hyperspectral imagery: Does feature selection improve machine learning performance? Remote Sens. 2021, 13, 4832. [Google Scholar] [CrossRef]
  29. Zhang, X.; Lin, X.; Fu, D.; Wang, Y.; Sun, S.; Wang, F.; Wang, C.; Xiao, Z.; Shi, Y. Comparison of the applicability of JM distance feature selection methods for coastal wetland classification. Water 2023, 15, 2212. [Google Scholar] [CrossRef]
  30. Ramezan, C.A. Transferability of recursive feature elimination (RFE)-derived feature sets for support vector machine land cover classification. Remote Sens. 2022, 14, 6218. [Google Scholar] [CrossRef]
  31. He, Y.; Wang, Y.; Ma, W. A multiple spectral important feature fusion method for wood species identification. Wood Sci. Technol. 2025, 59, 34. [Google Scholar] [CrossRef]
  32. Zhang, K.; Chen, Y.; Wang, W.; Wu, Y.; Wang, B.; Yan, Y. A method for remote sensing image classification by combining pixel neighbourhood similarity and optimal feature combination. Geocarto Int. 2023, 38, 2158948. [Google Scholar] [CrossRef]
  33. Chen, X.; Yang, K.; Ma, J.; Jiang, K.; Gu, X.; Peng, L. Aboveground biomass inversion based on object-oriented classification and Pearson–mRMR–machine learning model. Remote Sens. 2024, 16, 1537. [Google Scholar] [CrossRef]
  34. Lv, C.; Lu, Y.; Lu, M.; Feng, X.; Fan, H.; Xu, C.; Xu, L. A classification feature optimization method for remote sensing imagery based on Fisher score and mRMR. Appl. Sci. 2022, 12, 8845. [Google Scholar] [CrossRef]
  35. Gao, Y.; Zhao, D.; Liang, B.; Yang, X.; Xue, X. Remote sensing monitoring of soil salinization based on bootstrap–Boruta feature stability assessment: A case study in Minqin Lake region. Remote Sens. 2026, 18, 245. [Google Scholar] [CrossRef]
  36. Liang, Z.; Zhang, W.; Yang, Y.; Ma, J.; Li, S.; Wen, Z. Soil characteristics and microbial community response in rare earth mining areas. Environ. Sci. Pollut. Res. 2021, 28, 56418–56431. [Google Scholar] [CrossRef] [PubMed]
  37. Chen, M.; Li, F.; Hu, L.; Yang, T.; Yang, Q.; Tao, M.; Deng, Y. Heavy metal pollution in topsoil and vegetables in a typical mining area. Environ. Eng. Sci. 2019, 36, 1307–1314. [Google Scholar] [CrossRef]
  38. Huang, Y.; Xie, F.; Song, Z.; Zhu, S. Evolution and multi-scenario prediction of land use and carbon storage in Jiangxi Province. Forests 2023, 14, 1933. [Google Scholar] [CrossRef]
  39. Breiman, L. Random forests. Mach. Learn. 2001, 45, 5–32. [Google Scholar] [CrossRef]
  40. Timofeev, R. Classification and Regression Trees (CART): Theory and Applications; Humboldt University: Berlin, Germany, 2004. [Google Scholar]
  41. Cortes, C.; Vapnik, V. Support-vector networks. Mach. Learn. 1995, 20, 273–297. [Google Scholar] [CrossRef]
  42. Chapelle, O.; Chang, Y. Yahoo! learning to rank challenge overview. J. Mach. Learn. Res. 2011, 1, 1–24. [Google Scholar]
  43. Zhang, C.; Zhang, Y.; Shi, X.; Almpanidis, G.; Fan, G.; Shen, X. On incremental learning for gradient boosting decision trees. Neural Process. Lett. 2019, 50, 957–987. [Google Scholar] [CrossRef]
  44. Belgiu, M.; Drăguţ, L. Random forest in remote sensing: A review of applications and future directions. ISPRS J. Photogramm. Remote Sens. 2016, 114, 24–31. [Google Scholar] [CrossRef]
  45. Hsu, C.W.; Chang, C.C.; Lin, C.J. A Practical Guide to Support Vector Classification; National Taiwan University: Taipei, China, 2003. [Google Scholar]
  46. Zheng, J.; Shi, Y.; Gilbert, K.M. Temporal analysis of land use transformation and carbon emission patterns in Shanghai from 2000 to 2020. In Proceedings of the Second International Conference on Environmental Remote Sensing and Geographic Information Technology (ERSGIT); SPIE: Bellingham, WA, USA, 2024; Volume 12988, pp. 176–181. [Google Scholar]
  47. Liu, H.; Zheng, M.; Liu, J.; Zheng, X. Sustainable land use in trans-provincial marginal areas in China. Resour. Conserv. Recycl. 2020, 157, 104783. [Google Scholar] [CrossRef]
  48. Zhang, L. Remote sensing dynamic analysis of regional desertification evolution based on geological modelling. Int. J. Environ. Technol. Manag. 2024, 27, 370–383. [Google Scholar] [CrossRef]
  49. Issa, S.; Sultan, M. Land use and land cover mapping using Google Earth Engine: A comparative analysis of machine learning algorithms. Earth Sci. Inform. 2024, 17, 147–151. [Google Scholar]
  50. Raguraman, N.; Bhardwaj, A. Spatial analysis of land use/land cover dynamics using Sentinel-2 data. Int. Arch. Photogramm. Remote Sens. Spat. Inf. Sci. 2024, 48, 367–372. [Google Scholar] [CrossRef]
  51. Zhang, Y.; Zhao, H.; Ni, J. A comparison of four algorithms for land-use classification based on Landsat 8 OLI image. IOP Conf. Ser. Earth Environ. Sci. 2020, 1631, 012075. [Google Scholar] [CrossRef]
  52. Zafar, Z.; Zubair, M.; Zha, Y.; Fahd, S.; Nadeem, A.; Ahmad, A. Performance assessment of machine learning algorithms for land use/land cover mapping using remote sensing data. Egypt. J. Remote Sens. Space Sci. 2024, 27, 216–226. [Google Scholar] [CrossRef]
Figure 1. Geographic location of the Lingbei mining area. (a) Location of Jiangxi Province in China; (b) Location of the study area in Jiangxi; (c) Elevation and boundary of the Lingbei mining area.
Land 15 00797 g001
Figure 2. Land cover types represented in the input data stack. The red boxes indicate typical regions of the land cover types shown on the left.
Land 15 00797 g002
Figure 3. Flowchart of the methods.
Land 15 00797 g003
Figure 4. Feature importance ranking from 2016 to 2023.
Land 15 00797 g004
Figure 5. Relationship between overall accuracy and the number of feature combinations.
Land 15 00797 g005
Figure 6. Classification details of different feature combinations under the RF algorithm in 2017 and 2022: (a) 2017; (b) 2022. In each subfigure, the left panel presents the classification results of the selected local area under different feature combination schemes, while the right panel indicates the corresponding location within the study area.
Land 15 00797 g006
Figure 7. PA and UA of different land cover types under different feature combinations in 2017 and 2022. (Sch = Scheme).
Land 15 00797 g007
Figure 8. Comparison of classification results across different algorithms under Scheme 10 from 2016 to 2023. (a) Impervious surface. (b) Bare land. (c) Cropland. (d) Water body. In each subfigure, the left panel presents the local classification results of different algorithms across years, while the right panel indicates the corresponding location within the study area.
Land 15 00797 g008
Figure 9. Comparison of PA and UA across different algorithms under Scheme 10 in 2017 and 2022: (A) 2017; (B) 2022. In each subfigure, different colors represent different LULC classes, while circles and triangles denote UA and PA.
Land 15 00797 g009
Figure 10. Detailed classification results of different feature combinations using the RF algorithm in the Hetian mining area in 2021 and 2023: (a) 2021; (b) 2023. In each subfigure, the left panel shows the local classification results under different feature combination schemes, while the right panel indicates the corresponding location within the study area.
Land 15 00797 g010
Figure 11. Land use classification results under the RF algorithm for Scheme 10 from 2016 to 2023.
Land 15 00797 g011
Figure 12. Land use classification details under the RF algorithm for Scheme 10 from 2016 to 2023.
Land 15 00797 g012
Figure 13. Comparison of land use classification results under the RF algorithm for Scheme 10 in 2016 and 2023.
Land 15 00797 g013
Table 1. Data sources used in the study.
Data
Sources
Feature
Name
Spatial
Res. (m)
Time
Res.
Dataset
ID
Note
Sentinel-2 MSISpectral Features, Vegetation Index, Tasseled Cap, Texture Features10/20/605 daysCOPERNICUS/S2Multispectral optical imagery (cloud cover < 5%) for vegetation and surface monitoring
Sentinel-1 SARRadar Features106 daysCOPERNICUS/S1_GRDC-band radar imagery (VV polarization, IW mode) with strong all-weather capability
SRTM DEMTerrain Index30Static (2000)USGS/SRTMGL1_003Global DEM data reflecting terrain features
VIIRS DNBNighttime Lighting500Monthly (2020)NOAA/VIIRS/DNB/MONTHLY_V1/VCMSLCFGVIIRS nighttime light data indicating urban activity and economic development
Table 2. Feature factors.
Feature TypeFeature Variables
Nighttime Light Remote SensingNighttime light
TopographySlope, Aspect
SAR CharacteristicsBackscatter Coefficient: VV
Tasseled Cap IndexBrightness, Greenness, Wetness
Vegetation IndexNDVI, NDWI, EVI, BSI
Spectral FeaturesB1, B2, B3, B4, B5, B6, B7, B8,
B9, B10, B11, B12, B8A
Texture FeaturesGray_asm, Gray_contrast, Gray_corr,
Gray_var, Gray_idm, Gray_savg,
Gray_svar, Gray_sent, Gray_ent
Table 3. Training sample point data (number of samples).
YearForest
Land
Crop
Land
Bare
Land
ISWater
Body
Grass
Land
Total
2016225206216231272071112
2017226206220229312091121
2018224209209208182271095
2019227206235233232291153
2020225223213214292211125
2021225223213214292211125
2022222209216209222151093
2023230195205210192201079
Table 4. Feature combination schemes.
Combination SchemesFeature Combination
Scheme 1Sentinel-2A Spectral Bands + Topographic Indices + Texture Indices
Scheme 2Sentinel-2A Spectral Bands + Topographic Indices + Vegetation Indices
Scheme 3Sentinel-2A Spectral Bands + Texture Indices + Vegetation Indices
Scheme 4Sentinel-2A Spectral Bands + Topographic Indices + Texture Indices + Vegetation Indices
Scheme 5Sentinel-2A Spectral Bands + Topographic Indices + Texture Indices + Vegetation Indices + Sentinel-1 VV + Tasseled Cap Transformation
Scheme 6Sentinel-2A Spectral Bands + Topographic Indices + Texture Indices + Vegetation Indices + Nighttime Light Remote Sensing Index
Scheme 7Sentinel-2A Spectral Bands + Topographic Indices + Texture Indices + Vegetation Indices + Sentinel-1 VV + Nighttime Light Remote Sensing Index
Scheme 8Sentinel-2A Spectral Bands + Topographic Indices + Texture Indices + Vegetation Indices + Tasseled Cap Transformation + Nighttime Light Remote Sensing Index
Scheme 9Sentinel-2A Spectral Bands + Topographic Indices + Texture Indices + Vegetation Indices + Sentinel-1 VV + Tasseled Cap Transformation + Nighttime Light Remote Sensing Index
Scheme 10Optimized Feature Combination
Table 5. Classification accuracy of different feature combinations under the RF algorithm in 2017 and 2022.
Feature Combination2017RF2022RF
OAKappaOAKappa
Scheme 192.35%0.905390.18%0.8785
Scheme 293.24%0.916291.72%0.8975
Scheme 392.94%0.916290.49%0.8823
Scheme 493.24%0.916290.49%0.8823
Scheme 593.52%0.919890.80%0.8861
Scheme 692.65%0.908991.10%0.8899
Scheme 792.65%0.908990.80%0.8860
Scheme 892.35%0.905391.10%0.8898
Scheme 993.24%0.916291.10%0.8898
Scheme 1093.53%0.919892.02%0.9013
Table 6. Classification accuracy of different algorithms under Scheme 10 from 2016 to 2023.
YearRFCARTSVMGBDT
OAKappa OA Kappa OA Kappa OA Kappa
201692.69%0.908887.43%0.843188.89%0.861191.81%0.8977
201793.53%0.919889.41%0.868889.12%0.865493.24%0.9162
201894.41%0.930990.68%0.884788.20%0.85491.93%0.9002
201993.53%0.919589.64%0.871491.91%0.899492.56%0.9074
202093.90%0.924288.72%0.859887.80%0.848692.38%0.9051
202192.58%0.908086.94%0.838089.91%0.874692.28%0.9043
202292.02%0.901386.50%0.833084.05%0.802791.41%0.8937
202393.10%0.914390.60%0.883187.77%0.848092.16%0.9025
Table 7. Classification accuracy of different feature combinations under the RF algorithm in the Hetian mining area in 2021 and 2023.
Feature Combination2021RF2023RF
OA Kappa OA Kappa
Scheme 192.33%0.905092.66%0.9086
Scheme 293.05%0.914091.85%0.8982
Scheme 392.81%0.911092.66%0.9086
Scheme 493.05%0.913992.93%0.9120
Scheme 592.81%0.910993.21%0.9155
Scheme 692.57%0.908093.21%0.9154
Scheme 792.81%0.911093.21%0.9154
Scheme 892.81%0.910993.21%0.9155
Scheme 993.05%0.914092.12%0.9019
Scheme 1093.53%0.919993.48%0.9188
Table 8. Changes in land use type areas for different years (unit: km2).
Land Use Type20162017201820192020202120222023
Forest land128.86124.54123.86111.6499.38104.16108.57102.66
Cropland20.8219.5218.8219.8213.3613.1616.6415.10
Bare land3.183.214.043.083.712.972.662.43
IS8.275.043.775.367.656.836.528.16
Water body0.730.670.541.030.620.600.590.45
Grass land51.9260.8062.7572.8589.0686.0678.8084.98
Total213.78213.78213.78213.78213.78213.78213.78213.78
Table 9. Transition matrix for Lingbei mining area from 2016 to 2023 (unit: km2).
20162023Land 15 00797 i001
ISGrass LandCroplandForest LandBare LandWater BodyTotal
IS3.181.881.691.130.360.038.27
Grassland0.7143.402.334.850.630.0051.92
Cropland2.456.558.792.490.520.0220.82
Forest land1.3532.081.0893.960.360.01128.84
Bare land0.331.051.150.110.550.013.20
Water body0.130.010.050.130.020.390.73
Total8.1584.9715.09102.672.440.46213.7
Table 10. Land use dynamic degree for the Lingbei mining area.
Land Use Type2016–20172017–20182018–20192019–20202020–20212021–20222022–20232016–2023
KiForest land−3.35%−0.54%−9.87%−10.99%4.81%4.23%−5.44%−2.90%
Cropland−6.24%−3.59%5.31%−32.60%−1.42%26.35%−9.92%−3.92%
Bare land0.94%26.17%−23.95%20.46%19.95%−10.44%−8.65%−3.37%
IS−39.06%−25.20%42.18%42.72%10.72%−4.54%25.15%−0.19%
Water body−8.22%−19.40%92.60%−40.39%−3.22%−1.67%−23.73%−5.48%
Grass land17.08%3.21%1.10%22.25%−3.37%−8.42%7.83%9.09%
Kc2.08%0.65%3.09%4.48%1.12%1.84%1.83%1.10%
Disclaimer/Publisher’s Note: The statements, opinions and data contained in all publications are solely those of the individual author(s) and contributor(s) and not of MDPI and/or the editor(s). MDPI and/or the editor(s) disclaim responsibility for any injury to people or property resulting from any ideas, methods, instructions or products referred to in the content.