1. Introduction
Ecological networks provide the spatial basis for maintaining biodiversity, sustaining ecological processes, and facilitating species movement across fragmented landscapes. Since connectivity was recognized as a vital element of landscape structure, landscape ecologists have increasingly emphasized that ecological stability depends not only on habitat amount but also on the spatial arrangement of habitat patches and the permeability of the surrounding matrix [
1,
2]. In this context, ecological networks—usually composed of source areas, corridors, and key nodes—have become an important framework for understanding and improving landscape connectivity [
3,
4].
Over the past three decades, ecological network research has gradually shifted from conceptual discussion to operational spatial analysis. Early graph-based studies demonstrated that fragmented habitats could be abstracted as networks of nodes and links, making it possible to assess structural properties of landscapes in a more systematic and transparent way [
4]. Subsequent work further clarified how landscape connectivity should be measured and compared, and promoted graph theory as a practical tool for conservation planning in heterogeneous environments [
2,
5]. These studies laid the methodological foundation for later efforts to identify critical patches, corridors, and vulnerable connections in regional ecological systems.
At the same time, a series of connectivity indices were developed to quantify the contribution of different landscape elements to overall ecological connectivity. Among the most influential are the Integral Index of Connectivity (IIC), the Probability of Connectivity (PC), and related patch-removal approaches, which have been widely used to assess habitat availability and to rank the importance of habitat patches and links [
5,
6,
7,
8]. These methods significantly improved the rigor of connectivity evaluation, especially in identifying which elements contribute disproportionately to network integrity. More applied studies have also shown that graph-theoretic methods can be made operational in landscape assessment, planning, and design, thereby strengthening their value for spatial decision-making [
9].
In parallel with graph-based approaches, resistance-based corridor modelling has become a mainstream tool in ecological network construction. Least-cost modelling provides a practical way to represent ecological movement through heterogeneous landscapes by assigning resistance values to different land-cover types and identifying potential routes of minimum cumulative resistance [
10]. In China, this line of research has become closely associated with ecological security pattern planning, in which source identification, resistance surface construction, and corridor extraction constitute a widely adopted analytical framework [
11,
12,
13]. Because it can be implemented with relatively accessible spatial data and standard GIS tools, this framework has been widely applied in regional and provincial ecological planning.
However, a limitation of MCR- or least-cost-based ecological network construction is that the resulting corridor system often contains considerable redundancy, especially at larger spatial scales. A large number of potential corridors may be generated, but not all of them are equally important for maintaining the structural stability of the network. This has led to increasing interest in methods that can distinguish critical corridors from redundant ones. Circuit theory has offered one important direction by emphasizing multi-path movement [
14], while graph-theoretic metrics provide another route by identifying corridors that play a disproportionately important structural role. In particular, edge betweenness measures how frequently an edge lies on the shortest paths between pairs of nodes and can therefore be used to identify structurally critical corridors within an ecological network [
8].
Recent studies have begun to apply edge-betweenness-based optimization to corridor systems in order to extract backbone structures from dense ecological networks [
15,
16]. Lu et al. showed that introducing edge betweenness into provincial ecological corridor analysis can improve the identification of indispensable corridors under land-resource constraints [
17]. Luo and Wu further linked edge betweenness with the minimum spanning tree to identify arterial corridors in ecological networks, highlighting the value of distinguishing a reduced backbone from a redundant corridor system [
18]. These studies suggest that, for planning purposes, identifying a concise set of structurally important corridors is often more informative than retaining all potential least-cost routes.
Despite these advances, several gaps remain. First, although ecological network studies have been widely conducted at the city, urban-agglomeration, and basin scales, provincial-scale structural comparison across multiple time slices remains less common. Second, many studies stop at source and corridor extraction and do not further examine corridor hierarchy, backbone structure, or the relationship between the full corridor network and its reduced structural core. Third, cold-region provinces have received less attention than more densely urbanized or climatically moderate regions, despite their distinctive forest–wetland systems, seasonal constraints, and pronounced regional differentiation in land-use disturbance, all of which provide an important contextual setting for structural ecological network analysis [
19].
Heilongjiang Province provides an informative case for addressing these issues. As one of China’s major cold-region provinces and an important ecological barrier in Northeast Asia, it contains extensive forests, wetlands, river systems, and agricultural plains within a single provincial-scale landscape system [
16]. Over the past two decades, the province has undergone substantial land-use change associated with agricultural development, urban growth, and localized ecological restoration [
20]. This combination of relatively stable ecological foundations and spatially differentiated human disturbance makes Heilongjiang suitable for examining how provincial ecological networks evolve in structural terms over time, and how much the main network framework depends on a limited set of critical corridors [
21,
22].
Against this background, this study examines the spatiotemporal evolution of the ecological network in Heilongjiang Province from 2000 to 2020 through a structure-oriented framework integrating ecological sensitivity assessment, MCR-based corridor modelling, and edge-betweenness-based backbone extraction. The objectives are: (1) to identify ecological source areas and construct the provincial ecological network for 2000, 2010, and 2020; (2) to reveal the structural evolution of potential and backbone ecological corridors; and (3) to interpret how land-use change was associated with structural reorganization of ecological connectivity in a cold-region provincial landscape. In this study, the cold-region context is reflected primarily in the landscape setting, variable selection, and planning interpretation, rather than in an explicit process-based simulation of freeze–thaw dynamics or seasonal ecological processes.
2. Materials and Methods
2.1. Study Area
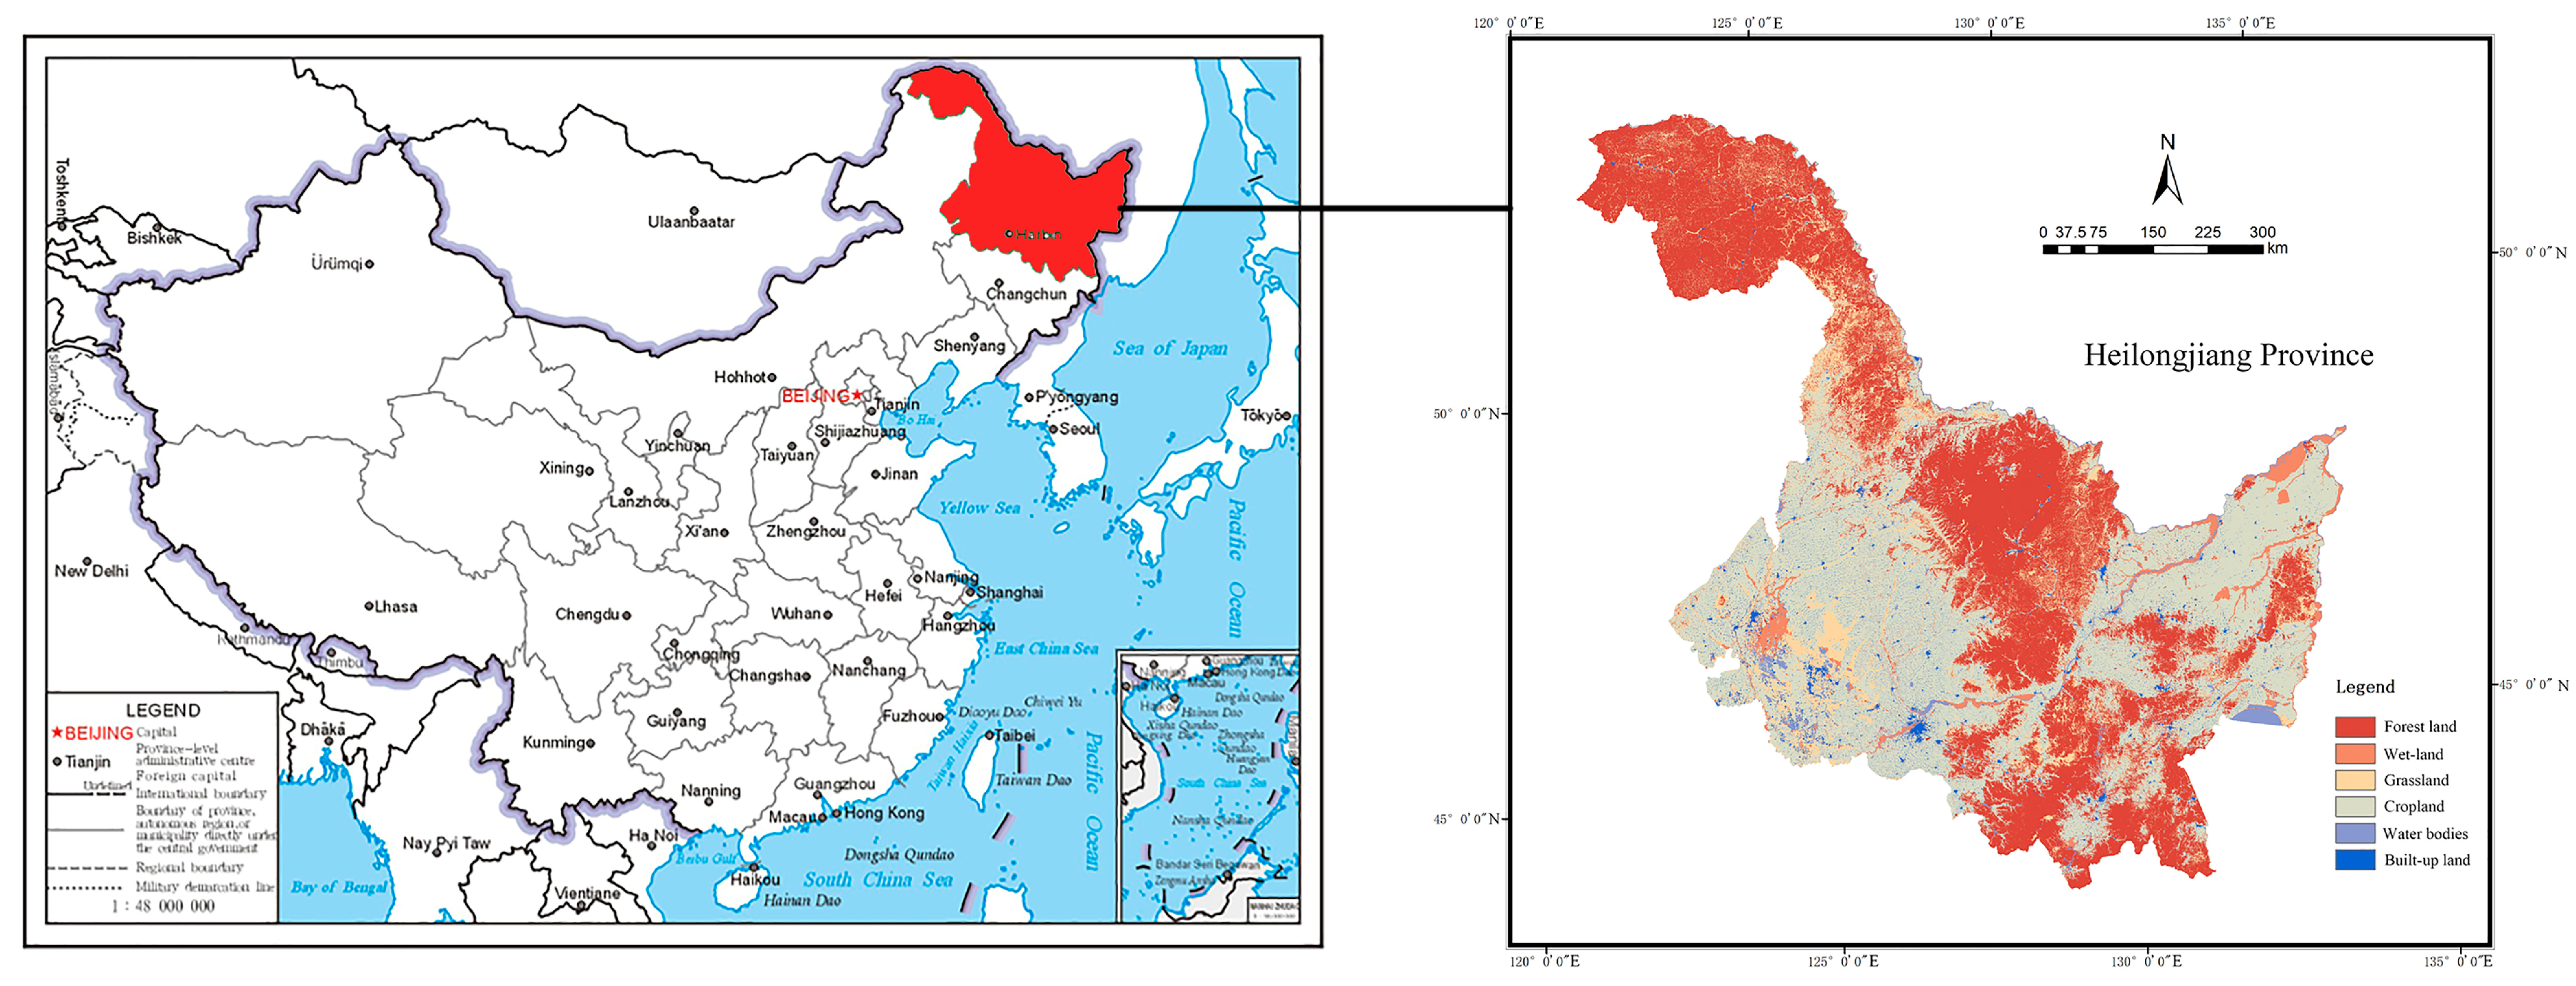
Heilongjiang Province is located in northeastern China and represents a typical cold-region landscape characterized by long winters, extensive forest ecosystems, and extensive agricultural landscapes. The province includes major ecological regions such as the Greater Khingan Range, Lesser Khingan Range, and the Sanjiang Plain, which provide ecological significance at the national scale. The province is characterized by diverse landforms, including mountain ranges, plains, wetlands, and extensive forest ecosystems. Major ecological elements such as forest land, wetlands, rivers, and agricultural landscapes jointly shape the regional ecological pattern (
Figure 1). Its high-latitude setting, long freezing period, and strong dependence on forest–wetland ecosystems make it a representative case for ecological network analysis in cold regions [
23,
24,
25].
During the period from 2000 to 2020, Heilongjiang Province experienced significant land-use changes driven by agricultural development, urban expansion, and infrastructure construction. These changes have exerted considerable pressure on regional ecological processes and landscape connectivity. Therefore, analyzing the spatiotemporal evolution of the ecological network at the provincial scale is essential for understanding long-term ecological security patterns and supporting spatial planning and ecological conservation.
2.2. Data Sources and Preprocessing
Multi-source spatial data were used in this study, including land-use/land-cover data, digital elevation model (DEM) data, normalized difference vegetation index (NDVI) data, and hydrological data for the years 2000, 2010, and 2020.
Land-use data were obtained from the Geographical National Conditions Monitoring Cloud Platform. DEM data were derived from the Geospatial Data Cloud. NDVI data were obtained from the Resource and Environmental Science Data Center of the Chinese Academy of Sciences. Hydrological data were derived from the National Basic Geographic Information database.
NDVI data were processed using annual composite values to reduce seasonal variability and ensure comparability across different time periods. DEM data were used to derive elevation and slope-related factors.
Hydrological data were used to generate water-body buffer zones. Buffer distances were classified into four intervals (0–50 m, 50–100 m, 100–200 m, and >200 m) to reflect the gradient influence of water proximity on ecological conditions.
All spatial datasets were projected to a unified coordinate reference system (WGS 1984 UTM Zone 52N) and resampled to a consistent spatial resolution of 30 m to ensure spatial comparability across different time periods. Raster-based spatial analysis was conducted using ArcGIS 10.8. All datasets were standardized and converted into raster format for subsequent spatial analysis.
2.3. Ecological Sensitivity Assessment
In this study, ecological sensitivity assessment was conducted as a spatial screening approach to identify areas with relatively favorable ecological conditions for ecological source selection, rather than as a model-based sensitivity analysis. Five key factors were selected, including elevation, slope aspect, vegetation coverage (NDVI), distance to water bodies, and land-use type. These factors comprehensively reflect terrain conditions, ecological quality, hydrological influence, and the degree of human disturbance, which are widely recognized as critical determinants of ecological suitability in regional-scale studies. Each factor was classified into four sensitivity levels: low, moderate, high, and extremely high sensitivity, and the specific indicator system and weight assignments are presented in
Table 1.
The five indicators were selected based on commonly used ecological sensitivity factors in regional ecological assessment, while also considering the ecological characteristics of Heilongjiang Province, where forest–wetland systems, riparian environments, and human land-use disturbance jointly shape ecological pattern differentiation. Previous studies have shown that ecological sensitivity assessment commonly integrates topographic factors, vegetation condition, land-use pattern, and water-related indicators, and that the relative importance of these factors is usually determined through regionally adapted expert-based or multi-criteria weighting methods rather than a universal fixed standard [
26,
27].
In the present study, land-use type was assigned the highest weight because, at the provincial scale, it most directly reflects landscape permeability and the intensity of human disturbance, both of which strongly influence the continuity of ecological source areas. NDVI was given the second highest weight because vegetation condition is a key indicator of ecological quality and habitat support in Heilongjiang’s forest–wetland landscape. Water-buffer distance was assigned an intermediate weight to capture the ecological significance of riparian and wetland-adjacent areas. By contrast, elevation and slope aspect were assigned relatively lower weights because, at the provincial scale, they mainly act as background modifying factors rather than direct determinants of ecological source integrity. Therefore, the weighting scheme used in this study should be understood as a regionally adapted structural assessment framework for provincial-scale source screening, rather than as a universally fixed ecological sensitivity standard. Although the exact numerical weights are study-specific, the relative weighting order adopted here reflects the dominant role of land-use pattern, vegetation condition, and water-related ecological context in shaping provincial-scale ecological sensitivity in Heilongjiang [
12,
13,
27].
A weighted overlay method was employed to calculate the comprehensive ecological sensitivity index, and areas with high and extremely high sensitivity were extracted as candidate ecological source areas. To ensure ecological integrity, spatially isolated small patches were removed through spatial filtering, while contiguous sensitive areas were retained. Given the provincial scale of this study, small and highly fragmented patches are less likely to function as stable core areas within a regional ecological network. Therefore, a minimum patch size threshold of 100 km2 was applied to exclude highly isolated and spatially limited patches from ecological source selection. This setting was intended to improve the structural integrity and interpretability of source identification at the provincial scale, where the ecological network is expected to be supported primarily by relatively large and continuous habitat areas. In addition, this threshold is consistent with common source-screening practices in large-scale ecological network studies. It should also be noted that the 100 km2 threshold is a generalized structural screening parameter rather than a species-specific ecological threshold. Although it provides a practical basis for provincial-scale source identification, the resulting source pattern may still be sensitive to threshold choice. Future research could further evaluate this issue through comparative threshold testing.
2.4. Construction of the Ecological Resistance Surface
The ecological resistance surface represents the relative difficulty of structural connectivity across different landscape types. In this study, resistance values were assigned primarily based on land-use types, reflecting their varying degrees of obstruction to ecological movement and structural connectivity. Resistance coefficients were assigned as regionally adapted relative parameters for provincial-scale terrestrial structural connectivity, with reference to previous MCR-based ecological network studies and the landscape characteristics of Heilongjiang Province.
The basic resistance coefficients for different land-use types are summarized in
Table 2. Forest land and wetlands were assigned relatively low resistance values because they generally provide ecological continuity, habitat support, and comparatively high landscape permeability within Heilongjiang’s forest–wetland system. By contrast, cropland and especially built-up land were assigned higher resistance values because of stronger human disturbance, lower habitat quality, and more pronounced barrier effects on ecological flow.
A distinction was made between wetlands and open water bodies. Wetlands were assigned low resistance because they often function as ecologically supportive landscape elements in the provincial forest–wetland mosaic. Open water bodies, however, were assigned a comparatively high resistance value (600) because this study focuses on provincial-scale terrestrial structural connectivity, under which large rivers, reservoirs, and lake surfaces tend to act as strong barriers to terrestrial ecological flow. Therefore, the high resistance value for water bodies should be understood as a relative barrier coefficient used to distinguish open-water resistance from cropland and built-up land, rather than as a species-specific absolute ecological cost [
28,
29,
30,
31].
It should also be noted that the numerical values in
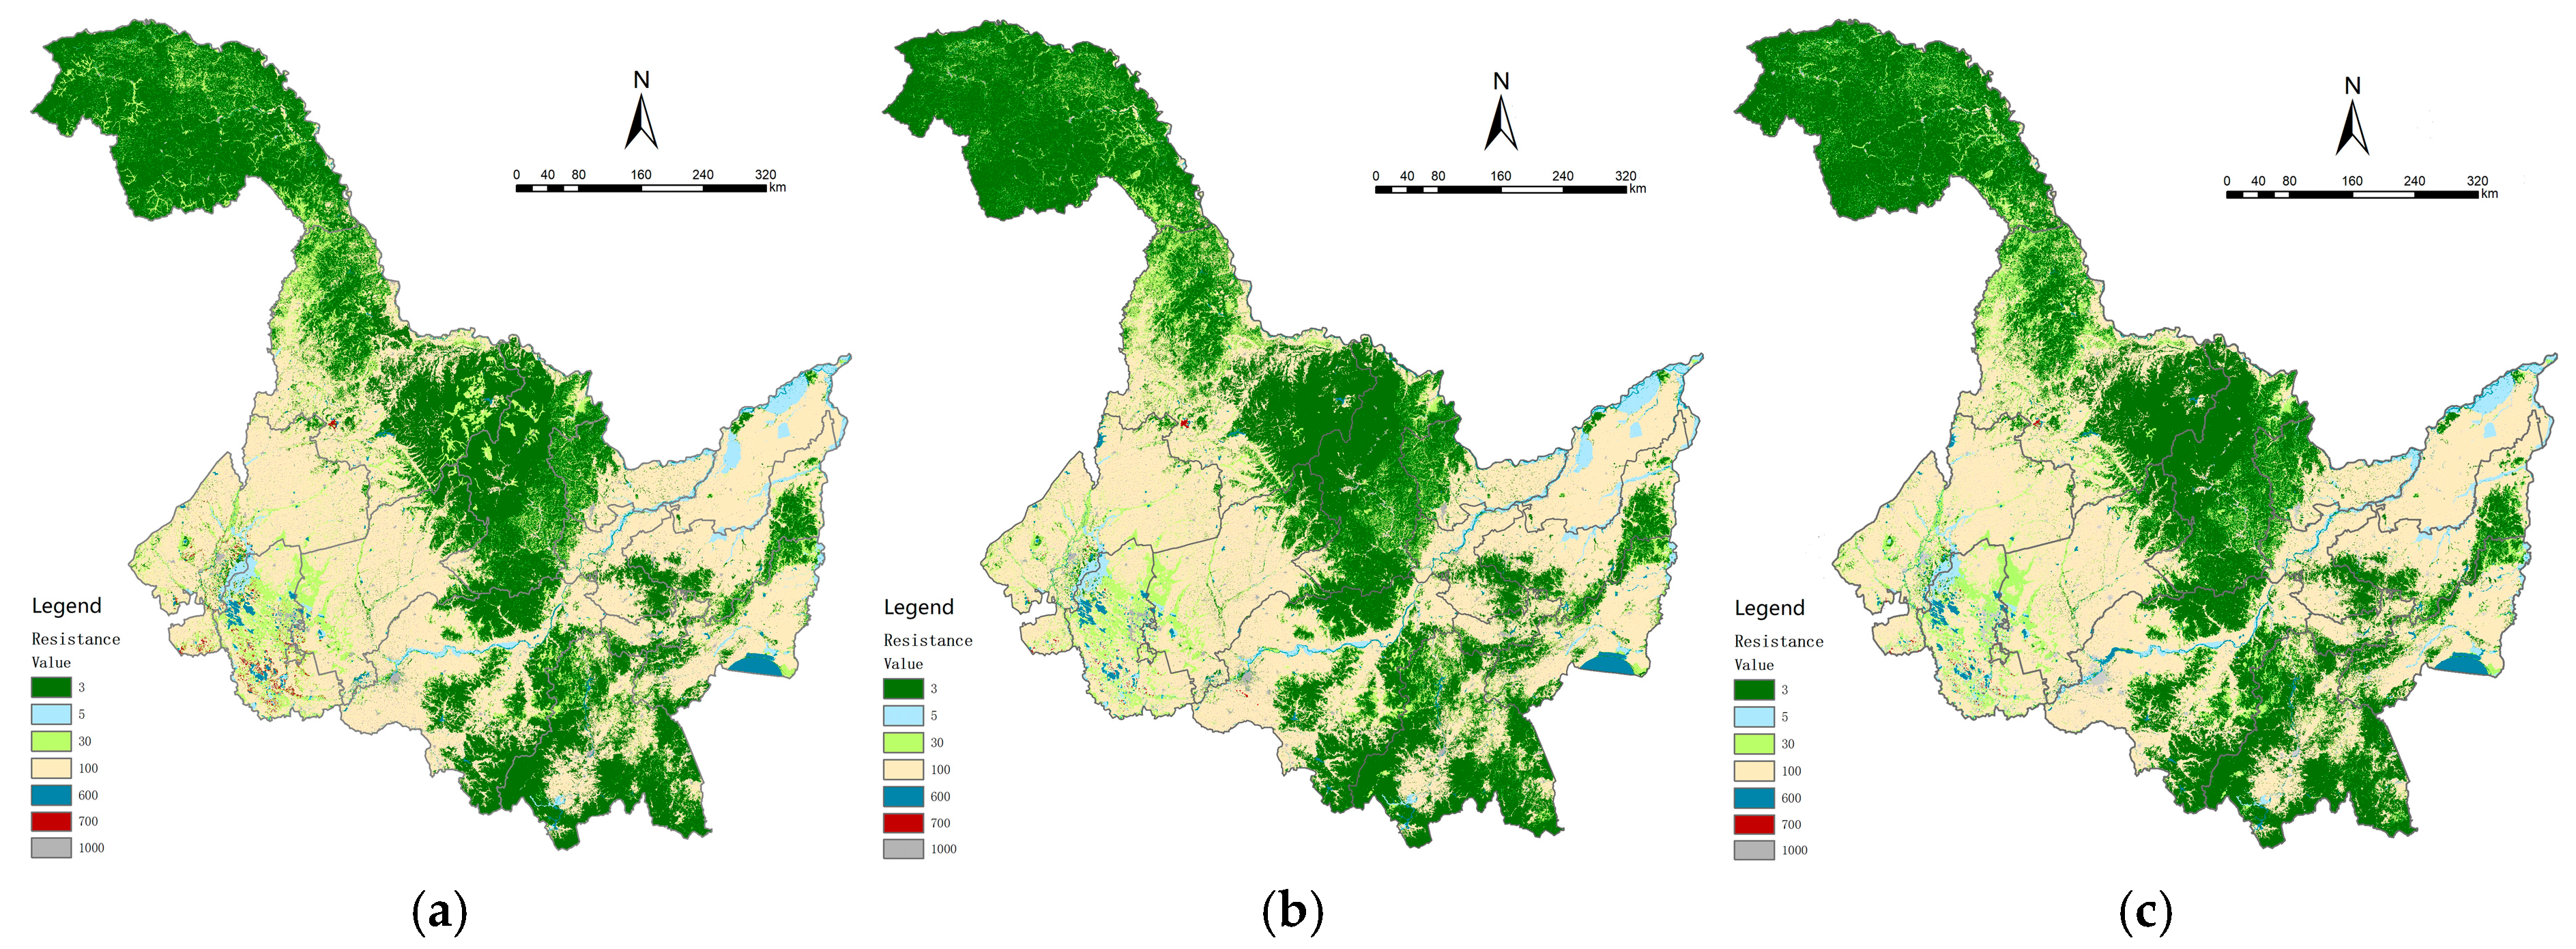
Table 2 are intended to express a relative resistance gradient among land-use categories in a provincial-scale terrestrial network, rather than fixed or universally transferable ecological costs. Accordingly, the resistance assignment in this study reflects a regionally adapted structural interpretation of landscape permeability in Heilongjiang Province. The resistance surface was generated by rasterizing land-use data and assigning corresponding resistance values to each grid cell. The spatial distribution of the ecological resistance surface is shown in
Figure 2.
2.5. Ecological Corridor Identification Based on the MCR Model
Ecological corridors were identified using the minimum cumulative resistance (MCR) model, which simulates potential ecological flow paths between ecological source areas across the resistance surface.
The Minimum Cumulative Resistance (MCR) model was first proposed by Knaapen et al. in 1992 [
31] and has been widely used in ecological planning to identify least-resistance pathways between ecological sources in heterogeneous landscapes [
32,
33,
34]. The model is expressed as follows:
where
is the minimum cumulative resistance value,
is the distance from point
i to point
j, and
is the resistance coefficient of landscape matrix
i. Lower values indicate higher ecological suitability and connectivity.
In this study, the resistance coefficients defined in
Section 2.4 were incorporated into the MCR model to calculate least-resistance pathways between ecological source areas. By combining the spatial distribution of ecological sources with the resistance surface, the model identified potential ecological corridors that reflect the main structural routes of ecological connection under different land-use and environmental conditions.
Ecological corridors were extracted independently for 2000, 2010, and 2020 in order to ensure temporal comparability. The resulting corridor networks therefore represent the spatial configuration of potential ecological connections under the respective landscape conditions of each study year.
2.6. Identification of Backbone Ecological Corridors Based on Edge Betweenness
To identify structurally important connections within the ecological network, edge betweenness from graph theory was introduced to extract backbone ecological corridors.
The ecological network was represented as a graph G = (V, E), where ecological source areas were defined as nodes (V), and ecological corridors derived from the MCR model were represented as edges (E). An adjacency matrix was constructed to describe the topological relationships among ecological sources.
Edge betweenness was calculated for each corridor as
where
is the total number of shortest paths between node
s and node
t, and
is the number of those paths that pass through edge
e. In this study, edge betweenness is used as a relative indicator to rank the structural importance of ecological corridors rather than as a normalized network-wide index.
Corridors with higher edge-betweenness values play a more critical role in maintaining overall network connectivity. Based on these values, corridors were iteratively removed in ascending order of edge betweenness while preserving network connectivity among ecological source areas. The simplification procedure was terminated when any further edge removal would disconnect the network. Therefore, the retained backbone network represents the minimum connected structural framework of the full ecological corridor network. This reduced network preserves the main topological support of the ecological network while excluding structurally less important corridors.
2.7. Analytical Framework
Based on the above procedures, a unified analytical framework was established to examine the spatiotemporal evolution of the ecological network in Heilongjiang Province from 2000 to 2020.
The framework integrates ecological sensitivity assessment, resistance surface construction, MCR-based corridor extraction, and edge-betweenness-based backbone corridor identification.
By comparing ecological network structures across different time periods, this study reveals changes in ecological source distribution, corridor configuration, and hierarchical network structure, thereby providing a scientific basis for ecological conservation and spatial planning at the provincial scale.
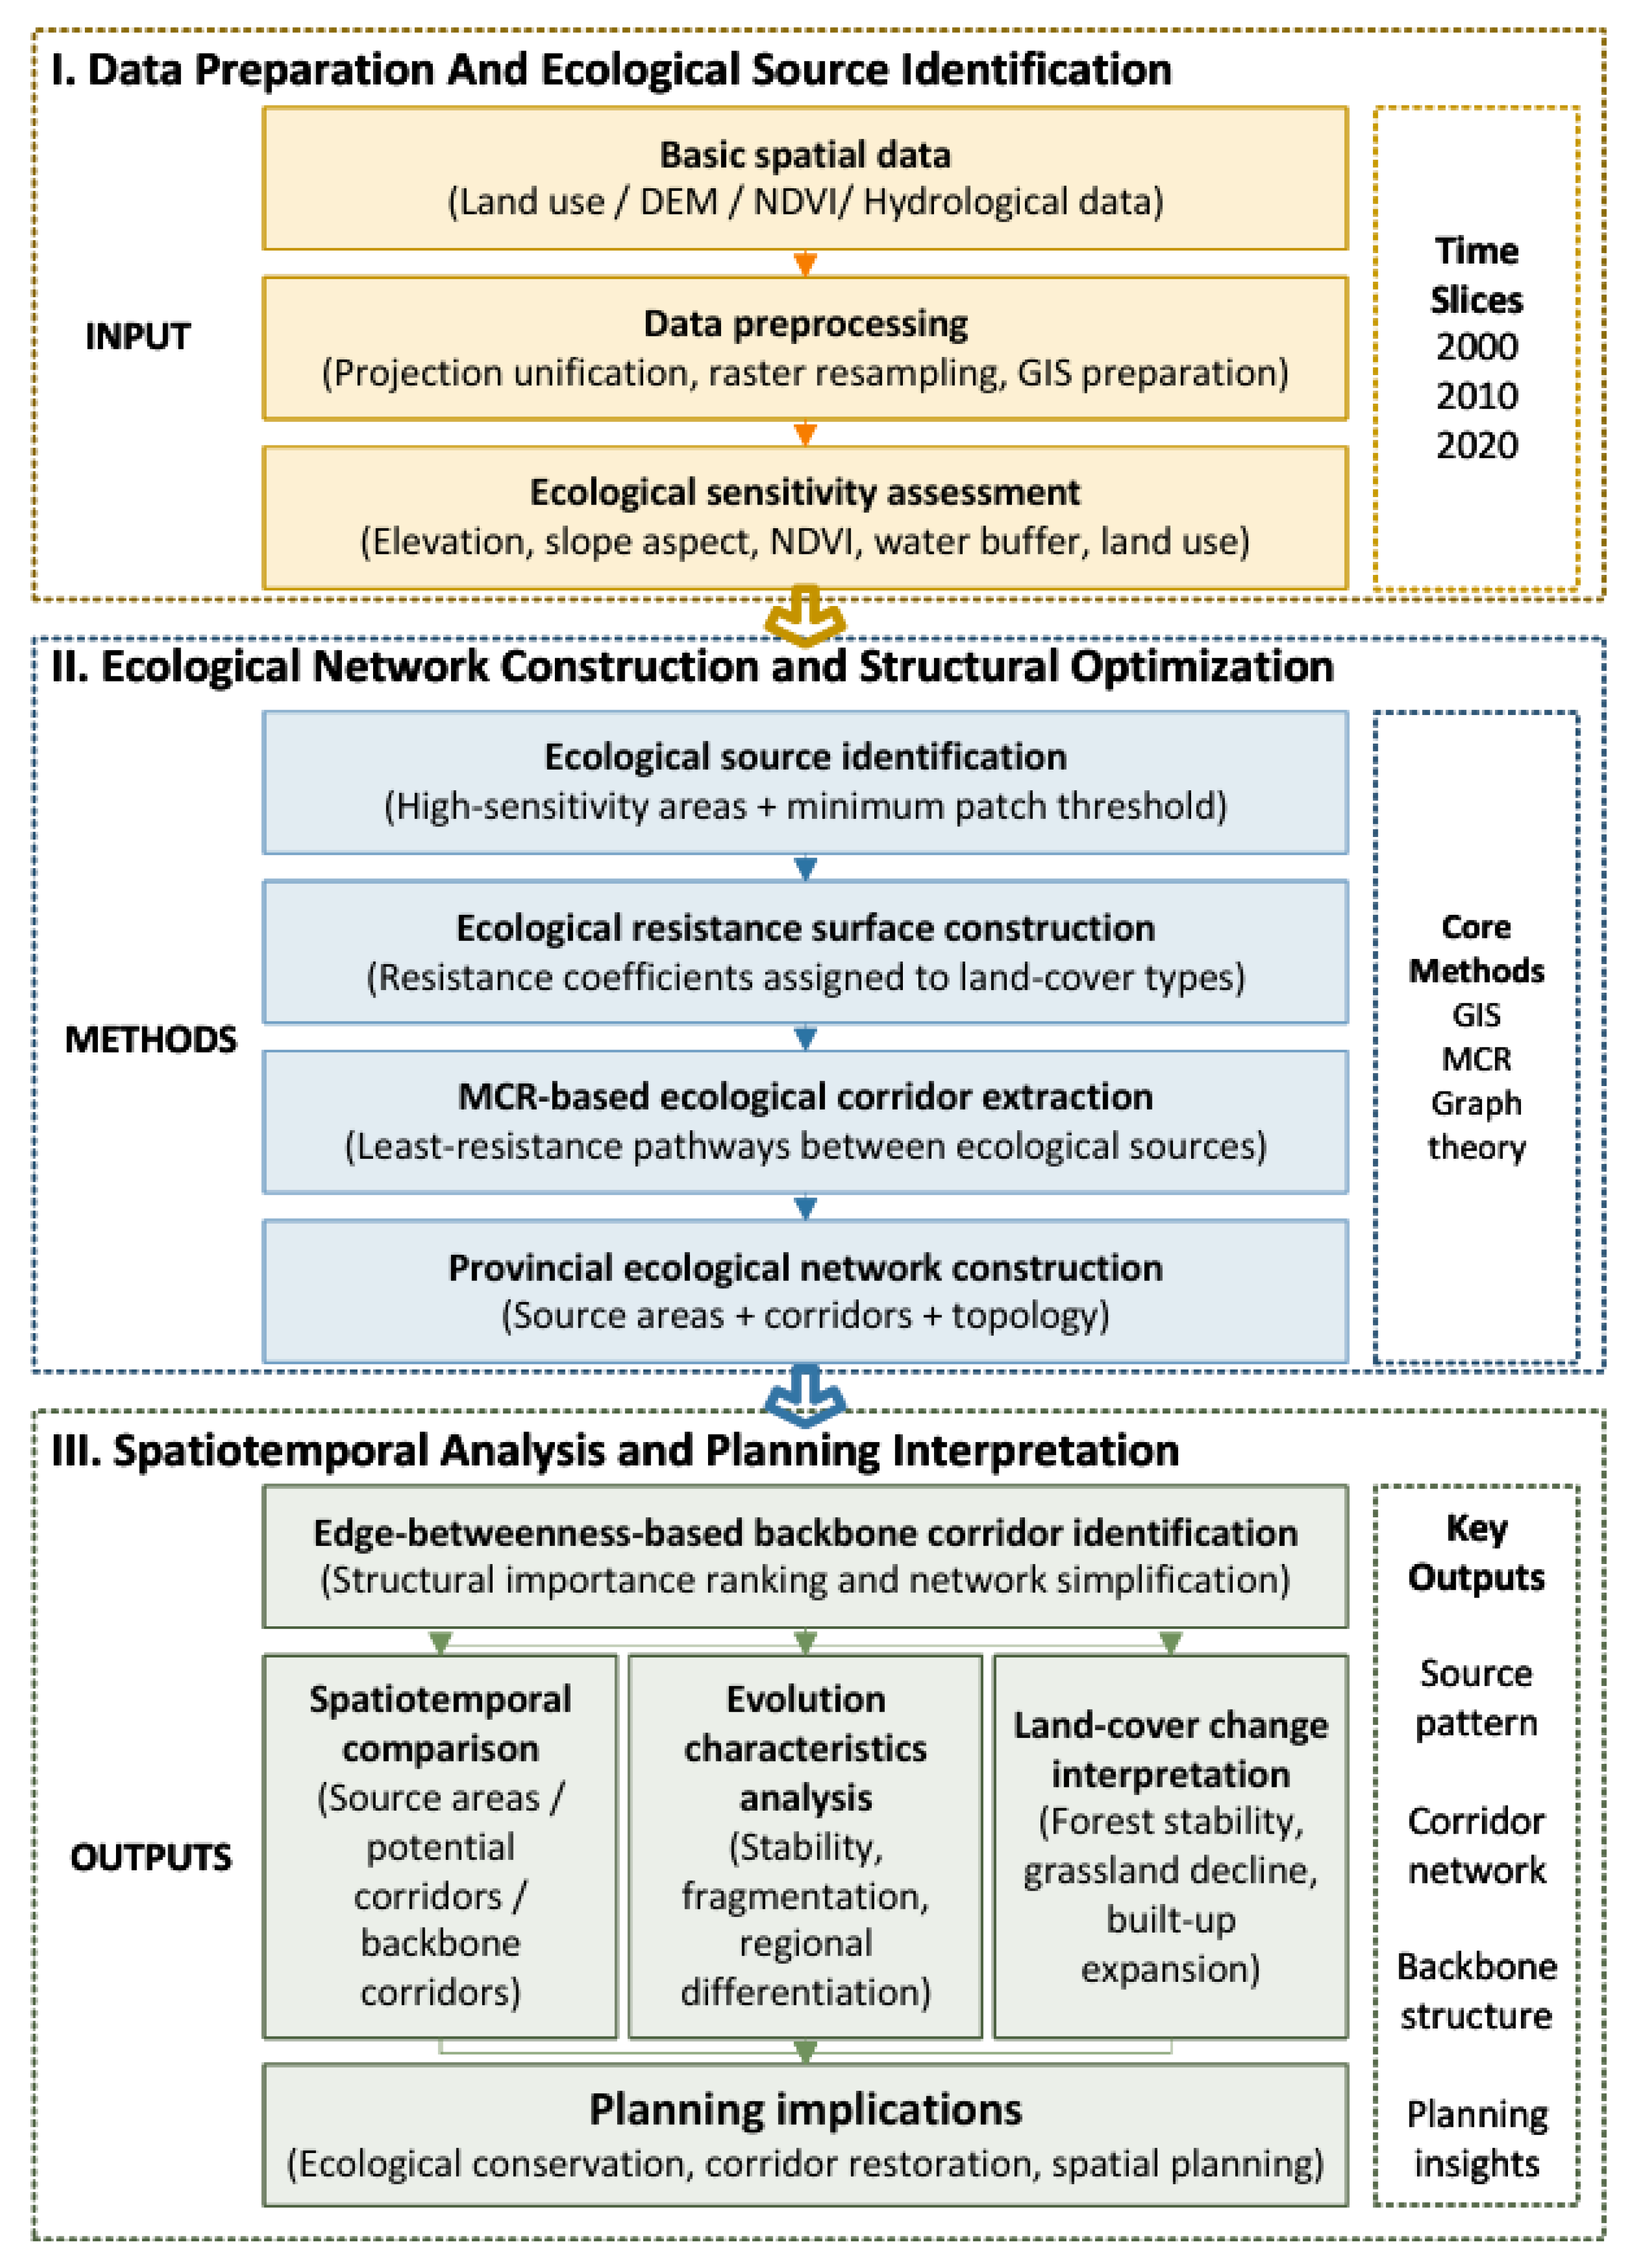
To clarify the overall research design, a unified analytical workflow was established for ecological source identification, resistance surface construction, MCR-based corridor extraction, backbone corridor optimization, and spatiotemporal evolution analysis (
Figure 3).
As shown in
Figure 3, the framework consists of three interconnected components: data preparation and ecological source identification, ecological network construction and structural optimization, and spatiotemporal analysis and planning interpretation. The workflow follows a logical progression from ecological pattern identification to network construction and finally to planning-oriented interpretation.
Specifically, ecological source areas are first identified through ecological sensitivity assessment, which provides the basis for resistance surface construction. The MCR model is then applied to extract potential ecological corridors and construct the provincial ecological network. Subsequently, edge-betweenness analysis is used to identify backbone corridors, which represent structurally critical pathways within the network.
By explicitly linking ecological source identification, corridor extraction, backbone corridor optimization, and land-cover change interpretation, this framework enables a systematic understanding of ecological network evolution and supports planning-oriented decision-making at the provincial scale.
This framework explicitly links ecological source identification, corridor extraction, backbone corridor optimization, and land-cover change interpretation, thereby supporting both structural analysis and planning-oriented interpretation.
3. Results
3.1. Spatiotemporal Evolution of Ecological Source Areas
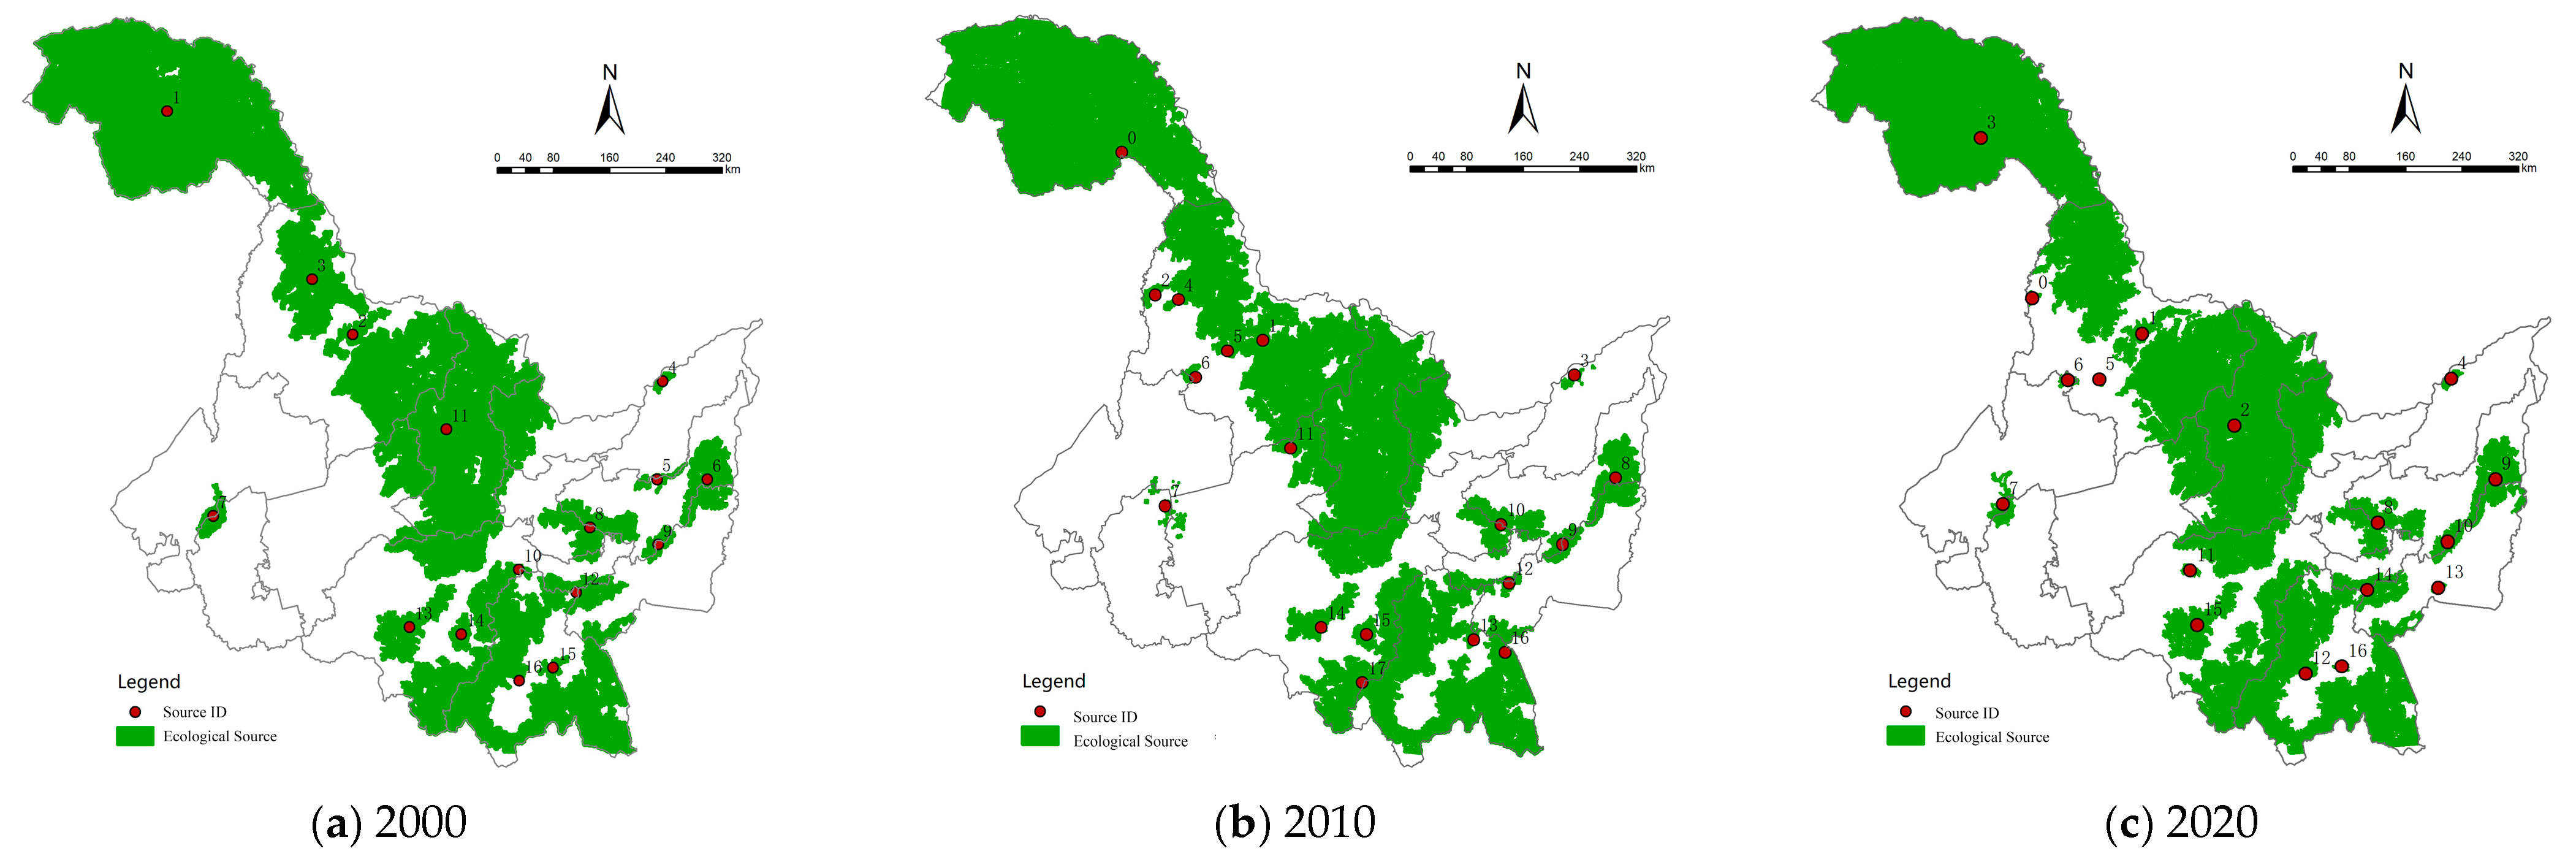
The spatial distribution of ecological source areas in Heilongjiang Province for the years 2000, 2010, and 2020 is shown in
Figure 4. Overall, ecological sources were primarily distributed in forest- and wetland-dominated regions, particularly in mountainous areas and major river basins.
The number of ecological source areas exhibited slight temporal fluctuations, with 16 sources identified in 2000, increasing to 18 in 2010, and slightly decreasing to 17 in 2020. Despite these changes in number, the overall spatial distribution of ecological sources remained relatively stable throughout the study period.
From a spatial perspective, ecological sources appeared more spatially clustered in 2010 and 2020 than in 2000, particularly in regions with relatively stable natural land cover.
These results indicate that large-scale forest and wetland ecosystems consistently function as core ecological sources, maintaining the fundamental spatial structure of the provincial ecological network.
3.2. Spatial Characteristics of the Potential Ecological Corridor Network
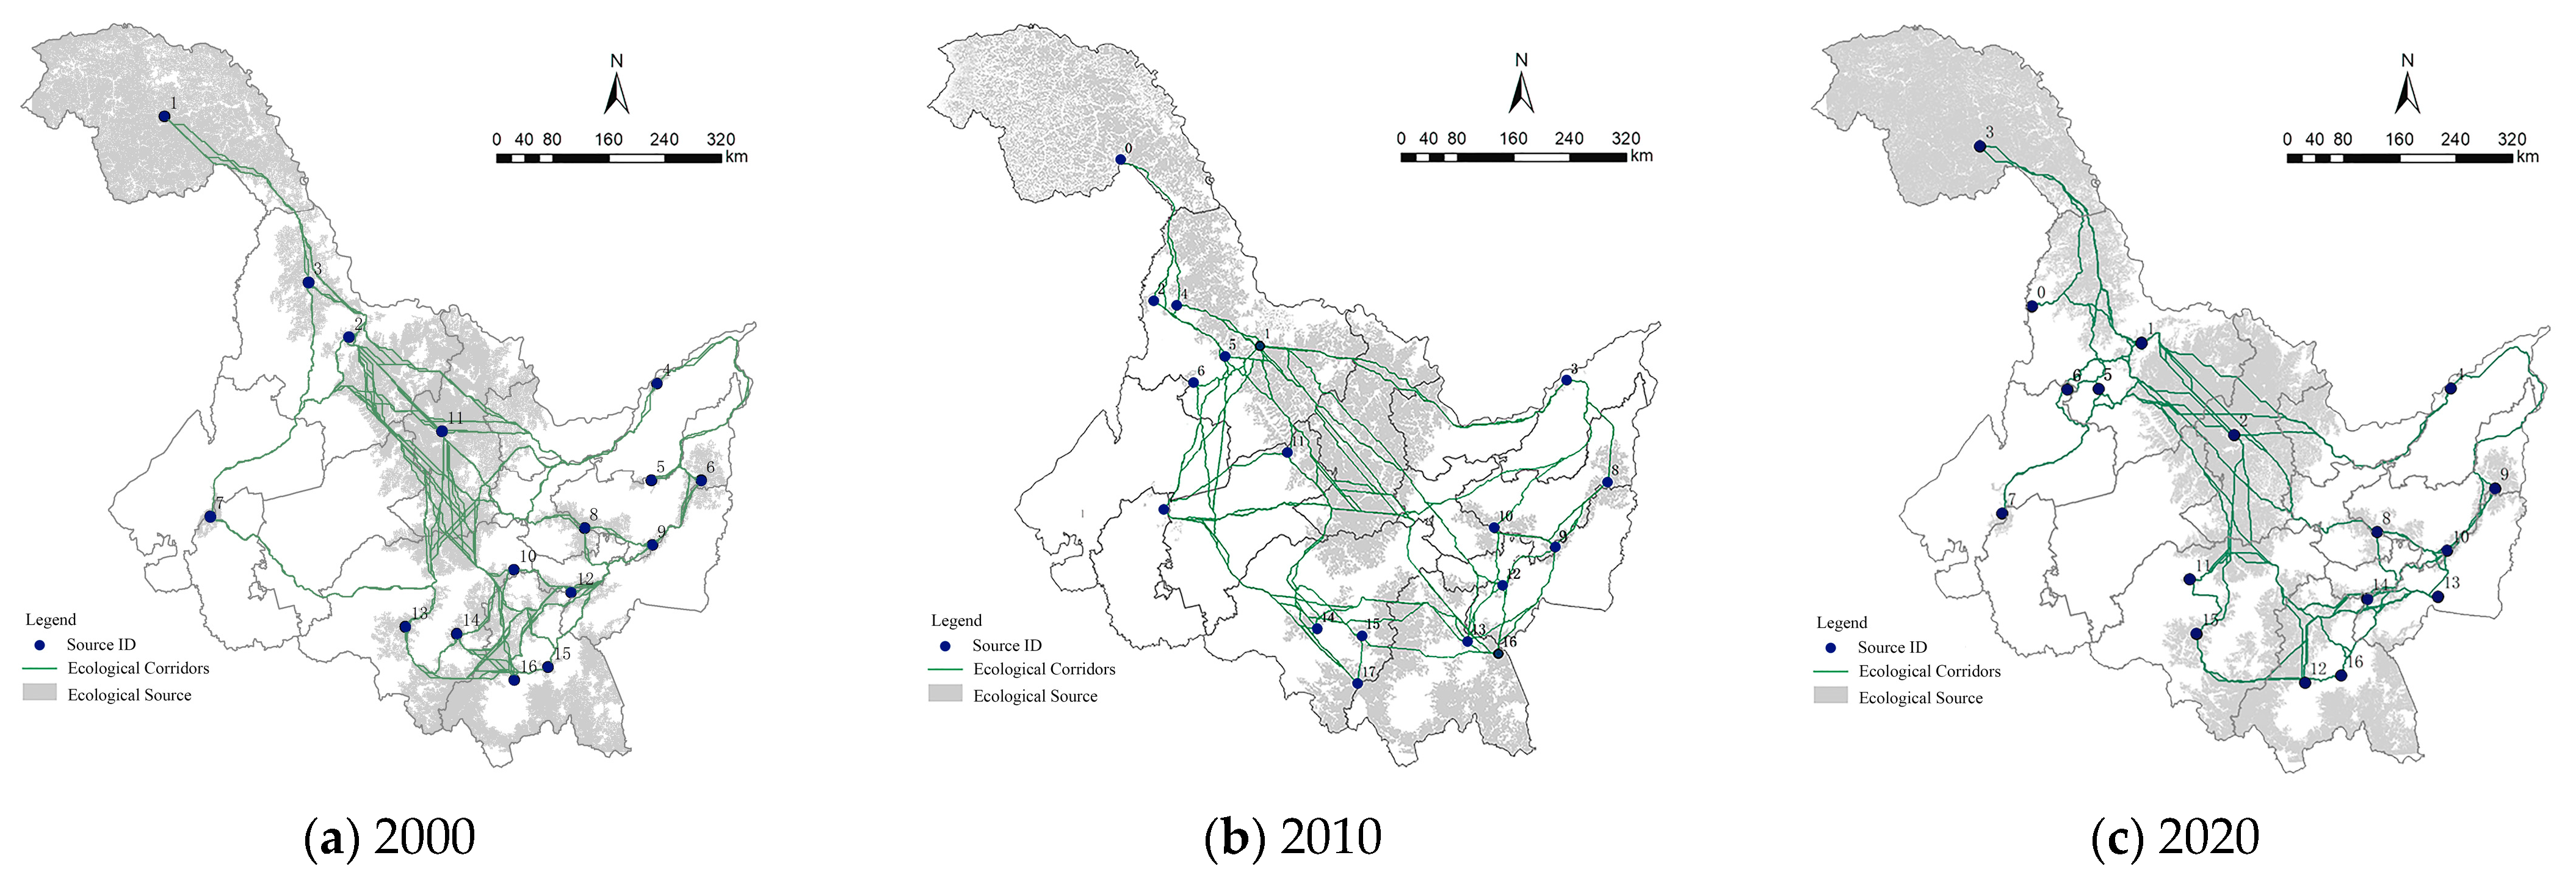
Based on the identified ecological source areas and resistance surfaces, potential ecological corridors were extracted using the MCR model. The spatial configuration of the ecological corridor network for the three study years is illustrated in
Figure 5.
In 2000, the potential ecological corridor network appeared spatially dispersed, with many corridors linking relatively nearby ecological source areas. Some corridor segments appeared less continuous, which was spatially consistent with heterogeneous land-use patterns and localized high-resistance areas.
By 2010, the corridor configuration became more spatially concentrated around major ecological source clusters. Several corridors appeared more continuous, particularly those linking major ecological source clusters. This pattern suggests a more compact corridor configuration along several major linkage directions.
In 2020, the potential ecological corridor network remained continuous at the provincial scale, but its configuration appeared more selective than in 2010. Corridors increasingly aligned with major terrain features and river systems, forming more spatially recognizable linkage pathways across the province. Compared with earlier periods, the corridor network showed a more differentiated spatial pattern, with some linkage directions becoming more prominent than others.
In quantitative terms, the total length of ecological corridors decreased from approximately 12,634 km in 2000 to 11,985 km in 2020, representing a reduction of about 5%. However, this reduction should be interpreted as a contraction in total corridor extent rather than direct evidence of connectivity loss. As shown later by the topological indicators in
Table 3, all three full ecological networks remained connected, whereas the main structural change was a decline in network compactness from 2010 to 2020.
3.3. Backbone Ecological Corridor Network
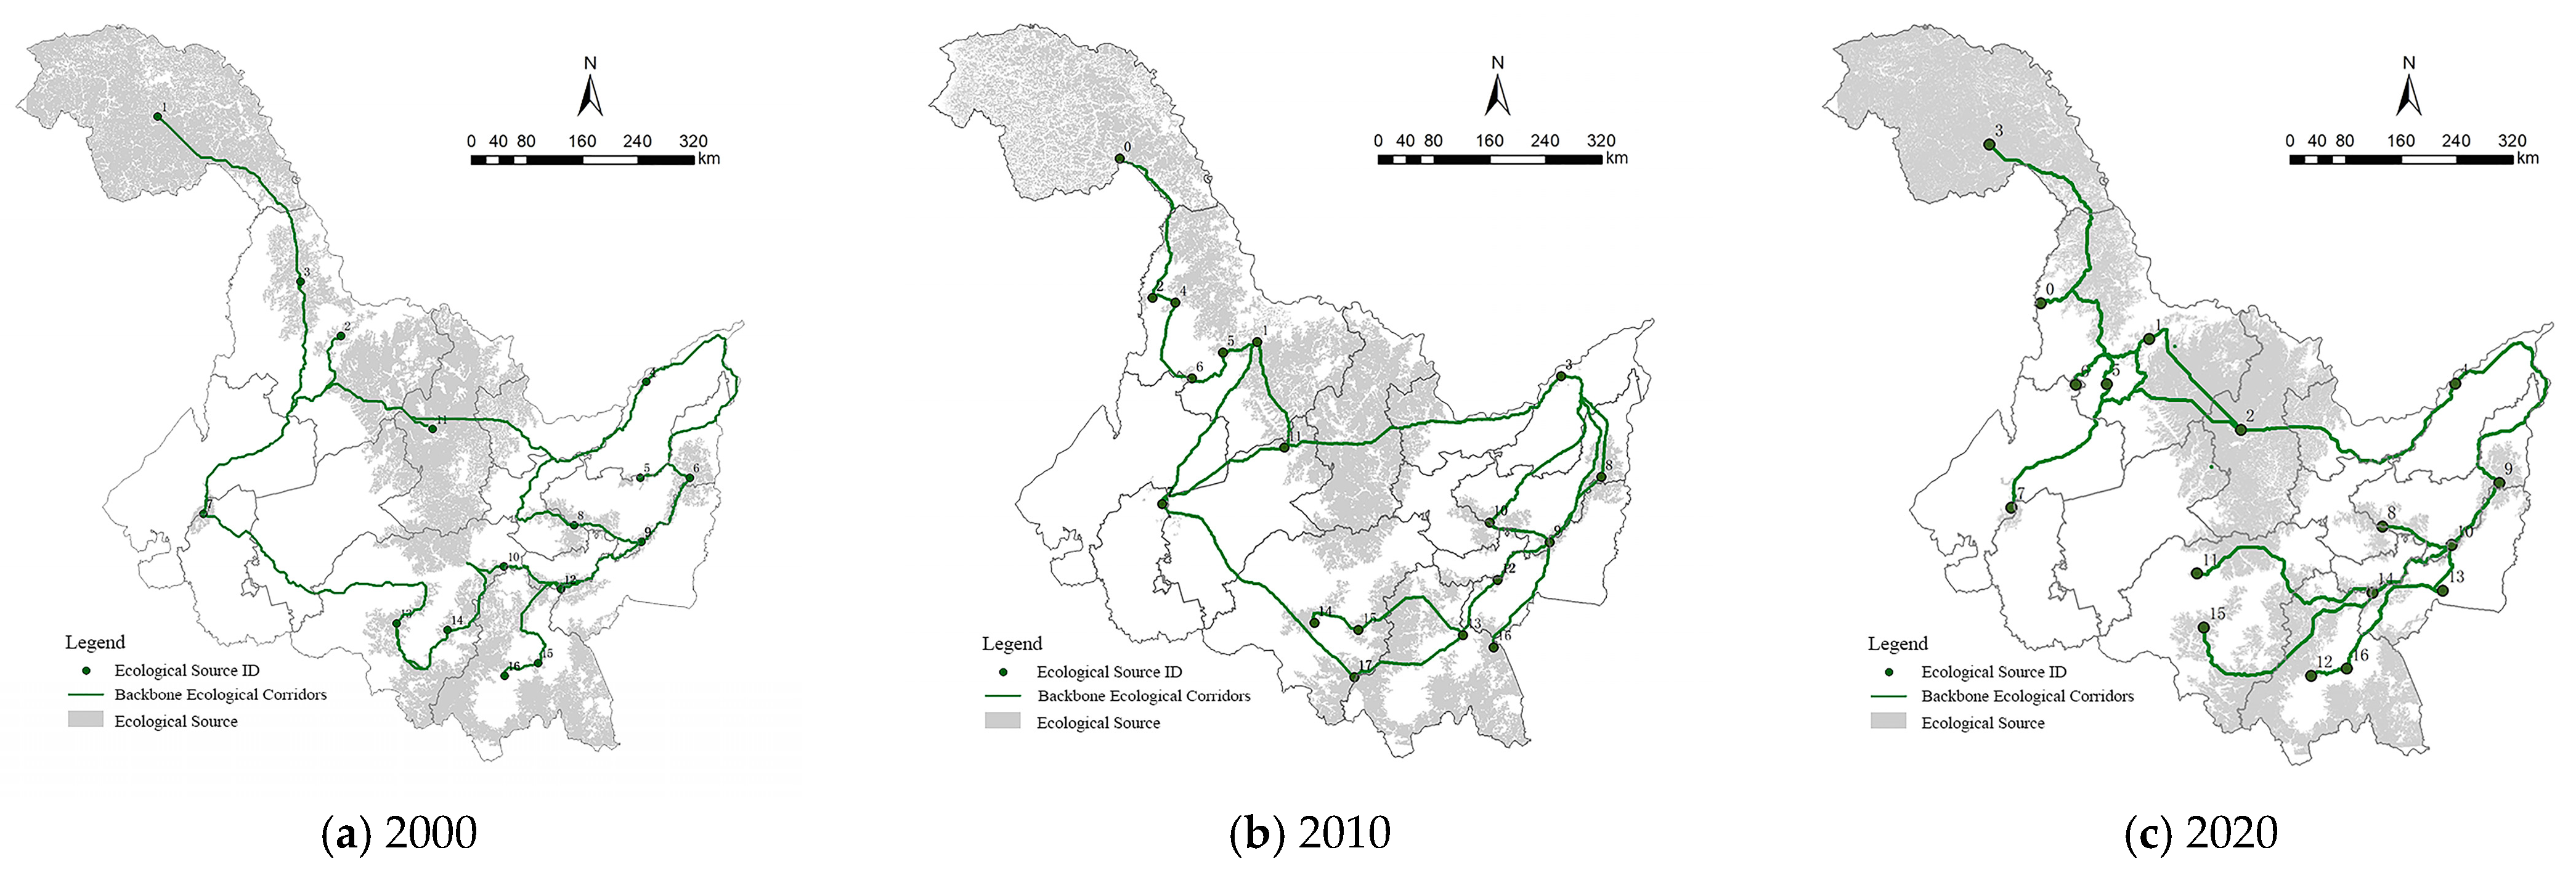
To identify structurally critical connections within the ecological network, backbone ecological corridors were extracted based on edge betweenness. The spatial distribution of backbone corridors for the three study years is presented in
Figure 6.
Compared with the full potential corridor network, the backbone corridor network consists of a smaller number of corridors while preserving key linkages among major ecological source areas. These corridors represent the main structural pathways that maintain ecological linkage among major source areas across Heilongjiang Province.
From 2000 to 2020, the backbone corridor network showed a progressively more selective structural configuration, with a smaller subset of corridors supporting the main network framework. Some secondary corridors present in earlier periods were no longer retained in the reduced backbone structure, whereas corridors linking major forest and wetland regions remained stable or became more prominent.
This pattern indicates that ecological connectivity at the provincial scale increasingly depends on a limited number of structurally important corridors. These backbone corridors function as structurally critical linkages within the ecological network and play an important role in maintaining overall network stability. The structural effectiveness of this reduced backbone network is further evaluated quantitatively in
Section 3.4, where the retained edge ratio, connected components, average shortest path length, and backbone diameter are compared with those of the full ecological network.
3.4. Quantitative Topological Characteristics and Backbone Retention of the Ecological Network
To provide a more quantitative comparison of ecological network evolution, several topological indicators were calculated for the full ecological network, including the number of nodes, number of edges, average degree, network density, connected components, average shortest path length, and network diameter (
Table 3). In addition, to evaluate the structural effectiveness of the backbone ecological corridor network, the number of retained edges, edge retention ratio, connected components, average shortest path length, and diameter of the backbone network were further compared across the three study years (
Table 4). These indicators complement the spatial interpretation based on
Figure 5 and
Figure 6 and provide additional quantitative support for the observed structural changes.
As shown in
Table 3, the full ecological network remained connected in all three years, with only one connected component in each period. This indicates that the provincial ecological network maintained overall structural continuity throughout the study period. However, the degree of structural compactness varied considerably among the three time slices. In 2010, the ecological network reached its highest number of nodes (18) and edges (148), and also exhibited the highest average degree (16.44) and network density (0.967). These values suggest that the 2010 network was the most densely connected and topologically compact among the three periods. By contrast, the 2000 and 2020 networks were both less dense, with 90 and 104 edges, respectively, and clearly lower average degree and density values.
The shortest-path-related indicators further support this interpretation. The average shortest path length was lowest in 2010 (1.03), compared with 1.25 in 2000 and 1.24 in 2020, while the network diameter remained 2 in all three years. This pattern indicates that although all three networks preserved province-wide connectivity, the 2010 network provided the most efficient structural connections among ecological source areas. In comparison, the 2020 network still remained fully connected, but its lower density and higher average shortest path length relative to 2010 suggest a decline in overall structural compactness. Therefore, the temporal evolution of the full ecological network should be interpreted not as a simple loss of connectivity, but rather as a shift from a highly compact structure in 2010 toward a less dense but still connected configuration in 2020.
As shown in
Table 4, the backbone ecological network retained only a limited proportion of the edges in the full network, with edge retention ratios ranging from 11.5% to 16.7%. Specifically, only 15, 17, and 16 edges were retained in the backbone networks of 2000, 2010, and 2020, respectively, while all three backbone networks still preserved overall connectivity, as indicated by a single connected component in each year. This result confirms that only a relatively small subset of corridors was needed to maintain the main structural framework of the provincial ecological network, thereby supporting the validity of edge-betweenness-based backbone extraction.
At the same time, the structural efficiency of the backbone network changed over time. The average shortest path length in the backbone network increased from 1.98 in 2000 to 2.25 in 2010 and further to 2.87 in 2020, while the backbone diameter increased from 3 in 2000 and 2010 to 4 in 2020. These changes indicate that, although the backbone network continued to preserve province-wide connectivity, the structural efficiency of this reduced corridor system declined in 2020. In other words, the main connectivity framework became more dependent on a smaller number of critical corridors and less efficient in terms of inter-source linkage. This trend is consistent with the spatial pattern shown in
Figure 6 and provides quantitative evidence that the ecological network in 2020 relied more strongly on a limited set of structurally important corridors.
3.5. Overall Evolution Characteristics of the Ecological Network
By synthesizing the results of ecological source identification, potential corridor extraction, backbone corridor analysis, and quantitative network indicators, the ecological network of Heilongjiang Province exhibited a clear but non-uniform spatiotemporal evolution pattern from 2000 to 2020. The spatial distribution of ecological source areas remained generally stable, whereas the topological characteristics of the network changed more substantially across the three time periods. Quantitatively, the 2010 network represented the most compact and densely connected configuration, while the 2020 network retained overall connectivity but showed reduced structural compactness compared with 2010 (
Table 3 and
Table 4).
The backbone network analysis further indicates that a relatively small subset of corridors maintained the main structural support of the ecological network in all three years. However, the increasing average shortest path length and diameter of the 2020 backbone network suggest that the reduced corridor system became less efficient and more reliant on a limited number of structurally critical linkages. Therefore, the observed evolution should be interpreted not simply as corridor loss, but as a transition toward a more spatially differentiated and structurally selective connectivity pattern.
Spatially, this transition was associated with contrasting regional tendencies. The northwestern and southeastern parts of the province maintained relatively stable ecological foundations, whereas the southwestern region, especially the Harbin–Daqing axis, showed clearer signs of corridor weakening and ecological space loss. Combined with the land-cover results presented in
Table 5 and
Figure 7 and
Figure 8, these patterns suggest that ecological network evolution in Heilongjiang Province was closely associated with the spatial redistribution of ecological land and increasing human disturbance in development-dominated areas.
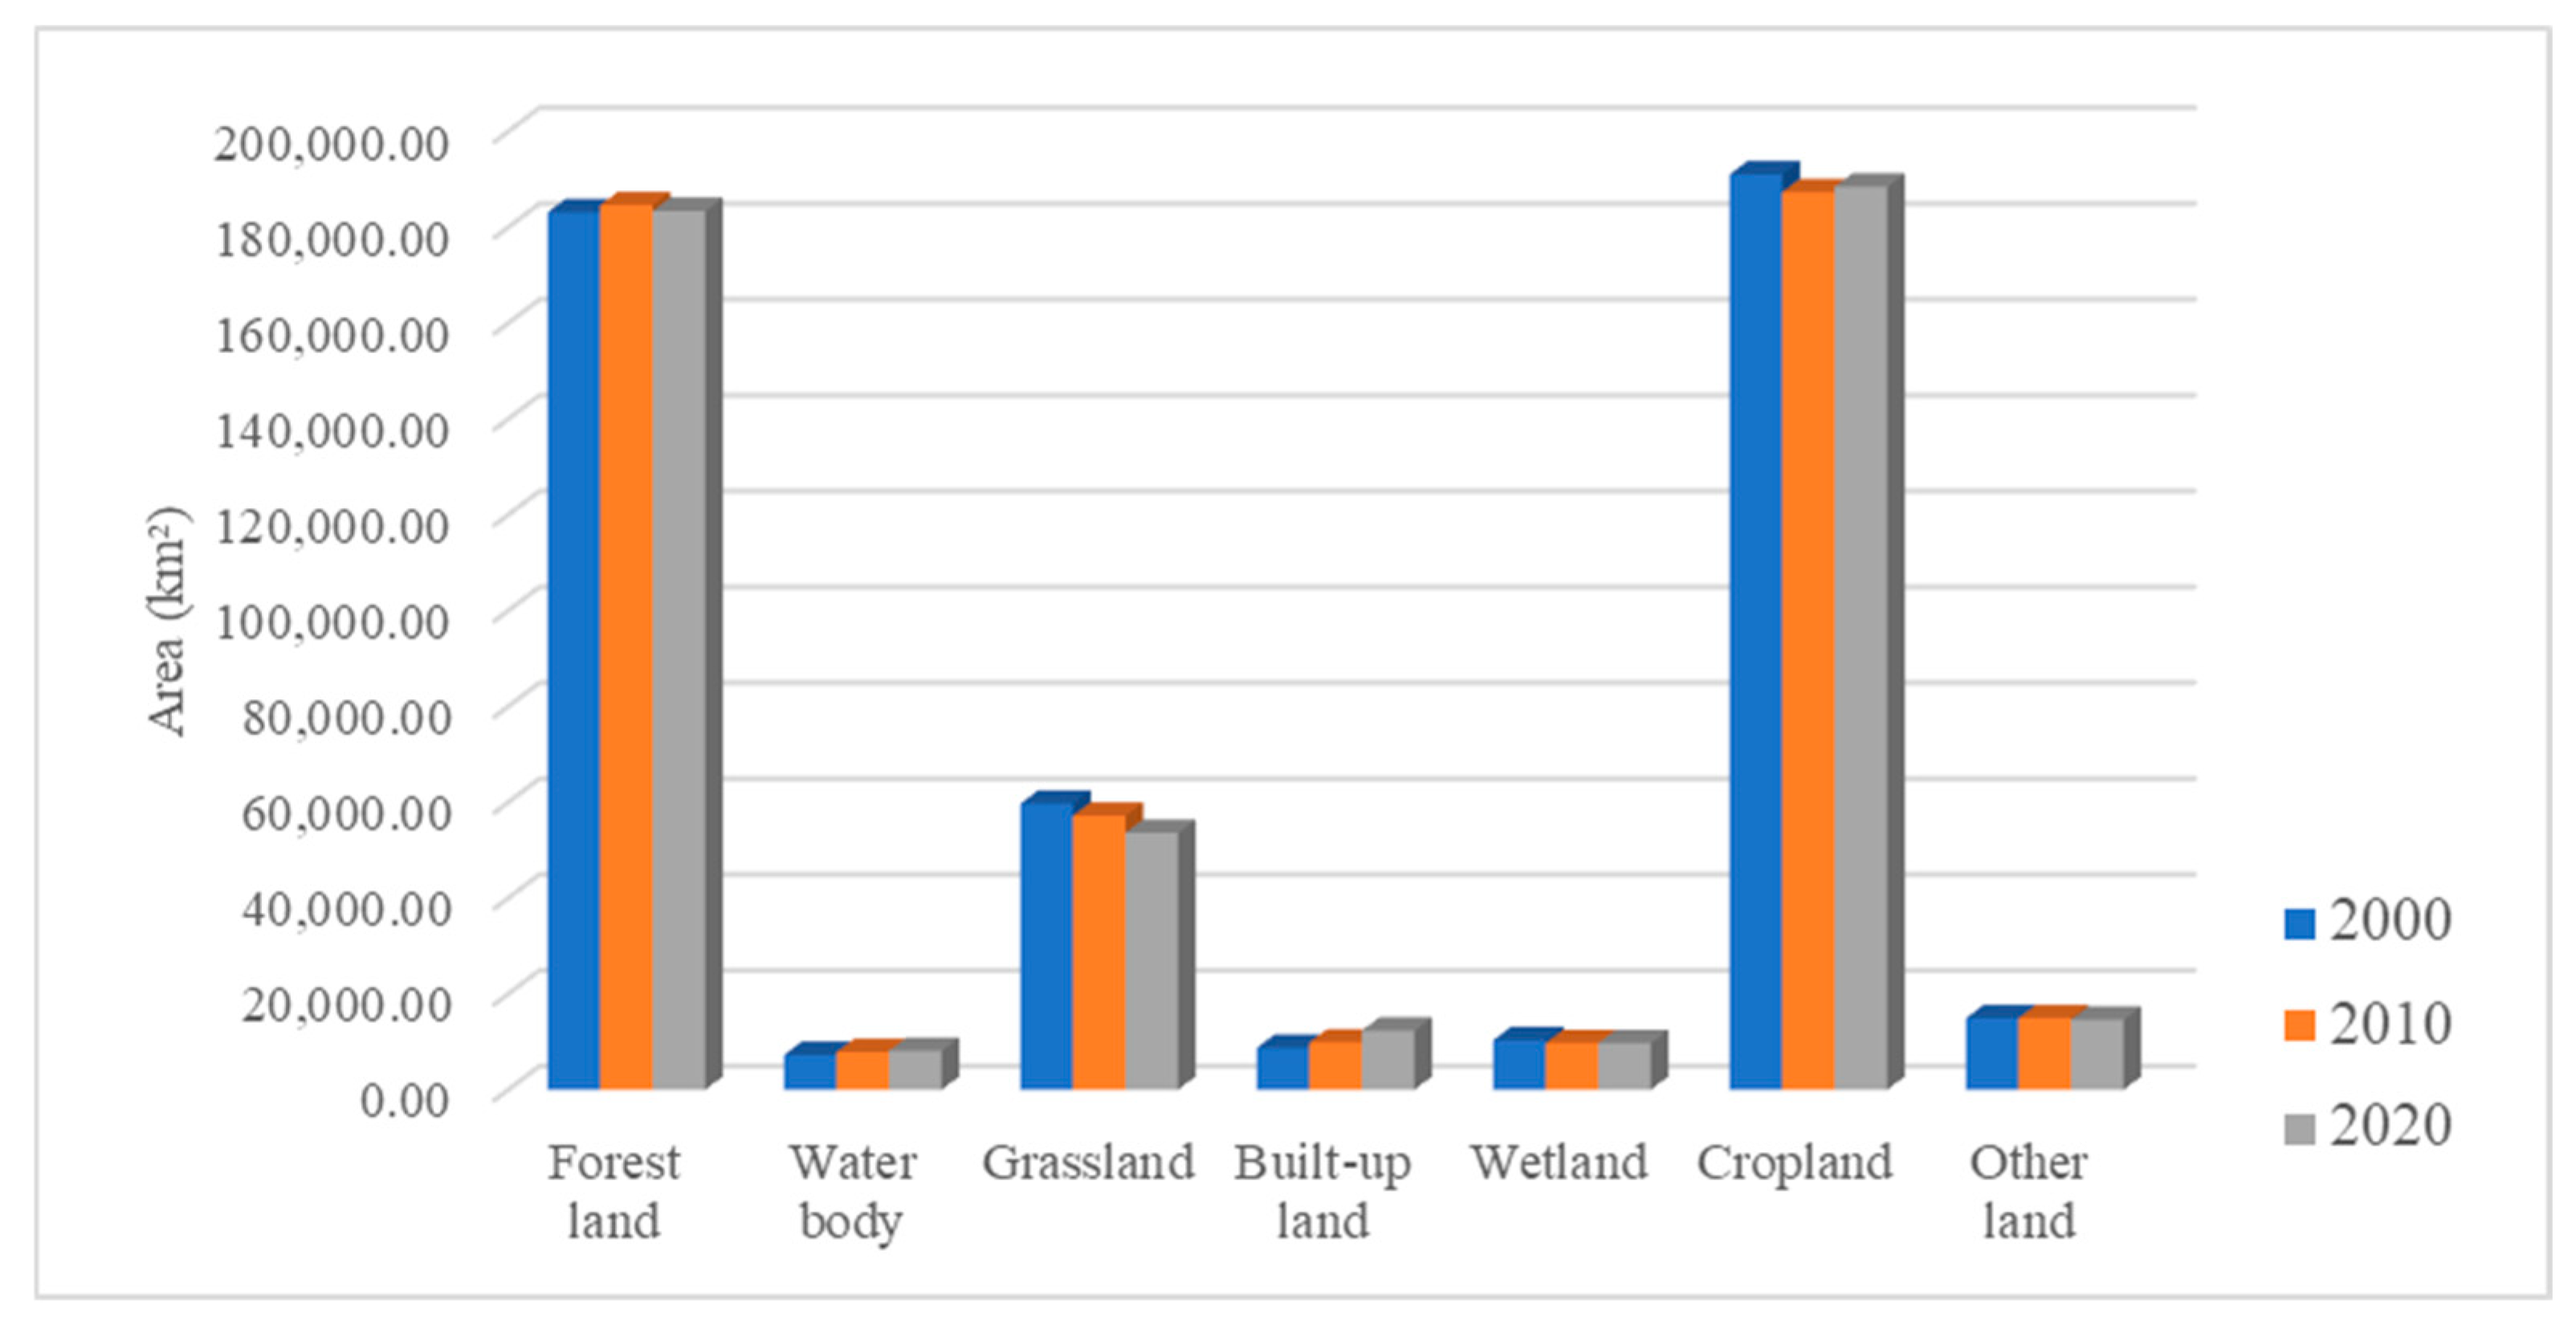
To further interpret the observed structural changes in the ecological network, land-cover dynamics from 2000 to 2020 were analyzed (
Table 5). Forest land remained highly stable, with an overall change of only 0.15%, indicating the persistence of the core ecological matrix. Wetland area decreased slightly from 10,350.30 km
2 in 2000 to 9732.60 km
2 in 2020, suggesting that although wetland ecosystems remained regionally important, some wetland landscapes also experienced pressure during the study period. In contrast, grassland decreased continuously from 59,720.40 km
2 in 2000 to 53,619.00 km
2 in 2020, representing a decline of 10.22%. Water bodies increased from 7271.40 km
2 to 8125.20 km
2 over the study period, indicating localized hydrological or land-cover change. Notably, built-up land expanded significantly from 8762.90 km
2 to 12,342.10 km
2, with an increase of 40.84%. To better visualize the temporal dynamics of major land-cover types, the changes in forest land, grassland, water body, and built-up land from 2000 to 2020 are further illustrated in
Figure 7.
As shown in
Figure 7, forest land remained relatively stable over the study period, whereas grassland showed a continuous declining trend. In contrast, water body and built-up land both increased, with built-up land exhibiting the most pronounced growth. These trends are consistent with the results in
Table 5 and provide additional support for the interpretation that the reduction in semi-natural land and the expansion of human-dominated land were closely associated with the observed structural changes in the ecological network.
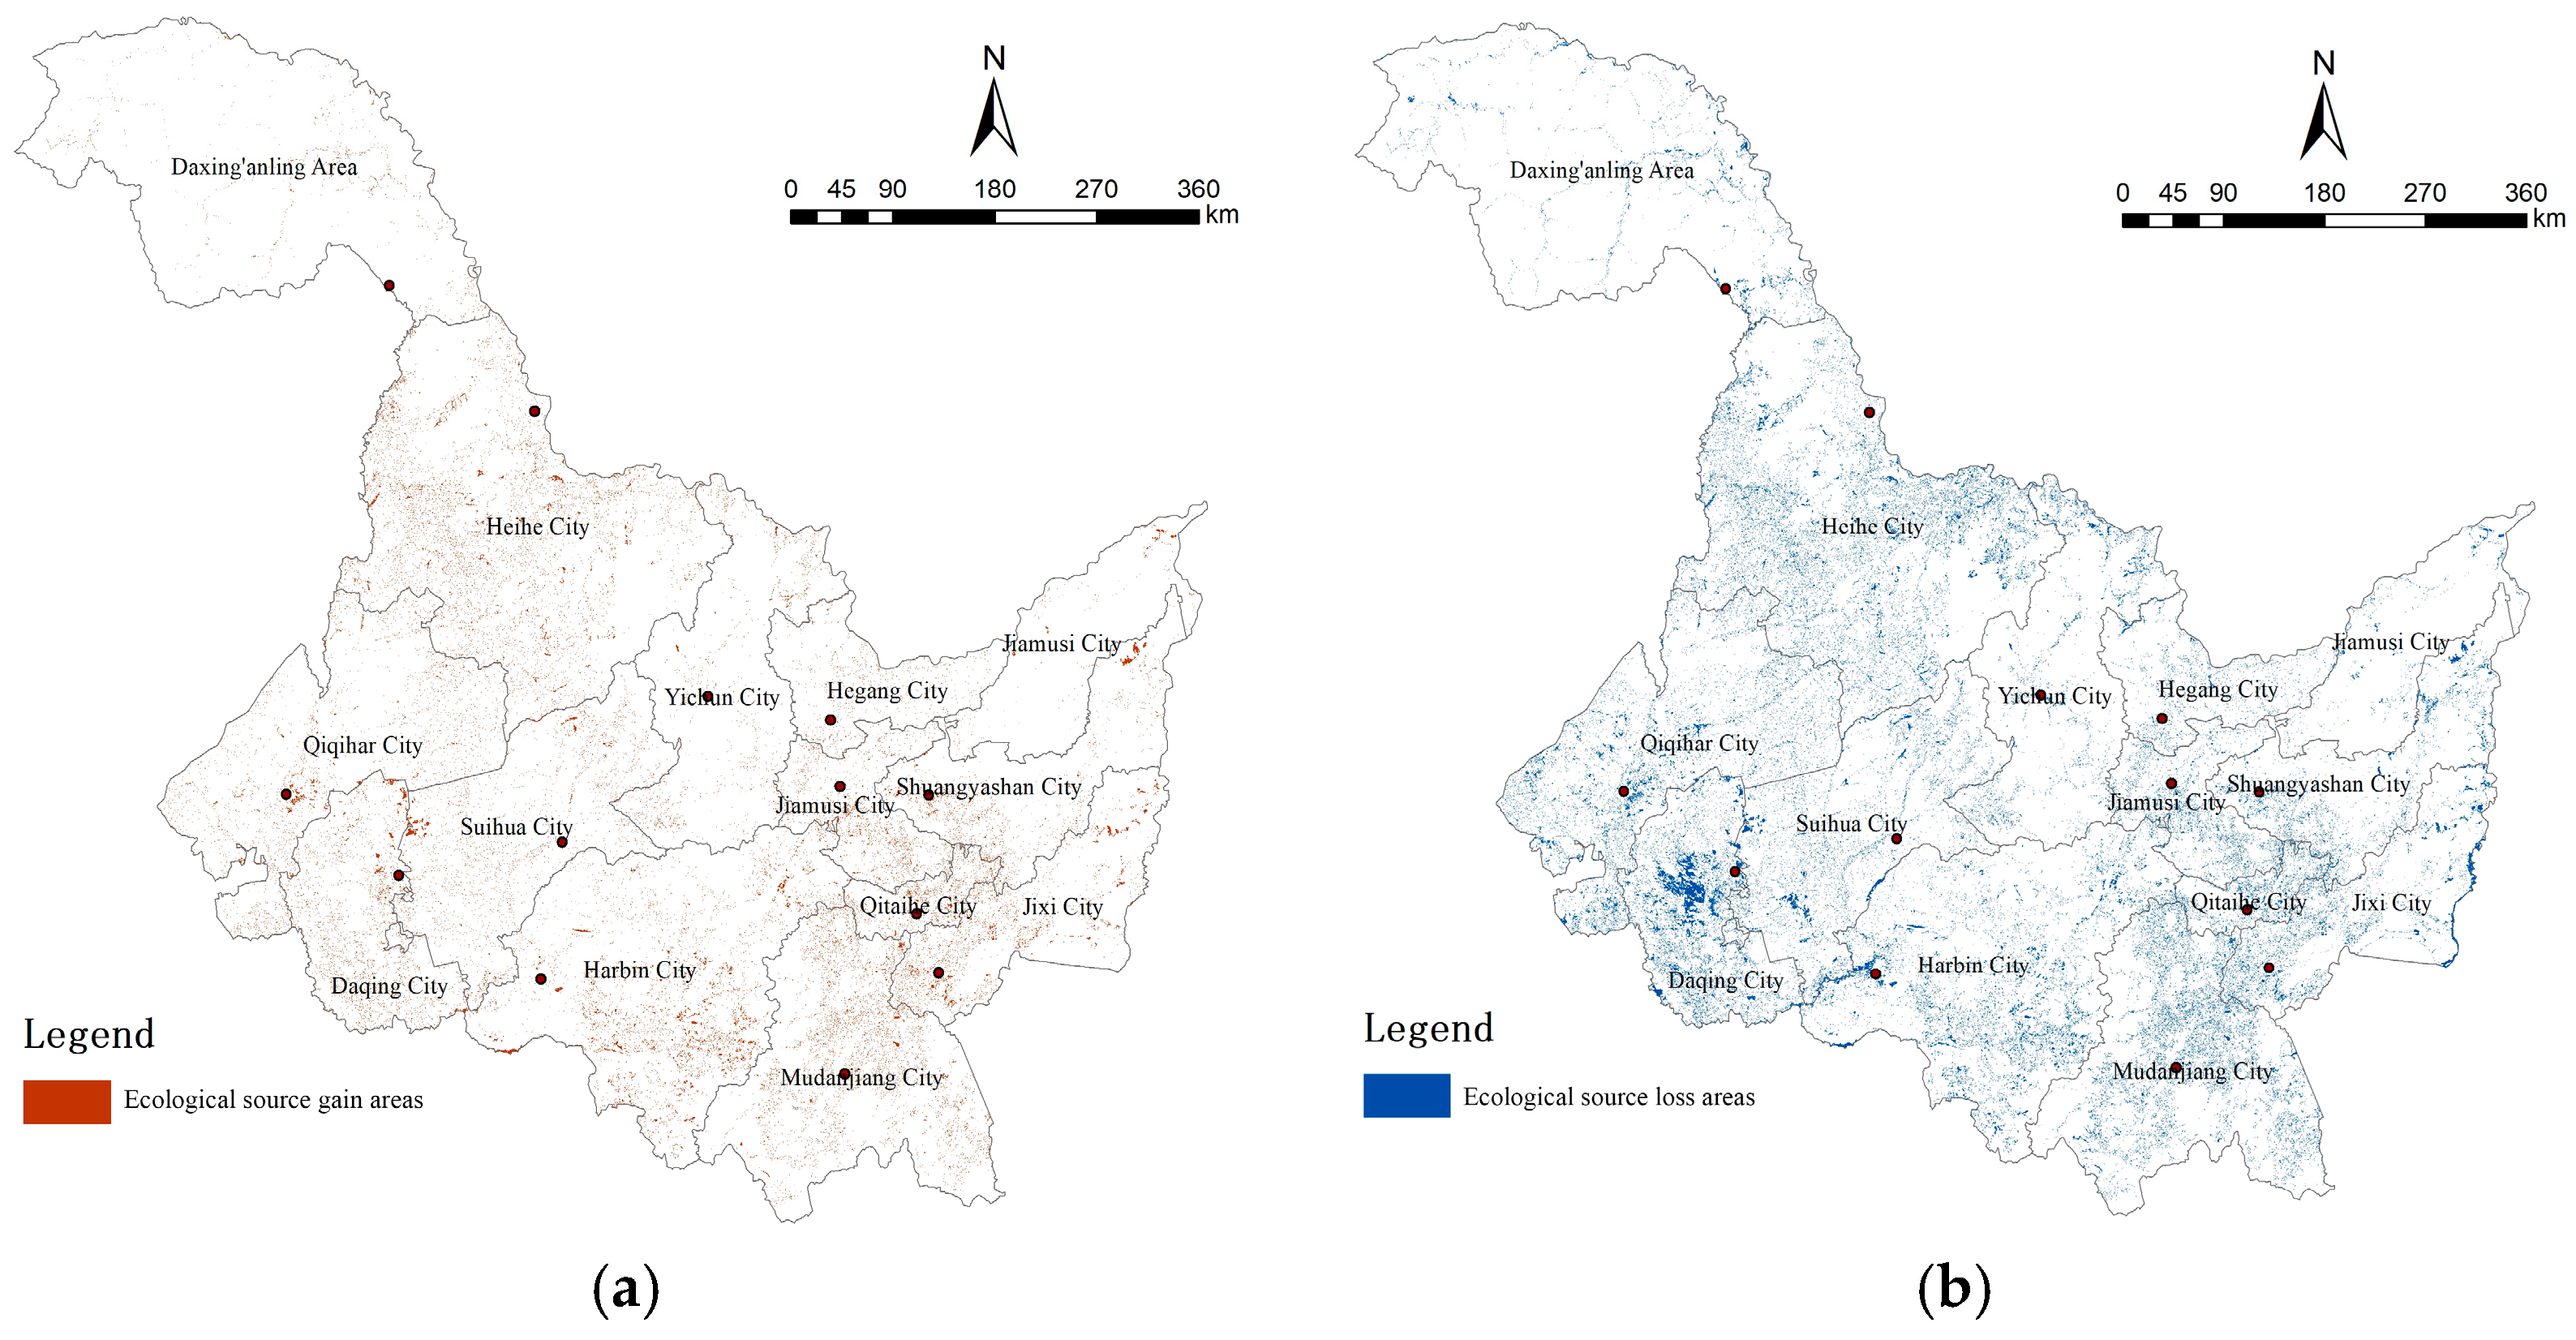
To further explain the regional differentiation of ecological network evolution, the spatial distribution of ecological space gain and loss from 2000 to 2020 was examined (
Figure 8). Ecological space gain was relatively dispersed across the province, whereas ecological space loss was more spatially concentrated, particularly in the southwestern part of Heilongjiang. This spatial pattern is consistent with the observed fragmentation of ecological corridors in the Harbin–Daqing region and provides additional spatial evidence for the “northwest–southeast improvement, southwest degradation” pattern of ecological network evolution.
These results suggest that while core ecological areas remained stable, the reduction in semi-natural land types and the expansion of human-dominated land provided an important contextual basis for interpreting the evolution of ecological network structure.
4. Discussion
4.1. Interpretation of Spatiotemporal Changes in the Ecological Network
The spatiotemporal evolution of the ecological network in Heilongjiang Province from 2000 to 2020 reflects the combined influence of relatively stable natural ecological conditions and ongoing land-use change.
The persistence of ecological source areas indicates that large forest and wetland ecosystems have maintained their dominant role in regional ecological structure. These areas, mainly distributed in mountainous regions and major river basins, provide long-term ecological support and function as core components of the provincial ecological network.
At the same time, the spatial configuration of ecological corridors has undergone gradual adjustment rather than abrupt restructuring. Over the study period, corridors increasingly aligned with major terrain features and hydrological systems, suggesting that physical geography plays a strong constraining role in shaping ecological connectivity. This pattern is consistent with the distribution of ecological land and reflects the underlying stability of the regional natural environment.
4.2. Structural Characteristics and Significance of Backbone Corridors
The extraction of backbone ecological corridors reveals a clear hierarchical structure within the ecological network. While the MCR-based corridor network contains a large number of potential connections, only a limited subset of corridors consistently maintains connectivity among major ecological source areas.
These backbone corridors represent structurally critical linkages within the network. Their spatial stability across different time periods indicates that they are less sensitive to short-term land-use fluctuations and play an important role in maintaining long-distance structural linkage within the network. This interpretation is supported by the quantitative backbone indicators. Although the backbone network retained only 11.5–16.7% of the edges in the full network, it preserved overall connectivity in all three years. Meanwhile, the increase in backbone average shortest path length from 1.98 in 2000 to 2.87 in 2020 and the increase in backbone diameter from 3 to 4 indicate that the reduced corridor system became structurally less efficient over time. This suggests that ecological connectivity increasingly depended on a limited set of critical corridors, especially in 2020 (
Table 4).
From a structural perspective, the increasing concentration of connectivity within a reduced number of corridors suggests a more selective backbone configuration, in which regional ecological connectivity depends on a limited set of critical pathways.
In practical terms, this finding implies that not all potential corridors contribute equally to network stability. Identifying and prioritizing backbone corridors provides a more efficient basis for ecological protection and restoration, particularly at the provincial scale where land resources are constrained.
4.3. Influence of Land-Use Change on Ecological Network Evolution
Land-use change was closely associated with the observed evolution of the ecological network. During the study period, forest area remained relatively stable, whereas grassland decreased and water bodies increased slightly. These land-cover patterns provide important context for interpreting the structural changes observed in the ecological network.
In particular, the continuous decline in grassland and the expansion of built-up land were spatially consistent with areas where corridor continuity weakened. The reduction in grassland may have reduced the continuity of semi-natural transitional space in some regions, whereas the expansion of built-up land likely increased landscape resistance in development-dominated areas. By contrast, the relative stability of forest ecosystems appears to have contributed to the persistence of core ecological source areas and the broader structural continuity of the network.
More specifically, built-up land increased by 40.84% from 2000 to 2020, while grassland decreased by 10.22% over the same period. These land-cover changes were particularly evident in the Harbin–Daqing area, where corridor weakening and ecological space loss were also more apparent. Although the present analysis does not establish direct causality, the spatial correspondence between land-cover change and corridor restructuring suggests that increasing human disturbance and the reduction in semi-natural land were important associated factors in ecological network evolution at the provincial scale.
Overall, the observed structural changes appear to reflect the combined influence of relatively stable forest-dominated ecological foundations, ongoing land-use adjustment, and regional differences in human disturbance intensity. Therefore, land-use change should be interpreted as an important associated factor rather than a directly demonstrated causal driver of ecological network change in this study.
4.4. Regional Differentiation and Connectivity Degradation
The ecological network exhibited clear spatial differentiation across Heilongjiang Province. The northwestern and southeastern parts of the province maintained relatively stable ecological foundations, whereas the southwestern region showed more evident signs of corridor weakening and ecological space loss.
In particular, the Harbin–Daqing region emerged as a key area of structural corridor decline. This region experienced intensive land-use change, including urban expansion and agricultural development, and these processes were spatially associated with higher landscape resistance and weaker corridor continuity. The observed corridor loss in this central development axis corresponded broadly to areas where grassland and other ecological land types declined.
Accordingly, although some parts of the network maintained greater structural continuity or local compactness in structural terms, the weakening of critical corridors in the Harbin–Daqing region reduced the compactness and efficiency of the overall network framework, especially when viewed in combination with the backbone network indicators. This suggests that the ecological network evolved toward a more spatially differentiated configuration, in which connectivity remained relatively stable in ecologically dominant regions but became more vulnerable in areas under stronger human disturbance.
From a structural perspective, this pattern can be described as increasing regional differentiation of ecological connectivity. However, this interpretation should be understood in terms of structural network change rather than direct ecological functional response, because the present study does not model species-specific movement or ecological process dynamics.
4.5. Implications for Spatial Planning and Ecological Management
The findings of this study provide several implications for provincial-level spatial planning and ecological management.
First, the long-term stability of ecological source areas underscores the importance of protecting large forest and wetland ecosystems. These areas should be designated as priority zones for ecological conservation. In development corridors characterized by rapid built-up land expansion, ecological restoration and land-use regulation should be coordinated to prevent further fragmentation of critical corridors.
Second, backbone ecological corridors should be explicitly incorporated into territorial spatial planning frameworks. Given their structural importance, these corridors require stricter land-use control and targeted ecological restoration to maintain network connectivity.
Third, the observed spatial differentiation of the ecological network suggests that conservation strategies should be region-specific. Areas with strong ecological foundations should focus on maintaining existing structures, whereas regions experiencing corridor fragmentation, such as the Harbin–Daqing corridor, should be prioritized for restoration and connectivity enhancement.
Overall, a hierarchical and differentiated approach to ecological network management is needed to reconcile ecological protection with socio-economic development at the provincial scale.
4.6. Limitations and Future Research
Several limitations of this study should be acknowledged. First, resistance values were assigned based on land-use categories and do not account for species-specific movement behaviors. Second, although several graph-based topological indicators were incorporated to strengthen the quantitative interpretation of structural network change, the analysis still focuses on structural rather than species-specific functional connectivity.
Third, the robustness of the parameter settings was not systematically tested in this study. Although the ecological sensitivity weights, resistance coefficients, and source-selection threshold were justified as regionally adapted structural parameters, their effects on the identification of ecological sources, potential corridors, and backbone corridors were not evaluated through alternative parameter scenarios. Therefore, the results should be interpreted as a structurally plausible configuration under the selected parameter scheme rather than as a unique or parameter-insensitive solution.
Despite these limitations, the structure-oriented framework provides a practical and replicable approach for provincial-scale ecological network analysis.
Future research may integrate species-specific ecological parameters, higher-resolution spatial data, and dynamic modeling approaches to further improve the accuracy of ecological network assessment and support more detailed ecological management decisions. In particular, future work should include systematic sensitivity testing of indicator weights, resistance values, and source-selection thresholds to assess the stability of ecological network patterns and improve the methodological robustness of the structure-oriented analytical framework.
5. Conclusions
This study investigated the spatiotemporal evolution of the ecological network in Heilongjiang Province from 2000 to 2020 using an integrated framework combining ecological sensitivity assessment and minimum cumulative resistance (MCR)-based corridor modeling. By focusing on ecological source areas, potential corridors, and backbone corridors, the study provides a structure-oriented understanding of long-term ecological network dynamics at the provincial scale.
The results indicate that ecological source areas remained relatively stable and were mainly concentrated in forest- and wetland-dominated regions. In contrast, ecological corridors exhibited gradual spatial reorganization, with changes in corridor number, length, and alignment reflecting evolving landscape patterns and land-use conditions. The extracted backbone ecological corridors form a hierarchical structural framework that supports large-scale ecological connectivity.
A key finding of this study is that regional ecological connectivity is increasingly dependent on a limited number of structurally critical corridors. This highlights a transition toward a more hierarchical and spatially differentiated network structure, in which backbone corridors play a dominant role in maintaining overall connectivity.
In addition to corridor quantity, length, spatial distribution, and persistence across multiple periods, the incorporation of graph-based topological indicators further strengthens the structural interpretation of ecological network evolution. The combined use of full-network and backbone-network metrics strengthens the quantitative interpretation of ecological network evolution by allowing more explicit comparison of network compactness, structural efficiency, and the changing role of critical corridors across time. This applied analytical workflow remains consistent with commonly available spatial data and is therefore suitable for large-scale and data-limited regional studies.
From a practical perspective, the findings provide a spatial basis for ecological conservation prioritization and territorial spatial planning in cold-region provinces. Stable ecological source areas and structurally important backbone corridors should be treated as priority components of the provincial ecological network, whereas regions showing corridor weakening or ecological space loss may require more targeted restoration and land-use regulation.
Several limitations should be acknowledged. The resistance surface was constructed using generalized land-use categories and does not account for species-specific movement behavior. In addition, although several graph-based topological indicators were incorporated to strengthen the quantitative interpretation of structural network change, the analysis still focuses on structural rather than species-specific functional connectivity, and the sensitivity of key parameter settings was not systematically tested. Future research could integrate species-specific parameters, higher-resolution data, dynamic connectivity models, and sensitivity testing to improve the ecological interpretability and methodological robustness of network assessment.
Overall, this study provides a practical and replicable structure-oriented framework for examining ecological network evolution at the provincial scale. Its contribution lies primarily in integrating source identification, corridor extraction, backbone simplification, and quantitative structural comparison into an applied workflow for ecological analysis and spatial planning, rather than in proposing a new theoretical model of connectivity.