1. Introduction
The urban–rural relationship represents one of the most fundamental economic and social configurations of human society, encompassing the restructuring of physical space, the optimal allocation of resources, and the reshaping of social relations [
1,
2]. For an extended period, China has continuously explored ways to address the developmental imbalances arising from the urban–rural dual structure, progressively deepening its understanding of urban–rural dynamics [
3]. The Third Plenary Session of the 20th Central Committee of the Communist Party of China emphasized that urban–rural integration is an inevitable requirement of Chinese-style modernization. The report of the 19th National Congress called for establishing sound institutional mechanisms and policy systems for urban–rural integration to resolve prominent social contradictions stemming from unbalanced urban–rural development and inadequate rural development. The report of the 20th National Congress further underscored that urban–rural integration and coordinated regional development are inherent requirements for achieving high-quality development. Moreover, the No. 1 Central Documents from 2023 to 2025 have consistently focused on advancing urban–rural integration. Promoting high-quality urban–rural integration hinges on facilitating the free, equitable, and orderly flow and combination of various production factors between urban and rural areas. This involves optimizing factor allocation and structural adjustment, reshaping the structure and function of urban–rural development, innovating integration models, and refining urban–rural development policies to maximize each region’s development potential, thereby achieving sustainable regional development [
4,
5].
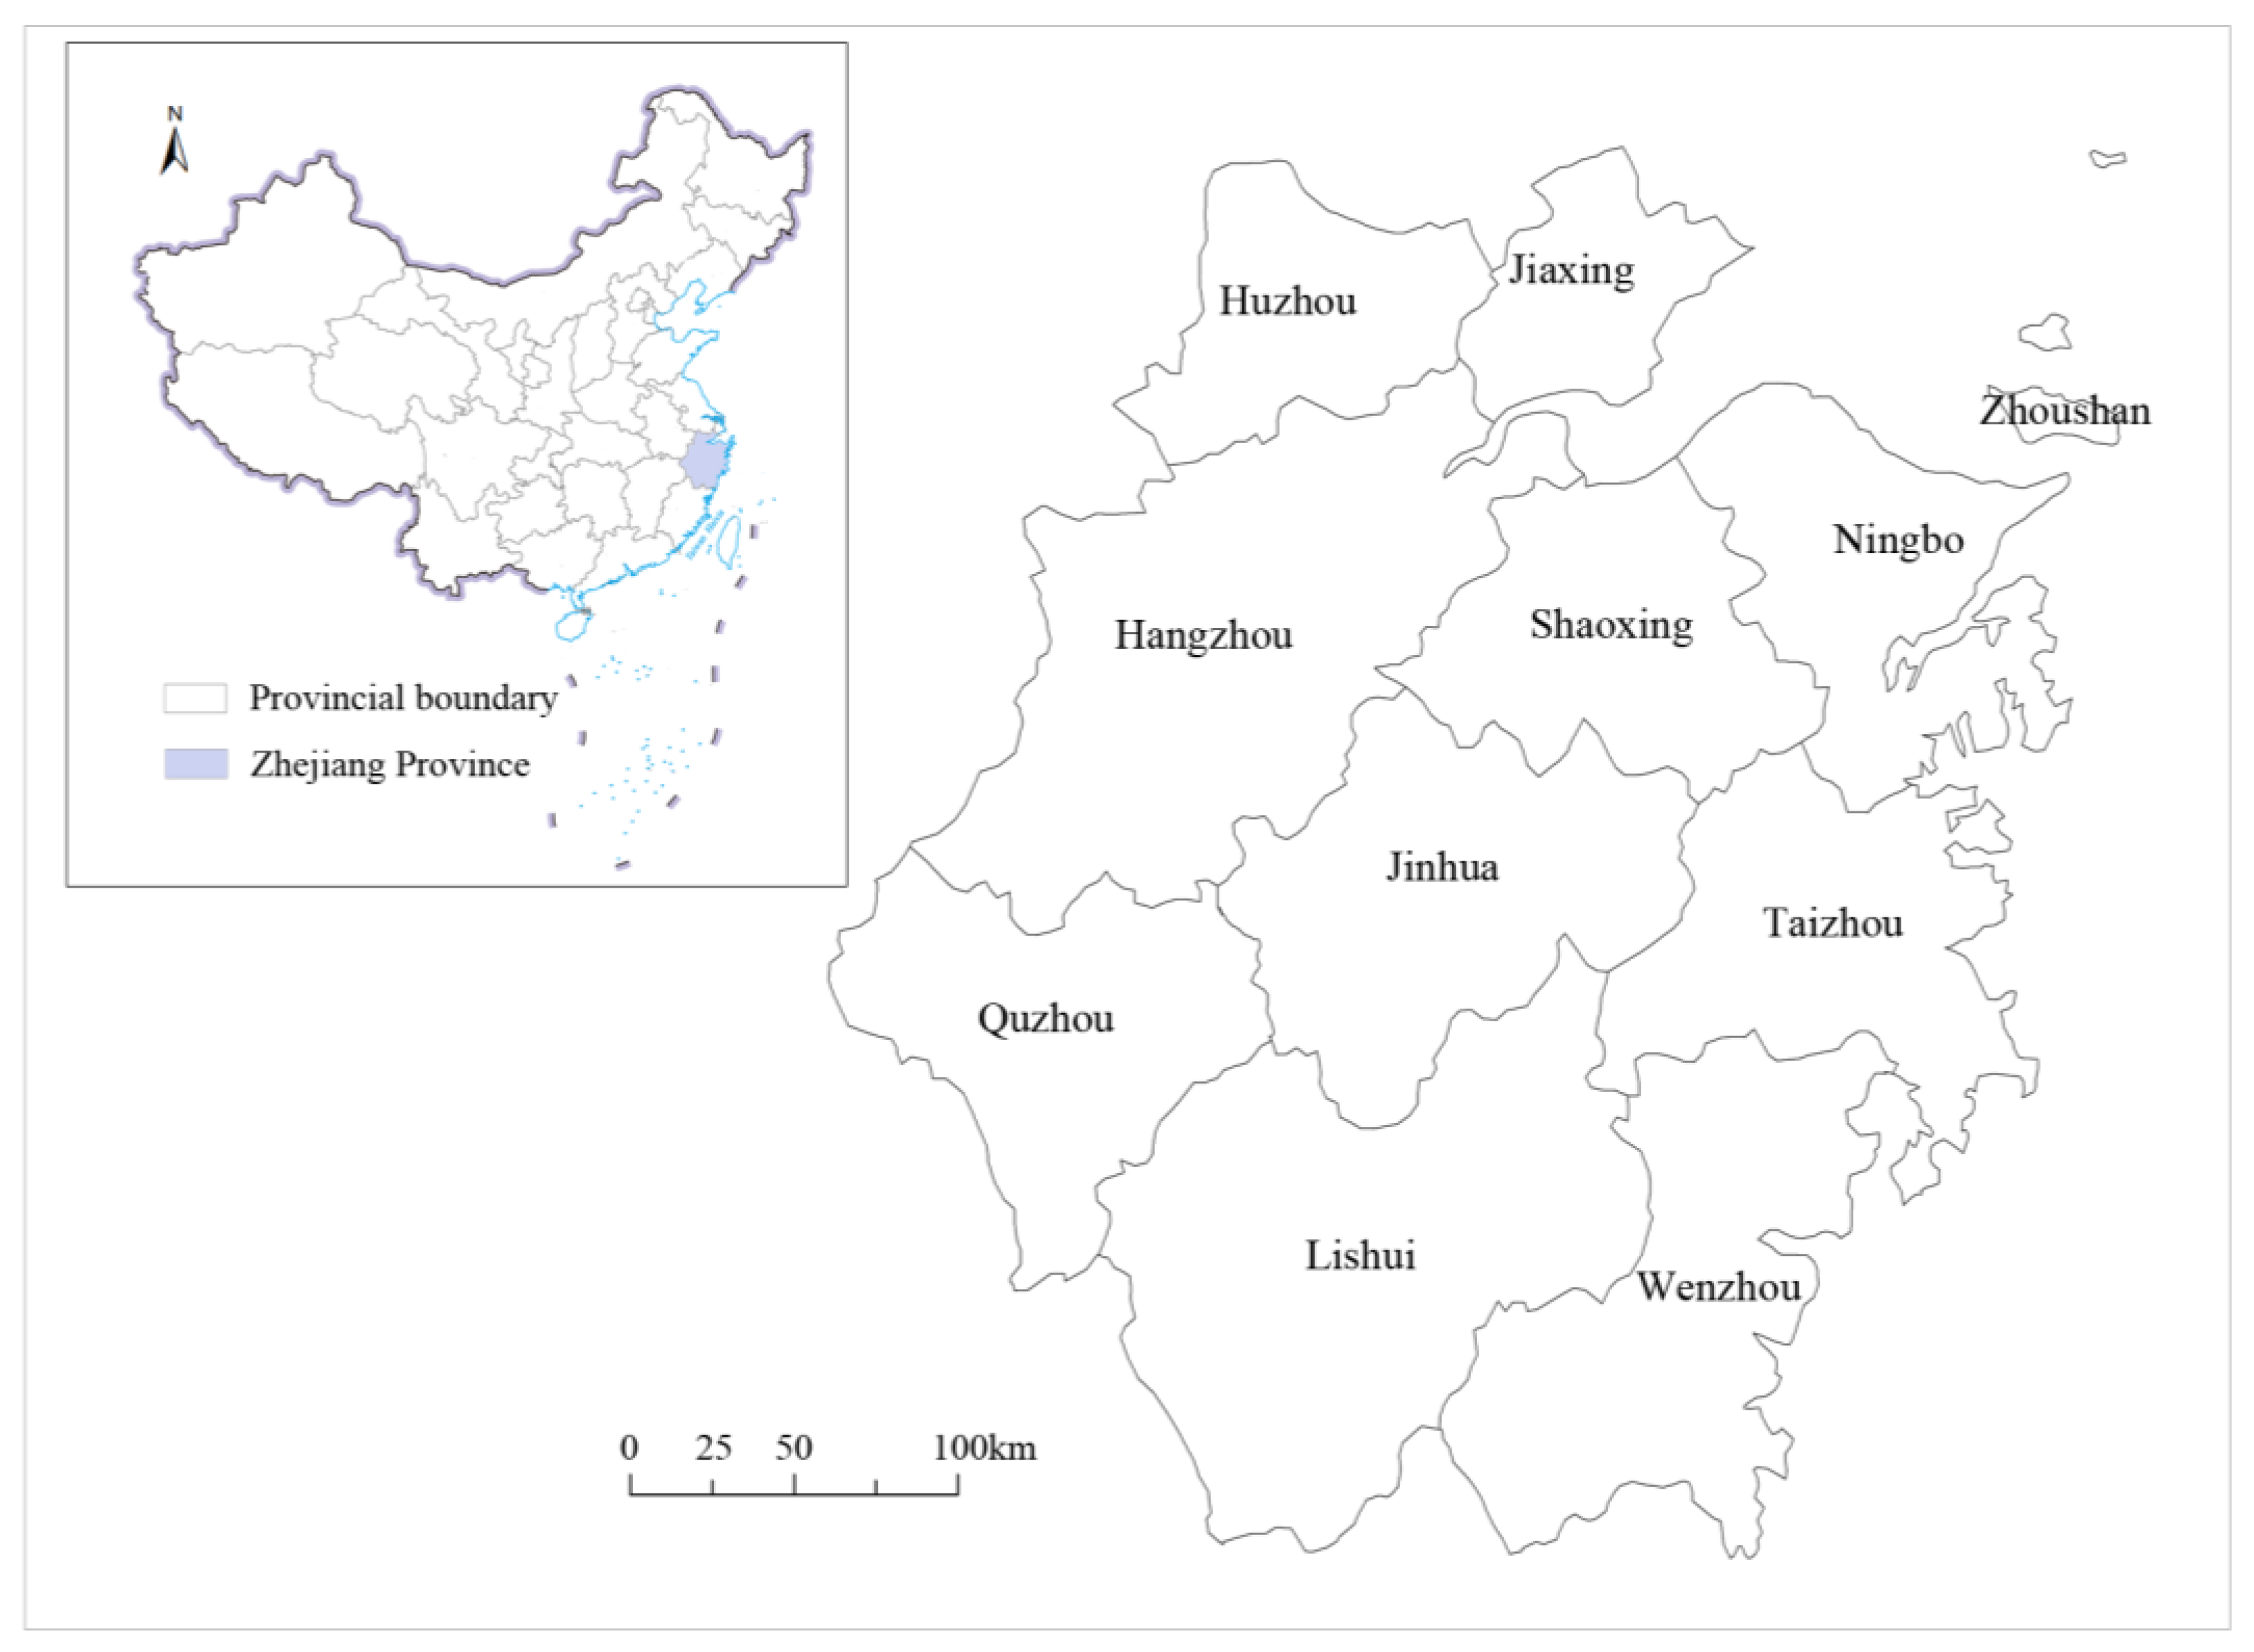
As a national pioneer pilot region for urban–rural integration, Zhejiang Province has introduced a series of relevant policy arrangements. Typical examples include the Implementation Plan for the National Urban–Rural Integration Pilot Area (Jiaxing–Huzhou Region, Zhejiang) and the Implementation Plan for Promoting Urban–Rural Integration via the Thousand Villages Project, narrowing the Three Gaps, and developing Common Prosperity Demonstration Zones. These policies have constructed a clear institutional framework and provided solid support for advancing high-quality urban–rural integration and building a national demonstration zone for common prosperity. Nevertheless, cities across Zhejiang still confront multiple challenges in urban–rural integration, including unbalanced development patterns, restricted factor mobility, inadequate regional coordination, and structural disparities between urban and rural systems. Accordingly, it is imperative to systematically evaluate the current status of urban–rural integration in Zhejiang Province, and to further explore its internal evolutionary mechanisms. Meanwhile, such research also carries important strategic implications for Zhejiang to exert its demonstrative effect in the Yangtze River Delta region and realize higher-level regional coordinated development.
Urban–rural integration development is a prominent research topic in global academic circles. International scholars have focused on the interactive relationship between urban and rural spaces. Some researchers emphasize building coordinated urban–rural systems by integrating natural and community elements. This approach helps address structural challenges in Latin America [
6]. On urban–rural relations, scholars propose multiple perspectives. Some advocate for an analytical framework of urban–rural interactions reflecting rural multifunctionality [
7]. Others conceptualize urban and rural areas as a continuous “field” and develop the idea of a “hybrid of mixed intensity” [
8]. Some researchers analyze urban–rural relations through migration patterns [
9].
Domestic scholars have carried out multidimensional explorations in the field of urban–rural integration. At the theoretical level, researchers have analyzed the connotations of urban–rural integration from diverse perspectives, proposing that urban–rural relations involve comprehensive systemic planning of urban and rural areas, driving forces of urban–rural development, constituent elements of the urban–rural system, urban–rural symbiotic relationships, and the conceptualization of the urban–rural integration system itself [
10,
11,
12]. It is also argued that urban–rural integration arises from the interplay of multiple dimensions, including resources, the economy, and society [
13].
In terms of indicator system construction, research has shifted from single-dimensional to multi-dimensional frameworks, covering economic, demographic, social, spatial, and ecological integration [
14,
15], thus providing diverse frameworks for measuring the level of urban–rural integration development. Furthermore, empirical research has been conducted across various spatial scales. Based on national [
16,
17,
18], urban agglomeration [
19,
20,
21,
22], and county- and city-level [
23,
24] scales, scholars have revealed the spatial differentiation characteristics and spatiotemporal evolution patterns of urban–rural integration development levels.
In summary, although existing studies lay an important foundation for this research, several limitations persist. First, in terms of research content, most existing studies have focused on measuring the level of urban–rural integration and analyzing its driving factors, while systematic identification of obstacle factors—a prerequisite for targeted policy interventions—remains relatively underdeveloped. Second, in terms of research perspective, existing studies have largely concentrated on national or county-level scales, with insufficient systematic explorations of urban–rural integration development at the provincial level. As a key unit connecting national strategies and local implementation, the internal heterogeneity and distinctive characteristics of the provincial scale have not yet been fully explored.
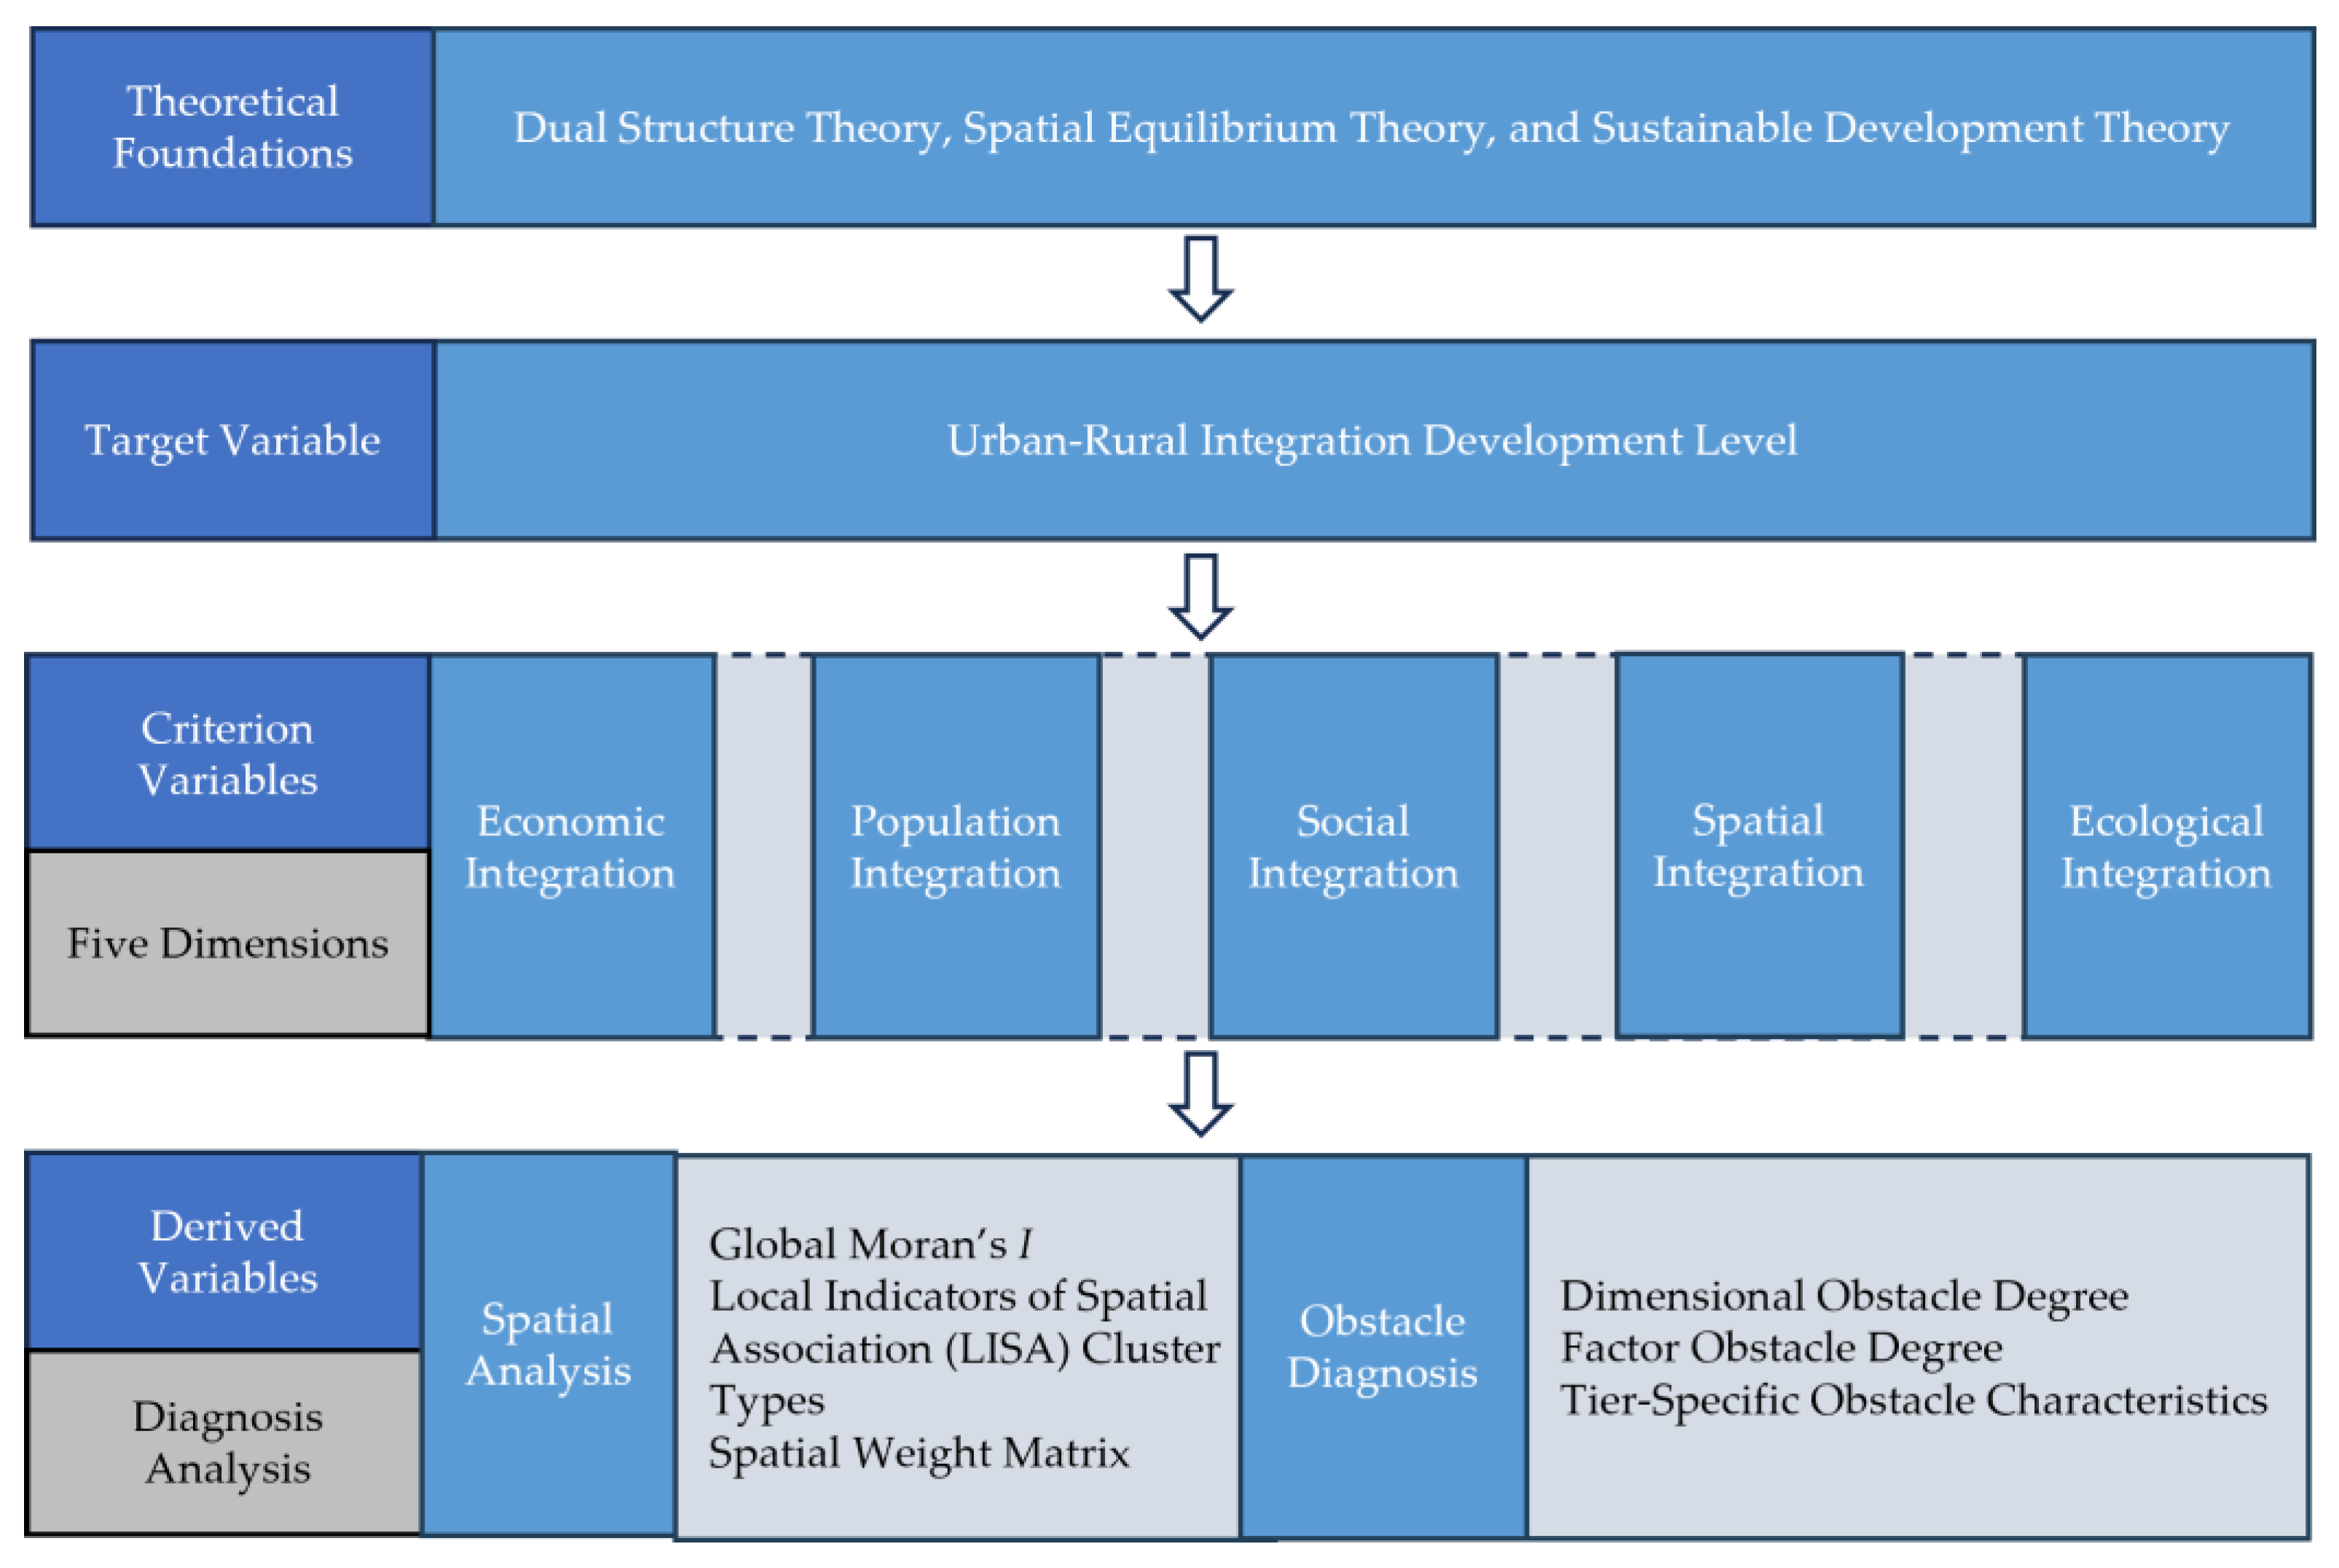
This study is grounded in three core theories: dual structure theory (Lewis, 1954; Fei and Ranis, 1964) [
25,
26], spatial equilibrium theory (Fujita et al., 1999; Glaeser, 2008) [
27,
28], and sustainable development theory (WCED, 1987) [
29]. Dual structure theory reveals urban–rural factor misallocation and industrial gaps, thereby supporting the selection of economic and demographic indicators and the identification of obstacle factors. Spatial equilibrium theory, which emphasizes the interaction between agglomeration and diffusion effects, provides a theoretical basis for applying spatial autocorrelation methods to analyze the spatial patterns of urban–rural integration in Zhejiang Province. Sustainable development theory highlights the coordinated advancement of economic, social, and ecological systems, which justifies the construction of a five-dimensional evaluation framework (economy, population, society, space, and ecology) and the use of an obstacle degree model to diagnose key constraints. These theories have been widely applied in recent studies evaluating urban–rural integration in China [
30,
31,
32].
Based on the above theoretical foundations and literature review, this study addresses the following four research questions: (1) What are the temporal evolution characteristics of urban–rural integration development levels across prefecture-level cities in Zhejiang Province during 2014–2023? (2) Are there significant spatial agglomeration effects and regional disparities in the distribution of urban–rural integration development in Zhejiang Province? (3) At both the system dimension and indicator dimension, what are the core obstacle factors constraining urban–rural integration development in Zhejiang Province? (4) Do these obstacle factors differ significantly among cities at different development tiers?
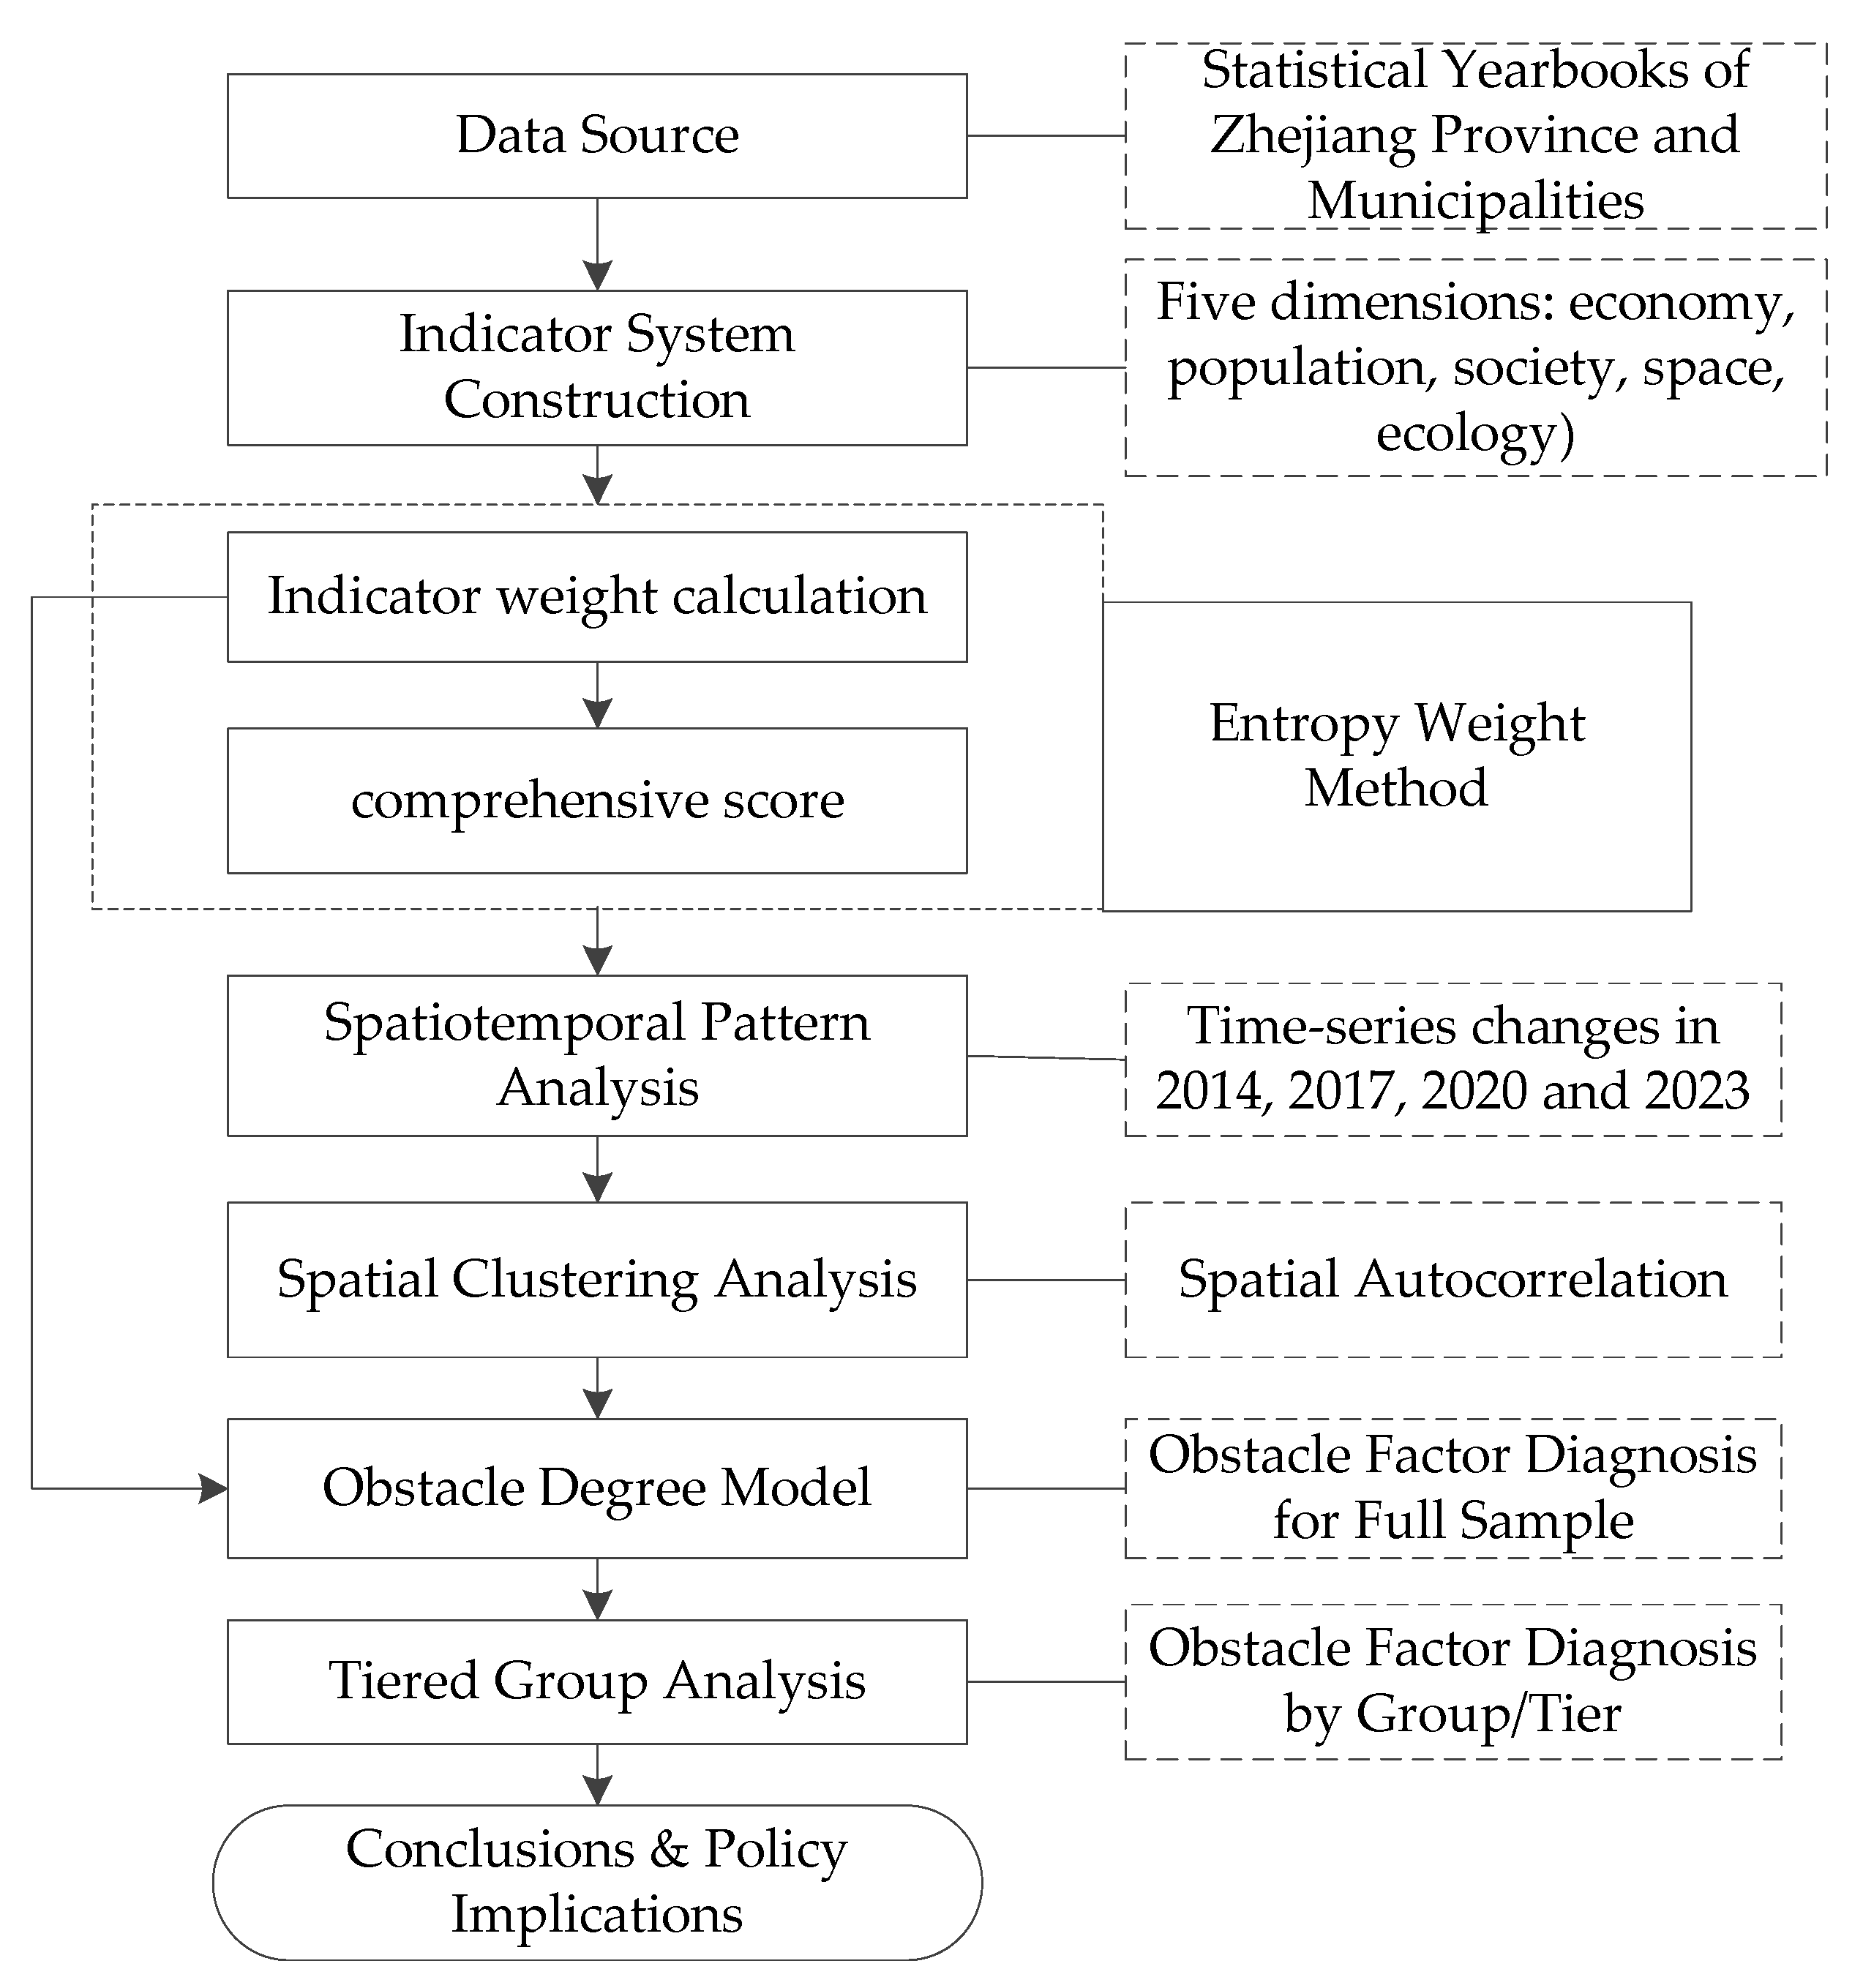
To address the above research questions, this study focuses on prefecture-level cities in Zhejiang Province, employing the entropy weight method, spatial autocorrelation analysis, and the obstacle degree model to analyze the spatiotemporal patterns of urban–rural integration and identify its main constraints. The selection of the prefecture-level scale is supported by both theoretical and practical grounds. Theoretically, spatial equilibrium theory highlights that regional spatial structures result from the interplay of agglomeration and diffusion effects, which can be well reflected at the meso-level administrative scale. Practically, prefecture-level cities act as key nodes connecting provincial strategies and county-level actions, making the findings highly policy-relevant for Zhejiang’s urban–rural integration planning. Therefore, this scale not only helps reveal spatial heterogeneity but also supports the formulation of targeted regional policies.
On this basis, to more clearly present the distinctions and innovations of this study in relation to existing research,
Table 1 provides a systematic review and comparative analysis of representative studies from three perspectives: research content, research perspective, and research framework.
In summary, compared with existing studies, the marginal contributions of this study are fourfold. First, it refines the research scale to the prefecture-level cities in Zhejiang Province, which helps capture intra-provincial heterogeneity and representative patterns. Second, it focuses on the diagnosis of obstacle factors and systematically identifies the key constraints on urban–rural integration development. Third, it conducts a typological analysis based on city development tiers to enable heterogeneity comparison. Fourth, it integrates three analytical methods to establish a comprehensive research framework that follows a “level identification-spatial differentiation-obstacle diagnosis” logic.
3. Results Analysis
3.1. Measurement of Urban–Rural Integration Development
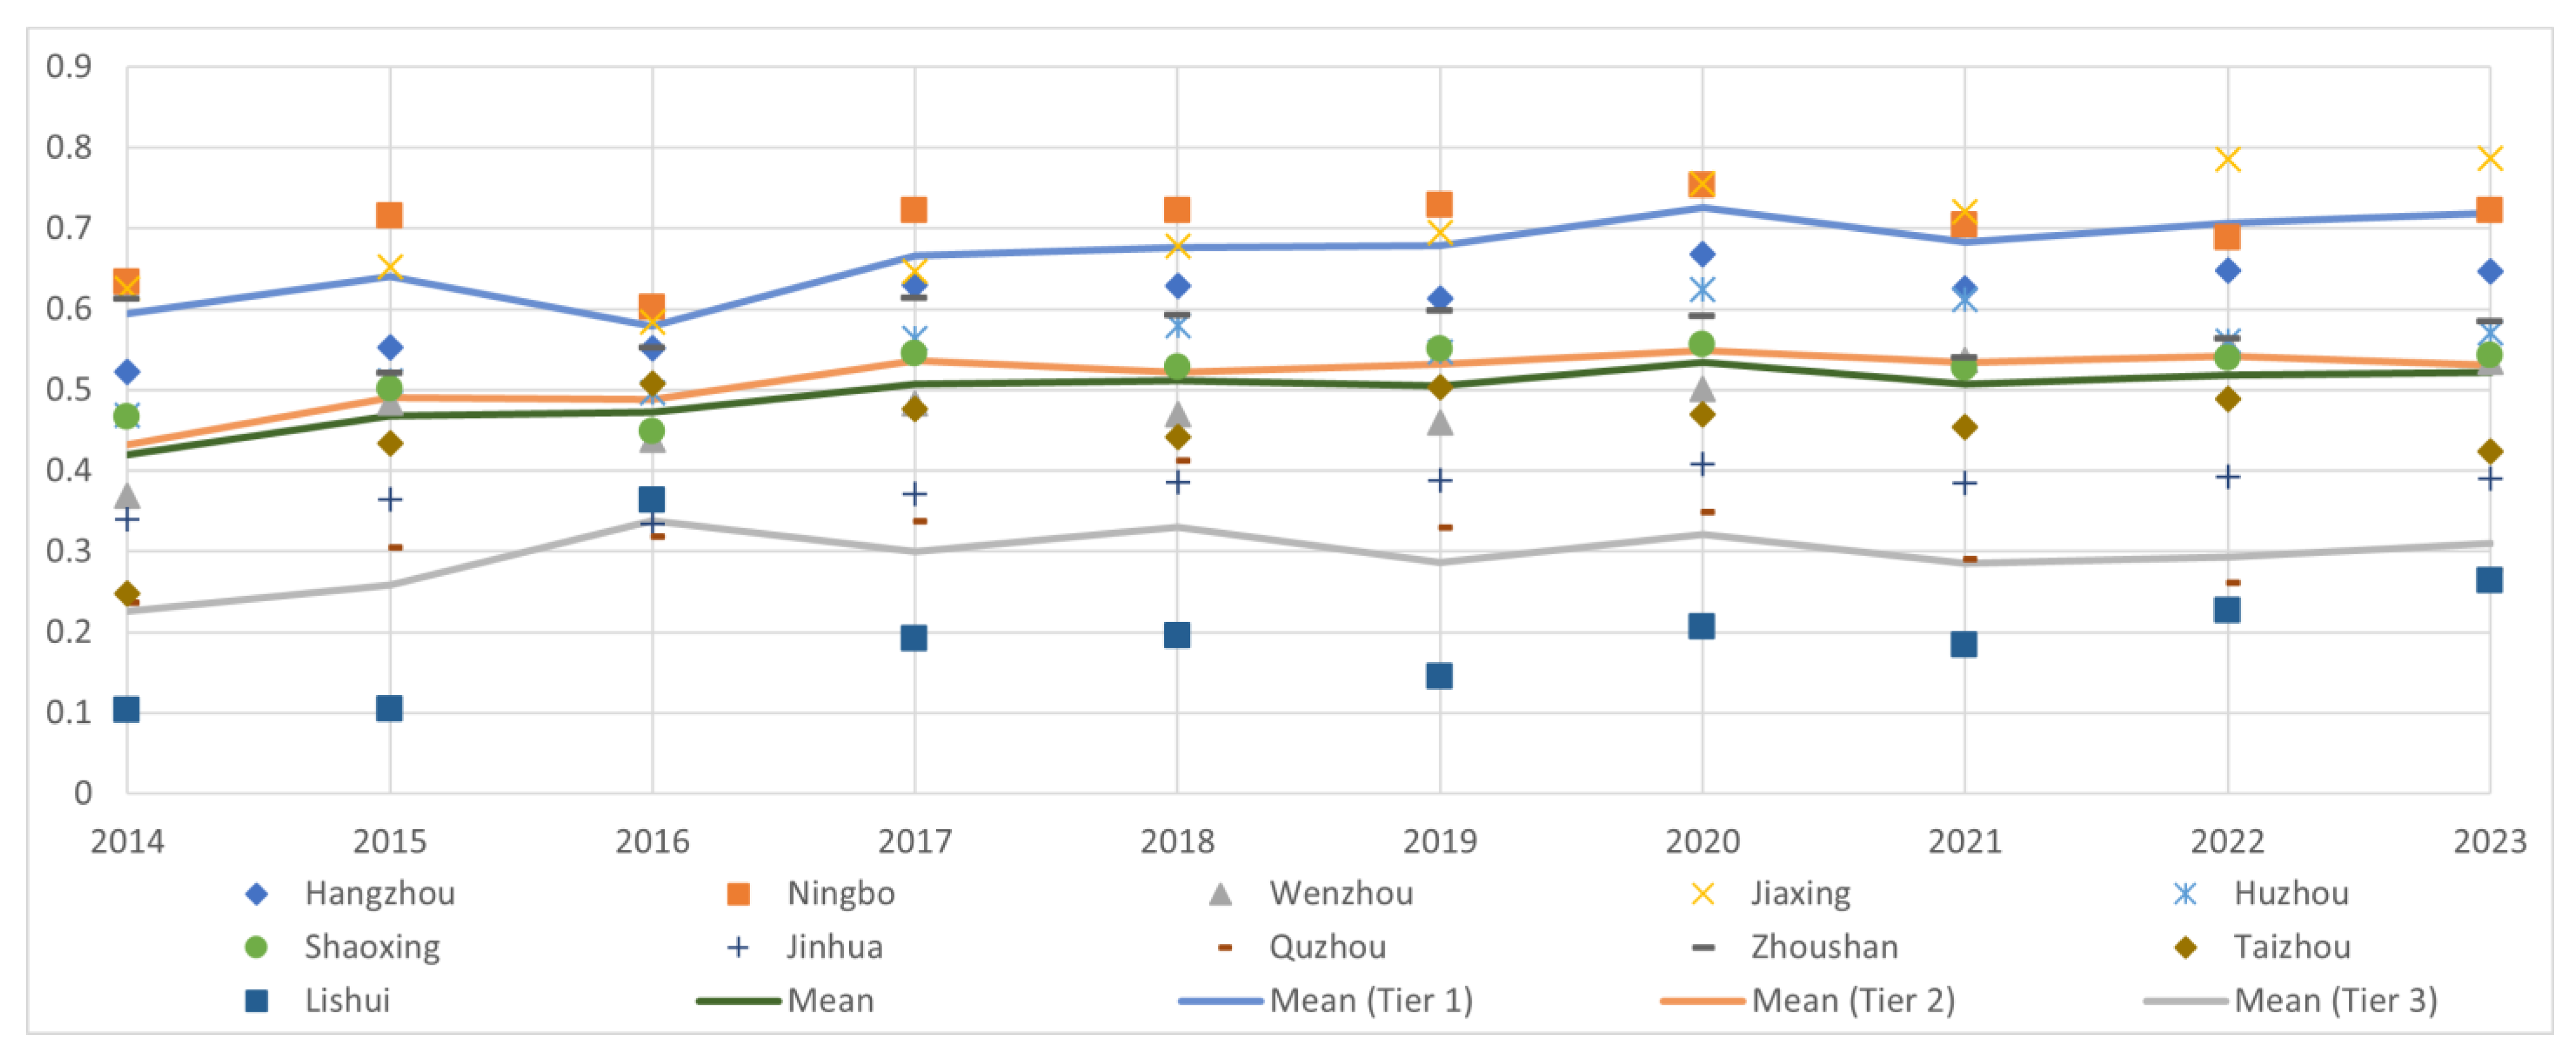
During the study period, the overall level of urban–rural integration development in Zhejiang Province exhibited a steady upward trend, with the average index increasing from 0.420 in 2014 to 0.522 in 2023, representing an increase of 24.3% (
Figure 4). This trend aligns closely with Zhejiang’s strategic positioning as a national demonstration zone for common prosperity, and is consistent with the in-depth implementation of the dual-drive strategy of new-type urbanization and rural revitalization under the guidance of the “Eight-Eight Strategy,” which has coincided with the promotion of urban–rural factor flows, equalization of public services, and infrastructure integration. However, significant inter-city disparities have resulted in a distinct hierarchical pattern. The first tier includes Hangzhou, Ningbo, and Jiaxing, with average indices exceeding 0.6. Among these, Jiaxing’s development trajectory is particularly notable, as it has ranked first in the province since 2020. This leap coincides temporally with its selection as a national pilot zone for urban–rural integration development in December 2019. As an institutional innovation carrier, the pilot qualification is theoretically associated with expanded policy space for exploratory reforms regarding urban–rural factor flows and industrial coordination. Such temporal coincidence is consistent with the theoretical implication of institutional dividends and can be regarded as mechanism-consistent evidence rather than definitive causal inference. The second tier includes Huzhou, Shaoxing, Wenzhou, Taizhou, and Zhoushan, with indices fluctuating near the provincial average (0.445–0.576). The third tier consists of Lishui, Quzhou, and Jinhua, whose indices remained below 0.40 throughout the study period. Among these, Lishui recorded an average index of only 0.198, representing the weakest area in the province. Most of these cities are located in the mountainous region of southwestern Zhejiang, where geographical conditions and economic development foundations are relatively weak. Their persistently low levels are consistent with the long-term constraints imposed by the geographical environment on urban–rural integration development.
Further analysis reveals that urban–rural integration development in Zhejiang Province features the coexistence of convergence and divergence. Convergence is mainly reflected in the steady rise in the provincial average index, indicating consistent overall policy orientation and development paths. By contrast, divergence is manifested in the gradually widening gap among cities in different tiers. The gap in average indices between the first and third tiers widened from 0.368 in 2014 to 0.409 in 2023, suggesting a growing imbalance in urban–rural integration development. The persistence of this divergent pattern is closely associated with regional disparities in initial development conditions, policy resource agglomeration, and the path-dependent effects of geographical endowments.
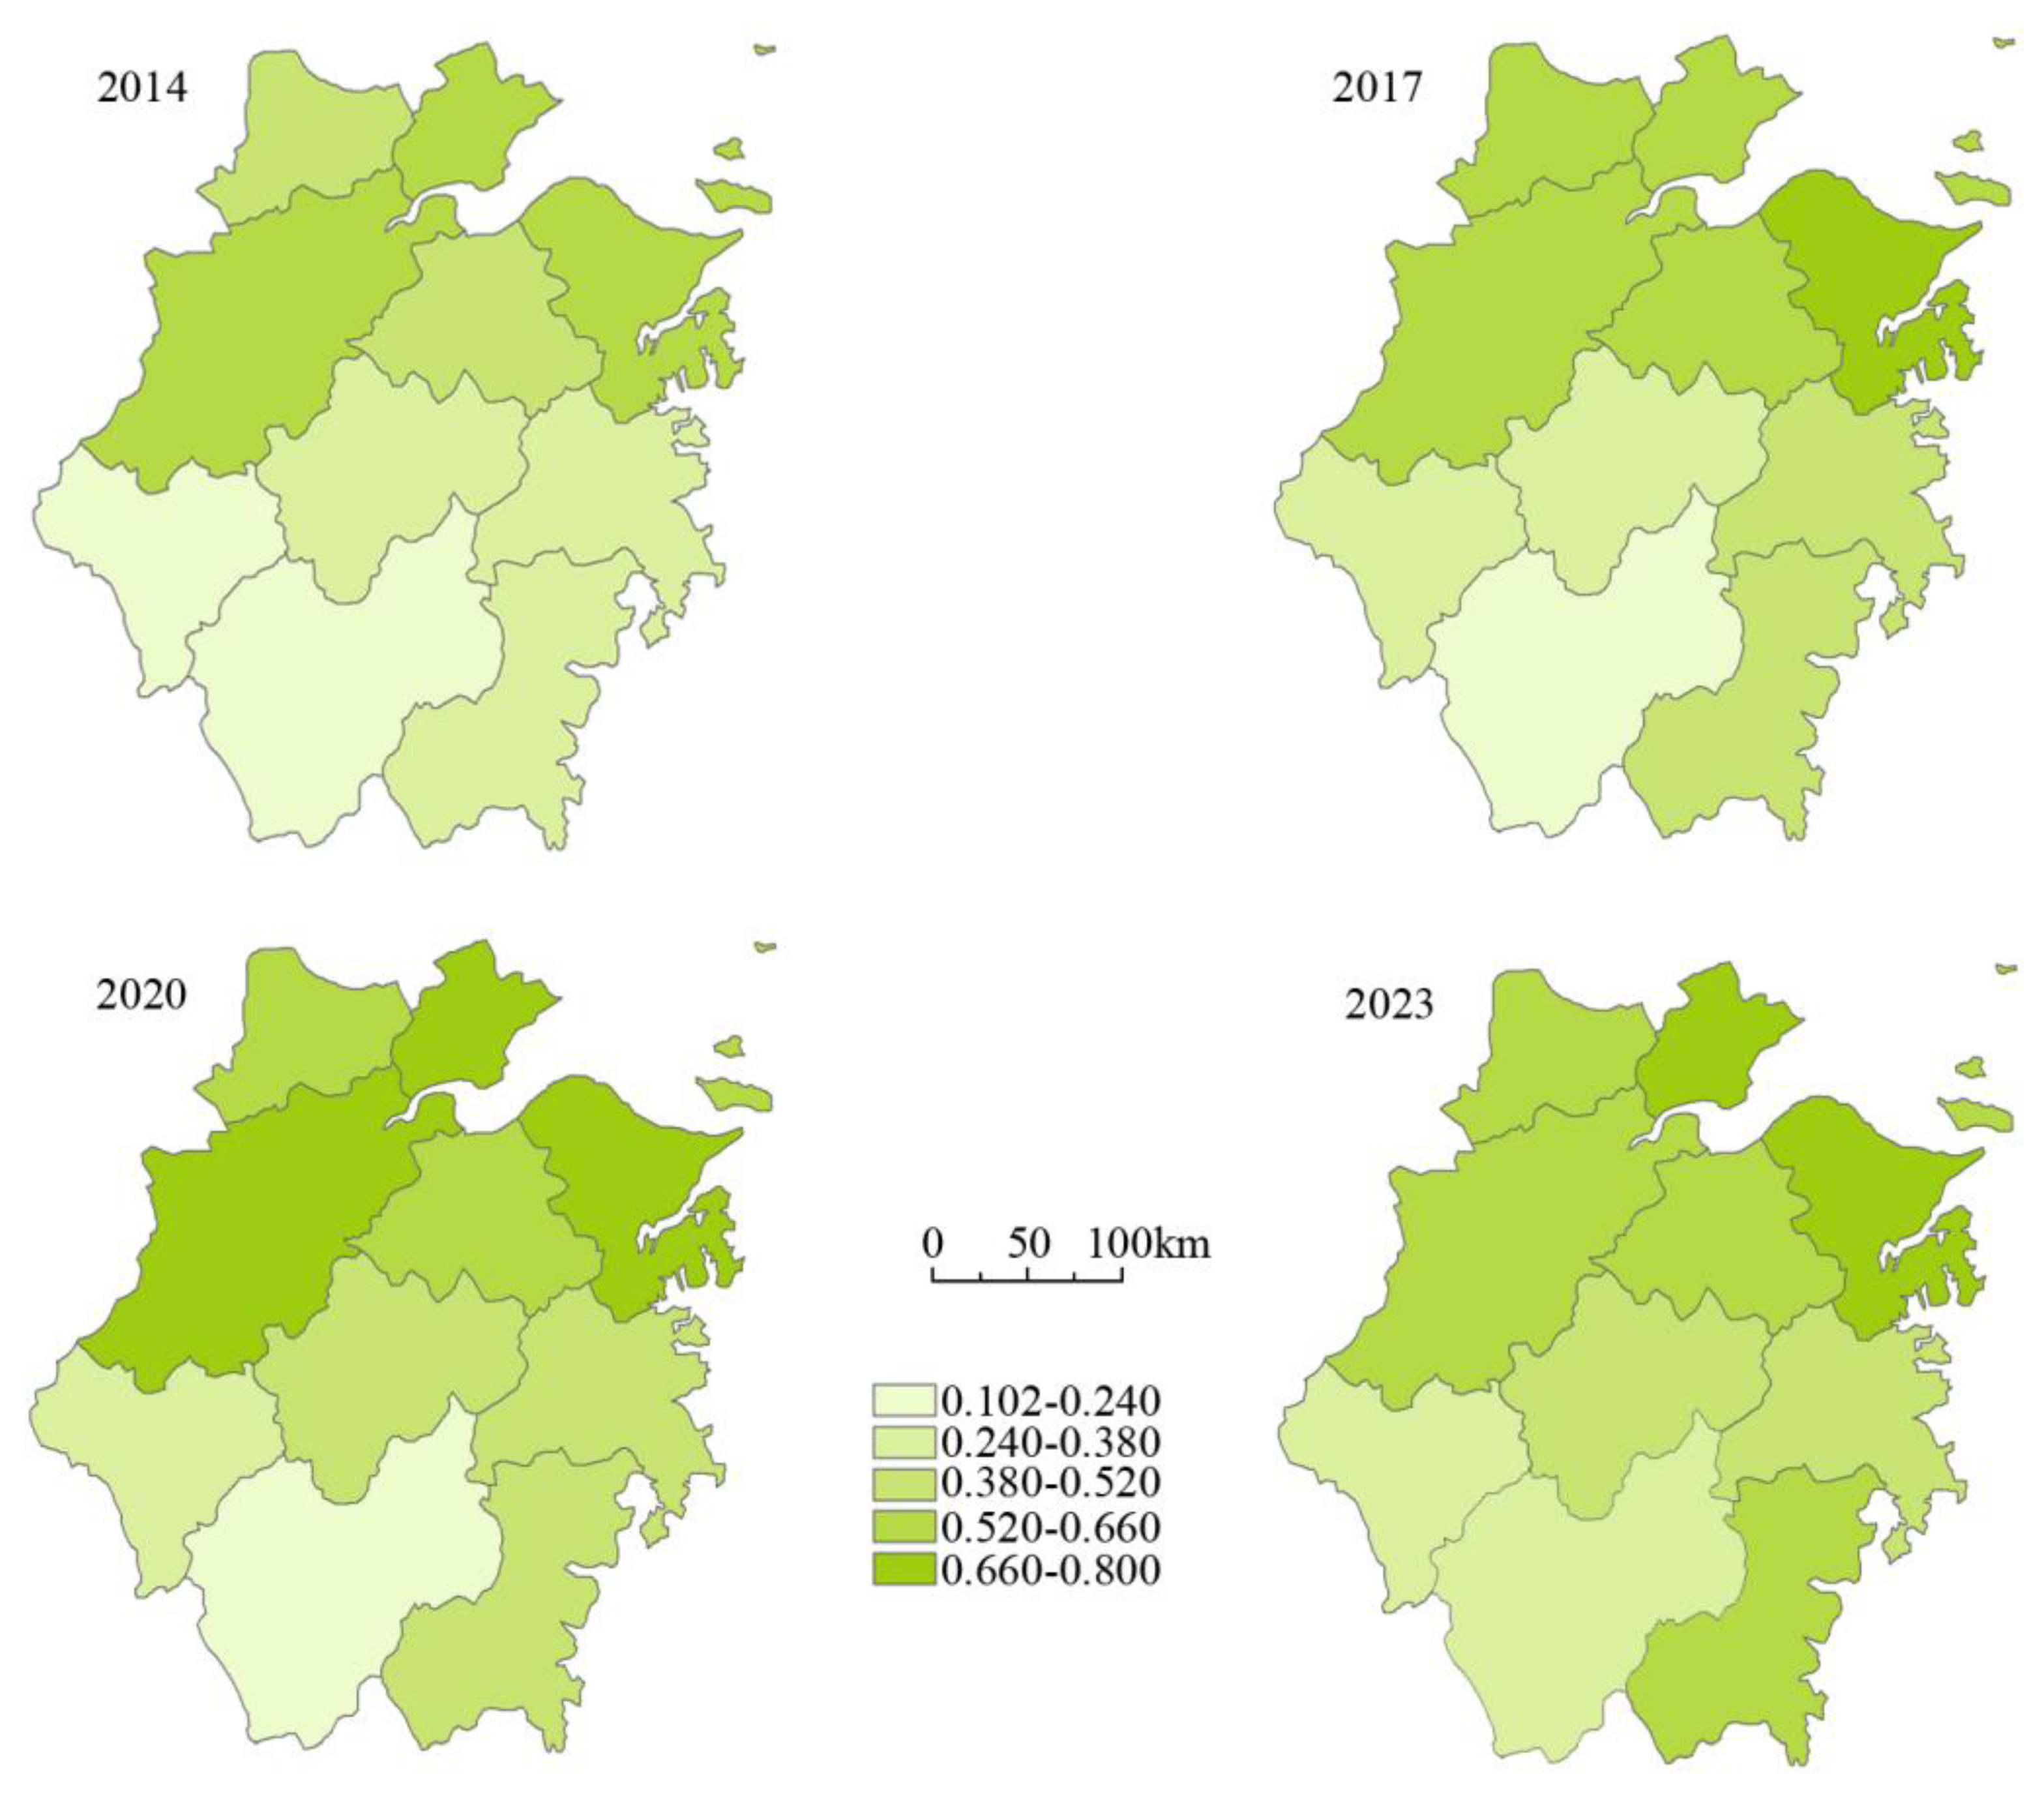
To reveal the spatial pattern characteristics of urban–rural integration development in Zhejiang Province, spatial visualization and classification analyses were conducted using ArcGIS 10.2 for the years 2014, 2017, 2020, and 2023 at the prefectural city level. Using the equal-interval classification method, the levels were defined from low to high as low-level area (0.102–0.240), relatively low-level area (0.240–0.380), medium-level area (0.380–0.660), relatively high-level area, and high-level area (0.660–0.800) (
Figure 5). The results reveal a clear spatial pattern of “high in the northeast, low in the southwest” in Zhejiang’s urban–rural integration development. The formation mechanism of this pattern lies in the fact that the northeastern region (e.g., Hangzhou, Ningbo, Jiaxing, Huzhou) benefits from higher urbanization levels, denser industrial agglomeration, and more developed transportation networks, resulting in stronger urban-to-rural spillover effects and the formation of integrated areas with complementary urban–rural functions. In contrast, the southwestern region (e.g., Lishui, Quzhou), constrained by mountainous terrain, low transportation accessibility, and weak economic foundations, faces higher natural and institutional barriers to the two-way flow of urban–rural factors, leading to a lag in urban–rural Integration Development.
Within this stable overarching framework, certain local changes occurred, reflecting an overall characteristic of “stable core and solidified depressions.” The locations and extents of relatively high-level and high-level areas remained largely stable, indicating the endogenous resilience and leading advantages of these regions. In 2020, Hangzhou rose from a relatively high-level area to a high-level area, and Jinhua rose from a relatively low-level area to a medium-level area. In 2023, Lishui transitioned from a low-level to a relatively low-level area, and Wenzhou rose from a medium-level to a relatively high-level area, suggesting that the experience and spillover effects of the core region began to diffuse to adjacent areas. Notably, during the study period, Hangzhou experienced a decline in its urban–rural integration development level, reflecting potential pressures of spatial resource reallocation and challenges of sustainable development following rapid growth. Meanwhile, the southwestern region (Quzhou and Lishui) consistently remained at a relatively low level, exhibiting a phenomenon of “depression solidification.” The persistence of this solidification, in addition to dual geographic and economic constraints, is closely related to the siphon effect generated by the continuous concentration of high-quality factors in core cities, highlighting the long-term and arduous nature of overcoming these constraints.
3.2. Analysis of Spatial Agglomeration Characteristics
To further explore the agglomeration characteristics of urban–rural integration development in Zhejiang Province, global and local spatial autocorrelation analyses were employed to reveal its spatial association patterns (
Table 5). The results show that all global Moran’s
I values from 2014 to 2023 were positive and statistically significant (
z > 3.2695,
p < 0.01), with a confidence level exceeding 95%. This indicates a significant positive spatial autocorrelation in urban–rural integration development across the study area, manifested as notable agglomeration patterns of both high-value and low-value clusters in spatial distribution. The underlying logic of this result is that cities with similar levels of urban–rural integration development tend to be geographically adjacent, and the processes of policy imitation, factor flow, and experience diffusion among cities exhibit a significant distance-decay effect, thereby giving rise to positive spatial autocorrelation and homogeneous agglomeration characteristics.
To examine the sensitivity of the global Moran’s
I to the choice of distance threshold, we further re-estimated the statistic using alternative cutoffs of 200 km and 300 km for four representative years (2014, 2017, 2020, and 2023). The results are presented in
Table 6.
Using Anselin’s Local Moran’s
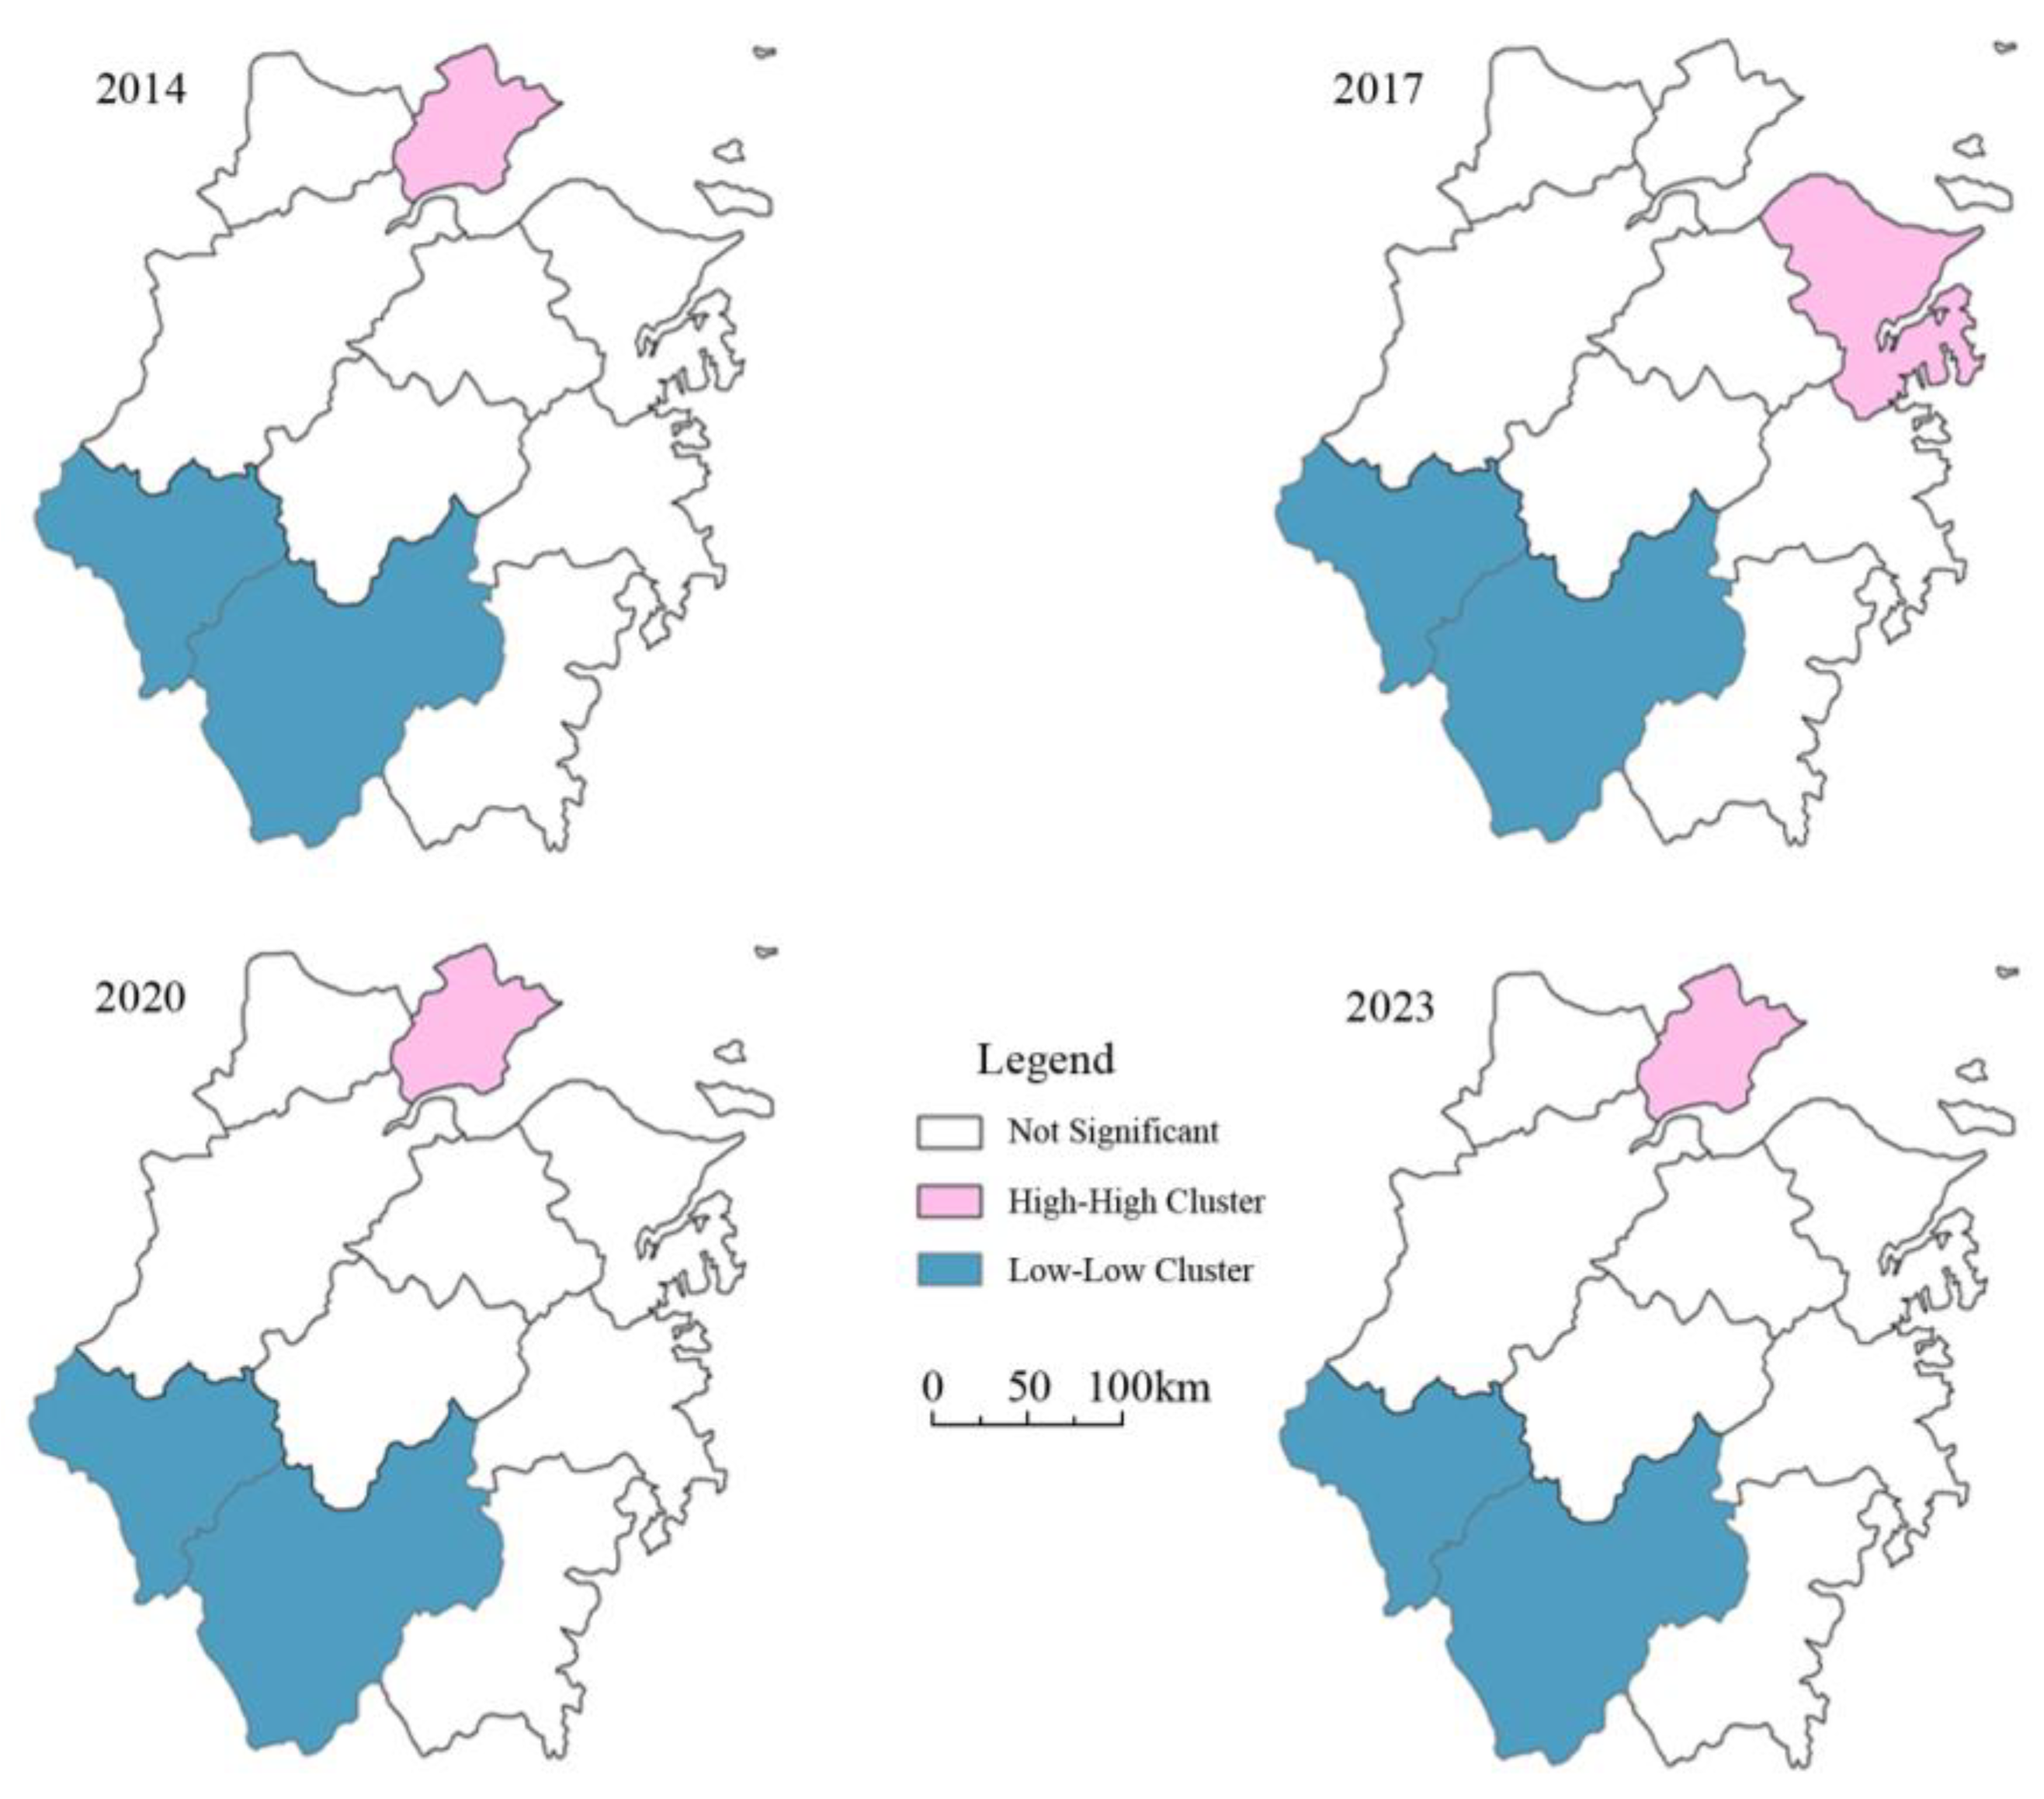
I index, LISA cluster maps of urban–rural integration development in Zhejiang Province were generated for 2014, 2017, 2020, and 2023 (
Figure 6), illustrating the agglomeration degree of spatial units and their spatial association with neighboring areas. The results show that the spatial agglomeration characteristics of urban–rural integration development in Zhejiang Province are dominated by “High–High” and “Low–Low” clusters, with no occurrence of “High–Low” or “Low–High” outliers. This indicates the absence of pronounced polarization or isolated enclave effects in the province’s urban–rural integration development, with spatial association being primarily characterized by “homogeneous agglomeration.” The spatial clustering exhibits a pattern of “dual-core agglomeration with largely insignificant areas,” highlighting prominent spatial differentiation. The formation mechanism of this pattern lies in the fact that the driving forces of urban–rural integration development in Zhejiang Province stem primarily from regional policy coordination and infrastructure integration, rather than from a strong siphoning effect of a single core city. Consequently, high-value and low-value areas each present contiguous agglomeration characteristics, with few spatially heterogeneous interleaving or isolated outliers.
The “High–High” agglomeration areas are stably and significantly concentrated in Jiaxing and Ningbo, indicating that these cities not only achieve high levels of urban–rural integration development themselves but are also surrounded by neighboring areas with similarly high levels, forming a robust and balanced high-level development cluster. In 2014, 2020, and 2023, Jiaxing was the sole “High–High” agglomeration city, serving as the core pole of urban–rural integration development in northern Zhejiang. The formation of this status is multi-layered. Geographically, Jiaxing is located in the Hangzhou–Jiaxing–Huzhou Plain, adjacent to Shanghai and Hangzhou, endowing it with significant locational advantages. Institutionally, its selection as a national pilot zone for urban–rural integration development brought dividends from institutional innovation. In terms of spatial interaction, the surrounding cities—Hangzhou, Huzhou, and Shaoxing—are also characterized by relatively high levels of urban–rural integration, creating a synergistic enhancement effect of being “surrounded by high-value areas.” The mutual reinforcement mechanism among high-level cities further consolidates Jiaxing’s status as a core pole.
Ningbo shifted from “not significant” in 2014 to a “High–High” agglomeration in 2017, before returning to “not significant.” This fluctuation warrants in-depth interpretation. Although Ningbo itself maintains a relatively high level of urban–rural integration development, its spatial association with neighboring cities remains insufficient, and a stable high-value synergistic cluster has yet to emerge. The underlying reason may be related to the export-oriented nature of Ningbo’s port economy—the spillover effects of its urban–rural integration are directed more toward the intra-urban domain rather than toward adjacent cities, resulting in instability in the statistical significance of spatial agglomeration. This suggests that Ningbo’s spatial spillover capacity still requires further enhancement.
The “Low–Low” agglomeration areas are stably and significantly concentrated in Quzhou and Lishui. This reflects a spatial mechanism reminiscent of a low-level equilibrium trap. On the one hand, this region is constrained by mountainous terrain, low density of transportation networks, high spatial connectivity costs, and a relatively weak economic foundation, making it difficult to improve the level of urban–rural integration development. On the other hand, being surrounded by areas with similarly low levels of development, it lacks the trickle-down effect of high-value neighbors, while high-quality factors continue to flow outward due to the siphon effect, resulting in a self-reinforcing low-level equilibrium. This spatial lock-in effect suggests that, in the short term, it is difficult for cities in this region to achieve a breakthrough through endogenous dynamics alone, and external policy intervention is needed to break the cycle.
The “non-significant” regions include seven prefecture-level cities—Hangzhou, Huzhou, Shaoxing, Jinhua, Taizhou, Wenzhou, and Zhoushan—accounting for 63.6% of the provincial total. It should be noted that this “non-significant” status does not fully align with the tiered classification based on the comprehensive scores of urban–rural integration development, reflecting a divergence between a city’s own development level and the significance of its spatial agglomeration. Based on each city’s development level and its spatial association with surrounding areas, these seven cities can be further divided into two mechanistic types.
The first type is the “high-level but non-significant” type (Hangzhou). Hangzhou’s urban–rural integration level ranks among the highest in the province. However, its neighboring cities—such as Jinhua, Quzhou, and Shaoxing—exhibit a considerable development gap, preventing the formation of a continuous high-value agglomeration belt and resulting in a local spatial autocorrelation that does not reach statistical significance. In other words, high-value areas appear as “isolated points” rather than “contiguous patches,” and spatial spillover effects have yet to fully materialize. This mechanism contrasts with the high-level synergistic spillovers found in “high–high” agglomeration areas: the latter involves mutual reinforcement among high-value cities, whereas the former represents a case of hampered radiation due to a substantial development gap between a high-value city and its periphery.
The second type is the “medium-level transitional zone” type, including Huzhou, Shaoxing, Wenzhou, Taizhou, Jinhua, and Zhoushan. Among these, Huzhou, Shaoxing, Wenzhou, Taizhou, and Zhoushan belong to the second tier, while Jinhua belongs to the third tier. These cities have a low-to-medium development level, with small differences compared to their surrounding areas. They are neither “high–high” agglomeration cores nor “low–low” agglomeration depressions but rather occupy a transitional zone between the two. They lack both the strong driving effect of high-level neighbors and the formation of their own agglomeration growth poles, presenting a loose spatial pattern characterized by “individualized development and weak linkages.” Zhoushan, due to its island geography with naturally constrained spatial interactions, can be considered a special subtype of this category. Unlike “low–low” agglomeration areas, which have formed a stable and entrenched low-level spatial association structure, these cities have yet to establish a significant and stable spatial association pattern and remain in a “gray zone” of coordinated urban–rural integration. At the same time, unlike “high–high” agglomeration areas, they lack the strong radiation and driving effect of a core growth pole. This dual absence—neither locked into a low-level equilibrium nor achieving high-level synergy—makes these cities a key focus for precise policy intervention.
3.3. Diagnosis of Obstacle Factors and Analysis of Mechanisms in Urban–Rural Integration Development
3.3.1. Temporal Evolution Characteristics of Obstacle Degree
To identify the key factors constraining the improvement of urban–rural integration development in Zhejiang Province, this study applied an obstacle degree model to panel data from four time points: 2014, 2017, 2020, and 2023. The results, presented in
Table 7, reveal the primary obstacle factors at both the system and indicator levels.
In terms of the mean obstacle degree at the system level, the constraining effects of individual subsystems on the improvement of urban–rural integration development in Zhejiang Province exhibit significant heterogeneity. Among them, the spatial integration subsystem presents the highest obstacle degree, with a mean value of 32.97%, followed by the population integration subsystem with a mean value of 26.50%. Together, these two subsystems account for nearly 60% of the total obstacle degree, making them the core constraining domains for Zhejiang’s urban–rural integration development.
This heterogeneous structure primarily stems from differences in the difficulty of improving each subsystem. Spatial and population integration serve as the physical carriers and dynamic drivers of urban–rural interactions, involving structural factors such as infrastructure, land allocation, and population mobility. Improvements in these subsystems rely on long-term public investment and institutional reforms, which are characterized by extended cycles and strong path dependence. In contrast, social integration (e.g., equalization of public services) and ecological integration (e.g., environmental governance) are more dependent on policy interventions and fiscal inputs, making them more responsive to short-term measures and thus exhibiting relatively lower obstacle degrees.
These findings suggest that the structural bottlenecks in Zhejiang’s urban–rural integration process are concentrated within the spatial and population subsystems, indicating that an efficiently coordinated pattern of urban–rural integration has yet to be established.
It is worth noting that, although the mean obstacle degree of the ecological integration subsystem remains moderate, it exhibits a gradual upward trend over the study period, rising from 12.43% to 13.48%. This suggests that, with the continuous advancement of industrialization and urbanization, the intensity of economic activities has been steadily increasing, leading to the progressive accumulation of regional ecological pressure. Consequently, the constraining effect of the ecological environment on urban–rural integration has gradually intensified, shifting from a previously implicit constraint to an explicit and measurable limitation.
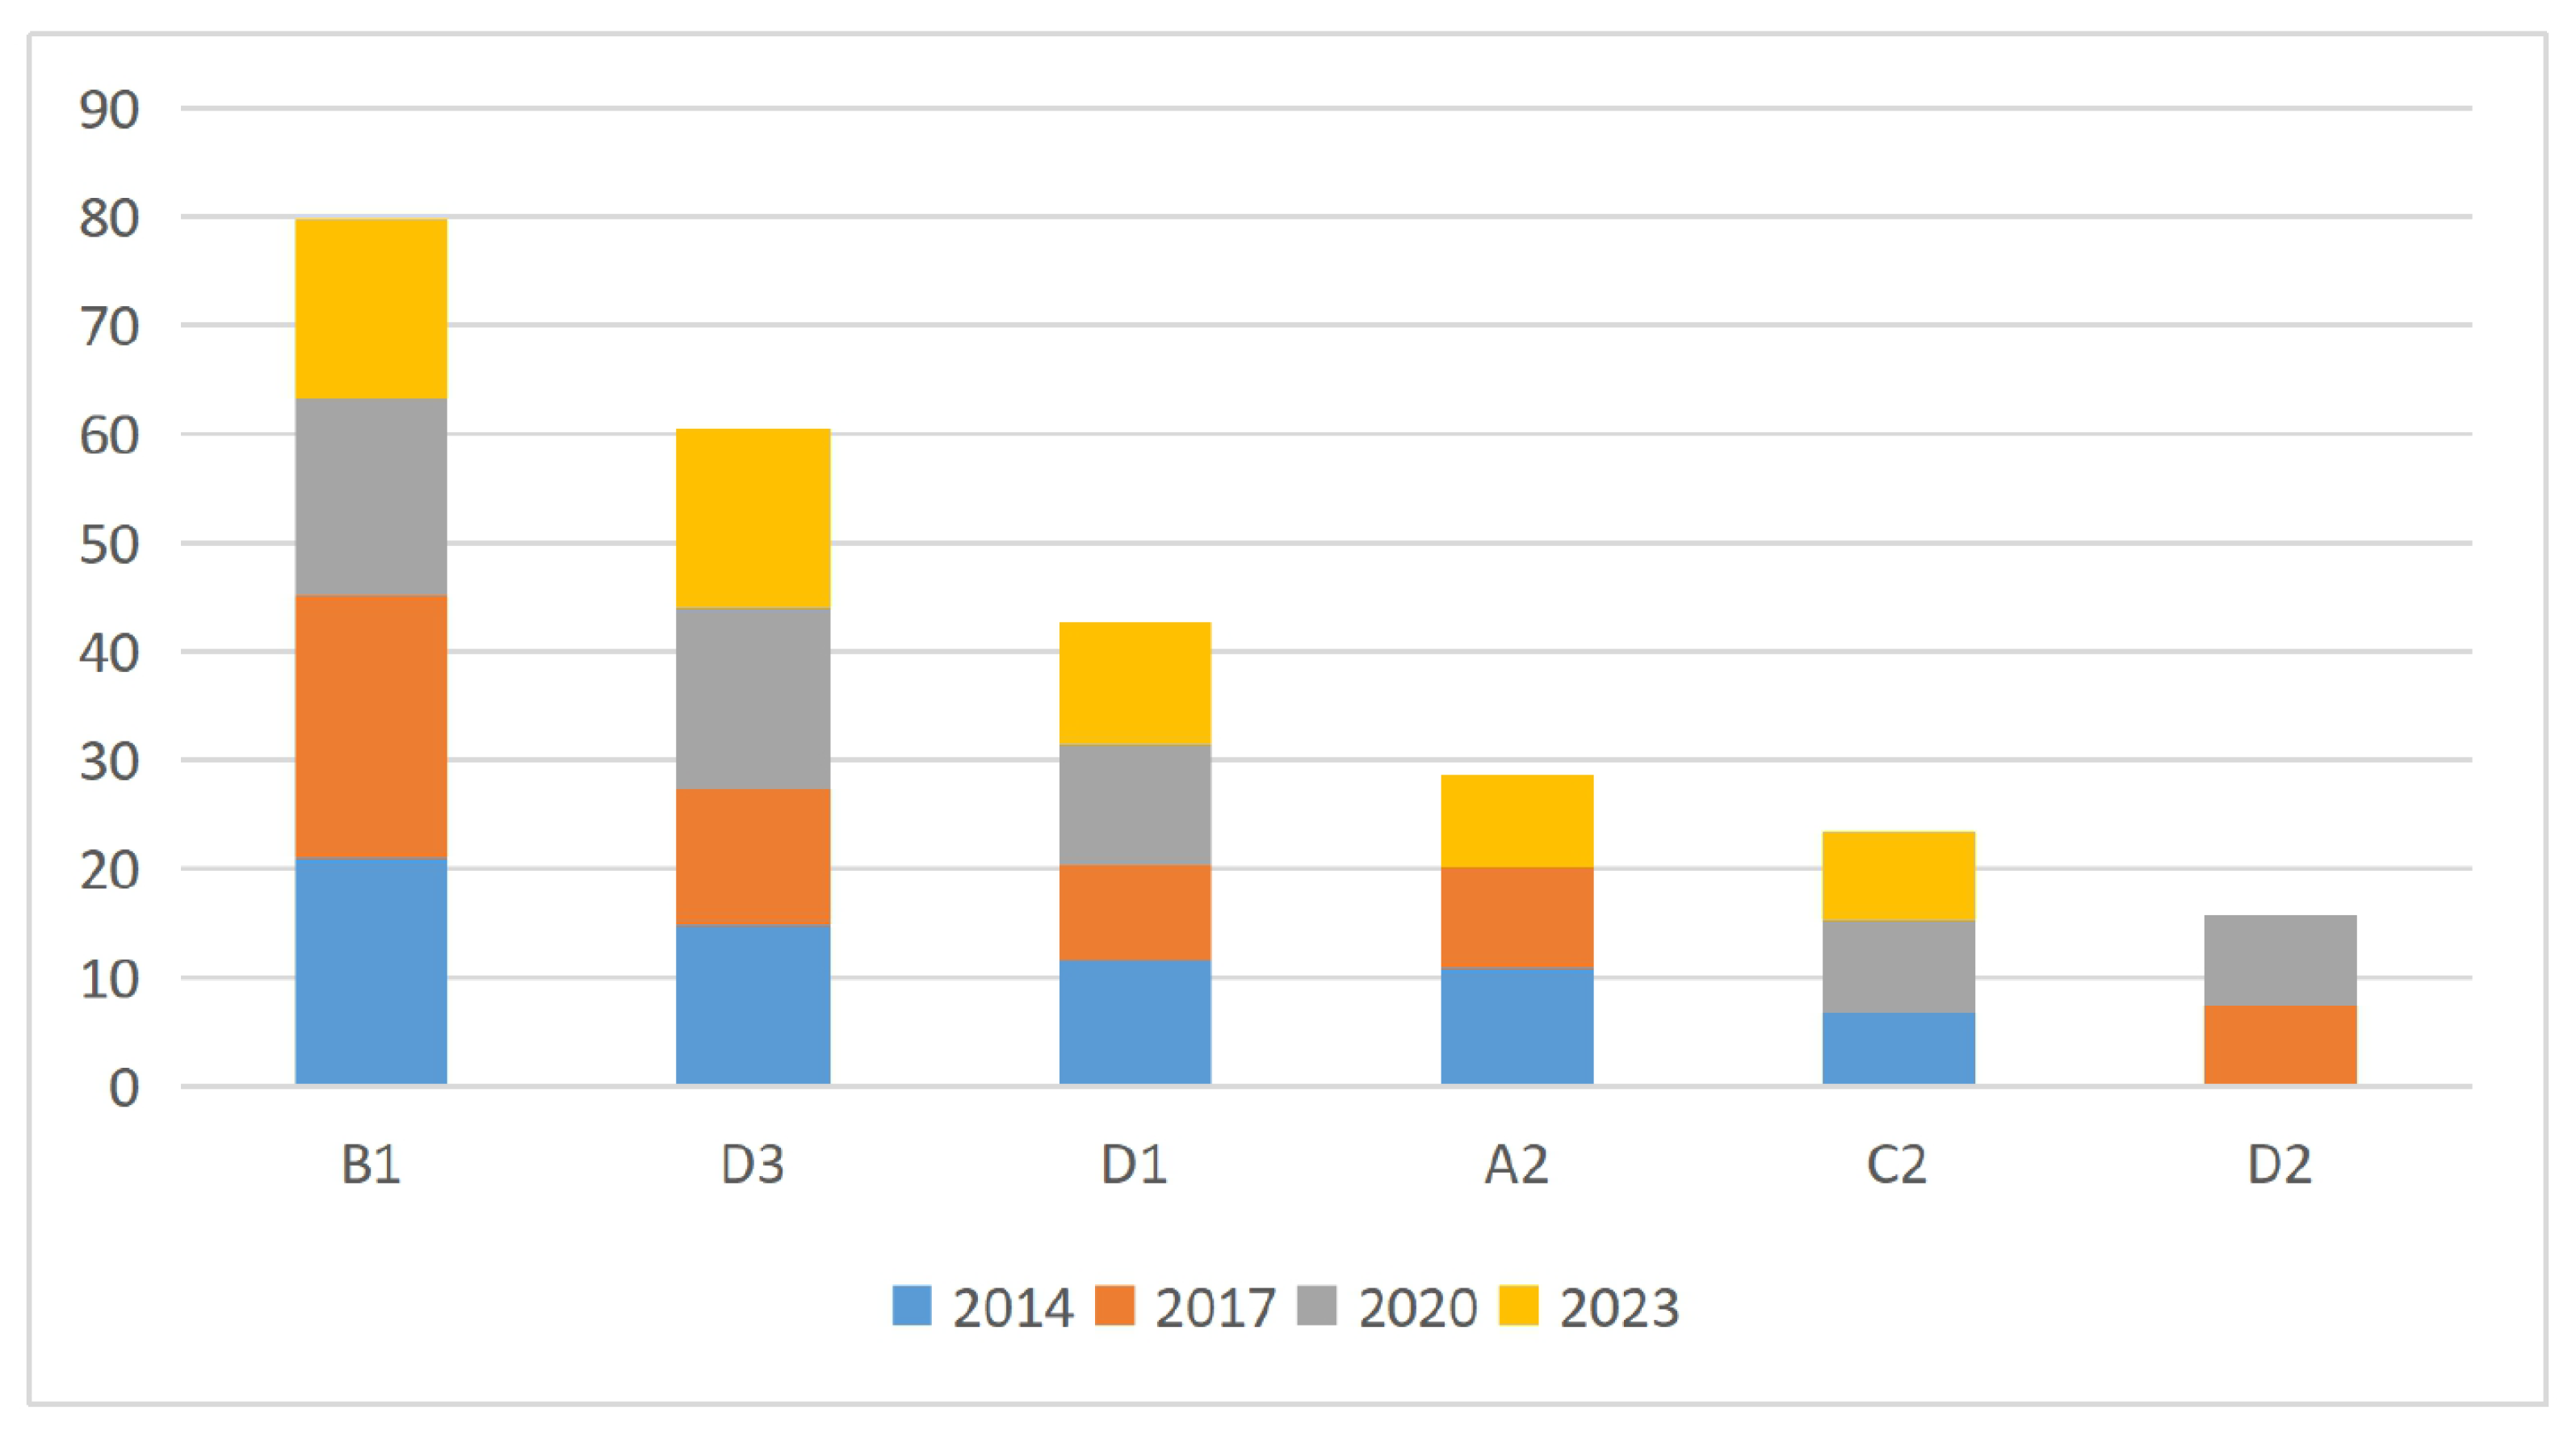
A further ranking analysis was conducted on the obstacle factors at the indicator level (
Figure 7). The results reveal a high degree of stability in the composition of the primary obstacle factors. Specifically, three factors consistently rank among the top five in terms of obstacle degree throughout the study period: population migration rate (B1), urban built-up area population density (D3), and information carrying capacity (D1). These persistently act as the major constraints to urban–rural integration.
The underlying mechanism that may help explain this stable structure is twofold. Space and population serve as the physical carriers of urban–rural interactions, and improvements in these domains tend to involve long cycles and strong path dependence. Population migration is influenced by multiple structural factors—including the household registration system, housing costs, and employment opportunities—which can make short-term reversal difficult. Built-up area density can be interpreted as an indicator of urban polarization effects and the associated resource suction from surrounding rural areas, a pattern that is embedded in deeper institutional arrangements such as land finance and industrial spatial configuration. Information carrying capacity points to the urban–rural gap in digital infrastructure, the alleviation of which depends on sustained public investment. Notably, these three factors may be interrelated: insufficient information carrying capacity could limit rural access to remote employment opportunities, thereby potentially dampening migration incentives; in turn, population outflows might reduce rural demand for information infrastructure. This is consistent with the idea of a self-reinforcing structure—a “low-level mutual lock-in”—that could help stabilize the observed pattern of obstacles. However, given the descriptive nature of our analysis, these interpretations are intended as mechanism-consistent hypotheses rather than definitive causal claims.
From the perspective of temporal evolution, the ranking of obstacle factors in 2014 was B1 (population migration rate), D3 (population density of urban built-up areas), D1 (information carrying capacity), A2 (urban–rural consumption expenditure ratio), and C2 (educational condition gap) in descending order, indicating that the allocation of population-related factors, spatial carrying capacity, and equalization of public services were the key constraints on urban–rural integration development at that stage. By 2017, B1 (population migration rate) and D3 (urban built-up area population density) remained the dominant obstacles, suggesting that these persistent shortcomings had yet to be alleviated. Notably, the ratio of urban to rural household consumption per capita (A2), which reflects the urban–rural disparity in income and welfare, rose to the third position, highlighting the widening urban–rural consumption gap during this period. This shift was driven by the underlying reality that rural residents’ income growth lagged behind that of their urban counterparts. In both 2020 and 2023, the top five obstacle factors—D3 (urban built-up area population density), B1 (Population migration rate), D1 (information carrying capacity), A2 (urban–rural consumption expenditure ratio), and C2 (gap in Educational Conditions)—remained identical to those in 2014, with only minor changes in their ranking order. This consistency indicates that the structure of core obstacle factors constraining Zhejiang Province’s urban–rural integration development has remained highly stable over the study period.
It is worth noting that, over the study period, the population migration rate (B1) ranked first in terms of obstacle degree on multiple occasions, making it the most critical and fundamental constraint on urban–rural integration. This finding entails two implications. First, the quantity of population migration is declining. As Zhejiang Province enters the late stage of urbanization, the scale of surplus rural labor has gradually shrunk, naturally weakening the impetus for labor migration to urban areas. Consequently, the “quantity-driven” model of urban–rural integration through population mobility has become increasingly unsustainable. Second, the quality of population migration remains deficient. Even among those who continue to migrate, many face the predicament of “semi-urbanization”—that is, they work in urban areas but do not obtain local household registration or equal access to public services. This situation further undermines the role of population integration in promoting coordinated urban–rural development. The underlying root cause of both issues points to the institutional inertia of linking household registration (hukou) to public service entitlements. Therefore, simply raising the urbanization rate can no longer resolve the core contradictions of population integration. Future policy efforts should place greater emphasis on the quality of citizenship for the floating population.
3.3.2. Analysis of Type Differences
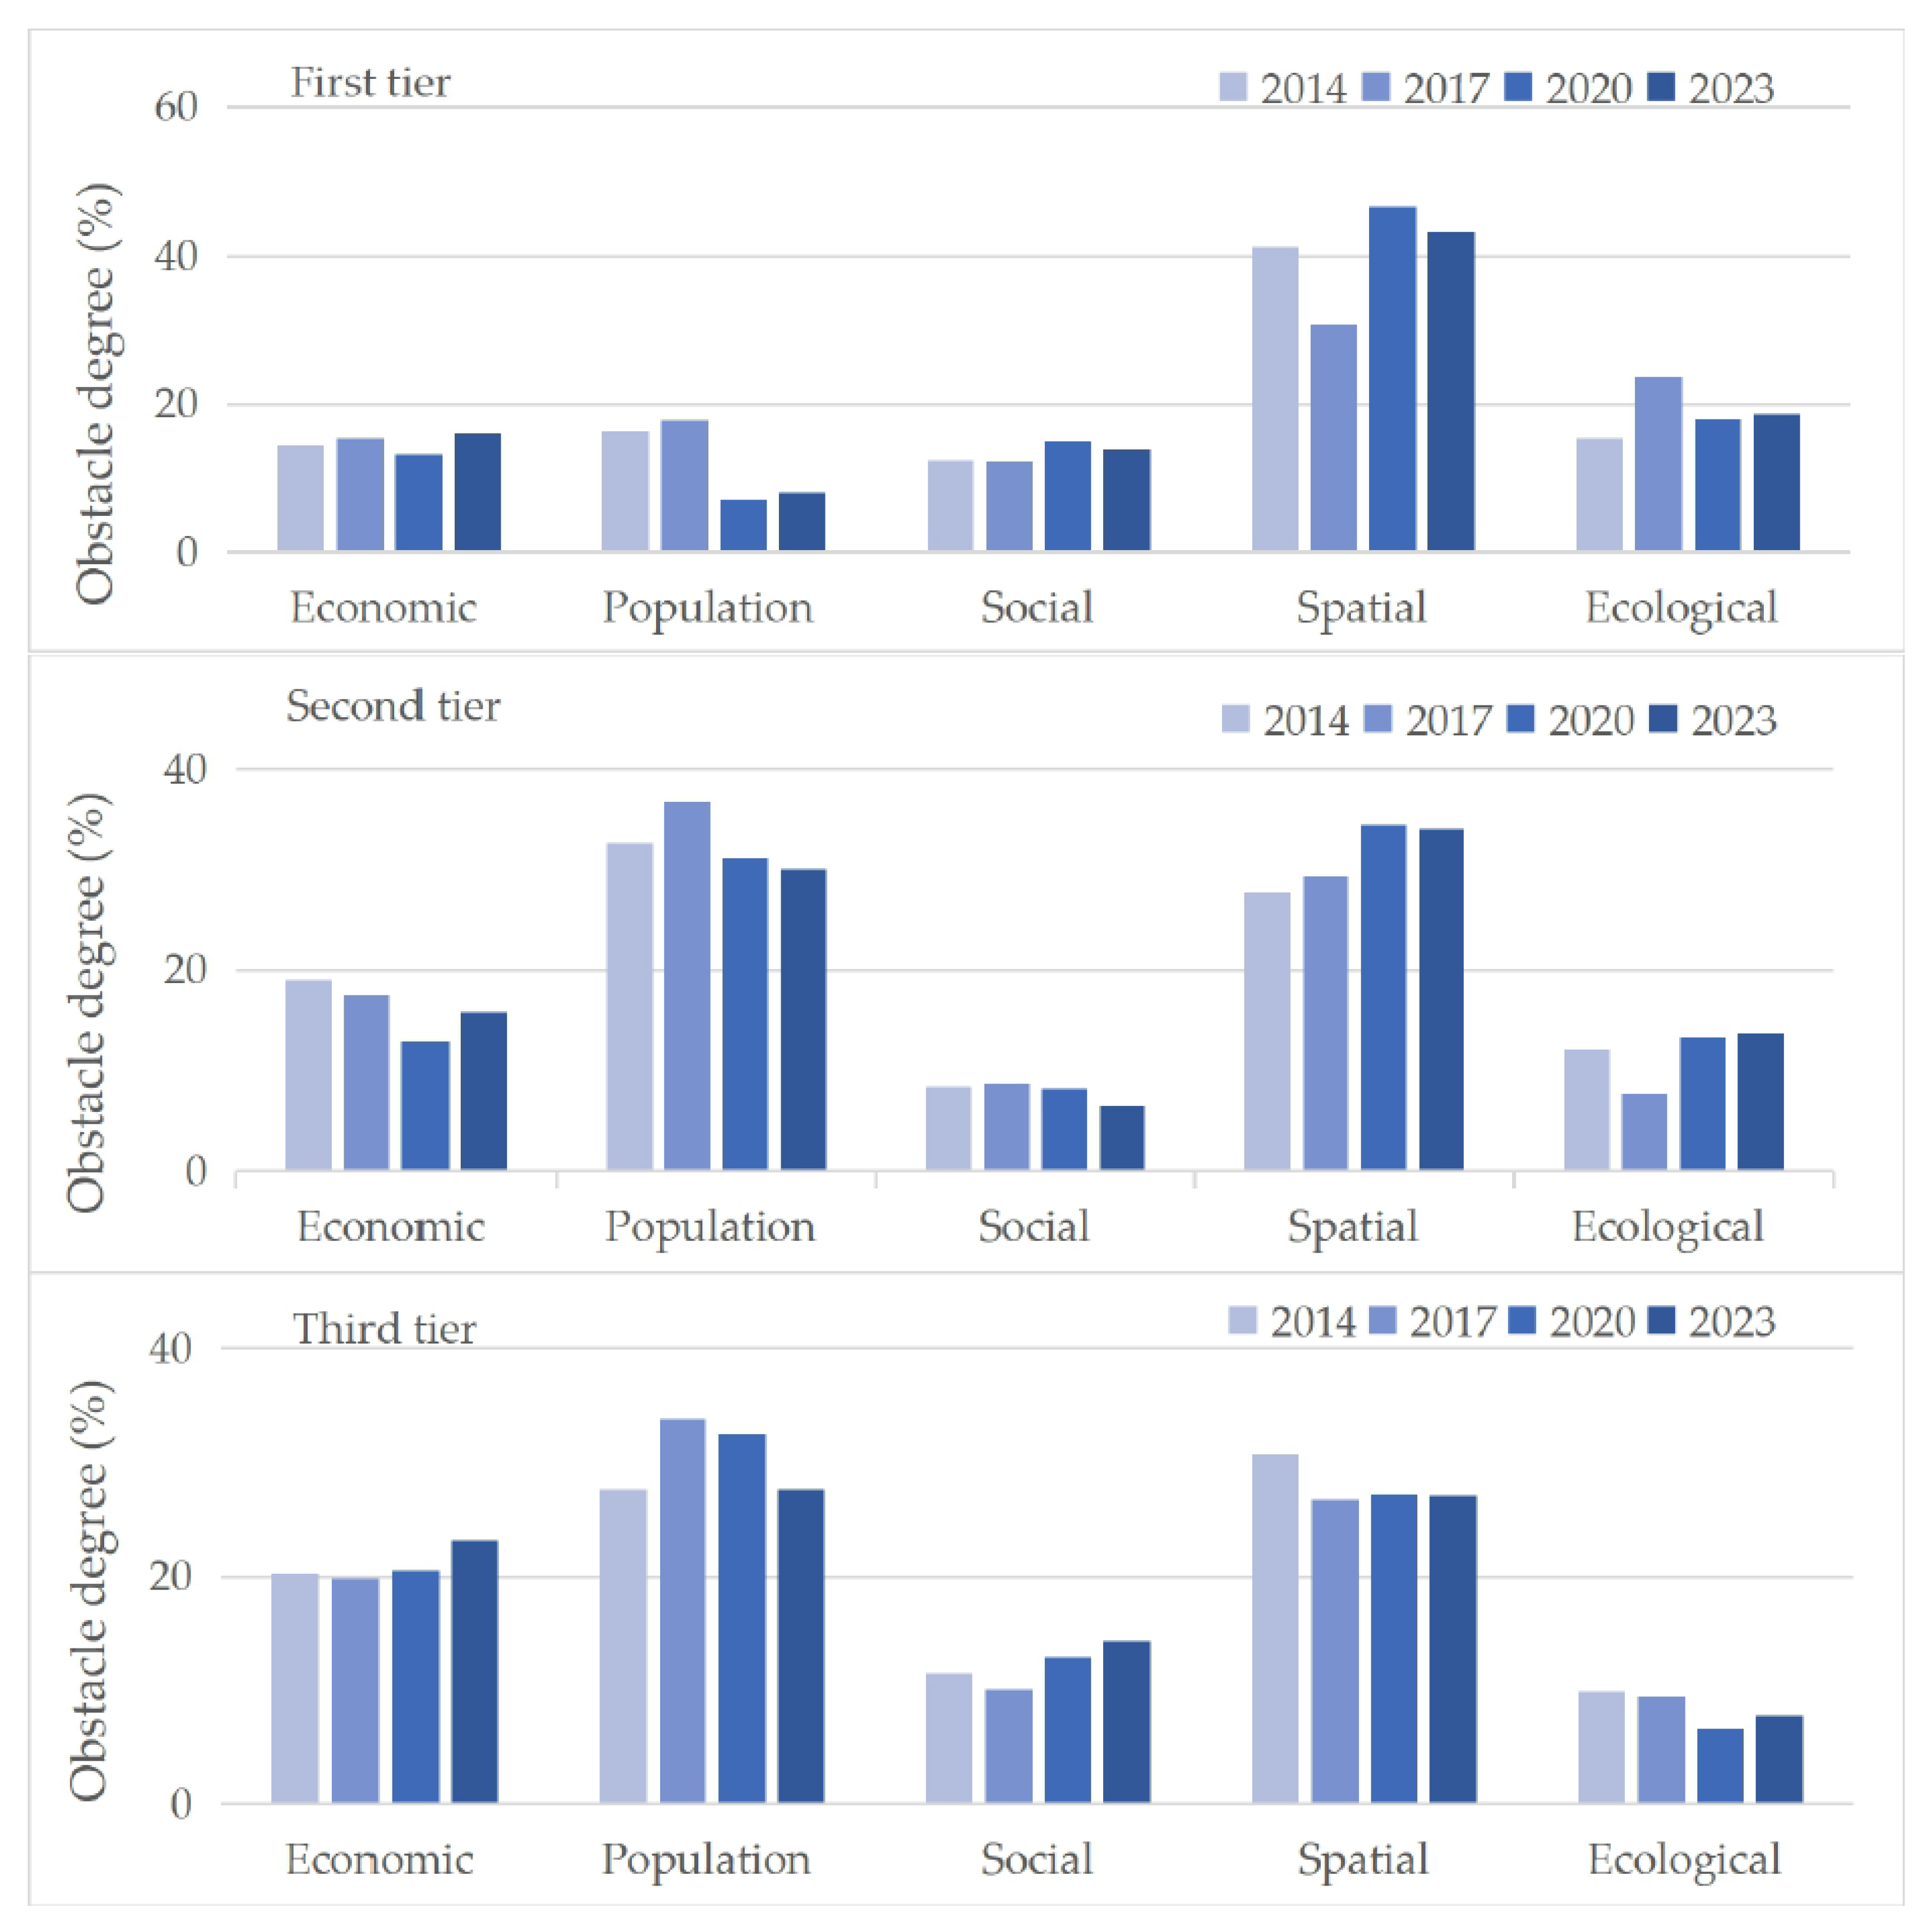
To further reveal the heterogeneity of obstacle factors affecting urban–rural integration development in Zhejiang Province, the 11 cities were classified into three tiers—the first tier, the second tier, and the third tier—based on the classification in
Section 3.1. The differences in the composition of obstacle factors among these three tiers were then compared (
Figure 8,
Table 8).
In the first tier, the obstacle degree of the spatial integration subsystem consistently ranked highest throughout the study period, not only substantially exceeding those of other subsystems but also exhibiting a fluctuating upward trend. In 2022, this indicator reached its peak at 46.80%, and although it declined slightly in 2023, it remained as high as 43.42%, indicating that spatial integration has become the core bottleneck constraining further development in this region. This suggests that as urban–rural integration advances to a higher level, structural tensions embedded in aspects such as spatial linkage intensity, population agglomeration levels, and information circulation capacity have become increasingly prominent, requiring spatial restructuring, optimized resource allocation, and institutional innovation. Meanwhile, the degree of obstacle to the population integration subsystem in this tier exhibited a significant downward trend, falling to 8.04% by 2023, primarily attributable to the equalization of public services in the first tier, which has effectively alleviated institutional barriers to population mobility. In contrast, the obstacle degree of the ecological integration subsystem increased, suggesting that a “green bottleneck” may gradually emerge as development levels rise. The underlying logic is that, at higher stages of development, intensive economic activities coincide with limited ecological carrying capacity, while the urban–rural ecological compensation mechanism remains underdeveloped; consequently, ecological constraints are progressively intensifying.
In the second tier, the obstacle degrees of the ecological and spatial integration subsystems exhibited upward trends over the study period, whereas those of the economic, population, and social integration subsystems showed fluctuating downward trends. This indicates that urban–rural integration in this region is entering a transitional and deepening phase. While initial progress has been made in urban–rural industrial linkages and factor mobility, the expansion of urban built-up areas has brought to the fore tensions between ecological pressure and lagging spatial configuration, with spatial optimization and ecological governance failing to keep pace with economic development. Specifically, in traditional industrial cities such as Shaoxing, Wenzhou, and Taizhou, this tension stems primarily from the relatively delayed environmental regulation during industrialization. Huzhou, however, presents a different case. As a national pilot zone for ecological civilization, the rising obstacle degrees of its ecological and spatial subsystems are not attributable to regulatory delays but rather to the growing tension between continued urban expansion and the protection of ecologically sensitive areas under relatively high environmental standards, reflecting a deeper contradiction between “high-standard protection” and sustained development. Zhoushan represents an even more distinctive case, where spatial and ecological constraints are primarily shaped by geographic fragmentation and inadequate infrastructure connectivity.
In the third tier, the obstacle degrees of population integration, spatial integration, and economic integration are comparably high, indicating that restricted population mobility, infrastructure deficiencies, and lagging economic development remain the core bottlenecks constraining urban–rural integration in this region. This pattern also suggests that these low-integration areas remain in a “breakthrough phase,” where the traditional urban–rural dual structure still predominates. Notably, the obstacle degrees of economic and social integration exhibit fluctuating upward trends, warranting caution against falling into an “integration trap”—a situation where economic growth fails to effectively drive social integration, and the urban–rural gaps in income and public services widen instead of narrowing. Meanwhile, the degree of ecological integration shows a fluctuating downward trend and consistently ranks the lowest among the five subsystems. This finding calls for a dialectical interpretation. On the one hand, it reflects the relatively modest ecological pressure in low-integration areas; on the other hand, it also reveals the region’s relatively low levels of industrialization and urbanization, where the deep-seated tension between ecological protection and economic development has not yet become prominent. In other words, the current “ecological advantage” of this region is, to some extent, a byproduct of “developmental lag.” As development accelerates in the future, ecological constraints are likely to intensify rapidly. Therefore, a green transition pathway should be proactively planned in advance.
Regarding the evolution of the primary obstacle factors (
Table 8), the obstacle structures of the three regions with different levels of urban–rural integration development exhibit distinct differentiation.
In the first tier, D3 (urban built-up area population density) and D1 (information carrying capacity) constitute the core combination of obstacle factors. Since 2020, B2 (non-agricultural to agricultural employment ratio) has fallen out of the top three, while C2 (educational condition gap) has emerged as the third major obstacle. This indicates that first-tier regions face dual constraints: insufficient urban spatial agglomeration and underdeveloped urban–rural information infrastructure. Furthermore, the balance of educational resource allocation between urban and rural areas has become a growing concern. Notably, D3 (urban built-up area population density) has consistently ranked first, with its obstacle degree increasing over time, rendering it the most prominent bottleneck limiting further urban–rural integration development at this new stage.
In the second tier, the factor-level obstacle structure remains the most stable, with only minor changes. B2 (non-agricultural to agricultural employment ratio) and D3 (urban built-up area population density) have consistently been the top two obstacles, serving as the core constraints on urban–rural integration development in these regions. D1 (information carrying capacity) has replaced A2 (urban–rural consumption expenditure ratio) as the third major obstacle. This shift reflects that the region is still in an integration stage characterized by unresolved industrial structure transformation, insufficient urban spatial agglomeration, and a mismatch between industrial and employment structures. Concurrently, the urban–rural gap in information infrastructure is beginning to emerge, with infrastructure development lagging behind economic growth. This constrains urban–rural integration development, and greater efforts are required to achieve equal access to public services.
In the third tier, changes in obstacle factors are relatively pronounced. B2 (ratio of non-agricultural to agricultural employment) has consistently ranked first, showing an initial increase followed by a decline. This suggests that although the constraining effect of employment structure transformation has eased somewhat, it remains the dominant obstacle. The obstacle degree of A1 (urban–rural per capita disposable income ratio) has been rising, reaching 11.24% in 2023 and thus surpassing D1 (information carrying capacity) to become the second major obstacle. Factors such as population density in urban built-up areas and the urban–rural household consumption ratio have gradually dropped out of the top three, whereas the population migration rate entered the top three only briefly in 2017 before falling back. This shift indicates that in these regions, which have not yet escaped the traditional dual structure, spatial agglomeration and the urban–rural consumption gap have improved, and barriers to population mobility have appeared only sporadically rather than forming persistent core constraints. Meanwhile, urban–rural income distribution has become increasingly prominent, emerging as a new bottleneck restricting urban–rural integration at this new stage. A threefold obstacle structure has therefore taken shape: insufficient transformation of employment structure, a widening urban–rural income gap, and a growing gap in information infrastructure.
4. Conclusions and Discussion
4.1. Research Conclusions
This study focuses on measuring the level of urban–rural integration development, analyzing its spatial differentiation characteristics, and identifying obstacle factors in Zhejiang Province. The main conclusions are as follows:
(1) Improvement coexists with widening disparities. The comprehensive index of urban–rural integration in Zhejiang Province increased by 24.3% (from 0.420 to 0.522), indicating steady overall improvement. Nevertheless, the gap between the first tier (mean > 0.6) and the third tier (mean < 0.40) widened from 0.368 to 0.409, reflecting uneven development: benefits have concentrated in more advanced regions, while less developed areas have not shared proportionally in the gains. Regional convergence has therefore not yet been achieved.
(2) A solidified gradient of “high in the northeast and low in the southwest”: high-level regional regression reveals transitional pains. Urban–rural integration in Zhejiang Province exhibits a pattern characterized by a “stable core and solidified depressions.” Hangzhou and Ningbo have consistently maintained high performance levels, while Lishui and Quzhou have persistently ranked at the bottom. Although some cities have achieved upward shifts—suggesting spillover effects—Hangzhou has undergone a periodic regression. This indicates that even developed regions face structural challenges, including rising factor costs and tightening environmental capacity, during the deepening stage of integration. The observed regression represents a phased adjustment toward a new development paradigm.
(3) Dual-core agglomeration shows dominance without established synergy. Jiaxing consistently serves as a high–high agglomeration core, whereas Quzhou and Lishui form a low–low depression, reflecting strong homogeneous agglomeration. Nevertheless, 63.6% of cities exhibit no significant spatial correlation, suggesting that spillover effects remain confined to a few core areas. Most regions lack significant spatial linkages, and an endogenous mechanism for networked synergy has yet to emerge.
(4) At the provincial level, the spatial and population integration subsystems together contribute nearly 60% of the total obstacle degree, with population migration rate, urban built-up area population density, and information carrying capacity consistently ranking among the top obstacle factors. This reflects a structural mismatch among the three fundamental elements of “people, land, and information.” Nevertheless, the manifestation of this common bottleneck varies across regions. In the first-tier regions, the primary constraints are insufficient urban spatial density and uneven information infrastructure. In the second-tier regions, the constraints center on lagging employment transformation and low spatial agglomeration. In the third-tier regions, the constraints stem from restricted population mobility and a pronounced urban–rural income gap. This indicates that, although factor mismatch is a common issue across the province, its specific form evolves with the stage of regional development.
(5) The obstacle structures of the three tiers display stepwise differentiation. In the first tier, spatial integration constitutes the core contradiction, facing challenges such as low agglomeration levels and rising ecological pressure, indicating a transition from “scale expansion” to “quality improvement.” In the second tier, spatial and economic integration serve as the dominant obstacles, accompanied by the accelerated rise in ecological integration obstacles, while lagging employment transformation coexists with low agglomeration levels, reflecting a predicament of “alternating old and new contradictions during the structural transformation period.” In the third tier, the population, spatial, and economic subsystems jointly constrain development, with employment structure imbalance and income disparity serving as the primary bottlenecks, suggesting that the region has yet to break free from the “low-level equilibrium trap.” To a certain extent, these findings confirm that the core obstacles to urban–rural integration may present a progressive evolutionary pattern from the factor mobility dimension to the structural optimization dimension and then to the quality enhancement dimension as the development stage advances, providing a reference for understanding the stage-specific and heterogeneous nature of urban–rural integration.
4.2. Theoretical Contributions
First, this study develops a tripartite analytical framework comprising “level identification, spatial differentiation, and obstacle diagnosis.” It extends urban–rural integration research from conventional measurement and driver analysis to obstacle diagnosis, clarifying the logical chain of “level–pattern–determinants.” In doing so, it offers a methodological reference for shifting this field from descriptive analysis toward diagnostic analysis.
Second, this study reveals heterogeneous patterns of urban–rural integration development at the prefecture-level city scale within a province. While existing studies have largely focused on national or county-level analyses, the intermediate provincial scale has been relatively overlooked. The empirical analysis of Zhejiang Province demonstrates that the provincial level constitutes a critical unit for understanding uneven urban–rural development, thereby addressing the issue of scale selection in urban–rural research.
Third, this study adopts a “whole–type” dual-level diagnostic approach and finds that the obstacle factors of urban–rural integration exhibit tier-based differentiation along the gradient of urban development levels. This finding revises the implicit assumption of “universality of obstacle factors” prevalent in existing literature. The results show that the structure of obstacles varies significantly across city tiers, providing a theoretical basis and analytical framework for implementing targeted and stage-specific governance strategies.
Furthermore, this study serves as a localized application and empirical test of global urban–rural relations theories. Existing international research has largely focused on urban–rural linkages and interactions, rural multifunctionality, and population mobility perspectives, with most studies grounded in the practical contexts of Europe, the Americas, and Latin America. Taking Zhejiang Province, a developed region in eastern China, as an empirical case, this study reveals that obstacle factors to urban–rural integration exhibit a tiered evolutionary pattern according to city development levels. This finding enriches the theoretical understanding of urban–rural transition with Chinese evidence, extends the applicability of urban–rural integration theories to developing countries and densely populated urban agglomerations, and thereby achieves an effective dialogue between localized research and global urban–rural theories.
4.3. Comparison with Existing Studies
To compare our findings with the existing literature, we examine three representative studies at the county, regional, and national scales.
First, compared with the Jiahu Lake area study [
37], both studies identify an overall upward trend in urban–rural integration and widening regional disparities. In terms of the indicator system, Zhai et al. employed a four-dimensional framework (economy, space, society, ecology), in which social integration encompassed livelihood indicators such as pension and medical care, and spatial integration was measured by land urbanization and transportation network density. By contrast, this study adopts a five-dimensional framework (economy, population, society, space, ecology), treating population integration as an independent subsystem and distinguishing between physical and virtual information spaces within spatial integration. This structural difference leads to divergent findings: Zhai et al. identified medical care as the primary obstacle, whereas this study finds that population and spatial integration contribute nearly 60% of the total obstacle effect. This discrepancy reflects the difference in research scale—county-scale studies focus on micro-level livelihoods, while prefecture-level studies emphasize macro-level structural mismatches. Furthermore, Zhai et al. reported a phased decline in 2020 and a pattern of “declining Jiaxing, rising Huzhou,” which complements our macro-level pattern of “high in the northeast, low in the southwest.” The two studies are mutually complementary: macro-level factor mismatch constitutes the fundamental constraint, while micro-level medical care and income represent the direct bottlenecks.
Second, compared with the study on the Yangtze River Delta core area [
42], both studies confirm an overall upward trend and widening later-stage disparities. In terms of indicator systems, Chen et al. employed a three-dimensional framework (economic, social, ecological), with social integration encompassing population mobility, transportation, information, education, and healthcare—spatial elements were not independently represented. By contrast, the present study adopts a five-dimensional framework, treating population and spatial integration as independent subsystems. Consequently, Chen et al. emphasized social integration factors (e.g., information, healthcare, environment), while this study identifies spatial integration as the primary obstacle, along with a solidified “northeast–high, southwest–low” gradient and periodic regression in Hangzhou—findings not reported by Chen et al. These discrepancies may stem from differences in spatial scope, indicator system construction, and study periods.
Third, comparison with a national-scale study [
46]: Ji et al. employed a separate urban–rural framework with distinct indicator systems for urban and rural areas, emphasizing technological innovation and marketization. By contrast, the present study adopts an integrated framework measuring disparities and interactions through urban–rural comparative indicators, focusing on structural obstacles such as population–spatial mismatch. The key inconsistencies are: (1) the national study finds narrowing disparities, while this study finds the gap in Zhejiang widened from 0.368 to 0.409—suggesting that national-level “convergence” may be driven by catch-up growth in central and western regions, whereas divergence has intensified within a developed province; and (2) the national study does not report regression in developed regions, whereas this study identifies periodic regression in Hangzhou, indicating non-linear evolution. Additionally, Ji et al. highlighted technological innovation and marketization as the strongest drivers, while this study identifies population–spatial mismatch as the greatest obstacle—two complementary perspectives. These differences may also be attributed to variations in spatial scope, indicator system construction, and study periods.
In summary, compared with existing studies at county, regional, and national scales, this study aligns with them on overall evolutionary trends but diverges in indicator system structure, obstacle factor identification, and the changing direction of regional disparities, revealing the scale dependence and regional stage-specificity of urban–rural integration evolution.
4.4. Policy Recommendations
Based on the research findings, the following policy recommendations are proposed:
(1) Leverage core city spillovers and establish a compensation mechanism for coordinated regional development. Given that “improvement coexists with widening disparities,” the growth pole functions of Hangzhou and Ningbo should be strengthened while acknowledging the risks of uneven growth. Facilitate orderly factor flows to southwestern Zhejiang, establish cross-regional benefit compensation mechanisms, and explore “enclave” and “reverse enclave” models to prevent suction effects from overriding spillover effects, thereby gradually reducing inter-tier disparities.
(2) Implement differentiated tier-based policies to address core bottlenecks. Given the systematic differentiation in obstacle structures across tiers, targeted strategies should be adopted. First-tier cities should focus on spatial integration bottlenecks: optimize urban spatial layouts, address information infrastructure deficiencies, and establish ecological carrying capacity early warnings to prevent ecological pressure from becoming a core constraint—facilitating the transition from “scale expansion” to “quality improvement.” Second-tier cities need to address dual ecological and spatial constraints, promoting coordinated development of employment transformation and spatial agglomeration. Third-tier cities should leverage resource endowments to cultivate internal growth poles, resolve employment and income disparities, and explore distinctive urban–rural integration pathways.
(3) Strengthen spatial synergy mechanisms to establish a networked development pattern. Synchronize urban renewal with population agglomeration through spatial optimization. Accelerate integrated urban–rural information infrastructure development driven by digital transformation. Establish a unified and open factor market to facilitate the free flow of production factors (e.g., population, capital, information) between urban and rural areas, enabling resource sharing and complementary advantages—thereby shifting from “isolated development” to “networked synergy.”
(4) Preserve inherent ecological advantages and prevent the upward shift in the “green bottleneck.” A sound ecological environment serves as the foundation and strength of urban–rural integration development in Zhejiang Province. Moving forward, ecological priorities should be upheld, and ecological protection should be integrated with green development throughout the process of urban–rural integration. It is essential to guard against escalating ecological pressure, achieve harmonization of economic, social, and ecological benefits, and ensure that urban–rural integration and ecological protection advance in tandem.
4.5. Limitations and Future Research Directions
Although the “level identification–spatial differentiation–obstacle diagnosis” analytical framework constructed in this study is innovative to a certain extent, it has several limitations that warrant further improvement.
First, the spatial scale of analysis could be further refined. This study exclusively takes prefecture-level cities as the unit of analysis and fails to capture the characteristics of intra-urban–rural inequality at the county or township levels. Micro-level processes of urban–rural integration—such as factor mobility at the village scale and industrial synergy at the county level—may exhibit different spatial patterns and evolutionary trajectories at finer scales. Future research could integrate county- or township-level data to conduct multi-scale comparative analyses, thereby more accurately revealing the micro-level mechanisms and local heterogeneity of urban–rural integration and providing a more comprehensive understanding of its underlying dynamics.
Second, the indicator system could be further refined and expanded. This study draws on mainstream frameworks [
30,
31,
32,
33,
34,
35,
36,
37,
38,
39,
40,
41,
42,
43,
44,
45,
46], relying mainly on objective, quantifiable indicators. Due to data constraints at the prefecture-level city scale, subjective perception indicators (e.g., sense of spatial justice, place identity) and digital development indicators (e.g., digital literacy, internet access) are not included. Future research could incorporate subjective–objective multi-dimensional indicators via surveys, micro-monitoring data, and telecom big data, refine existing dimensions (e.g., factor mobility, institutional integration, collaborative governance), and add cultural and digital dimensions to more fully capture the multi-dimensional nature of urban–rural integration.
Third, the obstacle diagnosis method can be further extended toward dynamic analysis. Although this study utilizes panel data, the empirical analysis primarily relies on cross-sectional comparisons across years. Future research could incorporate time-series techniques—such as evolution trajectory analysis, trend tests, and change-point detection—to capture the dynamic evolution of obstacle factors and identify whether they exhibit patterns of “shifting,” “lock-in,” or “mitigation.” Furthermore, this study employs the entropy weight method and the obstacle degree model for evaluating urban–rural integration and diagnosing obstacles, without adopting Structural Equation Modeling (SEM) or Partial Least Squares Structural Equation Modeling (PLS-SEM). This choice is motivated by the study’s focus on objective evaluation and spatiotemporal comparisons of manifest variables, rather than on testing causal relationships among latent constructs. As the theoretical framework for urban–rural integration matures, future research may introduce SEM or PLS-SEM to further examine the causal mechanisms linking its underlying dimensions.
Fourth, the tier classification method can be further optimized. This study categorizes cities into three tiers based on the calculated urban–rural integration development levels, yet the classification criteria warrant further validation. Future research could adopt multiple objective methods—such as K-means clustering, hierarchical clustering, and natural breaks (Jenks method)—to perform multi-scheme classification and compare the resulting tier assignments, thereby enhancing the robustness and scientific rigor of the tier classification.