Article

Assessing Sustainability and Socio-Economic Viability in Inhabited Protected Areas: A Framework Based on the West-Estonian Archipelago Biosphere Reserve

1
Chair of Environmental Protection and Landscape Management, Institute of Agricultural and Environmental Sciences, Estonian University of Life Sciences, F. R. Kreutzwaldi 5, 51006 Tartu, Estonia
2
Viljandi Culture Academy, University of Tartu, 71004 Viljandi, Estonia
3
Administration of West-Estonian Archipelago Biosphere Reserve, Vabrikuväljak 1, 92411 Kärdla, Estonia
*
Author to whom correspondence should be addressed.
Land 2026, 15(5), 719; https://doi.org/10.3390/land15050719
Submission received: 9 March 2026 / Revised: 20 April 2026 / Accepted: 22 April 2026 / Published: 24 April 2026

Abstract

Protected areas are increasingly expected to reconcile biodiversity conservation with socio-economic sustainability, yet operational tools for assessing local sustainability are limited. This study develops a replicable viability index as an operationalization of socio-economic sustainability at the settlement scale, focusing on the capacity of rural communities to maintain demographic balance and housing dynamics over time. The framework was applied to the West Estonian Archipelago Biosphere Reserve (WEABR), an inhabited UNESCO “Man and the Biosphere” site. Using harmonized census data from 1979 to 2021, the index combines three village-level binary indicators: population dynamics, residential construction activity, and demographic balance. Binary scoring reduces statistical volatility in small settlements and enables comparison across time. Approximately 60% of rural settlements remained viable over four decades, while highly viable settlements declined from 14% to 7%. Population stabilization increased, but ageing intensified and new construction decreased. Viability concentrates near urban centres, ports, transportation corridors, and coastal areas, while inland peripheral villages stagnate. Compared with mainland rural Estonia, WEABR shows a relatively resilient middle tier of viable settlements. The framework provides a transferable tool for monitoring settlement level socio-economic sustainability in inhabited protected areas.

1. Introduction

Over nearly four decades sustainable development has evolved from a broad theoretical framework into 17 measurable sustainable development goals (SDGs). These goals include 169 specific targets with increasing emphasis on social objectives, stakeholder inclusion, and urbanized landscapes [1]. Despite this increasing emphasis on urban contexts [2], natural and rural areas remain central to the global sustainability agenda, particularly in relation to biodiversity conservation and ecosystem services. This is underscored by a commitment to expanding effectively protected and conserved areas (PCAs) from the current coverage of 17.6% terrestrial and 8.4% marine areas to a target of 30% for both by 2030 [3,4]. Such expansion raises a central question: how can the long-term socio-economic sustainability of communities living within these areas be assessed in a consistent and operational way?
Protected areas with moderate levels of human impact have attracted both criticism [5,6,7] and support [8,9]. However, there is a growing scientific consensus that multiple-use protected areas are as essential as strict ones [10,11,12] and have thus become a key component of the global conservation [4,13]. Areas of multiple-use, including other effective area-based conservation measures—OECMs, and other protected areas (without an IUCN management category) now collectively account for more than half of terrestrial protected areas and two-thirds of marine protected areas [12]. In this context, the expansion of PCAs inevitably entails a range of ecological and socio-economic impacts. PCAs are crucial for conserving biodiversity and achieving SDGs [14,15], such as by alleviating climate change [16,17,18,19,20], supporting sustainable socio-economic development [21,22,23,24], and contributing to physical and mental public health [25,26,27] and human well-being in general [3,23,28,29,30]. Negative impacts are frequently linked to widespread impoverishment and forced resettlement [15,31,32], reduced income and livelihood opportunities [33,34], outmigration and population decline [35,36,37] and land abandonment and its associated adverse consequences [38,39]. In most cases, impacts are neither unidirectional nor unequivocally assessable (they are context-dependent) and reflect a combination of positive, negative, and neutral effects [12,40,41].
However, it has been found that although PCAs provide broad international value, the practical burdens often fall disproportionately on the populations living within or near them [28,33,41,42,43]. Combined with negative trends driven by urbanization, such as population outflow and the declining availability or rising costs of services and transport, this disproportionate burden decreases the capacity of protected areas to ensure sustainability.
The Convention on Biological Diversity conceptualizes biodiversity conservation as an integrated, multidimensional framework that combines ecological integrity with social well-being and economic development objectives [3]. This perspective highlights that long-term success depends on not only maintaining biodiversity, but also on ensuring equitable livelihood opportunities, community resilience, and the capacity of local economies to support environmentally compatible development [44,45,46].
Urbano et al. [47] note that biological and hydrological monitoring are well standardized, whereas socio-economic measurement is fragmented and difficult to compare between contexts. Otamendi-Urroz et al. [48] and Vári et al. [49] observe that cultural and community-level dimensions of well-being often receive insufficient attention. Corrigan et al. [50] demonstrate that available indicator systems rely on extensive but uneven panels that tend to emphasize material well-being while overlooking cultural and governance-related metrics. Imbalance also arises from the predominance of positively framed indicators, which may obscure underlying patterns. These limitations have prompted international frameworks to call for the integration of ecological and socio-economic dimensions into coherent and methodologically consistent assessment systems [49]. The Kunming–Montreal Global Biodiversity Framework highlights the dependence of human well-being on ecosystem services and the need to address both dimensions jointly [3]. Similarly, the Intergovernmental Platform on Biodiversity and Ecosystem Services (IPBES) framework, particularly in its Global and the subsequent Values assessments, connects ecological, social, and cultural factors into a single social-ecological system and emphasizes the need for culturally sensitive and context-specific indicators [51,52]. At the same time, several recent studies indicate that such integration remains challenging in practice, as governance systems often struggle to align ecological objectives with socio-economic realities across scales and actor groups [53,54,55,56].
This framing aligns with a social–ecological–systems perspective, which underscores the mutual interdependence of governance practices, community dynamics, and ecological processes [57]. Within such systems, universal thresholds and standardized indicators risk obscuring context-specific characteristics [58], particularly in small communities where processes are historically layered, nonlinear, and spatially embedded [59]. Research on rural areas has shown that community viability depends on the capacity to adapt to change and mobilize social capital [60]. In this context, the effectiveness of the IPBES itself has been linked to its ability to integrate natural, social, and human sciences within its assessment processes [61], an approach further reinforced by the 2024 Nexus and Transformative Change assessments, which aim to bridge disciplinary divides and link ecological, socio-economic, and policy insights for global decision-making [62,63]. Together, these perspectives highlight the need to move beyond fragmented indicator sets toward integrated, context-sensitive frameworks capable of capturing the interdependencies between ecosystems and human communities.
Despite this growing emphasis on integrated and context-sensitive assessment frameworks, there remains a lack of simple and replicable indicators that are suitable for evaluating the viability of small rural settlements [64]. Existing approaches often rely on generalised, national-level metrics that fail to capture the localized and context-dependent nature of socio-economic processes [65].
Building on these considerations, in both European and Estonian contexts, viability does not equate to economic productivity. Within a post-productivist framework, the quality of the living environment, local identity, and rural amenities have become central components of development trajectories in sparsely populated rural areas [66,67,68,69,70]. As a result, economic indicators—although still relevant—are less central and often not adequate at the small-settlement scale. At this scale, demographic structure, community cohesion, and locally embedded socio-cultural dynamics play more decisive roles in shaping long-term development prospects. Therefore, viability in such contexts should be understood as a dynamic characteristic that emphasizes directionality and adaptive capacity rather than short-term economic performance. This understanding aligns with the findings of spatial development studies showing that settlement viability emerges through the continuous interaction of multiple variables over time [60,71,72].
Addressing this gap requires a minimal set of clearly observable and interpretable metrics that remain robust under conditions of small sample variability. Such approaches emphasise transparency, simplicity, and comparability across time and space [49,73].
This paper addresses the identified gap by developing a compact and replicable framework for assessing the socio-economic viability of small settlements in inhabited protected areas. In this study, viability is understood as a practical expression of socio-economic sustainability at the settlement scale, focusing on the capacity of communities to maintain demographic balance and housing dynamics over time. The proposed approach combines a social–ecological systems perspective with a minimal set of village-level indicators that are suitable for analysing long-term development in small settlements, where statistical variability is high. The study contributes by introducing a binary viability index based on harmonized census data, which allows for consistent comparison across time and space. It also demonstrates how this approach can be applied in practice through the case of the West Estonian Archipelago Biosphere Reserve (WEABR), where it reveals long-term patterns of stability, decline, and spatial differentiation that are not easily captured by aggregated indicators. The framework provides a transparent and transferable tool for monitoring settlement-level socio-economic sustainability in inhabited protected areas and supports more context-sensitive, evidence-based approaches to their governance.

2. Material and Methods

2.1. Study Area

The West Estonian Archipelago Biosphere Reserve (WEABR), established in 1990, covers approximately 15,600 km2, of which one-quarter is terrestrial (Figure 1). The reserve encompasses numerous islands and islets the largest of which are Saaremaa (2673 km2), Hiiumaa (989 km2), Muhu (198 km2), Vormsi (93 km2), and Ruhnu (11.9 km2), where almost the entire population of the WEABR resides (approximately 45,000 people). Administratively, the area is divided into five municipalities with two urban centers (Kuressaare and Kärdla) and 687 villages. Most of the studied settlements are small: 86% of them have fewer than 50 residents, the median population is just 19, and only 19 settlements (3%) have over 200 inhabitants. With an average area of 5.9 km2 and a median of 4.7 km2, the settlements are also notably compact, which highlights the highly granular structure of the regional settlement hierarchy.
In terms of social progress, the region is characterized by high levels of human development. According to the Estonian Human Development Report [74], Estonia as a whole has advanced into the top 30 globally, with a Human Development Index (HDI) value of approximately 0.905 as of 2023. While regional disparities exist—primarily due to the concentration of economic activity in the capital region—the counties within the WEABR (Saare and Hiiu) consistently maintain a “Very High” human development status. This is supported by high life expectancy and educational attainment, though the archipelago faces challenges related to an aging population and the maintenance of essential services in smaller, remote settlements.
The WEABR is categorized into three management zones—core, buffer, and transition—designed to integrate strict nature protection with sustainable human development. The landscape is characterized by extensive coastlines, sandy forest plains, and rare semi-natural communities such as Nordic alvars and wooded meadows. These habitats are highly dependent on traditional anthropogenic activities, specifically grazing and mowing, to prevent overgrowth and maintain their high biodiversity [75,76,77].
Historically, the region has transitioned from an agrarian society to a service-based economy. Mirroring global shifts [12], the local economy has transitioned away from a shrinking primary sector (agriculture and fishing) toward secondary industries (food processing, shipbuilding) and a service-based tertiary sector, the latter of which is increasingly defined by tourism and the rise of remote-work professionals [41].

2.2. Viability Assessment of Rural Settlements

Settlement viability was assessed using a methodology based on a sufficient yet minimal set of easily interpretable and fundamental indicators. For simplicity, applicability, and replicability, these metrics rely on only readily available public data. Such an approach has proven to be highly efficient in rural studies, as also noted by several other authors [78]. The objective was to create a system that (1) captures the central themes, (2) can be consistently replicated, and (3) allows for comparison across time and space while taking into account the particular challenges associated with small-settlement data.
The main challenge in assessing the viability of rural settlements lies in data quality and the statistical instability that characterises small settlements, where individual events can drastically influence the results (see Sørensen [79] and Li et al. [60]. To address this, a binary evaluation method (positive/negative outcome) was applied to reduce distortions associated with small sample sizes and to enhance comparability. Binary indicators are used to stabilise assessments under statistically volatile conditions rather than to oversimplify rural dynamics. Such approaches are widely employed in public health and policy analysis due to their clarity and efficiency [80], and recent studies show that binary scales can perform comparably to continuous measures in general assessments, particularly in sensitive contexts [81,82]. Given that the objective is to identify overall trends rather than detailed intensity effects, the known limitations of dichotomisation [83,84] are considered acceptable within the scope of this study.
Based on the reasons detailed thus far and similar studies [37,85,86,87,88], three indicators were chosen: population dynamics (10-year period); residential construction activity (10-year period); and the age structure of residents (current value at the time of the census; longitudinal changes from prior values). Data were collected from the Population and Housing Census results from 1979 (approximately 10 years prior to the establishment of the WEABR), 1989, 2000, 2011, and 2021 (the most recent) [89]. Censuses are periodically conducted in Estonia every 10 years and are nationally administered, reliable, sufficiently detailed, and freely accessible. Given the selected indicators, a 10-year interval is considered optimal as shorter timeframes may fail to reveal distinct structural trends due to disproportionately skewed results from isolated outliers.
Furthermore, Statistics Estonia has maintained consistent data-collection protocols over several cycles, which enables expansion of the analytical scope beyond a single decade if needed (as implemented in the current study). Nevertheless, the viability index does not consider year the results of the 2000 census results, which is primarily due to inconsistencies in the significant data arising from the large-scale restoration of rural settlements in the early 1990s. During this period, the number of Estonian villages surged from approximately 3400 to over 4400, which caused widespread boundary changes that disrupted the tracking of statistical trends across these settlements.
Administrative restructuring was most acute on the Western Estonian islands, where only 1% of settlements were unaffected. This has rendered the data from 1989 to 2000 incomparable with the stable settlement borders and statistical recalculations available for the 1989, 2011, and 2021 indices. As of 2021, the WEABR comprised 687 rural and two urban settlements. The present study focused exclusively on the rural settlements, and the two urban centres were omitted to maintain a consistent focus on small-scale settlement dynamics. The study utilized data aggregated at the level of the smallest traditional settlement unit—the village—where communal functions and social principles are operative, and robust statistical data are available.
To contextualize the viability of the WEABR, a comparative analysis against mainland Estonia was conducted. This approach establishes a standardized benchmark to determine whether observed settlement dynamics are unique to the insular biosphere context or reflective of broader national rural trends. By situating the WEABR within the wider Estonian landscape, the specific impacts of archipelagic geography and the biosphere governance framework can be isolated from general socio-economic shifts. Furthermore, benchmarking the study area against structurally similar mainland regions facilitates a nuanced interpretation of how spatial and functional factors—such as coastal accessibility or community cohesion—differentiate the development trajectories of archipelago settlements from those in the rest of rural Estonia.

2.2.1. Binary Evaluation Model of Indicators

  • Population dynamics (growth-stability/decline)
The population dynamics reflects the overall viability of a settlement. It measures whether the population has increased, remained stable, or declined during the observed period (e.g., 10 years). Rural settlements are small in terms of population, in WEABR often having under 20 inhabitants. At this scale, the movement of a single person or family has a great impact, which is why in current study the changes are assessed at the level of individual. Stability is also considered a positive outcome since maintaining population levels in rural Estonia, should be treated as a favourable result given the long-term declining trends.
2.
Residential construction activity (built/not built)
New housing construction is a fundamental indicator signalling long-term investment and the willingness of people to commit to a specific place. It reflects both the attractiveness of the locality and its perceived future potential, making residential construction a practical and easily observable proxy for settlement-level socio-economic dynamics in rural contexts. The indicator was assigned a positive binary value if at least one new dwelling was built in the settlement during the period under observation.
3.
Demographic balance (youth-to-elderly ratio ≥ 1 or <1)
Age structure reflects demographic sustainability. Proportions of the working-age population (e.g., ages 18–64) are relatively similar and stable between different regions of Estonia, but the proportions of youth and elderly are diametrically opposed, making the latter more informative when assessing a settlement’s viability [89]. A positive outcome is recorded when the number of young residents is equal to or exceeds that of older residents (ratio ≥ 1). This indicates that the settlement is not excessively aged and that there is demographic potential exists in younger generations.

2.2.2. Interpretation of Results

Settlements are classified according to the number of positive indicators, which provide a rapid overview of their viability (Table 1). There is also a fourth category: uninhabited settlements. Although these settlements have seen no positive developments—similarly to stagnating ones—they are categorized independently to avoid artificially inflating the proportion of functioning but stagnating settlements.

3. Results

3.1. Viability of Rural Settlements in WEABR

The viability analysis indicates clear yet divergent development trends over the period 1979–2021. The data presented in Table 2 reflect positive values of the three principal indicators of the settlement viability index: population dynamics, residential construction activity, and age structure. Among the observed indicators, population dynamics is the only one that has improved consistently. Whereas 26% of settlements exhibited positive population growth or stability in 1979–1989, this share increased to 42% in 2011–2021. This suggests a shift in demographic trajectories moving from rapid decline toward stabilization and selective growth in rural regions.
At the same time, residential construction activity has steadily declined, with the proportion of settlements showing positive construction indicators decreasing from 49% in 1979–1989 to 36% in 2011–2021. The most drastic change occurred in the age composition of the population, particularly the ratio of youths (those aged 0–17 years) to seniors (those aged 65+ years). A younger demographic structure dominated in more than half (55%) of the settlements during the first period, but this figure fell to just 27% in the last decade, clearly reflecting an increasing general trend of aging, which is a phenomenon that characterises all of Europe [90].
These statistical trends are shaped by several broader socio-economic processes that are characteristic of Estonia and other European countries. The deterioration of the age structure is a direct consequence of urbanization and ageing of rural population [91] as younger generations tend to move to larger cities for education and career opportunities. In contrast to Western and Central Europe, rural depopulation in Estonia and other Eastern European countries is uniquely marked by the rapid decay of Soviet-era collective farm centres. Although this shift has led to an overall decrease in the rural population, it has simultaneously facilitated the gradual re-emergence of traditional settlement patterns [92,93]. However, the general stabilization of population trends indicates that active out-migration is slowing in numerous settlements. This shift is driven in part by the rise of remote working and intentional migration to rural areas, which is a phenomenon that has also been observed in other areas, such as Sweden [94].
A decrease in residential construction does not inherently imply the decline of rural vitality. Given the substantial stock of vacant farmsteads and residential units, there is a preference for renovating existing structures rather than commissioning new builds. This trend is largely invisible in official new construction statistics (see Terres et al. [88]). Furthermore, new housing development is severely constrained by the availability of financing. As also found by Waltert and Schläpfer [66], financial institutions frequently categorize real estate outside of urban centres as low-liquidity assets.
This renders mortgages inaccessible or prohibitively expensive, even for creditworthy applicants seeking to establish rural residences. Given the background of population and housing trends, Table 3 provides insight into the long-term viability of Biosphere Area settlements. While “viable” mid-tier settlements have remained stable over the last thirty years, significant shifts are evident at both ends of the spectrum: the most dynamic and the most vulnerable settlements.
Several key patterns emerged regarding the distribution and change in settlement viability within the Biosphere Reserve:
  • Persistence of a strong core (viable settlements)
The most positive feature of the WEABR is the stability and slight growth of the core group of viable settlements. This group has consistently represented a clear majority, increasing from 60% in 1989 to 63% in both 2011 and 2021. This suggests that most villages have been able to maintain their viability and a functional living environment.
2.
Continuous decline of the top tier (highly viable settlements)
The steady contraction of highly viable settlements—the region’s primary drivers—is a major concern. Their share has halved from 14% in 1989 to only 7% in 2021, signalling that the most dynamic settlements are losing their competitive edge and developmental pace.
3.
Settlements in persistent stagnation
The proportion of villages experiencing development difficulties has remained stable over decades, consistently comprising approximately one quarter of all settlements (26% in 1989, 24% in 2011, and 26% again in 2021). Therefore, these settlements have been largely excluded from positive development trends and may be characterized as “left-behind” settlements. Given the small size of most WEABR villages, even limited demographic fluctuations can reinforce long-term stagnation, which highlights the importance of early warning indicators in identifying vulnerable settlements.
4.
Abandoned settlements
A new phenomenon compared to the late Soviet period is the emergence of settlements without permanent residents. Whereas none officially existed in 1989 (0%), by 2011, their share had reached 5%, and by the 2021 census, it was 4%. This reflects processes of peripheralization, where some villages have lost year-round habitation, even though they may continue to function partially as seasonal or second-home areas. Although differing in distribution, the causes and mechanisms behind the emergence of uninhabited areas are similar and primarily comprise remote natural areas that are unsuitable for living, especially according to modern standards. Historically, such villages have always been sparsely populated or uninhabited, and they will likely remain so despite ever-improving transport links, communication, and energy-independence solutions.

3.2. Viability of WEABR Compared to the Rest of Estonia

Following the internal analysis of WEABR settlements, a comparative study was conducted using the rest of Estonia’s rural areas as a control. The selection of the control group was driven by the necessity to compare the WEABR with rural regions sharing similar socio-economic and spatial profiles, specifically to mitigate the distorting influence of urban sprawl. Of Estonia’s 15 counties, four were excluded because they host large cities (exceeding 20,000 residents) and the urban population exceeds the rural one. The ‘rural’ settlements in these excluded counties are largely situated within active suburbanization belts characterized by high growth and construction rates, making them poor analogues for the peripheral and insular context of the WEABR. The remaining 11 counties form the ‘rural Estonia’ control group, offering a more structurally consistent baseline. Harju County—which includes the capital, Tallinn, and houses one-third of the national population—was analysed as a standalone extreme case. Harju County was utilized as the primary model of intensive suburbanization to provide a sharp contrast against the developmental realities of the biosphere area.
Based on a four-tier classification of settlement viability, Estonia (15 counties) can roughly be divided into three characteristic zones (Table 4):
  • The economically dynamic and rapidly developing capital region (Harju County)
  • Generally contracting rural counties (11 counties out of 15; four counties including towns with >20,000 inhabitants and >50% of the total population living in urban areas were excluded)
  • The WEABR region, which is statistically similar to the average of rural Estonia but is shaped by a somewhat different spatial and functional context due to its archipelagic geography, coastal accessibility, and biosphere reserve governance framework.
The following key patterns emerged:
  • A deficit of highly viable settlements in WEABR and in rural Estonia as a whole
The most striking contrast appears in the top “highly viable” category, among which Harju County is in a league of its own compared to the rest of Estonia. The county’s 28% of highly viable rural settlements primarily reflects suburbanization processes. Its rural settlements are rarely traditional agricultural villages but rather suburban extensions of capital Tallinn, which are largely inhabited by higher-income taxpayers. The corresponding figure for WEABR is four times lower (7%) as the islands lack the metropolitan “hinterland effect,” but it is still comparable to other rural regions (5%) and Estonia as a whole (8%).
Highly viable settlements in WEABR are concentrated in mainly the immediate surroundings of the only urban centres: Kuressaare and Kärdla. Consistent with trends in the rest of rural Estonia, settlements located farther from major hubs face chronic deficits of critical human capital and economic activity, which limits their ability to transition into higher viability categories. This pattern reinforces the broader spatial polarization of economic opportunities within Estonia, where metropolitan influence strongly shapes the trajectories of rural development.
2.
A strong “middle class” against all odds
Despite the physical isolation of the islands, fewer options, and higher cost of living compared to mainland of Estonia, the WEABR broadly has a similar rate (63%) of moderately viable settlements compared to the national average (58%). This outcome is notable given the structural constraints that are typical of island regions, where limited accessibility and higher service costs often amplify demographic pressures. As a working hypothesis, a combination of island identity, community cohesion, and the stabilising effect of the biosphere reserve framework may help to sustain local communities, even where pure economic logic would predict decline.
3.
Less “stagnating” settlements compared to the average of rural counties
The situation on the islands is more favourable than in mainland rural areas, with fewer villages on the verge of abandonment (which are characterized by an aging, shrinking population and deteriorating property stock). In the WEABR, this outcome partly reflects the islands’ stronger amenity values and higher property attractiveness, which help to sustain vulnerable settlements even when demographic indicators alone would suggest decline. Seasonal habitation and second home use—which are both more prevalent in coastal and island regions—also contribute to preventing complete settlement abandonment and provide intermittent demand for maintenance, services, and infrastructure.

3.3. Spatial Distribution of Settlement Viability Within WEABR

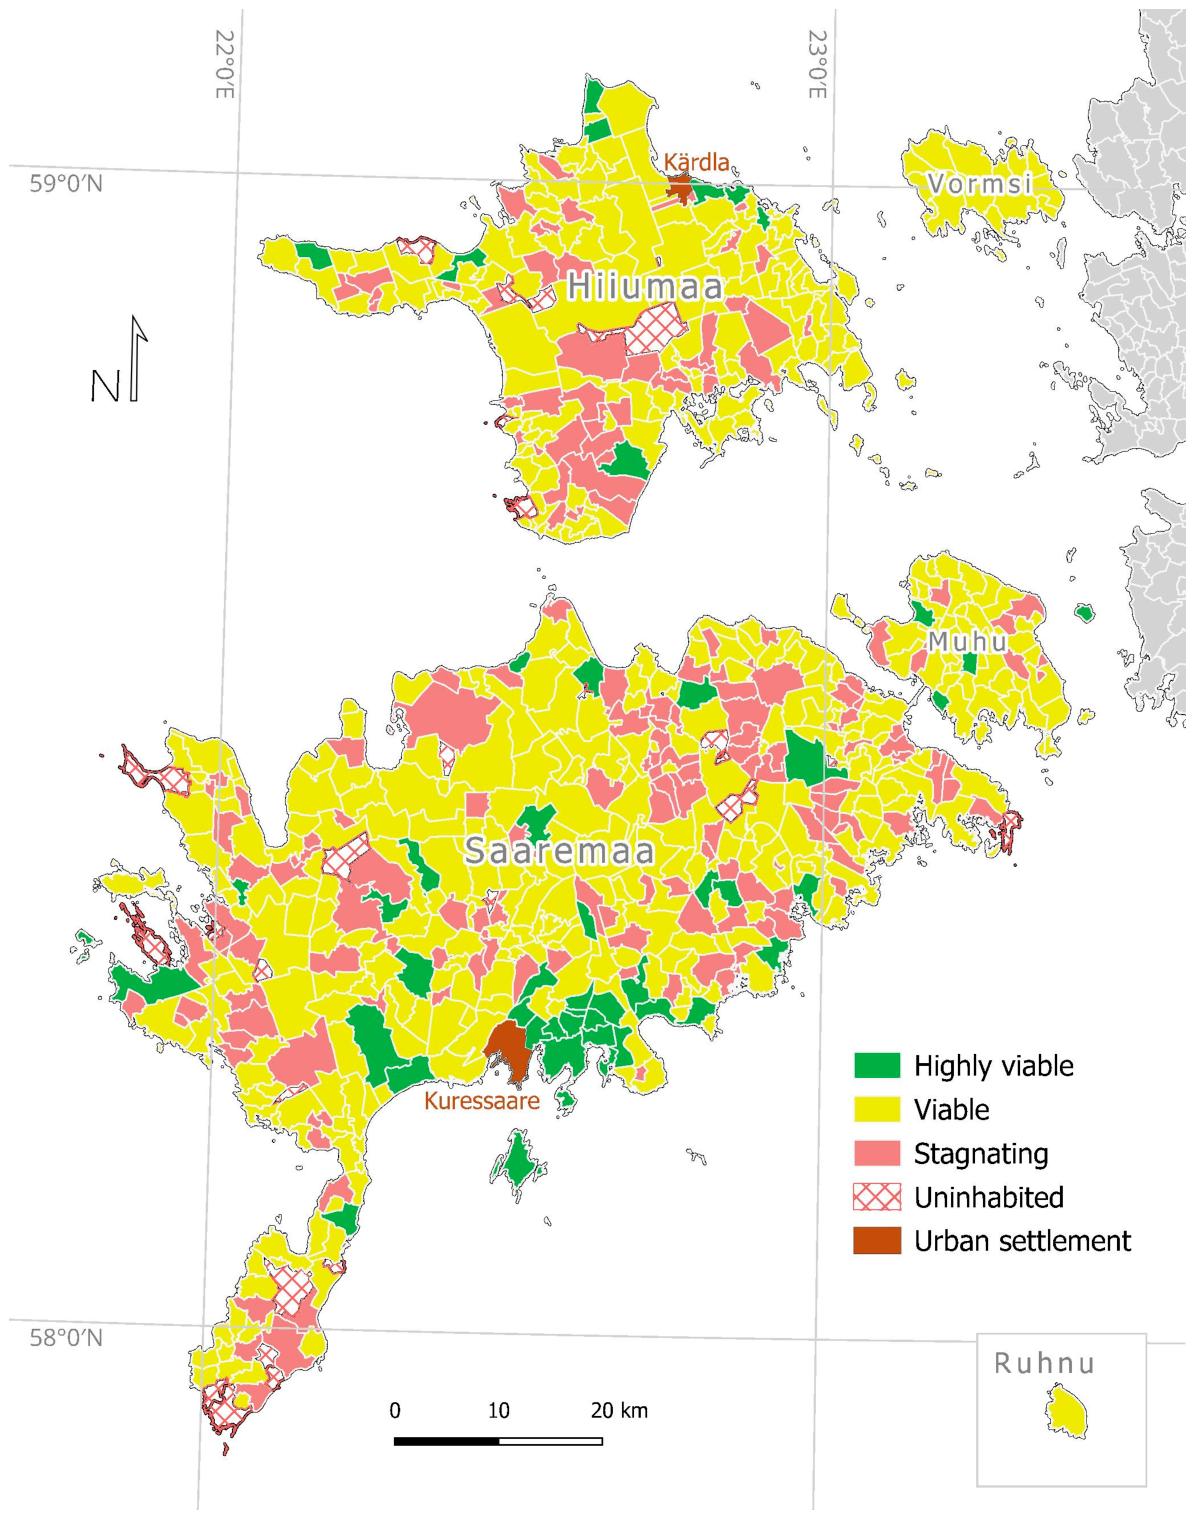
To determine the causal factors behind settlement trends, it is necessary to analyse the spatial relationships between individual villages and significant landmarks. Although the spatial distribution in the WEABR appears disparate at the micro-level (Figure 2), a robust spatial pattern is evident. This pattern is characterized by a strong correlation between settlement performance and accessibility to regional centres and transit corridors.
Analysis of the spatial distribution of rural settlements in the WEABR indicates distinct patterns on the two largest islands. The other islands of the WEABR turned to be too small to identify patterns in the spatial distribution of viable villages. Notably, Saaremaa has its own “metropolitan hinterland” with a strong concentration of high-performance settlements in the immediate vicinity of Kuressaare, the island’s only urban centre. This trend signifies a widening urban influence and suburban expansion, where residents prioritize the amenities of rural living while remaining integrated into the city’s labour and educational markets. This area represents the most demographically youthful and economically dynamic zone in the archipelago. The pattern is consistent with broader rural–urban interaction dynamics identified earlier in this study, where proximity to hubs and diversified labour markets underpin long-term settlement viability.
A second strong axis of viability runs along the main highway, stretching from the village of Kuivastu (the ferry link to the mainland) towards the south-west to the town of Kuressaare. Settlements located along this main artery exhibit significantly higher stability than those situated further away from the road. In the context of the WEABR, this corridor functions as the primary mobility backbone, concentrating economic flows, tourism traffic, and everyday commuting patterns. In principle, travel between Saaremaa and the mainland is possible only via the Port of Kuivastu on Muhu Island. The combined effects of transport centrality and continuous seasonal mobility of Muhu island help to maintain a baseline level of socioeconomic activity that small island settlements elsewhere often struggle to sustain.
A distinction also emerged between coastal areas and the inland, which is common for seaside regions. Many coastal villages are more resilient due to tourism and summer homes. Despite a limited number of permanent residents, the influx of seasonal economic activity and property development revitalizes the area, which has similarly been observed in countries like Spain [87]. In contrast, inland areas are less viable, especially the deeper interior parts of Northern and Western Saaremaa and the remote tips of the Sõrve Peninsula. These regions are further away from main roads and lack the attractiveness associated with proximity to the waterfront.
These areas comprise classic fading villages with an elderly population and a landscape that is often dominated by forests, which do not require constant management, unlike arable land. This pattern aligns with the broader demographic processes discussed earlier, where ageing, shrinking population, and limited economic diversification reduce long-term viability [60,78]. Coastal amenity values and episodic seasonal inflows act as compensatory mechanisms that help sustain settlement functions even when demographic indicators alone suggest decline.
The areas with the lowest viability (uninhabited areas) are sparsely distributed and not concentrated in any specific place or region. These areas are mainly former forest villages or small islands or islets, which are currently depopulated or only used seasonally primarily due to difficult accessibility. Such cases illustrate the extreme end of the accessibility gradient described earlier: in areas where mobility barriers are high and everyday service access is limited, settlements become increasingly vulnerable to complete depopulation, which has also been noted in rural peripheries elsewhere in Estonia [41].
Similarly to Saaremaa, the viable rural settlements of Hiiumaa also appear fragmented, but a clear spatial logic emerges there as well: viability is directly linked to the main centres of attraction, the port, and the island’s natural landscapes, particularly with the contrast between coastal zones and the forested interior. The highly viable settlements are concentrated in the immediate vicinity of Hiiumaa’s main centre, the town of Kärdla. Similarly to the trends surrounding Kuressaare in Saaremaa, this a clear sign of urban sprawl. Single highly viable villages are also located at the western and southern tips of Hiiumaa (e.g., in the areas of Kõpu and Emmaste), which function as local core settlements.
Also noticeable in Hiiumaa are the importance of the port as the islands’ primary link to the outside world and its impact on the viability of villages. Villages located near the road running between Heltermaa port and Kärdla are more able to maintain their viability than villages that are more remote. Rural settlements that are situated furthest from the Kärdla–Heltermaa axis exhibit lower levels of viability, aside from the Kõpu Peninsula and its primary landmark, the 16th-century Kõpu Lighthouse (which is one of the oldest continuously operating navigational aids in the world).
The unique character of the islands’ settlement structure and the coast–inland contrast also emerges in Hiiuma: all highly viable settlements are located directly on the sea coast. In contrast to Saaremaa, however, the uninhabited areas of Hiiumaa are concentrated in the central and western parts of the island, which features large natural areas that have traditionally been very sparsely populated or entirely uninhabited. However, it should be noted that unlike Saaremaa or Hiiumaa, where a contrast between coastal and inland villages occurs, Vormsi’s smaller scale and more balanced settlement structure prevent such fragmentation. Therefore, the viability of Vormsi is uniform and consistent throughout its entirety.

4. Discussion

In this study, viability is used as an operationalisation of socio-economic sustainability at the settlement scale: it captures whether a community retains the demographic and housing conditions needed for continued local life, rather than overall economic productivity alone. The three indicators incorporated into the index—population change, residential construction, and age structure—are highly sensitive in small settlements and can thus signal incipient decline marked by depopulation, accelerated demographic ageing, or stagnation in residential development. Methodologically, the main novelty lies in combining harmonised long-term census data with a minimal village-level binary scoring scheme, which reduces the statistical volatility typical of very small settlements while keeping the framework transparent and replicable. This methodological choice is necessitated by the fact that demographic indicators in small villages are prone to extreme fluctuations, as the movement of a single family can cause disproportionate proportional changes and render continuous measures unstable. Furthermore, the use of registered residency data may carry inherent biases because official records do not always reflect actual occupancy due to service eligibility or emotional ties to a specific municipality. At the same time, the index does not capture cultural or community-level factors that have been identified as essential components of rural viability in the literature on social-ecological systems [57,95,96].
As Leverington et al. [97] emphasize, such a quantitative measure of structural trends should be complemented by place-based qualitative information that may indicate development trajectories that are not visible in statistical data alone. Combined with local knowledge and community insights, as advocated by Borrini-Feyerabend et al. [98] and Boarini et al. [99], the index can help explain why some settlements maintain viability despite adverse structural conditions and provide useful guidance for biosphere reserve governance and regional policy. Although developed within the WEABR, a UNESCO “Man and the Biosphere” Program area, the index may also be applicable in other inhabited protected areas and OECMs where similar demographic and spatial processes shape long-term sustainability [45,50]. Transferability, however, depends on the availability of harmonized settlement-level census data, stable administrative boundaries, and basic housing records over comparable time periods; in data-poor regions, the framework would need adaptation or supplementation with locally compiled proxies.
Overall, viability in the WEABR has been relatively stable throughout the study period: approximately 60% of settlements consistently fell within the viable category, while stagnating settlements accounted for roughly one quarter of villages, which is considerably below the average observed in rural Estonia. The relatively high share of viable settlements in the WEABR suggests that the biosphere reserve framework may play a supportive role in sustaining rural communities. First, the designation has strengthened the islands’ reputation as a high-quality living environment, which has contributed to the development of sustainable tourism and encouraged lifestyle oriented in migration, including remote workers and young families. Second, the biosphere reserve model supports local economic activity by providing a coherent framework for small scale entrepreneurship such as local food production and handicrafts, allowing livelihoods to develop without undermining ecological values. At the same time, the potential “protective” effect of the biosphere reserve is difficult to separate from the broader cultural and geographic attractiveness of the islands and from the influence of nearby urban centres such as Kuressaare and Kärdla. The reserve status is therefore not the sole driver of settlement resilience, but it likely acts as an important catalyst that enhances the inherent socio ecological strengths of the region. Settlement level trajectories also show that viability is not static. Villages moved between categories over the four decades analysed, and the number of highly viable settlements declined. Given the small population size and limited housing stock of rural villages, such fluctuations are expected. Household size, generational turnover and the long lifespan of rural housing place natural limits on continuous growth. Under these conditions, sustained population increase, demographic rejuvenation or steady additions to the housing stock represent exceptional rather than typical trajectories at the village scale.
Migration processes further shape these trajectories. The demographic profile of the WEABR reflects both long-term population ageing, which is visible in the declining youth-to-senior ratio, and emerging forms of in-migration. Increased flexibility in work arrangements has contributed to renewed rural in-migration across several European regions as households seek environments that provide higher environmental quality, lower population density, and improved quality of life [100,101,102]. Research on rural in-migration by Rõigas et al. [65] indicates that newcomers often prefer places with strong identity, active communities, and good accessibility, which may partly explain why some settlements remain viable despite broader ageing trends. However, the long-term impact of these migration flows is uncertain, and their interaction with ageing populations produces uneven demographic patterns that a relatively simple index cannot fully capture. Future research should examine the diversity and level of migration flows to better understand why certain settlements prove more resilient than others under similar demographic pressures.
New residential construction also declined gradually over the study period. This does not necessarily indicate reduced viability since official statistics record only new construction and do not capture housing renovation, which constitutes a substantial share of actual investment in the housing stock. This is compounded by inaccuracies in building registries, where the recorded age of a structure often reflects the date of its official entry or occupancy permit rather than the actual year of construction. National financial conditions reinforce this pattern: limited access to housing loans in small settlements often encourages renovation rather than new construction. Future studies could supplement the construction indicator with renovation data obtained through either field observation in smaller areas [37,41,85] or remote sensing methods in larger territories [103,104,105].
Spatial analysis indicates that viability in the WEABR concentrates around ports, urban centres, and well-connected coastal areas. Coastal settlements and villages near major transport corridors maintain higher viability due to better accessibility, tourism activity, and seasonal population inflows, whereas inland peripheral areas are consistently weaker. These patterns broadly resemble those observed in mainland rural counties, although they are shaped by island-specific spatial mechanisms. As viability increasingly concentrates along development corridors, questions arise about sustaining services in inland settlements that fall outside them. Stronger attention to the biosphere program and targeted regional policy measures may be required to support the resilience of peripheral rural territories.
The central role of connectivity is further illustrated by infrastructure comparisons. Villages on Muhu Island, which is permanently connected to Saaremaa by a causeway, show higher viability than settlements on other small islands that lack such connections. Similar dynamics have been documented after the opening of the Øresund Bridge between Denmark and Sweden in 2000, where improved accessibility stimulated commuting, residential relocation, and labour–market integration [106,107]. Nevertheless, the difference in scale between these cases warrants caution in drawing direct parallels. Future infrastructure projects, such as a fixed link between Muhu Island and mainland Estonia or the construction of large wind parks, could significantly alter accessibility patterns and reshape settlement trajectories in the archipelago.
Finally, the institutional framework of the UNESCO “Man and the Biosphere” Program, together with the high natural and cultural values of the region, may enhance regional attractiveness and support community functioning even in demographically weaker areas. Research on PCAs demonstrates that such territories can generate socio-economic benefits, including tourism revenue, employment opportunities, and strengthened community cohesion [29,50], which may help explain the relatively resilient socio-economic base observed in the WEABR. However, it is difficult to disentangle the effects of biosphere-reserve status from those of historical development trajectories and strong island identities.

5. Conclusions

This study demonstrates that the viability index provides a consistent and adaptable metric for tracking long-term settlement dynamics in small rural areas. Applied to the WEABR over four decades, the index reveals three key findings: (i) a stable majority of viable settlements (approximately 60%), (ii) a decline in highly viable settlements, and (iii) increasing spatial concentration of viability near urban centres, transport corridors, and coastal areas. Conceptually, the study operationalizes socio-economic sustainability at the settlement scale through the notion of viability, understood as the capacity of rural communities to maintain demographic balance and housing dynamics over time. Methodologically, it demonstrates that a minimal set of binary indicators based on harmonized census data can provide robust and comparable results under conditions of small-sample statistical volatility. Practically, the framework offers a transferable tool for monitoring settlement dynamics in inhabited protected areas. From a governance perspective, the index can serve as a strategic planning tool within the integrated social-ecological framework of the UNESCO “Man and the Biosphere” Program. Incorporated into periodic reviews, it would provide a basis for evaluating long-term trends and policy effects; guide the allocation of regional development funds, EU recovery instruments and UNESCO program resources; and support management of land-use conflicts by identifying where development pressures are likely to encounter stronger community resistance. At the same time, the approach has several limitations. Its applicability depends on the availability of harmonized settlement-level census data, stable administrative boundaries, and reliable housing records over comparable time periods. In regions where such data are limited or inconsistent, the framework would require adaptation or the use of alternative proxy indicators. In addition, the index captures structural demographic and housing dynamics but does not fully reflect cultural, social, or qualitative dimensions of community viability.
Future research should focus on integrating viability-based assessments with qualitative and community-level indicators, as well as examining the role of migration dynamics, seasonal populations, and housing renovation processes, which remain insufficiently captured by current datasets. Comparative applications across different types of inhabited protected areas and OECMs would further test and refine the framework.
Finally, an important implication of this study is that settlement viability and conservation objectives do not necessarily align: higher viability may increase recreational pressure and land-use intensity, while declining viability may threaten the maintenance of semi-natural landscapes dependent on human activity. Addressing this tension requires integrated social–ecological approaches that consider both biodiversity conservation and the long-term sustainability of local communities.

Author Contributions

Conceptualization, J.K., H.J., T.K. and A.R.; methodology, J.K.; software, T.K., R.R. and J.R.; validation T.K., R.R. and J.R.; formal analysis, J.K. and J.R.; investigation, J.K., H.J., A.R., R.R. and T.K.; resources, J.K. and J.R.; data curation, J.K. and J.R.; writing—original draft preparation, J.K., H.J., A.R., R.R. and T.K.; writing—review and editing, A.S. and K.S.; visualization, T.K.; supervision, K.S. and A.S.; project administration, H.J.; funding acquisition, K.S. and H.J. All authors have read and agreed to the published version of the manuscript.

Funding

This research has been supported by the European Union through Horizon Europe project Europe-LAND (Towards Sustainable Land-use Strategies in the Context of Climate Change and Biodiversity Challenges in Europe; grant agreement No. 101081307) and by the BESTbelt project through its subproject TSIRK (Thorough Study for Innovative and Respected Knowledge; grant agreement No. EE-24-1068-53).

Data Availability Statement

The data presented in this study is available on request from the corresponding author.

Conflicts of Interest

The authors declare no conflicts of interest.

References

  1. Hajian, M.; Kashani, S.J. Evolution of the Concept of Sustainability. From Brundtland Report to Sustainable Development Goals. In Sustainable Resource Management; Velasco-Munoz, J.F., Chaudhery, M.H., Eds.; Elsevier: Amsterdam, The Netherlands, 2021; pp. 1–24. [Google Scholar] [CrossRef]
  2. United Nations. World Urbanization Prospects: The 2018 Revision; United Nations: New York, NY, USA, 2019. [Google Scholar]
  3. UN Environment Programme. Kunming-Montreal Post-2020 Global Biodiversity Framework; CBD/COP/DEC/15/4; UN: New York, NY, USA, 2022. [Google Scholar]
  4. UN Environment Programme World Conservation Monitoring Centre; International Union for Conservation of Nature; IUCN World Commission on Protected Areas (WCPA). Protected Planet Report 2024; UN Environment Programme World Conservation Monitoring Centre: Cambridge, UK; International Union for Conservation of Nature: Gland, Switzerland; IUCN World Commission on Protected Areas (WCPA): Gland, Switzerland, 2024. [Google Scholar]
  5. Locke, H.; Dearden, P. Rethinking Protected Area Categories and the New Paradigm. Environ. Conserv. 2005, 32, 1–10. [Google Scholar] [CrossRef]
  6. Shafer, C.L. Arguments for and against IUCN Protected Area Management Category VI with a Review of State versus Community Governance. J. Nat. Conserv. 2020, 53, 125697. [Google Scholar] [CrossRef]
  7. Terborgh, J. Reflections of a Scientist on the World Parks Congress. Conserv. Biol. 2004, 18, 619–620. [Google Scholar] [CrossRef]
  8. Mallarach, J.M.; Morrison, J.; Kothari, A.; Sarmiento, F.; Atauri, J.A.; Wishitemi, B. In Defence of Protected Landscapes: A Reply to Some Criticisms of Category V Protected Areas and Suggestions for Improvement. In Defining Protected Areas: An International Conference in Almeria, Spain; Dudley, N., Stolton, Sue., Eds.; IUCN: Gland, Switzerland, 2008; pp. 31–37. [Google Scholar]
  9. Wilson, A. All Parks Are Peopled Parks. In Policy Matters; Institute for Research on Public Policy: Montreal, QC, Canada, 2003; Volume 12, pp. 71–75. [Google Scholar]
  10. Elleason, M.; Guan, Z.; Deng, Y.; Jiang, A.; Goodale, E.; Mammides, C. Strictly Protected Areas Are Not Necessarily More Effective than Areas in Which Multiple Human Uses Are Permitted. Ambio 2021, 50, 1058–1073. [Google Scholar] [CrossRef]
  11. Vimal, R.; Navarro, L.M.; Jones, Y.; Wolf, F.; Le Moguédec, G.; Réjou-Méchain, M. The Global Distribution of Protected Areas Management Strategies and Their Complementarity for Biodiversity Conservation. Biol. Conserv. 2021, 256, 109014. [Google Scholar] [CrossRef]
  12. Adams, V.M.; Chauvenet, A.L.M.; Stoudmann, N.; Gurney, G.G.; Brockingon, D.; Kuempel, C.D. Multiple-Use Protected Areas Are Critical to Equitable and Effective Conservation. One Earth 2023, 6, 1173–1189. [Google Scholar] [CrossRef]
  13. Dudley, N.; Jonas, H.; Nelson, F.; Parrish, J.; Pyhälä, A.; Stolton, S.; Watson, J.E.M. The Essential Role of Other Effective Area-Based Conservation Measures in Achieving Big Bold Conservation Targets. Glob. Ecol. Conserv. 2018, 15, e00424. [Google Scholar] [CrossRef]
  14. Fischborn, M.; Sandwith, T. Solutions for Development Challenges: Insights from Protected and Conserved Areas; IUCN: Gland, Switzerland, 2021. [Google Scholar] [CrossRef]
  15. West, P.; Igoe, J.; Brockington, D. Parks and Peoples: The Social Impact of Protected Areas. Annu. Rev. Anthropol. 2006, 35, 251–277. [Google Scholar] [CrossRef]
  16. Gross, J.E.; Woodley, S.; Welling, L.A.; Watson, J.E.M. Adapting to Climate Change: Guidance for Protected Area Managers and Planners; IUCN: Gland, Switzerland, 2016. [Google Scholar] [CrossRef]
  17. Haight, J.; Hammill, E. Protected Areas as Potential Refugia for Biodiversity under Climatic Change. Biol. Conserv. 2020, 241, 108258. [Google Scholar] [CrossRef]
  18. Hannah, L. Protected Areas and Climate Change. Ann. N. Y. Acad. Sci. 2008, 1134, 201–212. [Google Scholar] [CrossRef]
  19. Hughes, K.A.; Convey, P.; Turner, J. Developing Resilience to Climate Change Impacts in Antarctica: An Evaluation of Antarctic Treaty System Protected Area Policy. Environ. Sci. Policy 2021, 124, 12–22. [Google Scholar] [CrossRef]
  20. Smith, R.; Cannizzo, Z.J.; Belle, E.; Wenzel, L. Role of Protected Areas in Climate Change Mitigation, Adaptation, and Disaster Risk Reduction. In Climate Action. Encyclopedia of the UN Sustainable Development Goals; Leal Filho, W., Azul, A.M., Brandli, L., Özuyar, P.G., Wall, T., Eds.; Springer: Cham, Switzerland, 2020; pp. 1–16. [Google Scholar] [CrossRef]
  21. CBD. The Strategic Plan for Biodiversity 2011–2020 and the Aichi Biodiversity Targets: Living in Harmony with Nature; Secretariat of the Convention on Biological Diversity: Montreal, QC, Canada, 2010. [Google Scholar]
  22. IUCN. Recommendations of the World National Parks Congress. Environ. Policy Law 1983, 10, 63–68. [Google Scholar] [CrossRef]
  23. Millenium Ecosystem Assessment. Ecosystems and Human Well-Being: Synthesis. In Millenium Ecosystem Assessment; Island Press/Center for Resource Economics: Washington, DC, USA, 2005; p. 155. [Google Scholar] [CrossRef]
  24. United Nations. Report of the United Nations Conference on Environment and Development; United Nations: New York, NY, USA, 1992; Volume l. [Google Scholar]
  25. Romagosa, F.; Eagles, P.F.J.; Lemieux, C.J. From the inside out to the Outside in: Exploring the Role of Parks and Protected Areas as Providers of Human Health and Well-Being. J. Outdoor Recreat. Tour. 2015, 10, 70–77. [Google Scholar] [CrossRef]
  26. Terraube, J.; Fernández-Llamazares, Á.; Cabeza, M. The Role of Protected Areas in Supporting Human Health: A Call to Broaden the Assessment of Conservation Outcomes. Curr. Opin. Environ. Sustain. 2017, 25, 50–58. [Google Scholar] [CrossRef]
  27. Venter, Z.S.; Barton, D.N.; Gundersen, V.; Figari, H.; Nowell, M.S. Back to Nature: Norwegians Sustain Increased Recreational Use of Urban Green Space Months after the COVID-19 Outbreak. Landsc. Urban Plan. 2021, 214, 104175. [Google Scholar] [CrossRef]
  28. Adams, W.M. Biodiversity Conservation and the Eradication of Poverty. Science 2004, 306, 1146–1149. [Google Scholar] [CrossRef] [PubMed]
  29. Naidoo, R.; Gerkey, D.; Hole, D.; Pfaff, A.; Ellis, A.M.; Golden, C.D.; Herrera, D.; Johnson, K.; Mulligan, M.; Ricketts, T.H.; et al. Evaluating the Impacts of Protected Areas on Human Well-Being across the Developing World. Sci. Adv. 2019, 5, eaav3006. [Google Scholar] [CrossRef]
  30. United Nations. Transforming Our World: The 2030 Agenda for Sustainable Development; United Nations: New York, NY, USA, 2015. [Google Scholar]
  31. Adams, W.M.; Hutton, J. People, Parks and Poverty: Political Ecology and Biodiversity Conservation. Conserv. Soc. 2007, 5, 147–183. [Google Scholar]
  32. Cernea, M.M.; Schmidt-Soltau, K. Poverty Risks and National Parks: Policy Issues in Conservation and Resettlement. World Dev. 2006, 34, 1808–1830. [Google Scholar] [CrossRef]
  33. Ferraro, P.J. The Local Costs of Establishing Protected Areas in Low-Income Nations: Ranomafana National Park, Madagascar. Ecol. Econ. 2002, 43, 261–275. [Google Scholar] [CrossRef]
  34. Kelboro, G.; Stellmacher, T. Protected Areas as Contested Spaces: Nech Sar National Park, Ethiopia, between ‘Local People’, the State, and NGO Engagement. Environ. Dev. 2015, 16, 63–75. [Google Scholar] [CrossRef]
  35. Joppa, L. Population Change in and around Protected Areas. J. Ecol. Anthropol. 2012, 15, 58–64. [Google Scholar] [CrossRef][Green Version]
  36. Agrawal, A.; Redford, K. Conservation and Displacement: An Overview. Conserv. Soc. 2009, 7, 1–10. [Google Scholar] [CrossRef]
  37. Kliimask, J.; Parts, P.K.; Järv, H.; Sepp, K.; Ward, R. Endangered Settlements and Protected Areas in Estonia: The Challenge of Maintaining Cultural Landscapes. Int. J. Agric. Resour. Gov. Ecol. 2015, 11, 346. [Google Scholar] [CrossRef]
  38. Fjellstad, W.; Mittenzwei, K.; Dramstad, W.; Øvren, E. Landscape Protection as a Tool for Managing Agricultural Landscapes in Norway. Environ. Sci. Policy 2009, 12, 1144–1152. [Google Scholar] [CrossRef]
  39. Schmitz, M.F.; Matos, D.G.G.; De Aranzabal, I.; Pineda, F.D. Effects of a Protected Area on Land-Use Dynamics and Socioeconomic Development of Local Populations. Biol. Conserv. 2012, 149, 122–135. [Google Scholar] [CrossRef]
  40. Geldmann, J.; Coad, L.; Barnes, M.; Craigie, I.D.; Hockings, M.; Knights, K.; Leverington, F.; Cuadros, I.C.; Zamora, C.; Woodley, S.; et al. Changes in Protected Area Management Effectiveness over Time: A Global Analysis. Biol. Conserv. 2015, 191, 692–699. [Google Scholar] [CrossRef]
  41. Järv, H.; Ward, R.D.; Raet, J.; Sepp, K. Socio-Economic Effects of National Park Governance and Management: Lessons from Post-Socialist Era Estonia. Land 2021, 10, 1257. [Google Scholar] [CrossRef]
  42. Balmford, A.; Whitten, T. Who Should Pay for Tropical Conservation, and How Could the Costs Be Met? Oryx 2003, 37, 238–250. [Google Scholar] [CrossRef]
  43. Järv, H.; Shkaruba, A.; Likhacheva, O.; Kireyeu, V.; Ward, R.; Sepp, K. A Tale of Two Protected Areas: “Value and Nature Conservation” in Comparable National Parks in Estonia and Russia. Land 2021, 10, 274. [Google Scholar] [CrossRef]
  44. Schreckenberg, K.; Franks, P.; Martin, A.; Lang, B. Unpacking Equity for Protected Area Conservation. Parks 2016, 22, 11–28. [Google Scholar] [CrossRef]
  45. Ghoddousi, A.; Loos, J.; Kuemmrle, T. An Outcome-Oriented, Social-Ecological Framework for Assessing Protected Area Effectiveness. Bioscience 2021, 72, 201–212. [Google Scholar] [CrossRef]
  46. Oldekop, J.A.; Holmes, G.; Harris, W.E.; Evans, K.L. A Global Assessment of the Social and Conservation Outcomes of Protected Areas. Conserv. Biol. 2016, 30, 133–141. [Google Scholar] [CrossRef]
  47. Urbano, F.; Viterbi, R.; Pedrotti, L.; Vettorazzo, E.; Movalli, C.; Corlatti, L. Enhancing Biodiversity Conservation and Monitoring in Protected Areas through Efficient Data Management. Environ. Monit. Assess. 2023, 196, 12. [Google Scholar] [CrossRef]
  48. Otamendi-Urroz, I.; Quintas-Soriano, C.; Hanspach, J.; Requena-Mullor, J.M.; Lagies, A.S.; Castro, A.J. Exploring Biocultural Diversity: A Systematic Analysis and Refined Classification to Inform Decisions on Conservation and Sustainability. Ambio 2025, 54, 1581–1597. [Google Scholar] [CrossRef] [PubMed]
  49. Vári, Á.; Gonzalez, A.; Bennett, E.M. Monitor Social–Ecological Systems to Achieve Global Goals for Biodiversity and Nature’s Contributions to People. Bioscience 2025, 75, 276–280. [Google Scholar] [CrossRef]
  50. Corrigan, C.; Robinson, C.J.; Burgess, N.D.; Kingston, N.; Hockings, M. Global Review of Social Indicators Used in Protected Area Management Evaluation. Conserv. Lett. 2018, 11, e12397. [Google Scholar] [CrossRef]
  51. Borie, M.; Hulme, M. Framing Global Biodiversity: IPBES between Mother Earth and Ecosystem Services. Environ. Sci. Policy 2015, 54, 487–496. [Google Scholar] [CrossRef]
  52. Intergovernmental Platform on Biodiversity and Ecosystem Services (IPBES). The IPBES Conceptual Framework; IPBES Secretariat: Bonn, Germany, 2013. [Google Scholar]
  53. Alba-Patiño, D.; Martín-López, B.; Delibes-Mateos, M.; Requena-Mullor, J.M.; Castro, A.J. Environmental Justice Gaps in Human-Wildlife Conflict Research from a Social-Ecological Systems Perspective. Biol. Conserv. 2025, 312, 111515. [Google Scholar] [CrossRef]
  54. Dobrovodská, M.; Raniak, A. Assessment and Perception of Rural Socio-Ecological System Development in Suburban Conditions in Central Europe. Land Use Policy 2026, 164, 107938. [Google Scholar] [CrossRef]
  55. Senghor, K.; Partelow, S.; Herrera, C.G.; Osemwegie, I. Conflicting Governance Realities: Aligning Historical and Cultural Practices with Formal Marine Protected Area Co-Management in Senegal. Mar. Policy 2023, 155, 105706. [Google Scholar] [CrossRef]
  56. Shkaruba, A.; Mnatsakanian, R.; Molodikova, I.; Kireyeu, V.; Sepp, K. Why Is the Eutrophication Governance over the Lake of Baikal Failing? Land Use Governance Solutions Need to Account for Barriers across Sectors, Scales, and Actor Groups. Land Use Policy 2024, 141, 107136. [Google Scholar] [CrossRef]
  57. Ostrom, E. A General Framework for Analyzing Sustainability of Social-Ecological Systems. Science 2009, 325, 419–422. [Google Scholar] [CrossRef]
  58. Turnhout, E.; Neves, K.; de Lijster, E. ‘Measurementality’ in Biodiversity Governance: Knowledge, Transparency, and the Intergovernmental Science-Policy Platform on Biodiversity and Ecosystem Services (Ipbes). Environ. Plan. A Econ. Space 2014, 46, 581–597. [Google Scholar] [CrossRef]
  59. Soberón, J.; Peterson, A.T. Biodiversity Governance: A Tower of Babel of Scales and Cultures. PLoS Biol. 2015, 13, e1002108. [Google Scholar] [CrossRef]
  60. Li, Y.; Westlund, H.; Liu, Y. Why Some Rural Areas Decline While Some Others Not: An Overview of Rural Evolution in the World. J. Rural Stud. 2019, 68, 135–143. [Google Scholar] [CrossRef]
  61. Schmeller, D.S.; Bridgewater, P. Transformative Change in a Nexus World: Product and Process in the Eleventh Plenary of the Intergovernmental Science-Policy Platform on Biodiversity and Ecosystem Services (IPBES-11). Biodivers. Conserv. 2025, 34, 715–721. [Google Scholar] [CrossRef]
  62. IPBES. Summary for Policymakers of the Thematic Assessment Report on the Underlying Causes of Biodiversity Loss and the Determinants of Transformative Change and Options for Achieving the 2050 Vision for Biodiversity of the Intergovernmental Science-Policy Platform on Biodiversity and Ecosystem Services; O’Brien, K., Garibaldi, L.A., Agrawal, A., Bennett, E., Biggs, R., Calderón Contreras, R., Carr, E.R., Frantzeskaki, N., Gosnell, H., Gurung, J., et al., Eds.; Zenodo: Bonn, Germany, 2024. [Google Scholar] [CrossRef]
  63. IPBES. Summary for Policymakers of the Thematic Assessment Report on the Interlinkages Among Biodiversity, Water, Food and Health (Nexus Assessment); McElwee, P.D., Harrison, P.A., van Huysen, T.L., Alonso Roldán, V., Barrios, E., Dasgupta, P., De Clerck, F., Harmáčková, Z., Hayman, D.T.S., Herrero, M., et al., Eds.; Zenodo: Bonn, Germany, 2024. [Google Scholar] [CrossRef]
  64. Liu, D.; Li, F.; Qiu, M.; Zhang, Y.; Zhao, X.; He, J. An Integrated Framework for Measuring Sustainable Rural Development towards the SDGs. Land Use Policy 2024, 147, 107339. [Google Scholar] [CrossRef]
  65. Rõigas, A.; Veemaa, J.; Rennu, M. Marketing Intentional Communities in Rural Estonia. Nor. Geogr. Tidsskr. 2025, 79, 10–22. [Google Scholar] [CrossRef]
  66. Waltert, F.; Schläpfer, F. Landscape Amenities and Local Development: A Review of Migration, Regional Economic and Hedonic Pricing Studies. Ecol. Econ. 2010, 70, 141–152. [Google Scholar] [CrossRef]
  67. Halfacree, K. Trial by Space for a ‘Radical Rural’: Introducing Alternative Localities, Representations and Lives. J. Rural Stud. 2007, 23, 125–141. [Google Scholar] [CrossRef]
  68. Halfacree, K. Rural Space: Constructing a Three-Fold Architecture. In The Handbook of Rural Studies; Cloke, P., Marsden, T., Mooney, P., Eds.; SAGE: London, UK, 2006; pp. 44–62. [Google Scholar] [CrossRef]
  69. Boyle, P.J.; Keith, H. Migration into Rural Areas: Theories and Issues; Wiley: Hoboken, NJ, USA, 1998. [Google Scholar]
  70. Ilbery, B.; Bowler, I. From Agricultural Productivism to Post-Productivism. In The Geography of Rural Change; Ilbery, B., Ed.; Routledge: London, UK, 1998; pp. 57–84. [Google Scholar] [CrossRef]
  71. Argent, N.; Brown, D.L. The Impacts of Population Change on Rural Society and Economy. In Routledge International Handbook of Rural Studies; Shucksmith, M., Brown, D.L., Eds.; Routledge: Abingdon, UK, 2016; pp. 85–96. [Google Scholar]
  72. Dax, T.; Fischer, M. An Alternative Policy Approach to Rural Development in Regions Facing Population Decline. Eur. Plan. Stud. 2018, 26, 297–315. [Google Scholar] [CrossRef]
  73. OECD; European Union; European Commission; Joint Research Centre. Handbook on Constructing Composite Indicators: Methodology and User Guide; OECD: Paris, France, 2008. [Google Scholar] [CrossRef]
  74. Sisask, M. The Estonian Human Development Report 2023 “Mental Health and Well-Being”; Estonian Cooperation Assembly: Tallinn, Estonia, 2023. [Google Scholar]
  75. Antrop, M.; Van Eetvelde, V. Landscape Perspectives: The Holistic Nature of Landscape; Springer: Dordrecht, The Netherlands, 2017. [Google Scholar] [CrossRef]
  76. Wilson, J.B.; Peet, R.K.; Dengler, J.; Pärtel, M. Plant Species Richness: The World Records. J. Veg. Sci. 2012, 23, 796–802. [Google Scholar] [CrossRef]
  77. Geldmann, J.; Barnes, M.; Coad, L.; Craigie, I.D.; Hockings, M.; Burgess, N.D. Effectiveness of Terrestrial Protected Areas in Reducing Habitat Loss and Population Declines. Biol. Conserv. 2013, 161, 230–238. [Google Scholar] [CrossRef]
  78. Brown, D.L.; Schafft, K.A. Rural People and Communities in the 21st Century: Resilience and Transformation, 2nd ed.; Polity Press: Cambridge, UK, 2018. [Google Scholar]
  79. Sørensen, J.F.L. The Importance of Place-Based, Internal Resources for the Population Development in Small Rural Communities. J. Rural Stud. 2018, 59, 78–87. [Google Scholar] [CrossRef]
  80. Vu, T.T. A Practical Framework for Selecting and Interpreting Regression Models for Binary Outcomes in Social Science and Public Health Studies. Discov. Soc. Sci. Health 2026, 6, 11. [Google Scholar] [CrossRef]
  81. Rivera-Garrido, N.; Ramos-Sosa, M.P.; Accerenzi, M.; Brañas-Garza, P. Continuous and Binary Sets of Responses Differ in the Field. Sci. Rep. 2022, 12, 14376. [Google Scholar] [CrossRef] [PubMed]
  82. Suarez-Garcia, A.; Alvarez-Hernandez, M.; Arce, H.; Ribas, J.R. Exploring the Efficacy of Binary Surveys versus Likert Scale in Assessing Student Perspectives Using Bayesian Analysis. Appl. Sci. 2024, 14, 4189. [Google Scholar] [CrossRef]
  83. Cohen, J. The Cost of Dichotomization. Appl. Psychol. Meas. 1983, 7, 249–253. [Google Scholar] [CrossRef]
  84. Altman, D.G.; Royston, P. The Cost of Dichotomising Continuous Variables. BMJ 2006, 332, 1080. [Google Scholar] [CrossRef]
  85. Järv, H.; Kliimask, J.; Ward, R.; Sepp, K. Socioeconomic Impacts of Protection Status on Residents of National Parks. Eur. Countrys. 2016, 8, 67–85. [Google Scholar] [CrossRef]
  86. Kliimask, J.; Järv, H.; Sepp, K.; Ward, R. Nature Conservation in Remote Rural Areas: A Win-Win Situation? In Think Rural! Dünkel, F., Herbst, M., Schlegel, T., Eds.; Springer VS: Wiesbaden, Germany, 2014; pp. 193–208. [Google Scholar] [CrossRef]
  87. Bonet-García, F.J.; Pérez-Luque, A.J.; Moreno-Llorca, R.A.; Pérez-Pérez, R.; Puerta-Piñero, C.; Zamora, R. Protected Areas as Elicitors of Human Well-Being in a Developed Region: A New Synthetic (Socioeconomic) Approach. Biol. Conserv. 2015, 187, 221–229. [Google Scholar] [CrossRef]
  88. Terres, J.M.; Scacchiafichi, L.N.; Wania, A.; Ambar, M.; Anguiano, E.; Buckwell, A.; Coppola, A.; Gocht, A.; Källström, H.N.; Pointereau, P.; et al. Farmland Abandonment in Europe: Identification of Drivers and Indicators, and Development of a Composite Indicator of Risk. Land Use Policy 2015, 49, 20–34. [Google Scholar] [CrossRef]
  89. Statistics Estonia. Available online: https://stat.ee/en (accessed on 18 February 2026).
  90. Eurostat. Demography of Europe—2025 Edition; Publications Office of the European Union: Luxembourg, 2025. [Google Scholar]
  91. Independent Group of Scientists Appointed by the Secretary-General. Global Sustainable Development Report 2019: The Future Is Now—Science for Achieving Sustainable Development; United Nations: New York, NY, USA, 2019. [Google Scholar]
  92. Printsmann, A.; Nugin, R.; Palang, H. Intricacies of Moral Geographies of Land Restitution in Estonia. Land 2022, 11, 235. [Google Scholar] [CrossRef]
  93. Balockaite, R. Post-Soviet Transitions of the Planned Socialist Towns: Visaginas, Lithuania. Stud. Transit. States Soc. 2010, 2, 63–81. [Google Scholar]
  94. Correa, M. Working from a New Home? Remote-Work Potential and Urban out-Migration in Sweden. Spat. Econ. Anal. 2025, 20, 266–290. [Google Scholar] [CrossRef]
  95. Stenseke, M. The Intergovernmental Science-Policy Platform on Biodiversity and Ecosystem Services and the Challenge of Integrating Social Sciences and Humanities. Bull. Geogr. Socio-Econ. Ser. 2016, 33, 119–129. [Google Scholar] [CrossRef][Green Version]
  96. Cumming, G.; Allen, C. Protected Areas as Social-Ecological Systems: Perspectives from Resilience and Social-Ecological Systems Theory. Ecol. Appl. 2017, 27, 1709–1717. [Google Scholar] [CrossRef] [PubMed]
  97. Leverington, F.; Costa, K.L.; Pavese, H.; Lisle, A.; Hockings, M. A Global Analysis of Protected Area Management Effectiveness. Environ. Manag. 2010, 46, 685–698. [Google Scholar] [CrossRef]
  98. Borrini-Feyerabend, G.; Johnston, J.; Pansky, D. Governance of Protected Areas. In Protected Areas Management: A Global Guide; Lockwood, M., Worboys, G.L., Kothari, A., Eds.; Earthscan: Sterling, VA, USA; London, UK, 2006; pp. 116–145. [Google Scholar]
  99. Boarini, R.; Kolev, A.; McGregor, A. Measuring Well-Being and Progress in Countries at Different Stages of Development: Towards a More Universal Conceptual Framework; OECD Publishing: Paris, France, 2014; Volume 325. [Google Scholar]
  100. Sánchez-Moral, S.; Arellano, A.; Díez-Pisonero, R. The Impact of Remote Working on Residential Mobility in the Metropolitan Region of Madrid. Cities 2026, 169, 106462. [Google Scholar] [CrossRef]
  101. Knuepling, L.; Sternberg, R.; Otto, A. Rural Areas as Winners of COVID-19, Digitalization and Remote Working? Empirical Evidence from Recent Internal Migration in Germany. Camb. J. Reg. Econ. Soc. 2025, 18, 227–248. [Google Scholar] [CrossRef]
  102. González-Leonardo, M.; Rowe, F.; Fresolone-Caparrós, A. Rural Revival? The Rise in Internal Migration to Rural Areas during the COVID-19 Pandemic. Who Moved and Where? J. Rural Stud. 2022, 96, 332–342. [Google Scholar] [CrossRef]
  103. Manapragada, N.V.S.K.; Mandelmilch, M.; Roitberg, E.; Kizel, F.; Natanian, J. Remote Sensing for Environmentally Responsive Urban Built Environment: A Review of Tools, Methods and Gaps. Remote Sens. Appl. 2025, 38, 101529. [Google Scholar] [CrossRef]
  104. Liu, P.; Liu, X.; Liu, M.; Shi, Q.; Yang, J.; Xu, X.; Zhang, Y. Building Footprint Extraction from High-Resolution Images via Spatial Residual Inception Convolutional Neural Network. Remote Sens. 2019, 11, 830. [Google Scholar] [CrossRef]
  105. Weng, Q. Remote Sensing of Impervious Surfaces in the Urban Areas: Requirements, Methods, and Trends. Remote Sens. Environ. 2012, 117, 34–49. [Google Scholar] [CrossRef]
  106. Matthiessen, C.W. The Öresund Area: Pre- and Post-Bridge Cross-Border Functional Integration: The Bi-National Regional Question. GeoJournal 2004, 61, 31–39. [Google Scholar] [CrossRef]
  107. Nauwelaers, C.; Maguire, K.; Marsan, G.A. The Case of Oresund (Denmark-Sweden)—Regions and Innovation: Collaborating Across Borders; OECD Regional Development Working Papers; OECD Publishing: Paris, France, 2013; Volume 21. [Google Scholar] [CrossRef]
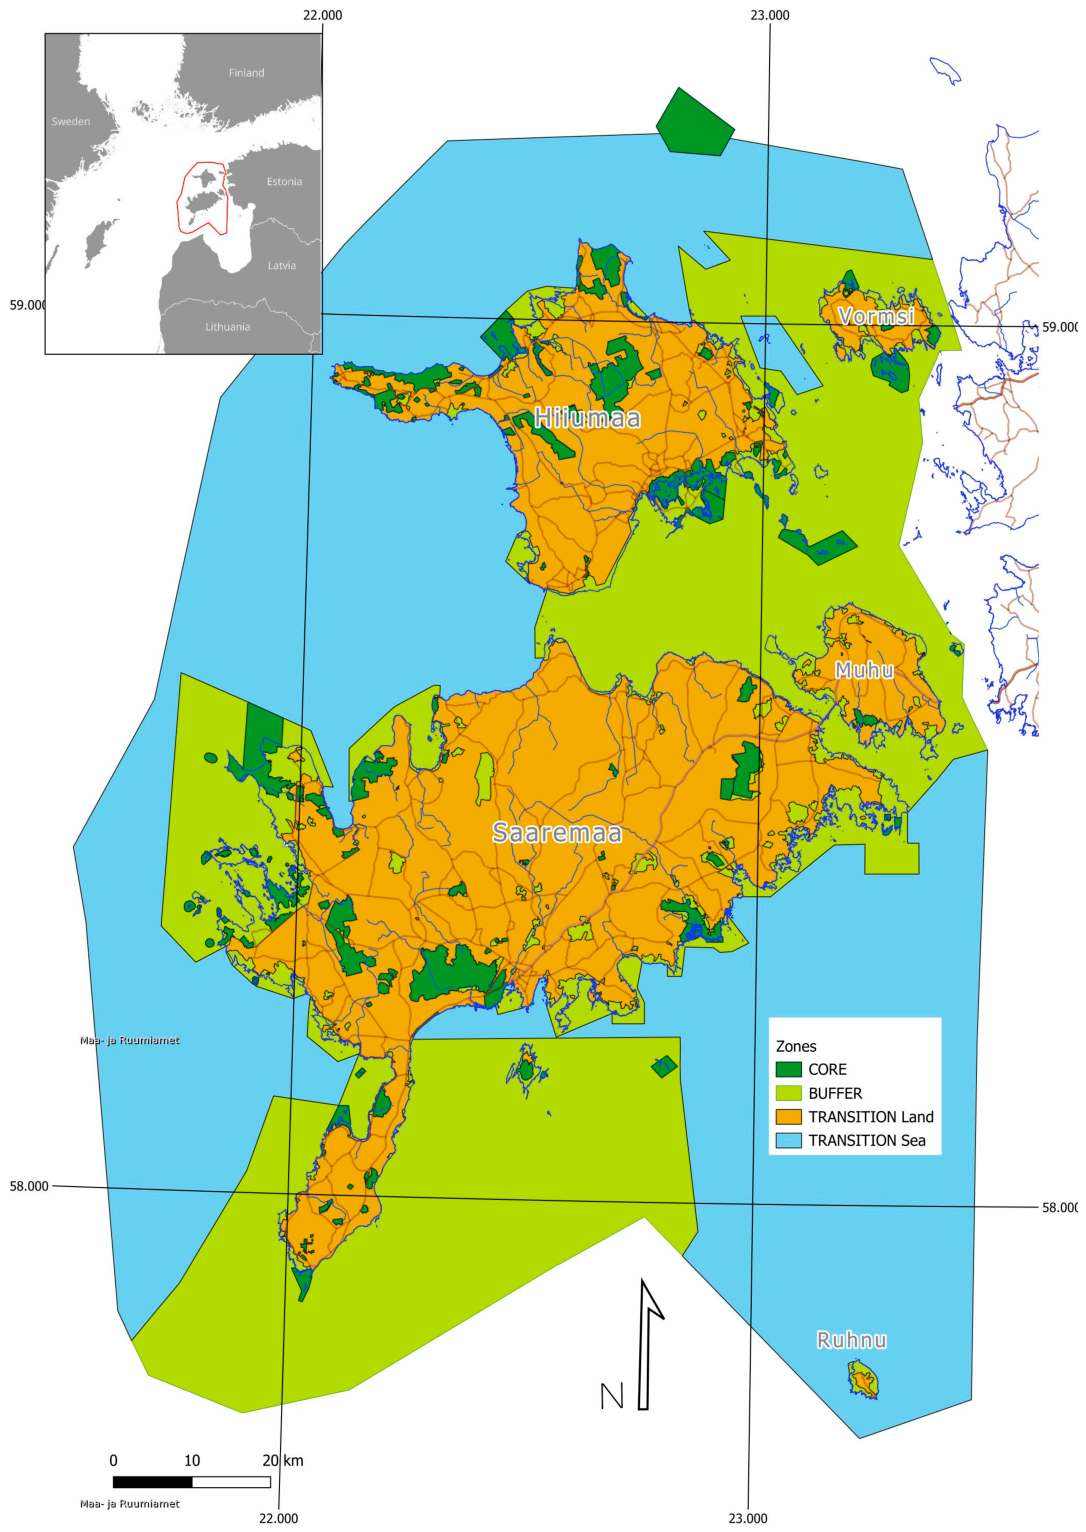
Figure 1. The location and zoning of the West Estonian Archipelago Biosphere Reserve. Coordinate system WGS84.
Land 15 00719 g001
Figure 2. Spatial distribution of West Estonian Archipelago Biosphere Reserve settlements according to previously determined viability classes. Coordinate system WGS84.
Land 15 00719 g002
Table 1. Categorization of settlement viability.
Number of Positive IndicatorsInterpretationDescription
3Highly viableThe number of residents is growing, new housing is being built, and the number of young residents exceeds that of older residents. These are the most dynamic and sustainable places.
1–2ViableOne or two of the three indicators are positive. Although one or two components may be weaker (e.g., a predominance of older residents), positive development is nevertheless occurring, indicating principal potential.
0StagnatingNo measurable positive development has occurred during the observed period. This does not necessarily mean the settlement is completely unviable, but at best, the current situation indicates stagnation.
Table 2. Proportion of rural settlements with positive values relative to the total number of studied settlements (%).
1979–19892000–20112011–2021
Population dynamics (stable or growing)262942
Residential construction activity (new housing was built)494536
Age structure of residents (ratio of population aged 0–17 to population aged 65+ is ≥1)553427
Table 3. Distribution of rural settlements in the West Estonian Archipelago Biosphere Reserve according to viability categories as the share (%) of total studied settlements.
198920112021
Highly viable settlements1487
Viable settlements606363
Stagnating settlements262426
Uninhabited settlements054
TOTAL100100100
Table 4. Distribution of rural settlements according to viability categories as share (%) of total studied settlements in West Estonian Archipelago Biosphere Reserve (WEABR).
WEABREstonia
Total
Harju
County
Average of 11
Rural Counties
Highly viable78285
Viable63585757
Stagnating26321335
Uninhabited4212
Total100100100100
Disclaimer/Publisher’s Note: The statements, opinions and data contained in all publications are solely those of the individual author(s) and contributor(s) and not of MDPI and/or the editor(s). MDPI and/or the editor(s) disclaim responsibility for any injury to people or property resulting from any ideas, methods, instructions or products referred to in the content.