Article

Spatiotemporal Dynamics of Deep Soil Organic Carbon and Its Response to Agricultural Management: Evidence from Long-Term Monitoring Data in Typical Farmlands in China

1
School of Economics and Management, Hainan Normal University, Haikou 571158, China
2
School of Economics and Trade, Hunan University, Changsha 410079, China
*
Author to whom correspondence should be addressed.
Land 2026, 15(4), 676; https://doi.org/10.3390/land15040676
Submission received: 28 February 2026 / Revised: 9 April 2026 / Accepted: 13 April 2026 / Published: 20 April 2026

Abstract

Understanding the dynamics of soil organic carbon (SOC) in farmland is crucial for assessing soil health, quantifying ecosystem potential for SOC enrichment, and guiding sustainable agricultural management. Existing research on SOC sequestration and mineralization has focused mainly on the topsoil layer (0–20 cm), whereas systematic evidence on how deep SOC (>20 cm) responds to agricultural management, and on strategies to enhance deep carbon sequestration, remains limited. This study uses long-term fixed-site monitoring data from 120 farmland plots across 21 typical farmland ecosystem stations and farmland–complex ecosystem stations within the Chinese Ecosystem Research Network (CERN) over 17 years (2004–2020). Using spatial analysis, we characterize the spatiotemporal dynamics of SOC below 20 cm along soil profiles across seven major geographical zones in China. We then estimate the heterogeneous effects of fertilization and straw-management practices (S, straw returning; SCF, straw returning with chemical fertilizer; OF, organic fertilizer; OCF, organic fertilizer with chemical fertilizer), tillage modes, and farmland types on SOC in the 20–40 cm, 40–60 cm, and 60–100 cm layers using a panel fixed-effects model. The results indicate pronounced vertical heterogeneity in SOC below 20 cm and a clear spatial gradient. The 60–100 cm layer shows a significant increase in SOC content during the study period, with a cumulative increase of 4.07%. Relative to single organic inputs, the co-application of organic and inorganic materials improves deep soil SOC enhancement efficiency. Compared with reduced tillage and no-tillage, conventional tillage is less conducive to SOC enhancement in layers shallower than 60 cm, yet it has a significant positive impact on SOC in the 60–100 cm layer. Compared with dryland and irrigated land, paddy fields are less favorable for SOC enhancement below 20 cm. Consequently, regarding agricultural practice, a composite tillage regime combining “surface conservation tillage with periodic deep tillage” should be promoted to foster deep SOC enhancement.

1. Introduction

The farmland soil carbon pool is the only carbon pool within the global terrestrial ecosystem that experiences strong human disturbance and remains adjustable over relatively short timescales [1,2]. As a substantial but often overlooked carbon reservoir, SOC below 20 cm in farmland soil profiles influences multiple ecological processes, including crop growth and nutrient translocation, and plays a pivotal role in enhancing soil carbon sequestration, sustaining farmland ecosystem services, and addressing climate change [3]. Although the impact of agricultural management on surface soil (0–20 cm) is more intuitive and readily measurable, recent evidence indicates that it is particularly in certain regions that deep soil carbon pools (>20 cm) have also been significantly affected by agricultural management and can influence global carbon cycling through soil–atmosphere carbon exchange [4,5].
Since the National Research Council defined Earth’s critical zones in 2001 [6], research into soil carbon cycling has increasingly probed beyond surface layers [7,8]. Despite this shift, systematically characterizing long-term deep SOC patterns remains challenging, largely due to observational constraints and the fragmentation of monitoring data [9,10,11]. In China, one of the world’s largest agricultural producers, the stability of deep SOC is particularly vulnerable to the synergistic pressures of climate warming and intensive agronomic practices, including tillage and fertilization [12,13]. Therefore, elucidating SOC dynamics at depths exceeding 20 cm in representative Chinese farmlands, coupled with its response to different fertilization and straw-management practices, is critical for securing this carbon reservoir and formulating effective climate adaptation strategies. In light of this, this study utilized the long-term fixed-site monitoring system of the Chinese Ecosystem Research Network (CERN) to compile data from 120 typical farmlands in China over a 17-year period (2004–2020). Through statistical analysis, spatial analysis, and econometric models, we systematically revealed the spatiotemporal dynamics of deep SOC in these farmlands, as well as its response to agricultural management.
Compared with the existing work, the main contributions of this study can be summarized as follows. First, this study systematically revealed the impact of different agricultural-management practices on SOC in soil layers deeper than 20 cm in typical farmland ecosystems in China. Existing research has primarily focused on the correlation between agricultural management and SOC in the tillage layer [14]. The biogeochemical processes governing deep SOC differ significantly from those in surface layers [15,16]. While traditional theories attribute the high stability of deep SOC to physicochemical protection, recent evidence suggests its activity is substantially enhanced by root exudate inputs and soil disturbance [17]. Crucially, this destabilization is often modulated by nutrient availability, particularly nitrogen and stoichiometric constraints, in which microbial decomposition is limited by resource imbalances [18]. Consequently, relying solely on surface SOC assessments may obscure the impacts of agricultural practices on deep carbon dynamics [19,20].
Second, in contrast to traditional methods that rely on remote sensing and local monitoring data to estimate SOC in farmland [21], this study employs fixed-site monitoring data acquired from 120 representative farmlands across 21 agro-ecological stations within CERN. It systematically quantifies the spatiotemporal dynamics of SOC in soil layers below 20 cm in typical farmlands across seven major geographical regions in China. This dataset has two advantages. On the one hand, through large-scale and long-term systematic observations, it enables us to distinguish short-term fluctuations from long-term trends in deep SOC. This overcomes the limitations of small-scale monitoring in identifying inter-group correlations and avoids the inherent limitation of limited accuracy in remote sensing inversion [22,23,24]. On the other hand, the management measures of typical farmlands are characterized by a structural consistency, under which practices such as tillage, fertilization, and straw retention remain invariant following their initial establishment. It is this temporal stability that renders agricultural management plausibly exogenous in our econometric model, enabling a more accurate identification of its effects on deep SOC dynamics.
Third, Wang et al. [25] demonstrated that, compared to unfertilized controls or the sole application of chemical fertilizers, the exclusive use of straw returning or organic fertilizers effectively enhances SOC content within the 0–100 cm soil profile. However, they did not further explore the differential effects of different fertilization and straw-management practices on specific sub-layers (i.e., 20–40 cm, 40–60 cm, and 60–100 cm). Furthermore, the exact depth interval responsible for the overall increase in SOC within the 0–100 cm profile remained unclear (e.g., the increase in the 0–100 cm layer could be driven by the 0–40 cm layer or the 60–100 cm layer). To address this knowledge gap, this study employed econometric models to investigate the heterogeneous effects of different fertilization and straw-management practices (S, straw returning; SCF, straw returning with chemical fertilizer; OF, organic fertilizer; OCF, organic fertilizer with chemical fertilizer), tillage modes, and farmland types on SOC across the 20–40, 40–60, and 60–100 cm soil layers.

2. Materials and Methods

2.1. Study Area

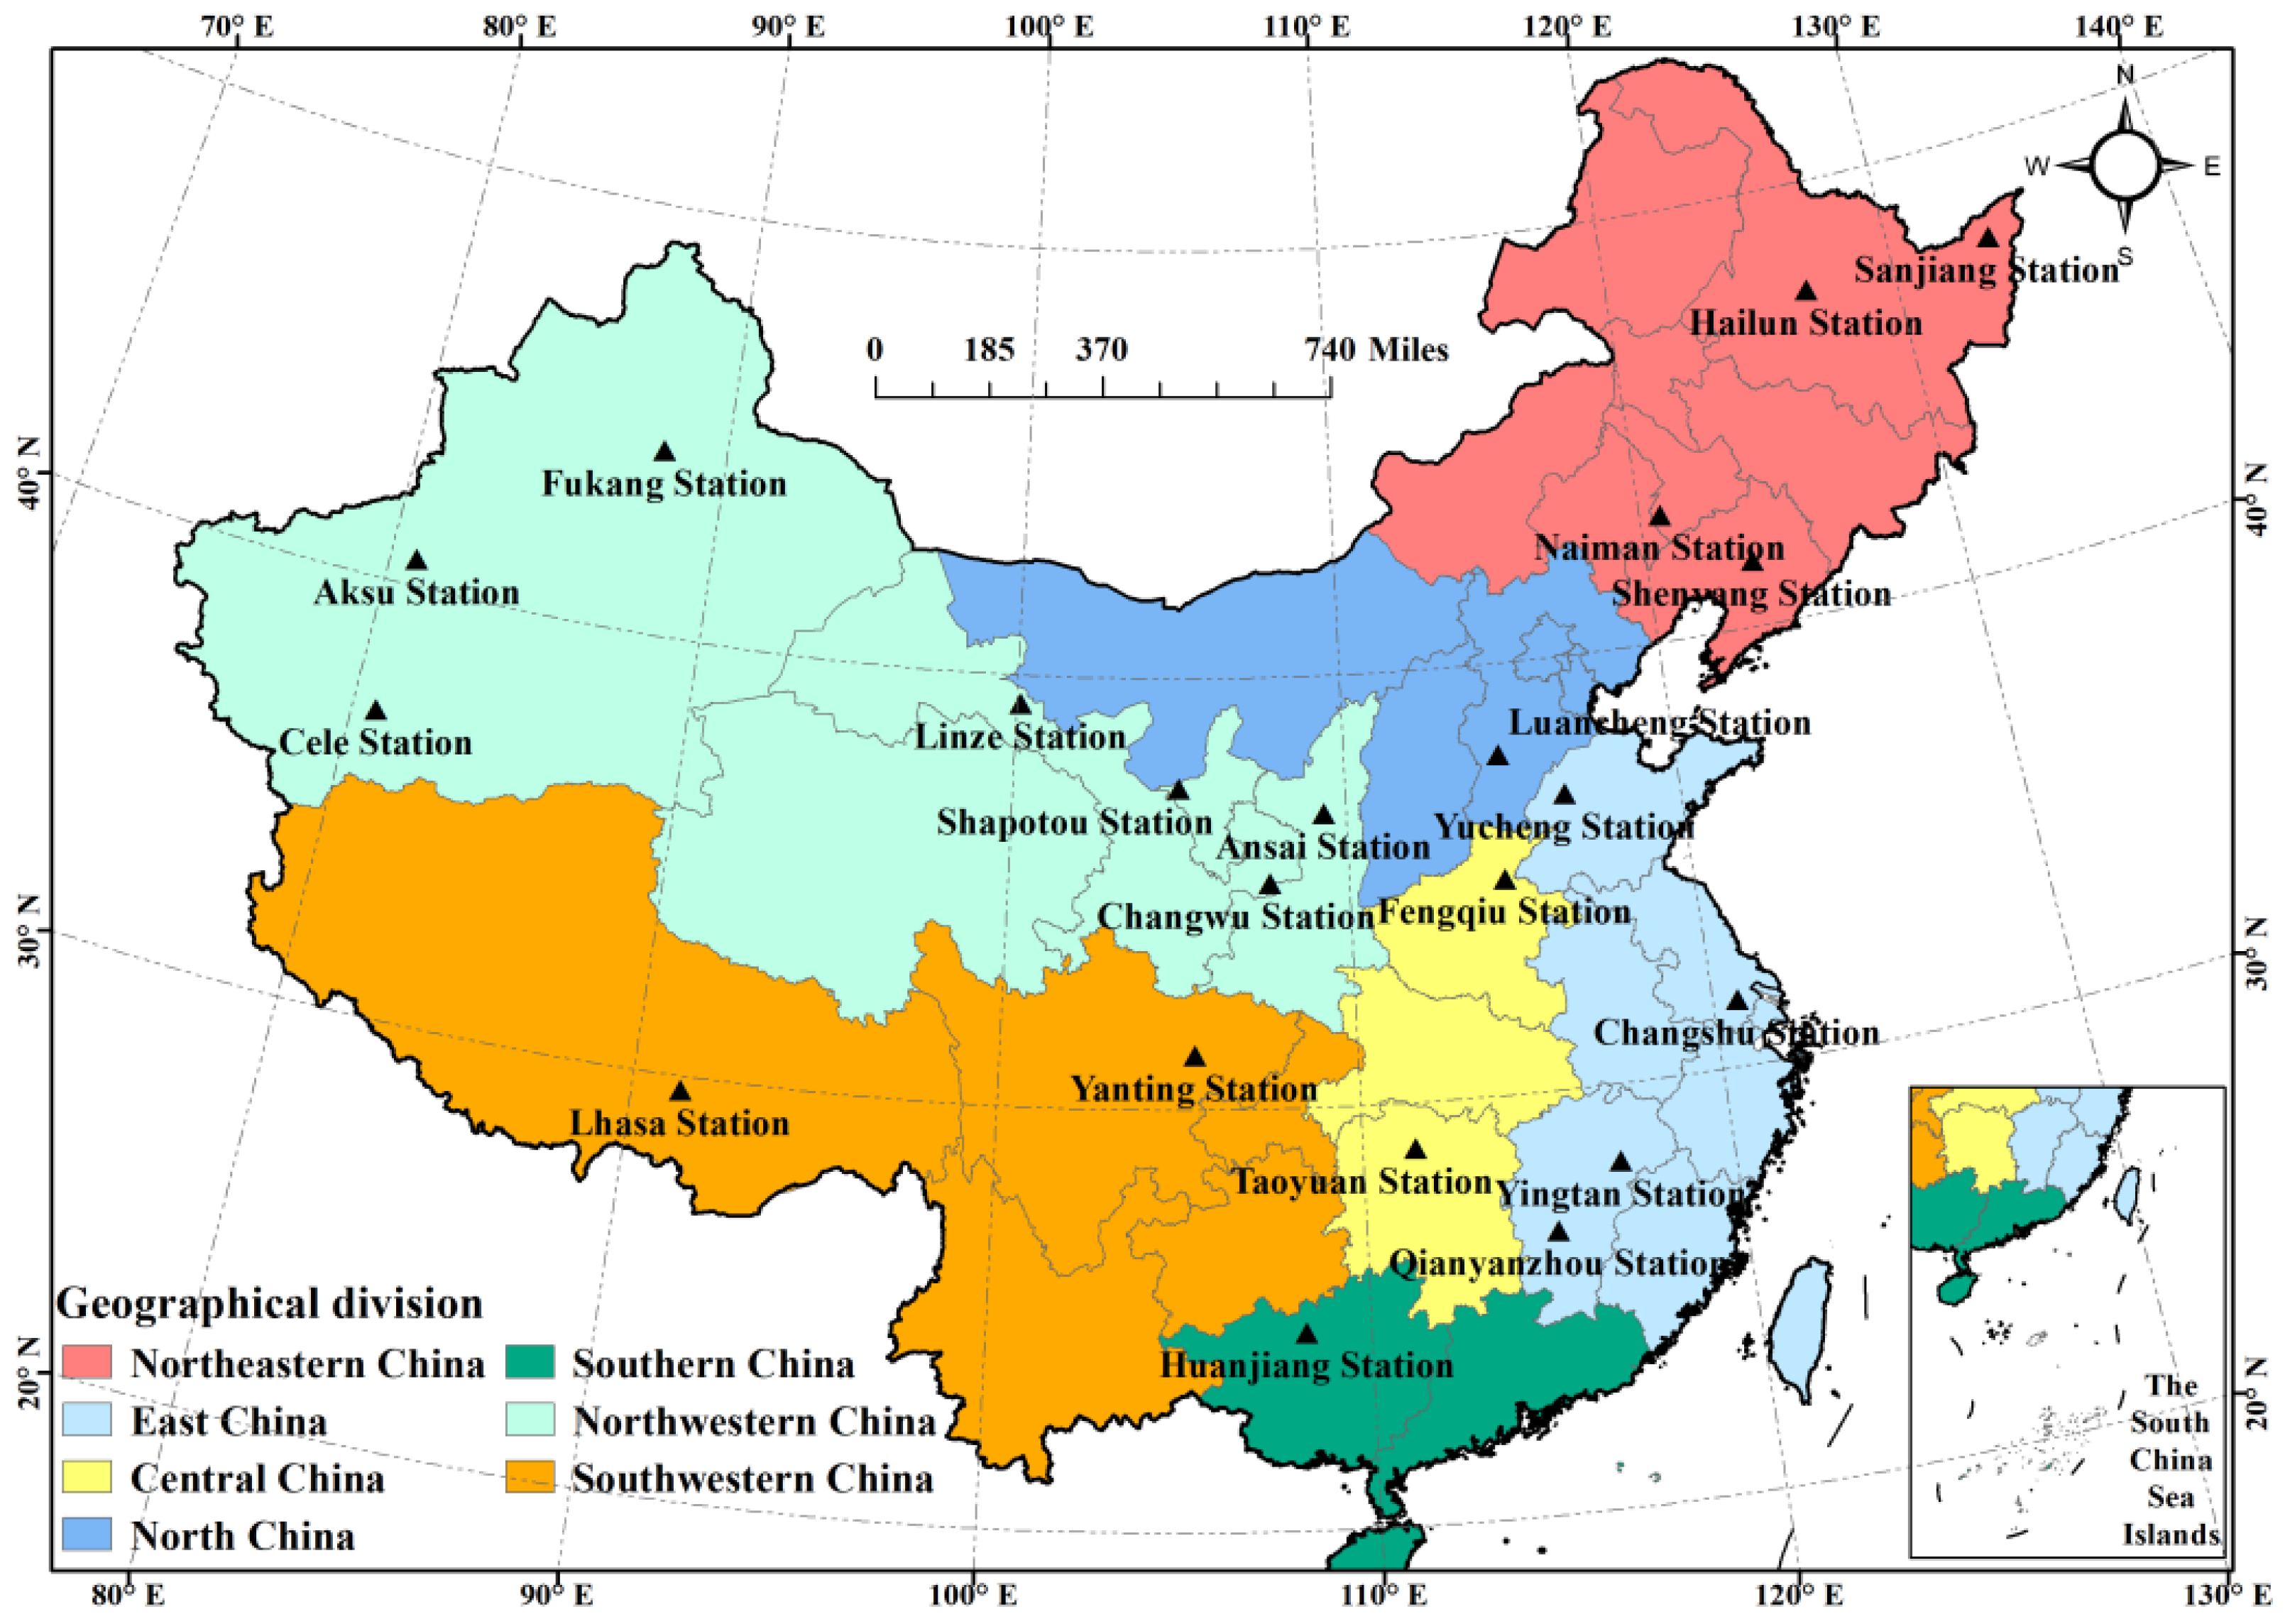
This study uses data from 120 long-term monitoring plots situated within 21 typical farmland and farmland–complex ecosystem stations within CERN. Spanning seven major geographical regions (Northeastern, Northern, Central, Southern, Eastern, Northwestern, and Southwestern China), the classification of which is based on administrative divisions. These stations encompass diverse climatic zones in which the key environmental variables driving SOC dynamics exhibit substantial variation. Detailed site locations and regional classifications are shown in Figure 1.

2.2. Data Sources and Variable Selection

Definitions of “deep soil” vary across studies depending on research objectives. The 0–20 cm soil layer serves as the primary tillage layer in agricultural practices, and SOC within this depth range is highly susceptible to agricultural management [3]. Consequently, by designating the soil profile at depths exceeding 20 cm as the deep layer, this study examines the spatiotemporal dynamics of deep SOC in the farmland soil profile, as well as its response to agricultural management. Data were primarily compiled from 120 long-term monitoring plots across 21 typical farmland and farmland–complex ecosystem stations within CERN, all of which have undergone continuous observation and sampling since 2004. Plot establishments and sampling protocols were implemented following the CERN ecosystem monitoring standards to ensure sample representativeness. Detailed monitoring protocols are available on the National Ecosystem Science Data Center website (www.cnern.org.cn).
In the empirical analysis, the dependent variables are SOC content in the 20–40 cm, 40–60 cm, and 60–100 cm soil layers of typical farmland. The explanatory variables primarily consist of three types of agricultural-management factors that affect farmland soil [26,27]. The first category encompasses different fertilization and straw-management practices; standardized protocols were applied across all 120 representative farmland plots [28,29,30]. The second category encompasses different tillage modes, including conventional tillage and reduced tillage [31,32,33]. The third category comprises different types of farmland, including paddy fields, dryland, and irrigated land [34]. Control variables include two categories of natural factors influencing farmland SOC. The first category consists of climatic and topographic factors, encompassing ground temperature, precipitation, and altitude [35,36]. It should be noted that, unlike prior studies controlling temperature and topography [37], this study focuses on subsoil SOC dynamics and its response to agricultural management. Therefore, we control climate factors such as ground temperature, which have a more significant impact on deep SOC [38]. The second category pertains to soil physicochemical properties, encompassing soil bulk density, soil pH, the proportion of clay particles smaller than 0.002 mm, and initial SOC content [39]. Table 1 summarizes variable definitions and descriptive statistics.
The mean temperature and total precipitation during the crop growing season at each site were derived from the daily gridded meteorological dataset provided by the National Climate Center, from which temperature and precipitation data for the 21 typical farmland ecosystem sites were extracted. Data on the tillage mode, crop types, ground temperature, soil pH, and the proportion of clay particles at each site were obtained from CERN. All the aforementioned data were monitored individually at each site and subsequently compiled into the CERN database. The soil data were generally monitored annually during the harvest period.

2.3. Soil Organic Carbon Calculation

The 21 typical farmland and farmland–complex ecosystem stations in CERN, which incorporate different agricultural-management practices, collect soil organic matter (SOM) content data across all soil layers once per season during harvest surveys. The determination of SOM was performed utilizing the potassium dichromate oxidation–external heating method, strictly adhering to the Chinese National Standard (GB/T 7857—1987 [40]). Since this study aims to explore the spatiotemporal dynamics of SOC content in soil layers below 20 cm in farmland soil profiles and its response to agricultural management, it is necessary to convert SOM content data into SOC content data. To achieve this, the conventional van Bemmelen factor of 1.724 was applied [41]. Although the carbon fraction of SOM may exhibit vertical variability within subsoils, it is China’s Technical Specification for National Cultivated Land Quality Monitoring (NY/T 1119-2019 [42]) that supports this approach by specifying the uniform application of the 1.724 factor across all farmland soil layers from 0 to 100 cm. The calculation formula for SOC content in the 20–40 cm soil layer is presented in Equation (1).
S O C 20 40 cm = S O M 20 40 cm 1.724
where SOC denotes the soil organic carbon (g/kg), and SOM denotes the soil organic matter content in a given soil layer (g/kg). The calculation method of SOC content in the 40–60 cm and 60–100 cm soil layers is similar to Equation (1) and is obtained by converting the SOM content in each soil layer.

2.4. Model Setting

A panel fixed-effects model, suitable for continuous dependent variables and capable of controlling for unobserved heterogeneity, was employed for regression analysis [43]. By incorporating station-level fixed effects, the model controlled for all time-invariant site-specific factors, including soil types, soil profile depth, and pedogenic processes that vary across the 21 monitoring stations. These fixed effects capture inherent differences in potential for SOC enrichment arising from variations in soil properties and formation conditions that remain constant over the study period but differ systematically across locations, thereby yielding unbiased estimates of the effects of agricultural management on farmland SOC. Moreover, to address potential issues of heteroscedasticity and serial autocorrelation within monitoring stations, standard errors were clustered at the individual station level.

2.4.1. Marginal Impact of Different Fertilization and Straw-Management Practices on Deep SOC

The fertilization and straw-management methods of 120 typical farmlands are categorized into six types: single straw returning (S), straw returning combined with chemical fertilizer (SCF), single organic fertilizer (OF), organic fertilizer combined with chemical fertilizer (OCF), single chemical fertilizer (CF), and no fertilization (NF). In the empirical analysis, these six methods are grouped into five categories for subsample analysis. Specifically, in Groups 1–4, the control group is NF or CF, and the treatment group is S, SCF, OF, or OCF. In Group 5, the control group is NF, and the treatment group is CF. The model is specified as follows:
S O C i t h = α 1 + β F e r t i t + γ M e a s u r e i t + δ C l i m a t e i t h + φ P r o p e r t i e s i t h + η k + λ t + ε i t
where SOCith represents the SOC content of different soil layers in a typical farmland. Fertit denotes different fertilization and straw-management methods, while Measureit represents agricultural-management factors other than fertilization and straw management. Climateith encompasses natural factors such as ground temperature, while Propertiesith signifies soil physicochemical properties such as soil pH. β, γ, δ, and φ are regression coefficients to be estimated. ηk represents the station-level fixed effects for the 21 typical farmland and farmland–complex ecosystem stations, which account for unobserved time-invariant heterogeneity, including the soil type, profile depth, rotation system, and redox processes. λt denotes the year fixed effect, controlling for temporal trends common to all stations, and εit is the error term.

2.4.2. Marginal Impact of Different Tillage Modes on Deep SOC

In the empirical analysis framework examining the marginal impact of different tillage modes on deep SOC, the dependent variable remains unchanged from Equation (2). When the tillage mode is conventional, it is assigned a value of 1, whereas a value of 0 is assigned for reduced tillage or no-tillage. The model is specified as follows:
S O C i t h = α 2 + β C u l t i i t + γ M e a s u r e i t + δ C l i m a t e i t h + φ P r o p e r t i e s i t h + η k + λ t + ε i t
where Cultiit represents the tillage-mode variable, and the meanings of all other variables are identical to those in Equation (2).

2.4.3. Marginal Impact of Different Types of Farmland on Deep SOC

To quantify the marginal impact of farmland type on deep SOC, a binary variable was introduced to isolate the specific effect of paddy fields. In this classification, paddy fields are assigned a value of 1, whereas dryland and irrigated lands are consolidated into the reference category (0), against which the relative influence of paddy ecosystems is evaluated. The model is specified as follows:
S O C i t h = α 3 + β P a d d y i t + γ M e a s u r e i t + δ C l i m a t e i t h + φ P r o p e r t i e s i t h + η k + λ t + ε i t
where Paddyit represents the farmland-type variable, and the meanings of the remaining variables are consistent with Equations (2) and (3).

3. Results

3.1. Spatiotemporal Dynamics of Deep SOC in Typical Farmland

3.1.1. Temporal Variation

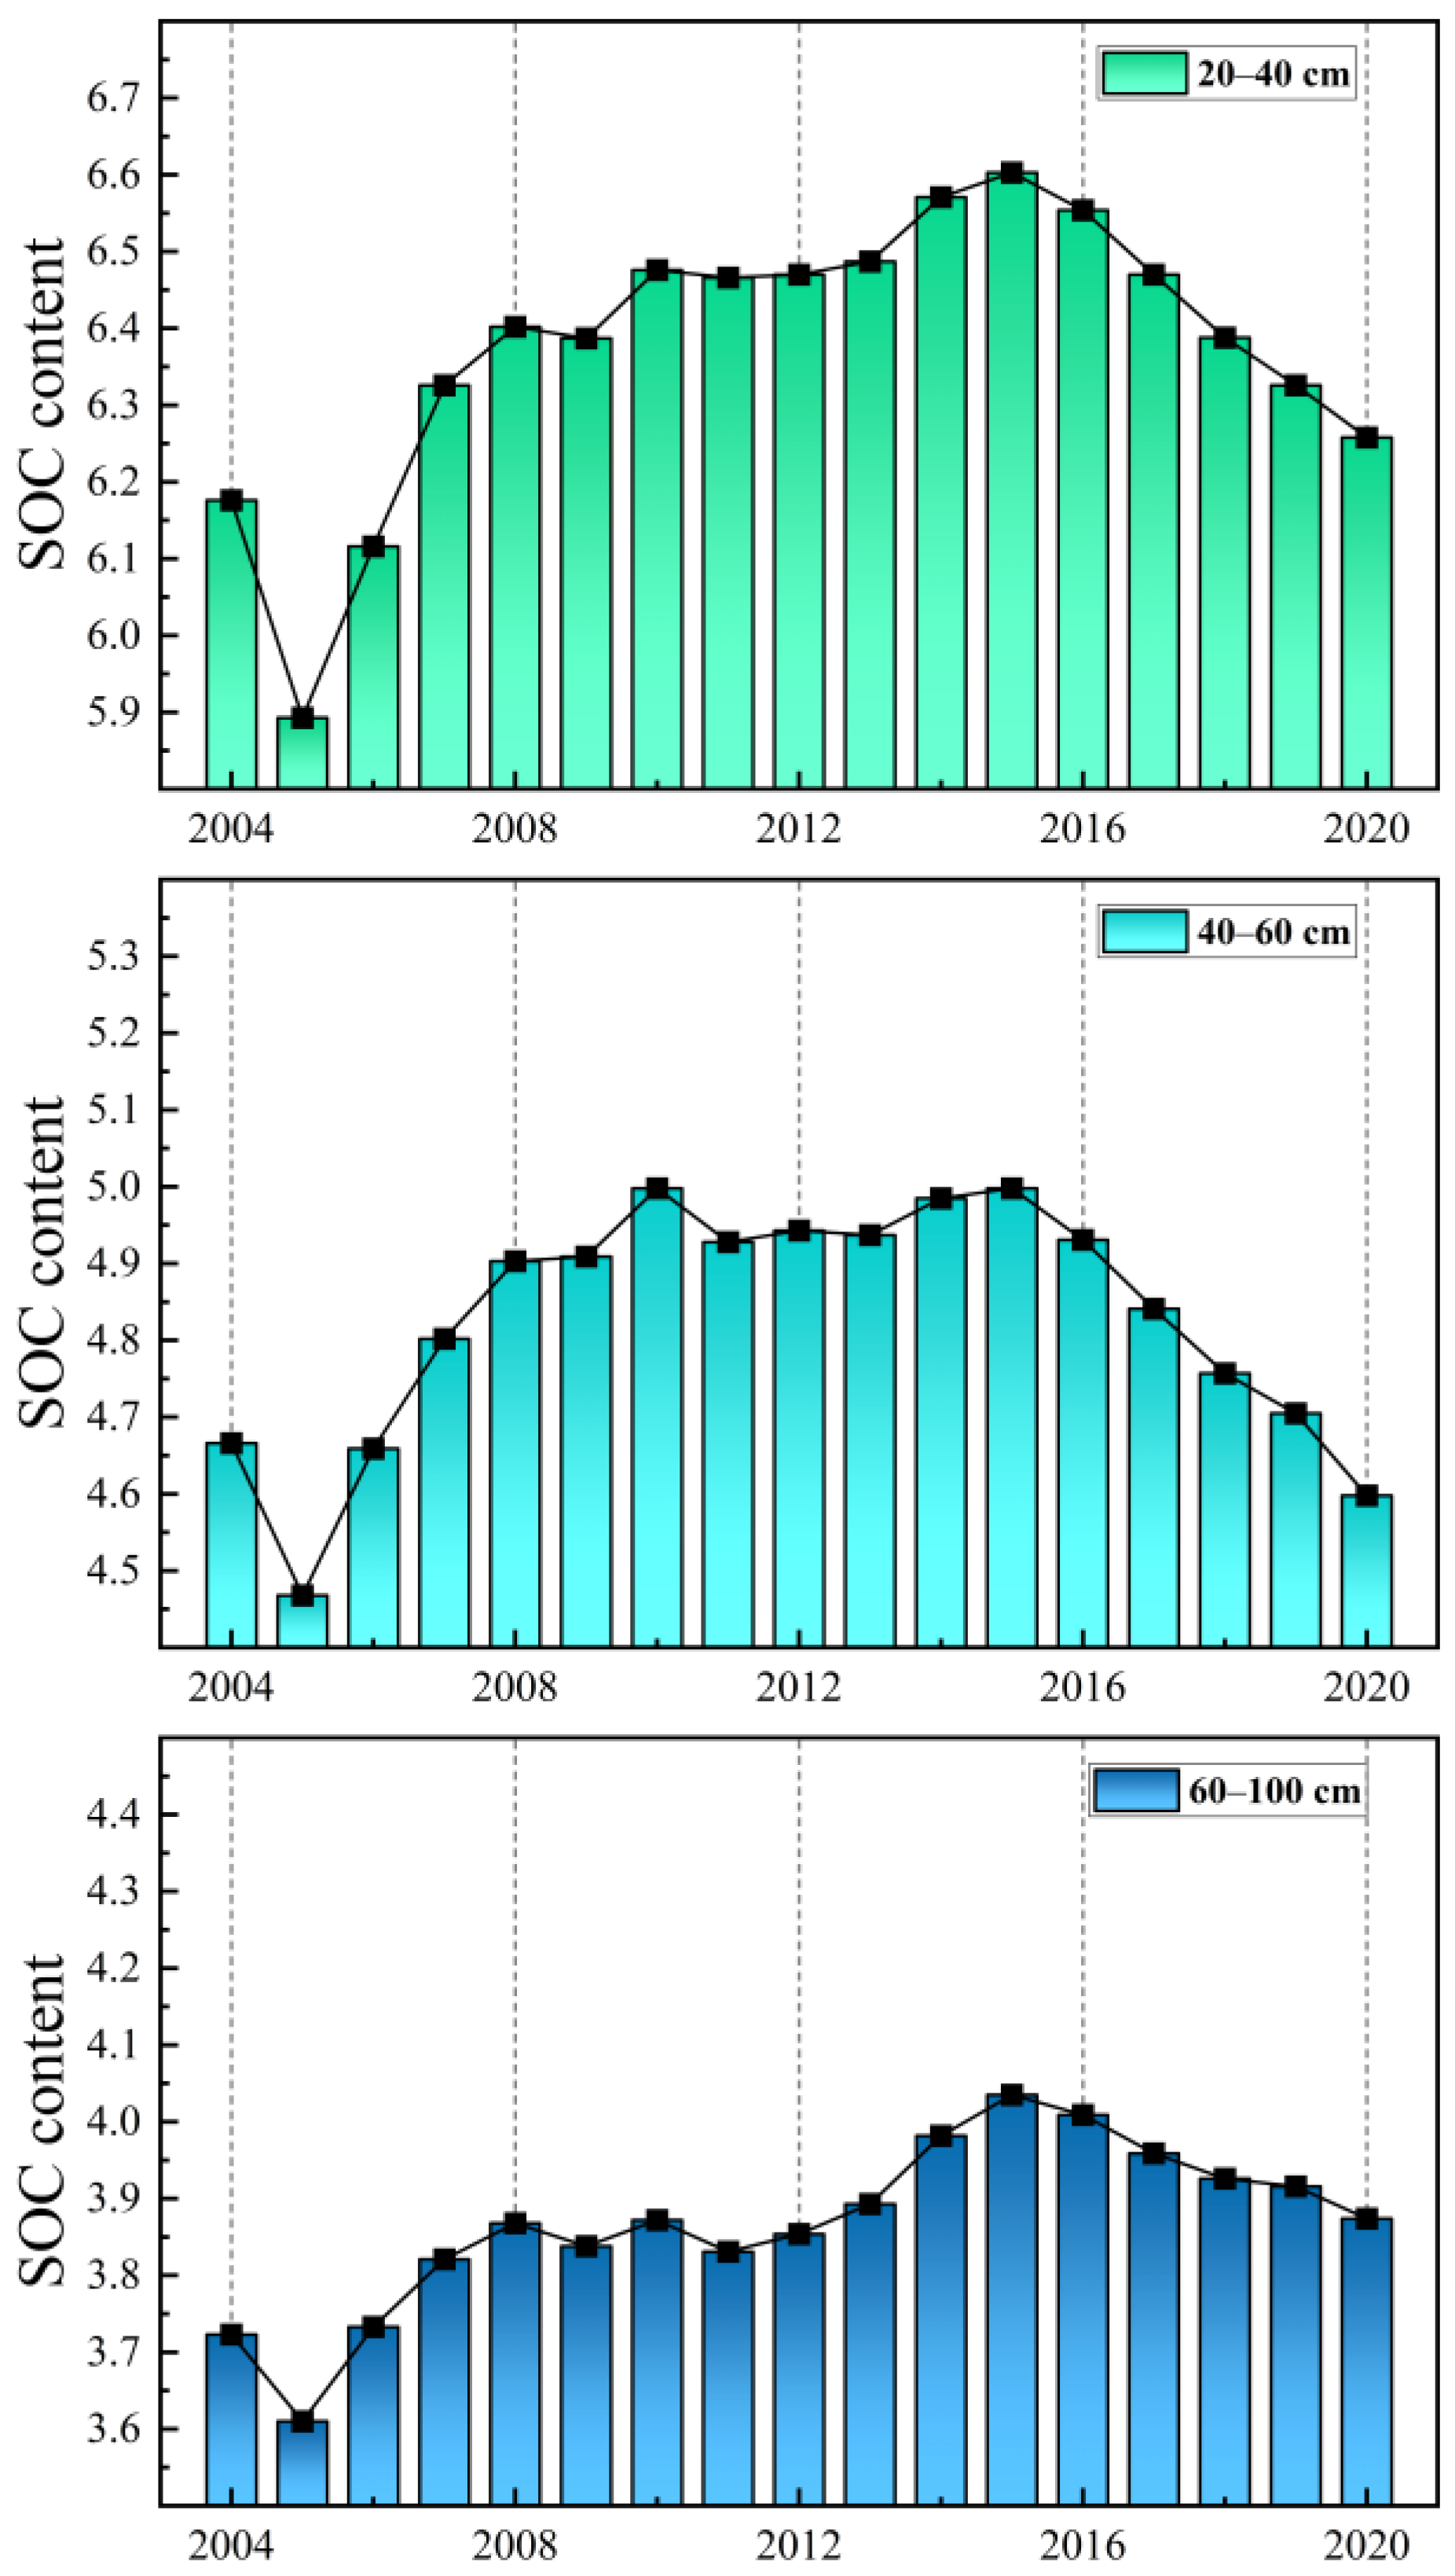
During the investigation period, the SOC content in the 20–40 cm soil layer of typical farmland exhibited a fluctuating accumulation trend, increasing from 6.176 g/kg to 6.258 g/kg (Figure 2). This corresponds to a cumulative increase of 1.33% and an average annual growth rate of 0.08%. The SOC content in the 40–60 cm soil layer of typical farmland decreased continuously, dropping from 4.666 g/kg to 4.598 g/kg. This corresponds to a cumulative decline of 1.46% and an average annual decline rate of 0.09%. In contrast, the 60–100 cm soil layer of typical farmland exhibited significant SOC enhancement, with SOC content increasing from 3.723 g/kg to 3.874 g/kg. This corresponded to a cumulative increase of 4.07% and an average annual growth rate of 0.25%. Overall, the SOC distribution below 20 cm in typical farmland ecosystems exhibited pronounced vertical heterogeneity, characterized by a distinct concentration gradient in which carbon content progressively declines with increasing depth.

3.1.2. Spatial Variation

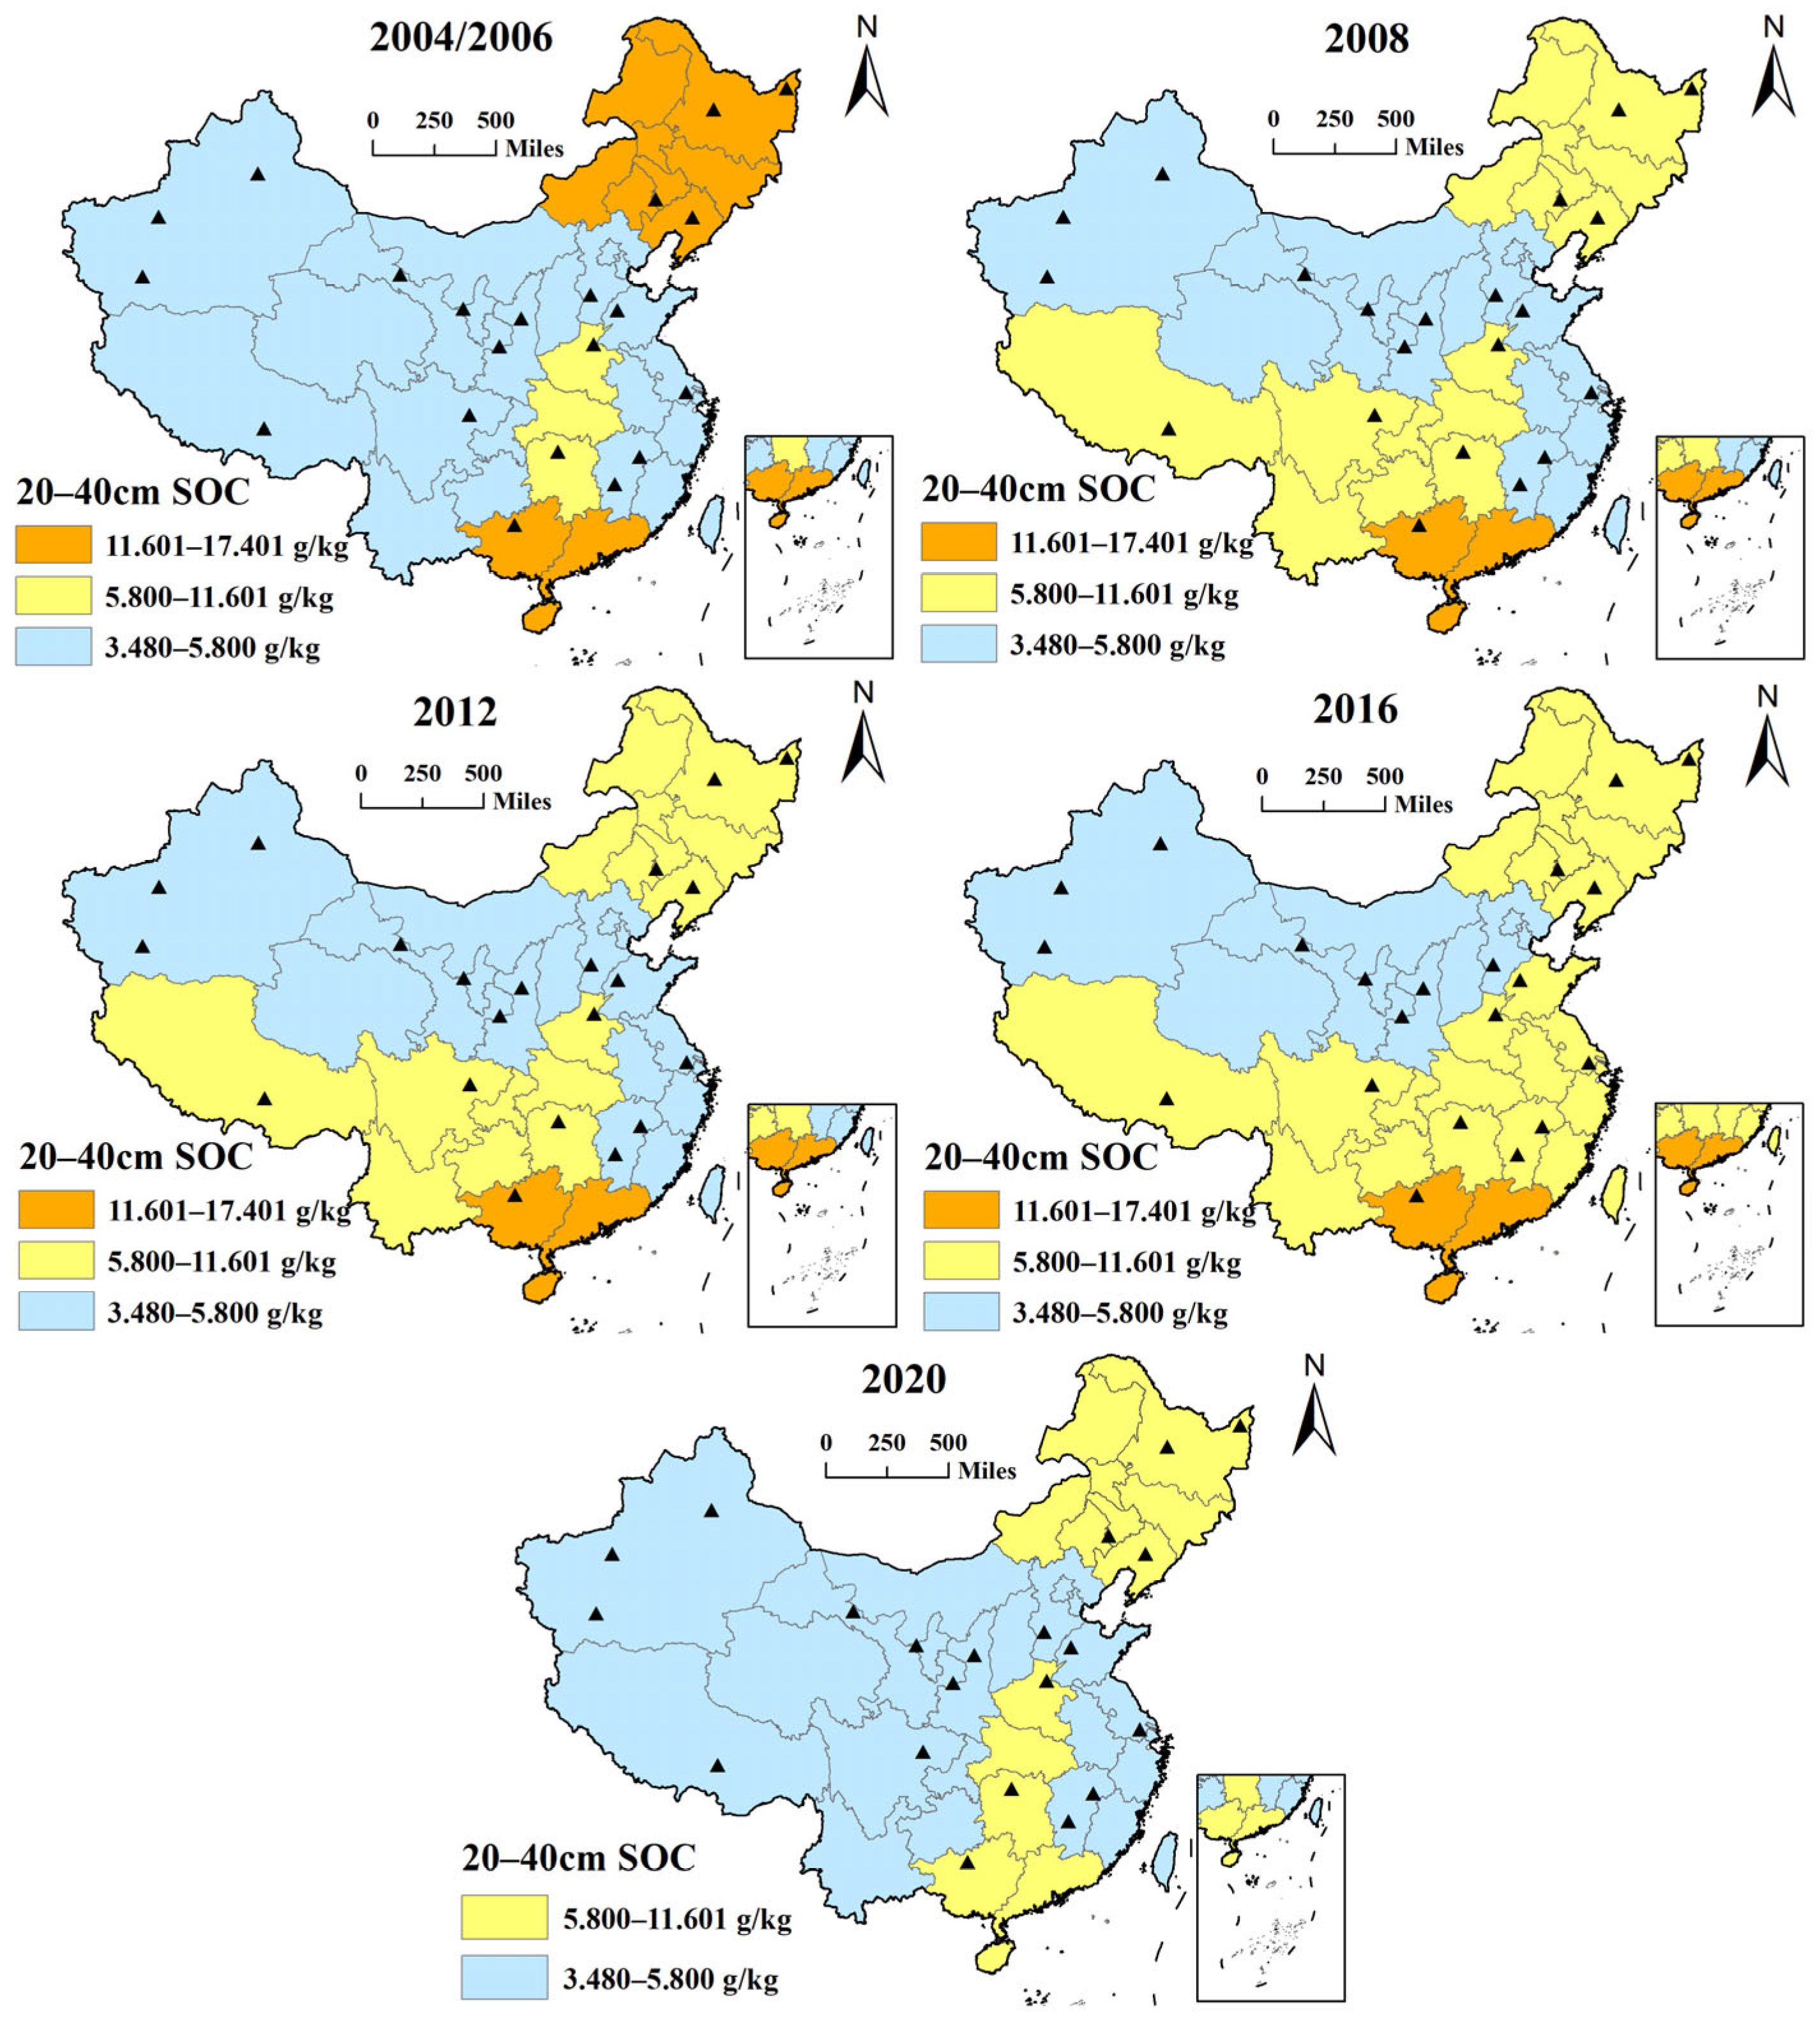
This study adopted the nutrient classification criteria from the second national soil survey. After converting SOM content using a factor of 1.724, SOC content was classified into six levels: >23.202 g/kg (extremely rich), 17.401–23.202 g/kg (rich), 11.601–17.401 g/kg (most suitable), 5.800–11.601 g/kg (suitable), 3.480–5.800 g/kg (deficient), and <3.480 g/kg (extremely deficient). According to the nutrient classification criteria of the second national soil survey [25], in 2020, SOC content in the 20–40 cm soil layer of typical farmland was at a suitable level only in the Northeastern, Southern, and Central China, whereas the remaining regions were at a deficient level (Figure 3). During the study period, the variation in SOC content in the 20–40 cm soil layer exhibited notable regional differentiation. The Central, Northern, and Northwestern China showed an upward trend, with average annual growth rates of 0.68%, 0.72%, and 0.04%, respectively. The Northeastern, Southwestern, Eastern, and Southern China showed a downward trend, with average annual decline rates of 0.35%, 0.93%, 0.22%, and 1.73%, respectively.
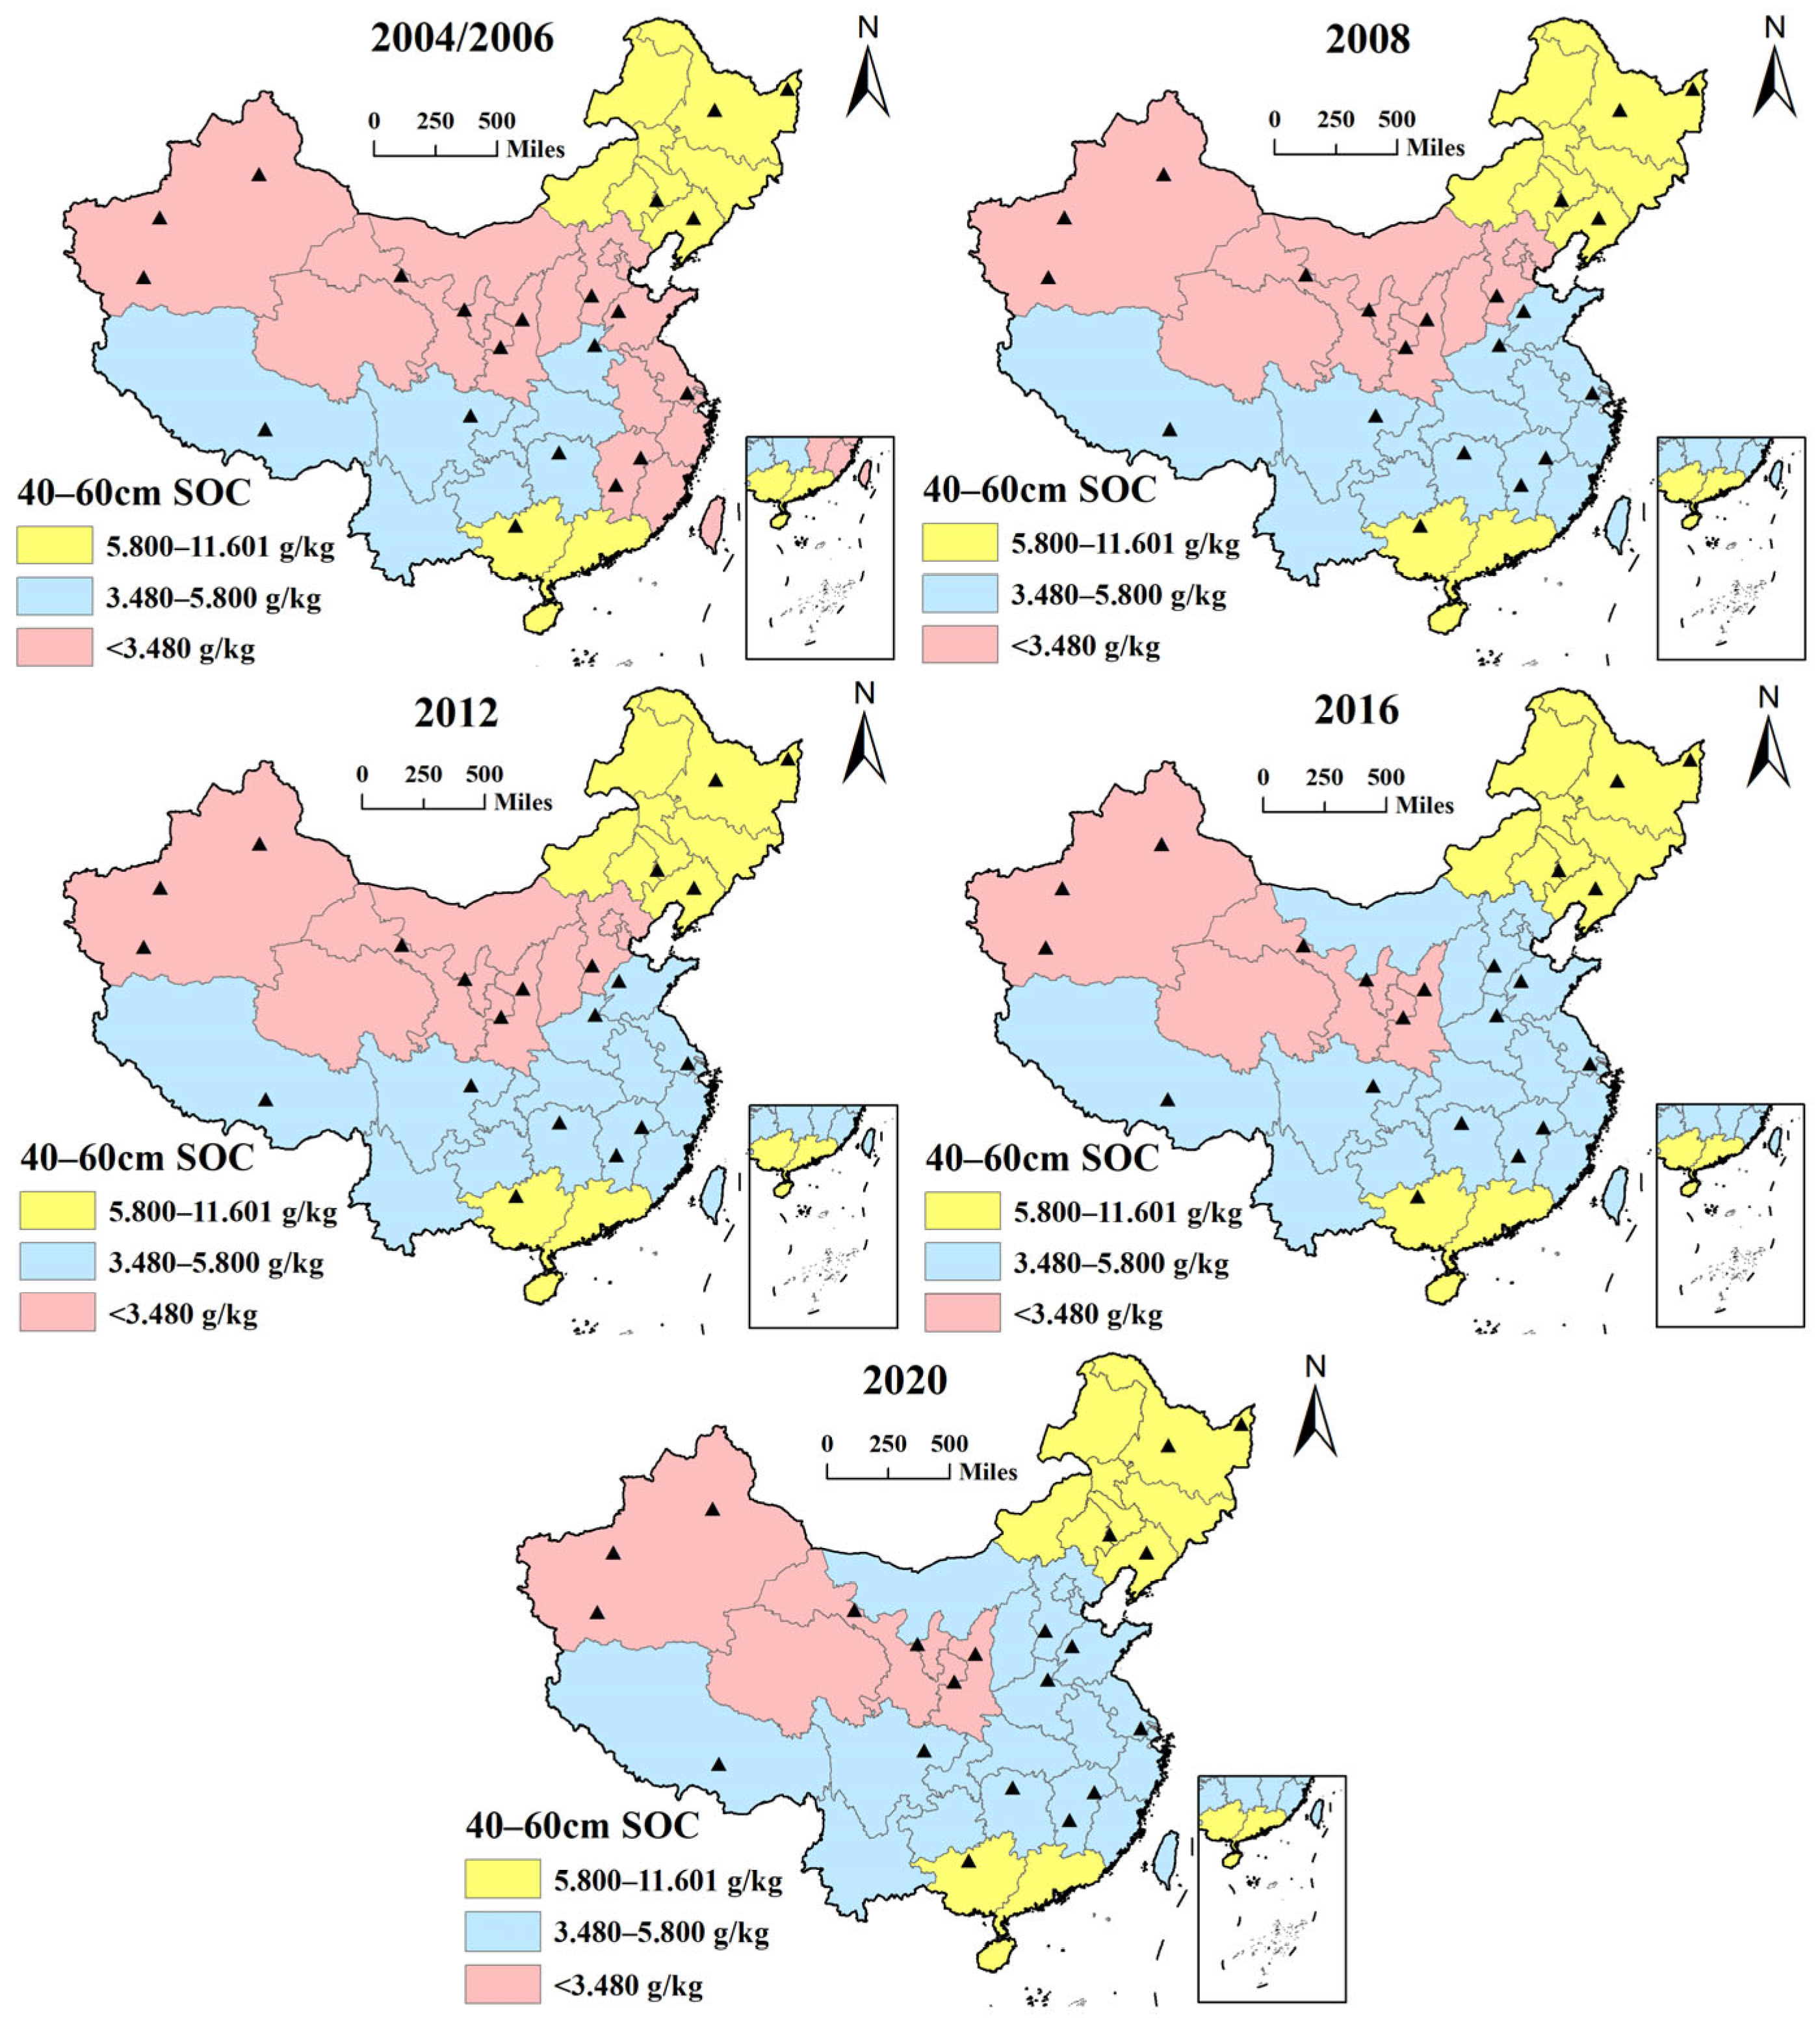
In 2020, the SOC content in the 40–60 cm soil layer of typical farmland was at a suitable level only in the Northeastern and Southern China, whereas it was at a deficient level in the Central, Eastern, Southwestern, and Northern China and at an extremely deficient level in the Northwestern China (Figure 4). During the study period, the SOC content in the 40–60 cm soil layer of typical farmland increased in Northern, Eastern, and Central China, with average annual growth rates of 1.93%, 0.99%, and 0.06%, respectively. Conversely, the SOC content in the 40–60 cm soil layer of typical farmland in the Northwestern, Southwestern, Northeastern, and Southern China showed a downward trend, with average annual decline rates of 0.55%, 0.93%, 0.70%, and 2.75%, respectively.
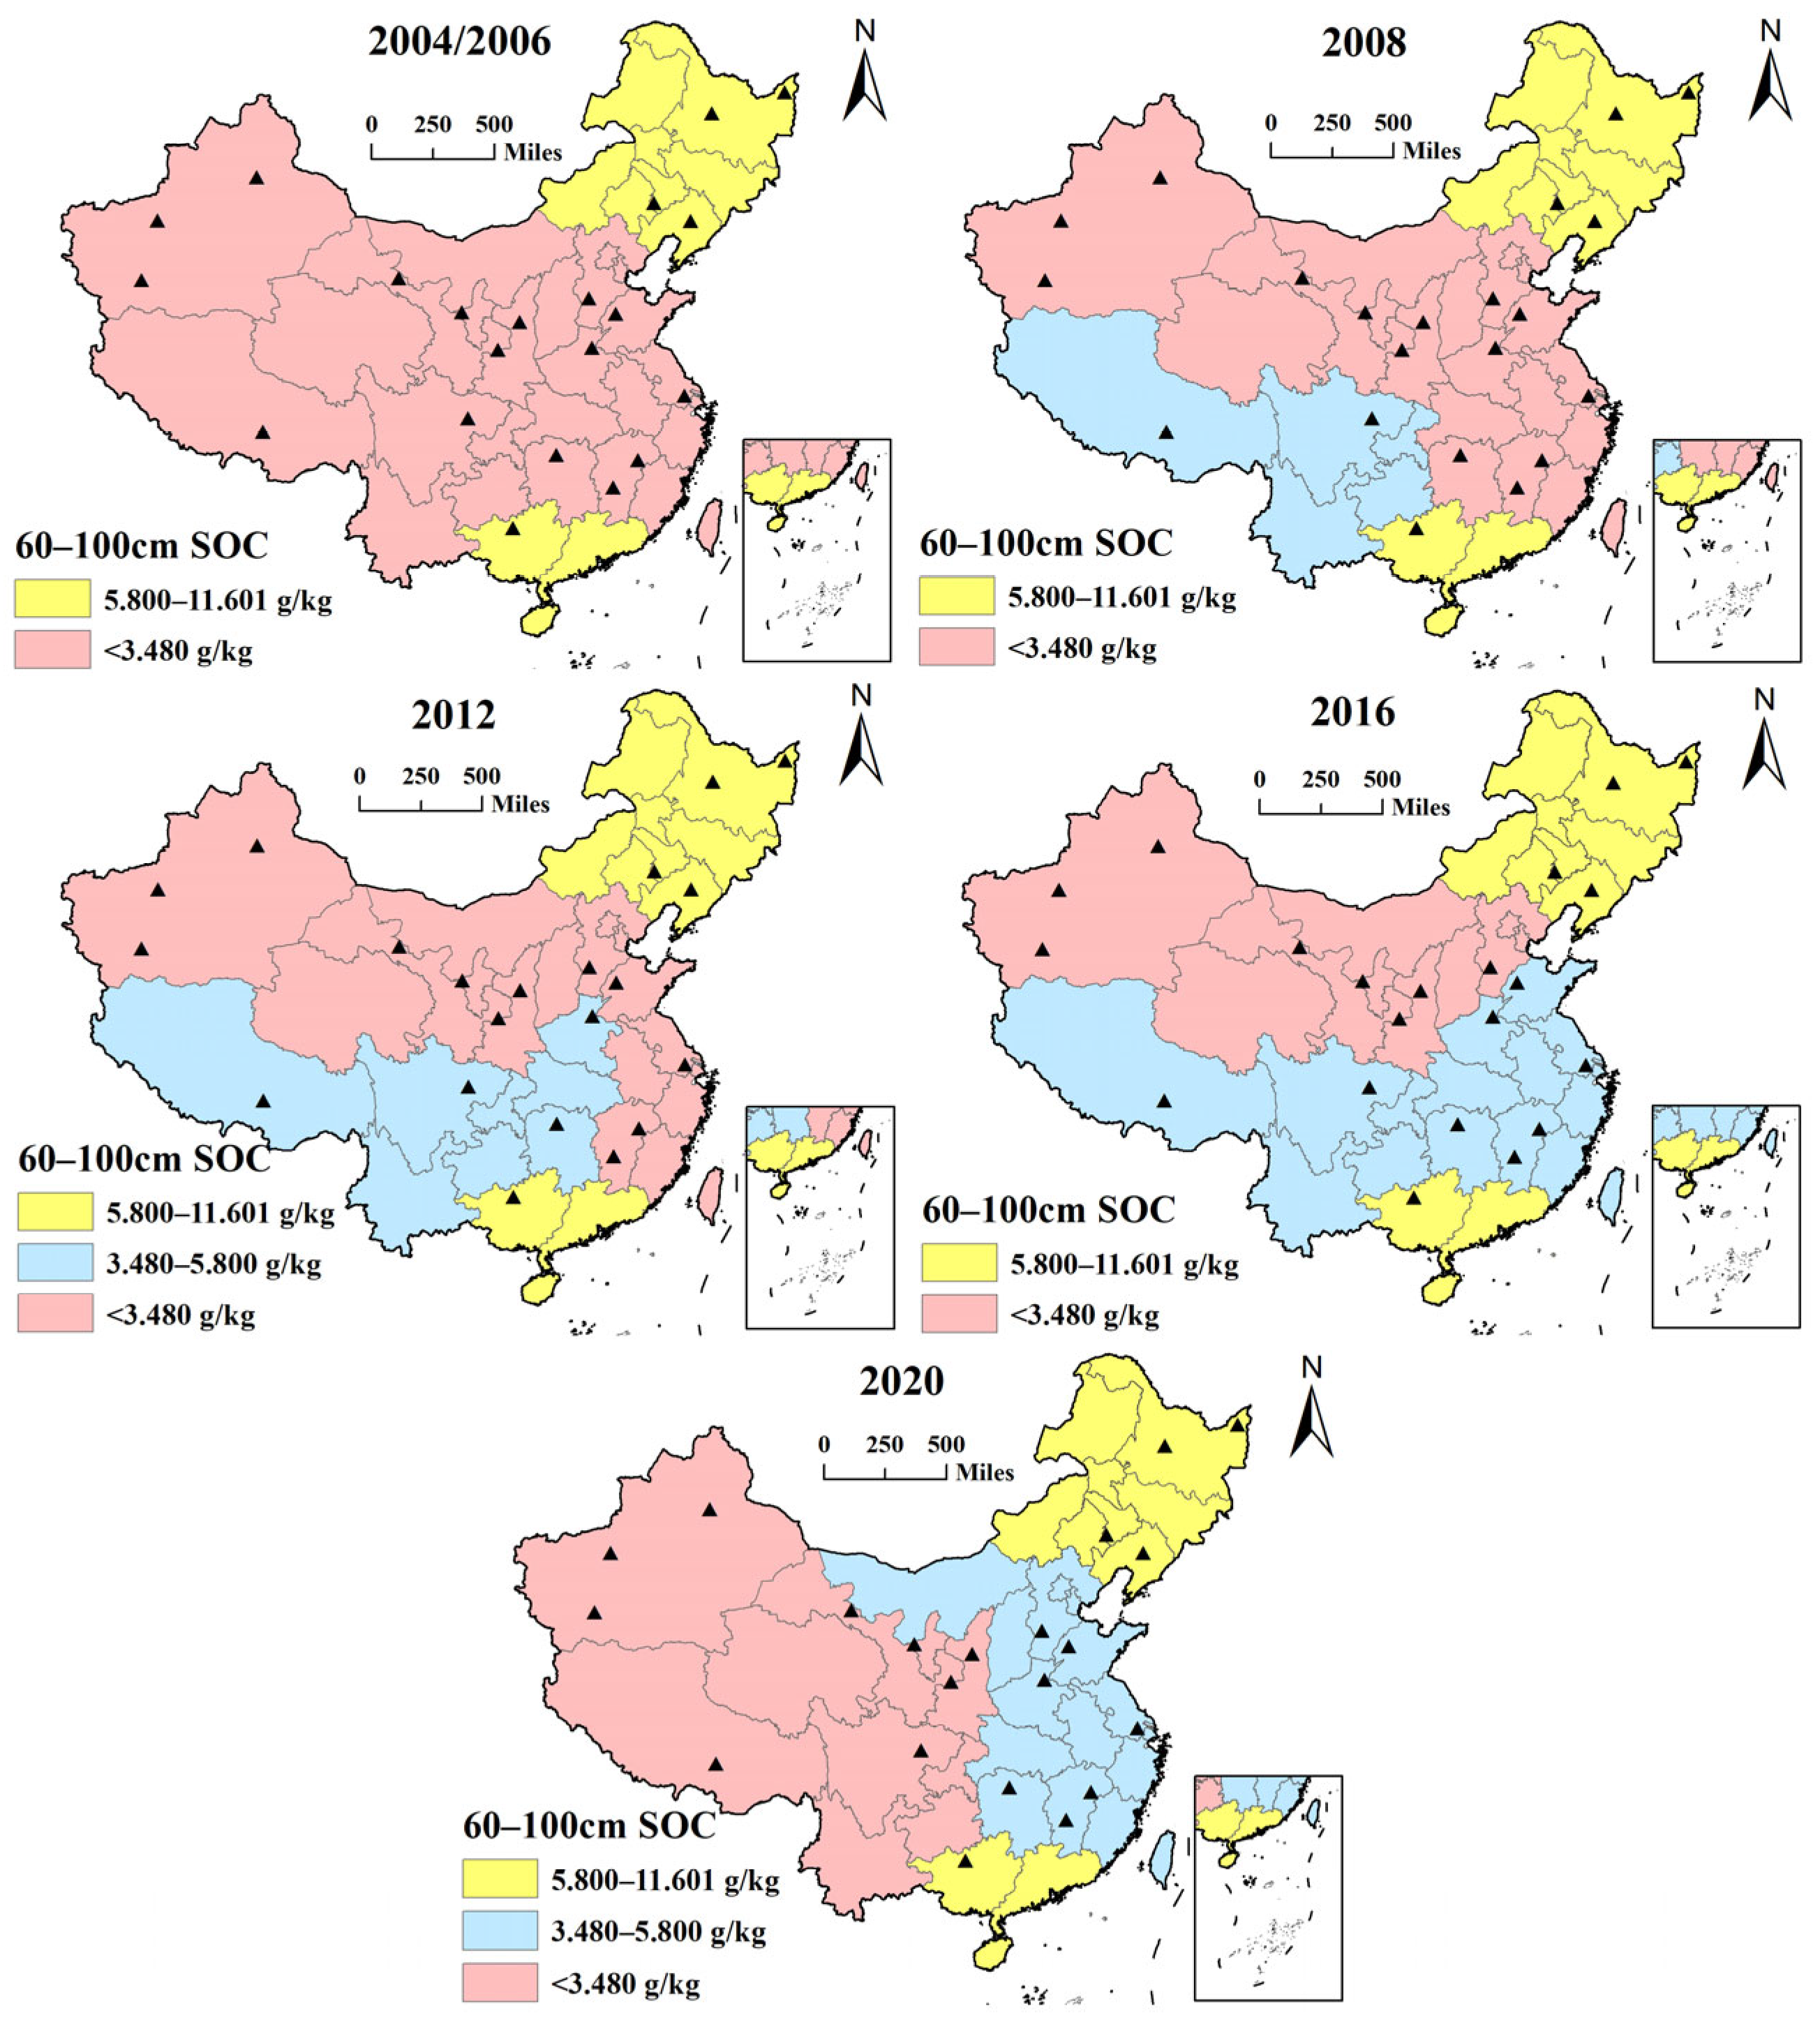
In 2020, the SOC content in the 60–100 cm soil layer of typical farmland was at a suitable level only in the Northeastern and Southern China, at a deficient level in the Central and Northern China, and at an extremely deficient level in the Eastern, Northwestern, and Southwestern China (Figure 5). During the study period, the SOC content in the 60–100 cm soil layer of typical farmland increased in Northern, Eastern, and Central China, with average annual growth rates of 2.25%, 1.11%, and 0.82%, respectively. Conversely, the Northwestern, Northeastern, Southwestern, and Southern China exhibited a downward trend, with average annual decline rates of 0.64%, 3.07%, 1.28%, and 0.84%, respectively.

3.2. Response of Deep SOC to Different Fertilization and Straw-Management Methods

To uncover the effects of different fertilization and straw-management practices on SOC content across soil layers below 20 cm in farmland, an unbalanced panel two-way fixed-effects model was employed for regression analysis (Table 2). Prior to the regression analysis, a collinearity diagnosis was conducted on five model specifications. The results indicated that the variance inflation factors (VIF) were all below 3.54, suggesting a low likelihood of multicollinearity among the variables [44].
Column (1) of Table 2 showed that, relative to NF or CF, the estimated coefficient for the S treatment on SOC content in the 20–40 cm layer was significantly negative (p < 0.1), with an estimated coefficient of −0.364. Column (2) showed that, relative to CF or NF, the estimated coefficient for SCF treatment was significantly positive (p < 0.01), with an estimated coefficient of 0.299. Column (3) indicated that, relative to CF or NF, the estimated coefficient for the OF treatment was 0.312 and was not statistically significant. Column (4) showed that, relative to CF or NF, the estimated coefficient for the OCF treatment was significantly positive (1.154, p < 0.01). Column (5) showed that, relative to NF, the estimated coefficient for the CF treatment was significantly positive (0.133, p < 0.1). It is worth noting that although most studies agree that straw returning is beneficial for SOC enhancement in farmlands [45,46], our results in Column (1) indicated that, relative to CF or NF, straw returning alone was not conducive to SOC enhancement in the 20–40 cm soil layer. Furthermore, Column (3) indicated that applying organic fertilizer alone did not have a significant impact on SOC in this soil layer. Overall, the fertilization and straw-management practices that significantly increased SOC in the 20–40 cm soil layer were SCF and OCF.
Collinearity diagnostics for the models in Table 3 indicated that the VIF for all five specifications was below 3.30. Column (1) presented the estimated effect of the S treatment on SOC content in the 40–60 cm layer relative to CF or NF. The estimated coefficient was significantly negative (−0.413, p < 0.1). Column (2) showed that, relative to CF or NF, the estimated coefficient for the SCF treatment was significantly positive (0.117, p < 0.05). Column (3) showed that, relative to CF or NF, the estimated coefficient for the OF treatment was significantly positive (0.309, p < 0.05). Column (4) showed that, relative to CF or NF, the estimated coefficient for the OCF treatment was significantly positive (0.764, p < 0.01). Column (5) showed that, relative to NF, the estimated coefficient for the CF treatment was 0.095 and was not statistically significant.
Overall, the regression results for the 40–60 cm layer in Table 3 were largely consistent with those in Table 2, although the estimated coefficients and significance levels for several practices decreased to varying degrees. SCF and OCF remained the most effective methods for promoting SOC enhancement in the 40–60 cm soil layer.
Collinearity diagnostics for the models in Table 4 indicated that the VIF for all five specifications was below 3.47. Relative to CF or NF, the estimated coefficients for the S and OF treatments were not statistically significant, whereas the estimated coefficients for SOC in the 60–100 cm layer under the SCF and OCF treatments were significantly positive. Relative to NF, the estimated coefficient for the CF treatment was not statistically significant. The regression results for SOC content in the 60–100 cm soil layer reported in Table 4 were largely consistent with those in Table 2 and Table 3, although the estimated coefficients and significance levels were further reduced across treatments. This pattern suggested that the effects of fertilization and straw-management practices on SOC weakened with increasing soil depth. In the 60–100 cm soil layer, the effects of S, OF, and CF on the SOC were not statistically significant. However, SCF and OCF significantly enhanced SOC enhancement in this layer.

3.3. Response of Deep SOC to Different Tillage Modes

Collinearity diagnostics for the models presented in Table 5 indicated that the VIF for all three specifications was below 3.36. The estimated coefficient of tillage mode on SOC in the 20–40 cm layer was −0.304 and was not statistically significant. The estimated coefficient of tillage mode on SOC in the 40–60 cm layer was significantly negative (−0.492, p < 0.05). This suggested that, relative to reduced tillage and no-tillage, conventional tillage had no significant effect on SOC in the 20–40 cm soil layer and had a significant negative impact on SOC in the 40–60 cm soil layer. In contrast, the estimated coefficient of tillage mode on SOC in the 60–100 cm soil layer was significantly positive (0.509, p < 0.05). These findings were not entirely consistent with previous research suggesting that reduced tillage or no-tillage significantly enhances soil carbon sequestration in farmland [47,48]. Our results indicated that while conventional tillage may not have been conducive to SOC enhancement in the 20–40 cm and 40–60 cm soil layers, it had a significant positive association with SOC content in the 60–100 cm soil layer.

3.4. Response of Deep SOC to Different Farmland Types

Collinearity diagnostics for the models presented in Table 6 indicated that the VIF for all three specifications was below 3.35. Columns (1)–(3) reported the estimated effects of farmland type on SOC content across soil layers below 20 cm in farmland soil profiles. In the 20–40 cm, 40–60 cm, and 60–100 cm soil layers, the estimated coefficients were −0.039, 0.079, and 0.120, respectively, and none were statistically significant. Existing studies generally suggest that paddy soils, as cultivated soils formed under specific management regimes, have higher SOC than other cultivated soils [49]. However, our results indicated that, relative to dryland or irrigated land, paddy fields did not significantly increase SOC enhancement below 20 cm in farmland soil profiles.

4. Discussion

4.1. Potential for SOC Enrichment Within Subsoil Layers (>20 cm)

While prior studies have examined SOC distribution in farmlands at broad scales, few have explicitly addressed typical farmland systems or subsoil layers. Other studies focusing on farmlands in specific areas often report contrasting trends when evaluating the potential for SOC enrichment of deep soils [50]. This study shows that SOC in the subsoil layers of typical Chinese farmlands exhibits marked temporal dynamics, challenging the traditional paradigm of subsoil inertness [51]. Most notably, compared to the 20–40 cm and 40–60 cm layers, the 60–100 cm layer exhibited the highest average annual growth rate of SOC, overall accounting for 62% of the total subsoil SOC enhancement observed during the study period. The substantial dynamism observed here suggests that deep soil layers are more active than previously assumed, potentially driven by deep root inputs or the leaching of dissolved organic carbon [52]. This complexity underscores the need to refine terrestrial carbon-cycle models to better capture subsoil contributions. Should the pronounced accumulation of SOC within the 60–100 cm layer be validated at a broader spatial scale, it would signify that it is the sequestration potential of the deep carbon pool that existing carbon accounting frameworks may have substantially underestimated.

4.2. Differential Responses of Deep SOC to Agricultural Management and Management Strategies

Relevant studies generally suggest that deep SOC is highly stable due to physical protection and chemical inertia associated with mineral binding [53]. This study indicates that agricultural management can significantly affect SOC below 20 cm in farmlands. Under different fertilization and straw-management practices, straw returning or organic fertilizer application alone does not significantly increase SOC in subsoil layers, whereas the combined application of organic and inorganic fertilizers has a larger effect on SOC below 20 cm in the soil profile. This finding supports the “nutrient synergy hypothesis” [54], which posits that under nutrient-limited conditions, the concurrent supply of organic carbon and inorganic nutrients synergistically enhances microbial carbon use efficiency and facilitates soil carbon sequestration [55]. It is plausible that the inclusion of inorganic nitrogen mitigates the positive priming effect typically induced by fresh organic inputs [56]. By satisfying microbial stoichiometric demands, exogenous nitrogen may reduce the microbial mining of native SOC for nutrients, a mechanism through which the stability of deep carbon pools is preserved.
In addition, compared with dryland or irrigated land, paddy fields do not effectively enhance SOC below 20 cm in typical farmland soil profiles. Consequently, land-use policy formulation must move beyond the conventional assumption that paddy fields are inherently superior for SOC sequestration. Rather than pursuing the uncritical expansion of paddy systems, decision-makers should prioritize the rational configuration of land-use types, in which the proportions of paddy, dryland, and irrigated croplands are balanced, such that regional soil quality and carbon storage can be effectively enhanced.

4.3. Differences in the Response of Surface and Deep SOC to Agricultural Management

To elucidate the differential responses of surface and deep SOC to different fertilization and straw-management practices within a unified framework, this study conducted a supplementary empirical analysis to evaluate the impacts of these agricultural practices on SOC content within the 0–20 cm soil layer of typical farmlands, thereby facilitating a direct comparison with the aforementioned findings regarding deep SOC. The monitoring data for the 0–20 cm soil layer are derived from the same sources as previously described and can be accessed via the National Ecosystem Science Data Center website (www.cnern.org.cn).
Table 7, Rows (1)–(5), reported the effects of different fertilization and straw-management methods on surface SOC. Relative to CF and NF, the estimated coefficients for SCF, OF, and OCF were all significantly positive (p < 0.01), whereas the estimated coefficient for S was not statistically significant. Relative to NF, the estimated coefficient for CF was significantly positive (p < 0.01). Row (6) of Table 7 showed that, relative to reduced tillage and no-tillage, the estimated coefficient for conventional tillage on surface SOC was significantly negative (−1.098, p < 0.01). Patra et al. [57] compared the effects of long-term agricultural-management practices on microbial functional characteristics related to SOC enhancement in topsoil and subsoil and found no significant difference in carbon use efficiency between conventional tillage and no-tillage in subsoil. This finding aligns with the evidence presented in this study, based upon which it is demonstrated that, relative to the other investigated layers, it is within the 60–100 cm profile that conventional tillage proves more conducive to carbon sequestration than no-tillage. This vertical disparity underscores the complexity of the net carbon balance, the assessment of which depends on the trade-off between surface depletion and deep-layer accumulation. Therefore, in farmland management, a compound tillage system combining “topsoil conservation tillage” with “subsoil interval tillage” should be promoted to facilitate deep SOC enhancement.
Row (7) of Table 7 indicates that the estimated coefficient for SOC content in the 0–20 cm soil layer in paddy fields is 2.109, which is significantly positive at the 1% level relative to dryland or irrigated land. In contrast to the estimates for soil layers below 20 cm, paddy fields significantly increase SOC content in the topsoil, a phenomenon consistent with the conventional understanding of carbon preservation in anaerobic paddy environments.

5. Conclusions

Given the imperative to secure and expand deep soil carbon reservoirs for climate mitigation, there is an urgent need to elucidate the large-scale spatiotemporal dynamics of SOC in deep farmland soils and its sensitivity to agricultural-management practices. This study focuses on SOC below 20 cm in 120 typical farmland soil profiles in China and identifies several important differences from existing research on topsoil organic carbon. The findings are as follows:
(1)
The distribution of SOC below 20 cm in typical farmland soil profiles in China exhibits pronounced vertical heterogeneity. SOC content in the 20–40 cm soil layer shows a fluctuating accumulation trend from 2004 to 2020, with a cumulative increase of 1.33%. SOC content in the 40–60 cm soil layer decreases over the study period, with a cumulative decline of 1.46%. In contrast, SOC content in the 60–100 cm soil layer exhibits notable SOC enhancement, with a cumulative increase of 4.07% during this period, accounting for 62% of the total increase in SOC content below 20 cm.
(2)
In 2020, SOC content below 20 cm in typical farmland soil profiles in China exhibits a spatial gradient characterized by “higher values in the north and south, lower values in the east and west”. According to the nutrient classification criteria of the second national soil survey, SOC content in the 20–40 cm soil layer is at a suitable level only in the Northeastern, Southern, and Central China, whereas the remaining regions are at a deficient level. SOC content in the 40–60 cm soil layer is at a suitable level only in the Northeastern and Southern China, whereas it is at a deficient level in the Central, Eastern, Southwestern, and Northern China and at an extremely deficient level in the Northwestern China. SOC content in the 60–100 cm soil layer is at a suitable level only in the Northeastern and Southern China, at a deficient level in the Central and Northern China, and at an extremely deficient level in the Eastern, Northwestern, and Southwestern China.
(3)
Different fertilization and straw-management practices significantly affect SOC below 20 cm in farmland soil profiles. In the 20–40 cm soil layer, relative to sole chemical fertilizer application or no fertilization, the regression coefficients for single straw returning and sole organic fertilizer application are significantly negative. However, the estimated coefficients for straw returning combined with chemical fertilizer and organic fertilizer combined with chemical fertilizer are significantly positive (p < 0.01), with coefficient values of 0.299 and 1.154. Relative to no fertilization, applying chemical fertilizer alone significantly increases SOC content in the 20–40 cm soil layer but has no significant impact on SOC below 40 cm. Results for the 40–60 cm and 60–100 cm soil layers are broadly consistent with those for the 20–40 cm layer. Overall, relative to practices such as single organic inputs or sole chemical fertilizer application, the combined application of organic and inorganic fertilizers has a stronger effect on deep SOC.
(4)
Relative to reduced tillage or no-tillage, conventional tillage significantly increases SOC content in the 60–100 cm soil layer. Given this vertical disparity, a compound tillage system integrating “topsoil conservation tillage” with “subsoil interval tillage” should be promoted to facilitate deep SOC enhancement. Compared with dryland or irrigated land, paddy field management has no significant impact on SOC at depths below 20 cm.

Author Contributions

Conceptualization, S.Z.; methodology, S.Z.; project administration, C.W.; resources, C.W.; software, S.Z.; writing—original draft preparation, S.Z.; supervision, C.W. All authors have read and agreed to the published version of the manuscript.

Funding

This research was funded by the funding of National Natural Science Foundation of China (Grant number: 42177463).

Data Availability Statement

Data will be available upon personal request.

Acknowledgments

We thank the Aksu, Ansai, Cele, Changshu, Changwu, Fukang, Fengqiu, Huanjiang, Hailun, Luancheng, Lhasa, Linze, Naiman, Qianyanzhou, Sanjiang, Shapotou, Shenyang, Taoyuan, Yucheng, Yanting, and Yingtan stations for their efforts in data collection. We also thank the Chinese Ecosystem Research Network soil sub-center and the comprehensive center for their diligent work on quality control of the original observation data and for providing data publication services.

Conflicts of Interest

The authors declare no conflicts of interest.

References

  1. Rumpel, C.; Amiraslani, F.; Koutika, L.S.; Smith, P.; Whitehead, D.; Wollenberg, E. Put more carbon in soils to meet Paris climate pledges. Nature 2018, 564, 32–34. [Google Scholar] [CrossRef] [Scilit]
  2. Abdellatif, M.A.; Hassan, F.O.; Rashed, H.S.A.; El Baroudy, A.A.; Mohamed, E.S.; Kucher, D.E.; Abd-Elmabod, S.K.; Shokr, M.S.; Abuzaid, A.S. Assessing Soil Organic Carbon Pool for Potential Climate-Change Mitigation in Agricultural Soils—A Case Study Fayoum Depression, Egypt. Land 2023, 12, 1755. [Google Scholar] [CrossRef] [Scilit]
  3. Fontaine, S.; Barot, S.; Barré, P.; Bdioui, N.; Mary, B.; Rumpel, C. Stability of organic carbon in deep soil layers controlled by fresh carbon supply. Nature 2007, 450, 277–280. [Google Scholar] [CrossRef] [Scilit] [PubMed]
  4. Mathieu, J.A.; Hatté, C.; Balesdent, J.; Parent, É. Deep soil carbon dynamics are driven more by soil type than by climate: A worldwide meta-analysis of radiocarbon profiles. Glob. Change Biol. 2015, 21, 4278–4292. [Google Scholar] [CrossRef] [Scilit] [PubMed]
  5. Sun, R.J.; Sun, K.; Liu, L.R.; Wu, W.J.; Xu, Z.Z. Changes in soil carbon and nitrogen along a 3-m vertical profile and environmental regulation in alpine grassland on the Tibetan Plateau. J. Geophys. Res.-Biogeosci. 2024, 129, e2023JG007579. [Google Scholar] [CrossRef] [Scilit]
  6. Zheng, J.F.; Cheng, K.; Pan, G.X. Impact of biochar application on deep soil organic carbon pool. J. Nanjing Agric. Univ. 2020, 43, 589–593. [Google Scholar]
  7. Blanco-Canqui, H.; Jasa, P.; Ferguson, R.B.; Slater, G. Cover crops and deep-soil c accumulation: What does research show after 10 years? Soil Sci. Soc. Am. J. 2024, 88, 2167–2180. [Google Scholar] [CrossRef] [Scilit]
  8. Fan, Y.N.; Zhang, C.; Hu, W.Y.; Khan, K.S.; Zhao, Y.C.; Huang, B. Development of soil quality assessment framework: A comprehensive review of indicators, functions, and approaches. Ecol. Indic. 2025, 172, 113272. [Google Scholar] [CrossRef] [Scilit]
  9. Tautges, N.E.; Chiartas, J.L.; Gaudin, A.C.M.; O’Geen, A.T.; Herrera, I.; Scow, K.M. Deep soil inventories reveal that impacts of cover crops and compost on soil carbon sequestration differ in surface and subsurface soils. Glob. Change Biol. 2019, 25, 3753–3766. [Google Scholar] [CrossRef] [Scilit]
  10. Lehmann, J.; Kleber, M. The contentious nature of soil organic matter. Nature 2015, 528, 60–68. [Google Scholar] [CrossRef] [Scilit]
  11. Zheng, Y.T.; Zhao, X.N.; Li, X.Y.; Chen, H.Y.; Li, C.C.; Zhang, C.T. Mapping soil organic carbon density via geographically weighted regression with smooth terms: A case study in shanxi province. Ecol. Indic. 2024, 166, 112588. [Google Scholar] [CrossRef] [Scilit]
  12. Fang, J.Y.; Yu, G.R.; Liu, L.L.; Hu, S.J.; Chapin, F.S. Climate change, human impacts, and carbon sequestration in China. Proc. Natl. Acad. Sci. USA 2018, 115, 4015–4020. [Google Scholar] [CrossRef] [Scilit]
  13. Ding, Y.H.B.; Zhang, H.; Xu, L.; Guo, Z.H.; Duan, H.X.; Song, M.Y.; Xie, Y.Z.; Zhu, Y.F.; Wang, C. Regional differences in the impact of climate extremes on future global rice yield variability. Geomat. Nat. Hazards Risk 2026, 17, 2619862. [Google Scholar] [CrossRef] [Scilit]
  14. Hashimi, R.; Sato, T.; Someya, K.; Asagi, N.; Komatsuzaki, M. Impact of Long-Term Organic No-Tillage on Soil Aggregation, Aggregate-Associated Carbon, and Soil Water Retention. Soil Use Manag. 2025, 41, e70158. [Google Scholar] [CrossRef] [Scilit]
  15. Angst, G.; Messinger, J.; Greiner, M.; Häusler, W.; Hertel, D.; Kirfel, K.; Kögel-Knabner, I.; Leuschner, C.; Rethemeyer, J.; Mueller, C.W. Soil organic carbon stocks in topsoil and subsoil controlled by parent material, carbon input in the rhizosphere, and microbial-derived compounds. Soil Biol. Biochem. 2018, 122, 19–30. [Google Scholar] [CrossRef] [Scilit]
  16. Pries, C.E.H.; Ryals, R.; Zhu, B.; Min, K.; Cooper, A.; Goldsmith, S.; Pett-Ridge, J.; Torn, M.; Berhe, A.A. The deep soil organic carbon response to global change. Annu. Rev. Ecol. Evol. Syst. 2023, 54, 375–401. [Google Scholar] [CrossRef] [Scilit]
  17. Sierra, C.A.; Ahrens, B.; Bolinder, M.A.; Braakhekke, M.C.; von Fromm, S.; Kätterer, T.; Luo, Z.K.; Parvin, N.; Wang, G.C. Carbon sequestration in the subsoil and the time required to stabilize carbon for climate change mitigation. Glob. Change Biol. 2024, 30, e17153. [Google Scholar] [CrossRef] [Scilit] [PubMed]
  18. Wild, B.; Li, J.; Pihlblad, J.; Bengtson, P.; Rütting, T. Decoupling of priming and microbial n mining during a short-term soil incubation. Soil Biol. Biochem. 2019, 129, 71–79. [Google Scholar] [CrossRef] [Scilit]
  19. Skadell, L.E.; Schneider, F.; Gocke, M.I.; Guigue, J.; Amelung, W.; Bauke, S.L.; Hobley, E.U.; Barkusky, D.; Honermeier, B.; Kögel-Knabner, I.; et al. Twenty percent of agricultural management effects on organic carbon stocks occur in subsoils—Results of ten long-term experiments. Agric. Ecosyst. Environ. 2023, 356, 108619. [Google Scholar] [CrossRef] [Scilit]
  20. Samson, M.E.; Chantigny, M.H.; Vanasse, A.; Menasseri-Aubry, S.; Royer, I.; Angers, D.A. Response of subsurface c and n stocks dominates the whole-soil profile response to agricultural management practices in a cool, humid climate. Agric. Ecosyst. Environ. 2024, 320, 107590. [Google Scholar] [CrossRef] [Scilit]
  21. Fernandes, M.M.; Fernandes, M.R.D.; Garcia, J.R.; Matricardi, E.A.T.; de Almeida, A.Q.; Pinto, A.S.; Menezes, R.S.C.; Silva, A.d.J.; Lima, A.H.d.S. Assessment of land use and land cover changes and valuation of carbon stocks in the sergipe semiarid region, brazil: 1992–2030. Land Use Policy 2020, 99, 104795. [Google Scholar] [CrossRef] [Scilit]
  22. Lehmann, J.; Hansel, C.M.; Kaiser, C.; Kleber, M.; Maher, K.; Manzoni, S. Persistence of soil organic carbon caused by functional complexity. Nat. Geosci. 2020, 13, 529–534. [Google Scholar] [CrossRef] [Scilit]
  23. Fernando, E.A.J.; Selvaraj, M.; Uga, Y.; Busch, W.; Bowers, H.; Tohme, J. Going deep: Roots, carbon, and analyzing subsoil carbon dynamics. Mol. Plant 2024, 17, 1–3. [Google Scholar] [CrossRef] [Scilit] [PubMed]
  24. Potash, E.; Guan, K.Y.; Margenot, A.J.; Lee, D.K.; Boe, A.; Douglass, M.; Heaton, E.; Jang, C.; Jin, V.; Li, N.; et al. Multi-site evaluation of stratified and balanced sampling of soil organic carbon stocks in agricultural fields. Geoderma 2023, 438, 116587. [Google Scholar] [CrossRef] [Scilit]
  25. Wang, L.F.; Zhang, S.H.; Wang, L.J.; Xi, X. Spatiotemporal coupling dynamics and factors influencing soil organic carbon and crop yield in Chinese farmlands. Sci. Total Environ. 2024, 954, 176588. [Google Scholar]
  26. Meena, R.S.; Yadav, A.; Kumar, S.; Jhariya, M.K.; Jatav, S.S. Agriculture ecosystem models for CO2 sequestration, improving soil physicochemical properties, and restoring degraded land. Ecol. Eng. 2022, 176, 106546. [Google Scholar] [CrossRef] [Scilit]
  27. Ren, H.L.; Xu, S.J.; Zhang, F.Y.; Sun, M.M.; Zhang, R.P. Cultivation and Nitrogen Management Practices Effect on Soil Carbon Fractions, Greenhouse Gas Emissions, and Maize Production under Dry-Land Farming System. Land 2023, 12, 1306. [Google Scholar] [CrossRef] [Scilit]
  28. Zhang, S.T.; Ren, T.; Cong, W.F.; Fang, Y.T.; Zhu, J.; Zhao, J.; Cong, R.H.; Li, X.K.; Lu, J.W. Oilseed rape-rice rotation with recommended fertilization and straw returning enhances soil organic carbon sequestration through influencing macroaggregates and molecular complexity. Agric. Ecosyst. Environ. 2024, 367, 108960. [Google Scholar] [CrossRef] [Scilit]
  29. Han, H.; Fan, D.J.; Liu, S.X.; Jiang, R.; Song, D.P.; Zou, G.Y.; He, P.; Wang, M.Y.; He, W.T. Integrating straw return and tillage practices to enhance soil organic carbon sequestration in wheat-maize rotation systems in the north China plain. Agric. Ecosyst. Environ. 2025, 384, 109555. [Google Scholar] [CrossRef] [Scilit]
  30. Zhang, Y.J.; Zou, J.L.; Osborne, B.; Dang, W.; Xu, Y.X.; Ren, Y.Y.; Dang, S.A.; Wang, L.J.; Chen, X.; Yu, Y. Effect of straw return on soil respiration in dryland agroecosystem of China: A meta-analysis. Ecol. Eng. 2023, 196, 107099. [Google Scholar] [CrossRef] [Scilit]
  31. Hao, X.Y.; He, W.; Lam, S.K.; Li, P.; Zong, Y.X.; Zhang, D.S.; Li, F.Y. Enhancement of no-tillage, crop straw return and manure application on field organic matter content overweigh the adverse effects of climate change in the arid and semi-arid northwest China. Agric. For. Meteorol. 2020, 295, 108199. [Google Scholar] [CrossRef] [Scilit]
  32. Feng, W.H.; Ai, J.J.; Sánchez-Rodríguez, A.R.; Li, S.W.; Zhang, W.T.; Yang, H.S.; Apostolakis, A.; Muenter, C.; Li, F.M.; Dippold, M.A.; et al. Depth-dependent patterns in soil organic c, enzymatic stochiometric ratio, and soil quality under conventional tillage and reduced tillage after 55-years. Agric. Ecosyst. Environ. 2025, 385, 109584. [Google Scholar] [CrossRef] [Scilit]
  33. Bongiorno, G.; Bünemann, E.K.; Oguejiofor, C.U.; Meier, J.; Gort, G.; Comans, R.; Mäder, P.; Brussaard, L.; de Goede, R. Sensitivity of labile carbon fractions to tillage and organic matter management and their potential as comprehensive soil quality indicators across pedoclimatic conditions in europe. Ecol. Indic. 2021, 121, 107093. [Google Scholar] [CrossRef] [Scilit]
  34. Xie, W.; Zhu, A.F.; Ali, T.; Zhang, Z.T.; Chen, X.G.; Wu, F.; Huang, J.K.; Davis, K.F. Crop switching can enhance environmental sustainability and farmer incomes in China. Nature 2023, 618, E26. [Google Scholar] [CrossRef] [Scilit] [PubMed]
  35. Hobley, E.; Wilson, B.; Wilkie, A.; Gray, J.; Koen, T. Drivers of soil organic carbon storage and vertical distribution in eastern australia. Plant Soil 2015, 390, 111–127. [Google Scholar] [CrossRef] [Scilit]
  36. Liang, Z.Y.; Li, Y.N.; Wang, J.Y.Z.; Hao, J.Q.; Jiang, Y.H.; Shi, J.L.; Meng, X.T.; Tian, X.H. Effects of the combined application of livestock manure and plant residues on soil organic carbon sequestration in the southern loess plateau of China. Agric. Ecosyst. Environ. 2024, 368, 109011. [Google Scholar] [CrossRef] [Scilit]
  37. Li, Q.; Gao, M.F.; Li, Z.L. Soil organic carbon storage in australian wheat cropping systems in response to climate change from 1990 to 2060. Land 2022, 11, 1683. [Google Scholar] [CrossRef] [Scilit]
  38. Fierer, N.; Allen, A.S.; Schimel, J.P.; Holden, P.A. Controls on microbial CO2 production: A comparison of surface and subsurface soil horizons. Glob. Change Biol. 2003, 9, 1322–1332. [Google Scholar] [CrossRef] [Scilit]
  39. Dignac, M.F.; Derrien, D.; Barré, P.; Barot, S.; Cécillon, L.; Chenu, C.; Chevallier, T.; Freschet, G.T.; Garnier, P.; Guenet, B.; et al. Increasing soil carbon storage: Mechanisms, effects of agricultural practices and proxies. A review. Agron. Sustain. Dev. 2017, 37, 14. [Google Scholar] [CrossRef] [Scilit]
  40. GB/T 7857—1987; Determination of Organic Matter and Calculation of Carbon-Nitrogen Ratio for Forest Soil. China Standards Press: Beijing, China, 1987.
  41. Gattinger, A.; Muller, A.; Haeni, M.; Skinner, C.; Fliessbach, A.; Buchmann, N.; Mäder, P.; Stolze, M.; Smith, P.; Scialabba, N.E.H.; et al. Enhanced top soil carbon stocks under organic farming. Proc. Natl. Acad. Sci. USA 2012, 109, 18226–18231. [Google Scholar] [CrossRef] [Scilit] [PubMed]
  42. NY/T 1119-2019; Rules for Cultivated Land Quality Monitoring. China Agricultural Press: Beijing, China, 2019.
  43. Jawadi, F.; Pondie, T.M.; Cheffou, A.I. New challenges for green finance and sustainable industrialization in developing countries: A panel data analysis. Energy Econ. 2025, 142, 108120. [Google Scholar] [CrossRef] [Scilit]
  44. Salmerón, R.; García, C.B.; García, J. Variance Inflation Factor and Condition Number in multiple linear regression. J. Stat. Comput. Simul. 2018, 88, 2365–2384. [Google Scholar] [CrossRef] [Scilit]
  45. Xin, J.J.; Yan, L.; Cai, H.G. Response of soil organic carbon to straw return in farmland soil in China: A meta-analysis. J. Environ. Manag. 2024, 359, 121051. [Google Scholar] [CrossRef] [Scilit]
  46. Xu, Y.A.; Yu, Y.L.; Sheng, J.; Wang, Y.K.; Yang, H.S.; Li, F.M.; Liu, S.P.; Kan, Z.R. Long-term residue returning increased subsoil carbon quality in a rice-wheat cropping system. J. Environ. Manag. 2024, 360, 121088. [Google Scholar] [CrossRef] [Scilit]
  47. Shi, H.Y.; Umair, M. Balancing agricultural production and environmental sustainability: Based on Economic Analysis From North China Plain. Environ. Res. 2024, 252, 118784. [Google Scholar] [CrossRef] [Scilit]
  48. Yan, S.B.; Yin, L.M.; Dijkstra, F.A.; Wang, P.; Cheng, W.X. Priming effect on soil carbon decomposition by root exudate surrogates: A meta-analysis. Soil Biol. Biochem. 2023, 178, 108955. [Google Scholar] [CrossRef] [Scilit]
  49. Chioggia, F.; Grigatti, M.; Lavrnic, S.; Toscano, A. Constructed wetland biomass for compost production: Evaluation of effects on crops and soil. Ecol. Eng. 2024, 207, 107339. [Google Scholar] [CrossRef] [Scilit]
  50. Zhao, Y.; Wang, M.; Hu, S.; Zhang, X.; Ouyang, Z.; Zhang, G.; Huang, B.; Zhao, S.; Wu, J.; Xie, D.; et al. Economics- and policy-driven organic carbon input enhancement dominates soil organic carbon accumulation in Chinese croplands. Proc. Natl. Acad. Sci. USA 2018, 115, 4045–4050. [Google Scholar] [CrossRef] [Scilit] [PubMed]
  51. Button, E.S.; Pett, R.J.; Murphy, D.; Kuzyakov, Y.; Chadwick, D.R.; Jones, D.L. Deep-c storage: Biological, chemical and physical strategies to enhance carbon stocks in agricultural subsoils. Soil Biol. Biochem. 2022, 170, 108697. [Google Scholar] [CrossRef] [Scilit]
  52. Amundson, R.; Biardeau, L. Soil carbon sequestration is an elusive climate mitigation tool. Proc. Natl. Acad. Sci. USA 2018, 115, 11652–11656. [Google Scholar] [CrossRef] [Scilit] [PubMed]
  53. Khairallah, W.; Raclot, D.; Annabi, M.; Coulouma, G.; Guenet, B.; Rumpel, C.; Bahri, H. Evidence of high carbon biodegradability in the subsoil of Mediterranean croplands. Geoderma 2025, 455, 117212. [Google Scholar] [CrossRef] [Scilit]
  54. Xu, H.; Cai, A.D.; Yang, X.Y.; Zhang, S.L.; Huang, S.M.; Wang, B.R.; Zhu, P.; Colinet, G.; Sun, N.; Xu, M.G.; et al. Long-term organic substitution promotes carbon and nitrogen sequestration and benefit crop production in upland field. Agronomy 2023, 13, 2381. [Google Scholar] [CrossRef] [Scilit]
  55. He, H.; Peng, M.W.; Hou, Z.A.; Li, J.H. Unlike chemical fertilizer reduction, organic fertilizer substitution increases soil organic carbon stock and soil fertility in wheat fields. J. Sci. Food Agric. 2024, 104, 2798–2808. [Google Scholar] [CrossRef] [Scilit] [PubMed]
  56. Tang, H.M.; Cheng, K.K.; Shi, L.H.; Li, C.; Wen, L.; Li, W.Y.; Sun, M.; Sun, G.; Long, Z.D. Effects of long-term organic matter application on soil carbon accumulation and nitrogen use efficiency in a double-cropping rice field. Environ. Res. 2022, 213, 113700. [Google Scholar] [CrossRef] [Scilit]
  57. Patra, R.; Saha, D.; Neupane, A.; Jagadamma, S. Deep-rooted winter wheat cover crop promotes subsoil organic carbon storage through improved microbial functional traits. Appl. Soil Ecol. 2024, 199, 105413. [Google Scholar] [CrossRef] [Scilit]
Figure 1. Distribution of 21 typical farmland ecosystem stations and farmland–complex ecosystem stations in China. The map approval number is GS(2024)0650. The number of plots in each region is as follows: Northeastern (20), Northern (5), Central (14), Southern (4), Eastern (23), Northwestern (36), and Southwestern China (18).
Land 15 00676 g001
Figure 2. SOC content in the soil layer below 20 cm in typical farmland in China from 2004 to 2020.
Land 15 00676 g002
Figure 3. Distribution of SOC content in the 20–40 cm soil layer of typical farmland across seven geographical regions from 2004 to 2020. To effectively visualize long-term evolutionary trends while maintaining graphical clarity, representative years were selected at four-year intervals (2004/2006, 2008, 2012, 2016, and 2020). The initial year for Southern China was 2006, whereas the initial statistical year for the other six regions was 2004.
Land 15 00676 g003
Figure 4. Distribution of SOC content in the 40–60 cm soil layer of typical farmland across seven geographical regions from 2004 to 2020.
Land 15 00676 g004
Figure 5. Distribution of SOC content in the 60–100 cm soil layer of typical farmland across seven geographical regions from 2004 to 2020.
Land 15 00676 g005
Table 1. Descriptive statistics of variables used in the panel fixed-effects model (2004–2020).
VariableMeaningMeanSDMaxMin
SOC (g/kg)20–40 cm6.3844.57223.4920.238
40–60 cm4.8333.04914.8490.180
60–100 cm3.8722.44416.4920.209
Exogenous carbon input1 = Organic fertilizer or straw returning
0 = No fertilizer or chemical fertilizer
0.5350.4991.0000.000
Ground temperature (°C)20–40 cm14.2144.11122.3004.400
40–60 cm14.1774.07222.4004.500
60–100 cm14.2244.11422.4444.683
Soil bulk density20–40 cm1.4890.1882.7650.988
40–60 cm1.4920.1802.6551.170
60–100 cm1.4990.1902.7511.060
Soil pH20–40 cm7.6681.3009.9384.008
40–60 cm7.7011.3009.9994.000
60–100 cm7.6961.3109.9364.019
Proportion of clay particles20–40 cm21.68715.48475.2030.034
40–60 cm23.50517.17786.5050.000
60–100 cm22.46516.82878.7300.000
Initial SOC20–40 cm6.2084.24021.2490.238
40–60 cm4.6762.97014.6350.180
60–100 cm3.6652.33811.9610.209
Precipitation (mm)Annual precipitation621.052510.5792571.0005.600
Altitude (m)Vertical elevation relative to mean sea level690.129988.2353688.0001.300
Notes: Since proxy variables for assessing agricultural management, such as fertilization practices and straw-management practices, require establishing a control group for comparative analysis, they are omitted from Table 1. The ground temperature represents the annual mean soil temperature at the specified depth intervals, measured continuously throughout the year.
Table 2. Estimation results for the effects of different fertilization and straw-management practices on SOC in the 20–40 cm layer.
(1)(2)(3)(4)(5)
S−0.364 *
(0.202)
SCF 0.299 ***
(0.082)
OF 0.312
(0.206)
OCF 1.154 ***
(0.131)
CF 0.133 *
(0.080)
_cons32.758 ***
(1.707)
31.554 ***
(1.543)
32.648 ***
(1.727)
34.257 ***
(1.736)
32.677 ***
(1.730)
ControlsYYYYY
Site_FEYYYYY
Year_FEYYYYY
Obs93913589021299873
R-squared0.9470.9410.9460.8900.947
Notes: *** p < 0.01, * p < 0.1. Standard errors were reported in parentheses and clustered at the individual level. Control variables included ground temperature, precipitation, altitude, bulk density, soil pH, the percentage of clay particles, and initial SOC content. Y indicated that the variable was controlled.
Table 3. Estimation results for the effects of different fertilization and straw-management practices on SOC in the 40–60 cm layer.
(1)(2)(3)(4)(5)
S−0.413 *
(0.220)
SCF 0.117 **
(0.064)
OF 0.309 **
(0.149)
OCF 0.764 ***
(0.083)
CF 0.095
(0.082)
_cons17.875 ***
(1.087)
16.889 ***
(0.954)
17.078 ***
(1.093)
18.542 ***
(1.159)
17.112 ***
(1.104)
ControlsYYYYY
Site_FEYYYYY
Year_FEYYYYY
Obs93913589021299873
R-squared0.9180.9130.9200.8790.920
Notes: *** p < 0.01, ** p < 0.05, * p < 0.1. Standard errors were reported in parentheses and clustered at the individual level. The control variables were the same as those in Table 2. Y indicated that the variable was controlled.
Table 4. Estimation results for the effects of different fertilization and straw-management practices on SOC in the 60–100 cm layer.
(1)(2)(3)(4)(5)
S0.008
(0.129)
SCF 0.161 **
(0.069)
OF 0.209
(0.132)
OCF 1.042 ***
(0.072)
CF −0.009
(0.066)
_cons11.581 ***
(0.890)
11.746 ***
(0.847)
11.548 ***
(0.912)
13.026 ***
(0.973)
11.423 ***
(0.912)
ControlsYYYYY
Site_FEYYYYY
Year_FEYYYYY
Obs93913589021299873
R-squared0.9090.8930.9110.8770.912
Notes: *** p < 0.01, ** p < 0.05. Standard errors were reported in parentheses and clustered at the individual level. The control variables were the same as those in Table 2. Y indicated that the variable was controlled.
Table 5. The estimated impact of different tillage modes on deep SOC in farmland.
20–40 cm SOC40–60 cm SOC60–100 cm SOC
(1)(2)(3)
Tillage mode−0.304
(0.315)
−0.492 **
(0.250)
0.509 **
(0.216)
_cons32.416 ***
(1.562)
18.599 ***
(1.038)
12.496 ***
(0.965)
ControlsYYY
Site_FEYYY
Year_FEYYY
Obs185118511851
R-squared0.8950.8780.860
Notes: *** p < 0.01, ** p < 0.05. Standard errors were reported in parentheses and clustered at the individual level. Soil pH, clay content, and initial SOC for the 20–40 cm soil layer were reported in Column (1), whereas Columns (2) and (3) reported the corresponding values for the 40–60 cm and 60–100 cm soil layers, respectively. Control variables included exogenous carbon input, ground temperature, precipitation, altitude, bulk density, soil pH, the percentage of clay particles, and initial SOC content. Y indicated that the variable was controlled.
Table 6. Estimation results of different types of farmland.
20–40 cm SOC40–60 cm SOC60–100 cm SOC
(1)(2)(3)
Farmland type−0.039
(0.168)
0.079
(0.147)
0.120
(0.123)
_cons31.835 ***
(1.535)
17.917 ***
(0.980)
13.225 ***
(0.846)
ControlsYYY
Site_FEYYY
Year_FEYYY
Obs187918791879
R-squared0.8950.8790.860
Notes: *** p < 0.01. Standard errors were reported in parentheses and clustered at the individual level. The control variables remained the same as those in Table 5. Y indicated that the variable was controlled.
Table 7. Estimation results for the effects of agricultural management on SOC in the 0–20 cm layer.
ModelIndependent VariableRegression CoefficientStandard DeviationControlsSite_FEYear_FEObsR-Squared
(1)S−0.4060.337YYY9390.950
(2)SCF1.865 ***0.139YYY13580.946
(3)OF2.030 ***0.327YYY9020.947
(4)OCF1.963 ***0.165YYY12990.926
(5)CF0.868 ***0.104YYY8730.951
(6)Tillage mode−1.098 ***0.423YYY18510.928
(7)Farmland type2.109 ***0.315YYY18790.932
Notes: *** p < 0.01. Standard errors were reported in parentheses and clustered at the individual level. Y indicated that the variable was controlled.
Disclaimer/Publisher’s Note: The statements, opinions and data contained in all publications are solely those of the individual author(s) and contributor(s) and not of MDPI and/or the editor(s). MDPI and/or the editor(s) disclaim responsibility for any injury to people or property resulting from any ideas, methods, instructions or products referred to in the content.