Next Article in Journal
Ageing, Gender, and Territorial Inequalities: Environmental and Socio-Spatial Challenges in Contemporary Societies
Next Article in Special Issue
Correction: Hussain et al. GIS-Driven Regional Assessment for Sustainable Data Center Siting in the United Kingdom. Land 2026, 15, 516
Previous Article in Journal
Biocultural Value of Semi-Natural and Human-Conditioned Habitats in Slovakia
Previous Article in Special Issue
Beyond the Footprint: Empirical Land Use and Environmental Patterns of Wind Energy in Mountainous Landscapes
 
 
Correction published on 29 May 2026, see Land 2026, 15(6), 934.
Article

GIS-Driven Regional Assessment for Sustainable Data Center Siting in the United Kingdom
Faculty of Environment, Science and Economy (ESE), Renewable Energy, Electric and Electronic Engineering, University of Exeter, Penryn TR10 9FE, UK
*
Author to whom correspondence should be addressed.
Land 2026, 15(3), 516; https://doi.org/10.3390/land15030516
Submission received: 10 December 2025 / Revised: 16 March 2026 / Accepted: 17 March 2026 / Published: 23 March 2026 / Corrected: 29 May 2026

Abstract

This study presents a GIS-driven multi-criteria decision analysis (MCDA) framework for regional suitability screening of data center (DC) development in the United Kingdom. The methodology integrates spatial exclusion of constrained zones, raster standardization of climate and infrastructure indicators, Analytic Hierarchy Process (AHP) weighting, and Weighted Linear Combination (WLC) to generate a national suitability surface at 1 km resolution. Climate indicators (temperature, air frost days, humidity, and solar radiation) and infrastructure and environmental constraint indicators (grid access, transport proximity, environmental protections, and population distribution) were standardized and combined within a GIS-based decision framework. Hard constraints such as protected areas and flood zones were applied through binary exclusion, while climatic and infrastructure factors were evaluated using weighted suitability scoring. Five candidate regions were identified from the suitability analysis: the Scottish Highlands, Northeast England, Southwest England (Cornwall), Northwest England, and Eastern England. These regions were further evaluated against key requirements including power infrastructure accessibility, workforce and connectivity availability, and exposure to environmental and hydro-climate constraints. The final comparison identified Lincolnshire as the most suitable region due to strong grid accessibility, favorable composite climate suitability, adequate population proximity, and limited overlap with protected areas. The proposed framework demonstrates how climate-driven cooling suitability can be integrated with infrastructure accessibility and environmental constraints within a unified spatial decision model for national-scale digital infrastructure planning.

1. Introduction

Modern society’s digital infrastructure relies on a rapidly expanding network of data centers (DCs), which host computational and storage resources that support cloud computing, online streaming, artificial intelligence, and other emerging digital services [1]. As demand for digital services continues to increase on a global scale, governments and industry are facing pressure to expand DC capacity. This must be done in a way that is environmentally sustainable and also operationally resilient [2]. Region selection for new DC developments has therefore become a strategic decision, particularly in countries such as the United Kingdom, where geographic, environmental, and regulatory constraints must be balanced together with technical and infrastructural requirements [3].
The location of a DC plays an important role in determining long-term operational performance, environmental footprint, and resilience of the facility. A well-sited location can reduce cooling energy demand and improve access to reliable power and network connectivity, while also limiting exposure to environmental hazards. In contrast, a poorly chosen region may lead to higher operational energy use, vulnerability to flooding or heat stress, planning delays, or social and environmental conflicts [4]. These impacts can affect long-term viability. It should also be recognized that community opposition may still arise even for technically suitable locations, especially when land use change, water abstraction, or visual impacts are perceived as significant by local stakeholders.
Several factors make location selection particularly critical for DCs, among these, energy demand is one of the most important. DCs are highly energy-intensive infrastructures, requiring continuous electricity supply to operate IT equipment and associated cooling systems. While most DCs rely on robust connections to the national grid, resilience strategies often include on-site backup generation, such as gas-fired generators, to maintain operation during grid outages [1,5]. Nevertheless, proximity to high-capacity electrical infrastructure, including high-voltage substations and transmission corridors, remains important. This is mainly to minimize grid connection costs and ensure sufficient capacity for large-scale facilities.
Another key factor is network connectivity; DCs depend strongly on high-bandwidth and low-latency connections. Proximity to major fiber-optic backbones and internet exchange points, which are typically located near metropolitan areas, can reduce latency and improve service performance [6]. This factor has become increasingly important with the growth of edge computing, where decentralized facilities are deployed closer to end-users, which supports latency-sensitive applications. For example, DCs located closer to demand centers can achieve network latencies on the order of 5–20 ms, compared to higher values for more remote facilities [7]. However, this creates a trade-off between proximity to users and other siting objectives, such as land availability, environmental constraints, and cooling efficiency [8]. Therefore, balance is required.
DCs are increasingly recognized as critical national infrastructure, mainly due to their role in supporting essential digital services across the economy. Global DC capacity is estimated to be growing at approximately 20% annually, and more than 500 DCs are currently operational in the UK [2]. Since 2024, the UK government has formally designated DCs as critical national infrastructure, which highlights the need for resilient and well-planned future expansion. Data center region selection is widely treated as a multi-criteria problem, requiring tradeoffs between infrastructure availability, mainly power supply and network connectivity, climate conditions and natural hazard exposure, regulatory and planning limits, long-term scalability, and proximity and latency factors [9].
Climate-related factors are becoming increasingly important in DC siting decisions, as rising temperatures, heatwaves, and water stress can have a noticeable impact on cooling system performance and overall energy demand. Cooler climates can reduce reliance on mechanical cooling and improve energy efficiency, which has encouraged some operators to consider northern or less densely populated regions. However, such locations may also face disadvantages related to connectivity, workforce availability, or distance from demand centers, which can offset climate benefits. At the same time, there is growing interest in the potential for waste heat recovery from DCs, particularly where proximity to urban areas or district heating networks could allow low-grade heat to be reused for space heating or industrial purposes. This adds another spatial consideration [10,11].
Historically, DC development in the UK has been highly concentrated around London’s M25 corridor, which accounts for approximately 70% of the national market, with a secondary cluster located around Manchester [2]. While this concentration reflects proximity to population centers, major businesses, and internet exchange points, it also increases systemic risks, such as localized grid constraints, land scarcity, and flood exposure. These risks are becoming more relevant. In order to support continued expansion while improving resilience and sustainability, there is increasing interest in identifying suitable regions outside these established clusters, provided that power availability, connectivity, and environmental requirements can still be met.
Geographic Information Systems (GIS) provide a powerful framework for addressing this challenge by enabling integration of diverse spatial datasets, including climate indicators, environmental constraints, infrastructure networks, and socio-demographic factors. When combined with multi-criteria decision analysis (MCDA), GIS enables transparent and reproducible regional-scale screening of regional suitability [11]. This approach is widely used in spatial planning studies.
Accordingly, this study applies a GIS-based MCDA framework to identify suitable regions for sustainable data center development within the United Kingdom. Although the analysis is demonstrated using the UK as a case study, the methodological structure is designed to be transferable to other national contexts with different climatic, infrastructural, or regulatory characteristics. By integrating exclusion-based spatial screening, AHP-derived weighting, and WLC-based suitability aggregation, the framework provides a generalizable decision-support approach for infrastructure planning. The methodology can therefore support strategic digital infrastructure planning in countries with varying geographic conditions, infrastructure maturity, and environmental regulation regimes. In this way, the study contributes not only a UK-specific assessment but also a transferable spatial decision framework for sustainable data center siting.
This paper is structured as follows: Section 2 presents the literature review; Section 3 describes the methodology; Section 4 discusses the results; and Section 5 concludes the study.

2. Literature Review

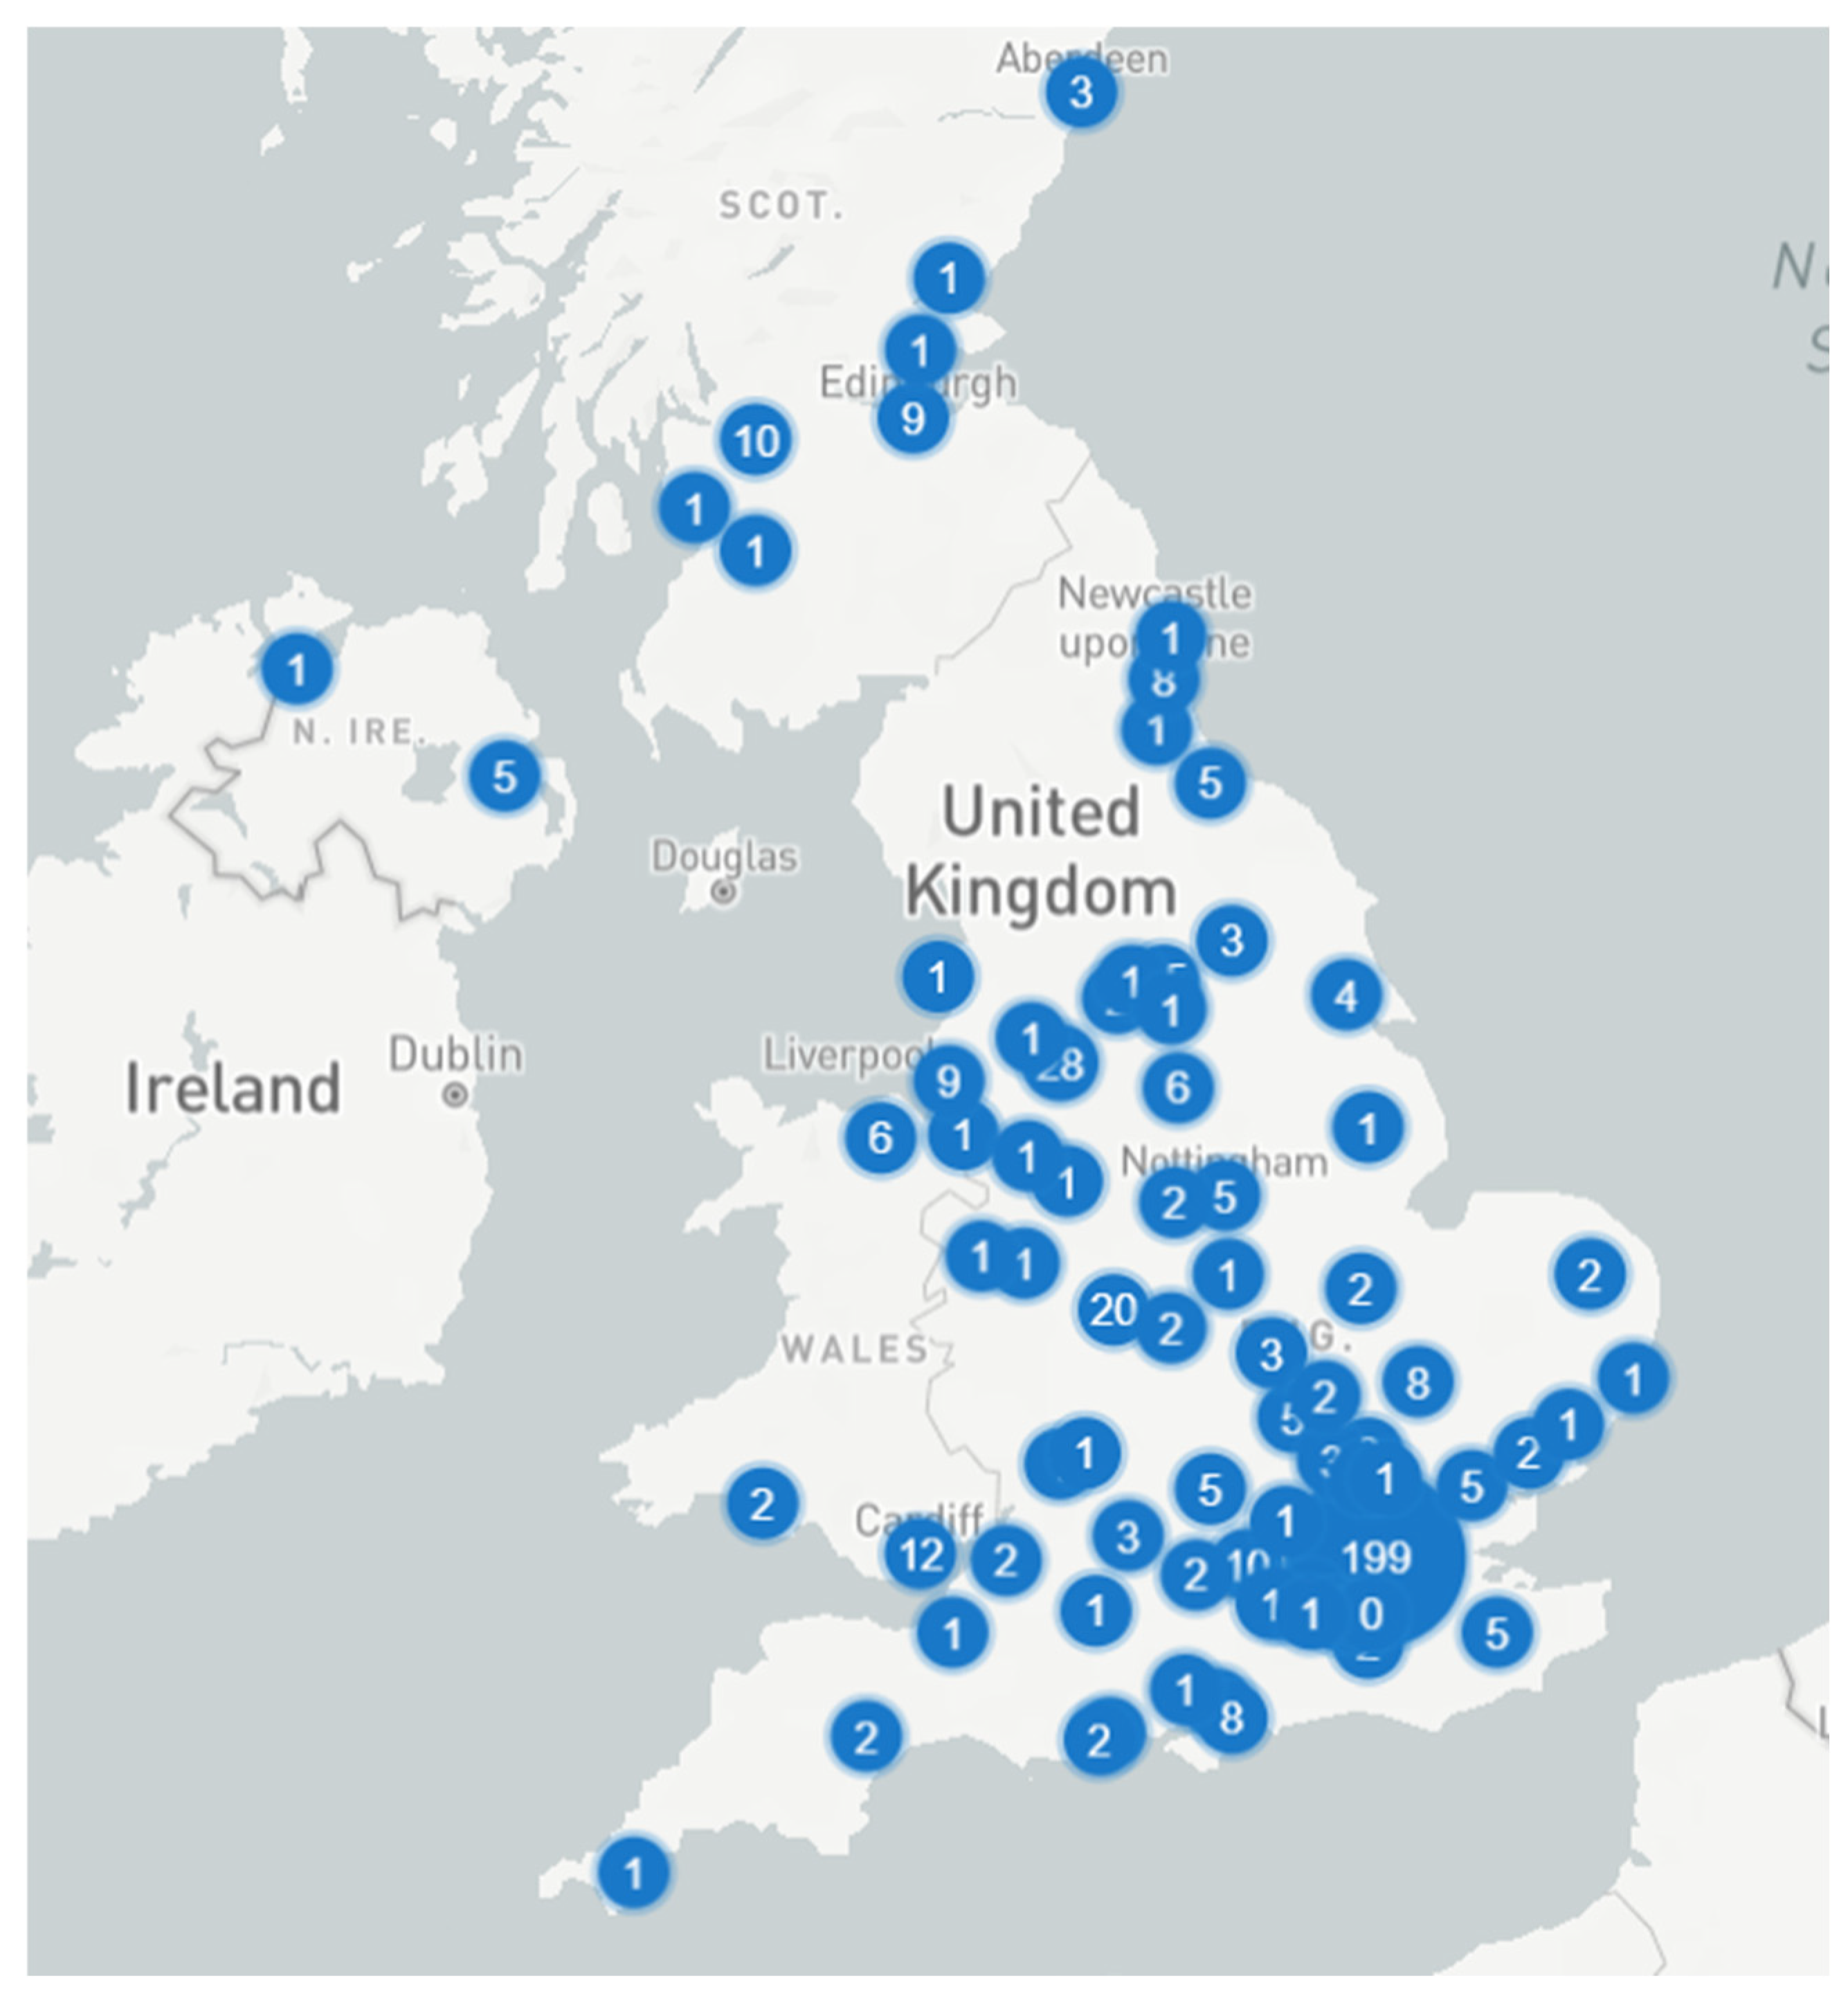
Recent literature highlights that DCs have evolved into energy-intensive, large-scale infrastructures whose environmental footprint is increasingly shaped by location rather than only internal design. As global digital demand expands, driven by cloud computing, artificial intelligence, and edge services, the siting of new DCs has become a central sustainability concern [10,12]. Studies consistently show that location selection strongly influences electricity consumption, cooling efficiency, exposure to climate hazards, and long-term operational resilience. Sustainability and energy efficiency are primary objectives, with numerous centers implementing green technologies to minimize expenses and environmental effects. Figure 1 shows the spatial distribution of existing data centers. The location of the current sites is strategically located in proximity to demand, connectivity, and infrastructure, along with power supply and resilience. The densely populated region with the data center can be seen to be dominant in the region with the UK’s human population concentration, that include Southeast of England and London [13]. This has resulted in better connectivity and infrastructure in those regions with constant power availability [14,15].
Constraints include ecological boundaries, legal compliance, physical site limitations, initial and operational budget caps, and others. Site-specific climate affects energy design techniques and HVAC system selections. DCs must follow building regulations and standards, including ASHRAE 62.1 [17] for ventilation and indoor air quality, ASHRAE 90.1 [18] for energy efficiency, and ASHRAE 189.1 [19] for green building design. Physical limitations encompass the potential of floor loading, the heights of ceilings, and the availability of space for power and cooling equipment. Moreover, DCs encounter limitations regarding power supply and network access [20].
Factors affecting DC performance modeling encompass IT load density (kW per rack or per square meter), ambient temperature and humidity, airflow rates, cooling system capacity, and power distribution losses. Energy modelling variables encompass dynamic load profiles, equipment efficiency curves, and control techniques, including economizer utilization and variable-speed drives [9]. BAS interrogation variables include sensor measurements, control setpoints, and system alerts. The precise modelling and regulation of these factors facilitate the optimization of energy consumption and environmental conditions, while guaranteeing system dependability [21].
Countries have adopted several policy measures to lessen the negative effects that DCs have on the environment. While some regions have changed their regulations to enforce more stringent environmental requirements, others have implemented moratoriums to temporarily halt the establishment of new DCs. For instance, Germany and the UK have chosen to make modifications, concentrating on energy efficiency and the strategic positioning of DCs to balance expansion with sustainability, while Singapore and the Netherlands have implemented moratoriums to slow down the swift increase in DCs [22].

2.1. Energy Demand, Efficiency Metrics and Environmental Pressure

Several studies estimate that DCs consume a substantial and growing share of global electricity, with continued upward pressure expected as digital workloads increase [15]. This has led to widespread use of performance metrics to quantify operational efficiency. Power Usage Effectiveness (PUE) is commonly applied to assess electrical efficiency, while Water Usage Effectiveness (WUE) has gained importance due to increasing concerns around cooling water demand and regional water stress [12].
Literature increasingly stresses that low PUE values alone do not guarantee sustainability, because they do not capture carbon intensity or resource depletion. As a result, researchers argue that regional selection should consider not only cooling efficiency but also regional electricity infrastructure, water availability, and environmental sensitivity [12,23].

2.2. Climate Conditions, Cooling Strategies, and Regional Suitability

Ambient climate conditions play a major role in DC cooling performance. Multiple studies show that cooler regions allow extended use of free-cooling or hybrid cooling systems, reducing reliance on mechanical refrigeration and lowering total energy demand [21]. Rather than defining strict temperature limits, recent research treats temperature as a continuous driver of cooling energy, where incremental differences in mean conditions can significantly affect operational costs.
Humidity and precipitation also influence DC performance, though their effects are often indirect. Consequently, climate variables are increasingly incorporated into GIS-based suitability frameworks as graded criteria rather than binary constraints, particularly in temperate regions such as the UK [23].
An emerging topic in the literature is waste heat recovery from DCs. While technically feasible, studies indicate that meaningful heat reuse depends strongly on proximity to urban areas or district heating networks, which introduces a trade-off between climatic suitability and spatial integration [24]. These findings indicate that climatic conditions directly influence cooling efficiency and operational energy demand, making temperature, humidity, and frost frequency important variables in spatial suitability assessments.

2.3. Water Use, Cooling Trade-Offs, and Environmental Risk

Water consumption has become a growing concern in DC sustainability studies. Although evaporative and adiabatic cooling systems can reduce electricity use, they increase dependence on local water resources. Recent reviews emphasize that proximity to rivers or lakes does not automatically imply sustainable cooling, particularly in regions already classified as water-stressed [12].
The literature therefore frames water availability as a risk-moderated advantage rather than a universally positive factor. Studies recommend that water proximity be treated cautiously in region selection models, especially where abstraction may impact ecosystems or compete with agricultural and domestic demand [12]. Regions experiencing higher water stress may restrict the feasibility of water-intensive cooling technologies, necessitating dry or hybrid cooling approaches.

2.4. Infrastructure Access: Power, Transport, and Connectivity

Reliable access to electrical infrastructure is consistently identified as one of the most critical siting factors for DCs. GIS-based studies across energy infrastructure planning show that proximity to substations and transmission corridors strongly influences feasibility and connection cost and is therefore frequently assigned high weight in suitability analysis [25,26].
Connectivity is similarly essential, although detailed fiber-optic datasets are often unavailable. Several studies therefore adopt proxy indicators such as population density, proximity to existing infrastructure clusters, and transport corridors to represent likely access to digital connectivity and skilled labor [24]. While imperfect, this approach is widely accepted for regional-scale screening when data limitations are explicitly acknowledged.

2.5. UK Data Center Distribution

In the UK context, DC development has historically been concentrated around London and the Southeast, with secondary clusters around Manchester and other major urban centers. Figure 1 illustrates the current spatial distribution of DCs across the UK, based on publicly available industry mapping data [16]. This concentration reflects proximity to population centers, connectivity infrastructure, and business demand, but it also highlights the potential risks of spatial clustering, including grid congestion, land scarcity, and flood exposure.

2.6. Land Use Constraints, Protected Areas, and Planning Context

Land availability and regulatory constraints are recurring themes in DC siting literature. Large DC developments require substantial land areas, often creating competition with agriculture or other rural land uses. Even where economic land prices are excluded, studies show that land-use compatibility and planning acceptance strongly affect feasibility [24].
Protected areas such as Areas of Outstanding Natural Beauty (AONB) and Sites of Special Scientific Interest (SSSI) are commonly treated as exclusion zones in GIS-MCDA studies [24]. While these designations do not represent all ecologically valuable land, they are frequently used as representative constraints in proof-of-concept models.

2.7. Standards, Automation, and Operational Modeling

Engineering standards such as ASHRAE 90.1 establish baseline requirements for energy-efficient building operation, including DCs [18]. These standards indirectly reinforce the importance of climate-aware siting, as ambient conditions influence the feasibility of meeting efficiency targets.
At the operational level, building automation systems (BAS) and dynamic energy models are widely discussed as tools for improving DC efficiency and reliability. Recent studies demonstrate that real-time monitoring and control of IT loads, cooling systems, and airflow can significantly reduce energy consumption [27].

2.8. GIS–MCDA and Hazard Considerations

MCDA has become a standard approach for regional infrastructure siting, including DCs treated as critical infrastructure [24,26]. Weighted overlay methods allow integration of heterogeneous criteria and transparent comparison between candidate regions.
In the UK, seismic hazards are generally low compared to plate-boundary regions, as confirmed by recent national hazard models [28]. As a result, seismic risk is typically treated as a low-weight screening factor, while flood risk receives greater emphasis due to higher operational relevance.
Overall, the literature shows that sustainable DC siting requires balancing power and connectivity access, climate-driven cooling efficiency, water and environmental constraints, hazard avoidance, and planning considerations. GIS-MCDA is widely recognized as a suitable tool for regional-scale screening because it enables transparent integration of these diverse factors [24,26]. Building on these approaches, the present study applies a GIS-based MCDA framework to integrate climate suitability, infrastructure accessibility, and environmental constraints for national-scale data center site screening in the UK.

3. Methodology

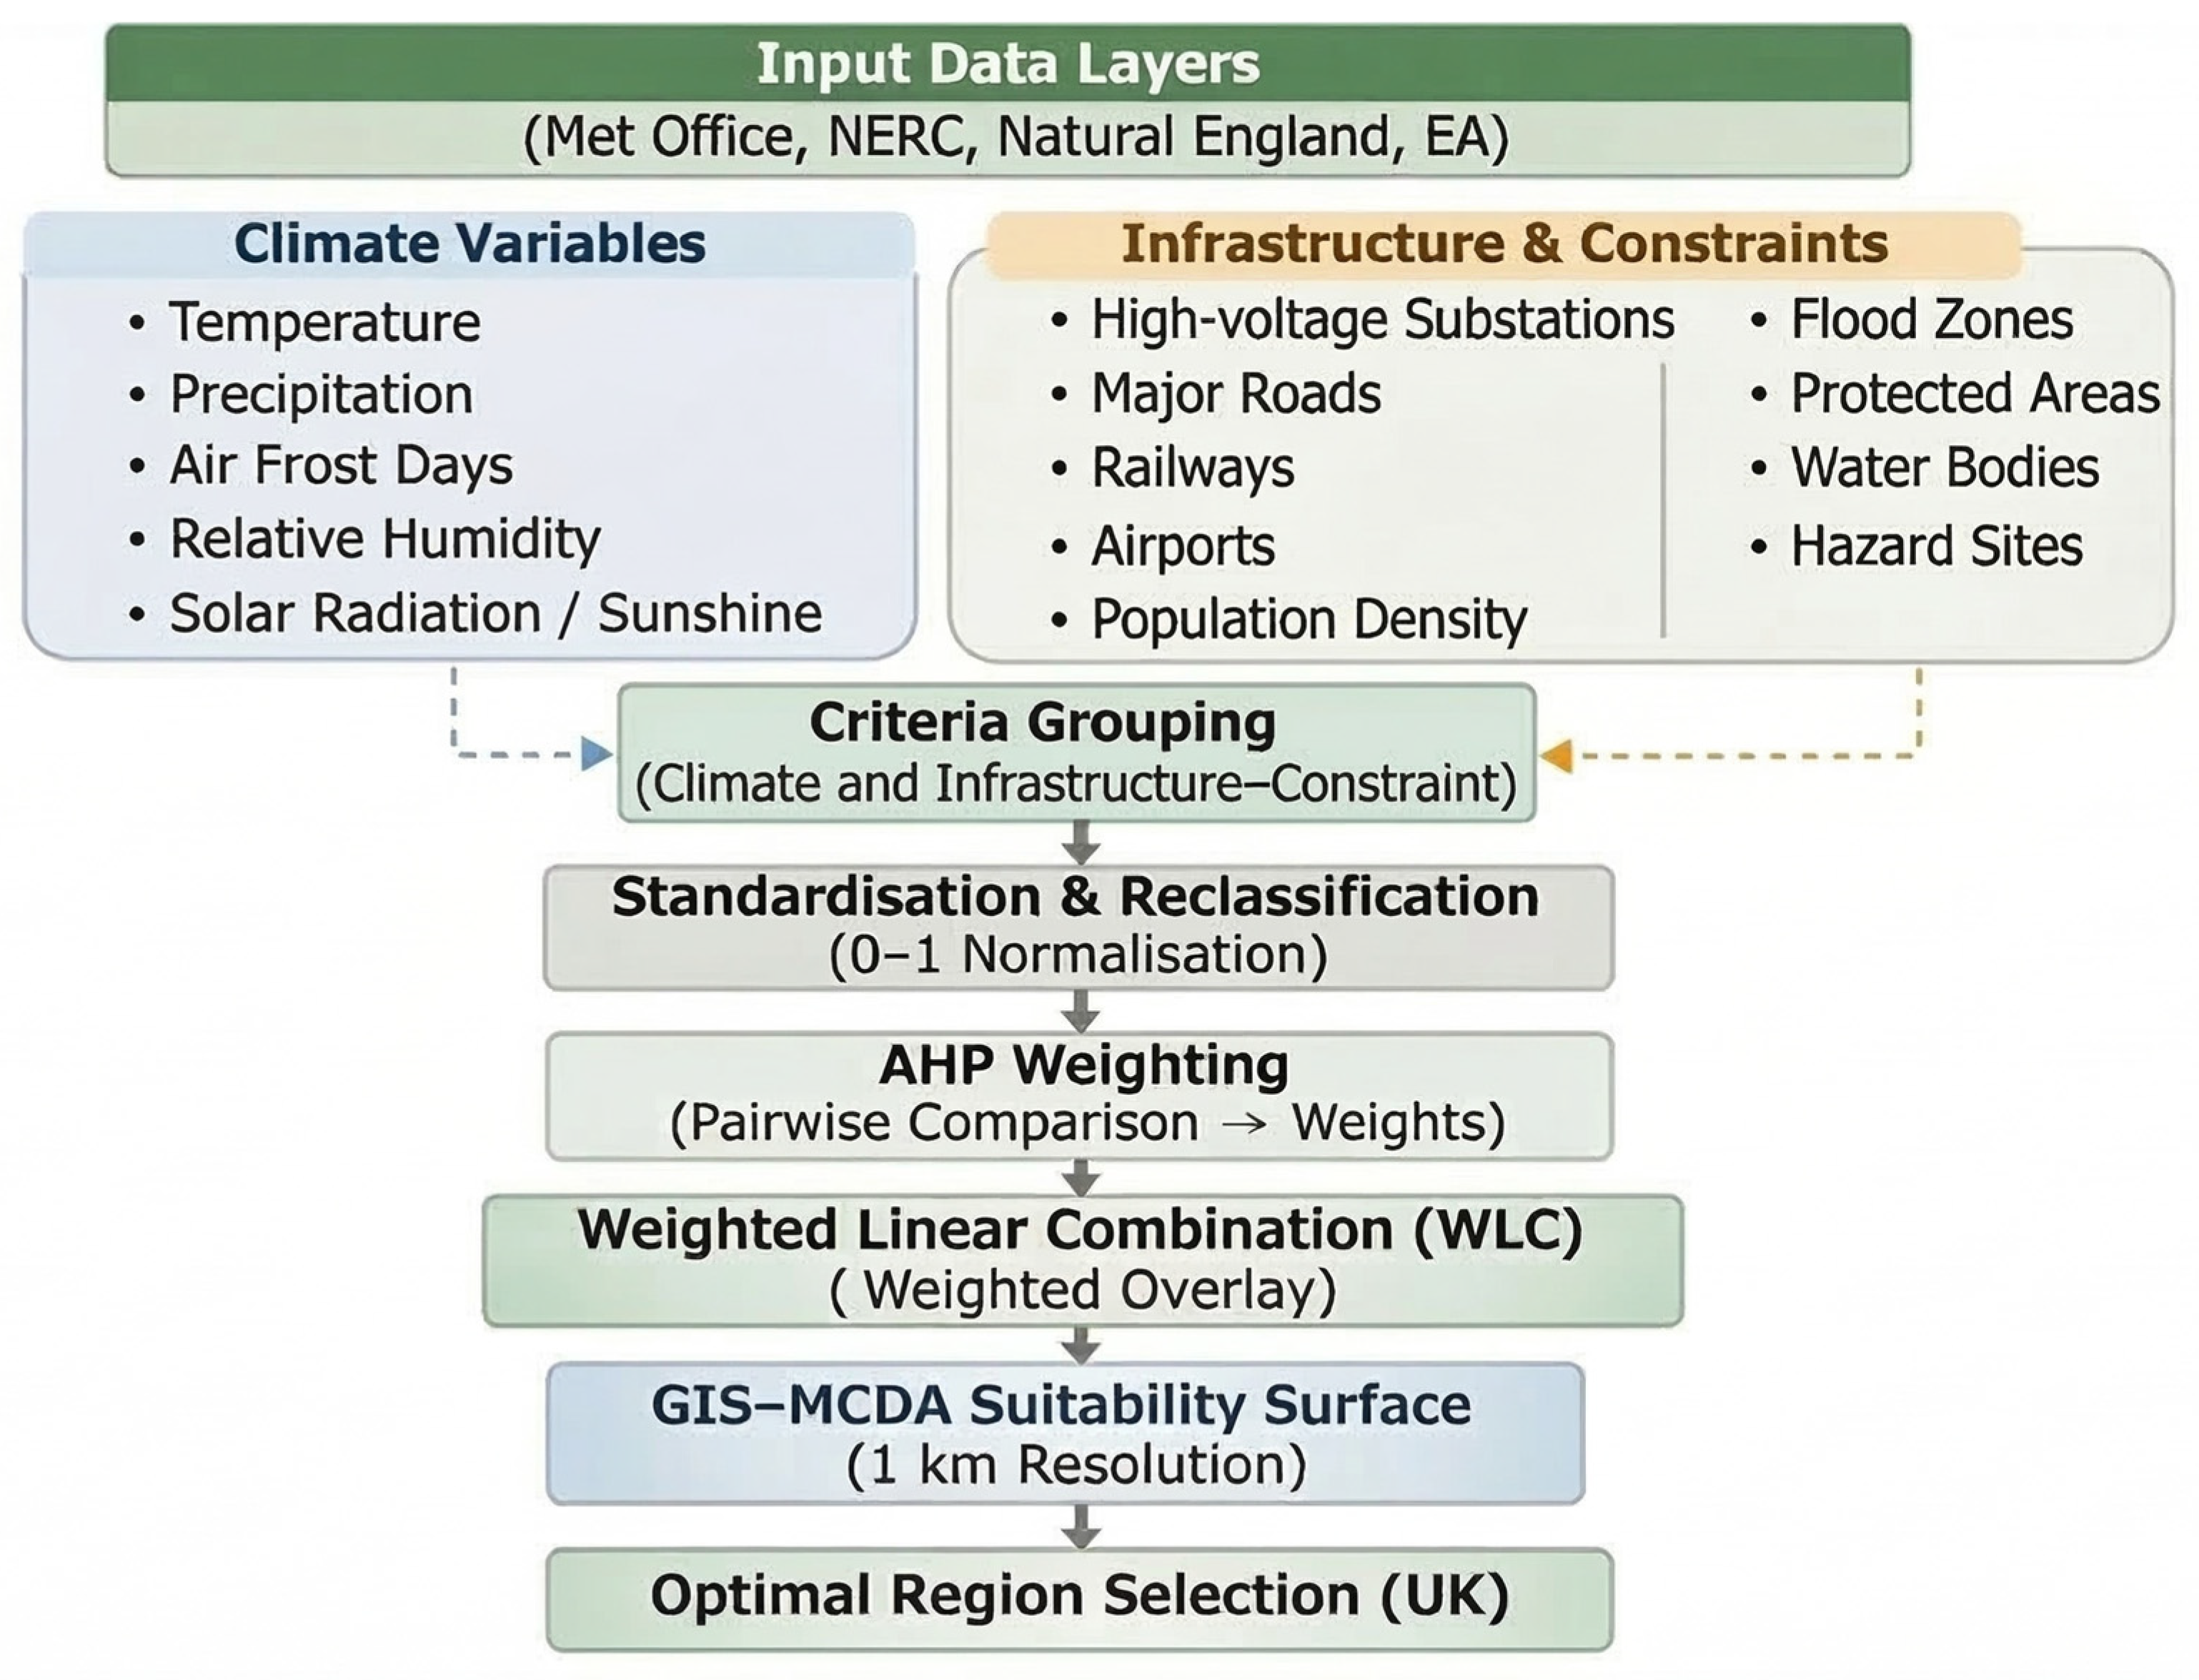
Figure 2 summarizes the GIS-based MCDA workflow adopted for regional data center screening. The criteria were organized into two main groups: climate suitability and infrastructure-constraint factors. The methodological structure was informed by previous GIS-MCDA studies [29,30,31]. Climate-related variables were included to represent cooling suitability and broader environmental exposure, while infrastructure and constraint variables were used to assess development feasibility, accessibility, and regulatory limitations. All spatial datasets were processed in QGIS 3.34 (QGIS Development Team, Open Source Geospatial Foundation, Beaverton, OR, USA) using raster standardization, binary exclusion screening, and weighted overlay analysis. All external GIS datasets used in this study were obtained from publicly available national repositories and are cited in the caption of the corresponding maps to ensure transparency and reproducibility.

3.1. GIS-MCDA for Large-Scale Infrastructure Siting

GIS-MCDA has been used widely for location selection of large infrastructure projects, in particular when spatial constraints are complex and many factors must be looked at together. In the renewable energy sector, GIS-MCDA is now a common approach to identify suitable locations for wind farms, solar parks, and other energy-related projects [25]. More recently, similar ideas have been applied to digital infrastructure, where data centers are increasingly treated as energy-intensive facilities similar to power plants or industrial developments [32].
The main advantage of GIS-MCDA is that it allows different criteria to be combined, even if they are not easy to compare directly, such as climate, infrastructure access, and land-use limits. Rather than focusing on one variable only, regions can be ranked using an overall suitability score. This is especially relevant for data center siting, which is usually carried out at regional or national scale, rather than for a specific plot of land [21].
Based on this, a GIS-based MCDA framework was implemented in QGIS, structured in six main steps: (1) definition of criteria and constraints; (2) data collection and pre-processing; (3) spatial normalization and reclassification; (4) assignment and justification of criteria weights; (5) exclusion screening and weighted overlay; and (6) identification and comparison of candidate regions.

3.2. Criteria Definition and Grouping

For the GIS-based MCDA, the input layers were organized into two main groups as stated earlier and demonstrated using Figure 2.
Within the GIS–MCDA framework, variables were further classified into two functional categories. Hard constraints were applied through binary exclusion to remove locations unsuitable for development, including protected areas, flood zones, and safety buffers around critical infrastructure. Weighted suitability criteria were standardized and incorporated into the weighted overlay analysis to evaluate relative site suitability.
The climate criterion includes variables that influence cooling performance and renewable potential, namely mean annual air temperature, number of air frost days, relative humidity, and solar radiation, including sunshine hours. The infrastructure and constraints group covers feasibility and risk factors, including proximity to high-voltage electrical substations, distance to major roads and railways, population density as a proxy for workforce and connectivity, designated protected areas such as AONB, SSSI, Heritage Coasts and nature recovery areas, flood-related indicators such as heavy precipitation days and mapped flood zones, and proximity buffers around airports, overhead lines, and other hazard sites as nuclear plants and chemical facilities. These variables form the basis of the exclusion screening and the weighted overlay suitability analysis.

3.3. Analytic Hierarchy Process for Criteria Weighting

The Analytic Hierarchy Process (AHP) was employed to formalize decision priorities in a transparent and consistency-checked manner before weighted overlay analysis [26,33,34]. AHP was applied at the criterion level to derive weights for the final set of standardized criteria used in the weighted overlay. Although criteria were conceptually grouped into climate suitability and infrastructure constraints (Section 3.2), the pairwise comparison was performed across the final criteria set (Table 1) to obtain a single priority vector for WLC integration.
Pairwise comparisons were conducted using Saaty’s nine-point fundamental scale to express the relative importance of each criterion, based on data center operational requirements, regulatory considerations, and guidance from the literature [33]. For the AHP, climate was treated as a single composite criterion. Mean annual temperature, air frost days, relative humidity, and solar radiation were first normalized and combined using equal weights to form a unified climate suitability index, which was then entered into the pairwise comparison matrix as one criterion. Higher priority was assigned to grid accessibility and environmental compliance, followed by climate-related cooling indicators, while transport accessibility and population density were treated primarily as enabling factors. The resulting pairwise comparison matrix is presented in Table 1.
Following Saaty’s formulation [33], the pairwise comparison matrix A was defined as shown in Equation (1):
A = a i j , a i j = w i w j
where a i j represents the relative importance of criterion i over criterion j , and w i denotes the priority weight of criterion i . In this reciprocal matrix, if criterion i is judged to be more important than criterion j , then a i j > 1 , and correspondingly a j i = 1 / a i j . Thus, the matrix structure reflects the proportional relationships among the unknown weights.
To estimate the weights from the comparison matrix, Saaty’s eigenvalue method was applied [33]. The priority vector W was obtained by solving the eigenvalue problem shown in Equation (2):
A W = λ m a x W
where λ m a x is the maximum eigenvalue of matrix A . In practice, this means that the weight vector W is the normalized principal eigenvector of A . The resulting priority vector W was normalized such that i = 1 n w i = 1 , ensuring the weights form a proper convex combination for subsequent integration within the WLC framework. When the matrix is perfectly consistent, λ m a x equals the number of criteria n , and the proportional relationships in Equation (1) are satisfied exactly. Deviations of λ m a x from n indicate inconsistency in the pairwise judgments, which is subsequently evaluated using the Consistency Index ( C I ) and Consistency Ratio ( C R ).
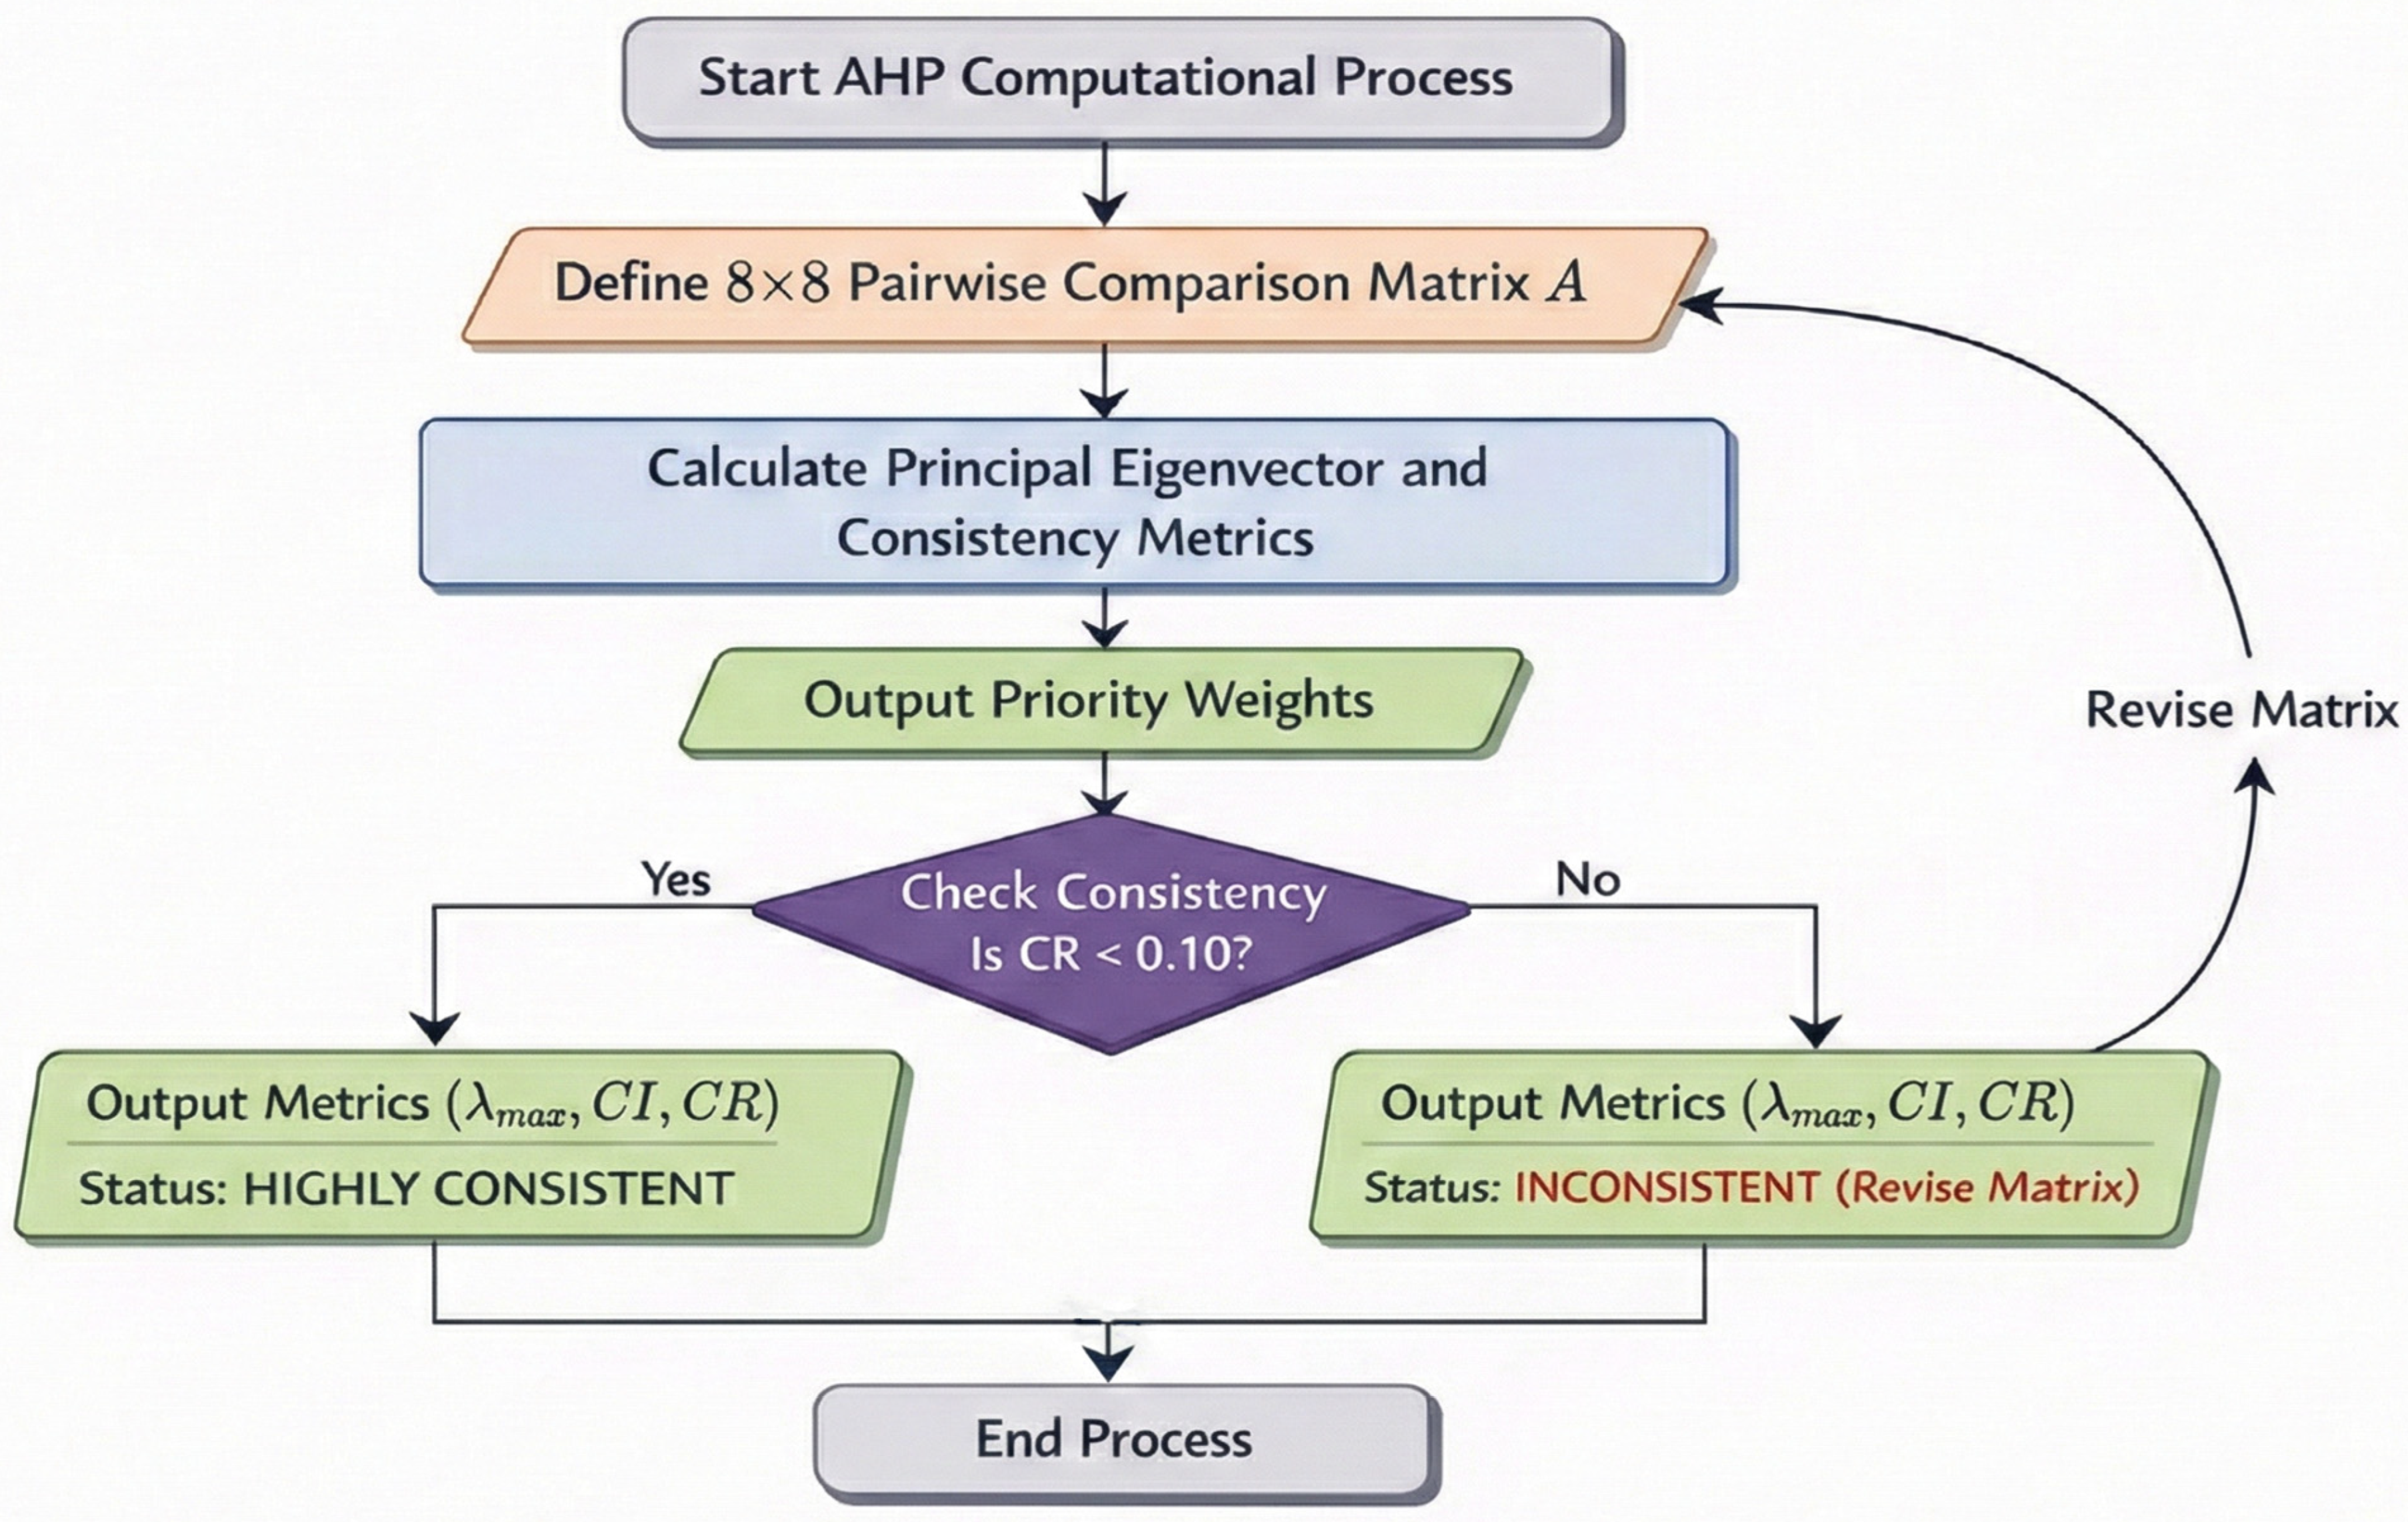
The computational procedure adopted for the AHP weighting process is illustrated in Figure 3. The workflow summarizes the construction of the pairwise comparison matrix, derivation of the principal eigenvector, calculation of CI and CR, and the consistency verification step that determines whether the matrix must be revised before accepting the final priority weights.
The consistency of the pairwise judgments was evaluated using the Consistency Index ( C I ) and Consistency Ratio ( C R ) [33]:
C I = λ m a x n n 1 , C R = C I R I
where n is the number of criteria and R I is the Random Index. A threshold of C R < 0.10 was adopted to ensure acceptable consistency of the comparison matrix. The derived weights satisfied this criterion and were subsequently integrated into the spatial suitability model for weighted overlay analysis.
The derived priority weights and associated consistency indicators are summarized in Table 2. All comparison matrices satisfied the consistency requirement, and the resulting weights were subsequently integrated into the spatial suitability model for weighted overlay analysis.
The relative importance between criteria was quantified using Saaty’s fundamental nine-point scale, where a value of 1 indicates equal importance, 3 denotes moderate importance, 5 represents strong importance, 7 indicates very strong importance, and 9 reflects extreme importance of one criterion over another. Intermediate values (2, 4, 6, and 8) were used to express compromise judgments between adjacent levels. Reciprocals of these values were applied when criterion j was judged to be more important than criterion i. This scale provides a structured and widely accepted framework for translating qualitative expert and literature-based assessments into quantitative pairwise comparison values [33].

Justification for Pairwise Comparison Matrix

The values assigned in the pairwise comparison matrix were derived from a synthesis of published literature on data center energy dependence, cooling performance, digital connectivity requirements, and regulatory constraints, together with operational characteristics relevant to the UK context. Pairwise judgements were encoded using Saaty’s nine-point fundamental scale (1 = equal importance; 3/5/7 = moderate/strong/very strong dominance; 9 = extreme dominance; reciprocals for the opposite direction) [33]. Thus, values such as 1/3 or 1/9 are not arbitrary fractions; they are reciprocal expressions of explicit dominance levels on the same scale and follow a consistent logic.
The criteria were structured hierarchically into (i) dominant operational and feasibility factors (climate suitability, grid infrastructure, telecommunication infrastructure, and protected areas), (ii) secondary enabling factors (Water Bodies, Population Density, and Road Access), and (iii) background risk-modifying factors (hydro-hazard).
Grid and protected areas were prioritized as primary feasibility constraints because they are the least substitutable in practice. Reliable electricity supply is non-negotiable for uptime, and regulatory compliance can function as a veto. Takci et al. [35] emphasize that operational stability and flexibility are fundamentally constrained by grid capacity and regulation, supporting moderate-to-strong dominance values (typically 2–4) over secondary indicators. Industry guidance similarly identifies power availability and planning compliance as primary screening criteria in regional data center site selection [36]. In this sense, these factors define basic viability limits.
Telecommunication and digital infrastructure were also treated as primary feasibility constraints. Engineering and planning studies consistently identify proximity to backbone infrastructure (e.g., fiber routes, Points of Presence, gateways, and cable landing stations) as central for latency, redundancy, and reliability. Accordingly, telecom was weighted comparably to core infrastructure requirements [35,37]. Human geography further shows that data centers are highly place-dependent infrastructures, concentrating where power, networks, and supportive governance exist. These spatial patterns reinforce the high placement of digital infrastructure in the hierarchy, even if this dependency is sometimes under-estimated or just overlooked [29].
Climate suitability was grouped as a key operational optimization criterion reflecting cooling-energy burden. Cooling can represent a substantial share of total electricity use [30]. Temperature and humidity affect free-cooling availability and system efficiency. Turek and Radgen [31] show that even mesoclimatic variation over tens of kilometers can materially reduce cooling demand, supporting climate as a high-impact operational factor. Although climate effects can be partly mitigated through technological and design measures, their persistent influence on long-term operational costs justified assigning climate the highest overall priority in the pairwise comparison matrix, with moderate dominance (2–3) over enabling factors and very strong dominance (7) over background hazards. Accordingly, the ‘Climate’ entry in Table 1 represents the composite climate suitability index (temperature, air frost days, relative humidity, and solar radiation/sunshine hours).
Population/workforce and transport accessibility were treated mainly as enabling conditions. They influence construction logistics and labor availability but rarely override constraints imposed by power, connectivity, and planning [38]. Water bodies were treated as a conditional factor rather than a universal benefit, because proximity to major lakes and wetlands can increase flood exposure and ecological/planning sensitivity in the UK context.
Solar radiation was incorporated within the climate criterion (rather than retained as a standalone criterion) to reflect its interaction with thermal/meteorological conditions relevant to DC operation and broader environmental exposure. Consistent with the literature, renewable procurement for DCs is often achieved through contractual mechanisms (e.g., Power Purchase Agreements) rather than relying on on-site PV alone, mainly due to site and grid integration constraints and planning limits [39].
Finally, hydro-hazard was retained as a background risk modifier. Flooding and extreme rainfall pose operational risk, but modern engineering can reduce exposure; therefore, hazards were assigned the lowest relative importance while still being penalized spatially through exclusion and constraint handling [40].
Overall, the adopted matrix reflects a transparent hierarchy in which non-substitutable feasibility constraints (power, digital connectivity, regulatory compliance) and optimizable operational factors (climate) dominate enabling or conditional factors (roads, population, water bodies) and background hazards. This structure is consistent with both technical and socio-spatial literature on data center siting, even if minor uncertainties remain.
Table 2 shows the derived priority weights for each criterion, together with the corresponding CI and CR values, demonstrating that the pairwise comparison matrices satisfy the accepted consistency threshold and provide a reliable basis for subsequent weighted overlay analysis.

3.4. Weighted Overlay in Spatial Suitability Mapping

The criterion weights derived using AHP were subsequently integrated into the Weighted Linear Combination (WLC) framework. Each standardized raster layer was multiplied by its corresponding AHP-derived weight and aggregated to generate the composite suitability surface.
WLC is one of the most commonly used techniques for GIS-based suitability analysis [34]. In this method, each spatial layer is first normalized and then given a weight depending on how important it is considered. The final suitability score is then calculated by summing all the weighted layers together [34].
This technique has been used in many infrastructure planning studies. Several renewable energy assessments combine WLC with the AHP to define relative importance between criteria such as grid proximity, land slope, and environmental constraints [25,26,34,40,41]. The popularity of weighted overlay comes mainly from its simplicity and ease of understanding, although the subjectivity in assigning weights is often mentioned as a limitation. Even so, the method continues to be used across different sectors, including energy, telecommunications, waste management, and more recently, regional data center siting and suitability assessment [42].
Within the GIS-MCDA, criteria were weighted according to the AHP-derived priority values reported in Table 2. Climate was represented as a single composite criterion (Section 3.3) and assigned the highest weight (0.250), reflecting its dominant influence on cooling demand and operational efficiency. Grid infrastructure, telecommunication infrastructure, and protected areas were each assigned a weight of 0.154, reflecting their role as key feasibility and compliance-related constraints. Water bodies and population density were weighted at 0.0847, while road access was assigned 0.0795. Hydro-hazard was assigned the lowest weight (0.0390) as a background risk-modifying factor. The climate suitability component was implemented as a single composite raster C climate ( x ) , formed by equally combining standardized temperature, frost-day, relative humidity, and solar radiation/sunshine hours layers before AHP weighting.
The AHP results were used to inform the final weighting scheme, with the derived priority values interpreted and manually implemented in the QGIS weighted overlay environment. All suitability maps and composite scores presented in this study were generated using this AHP-informed weighting structure.

3.5. Environmental Constraints (Climate and Hazards)

For data centers, ambient temperature is particularly important because it directly affects cooling demand. Locations with lower average temperatures are generally preferred, as they allow reduced mechanical cooling and lower energy consumption [10,23]. While ambient temperature has a significant role to play, air frost, rainfall, and humidity cannot be ignored as they directly contribute to the ambient temperature, thus giving them reasonable weightage while doing the analysis. In addition, climate-related risks and adaptation considerations are increasingly emphasized in UK digital infrastructure planning, particularly with respect to flooding, overheating, and extreme weather resilience [43]. This further justifies the inclusion of climate and hazard indicators within the suitability framework.
Environmental conditions play a key role in determining the suitability of regions for energy-intensive infrastructure. Many GIS-MCDA studies include climate-related factors such as ambient temperature, humidity, flood risk, and solar radiation. Studies on energy infrastructure show that ignoring spatial variations in climate can result in inefficient or higher-risk siting decisions [23]. On the other hand, flood-prone regions and areas with high humidity are often penalized or excluded due to risks such as corrosion, equipment failure, and service disruption. Solar radiation is sometimes included, not mainly for power generation, but more as an indicator of thermal stress on buildings [23]. Seismic risk was reviewed as part of the broader hazard context for UK data center siting; however, given its generally low significance relative to flood-related risks, it was not retained as an explicit criterion in the GIS-based suitability model [28].

3.6. Proximity to Power Infrastructure (Grid Access)

Access to reliable electrical infrastructure is consistently identified as a critical factor in data center regional selection and siting decisions. In GIS-based suitability models, proximity to high-voltage substations and transmission corridors is often treated as an important constraint, since connection distance affects both cost and technical feasibility. Similar findings are well established in renewable energy siting literature, where grid access is often given a relatively high weight [21,25].
Onshore wind and solar energy studies commonly prioritize locations close to substations in order to reduce grid connection costs and transmission losses [25]. Comparable approaches are also used in data center screening studies, supporting the treatment of grid proximity as one of the dominant factors in regional suitability analysis [21].

3.7. Population Density and Transport as Connectivity Proxies

When detailed fiber-optic network data are not publicly available, population density and transport infrastructure are often used as proxy indicators for digital connectivity. The assumption behind this is that areas with higher population density and well-developed transport networks are more likely to be served by high-capacity communication infrastructure and also skilled labor.
Several GIS-based studies in infrastructure and telecommunication planning use population density and road accessibility as key indicators when direct network data is not available [26]. A similar approach is used in data center studies, where proximity to highways and urban centers is treated as an indirect measure of connectivity and accessibility. Research on telecommunication infrastructure planning further supports the use of demographic indicators as reasonable proxies for network demand and backbone presence [41]. In terms of population density, the Northeast England region had the highest score (0.084684) due to its relatively higher population density.

3.8. Protected Areas as Exclusion Zones

Environmental protection policies require certain types of land to be excluded from development. Within GIS-MCDA frameworks, this is commonly done by defining protected areas such as National Parks, Areas of Outstanding Natural Beauty (AONB), and Sites of Special Scientific Interest (SSSI) as exclusion zones [26].
In the UK context, renewable energy and infrastructure siting studies consistently treat these areas as effectively non-developable due to planning restrictions and public opposition [22] Although these designations do not capture all areas of ecological value, they provide a practical representation of regulatory constraints at the national scale. As a result, many GIS-based suitability studies apply strict exclusion rules or buffer zones around protected areas [26].

3.9. Water Stress and Cooling Water Risks

Water availability has become an increasingly important consideration in regional selection and siting decisions, especially for facilities that rely on water-based cooling systems. Recent sustainability-focused frameworks explicitly include water availability as a siting criterion alongside energy and environmental factors [12].
Large data centers can consume large volumes of water, which may worsen water stress in regions already facing supply pressures. Because of this, some recent studies argue that proximity to water bodies should not automatically be treated as beneficial, particularly where abstraction could negatively affect local ecosystems [24]. Instead, water availability is more often treated as a conditional or weighted factor within GIS-MCDA models rather than a simple advantage [12].

3.10. Binary Exclusion Versus Gradual Climate Suitability

Earlier GIS-based siting approaches often relied on hard thresholds for climate variables, such as excluding all locations above a certain average temperature. However, more recent research has shown that such binary approaches can oversimplify the relationship between climate conditions and operational performance [31].
Studies using mesoscale climate modeling indicate that relatively small spatial temperature differences can lead to noticeable variations in cooling energy demand [31]. As a result, gradual or continuous suitability scoring is increasingly recommended, allowing warmer locations to be penalized rather than fully excluded. This approach better reflects real-world trade-offs and improvements in cooling technology [23].

3.11. Justification for 1 Km Spatial Resolution

A spatial resolution of 1 km was selected for the GIS analysis because most national scale datasets used in this study, including climate grids, population density layers, and environmental constraint datasets, are available or meaningful at a kilometer resolution. The purpose of the analysis is regional screening of suitable areas for data center development, rather than parcel-level land selection [31].
At this resolution, the analysis captures broad spatial patterns in climate suitability, infrastructure availability, and environmental constraints, while maintaining consistency between datasets and manageable computational demand. Smaller-scale features such as local drainage conditions, micro topography, and site-specific planning constraints are not fully represented at 1 km resolution and would require further site-level assessment once a suitable region has been identified. Table 3 summarizes the main exclusion constraints and proximity thresholds applied within the GIS analysis.

3.12. Shortlisted Candidate Regions

After preparing and standardizing all the spatial layers, the suitability surface was generated in two main stages. First, binary exclusion constraints were applied to remove non-developable areas from the analysis. These constraints aim to ensure only feasible land is considered. They included protected designations such as AONB and SSSI, flood zones, airport buffers, and defined proximity thresholds around nuclear and chemical facilities, as summarized in Table 3. This step significantly reduced the study area. It limited the analysis to locations that are spatially and regulatorily feasible, before any weighted scoring was performed, and therefore narrows down the range of potential sites quite considerably.
The second stage involved the application of a WLC framework. This approach combines multiple criteria into a single composite index, allowing trade-offs between factors to be represented in the final surface. The weights used in this aggregation were obtained through AHP, as detailed in Section 3.3. They are reported in Table 2 together with the associated CI and CR values. The low CR confirms that the pairwise comparison matrix is consistent. It also indicates that the derived priority structure is reliable overall. In other words, the weighting scheme applied in the spatial model is supported by an internally coherent decision structure, which increases the robustness of the final suitability outputs and strengthens the methodological transparency of the analysis.
The AHP-derived weights were then implemented directly within the GIS weighted overlay procedure to compute the composite suitability index S:
S = i = 1 n w i C i
where C i represents the standardized suitability score (scaled between 0 and 1) for the criterion i , and w i is the corresponding AHP-derived weight from Table 2. In this framework, AHP defines the relative importance between criteria, while WLC translates those relative priorities into a spatially explicit model.
Since the analysis was conducted at a 1 km raster resolution, the suitability score was calculated for every grid cell across the UK. This can be expressed as:
S ( x ) = i = 1 n w i C i ( x )
Here, x denotes an individual grid cell, and C i ( x ) represents the normalized value of the criterion i at that specific location. All C i ( x ) values were standardized to a common scale between 0 and 1 prior to weighting. Thus, each location receives its own composite score S ( x ) . The value of S ( x ) reflects how well that particular 1 km cell performs when all criteria are considered simultaneously, according to the AHP-derived importance structure. Higher values indicate stronger overall suitability under the defined assumptions.
The resulting national suitability surface, therefore, represents a continuous, weighted ranking of all feasible grid cells. Areas with consistently high S ( x ) values were then examined for spatial continuity and practical feasibility. Continuous high-scoring zones were grouped into broader regional clusters rather than isolated pixels, since the objective of this study is regional screening rather than parcel-level siting.
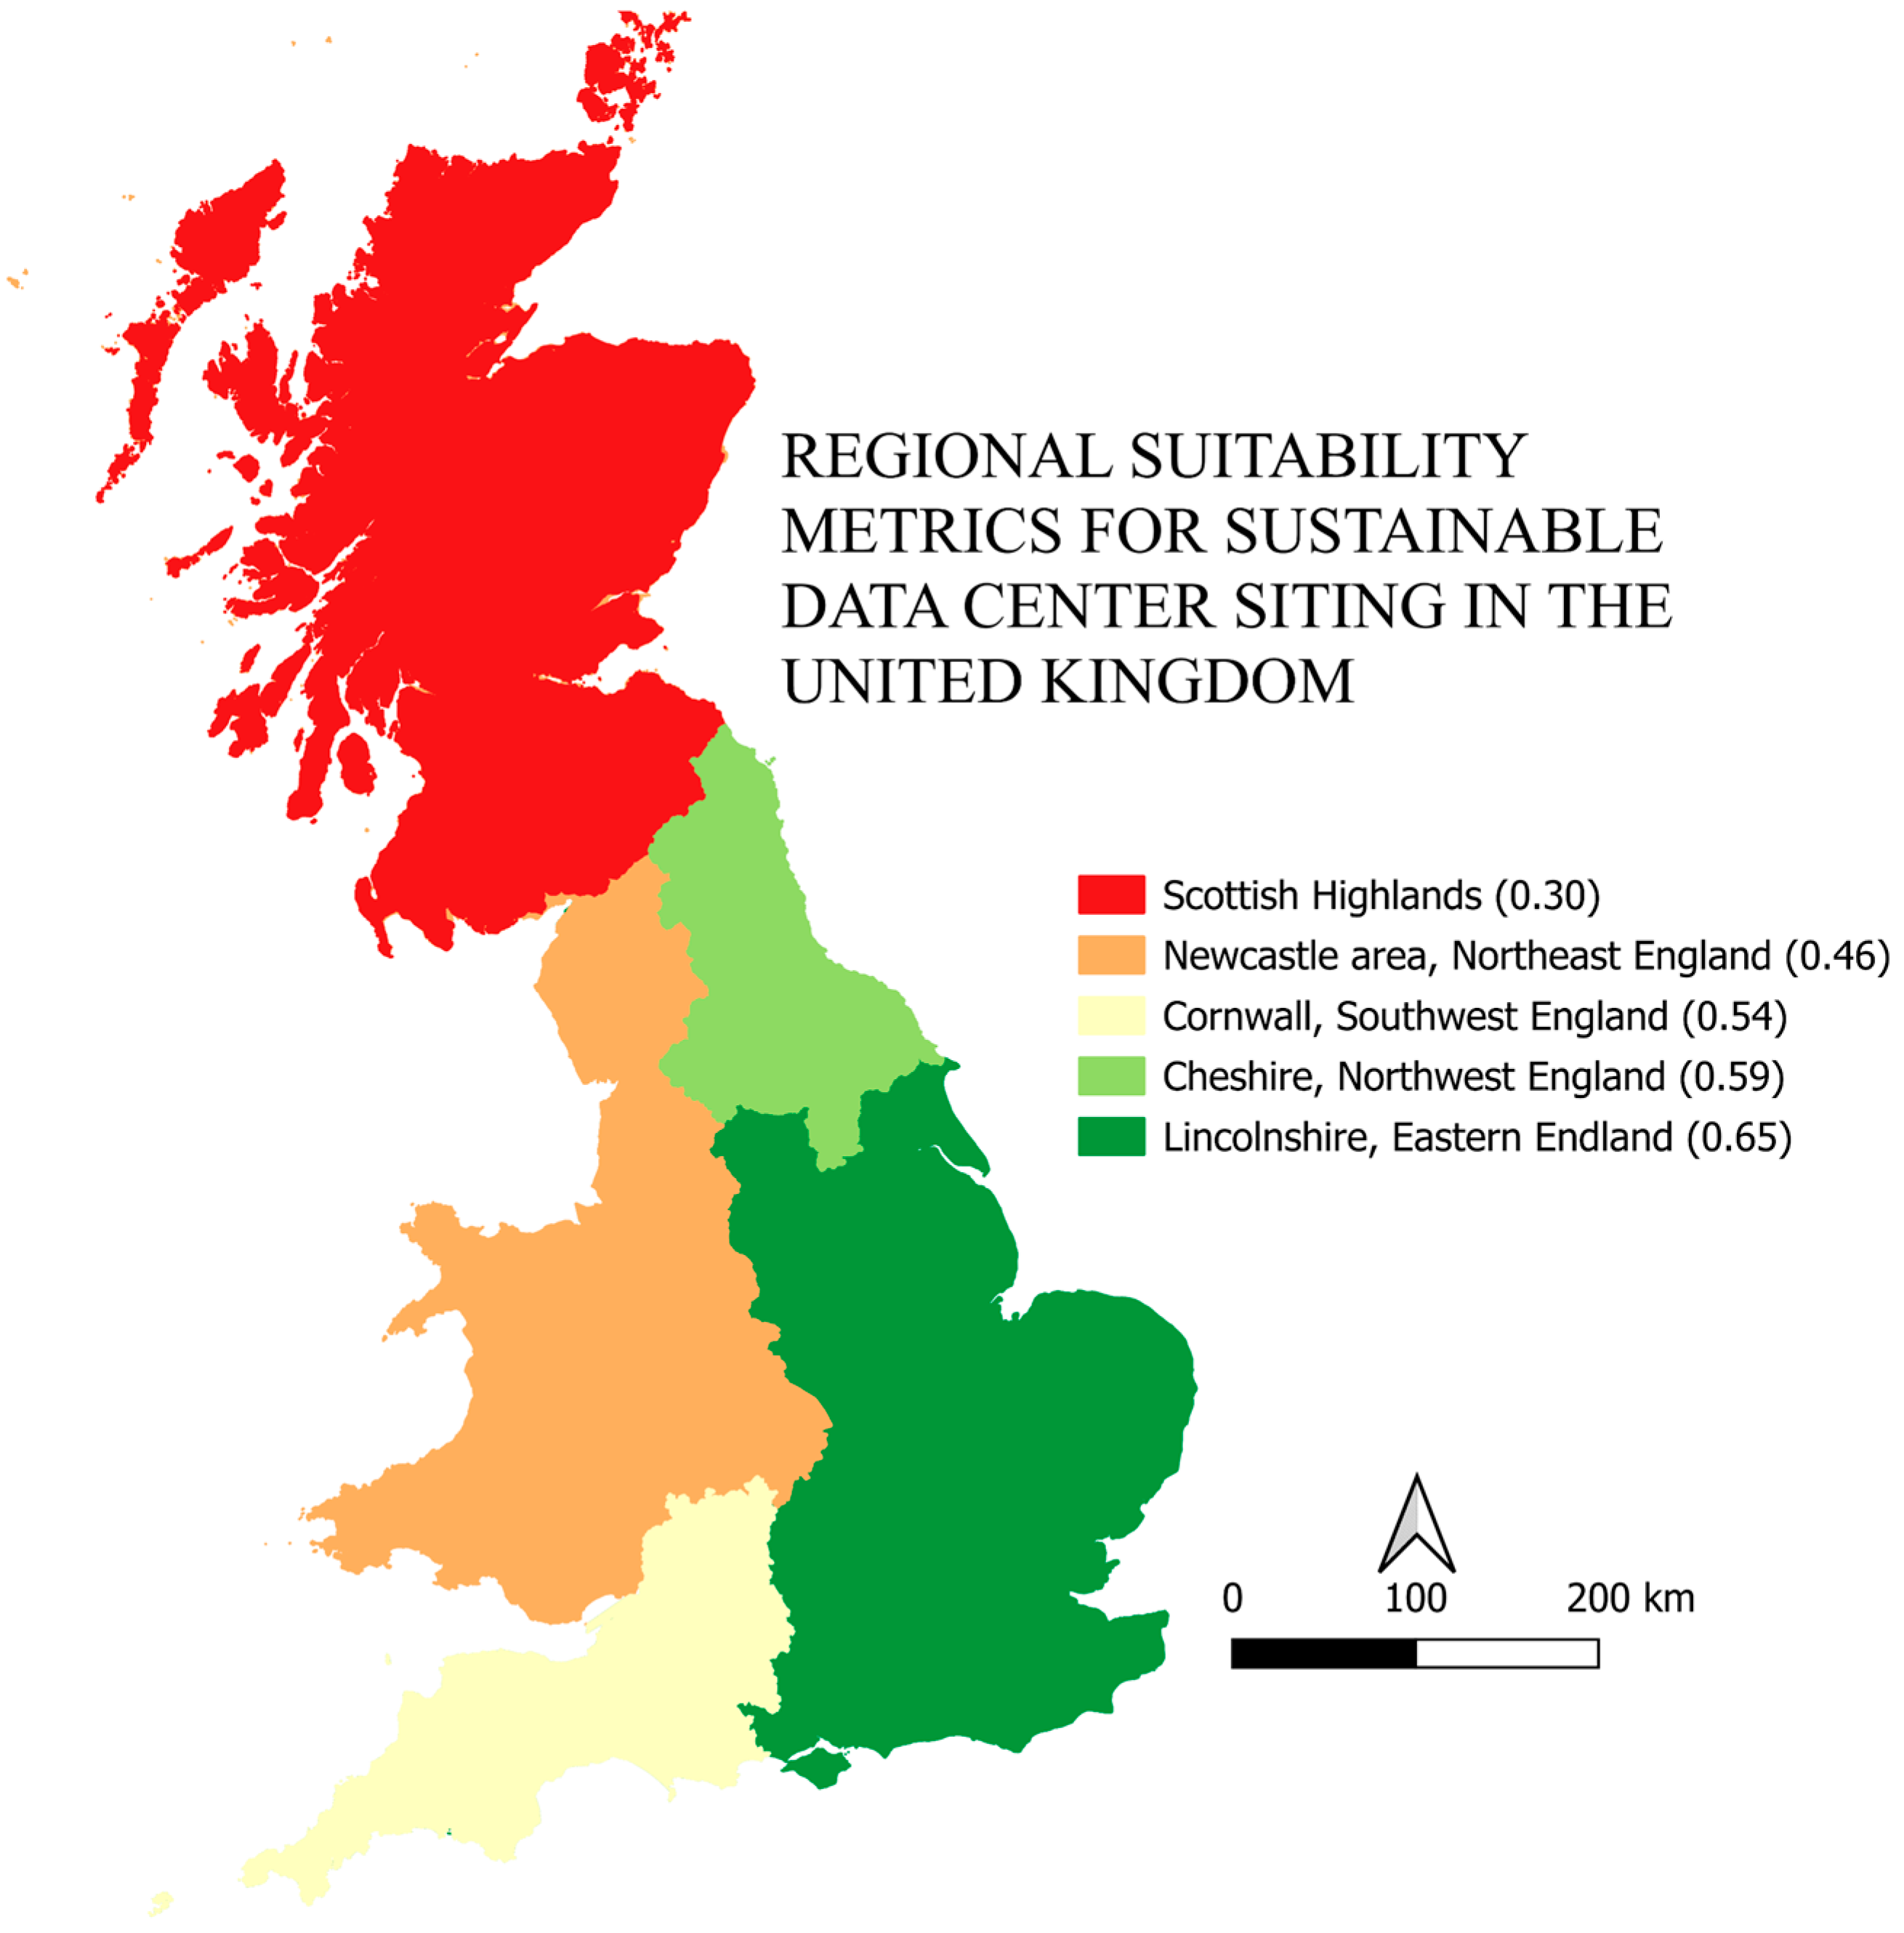
Based on this process, five candidate regions were delineated for further comparison in Section 4.1.5. These include the Scottish Highlands, Northeast England (Newcastle region), Southwest England (Cornwall), Northwest England (Cheshire), and Eastern England (Lincolnshire). They correspond to the most spatially coherent high-scoring clusters under the AHP-informed WLC framework and therefore form the basis for the final comparative evaluation.

4. Results and Discussion

4.1. Regional Selection

The Regional selection methodology integrated multiple GIS layers representing climate suitability, renewable energy potential, environmental constraints, infrastructure availability, and socio-economic proxy factors. All spatial datasets were projected into a common UK coordinate system in QGIS 3.34 and analyzed at the regional screening scale. The analysis followed two steps, first exclusion-based screening, and second, weighted overlay scoring, which aligns with the GIS MCDA approach described in Section 3.

4.1.1. Climate Factors for Cooling

Data centers generate substantial heat, so cooler climates and more frequent cold days can reduce cooling energy needs and improve efficiency. We included mean annual air frost days and mean annual temperature as proxies for free cooling potential.
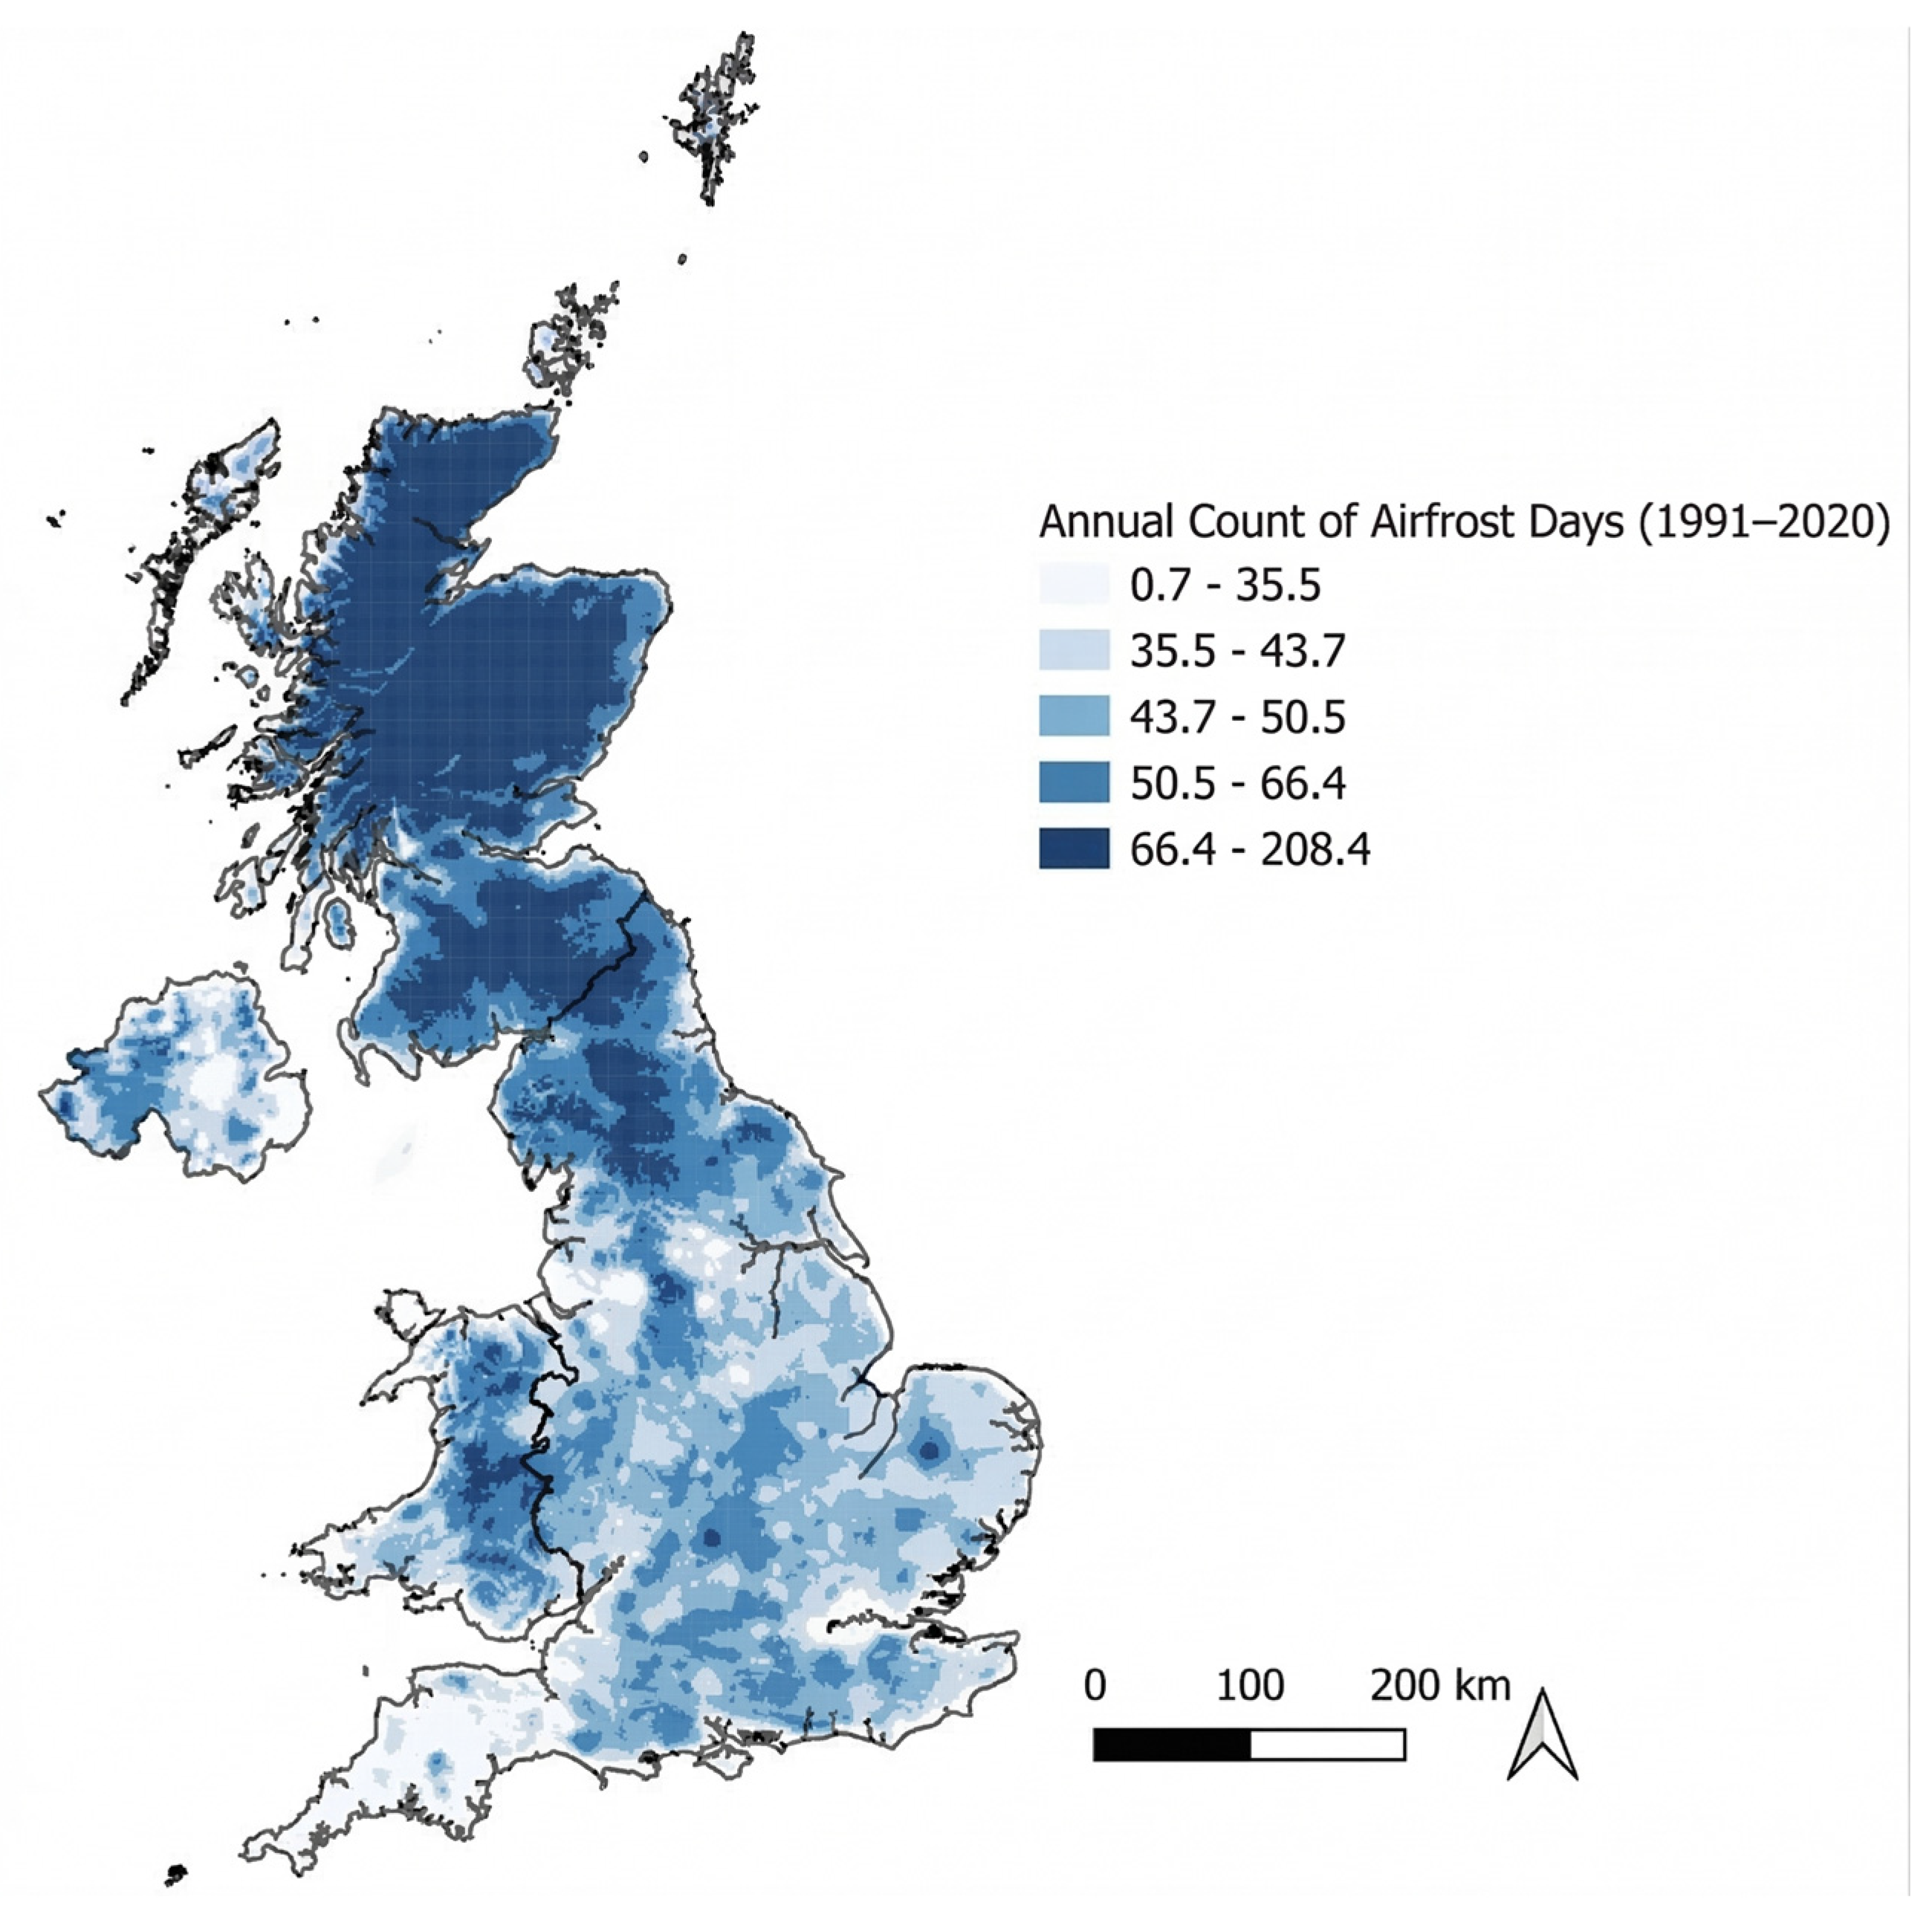
Figure 4 shows the annual count of air frost days across the UK. Colder northern and highland regions, especially Scotland, show around 60 to 200 frost days per year. In comparison, southern coastal areas show fewer than 10 to 40 frost days. This suggests that northern Scotland and parts of northern England provide stronger opportunities for natural cooling and long periods of economizer operation, while southern England has less free cooling due to mild winters.
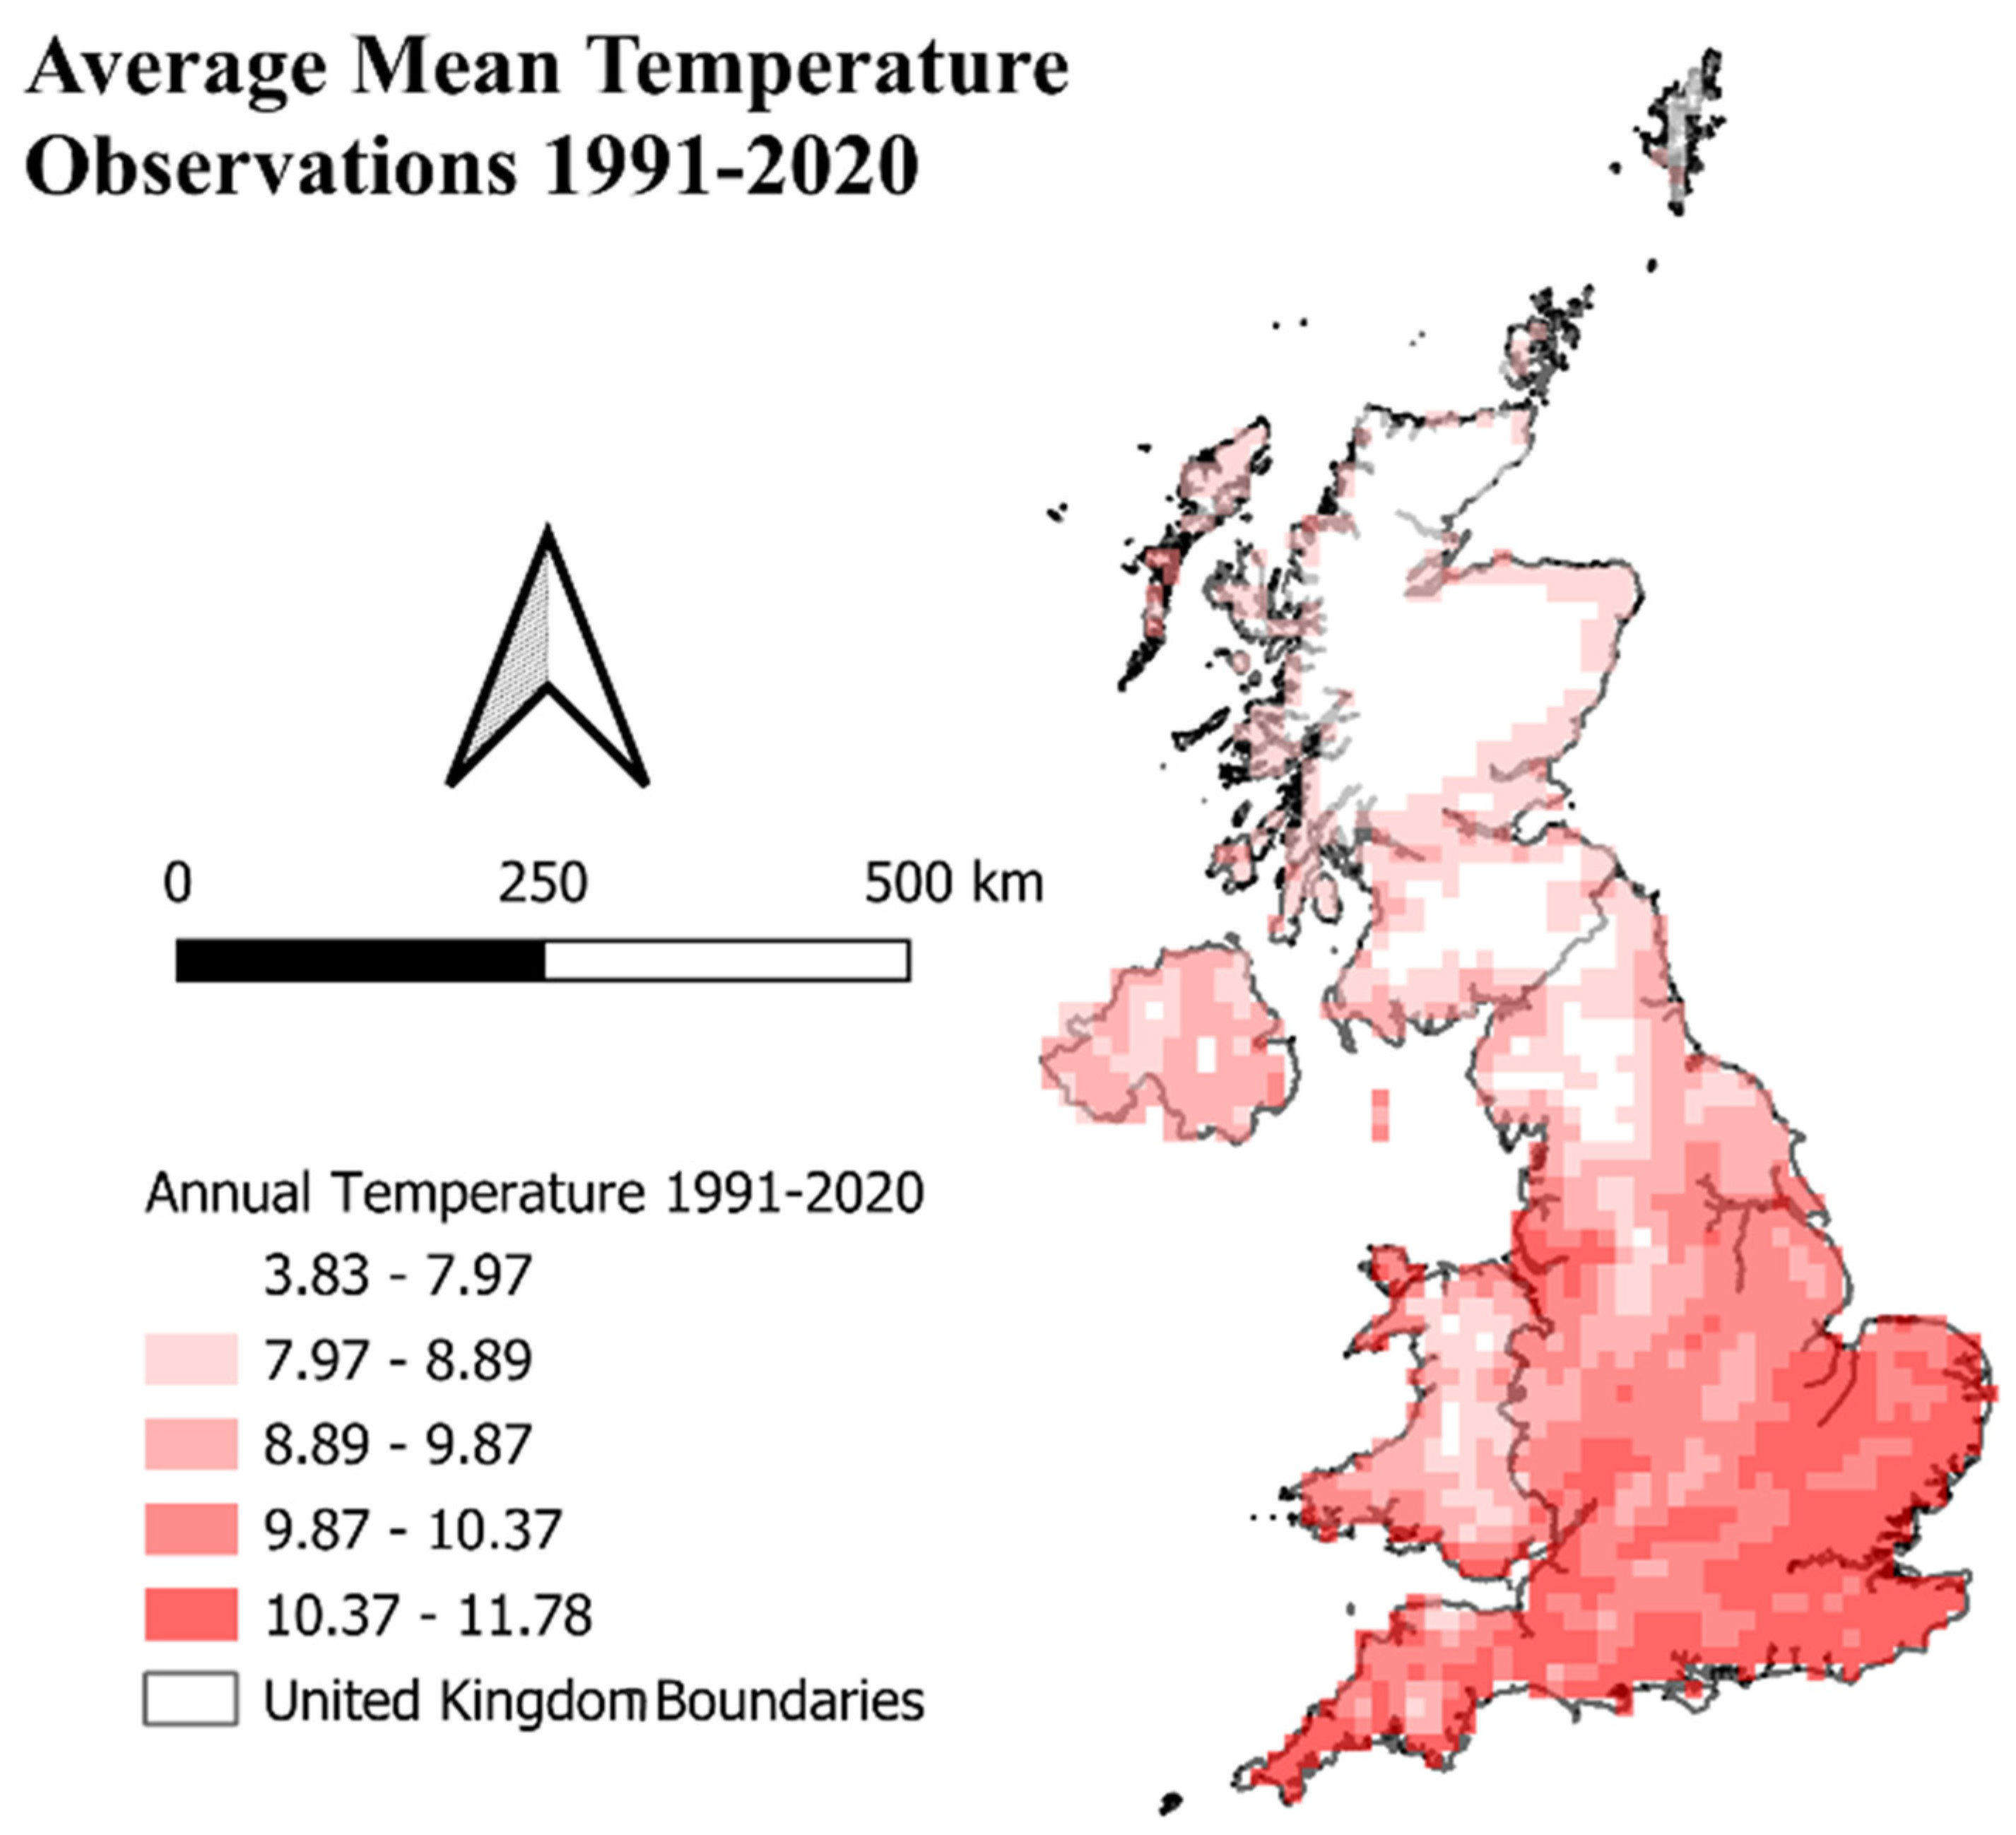
Figure 5 illustrates the spatial distribution of mean annual temperature (1991 to 2020). The coolest regions around 4 to 8 degrees °C occur in the Scottish Highlands and upland areas, whereas southeastern England and coastal Cornwall show higher values around 10 to 12 degrees °C. Lower ambient temperature is desirable for DCs as it lowers chiller loads and can reduce PUE. These regions were scored more favorably for the climate suitability component.
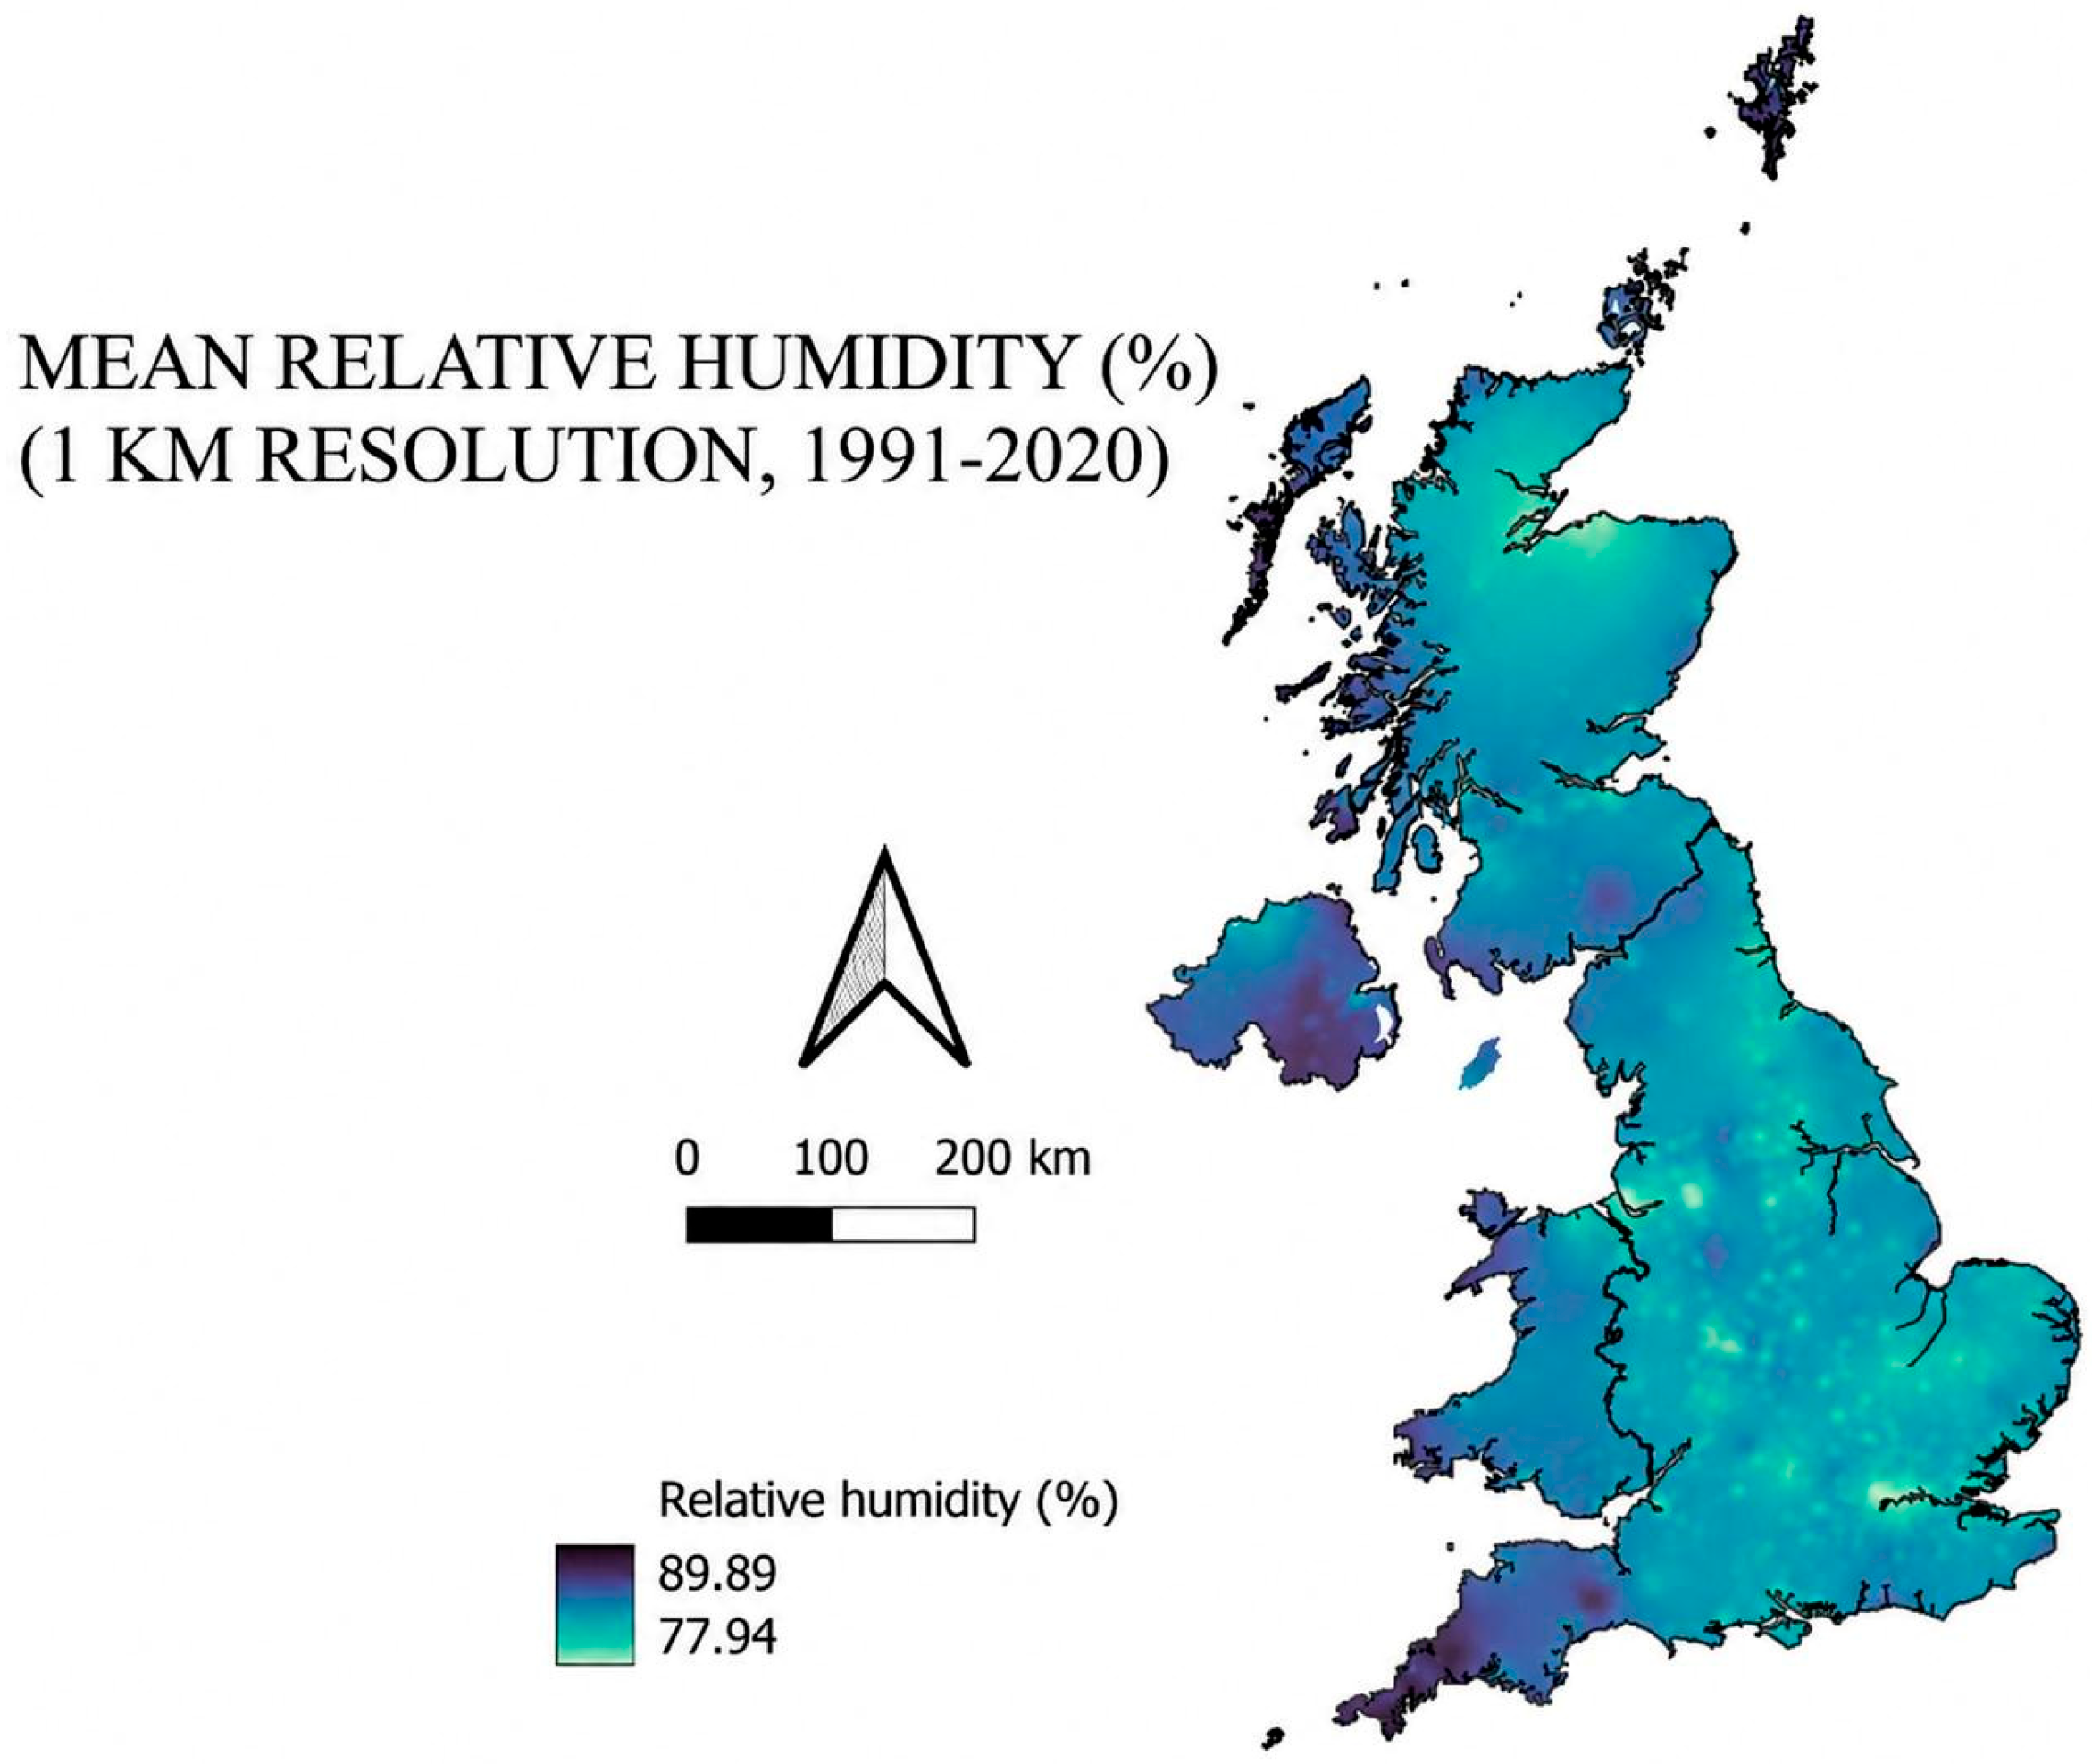
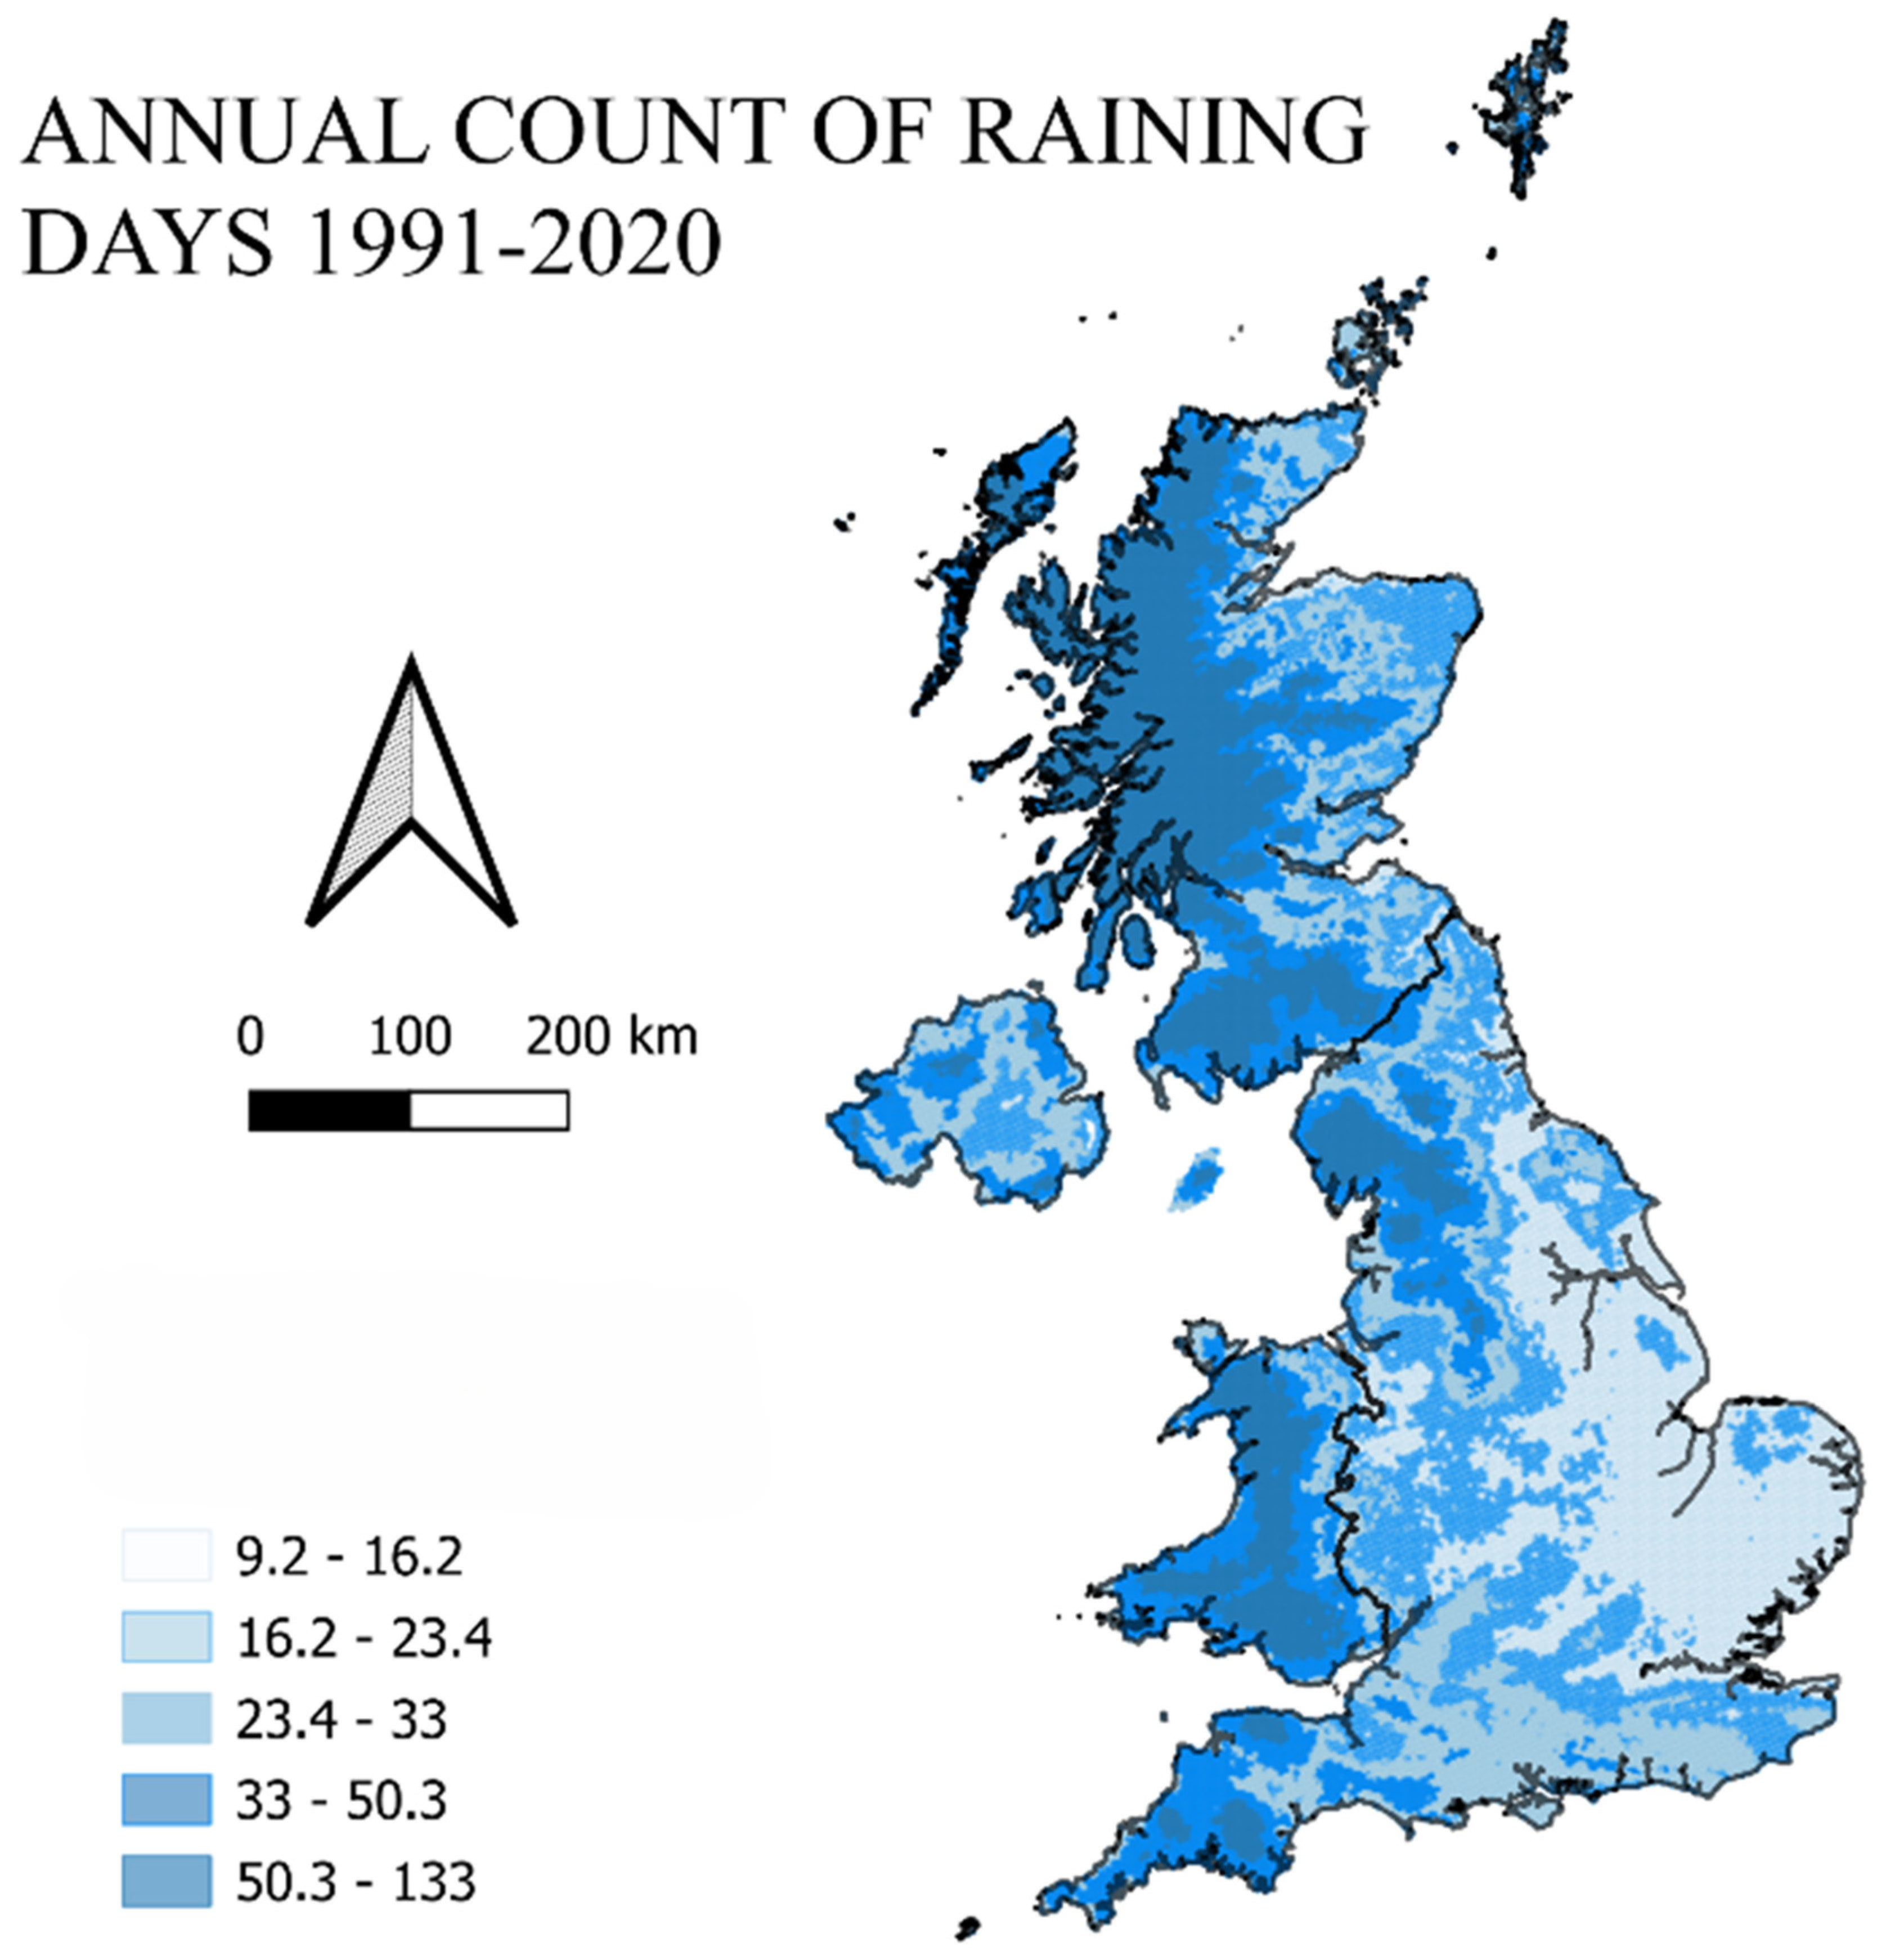
Humidity also affects cooling effectiveness. High relative humidity can reduce evaporative cooling benefits and can raise condensation risk in some operating cases. Figure 6 maps mean relative humidity across the UK. The UK is generally humid around 78 to 90 percent annual mean. Central and eastern England show slightly lower humidity around 78 to 80 percent, while western coastal and highland regions can exceed 88 to 90 percent. The differences are not extremely large, but more humid regions were treated as slightly less favorable in the scoring. Figure 7 shows that western and upland regions show much higher heavy rain frequency (often 50 to 100 days per year) compared with eastern England (often under 20 days). Highly heavy rain areas were penalized because they have higher likelihood of surface water flooding and disruption risk.

4.1.2. Renewable Energy Potential

Access to low-carbon electricity is a key factor for modern data centers, both for sustainability and long-term cost exposure. Although solar resource is reported here as a standalone indicator for interpretability, it was incorporated within the composite ‘Climate’ criterion in the AHP–WLC model (Section 3.3). Solar radiation (represented as annual sunshine hours) was included as a renewable energy indicator, since on-site solar or regional solar farms can contribute to decarbonizing supply and improve carbon performance.
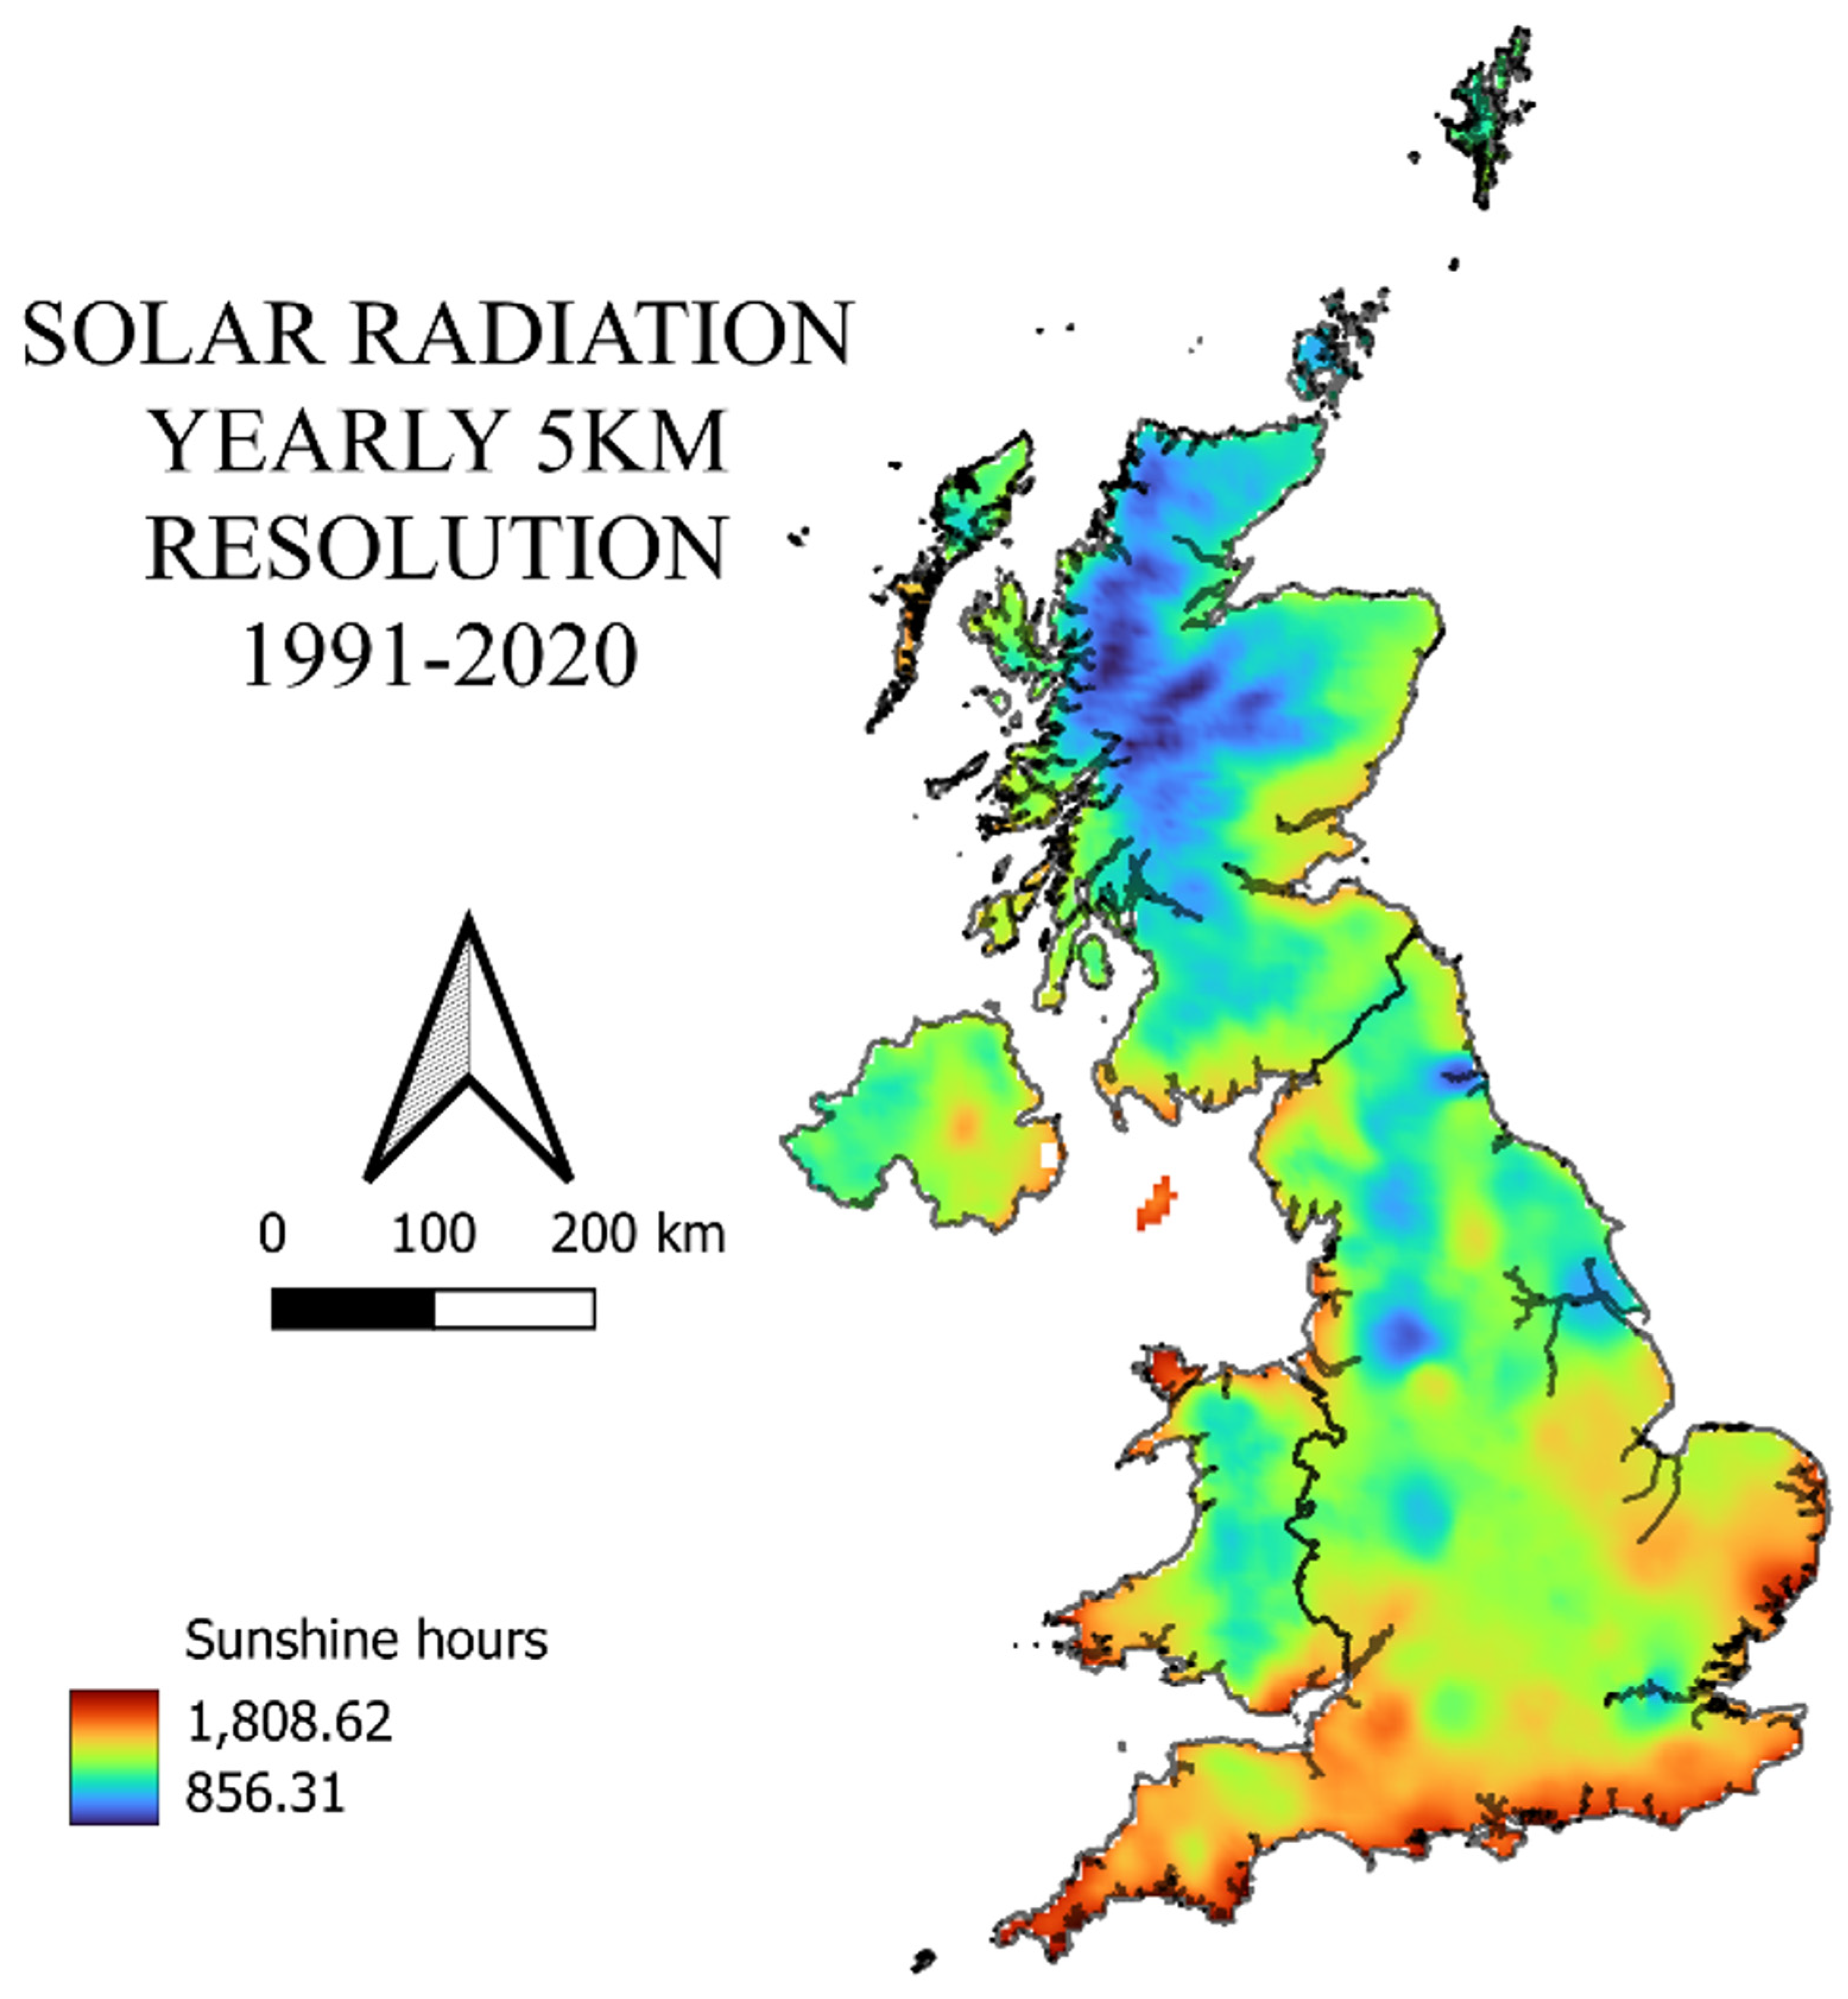
Figure 8 depicts annual sunshine hours across the UK (1991 to 2020). A clear south-to-north gradient is visible. Southern England and parts of eastern England receive the highest sunshine, around 1600 to 1800 h per year, while northwest Scotland can be as low as around 850 to 1000 h. This shows that PV output potential in the south and east can be significantly higher than in northern regions. Therefore, higher solar resources contributed to a higher climate-composite suitability score (Section 3.3).

4.1.3. Environmental and Hazard Constraints

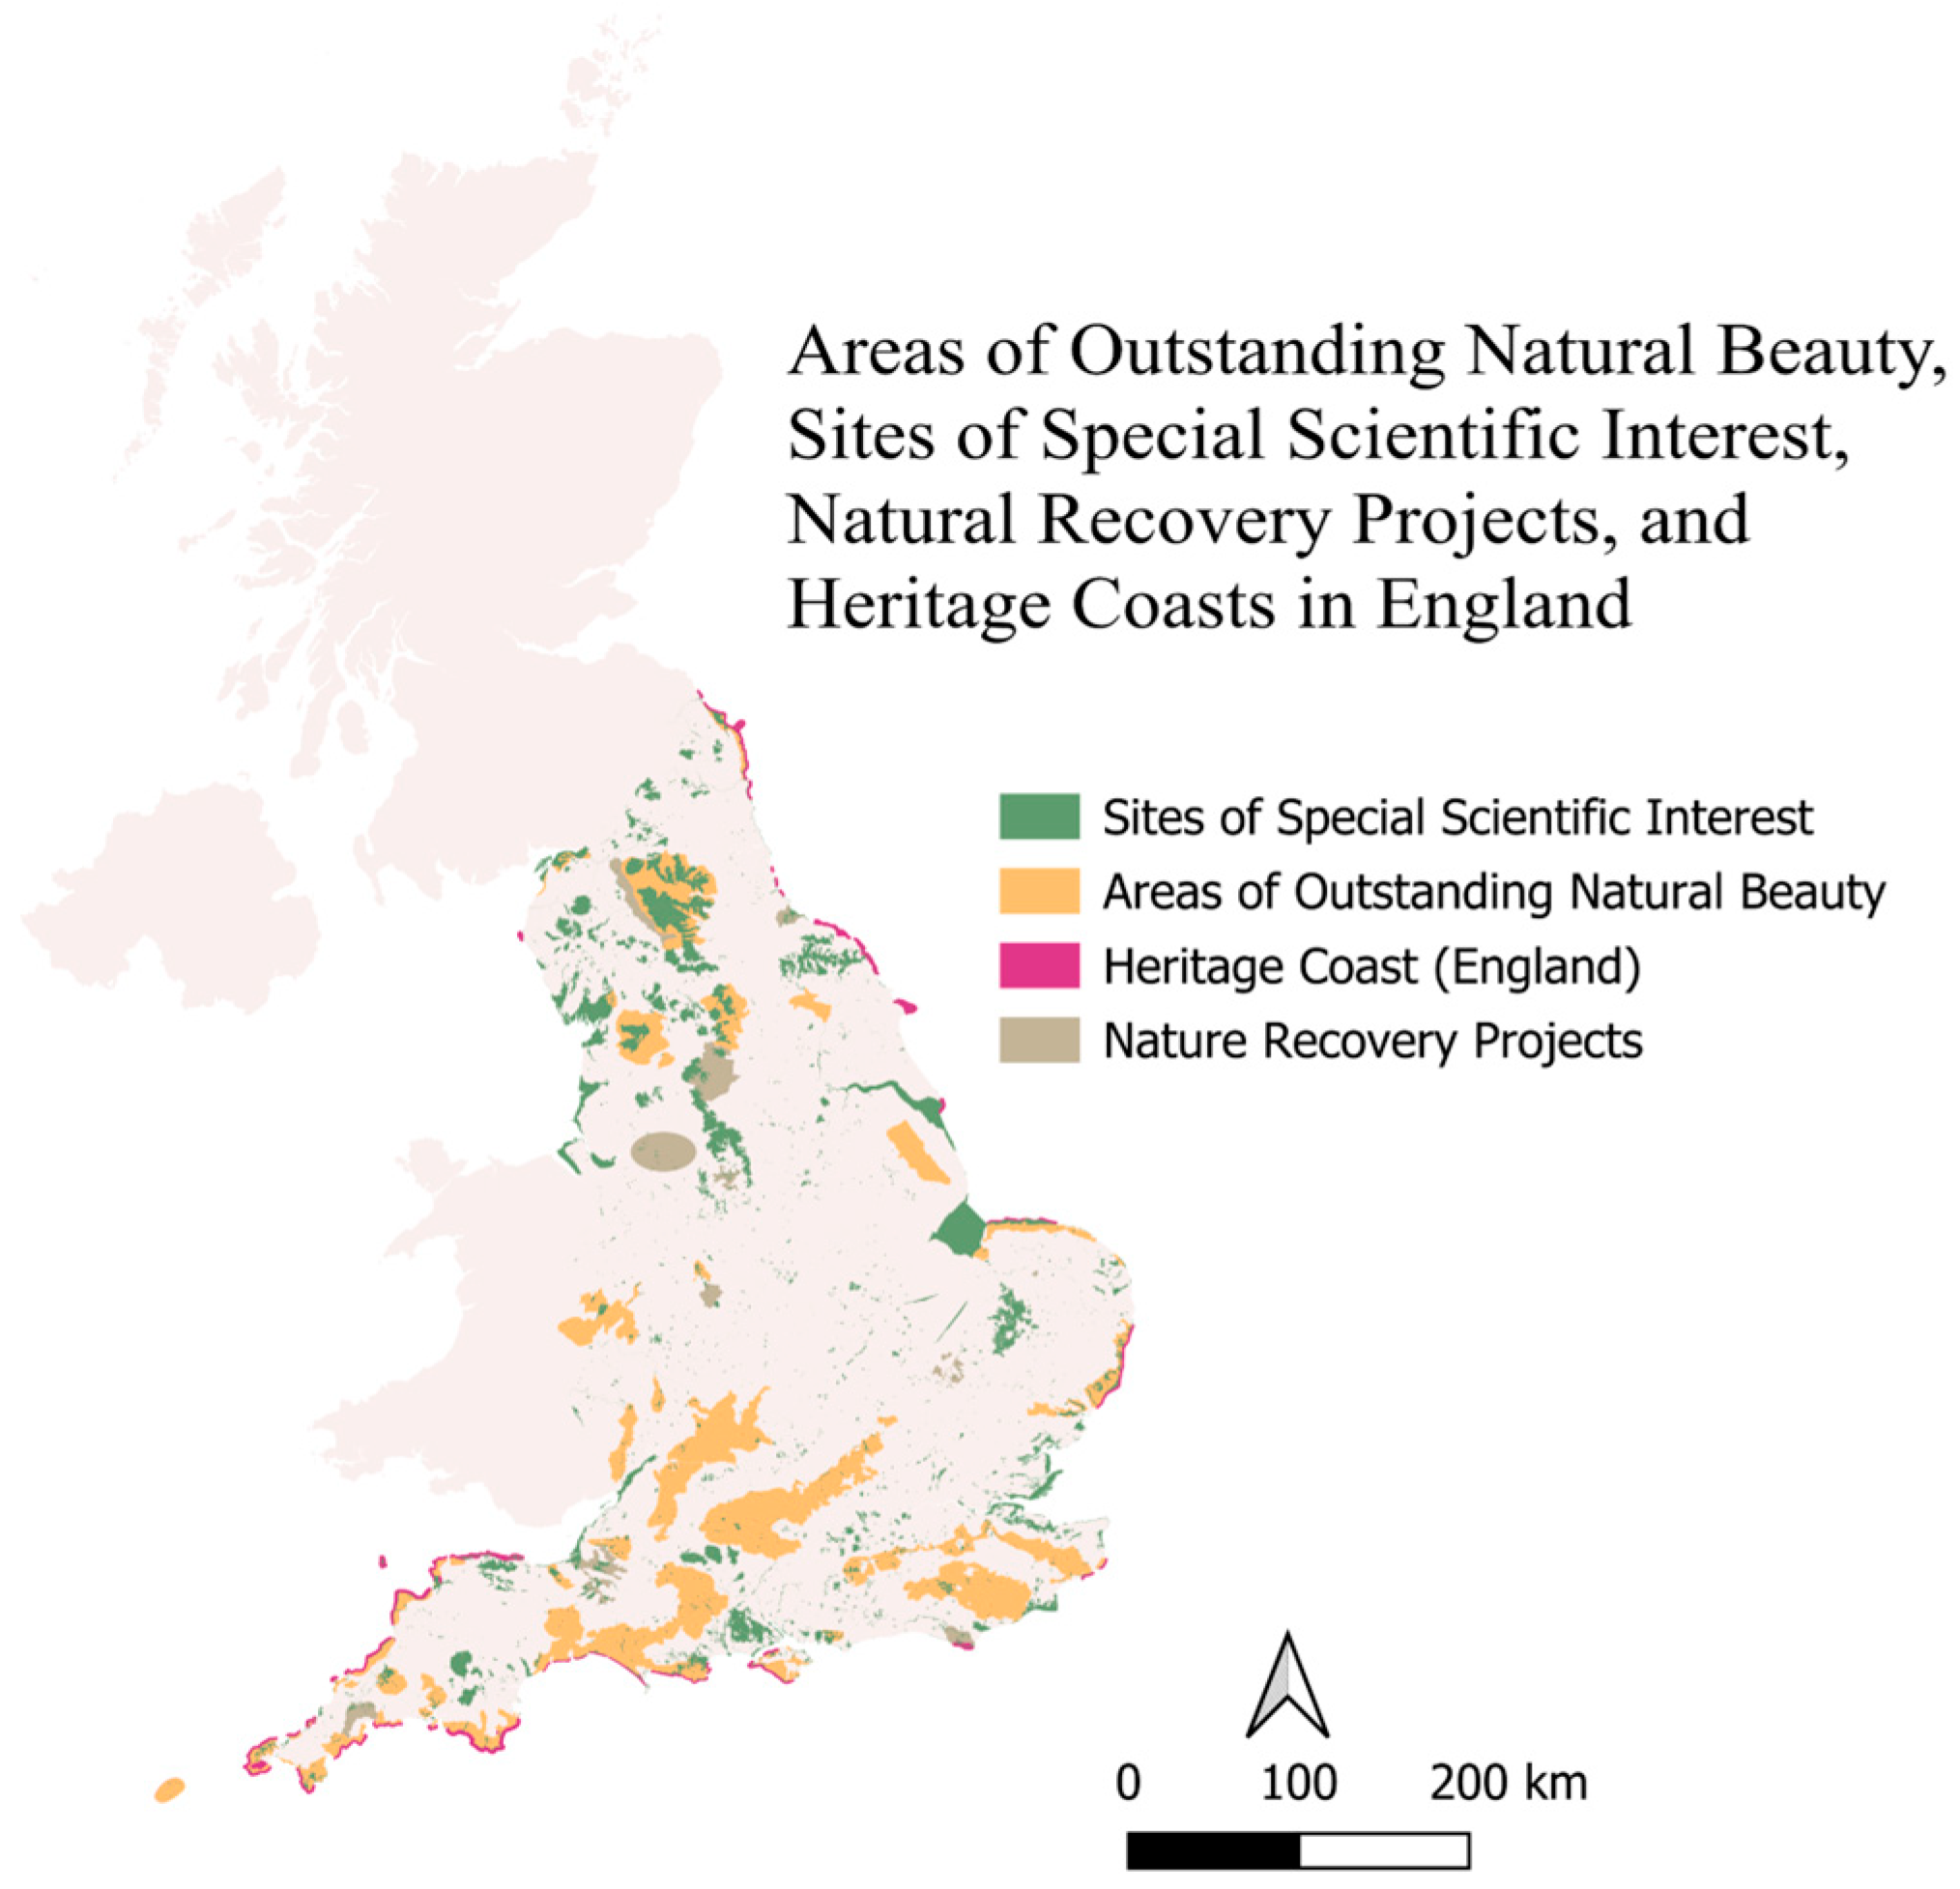
The analysis incorporated multiple layers to avoid areas that would cause environmental conflicts or create hazard exposure. Protected and sensitive areas were compiled into a composite layer including AONB, SSSI, Heritage Coasts, and Nature Recovery projects. These areas were treated as exclusion zones, because development in these locations would face major planning barriers and may cause ecological and landscape impacts. Figure 9 illustrates the protected zones, and all areas overlapping them were masked out during screening.
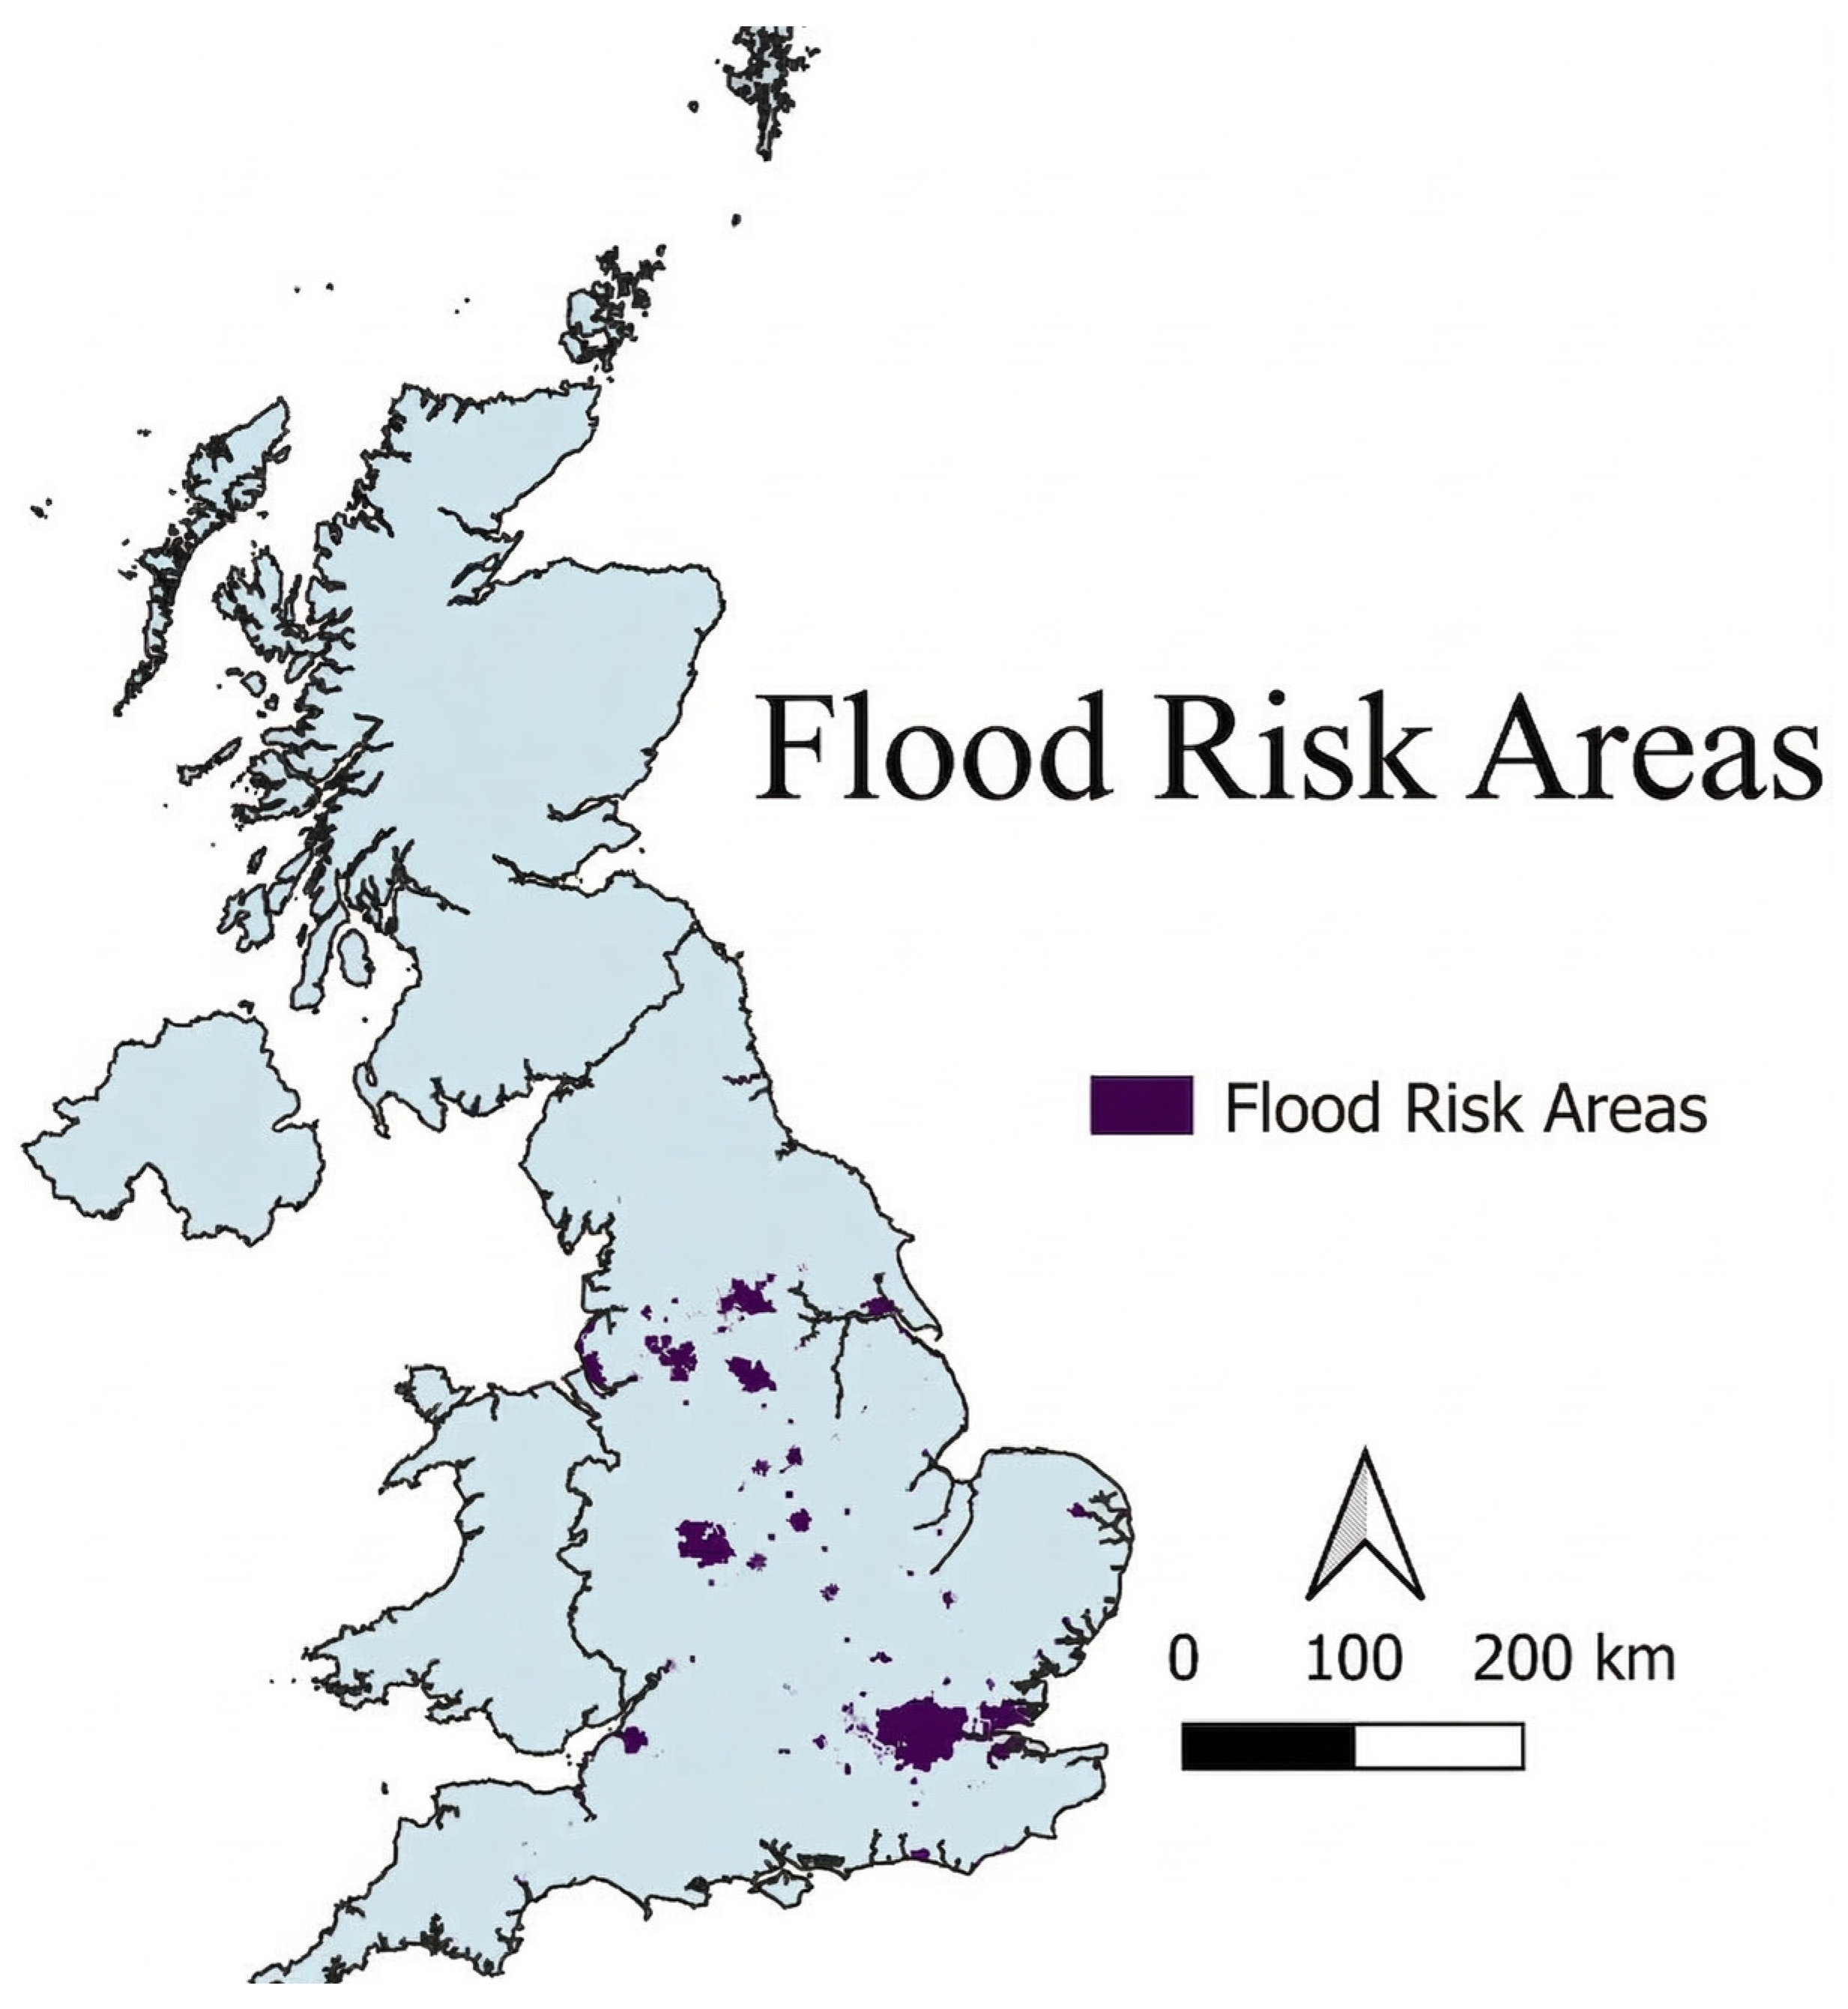
Flood and rainfall-related hazards were represented using annual heavy precipitation days (Figure 7) and mapped flood-risk zones (Figure 10), thereby supporting site screening by identifying areas of elevated flood risk to be avoided.
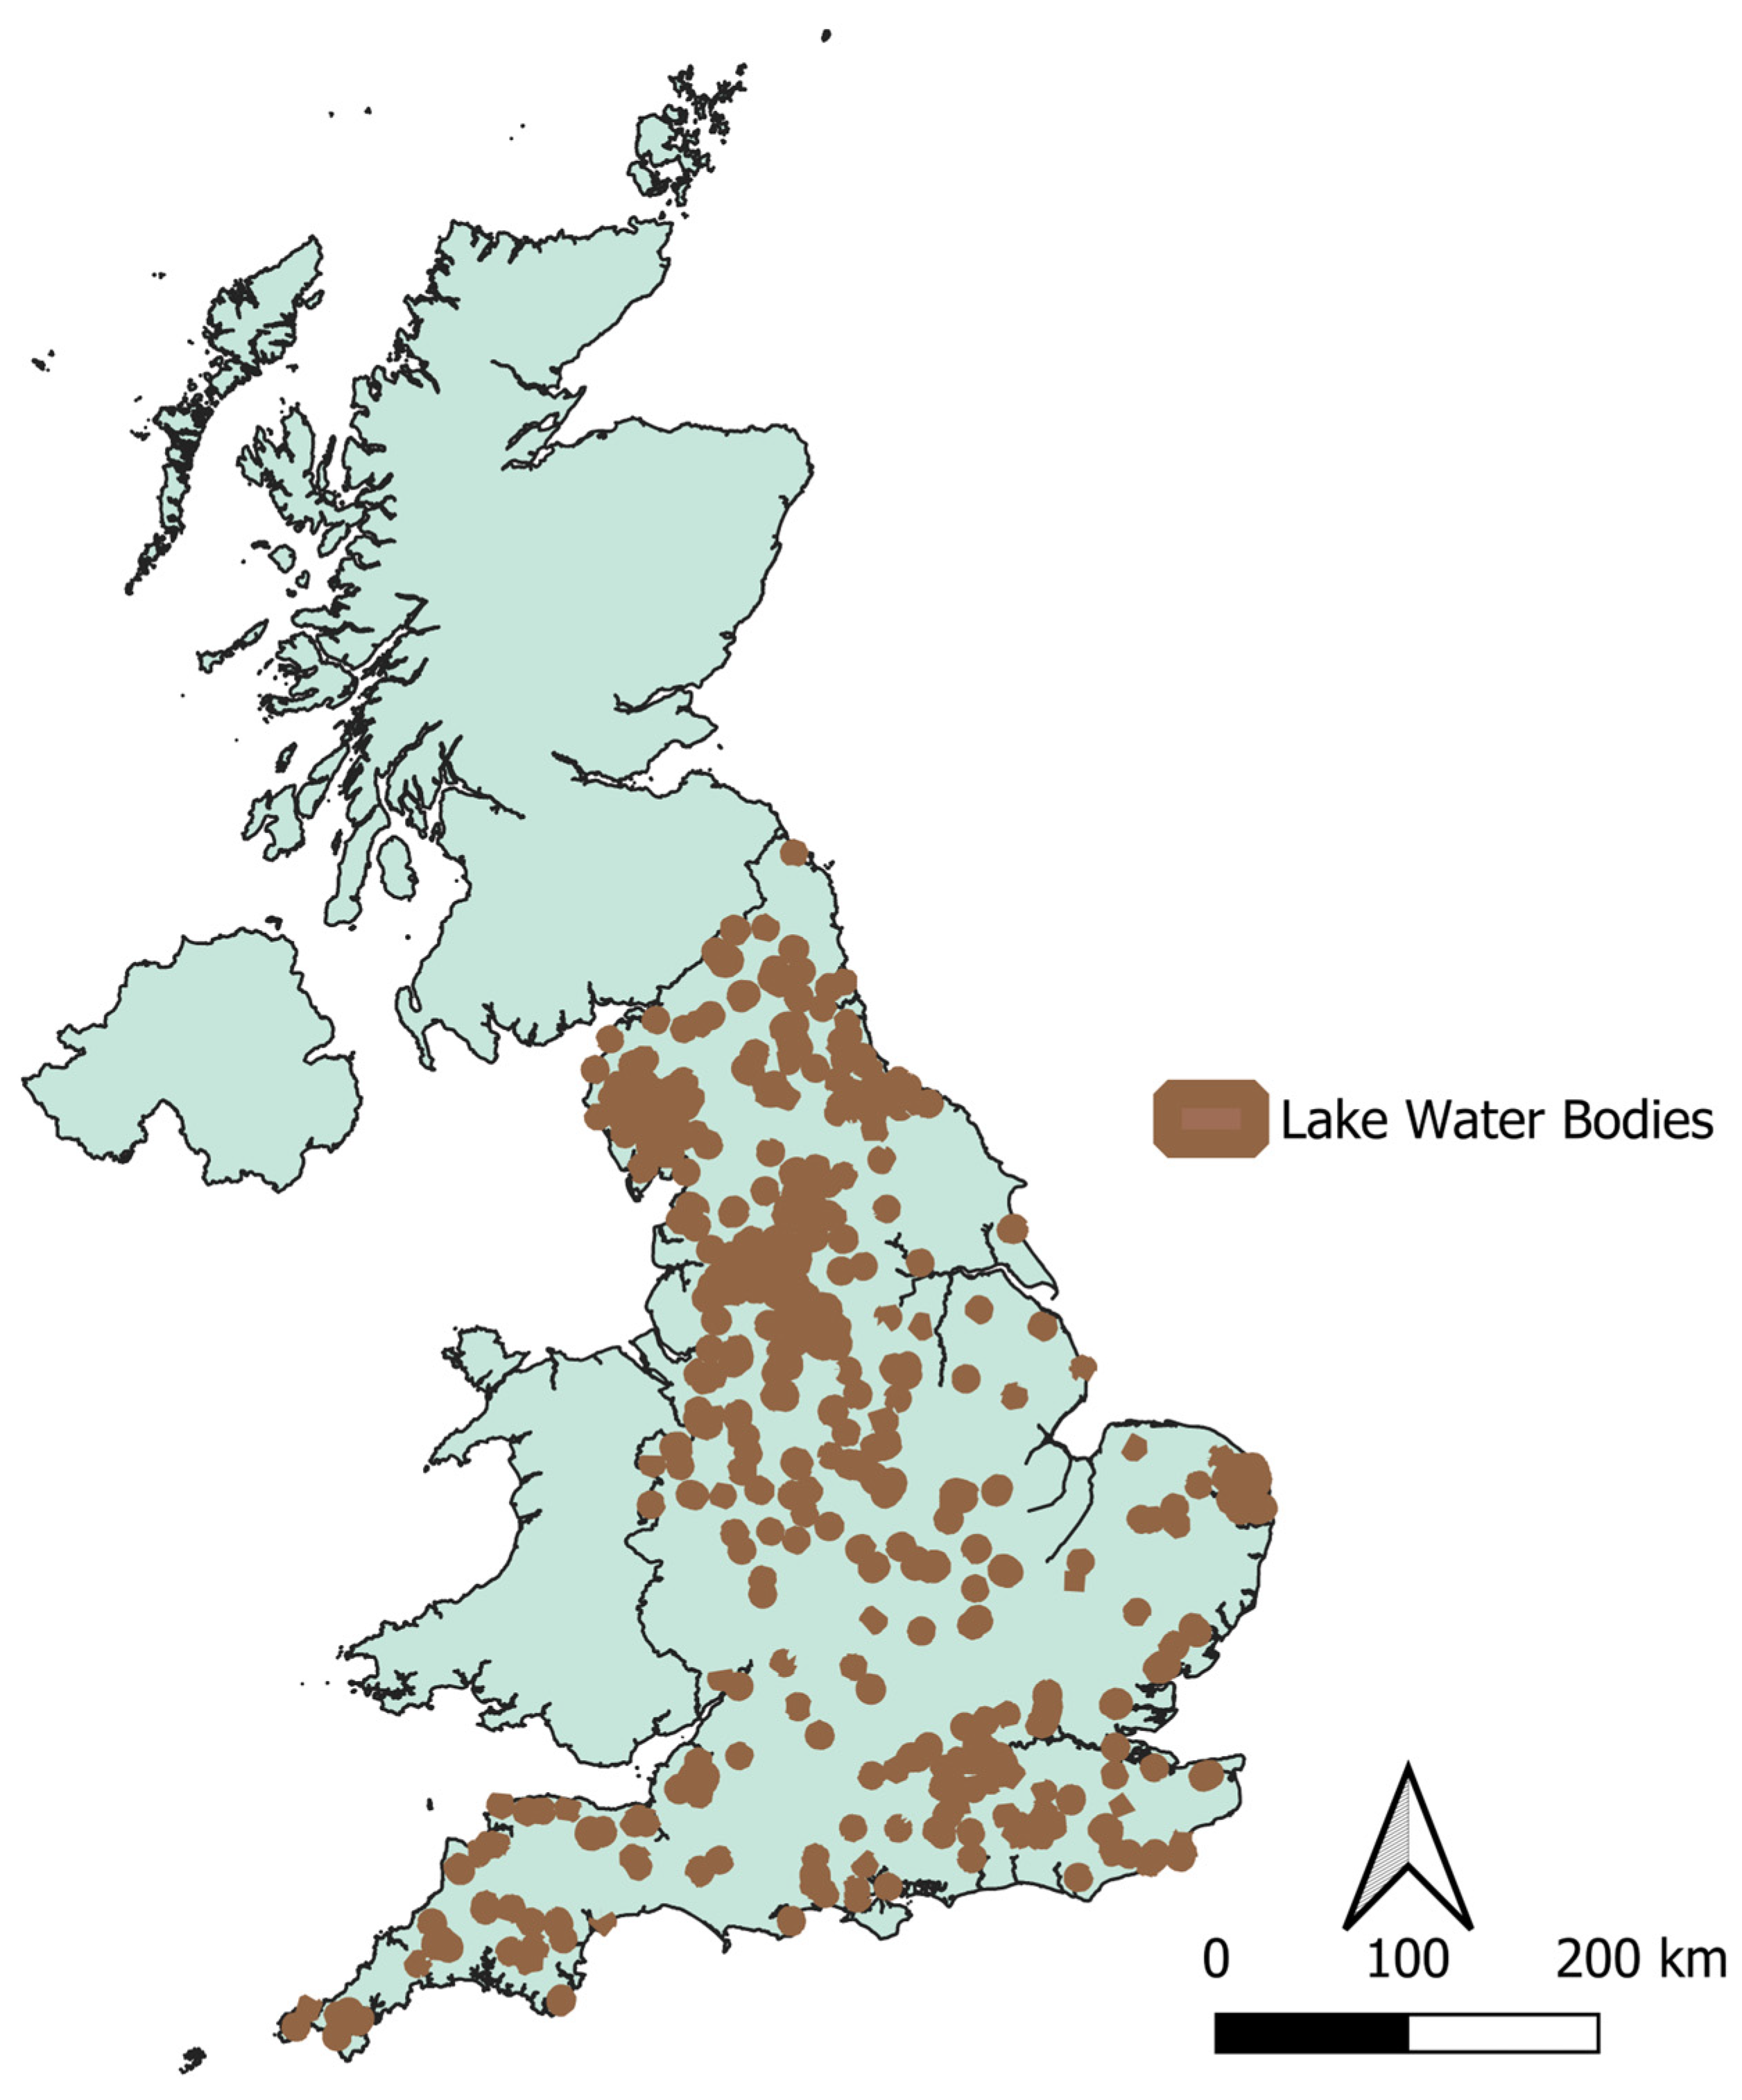
Major lakes and water bodies were also mapped (Figure 11). Although water can, in some cases, support cooling options, UK data centers typically prioritize resilience and do not rely on direct open water cooling. Therefore, areas very close to large water bodies and wetland-like zones were treated cautiously and given lower preference, to reduce flood and environmental risk. Overall, the Scottish region scored 0.09, while Southeast England (Cornwall) had the highest value of 0.15.

4.1.4. Infrastructure and Population

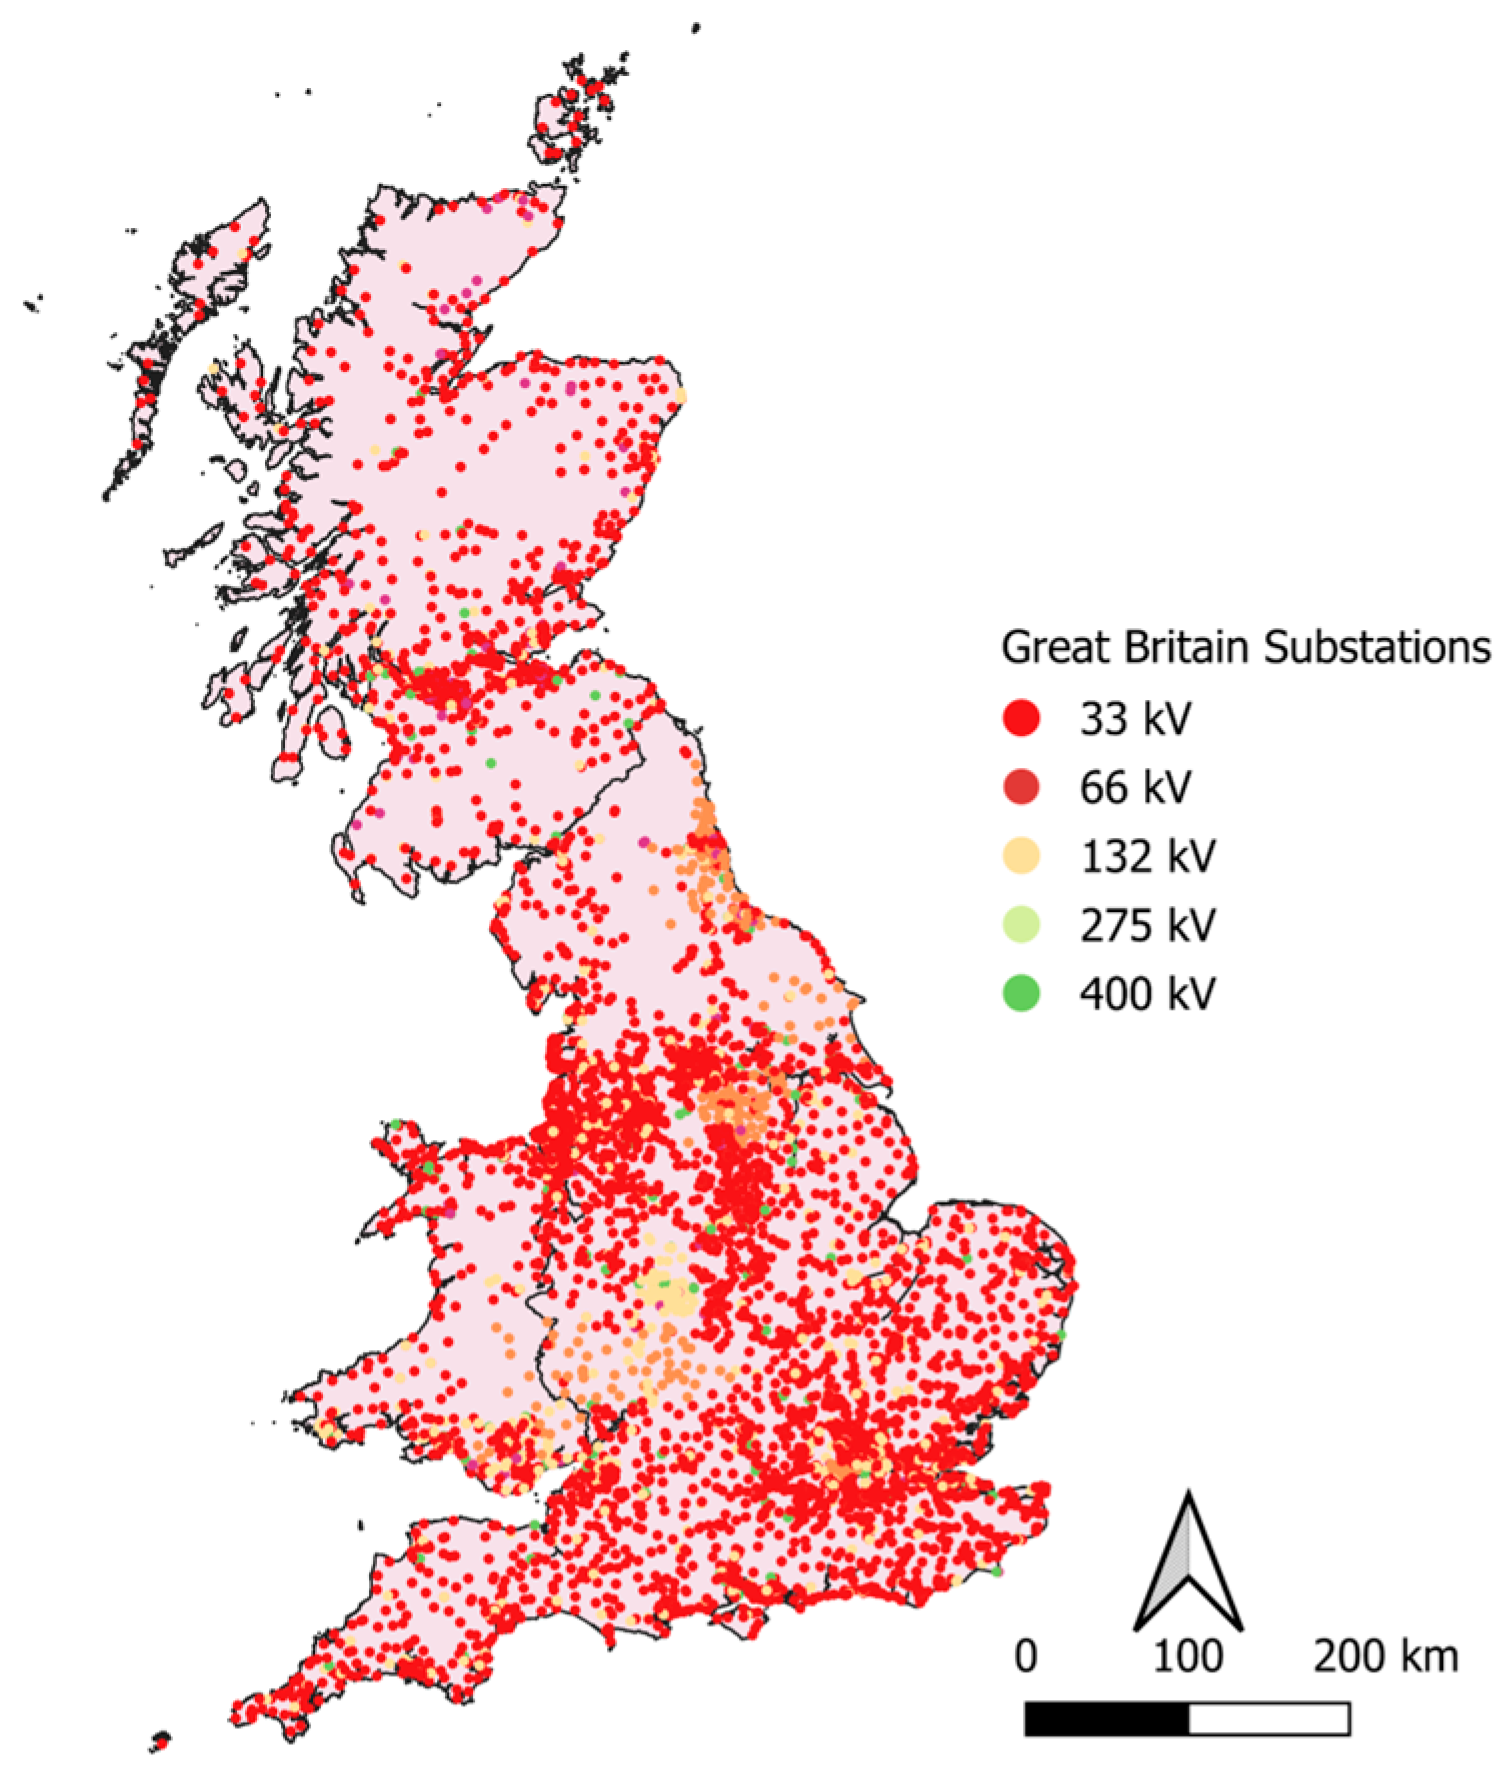
Electrical infrastructure was a primary feasibility criterion because a DC requires a large and continuous power supply. We used high voltage substation locations (33 kV to 400 kV) as a proxy for grid availability and capacity. Figure 12 shows the distribution of substations across Great Britain. Dense clusters occur in central and southern England and also in parts of the northwest, while rural Scotland, Wales, and Cornwall show sparser coverage. Proximity to higher voltage infrastructure was scored strongly because it reduces connection distance and increases confidence in supply capacity.
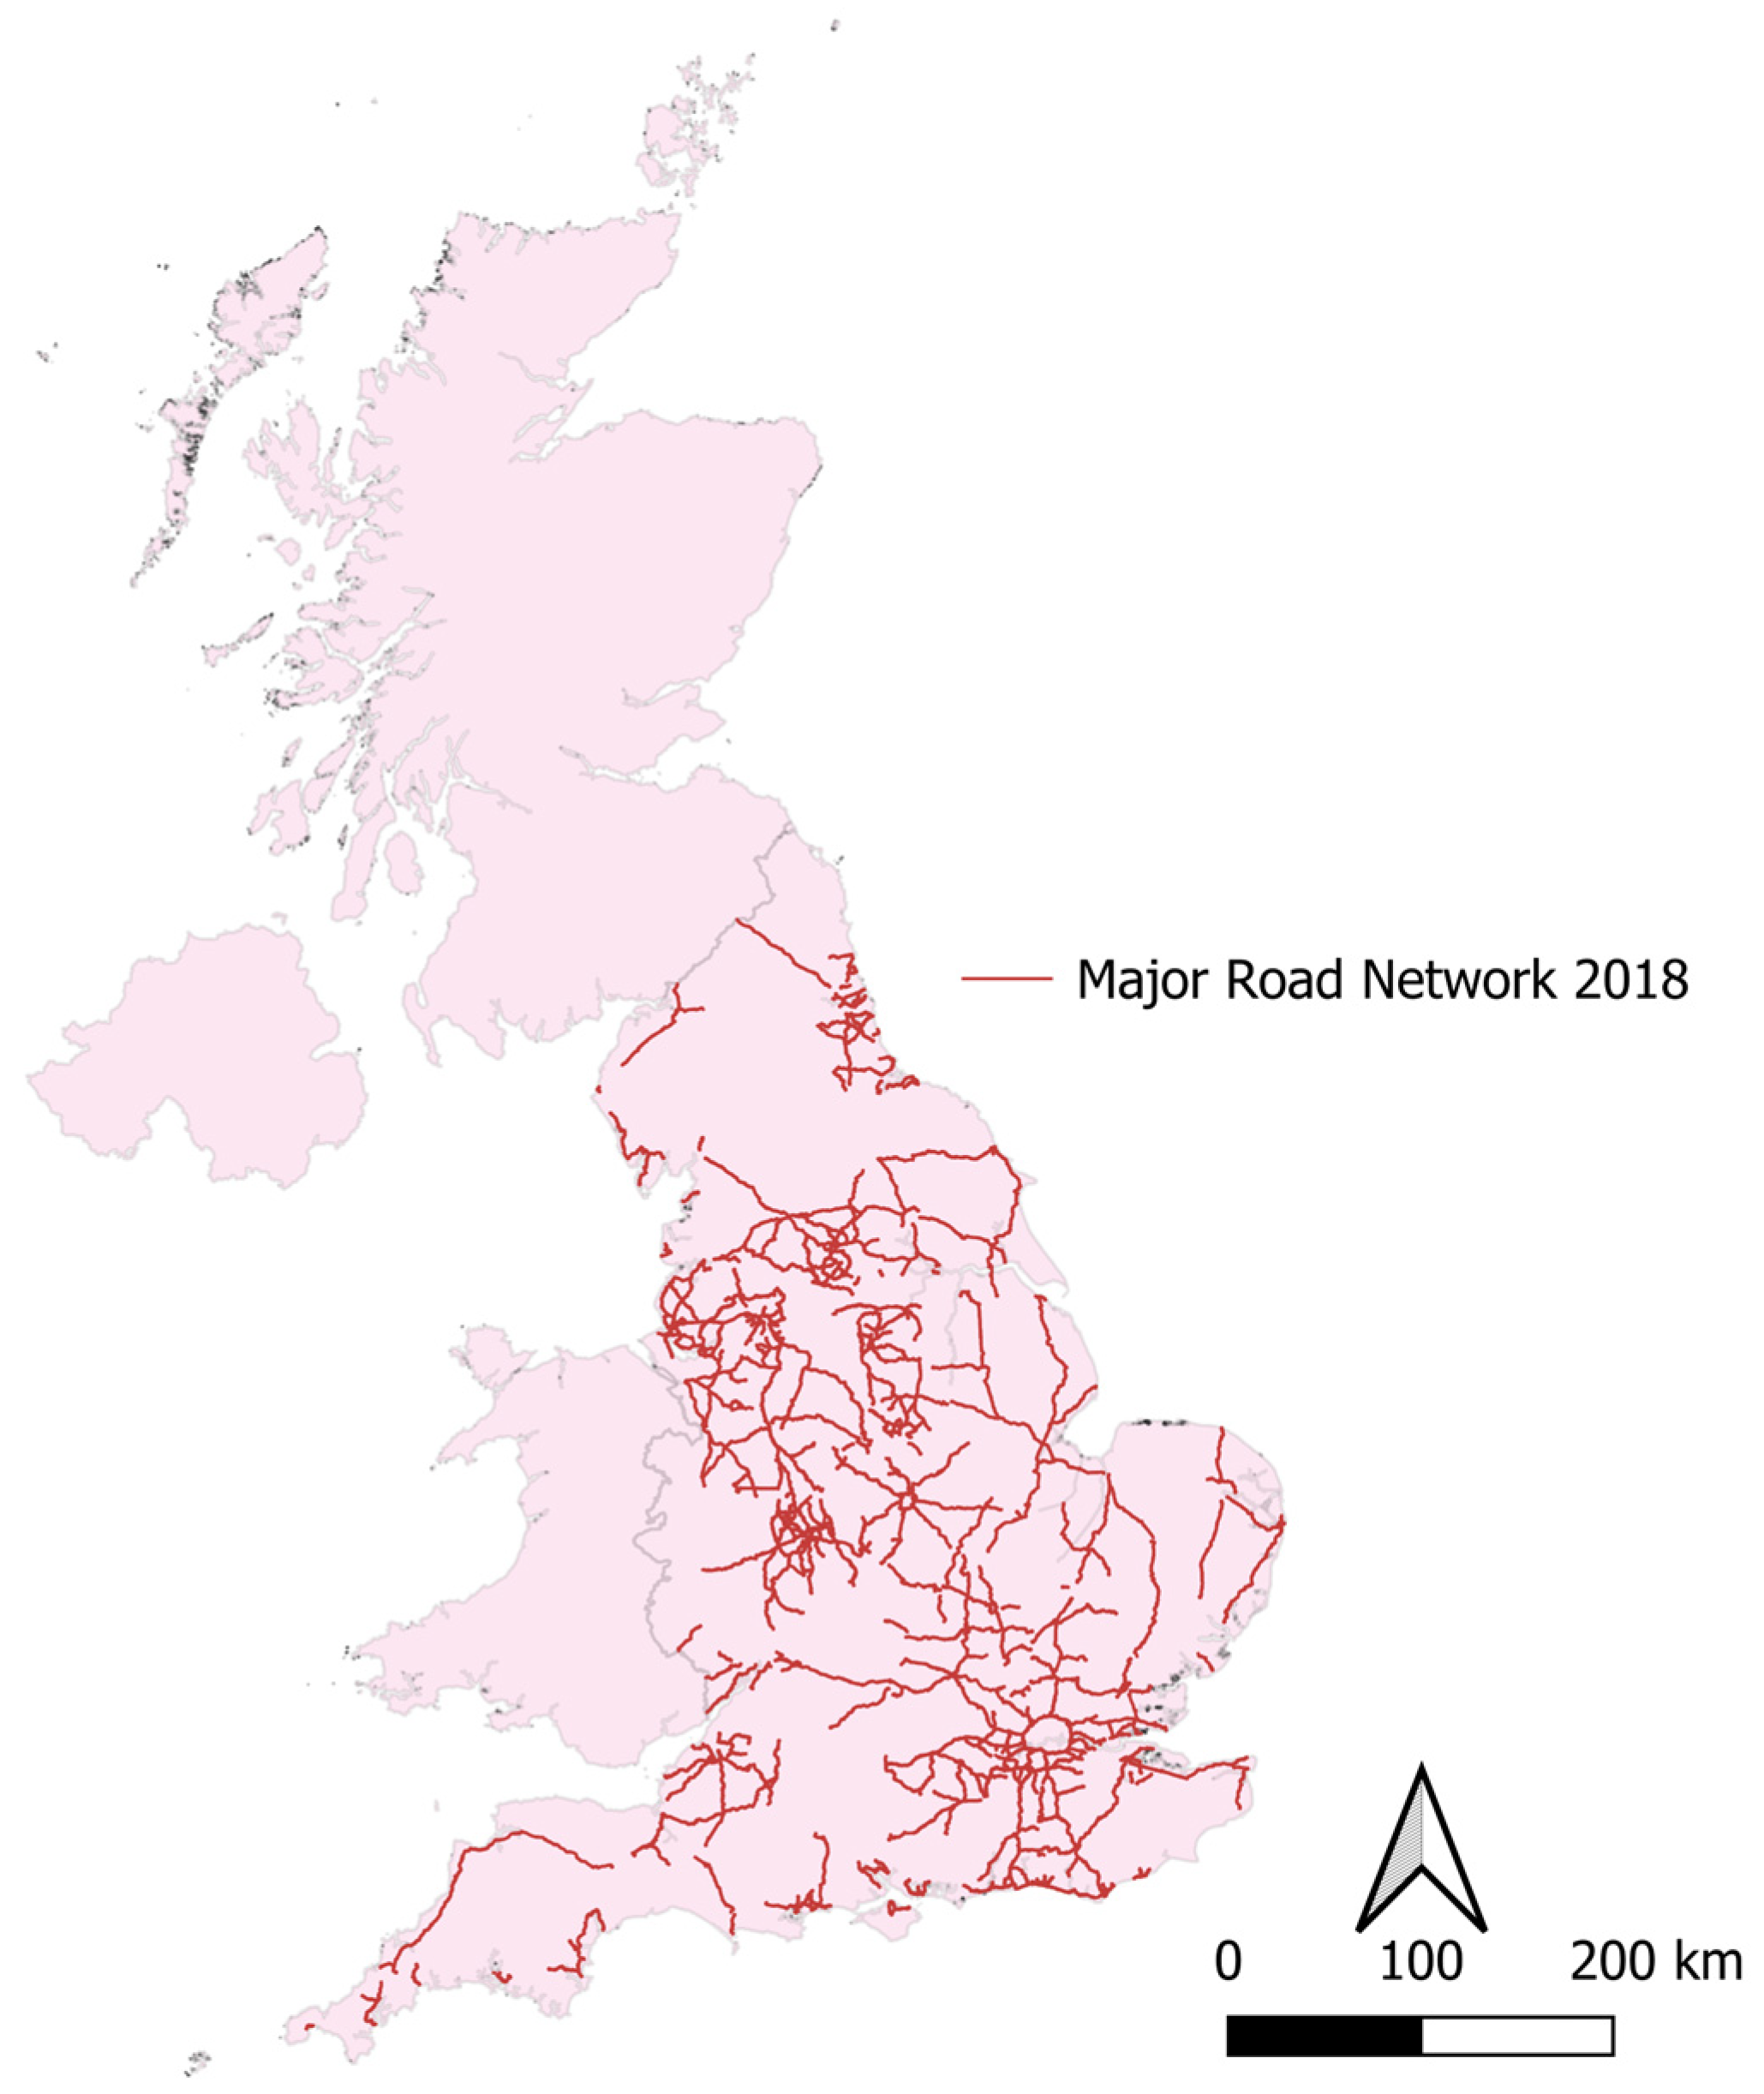
Transport access was assessed using major roads (motorways and primary A roads). Figure 13 shows the road network. Areas close to major roads were preferred because it supports construction logistics, deliveries, and staff commuting. All shortlisted candidate regions were near at least one major road corridor.
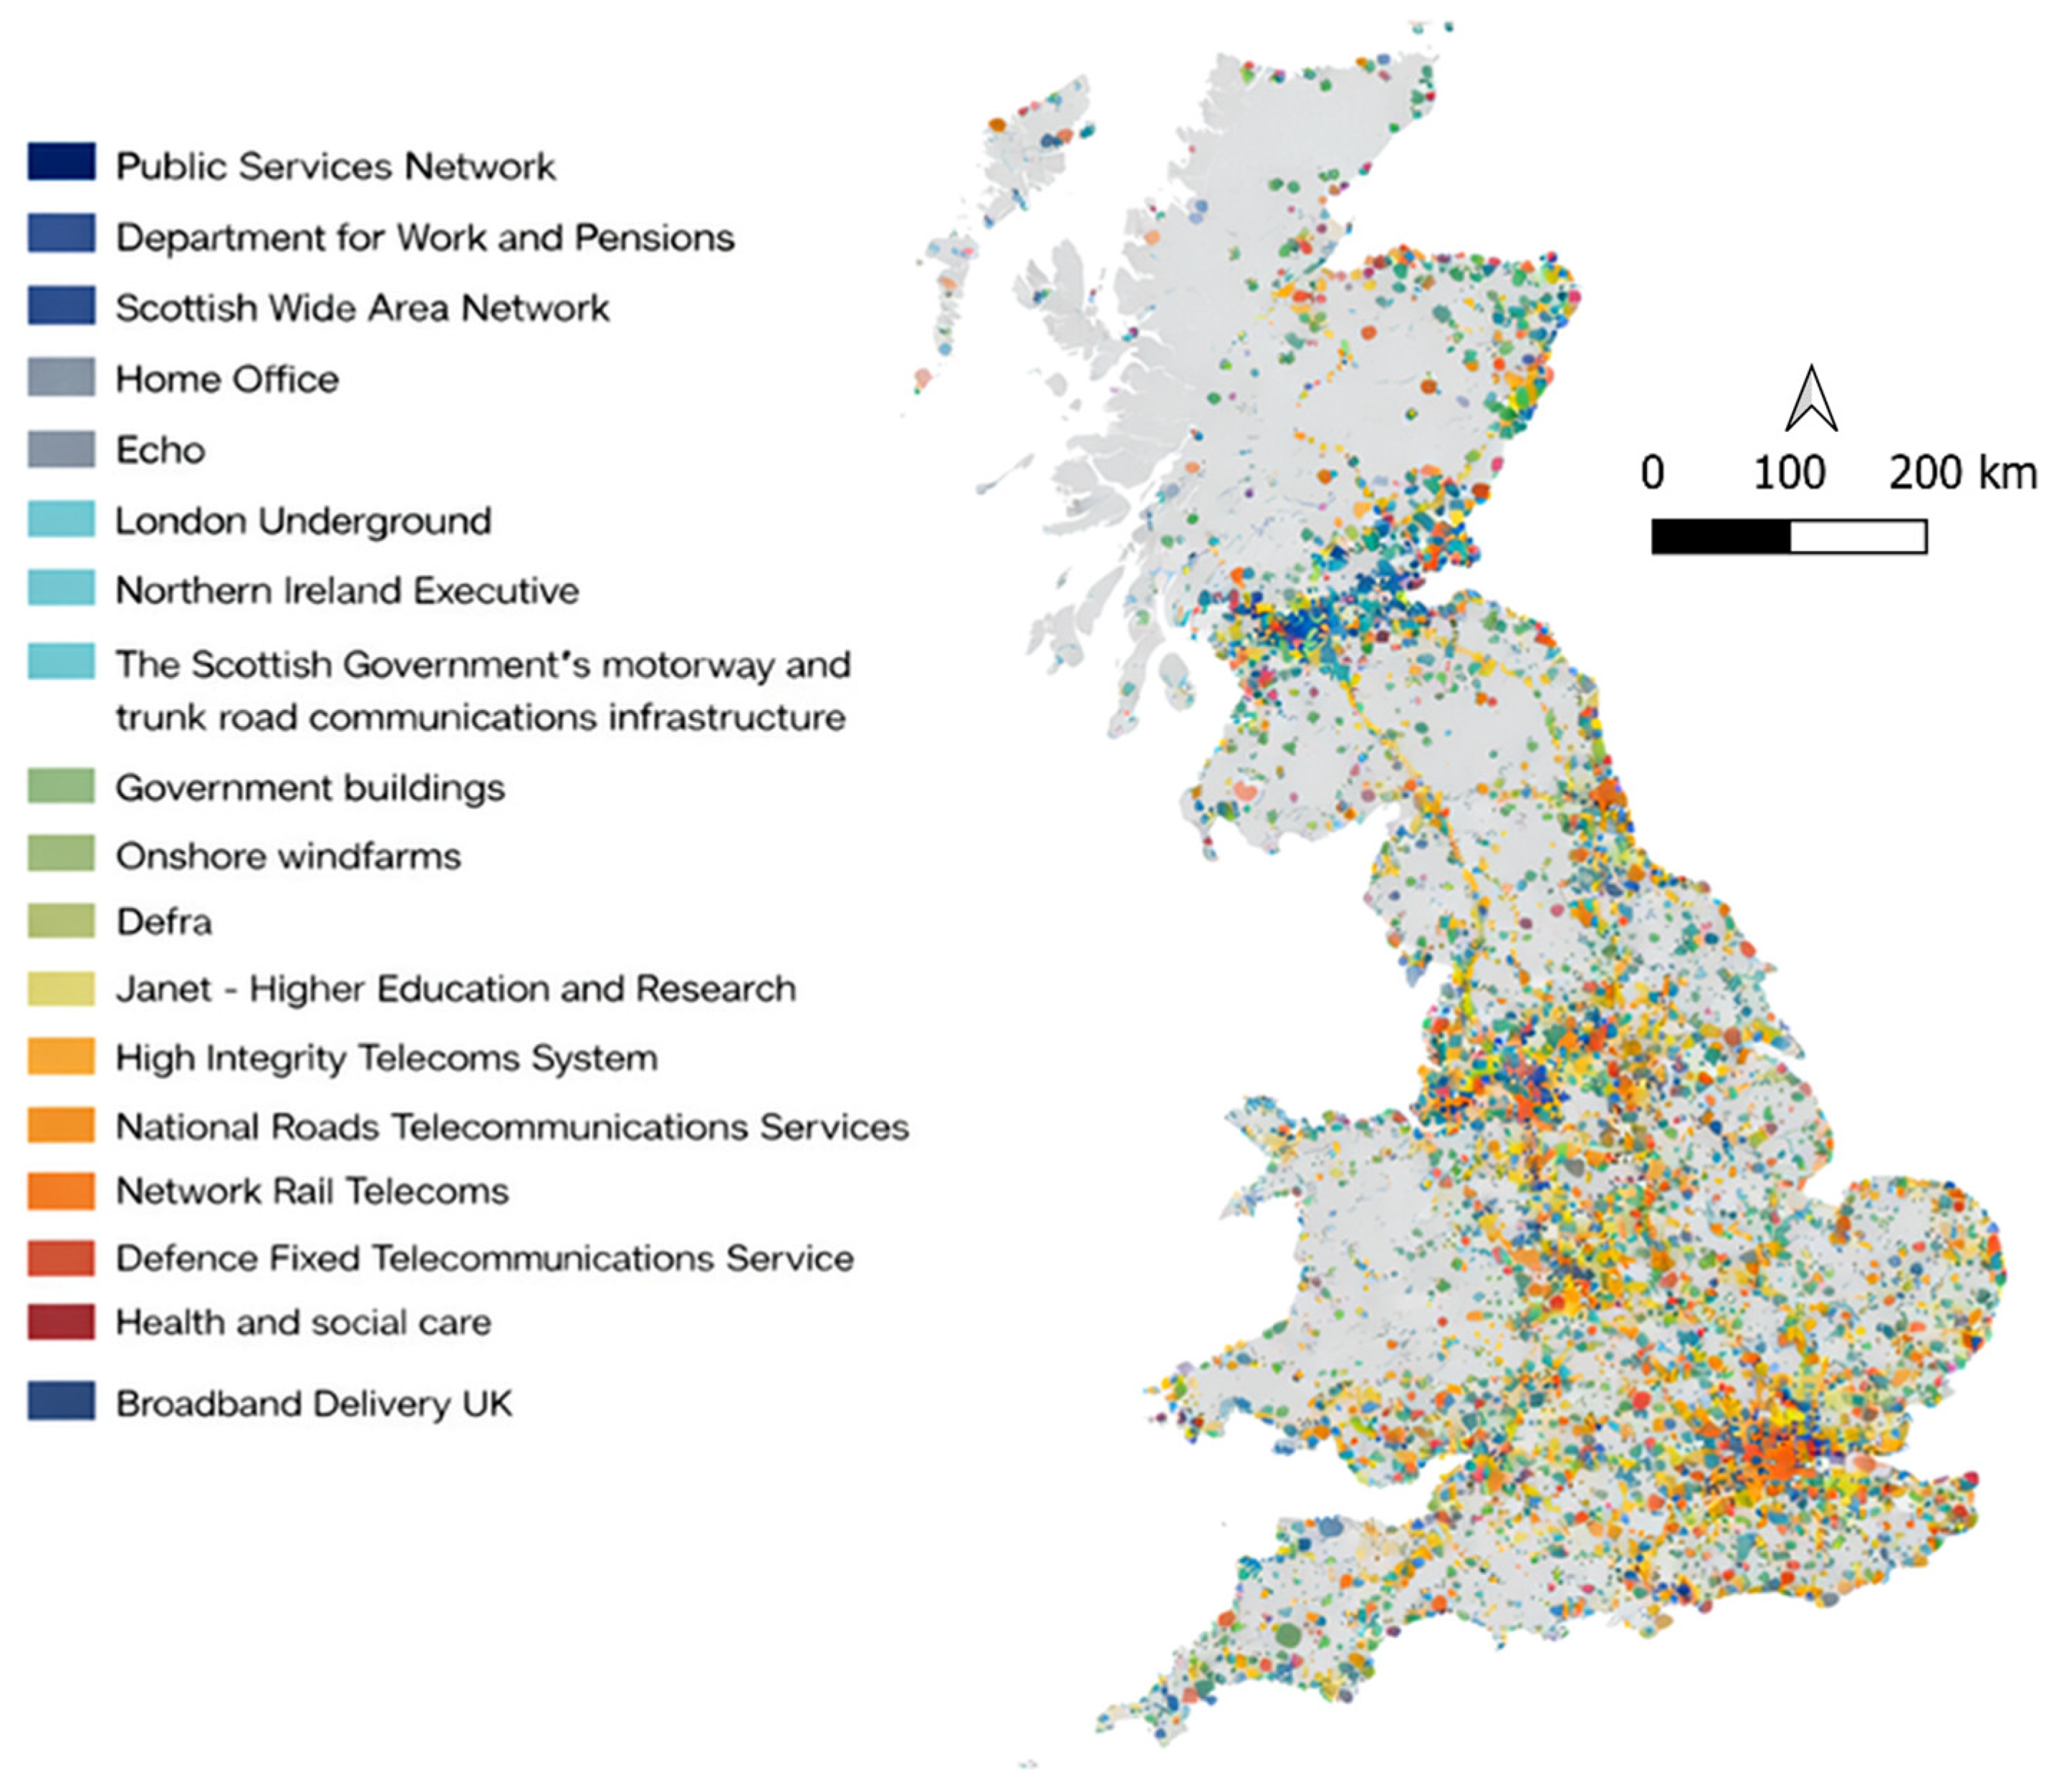
Figure 14 illustrates the underlying telecommunications infrastructure dataset used in the analysis. In the GIS workflow, this dataset was converted into a standardized proximity-based raster layer representing telecom accessibility, which was then integrated into the WLC suitability model.
Connectivity is a key consideration in data center regional selection. The national telecommunications infrastructure dataset shown in Figure 14 was converted into a proximity-based raster layer and standardized for inclusion as the telecom criterion within the WLC model. However, this dataset represents public and institutional network infrastructure rather than detailed commercial fiber backbone routes or Internet Exchange Point proximity. Therefore, the telecom suitability layer captures general infrastructure presence at a regional scale but does not explicitly model high-capacity backbone access. This approach is considered suitable for regional-scale screening, but for parcel-level assessment, the explicit inclusion of fiber backbone infrastructure and internet exchange point proximity would be required [51,52,53].
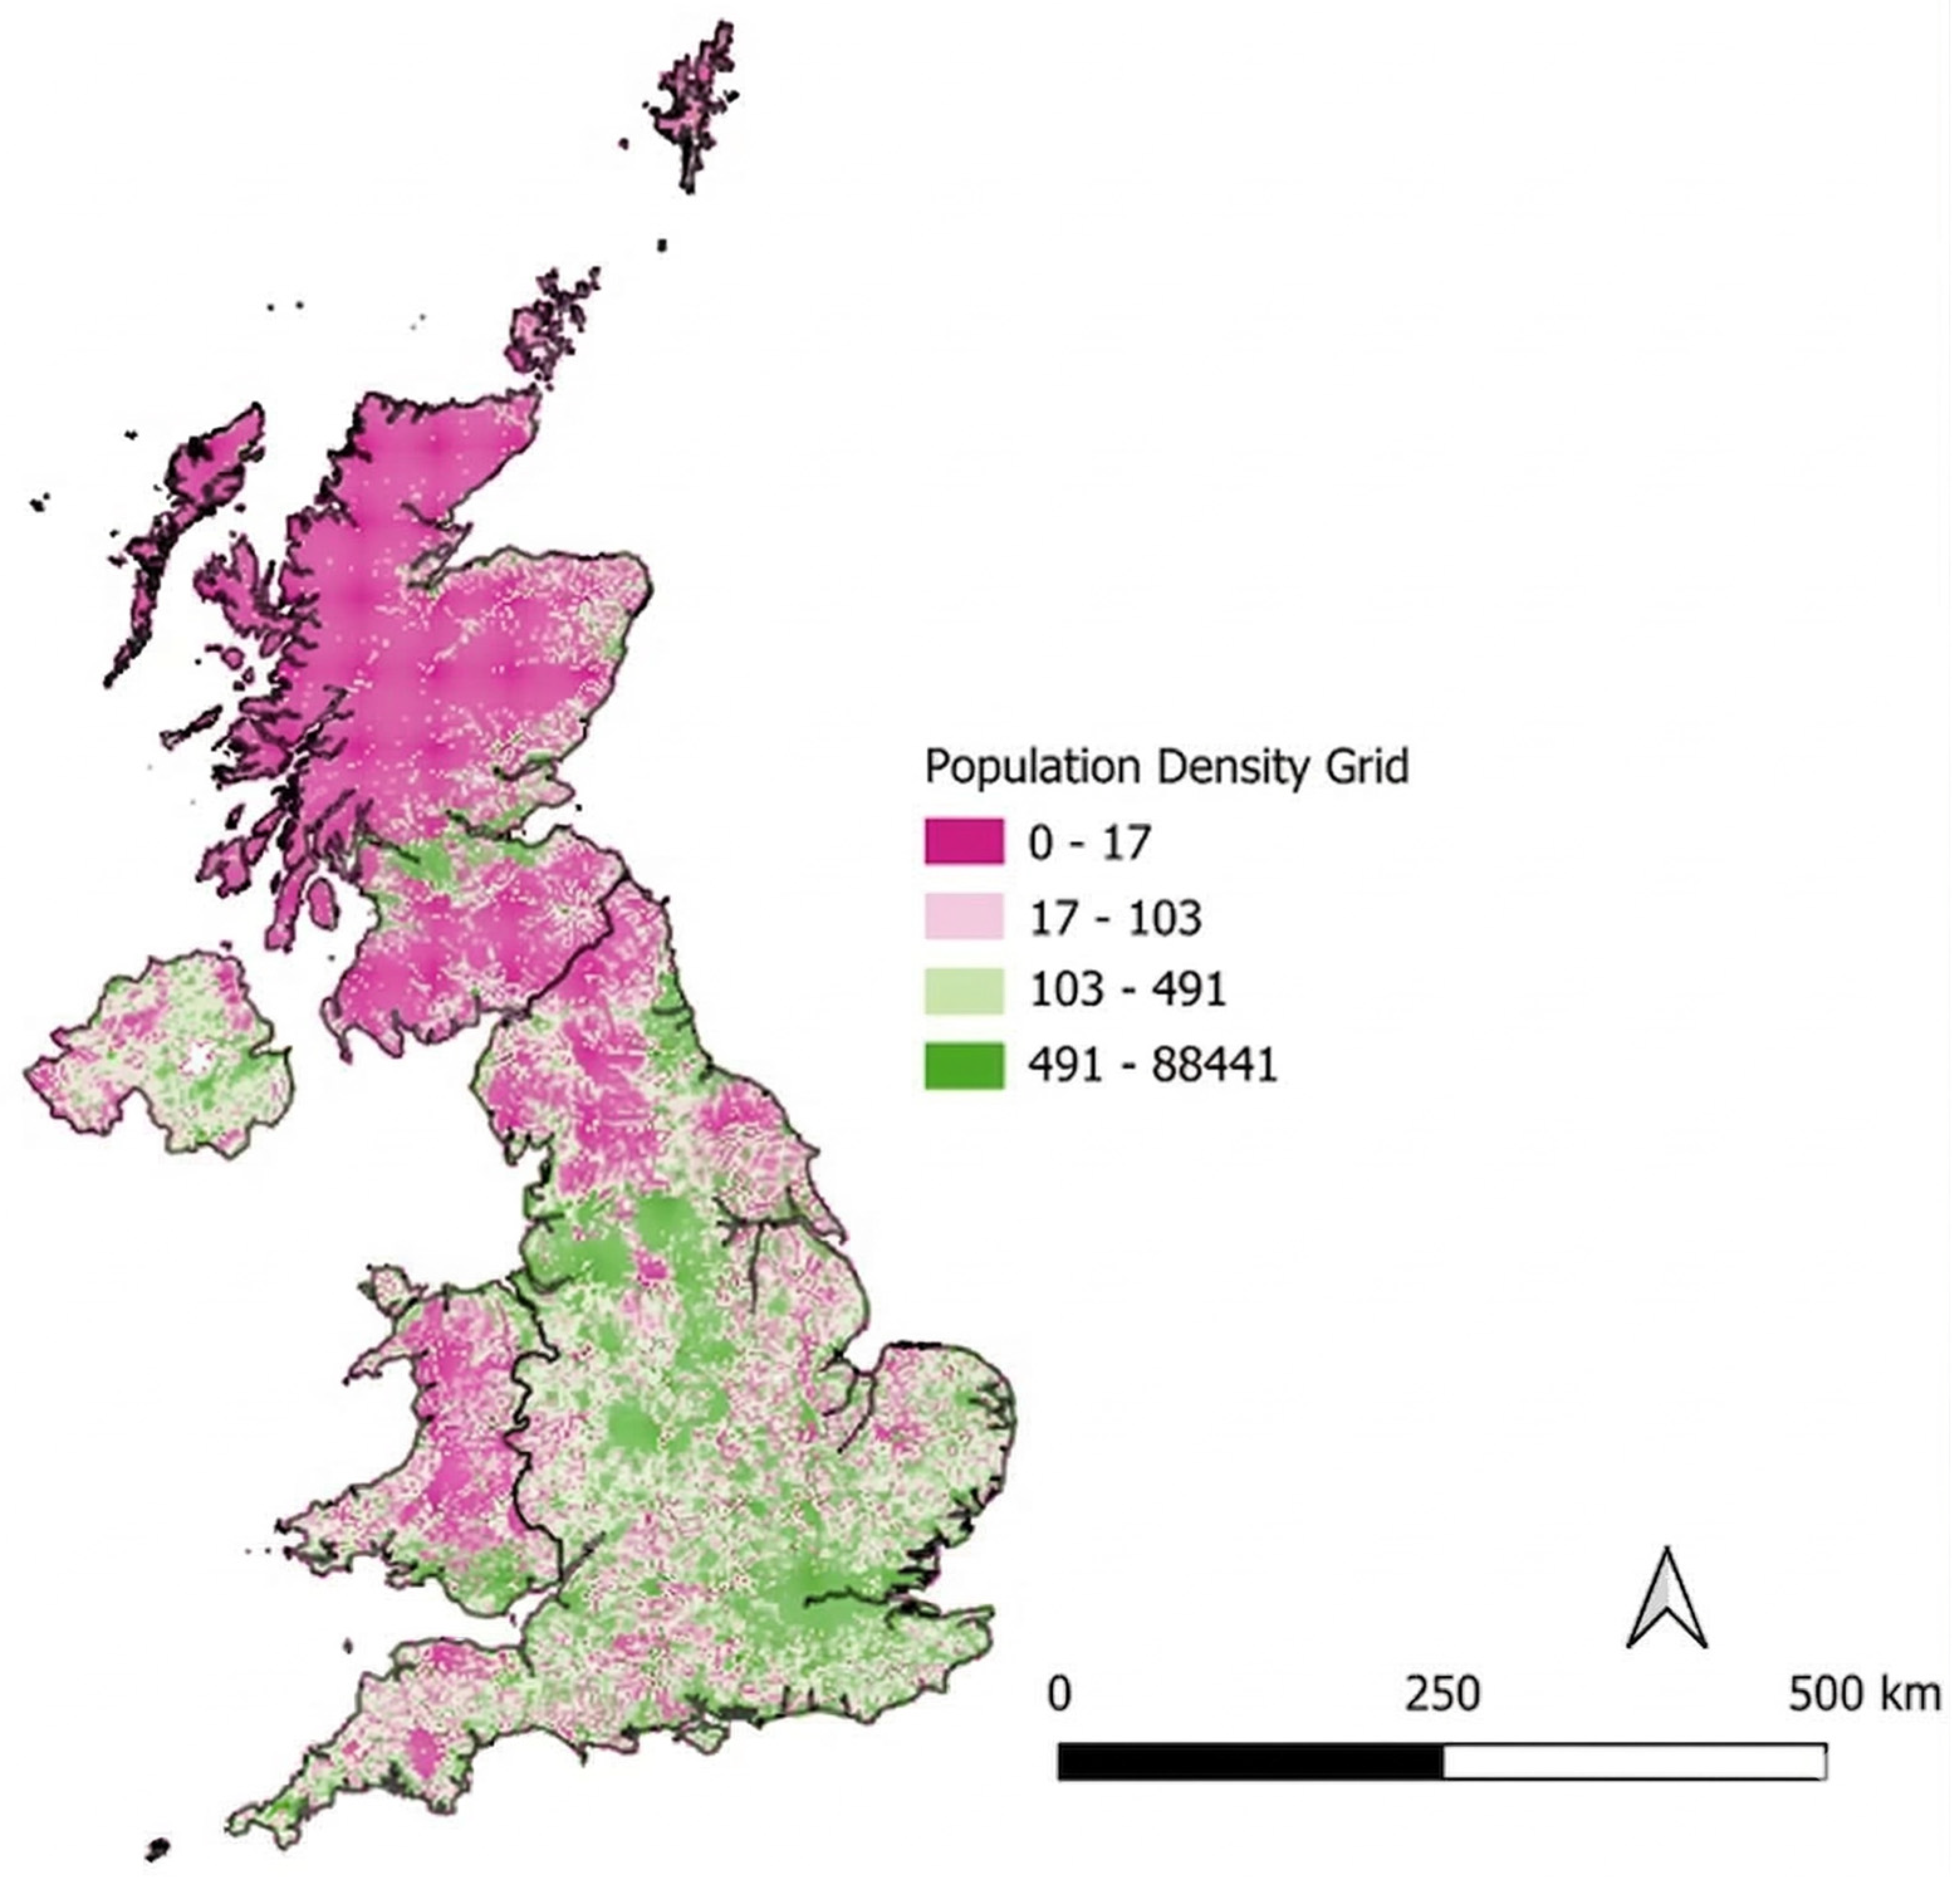
Population density was included to reflect workforce availability and also demand-side proximity. Figure 15 shows high-density urban areas and low-density rural areas. However, the goal was not to choose a dense urban core, because land cost, planning complexity, and lack of large footprints create difficulty. Therefore, the analysis favored peri-urban and regional hub zones, close enough to cities for workforce and connectivity, but not inside high-density centers. This was applied as graded scoring rather than a strict threshold.
Figure 12. High-voltage electrical substations in Great Britain (33 kV, 66 kV, 132 kV, 275 kV, 400 kV) [53]. Concentrations of substations (and thus strong grid infrastructure) are apparent in central, southern, and northwestern England, whereas parts of Scotland, Wales, and southwest England have sparser coverage.
Land 15 00516 g012
Figure 13. Major road network in England [54]. Here, red lines indicate motorways and primary A-roads. Shortlisted sites were all located near major highways to ensure construction and operational accessibility.
Land 15 00516 g013
Figure 14. Telecommunication and digital infrastructure map [55].
Land 15 00516 g014
Figure 15. Population density grid of the UK [56]. Green areas represent high population density (urban centers), while the pink areas are sparsely populated. Proximity to population centers was considered for workforce availability and network connectivity.
Land 15 00516 g015

4.1.5. Candidate Region Comparison and Final Selection

Figure 16 illustrates the locations that had potential for DC based on the above analysis with the scoring. Table 4 provides a comparative overview of key climatic, infrastructure, and demographic indicators for each candidate region, which led to the selection and rejection, while the final selection is based on the GIS-based suitability overlay. The total score represents the mean value of S ( x ) across all feasible (non-masked) grid cells within each candidate region, derived from the AHP-weighted WLC surface. The Scottish Highlands had the strongest cooling advantage, but it was rejected mainly due to remoteness and insufficient high-capacity grid infrastructure. Even if the climate is ideal, a DC requires a strong and stable power supply and also access to the labor and service ecosystem, and these were weak in the Highlands. The five candidate regions were identified from the AHP-weighted WLC suitability surface. High-scoring grid cells were first extracted quantitatively from the composite raster, after which contiguous clusters were delineated in QGIS to define coherent regional units. This delineation step involved spatial interpretation of the model output rather than the use of a fully automated regionalization algorithm, consistent with the objective of regional-scale screening.
The Newcastle region provides cooler conditions compared to southern England and has moderate infrastructure, but it is less central relative to the main UK DC clusters, and connectivity and market centrality were weaker compared with other regions. This increases the risk of higher backhaul and integration costs, even if the climate is acceptable.
Cornwall recorded strong solar potential and could support PV generation, but its warmer climate increases cooling demand. It is also geographically isolated at the southwest tip, with limited transmission strength compared with central corridors, and it has a lower population density. Planning sensitivity is also relevant due to protected landscapes near parts of the region. For these reasons, Cornwall was not selected.
This left two of the strong candidate regions, Cheshire (Northwest England) and Lincolnshire (Eastern England). Cheshire benefits from proximity to Manchester and strong grid infrastructure, which supports network connectivity and workforce availability. However, solar resources are lower than in the east, and land competition and expansion limits may be more significant in that region.
Lincolnshire scored strongly due to high solar potential and also robust grid corridors. The region contains large flat land areas that can support expansion at lower land pressure compared to more congested hubs. While Lincolnshire is not a major metropolitan area, it remains within a reasonable distance to the Midlands and London connectivity routes, so the latency penalty is expected to be limited at the regional scale. Importantly, the selected high suitability zones inside Lincolnshire avoid protected areas and major flood-related constraints at the kilometer scale.
A key limitation is that Lincolnshire is a large county with internal variation. The result does not imply the whole county is suitable. Instead, the suitability map identifies specific zones, and a follow-up site-level selection should incorporate more detailed hydrology, land classification, and local planning constraints.
Another limitation relates to data availability. Connectivity was represented using proxy indicators such as population proximity and transport corridors, mainly because a nationally consistent and high-resolution fiber backbone dataset was not accessible. As a result, the connectivity assessment reflects likely regional suitability rather than confirmed network readiness at a specific location.
Furthermore, infrastructure datasets, such as substation locations, indicate spatial proximity but do not guarantee available grid capacity or favorable connection conditions, which may change over time. Similarly, environmental constraints were modeled using nationally designated protected areas and rainfall exposure indicators. However, these simplified representations do not fully capture local ecological sensitivity or detailed flood risk, which are normally required during planning applications.
In addition, the analysis integrates datasets collected in different years and updated at different intervals, which may introduce some temporal inconsistencies, particularly in relation to infrastructure development and planning policy changes.
Overall, the findings should therefore be interpreted as a strategic regional screening outcome rather than a definitive identification of development-ready locations. The framework is mainly intended to narrow the national search space and support regional comparison, while detailed regulatory, technical, and location-specific assessments would still be required before practical implementation.
After weighing the composite suitability outputs and the practical feasibility considerations, Lincolnshire was selected as the optimal region. Overall, it provides the best balance between renewable potential, grid readiness, environmental constraint avoidance, and reasonable proximity to markets and connectivity. Table 4 also shows the composite suitability to summarize the numerical GIS-based results for each candidate region, including mean suitability. These quantitative indicators demonstrate that Lincolnshire has better performance than the choice relying solely on virtual inspection on the map. This interpretation was conducted using the predefined AHP-derived weights (Section 3.3) and the resulting composite suitability scores (Section 3.4) to support transparent regional comparison.
It is worth noting that some other criteria, such as land cost, electricity cost, and labor availability, can be considered. However, this paper focuses more on the geographical aspect instead of finance. The most promising large-scale sites often overlap with agricultural land. However, recent government reforms have designated data centers as Critical National Infrastructure (CNI). This means large developments can now be opted into the Nationally Significant Infrastructure Projects (NSIP) regime, shifting planning decisions to the national level and helping to balance strategic infrastructure needs against local agricultural preservation [43,57].

5. Conclusions

This study employed a GIS-based MCDA to identify suitable regions for sustainable and resilient DC development in the United Kingdom. By systematically integrating climate conditions, renewable energy potential, environmental constraints, and infrastructure accessibility, while considering seismic risk as part of the broader UK hazard context, the analysis identified five candidate regions for further assessment: the Scottish Highlands, Northeast England, Southwest England (Cornwall), Northwest England, and Eastern England. These regions represent areas where favorable conditions emerge from the combined spatial criteria at the regional scale.
Following a detailed comparison of these candidate regions, Lincolnshire emerged as the most advantageous region. This result is driven by its strong grid infrastructure, high solar energy potential, suitable climate conditions for efficient cooling, and limited overlap with protected or environmentally sensitive areas. In addition, the selected zones within Lincolnshire provide good proximity to high-capacity electrical substations and reasonable access to major markets and workforce centers, supporting both operational feasibility and long-term sustainability. These are reflected in terms of the score showing the favorability of the location.
Overall, this study demonstrates the value of GIS-driven spatial analysis and MCDA as decision-support tools for DC regional selection, allowing a balanced consideration of technical performance, environmental sustainability, and resilience to climate-related risks. The framework and findings presented here offer a transferable approach for strategic DC planning and can be adapted to support future digital infrastructure development in the UK and in regions with comparable environmental and infrastructural conditions.
Future research should focus on extending this regional screening framework toward site-level feasibility assessment. This includes the integration of high-resolution flood and drainage modeling, explicit fiber-optic backbone and internet exchange point datasets, and verified grid capacity and connection queue information. Further work should also incorporate techno-economic analysis, including land cost, electricity pricing, grid reinforcement requirements, and lifecycle carbon intensity in order to support investment-level decision-making. In addition, sensitivity analysis of key spatial parameters and scenario-based assessment under future climate projections would strengthen the robustness of regional suitability evaluations. Together, these developments would improve the practical applicability of GIS-based approaches for sustainable data center planning in the UK and beyond.

Author Contributions

Conceptualization, S.N.H., M.A.-M. and A.G.; methodology, S.N.H., M.A.-M. and A.G.; software, S.N.H. and M.A.-M.; validation, S.N.H., M.A.-M., S.M.F.A. and A.Z.; formal analysis, S.N.H., M.A.-M. and A.G.; investigation, S.N.H., M.A.-M. and A.G.; resources, A.G.; data curation, S.N.H. and M.A.-M.; writing, original draft preparation, S.N.H., M.A.-M. and A.G.; writing, review and editing, S.N.H., S.M.F.A., A.Z. and A.G.; visualization, S.N.H., M.A.-M. and A.G.; supervision, A.G.; project administration, A.G.; funding acquisition, A.G. All authors have read and agreed to the published version of the manuscript.

Funding

This research received no external funding.

Data Availability Statement

Data will be available upon request to the corresponding author.

Acknowledgments

For the purpose of open access, the author has applied a Creative Commons Attribution (CC BY) license to any Author Accepted Manuscript version arising from this submission. This was a part of the ASHRAE Region XIV Net-Zero Building Design Competition 2025, and won the first prize in the competition, using this information.

Conflicts of Interest

The authors declare no conflicts of interest.

Abbreviations

The following abbreviations are used in this manuscript:
AONBArea of Outstanding Natural Beauty
ASHRAEAmerican Society of Heating, Refrigerating and Air-Conditioning Engineers
BASBuilding Automation System
CIBSEChartered Institution of Building Services Engineers
DCData Center
GISGeographic Information System
PGAPeak Ground Acceleration
PUEPower Usage Effectiveness
SSSISite of Special Scientific Interest
TC 9.9Technical Committee 9.9
TIA-942Telecommunications Industry Association Standard 942
UKUnited Kingdom
WUEWater Usage Effectiveness

References

  1. Kollar, A.; Grady, C. The Relationship between Data Centers and the Climate Is a Systems Challenge: A Spatial Analysis of United States Data Centers. Environ. Res. Commun. 2025, 7, 111005. [Google Scholar] [CrossRef] [Scilit]
  2. Tao, Y.; Gao, P. Global Data Center Expansion and Human Health: A Call for Empirical Research. Eco-Environ. Health 2025, 4, 100157. [Google Scholar] [CrossRef] [Scilit]
  3. Jerléus, K.; Ibrahim, M.A.; Augustsson, A. Environmental Footprints of the Data Center Service Sector in Sweden. Heliyon 2024, 10, e31290. [Google Scholar] [CrossRef] [Scilit]
  4. Ziaei, P.; Husev, O.; Rabkowski, J. Data Centers as a Driving Force for the Renewable Energy Sector. Energies 2025, 19, 236. [Google Scholar] [CrossRef] [Scilit]
  5. Fiber Broadband Association. The Underappreciated Need to Enable AI and Data Center Growth: Increased and More Strategic Fiber Interconnections; Fiber Broadband Association: Washington, DC, USA, 2025. [Google Scholar]
  6. Shi, W.; Cao, J.; Zhang, Q.; Li, Y.; Xu, L. Edge Computing: Vision and Challenges. IEEE Internet Things J. 2016, 3, 637–646. [Google Scholar] [CrossRef] [Scilit]
  7. Clark, A. Data Centres: Planning Policy, Sustainability, and Resilience; House of Commons Library: London, UK, 2025; Available online: https://commonslibrary.parliament.uk/research-briefings/cbp-10315/ (accessed on 28 January 2026).
  8. Gandhi, H.; Chandran, R. We Mapped the World’s Hottest Data Centers. Rest of World. 2025. Available online: https://restofworld.org/2025/data-center-heat-map/ (accessed on 28 January 2026).
  9. Kheybari, S.; Davoodi Monfared, M.; Farazmand, H.; Rezaei, J. Sustainable Location Selection of Data Centers: Developing a Multi-Criteria Set-Covering Decision-Making Methodology. Int. J. Inf. Technol. Decis. Mak. 2020, 19, 741–773. [Google Scholar] [CrossRef] [Scilit]
  10. Masanet, E.; Shehabi, A.; Lei, N.; Smith, S.; Koomey, J. Recalibrating Global Data Center Energy-Use Estimates. Science 2020, 367, 984–986. [Google Scholar] [CrossRef] [Scilit] [PubMed]
  11. Yuan, X.; Liu, J.; Sun, S.; Lin, X.; Fan, X.; Zhao, W.; Kosonen, R. Data Center Waste Heat for District Heating Networks: A Review. Renew. Sustain. Energy Rev. 2025, 219, 115863. [Google Scholar] [CrossRef] [Scilit]
  12. Lei, N.; Lu, J.; Shehabi, A.; Masanet, E. The Water Use of Data Center Workloads: A Review and Assessment of Key Deter-minants. Resour. Conserv. Recycl. 2025, 219, 108310. [Google Scholar] [CrossRef] [Scilit]
  13. Census Population Estimates. Available online: https://ocsi.uk/2022/06/28/census-2021-east-of-england-has-seen-the-largest-population-increase/ (accessed on 28 January 2026).
  14. The Best Regions in the UK for Internet Speeds—Landlord Insider. Available online: https://www.landlordvision.co.uk/blog/best-regions-uk-internet-speeds/ (accessed on 28 January 2026).
  15. UK Power Cut Checker—Live Power Outage Map for Great Britain. Available online: https://ade-power.co.uk/uk-power-cut-checker/ (accessed on 28 January 2026).
  16. DataCenterMap Data Centers in the United Kingdom. Available online: https://www.datacentermap.com/united-kingdom/ (accessed on 28 January 2026).
  17. ANSI/ASHRAE Standard 62.1-2019; Ventilation for Acceptable Indoor Air Quality. ASHRAE: Atlanta, GA, USA, 2019.
  18. ANSI/ASHRAE/IES Standard 90.1-2019; Energy Standard for Buildings Except Low-Rise Residential Buildings. ASHRAE: Atlanta, GA, USA, 2019.
  19. ANSI/ASHRAE Standard 189.1-2020; Standard for the Design of High-Performance Green Buildings. ASHRAE: Atlanta, GA, USA, 2020.
  20. techUK. Future-Proofing Digital Infrastructure: Climate Resilience in the Data Centre Sector; techUK: London, UK, 2024. [Google Scholar]
  21. Cook, D.; Petursson, J.G. The Role of GIS Mapping in Multi-Criteria Decision Analysis in Informing the Location and Design of Renewable Energy Projects—A Systematic Review. Energy Strategy Rev. 2025, 59, 101765. [Google Scholar] [CrossRef] [Scilit]
  22. Covas, M.T.; Silva, C.A.; Dias, L.C. On Locating Sustainable Data Centers in Portugal: Problem Structuring and GIS-Based Analysis. Sustain. Comput. Inform. Syst. 2013, 3, 27–35. [Google Scholar] [CrossRef] [Scilit]
  23. Fan, C.; Zou, B.; Liao, Y.; Zhou, X. Evaluation of Energy Performance and Ecological Benefit of Free-Cooling Systems for Data Centers in Worldwide Climates. Sustain. Cities Soc. 2024, 108, 105509. [Google Scholar] [CrossRef] [Scilit]
  24. Arzumanyan, M.; Rodriguez Calzado, E.; Lin, N.; Bahadur, V.; Das, J.; Ko, T.L.; Koesterke, L. Geospatial Suitability Analysis for Data Center Placement: A Case Study in Texas, USA. Sustain. Cities Soc. 2025, 131, 106687. [Google Scholar] [CrossRef] [Scilit]
  25. Katkar, V.V.; Sward, J.A.; Worsley, A.; Zhang, K.M. Strategic Land-Use Analysis for Solar Energy Development in New York State. Renew. Energy 2021, 173, 861–875. [Google Scholar] [CrossRef] [Scilit]
  26. Halder, B.; Banik, P.; Almohamad, H.; Al Dughairi, A.A.; Al-Mutiry, M.; Al Shahrani, H.F.; Abdo, H.G. Land Suitability In-vestigation for Solar Power Plant Using GIS, AHP and Multi-Criteria Decision Approach: A Case of Megacity Kolkata, West Bengal, India. Sustainability 2022, 14, 11276. [Google Scholar] [CrossRef] [Scilit]
  27. An, H.; Ma, X. Dynamic Coupling Real-Time Energy Consumption Modeling for Data Centers. Energy Rep. 2022, 8, 1184–1192. [Google Scholar] [CrossRef] [Scilit]
  28. Mosca, I.; Sargeant, S.; Baptie, B.; Musson, R.M.W.; Pharaoh, T.C. The 2020 National Seismic Hazard Model for the United Kingdom. Bull. Earthq. Eng. 2022, 20, 633–675. [Google Scholar] [CrossRef] [Scilit]
  29. Carr, C.; Bast, D.; Madron, K.; Syrus, A.M. Mapping the Clouds: The Matter of Data Centers. J. Maps 2022, 18, 106–113. [Google Scholar] [CrossRef] [Scilit]
  30. Borkowski, M.; Piłat, A.K. Energy Efficiency Increase Achieved by Dedicated Rule-Based Control of Chillers Operating in the Data Center. Energies 2022, 15, 2419. [Google Scholar] [CrossRef] [Scilit]
  31. Turek, D.; Radgen, P. Optimized Data Center Site Selection—Mesoclimatic Effects on Data Center Energy Consumption and Costs. Energy Effic. 2021, 14, 33. [Google Scholar] [CrossRef] [Scilit]
  32. Wang, D.; Zhu, Y.; Mao, X.; Wang, J.; Ji, X. Industrial Site Selection: Methodologies, Advances and Challenges. Appl. Sci. 2025, 15, 11379. [Google Scholar] [CrossRef] [Scilit]
  33. Saaty, R.W. The Analytic Hierarchy Process—What It Is and How It Is Used. Math. Model. 1987, 9, 161–176. [Google Scholar] [CrossRef] [Scilit]
  34. Ifkirne, M.; El Bouhi, H.; Acharki, S.; Pham, Q.B.; Farah, A.; Linh, N.T.T. Multi-Criteria GIS-Based Analysis for Mapping Suitable Sites for Onshore Wind Farms in Southeast France. Land 2022, 11, 1839. [Google Scholar] [CrossRef] [Scilit]
  35. Takci, M.T.; Qadrdan, M.; Summers, J.; Gustafsson, J. Data Centres as a Source of Flexibility for Power Systems. Energy Rep. 2025, 13, 3661–3671. [Google Scholar] [CrossRef] [Scilit]
  36. Intel Corporation; Mena, M.; Musilli, J.; Austin, E.; Lee, J.; Vaccaro, P. Selecting a Data Center Site: Intel’s Approach; IT@Intel White Paper; Intel Corporation: Santa Clara, CA, USA, 2014; Available online: https://media14.connectedsocialmedia.com/intel/02/11447/IT_Best_Practices_Data_Center_Site_Selection.pdf (accessed on 28 January 2026).
  37. Lee, M.Z.; Rusli, N. A Multicriteria Decision-Making Approach for Identifying the Suitable Data Center Location in Iskandar Puteri, Johor. Chin. J. Urban Environ. Stud. 2025, 13, 2550021. [Google Scholar] [CrossRef] [Scilit]
  38. Rollinson, W.; Urquhart, A.; Thomson, M. Technoeconomic Feasibility of Wind and Solar Generation for Off-Grid Hyperscale Data Centres. Energies 2025, 18, 382. [Google Scholar] [CrossRef] [Scilit]
  39. Pasupuleti, M.K. Climate and Flood-Aware Data Centre Siting: A GIS and Hydrologic Simulation-Based Framework for Risk-Aware Cloud Infrastructure. Int. J. Acad. Ind. Res. Innov. (IJAIRI) 2024, 4, 90–111. [Google Scholar] [CrossRef] [Scilit]
  40. Nassar, A.K.; Al-Dulaimi, O.; Fakhruldeen, H.F.; Sapaev, I.B.; Jabbar, F.I.; Dawood, I.I.; Khalaf, D.H.; Algburi, S. Multi-Criteria GIS-Based Approach for Optimal Site Selection of Solar and Wind Energy. Unconv. Resour. 2025, 7, 100192. [Google Scholar] [CrossRef] [Scilit]
  41. Azizan, N.F.M.; Tarmidi, Z. GIS-Based Site Suitability for 5G Telecommunication Towers: Enhancing Mobile Network Cov-erage. J. Appl. Geospat. Sci. Technol. 2025, 5, 302–324. [Google Scholar] [CrossRef] [Scilit]
  42. techUK. The Uk’s Core Digital Infrastructure: Data Centres Climate Change Adaptation and Resilience; techUK: London, UK, 2016. [Google Scholar]
  43. National Planning Policy Framework—GOV.UK. Available online: https://www.gov.uk/government/publications/national-planning-policy-framework--2 (accessed on 28 January 2026).
  44. Annual Count of Frost Days 1991–2020|The Met Office Climate Data Portal. Available online: https://climatedataportal.metoffice.gov.uk/datasets/TheMetOffice::annual-count-of-frost-days-1991-2020/explore (accessed on 14 September 2025).
  45. Hollis, D.; McCarthy, M.; Kendon, M.; Legg, T.; Simpson, I. HadUK-Grid—A New UK Dataset of Gridded Climate Observa-tions. Geosci. Data J. 2019, 6, 151–159. [Google Scholar] [CrossRef] [Scilit]
  46. Met Office; Hollis, D.; Carlisle, E.; Kendon, M.; Packman, S.; Doherty, A. HadUK-Grid Gridded Climate Observations on a 1 km Grid over the UK (1862–2024), v1.3.1.ceda; NERC EDS Centre for Environmental Data Analysis: Didcot, UK, 2025. [Google Scholar] [CrossRef]
  47. Annual Count of 10 mm Rainfall Days 1991–2020|The Met Office Climate Data Portal. Available online: https://climatedataportal.metoffice.gov.uk/datasets/annual-count-of-10mm-rainfall-days-1991-2020/explore (accessed on 14 September 2025).
  48. Special Protection Areas (England) | Natural England Open Data Geoportal. Available online: https://naturalengland-defra.opendata.arcgis.com/datasets/special-protection-areas-england/explore?location=52.695770%2C-2.229306%2C6.83 (accessed on 14 September 2025).
  49. Flood Map for Planning—Flood Zones. Available online: https://environment.data.gov.uk/dataset/04532375-a198-476e-985e-0579a0a11b47 (accessed on 26 February 2026).
  50. Water Framework Directive (WFD) Lake Water Bodies Cycle 3 Classification 2022. Available online: https://environment.data.gov.uk/dataset/af2cf51a-e163-45c9-843f-824985fcb5f7 (accessed on 25 February 2026).
  51. Goiri, Í.; Le, K.; Guitart, J.; Torres, J.; Bianchini, R. Intelligent Placement of Datacenters for Internet Services. In Proceedings of the 2011 31st International Conference on Distributed Computing Systems, Minneapolis, MN, USA, 20–24 June 2011; pp. 131–142. [Google Scholar] [CrossRef] [Scilit]
  52. Daim, T.U.; Bhatla, A.; Mansour, M. Site Selection for a Data Centre—A Multi-Criteria Decision-Making Model. Int. J. Sustain. Eng. 2013, 6, 10–22. [Google Scholar] [CrossRef] [Scilit]
  53. Locations and Characteristics of Electricity Substations (33 KV or Larger), Great Britain, 2018—Data.Gov.Uk. Available online: https://www.data.gov.uk/dataset/1192779d-be8e-4a24-9436-2d1391809cc9/locations-and-characteristics-of-electricity-substations-33-kv-or-larger-great-britain-2018 (accessed on 25 February 2026).
  54. Major Road Network—Data.Gov.Uk. Available online: https://www.data.gov.uk/dataset/95f58bfa-13d6-4657-9d6f-020589498cfd/major-road-network (accessed on 25 February 2026).
  55. Telecommunications and Digital Infrastructure Maps: March 2015—GOV.Uk. Available online: https://www.gov.uk/government/publications/telecommunications-and-digital-infrastructure-maps-march-2015 (accessed on 28 January 2026).
  56. Carnell, E.; Tomlinson, S.J.; Reis, S. UK Gridded Population at 1 km Resolution for 2021 Based on Census 2021/2022 and Land Cover Map 2021; NERC EDS Environmental Information Data Centre: Didcot, UK, 2025. [Google Scholar] [CrossRef]
  57. Helios Renewable Energy Project. Environmental Statement Chapter 14: Soils and Agricultural Land; Kernon Countryside Con-sultants Ltd. (KCC): Swindon, UK, 2024. Available online: https://infrastructure.planninginspectorate.gov.uk/projects/yorkshire-and-the-humber/helios-renewable-energy-project/ (accessed on 28 January 2026).
Figure 1. Overview of the DCs around the UK [16]. The numbers indicate the number of data centres at each location.
Land 15 00516 g001
Figure 2. Methodological workflow of the GIS-based MCDA framework for data center region selection. Climate and infrastructure criteria were grouped, standardized and weighted using the Analytic Hierarchy Process (AHP)and integrated through a Weighted Linear Combination (WLC) to generate a 1 km resolution suitability surface for identifying optimal regions within the UK. The input datasets were obtained from national data providers, including the UK Met Office, NERC (Natural Environment Research Council), Natural England, and EA (Environment Agency).
Land 15 00516 g002
Figure 3. Computational workflow of the AHP procedure for criteria weighting. The process includes construction of the pairwise comparison matrix, eigenvector-based weight derivation, calculation of λmax, CI and CR, and consistency verification prior to integration into the WLC model.
Land 15 00516 g003
Figure 4. Annual count of air frost days (1991–2020) across the UK, indicating colder regions with more frequent frost [44,45].
Land 15 00516 g004
Figure 5. Average annual temperature (1991–2020) in the UK (1991–2020 baseline) [46].
Land 15 00516 g005
Figure 6. Mean relative humidity (%) across the UK (1991–2020) [45,46].
Land 15 00516 g006
Figure 7. Annual number of heavy precipitation days (>10 mm rain) in the UK (1991–2020) [47]. Here, Western and upland regions (dark blue) experience many more heavy rain days than eastern England (light shades), highlighting varying flood risk across the country.
Land 15 00516 g007
Figure 8. Annual solar radiation/sunshine hours across the UK (1991–2020) [46,47]. Southern and eastern regions enjoy the most sunshine, indicated by orange-red, indicating higher solar PV potential, while northern and western areas are significantly cloudier, indicated by blue-green.
Land 15 00516 g008
Figure 9. Protected environmental areas in England and Wales, including Areas of Outstanding Natural Beauty (green), Sites of Special Scientific Interest (purple), Heritage Coasts (orange), and designated Nature Recovery project sites (brown) [48]. The GIS analysis excluded sites within these zones to avoid environmental conflicts.
Land 15 00516 g009
Figure 10. Flood risk areas in England based on the available data. The GIS analysis excluded sites within these zones to avoid natural hazards [49].
Land 15 00516 g010
Figure 11. Spatial distribution of major lake water bodies in England [50]. Point features represent lake locations, with nearby water bodies visually aggregated for clarity.
Land 15 00516 g011
Figure 16. Regional suitability metrics for sustainable data center siting in the United Kingdom.
Land 15 00516 g016
Table 1. AHP Pairwise Comparison Matrix.
CategoryClimateWater BodiesGridRoadsPopulationTelecomProtectedHydro-Hazard
Climate12232227
Water Bodies1/211/2111/21/22
Grid Infrastructure1/22122114
Road Access1/311/2111/21/22
Population Density1/211/2111/21/22
Telecom Infrastructure1/22122114
Protected Areas1/22122114
Hydro-hazard1/71/21/41/21/21/41/41
Table 2. Derived AHP Weights and Consistency Indicators.
CategoryItemValue
WeightClimate0.250
Water Bodies0.0847
Grid Infrastructure0.154
Road Access0.0795
Population Density0.0847
Telecom Infrastructure0.154
Protected Areas0.154
Hydro-hazard0.039
Total1.000
Consistencyλmax8.07
CI0.0095
CR0.0067
Table 3. Constraints and their proximities [26,36,43].
S. No.ConstraintProximities
1Substation<4 km
2Airports1.6 km–8 km away
3RoadsAt least 800 m
4Railway>800 m
5Flood zones>91 m
6Overhead lines<4 km
7Nuclear plant>1.6 km
8Chemical plant>400 m
9AONB, SSSIEntirely avoided
Table 4. Comparison of shortlisted candidate regions using key climatic, infrastructure, and demographic indicators derived from GIS layers.
Candidate RegionClimate Cooling IndicatorsSolar Potential (Sunshine hrs yr−1)Grid, Power, Road & Telecommunication InfrastructureAONB, SSSI, Other Protected Area & Flood RiskPopulation AccessTotal Score
(Mean Suitability Score)
Outcome
Scottish HighlandsVery cool, avg ~5 °C, >150 frost days yr−1~900Distant from 275–400 kV network, limited capacityHas a significant natural heritage areaVery low, sparse population0.30Rejected
Northeast England (Newcastle area)Cool, avg ~8–9 °C, moderate frost~1000–1200132 kV present, limited transmission hubsConsists of SSSI, National parks, and some areas covered with AONBModerate near city only0.46Rejected
Southwest England (Cornwall)Warm, avg ~11 °C, few frost days>1600132 kV grid, end of network locationAONB areas can be found across this regionLow, remote0.54Rejected
Northwest England (Cheshire)Mild, avg ~9–10 °C, moderate frost~1100–1300Multiple 400 kV substations nearbyNot dominated with protected areasHigh, Manchester and Liverpool0.59Finalist
Eastern England (Lincolnshire)Mild, avg ~10 °C, moderate frost>1500Strong 400 kV corridor and substationsThough not dominated by protected areas but is a home to some of the AONBMedium, regional towns0.65Selected
Note: AONB = Area of Outstanding Natural Beauty; SSSI = Site of Special Scientific Interest.
Disclaimer/Publisher’s Note: The statements, opinions and data contained in all publications are solely those of the individual author(s) and contributor(s) and not of MDPI and/or the editor(s). MDPI and/or the editor(s) disclaim responsibility for any injury to people or property resulting from any ideas, methods, instructions or products referred to in the content.