Article

Measurement and Spatiotemporal Evolution of Urban Low-Carbon Coordinated Development Under the 3E1S Framework: Evidence from Chinese Cities

1
Department of Marxist Ideology, Party School of Zhejiang Provincial Committee of C.P.C. (Zhejiang Institute of Administration), Hangzhou 311121, China
2
School of Public Policy and Management, Tsinghua University, Beijing 100084, China
*
Author to whom correspondence should be addressed.
Land 2026, 15(3), 504; https://doi.org/10.3390/land15030504
Submission received: 13 February 2026 / Revised: 17 March 2026 / Accepted: 19 March 2026 / Published: 20 March 2026

Abstract

In the context of the “dual carbon” goals, this study examines the spatiotemporal patterns and evolution of urban low-carbon coordinated development (LCCD). Based on the integrated Economy–Energy–Environment–Society (3E1S) framework, this study constructs a multidimensional evaluation index system for urban LCCD and applies a composite system coordination degree model to quantitatively assess and analyze the spatiotemporal evolution of LCCD across 271 prefecture-level and above cities in China from 2005 to 2020. The results indicate that (1) from a temporal perspective, the level of urban LCCD in China exhibits an overall upward trend during the study period, with relatively rapid growth from 2005 to 2015, a subsequent slowdown after 2015, and a stage-wise decline observed in 2020, reflecting a transition from rapid improvement to gradual adjustment; (2) from a spatial perspective, urban LCCD demonstrates a certain degree of spatial autocorrelation and an overall spatial structure characterized by a southwest–northeast-oriented axis, with spatial agglomeration features gradually strengthening over time; (3) from a system structure perspective, the coordinated evolution of the 3E1S subsystems shows clear differentiation, with the energy and economic subsystems following an inverted U-shaped trajectory, the environmental subsystem exhibiting a fluctuating upward trend, and the social subsystem maintaining continuous improvement, highlighting the inherent imbalance in the multidimensional process of subsystem coordination. From a multisystem coordination perspective, this study systematically identifies the spatiotemporal evolutionary characteristics and subsystem coupling relationships of urban low-carbon coordinated development, providing empirical evidence for a deeper understanding of multidimensional low-carbon coordination processes in cities.

1. Introduction

Against the backdrop of intensifying global climate change and the accelerated advancement of green transition, low-carbon development has become a key strategic pathway for countries to promote sustainable growth and ecological governance. Since China proposed the “dual carbon” goals, cities—serving as core spatial units of energy consumption and carbon emissions, as well as key carriers with a high concentration of industrial activities, technological innovation, and institutional governance—have assumed a fundamental and leading role in the low-carbon transition process. Urban low-carbon development is not merely reflected in reductions in carbon emission intensity or optimization of energy structures; rather, it represents a comprehensive process involving the coordinated advancement of multiple dimensions, including economic development patterns, resource use efficiency, environmental governance capacity, and improvements in social welfare. Therefore, systematically characterizing the level and evolutionary characteristics of urban low-carbon development from a multisystem coordination perspective is of significant research value for deepening the systemic understanding of urban low-carbon transition processes.
However, under the long-standing development paradigm oriented toward economic growth, structural imbalances persist in the low-carbon transition of some regions. These imbalances are manifested in the coexistence of economic expansion and rigid growth in energy consumption, as well as insufficient coordination between environmental governance and social development dimensions. Optimization in a single dimension or isolated sector is insufficient to comprehensively reflect the overall performance of the low-carbon transition, nor can it effectively reveal the synergistic relationships and structural coupling states among multiple systems. In this context, incorporating energy, economy, environment, and society into an integrated analytical framework and conducting a comprehensive assessment of low-carbon coordinated development (LCCD) has become an important direction in low-carbon city research.
Accordingly, this study introduces the integrated Economy–Energy–Environment–Society (3E1S) framework and constructs a multidimensional evaluation index system for urban LCCD from a multisystem coordination perspective. A composite system synergy degree model is employed to quantitatively assess the level of LCCD across 271 prefecture-level and above cities in China from 2005 to 2020. On this basis, spatial statistical analysis and geographic visualization methods are combined to systematically depict the temporal evolution and spatial patterns of urban LCCD and the coordinated evolution of its subsystems, thereby revealing the overall spatiotemporal dynamics and multisystem coordination structures.
The main objectives of this study are as follows:
  • To construct a multidimensional evaluation index system for urban LCCD based on the 3E1S framework;
  • To reveal the structural differentiation and spatiotemporal evolutionary characteristics of the coordinated evolution of the 3E1S subsystems;
  • To measure and analyze the level of urban LCCD in China and its spatiotemporal evolution.

2. Literature Review

Existing studies have quantitatively measured and evaluated low-carbon development from multiple perspectives, with research primarily focusing on carbon emission accounting, low-carbon efficiency assessment, and the construction of green development indices. Early studies were largely based on energy consumption and carbon emission inventory data and employed indicators such as carbon emission intensity, carbon emissions per unit of output, and carbon productivity to characterize the level of low-carbon development at urban or regional scales [1,2,3]. Although these approaches are characterized by clear indicators and strong data comparability, they mainly capture emission outcomes and provide limited insights into the coordinated changes among multiple development dimensions during the low-carbon transition process. Consequently, such indicator systems are often insufficient for revealing the complex interactions among economic, environmental, and social subsystems during the process of low-carbon transition.
As evaluation frameworks have gradually expanded, subsequent studies have incorporated indicators related to economic structure, resource-use efficiency, environmental performance, and social development to construct multidimensional composite evaluation systems for assessing green and low-carbon development [4,5,6,7]. Such multi-indicator approaches enable the characterization of development quality differences from a system-level perspective, shifting low-carbon assessment from an “emission-oriented” focus toward a more “comprehensive performance-oriented” framework. Recent studies have further emphasized the importance of integrating multiple sustainability dimensions and linking them with policy-oriented interpretations. For example, Shmelev (2025) developed a multidimensional sustainability assessment framework to compare national development trajectories under different policy priorities, highlighting the need to interpret sustainability performance through interactions among economic, environmental, and social systems [8]. Similarly, Shmelev et al. (2023) examined sustainability performance across European regions using multidimensional indicators and demonstrated that systemic linkages among development dimensions are essential for understanding regional sustainability outcomes [9]. As a result, low-carbon evaluation systems have gradually evolved toward multidimensional and systematic assessment. However, many existing multidimensional evaluation systems still emphasize aggregated performance indicators, while the internal interaction mechanisms and coordinated evolution among different subsystems remain insufficiently examined.
In terms of methodological approaches, research on low-carbon development assessment has formed multiple technical pathways. Composite index methods, which integrate multiple indicators through normalization and weighted aggregation, have been widely applied in comparative studies across regions and cities [10,11]. Efficiency evaluation models, such as input–output–based efficiency measurement methods, assess low-carbon development performance from the perspective of resource allocation efficiency [12,13,14]. Meanwhile, multi-indicator weighting and objective weighting methods increasingly incorporate techniques such as entropy and coefficient of variation to reduce biases arising from subjective weight assignment [15,16]. In addition, some studies have begun to introduce multi-source data and big data approaches to conduct dynamic assessments and cross-validation of low-carbon development levels, further enhancing the robustness of evaluation results [6,17]. Recent research has also emphasized the importance of linking sustainability assessment with policy-driven transitions and systemic governance mechanisms. For instance, Hezardastan and Shmelev (2025) analyzed the effectiveness of policy instruments in promoting circular economy practices and sustainable waste management, demonstrating how economic, environmental, and institutional factors jointly shape sustainability outcomes [18]. Nevertheless, most existing studies still concentrate on evaluating the performance of individual subsystems or overall development outcomes, while the systematic measurement of coordinated interactions among multiple subsystems remains relatively limited.
With the increasing integration of systems science and sustainable development theory, multisystem coupling and synergy analysis has gradually become an important direction in low-carbon research. Coupling coordination theory has been widely applied to characterize interactions and coordination states among different subsystems, with related studies mainly examining the coupling relationships between low-carbon development and urbanization processes, industrial structure upgrading, technological innovation capacity, and ecological environmental systems [19,20,21,22]. In terms of modeling approaches, the composite system synergy degree model has emerged as an important tool for synergy measurement [23,24,25]. Compared with the coupling coordination degree model, this approach is less sensitive to indicator weighting and can dynamically reflect internal synergistic mechanisms and evolutionary processes through changes in order parameters, enabling it to better capture system dynamics and development trends [26,27]. By contrast, although the coupling coordination degree model features a clear computational structure, its formulation becomes increasingly complex as the number of subsystems increases and often requires modification before application. Moreover, both traditional and modified coupling coordination degree models suffer from issues related to result volatility and limited comparability, which may affect their reliability [28,29,30]. Consequently, some studies have adopted a comprehensive multisystem perspective by integrating energy, economy, and environment into a unified analytical framework and employing composite system synergy degree models to assess overall system coordination [31,32]. In recent years, several studies have further incorporated the social dimension into the 3E framework to form the 3E1S framework and applied coupling coordination degree models or composite system synergy degree models accordingly [33,34,35]. However, despite these developments, existing studies still face challenges in achieving a systematic and balanced integration of multiple subsystems, particularly in capturing the structural relationships and coordination mechanisms within the 3E1S framework.
Regarding research scale, studies on low-carbon development have covered multiple spatial levels, including national, provincial, and urban agglomeration scales [36,37,38]. While national- and provincial-level studies are conducive to identifying overall trends and regional disparities, research at the urban agglomeration and city scales is more effective in revealing spatial spillover effects and localized synergy mechanisms. With the increasing availability of urban-level data, city-scale studies on low-carbon development have expanded in recent years. Yet, relatively few studies treat cities as integrated multisystem units to systematically examine coordinated development across multiple subsystems over long time periods.
The introduction of spatial analytical methods has further promoted the transition of low-carbon development research from static evaluation toward spatiotemporal evolutionary analysis. Existing studies have systematically examined spatial patterns and agglomeration characteristics of low-carbon development using methods such as spatial autocorrelation analysis, hotspot identification, spatial econometric models, and spatial distribution center analysis [39,40,41,42]. From a temporal perspective, some studies have identified stage-wise trends in low-carbon or green development performance based on long time-series data, revealing the dynamic impacts of policy regulation, industrial restructuring, and technological progress on low-carbon transitions [43,44,45,46,47]. However, studies that simultaneously integrate multisystem synergy analysis, long-term time-series perspectives, and city-scale spatiotemporal evolution remain relatively scarce.
Overall, although previous studies have made important progress in low-carbon development measurement, multisystem coupling analysis, and spatiotemporal characterization, several research gaps remain. First, many studies still focus on single-system or dual-system coordination, while comprehensive synergistic measurement within the integrated 3E1S framework remains insufficiently explored. Second, long-term city-scale analyses of synergistic evolution are relatively limited, and the stage-wise characteristics of system evolution have not been systematically examined. Third, the structural differentiation and non-equilibrium characteristics among subsystems during the synergistic development process have rarely been analyzed within a unified quantitative framework.
To address these gaps, this study adopts the integrated 3E1S framework and a multisystem synergy perspective to systematically measure and analyze the level and spatiotemporal evolution of LCCD at the city level. By integrating multidimensional system evaluation with long-term spatiotemporal analysis, this study aims to contribute to the methodological development of multisystem synergy assessment and to provide new insights into the spatiotemporal evolution of low-carbon coordinated development at the urban scale.

3. Theoretical Foundation and Analytical Framework

3.1. Theoretical Foundation

3.1.1. 3E1S System Theory

The Economy–Energy–Environment (3E) system theory originates from a systematic reflection on the relationship between energy utilization and economic growth. Early studies in resource economics pointed out that energy, as a key input factor for industrialization and economic growth, can simultaneously promote economic expansion and impose intrinsic constraints on the economic system through resource limitations and environmental externalities. This perspective reveals that the relationship between energy and the economy is not unidirectionally facilitative, but rather characterized by structural tensions.
With the acceleration of industrialization and urbanization, rapid growth in energy demand has made issues related to energy security, resource efficiency, and economic sustainability increasingly prominent. Development models dominated by energy consumption and economic growth have exhibited clear limitations over the long term, particularly in the context of accumulating environmental pollution and intensifying ecosystem degradation. Multiple energy crises in the 1970s further demonstrated that a single economic- or energy-centered perspective is insufficient to effectively explain systemic risks in complex development processes.
Against this background, research paradigms gradually shifted from a binary “energy–economy” analysis toward integrated system analysis, with environmental factors being incorporated into the core analytical framework. Meadows et al. (1972), from a systems perspective, revealed the mutual constraints among resource consumption, economic growth, and environmental carrying capacity, emphasizing that economic systems must operate within natural ecological boundaries [48]. This work laid an important foundation for the formation of the 3E system theory. The emergence of the sustainable development concept further clarified the necessity of achieving long-term coordination and dynamic balance among economic development, energy use, and environmental protection [49], promoting the evolution of the 3E system from static relationship analysis toward multidimensional interaction analysis.
Entering the 21st century, under the increasing constraints of global climate change and carbon reduction, the research scope of 3E system theory has continued to expand. The focus has shifted from single efficiency or structural issues toward the dynamic interactions among energy systems, economic structures, and environmental performance. Existing studies indicate that nonlinear feedbacks, stage-wise evolution, and path dependence are prevalent among the 3E subsystems, and that optimization in a single dimension is insufficient to ensure the sustainable operation of the overall system [50]. The introduction of system dynamics and complex system theory has further enhanced the capacity of the 3E framework to capture multisubsystem co-evolution and its long-term effects [51,52].
Despite its strengths in explaining energy–economy–environment relationships, the traditional 3E system remains limited in its representation of social dimensions. Existing research shows that social factors—such as social structure, public service provision, residents’ well-being, and human capital—exert significant influences on low-carbon transitions by shaping energy consumption behavior, economic development quality, and environmental governance performance. However, within the conventional 3E framework, social factors are often treated as exogenous conditions, making it difficult to systematically capture their intrinsic coupling relationships with energy, economic, and environmental systems.
To address this limitation, scholars have incorporated the social subsystem into the 3E system, forming the 3E1S system theory. The 3E1S framework conceptualizes low-carbon development as a comprehensive process of coordinated evolution among multiple subsystems, including energy-use efficiency, economic development modes, environmental quality improvement, and social welfare enhancement. This framework enables a more comprehensive understanding of subsystem interactions and structural differentiation during low-carbon transitions.
At the urban scale, the 3E1S system theory exhibits stronger explanatory power. Cities, as spatial units with high concentrations of energy consumption, economic activities, environmental pressures, and social elements, inherently reflect dynamic coordination and structural adjustment among multiple subsystems within a limited space. Compared with the traditional 3E framework, the 3E1S system theory is better suited to revealing the non-equilibrium characteristics and spatiotemporal evolution of multidimensional coordination in urban low-carbon development, providing systematic theoretical support for the comprehensive measurement and evolutionary analysis of urban LCCD.

3.1.2. Synergetics Theory

Synergetics is a theoretical framework used to characterize interactions among multiple elements within complex systems and their emergent collective behavior. Its core concern lies in how systems evolve from disordered states to ordered structures through nonlinear interactions among internal elements. Proposed by Haken (1977), the theory was initially developed to explain self-organization phenomena in physical systems and was later widely applied to biological, social, and economic systems [53].
The fundamental premise of synergetics is that in open systems far from equilibrium, system evolution is not governed by a single element but is dominated by a small number of key variables that control macroscopic behavior. These variables, known as order parameters, determine the direction and degree of system evolution from disorder to order by “enslaving” a large number of microscopic variables. As such, order parameters serve as critical indicators of system synergy and ordering levels [54].
In complex systems composed of multiple subsystems, significant nonlinear feedbacks, mutual constraints, and co-evolutionary relationships often exist among subsystems. Synergetics emphasizes that overall system behavior is not a simple aggregation of subsystem behaviors, but rather the result of emergent synergistic effects arising from multisystem interactions. This perspective provides an important theoretical tool for analyzing coordination levels, evolutionary pathways, and stage-wise characteristics among multiple systems.
In socio-economic and sustainable development research, synergetics has increasingly been applied to interpret the co-evolution of economic, resource, environmental, and social subsystems. Relevant studies indicate that socio-economic systems exhibit typical features of complex systems, including nonlinearity, path dependence, and phase transitions, and that synergetics can effectively characterize the dynamic mechanisms through which systems evolve from imbalance toward coordination [55].
Accordingly, introducing synergetics into the analysis of the 3E1S system facilitates the identification of key order parameters that determine system evolution trajectories within multisubsystem interactions, and provides a theoretical basis for constructing quantitative measures of multisystem synergy. Within this framework, low-carbon development can be understood as a dynamic process in which multidimensional subsystems progressively achieve higher levels of order and structural optimization through synergistic evolution, thereby establishing a solid theoretical foundation for applying composite system synergy degree models to measure urban LCCD.

3.2. Analytical Framework

Low-carbon development is essentially a complex nonlinear process driven by the joint effects of energy, economic, environmental, and social dimensions, with its evolutionary outcomes depending on the interactions and synergy levels among subsystems. In practical terms, this means that improvements in low-carbon development cannot be explained by changes in a single dimension alone, but rather by how these different subsystems evolve together and reinforce each other. In this study, the 3E1S system theory and synergetics theory complement each other to jointly form the theoretical foundation for measuring LCCD and analyzing its spatiotemporal evolution.
Specifically, the 3E1S system theory provides a unified analytical framework encompassing energy, economy, environment, and society to characterize the multidimensional structural features and overall level of LCCD. Within this framework, each subsystem is represented by a set of indicators describing its development performance, such as economic growth, energy utilization efficiency, environmental quality, and social welfare conditions. Synergetics theory, from a complex systems perspective, elucidates the internal mechanisms through which synergistic effects emerge from multisubsystem interactions, offering methodological support for the quantitative measurement of LCCD. In this study, the concept of “order degree” is used to describe the development state or performance level of each subsystem based on its indicator values. A higher-order degree indicates that the subsystem is operating in a more stable and coordinated manner within the overall low-carbon development system. Based on synergetics theory, this study employs a composite system synergy degree model to assess the synergistic states of the 3E1S subsystems and their evolutionary characteristics. The synergy degree therefore reflects the extent to which the four subsystems develop in a coordinated way, rather than improving independently of one another.
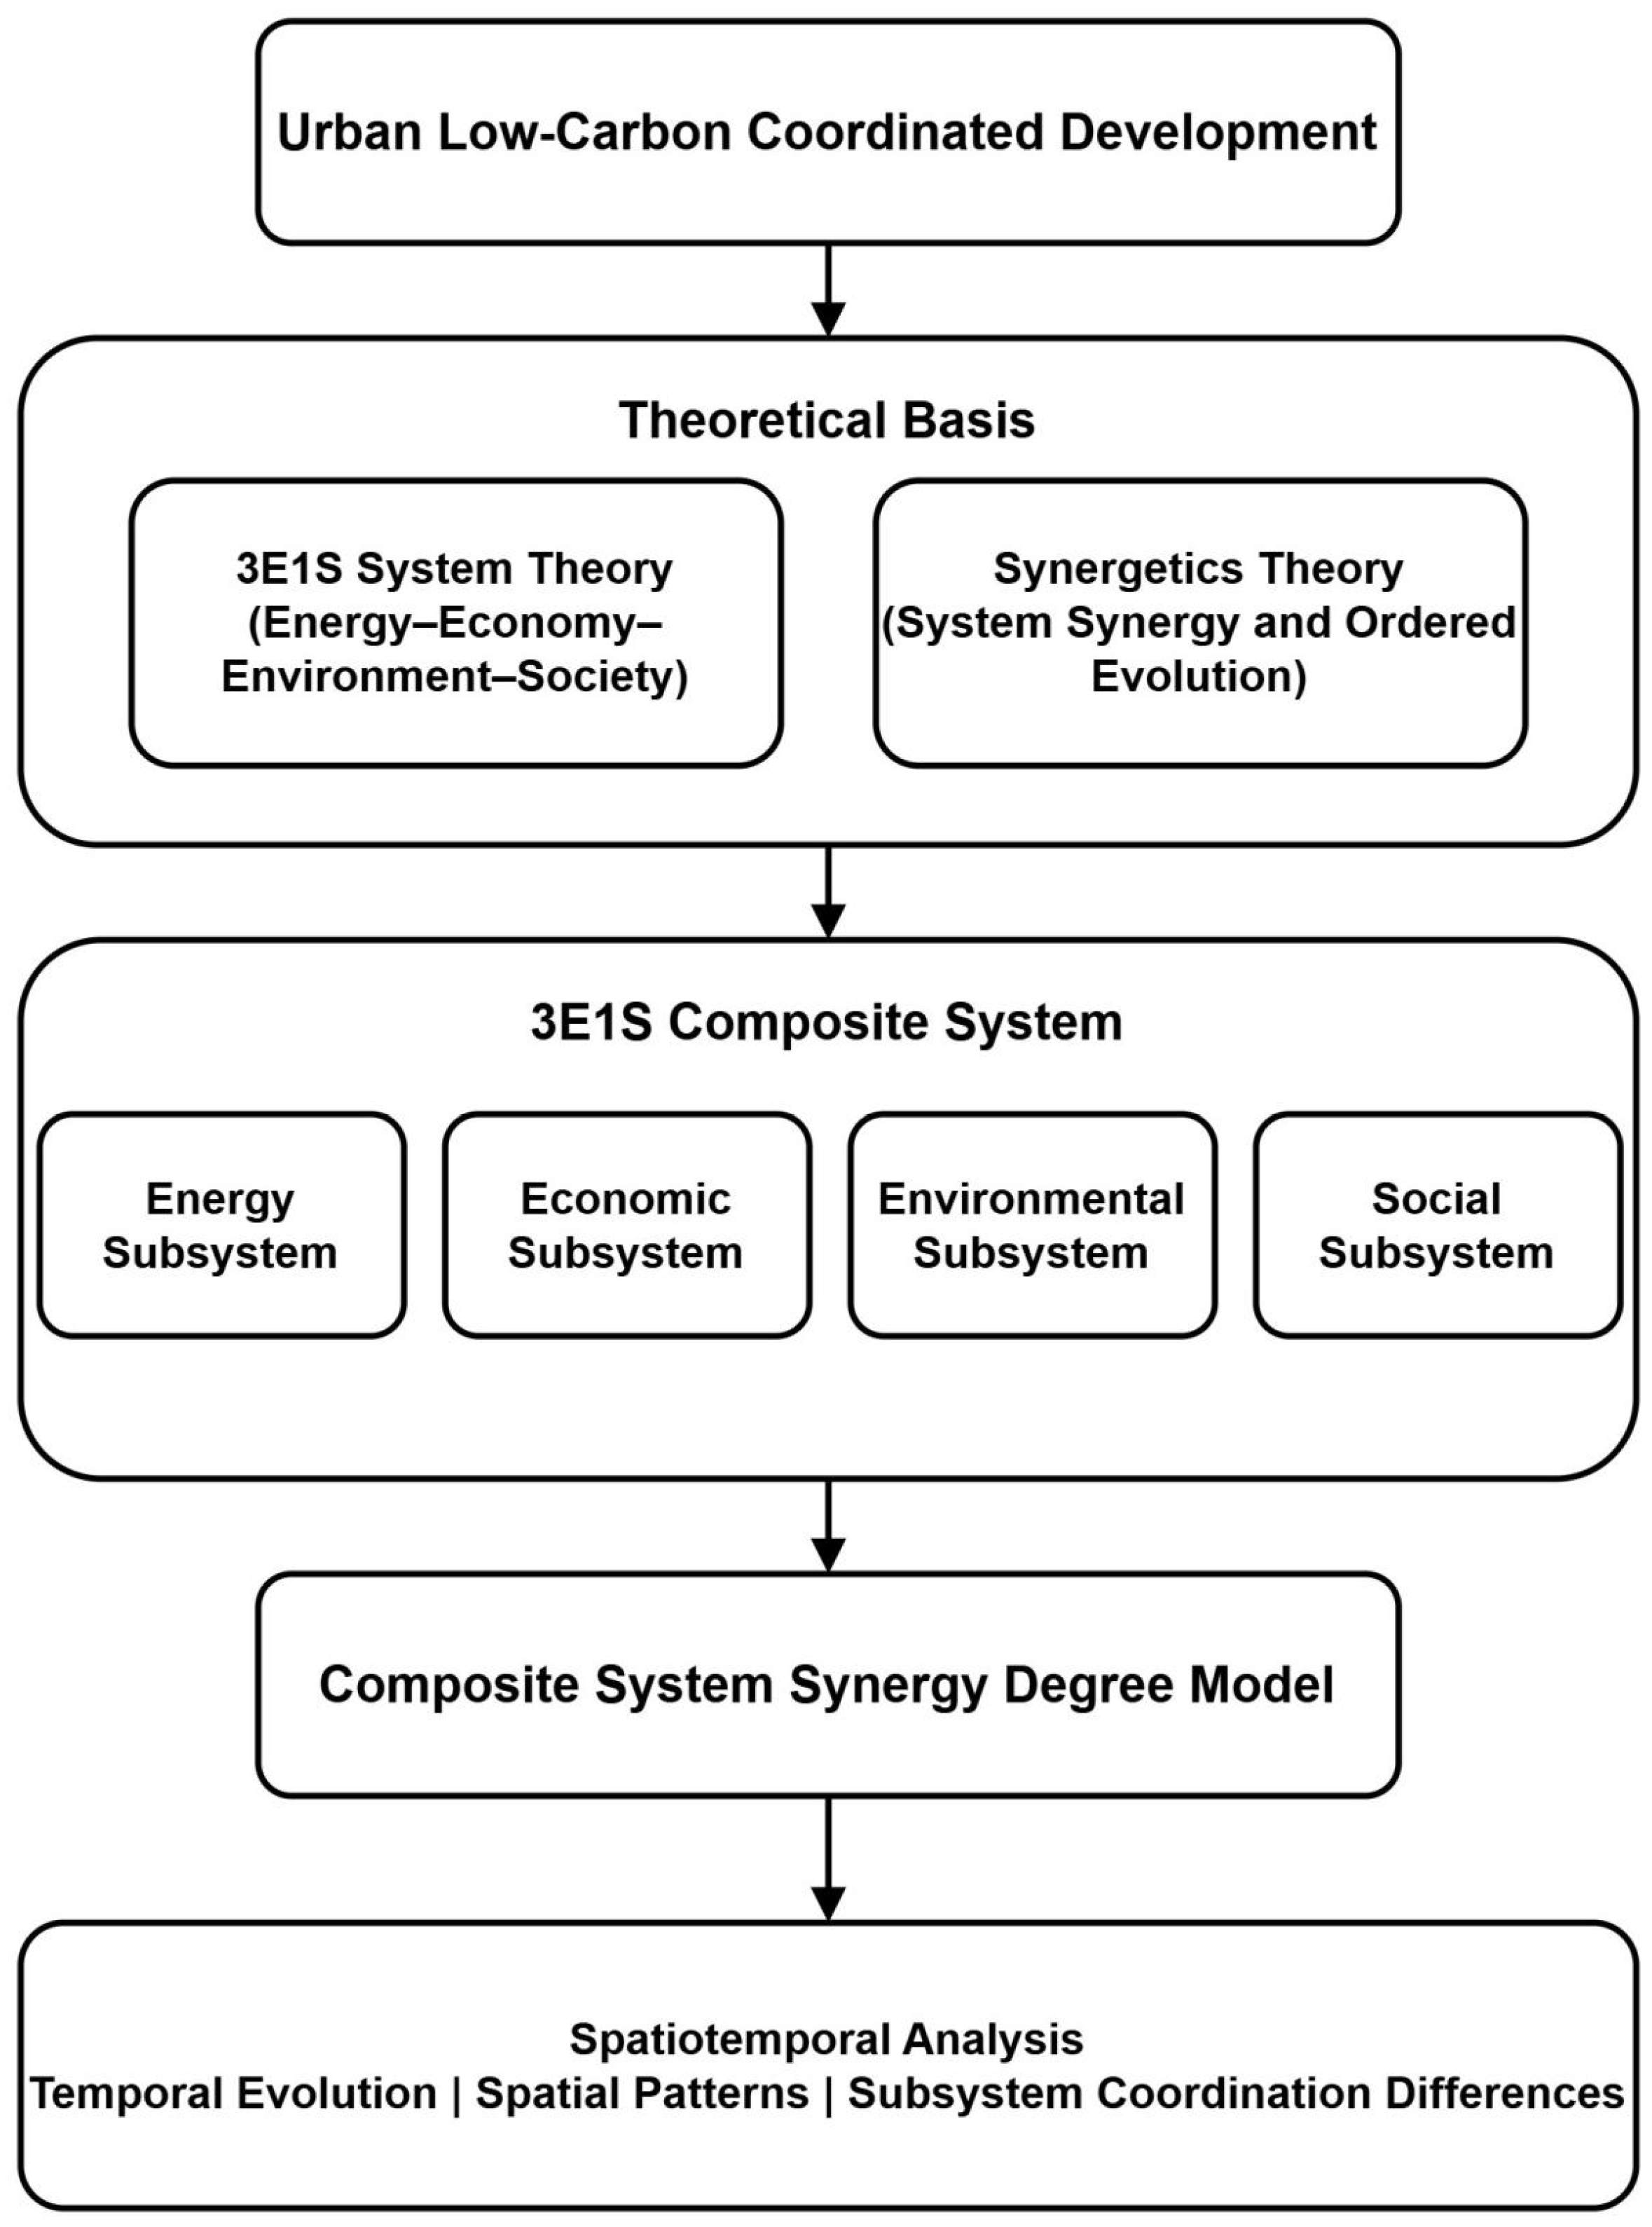
By integrating the 3E1S system theory with synergetics theory, this study constructs a systematic theoretical framework for analyzing the level and spatiotemporal evolution of LCCD in Chinese cities. Within this framework, the 3E1S system theory provides a multidimensional structural perspective, while synergetics theory underpins the identification and quantification of system synergy. In other words, the framework allows us to evaluate not only how each subsystem performs individually, but also how well the different subsystems evolve together toward a coordinated low-carbon development pathway. The overall theoretical analytical framework of this study is illustrated in Figure 1.

4. Research Design

4.1. Indicator Selection

When measuring the level of LCCD, the construction of an indicator system should not only account for data availability and scientific rigor, but also be capable of systematically characterizing the interactions among the energy, economic, environmental, and social subsystems and their synergistic evolution. Based on synergetics theory, low-carbon development is regarded as a complex evolutionary process in which multiple elements interact and gradually evolve toward an ordered state. Accordingly, indicator selection should facilitate the identification of key influencing factors in system evolution and reflect their structural roles in the process of LCCD.
Specifically, this study constructs the evaluation indicator system for LCCD from four dimensions:
(1) Energy dimension. The energy system is the core domain of the low-carbon transition, as its production and consumption patterns directly determine carbon emission levels. Indicators in this dimension are therefore mainly used to reflect adjustments in energy structure and improvements in energy utilization efficiency.
(2) Economic dimension. LCCD requires coordination between economic growth and carbon reduction constraints. Indicators in the economic dimension should not only capture economic vitality, but also reflect economic structural optimization and the quality of low-carbon transformation.
(3) Environmental dimension. Indicators in this dimension are used to measure the impacts of economic activities on the ecological environment, with a focus on carbon emission control levels and environmental governance performance, thereby characterizing the environmental effects of LCCD.
(4) Social dimension. The social system serves as an important carrier for the implementation and effectiveness of low-carbon policies. Indicators in this dimension mainly reflect the impacts of LCCD on public service provision and overall social development.
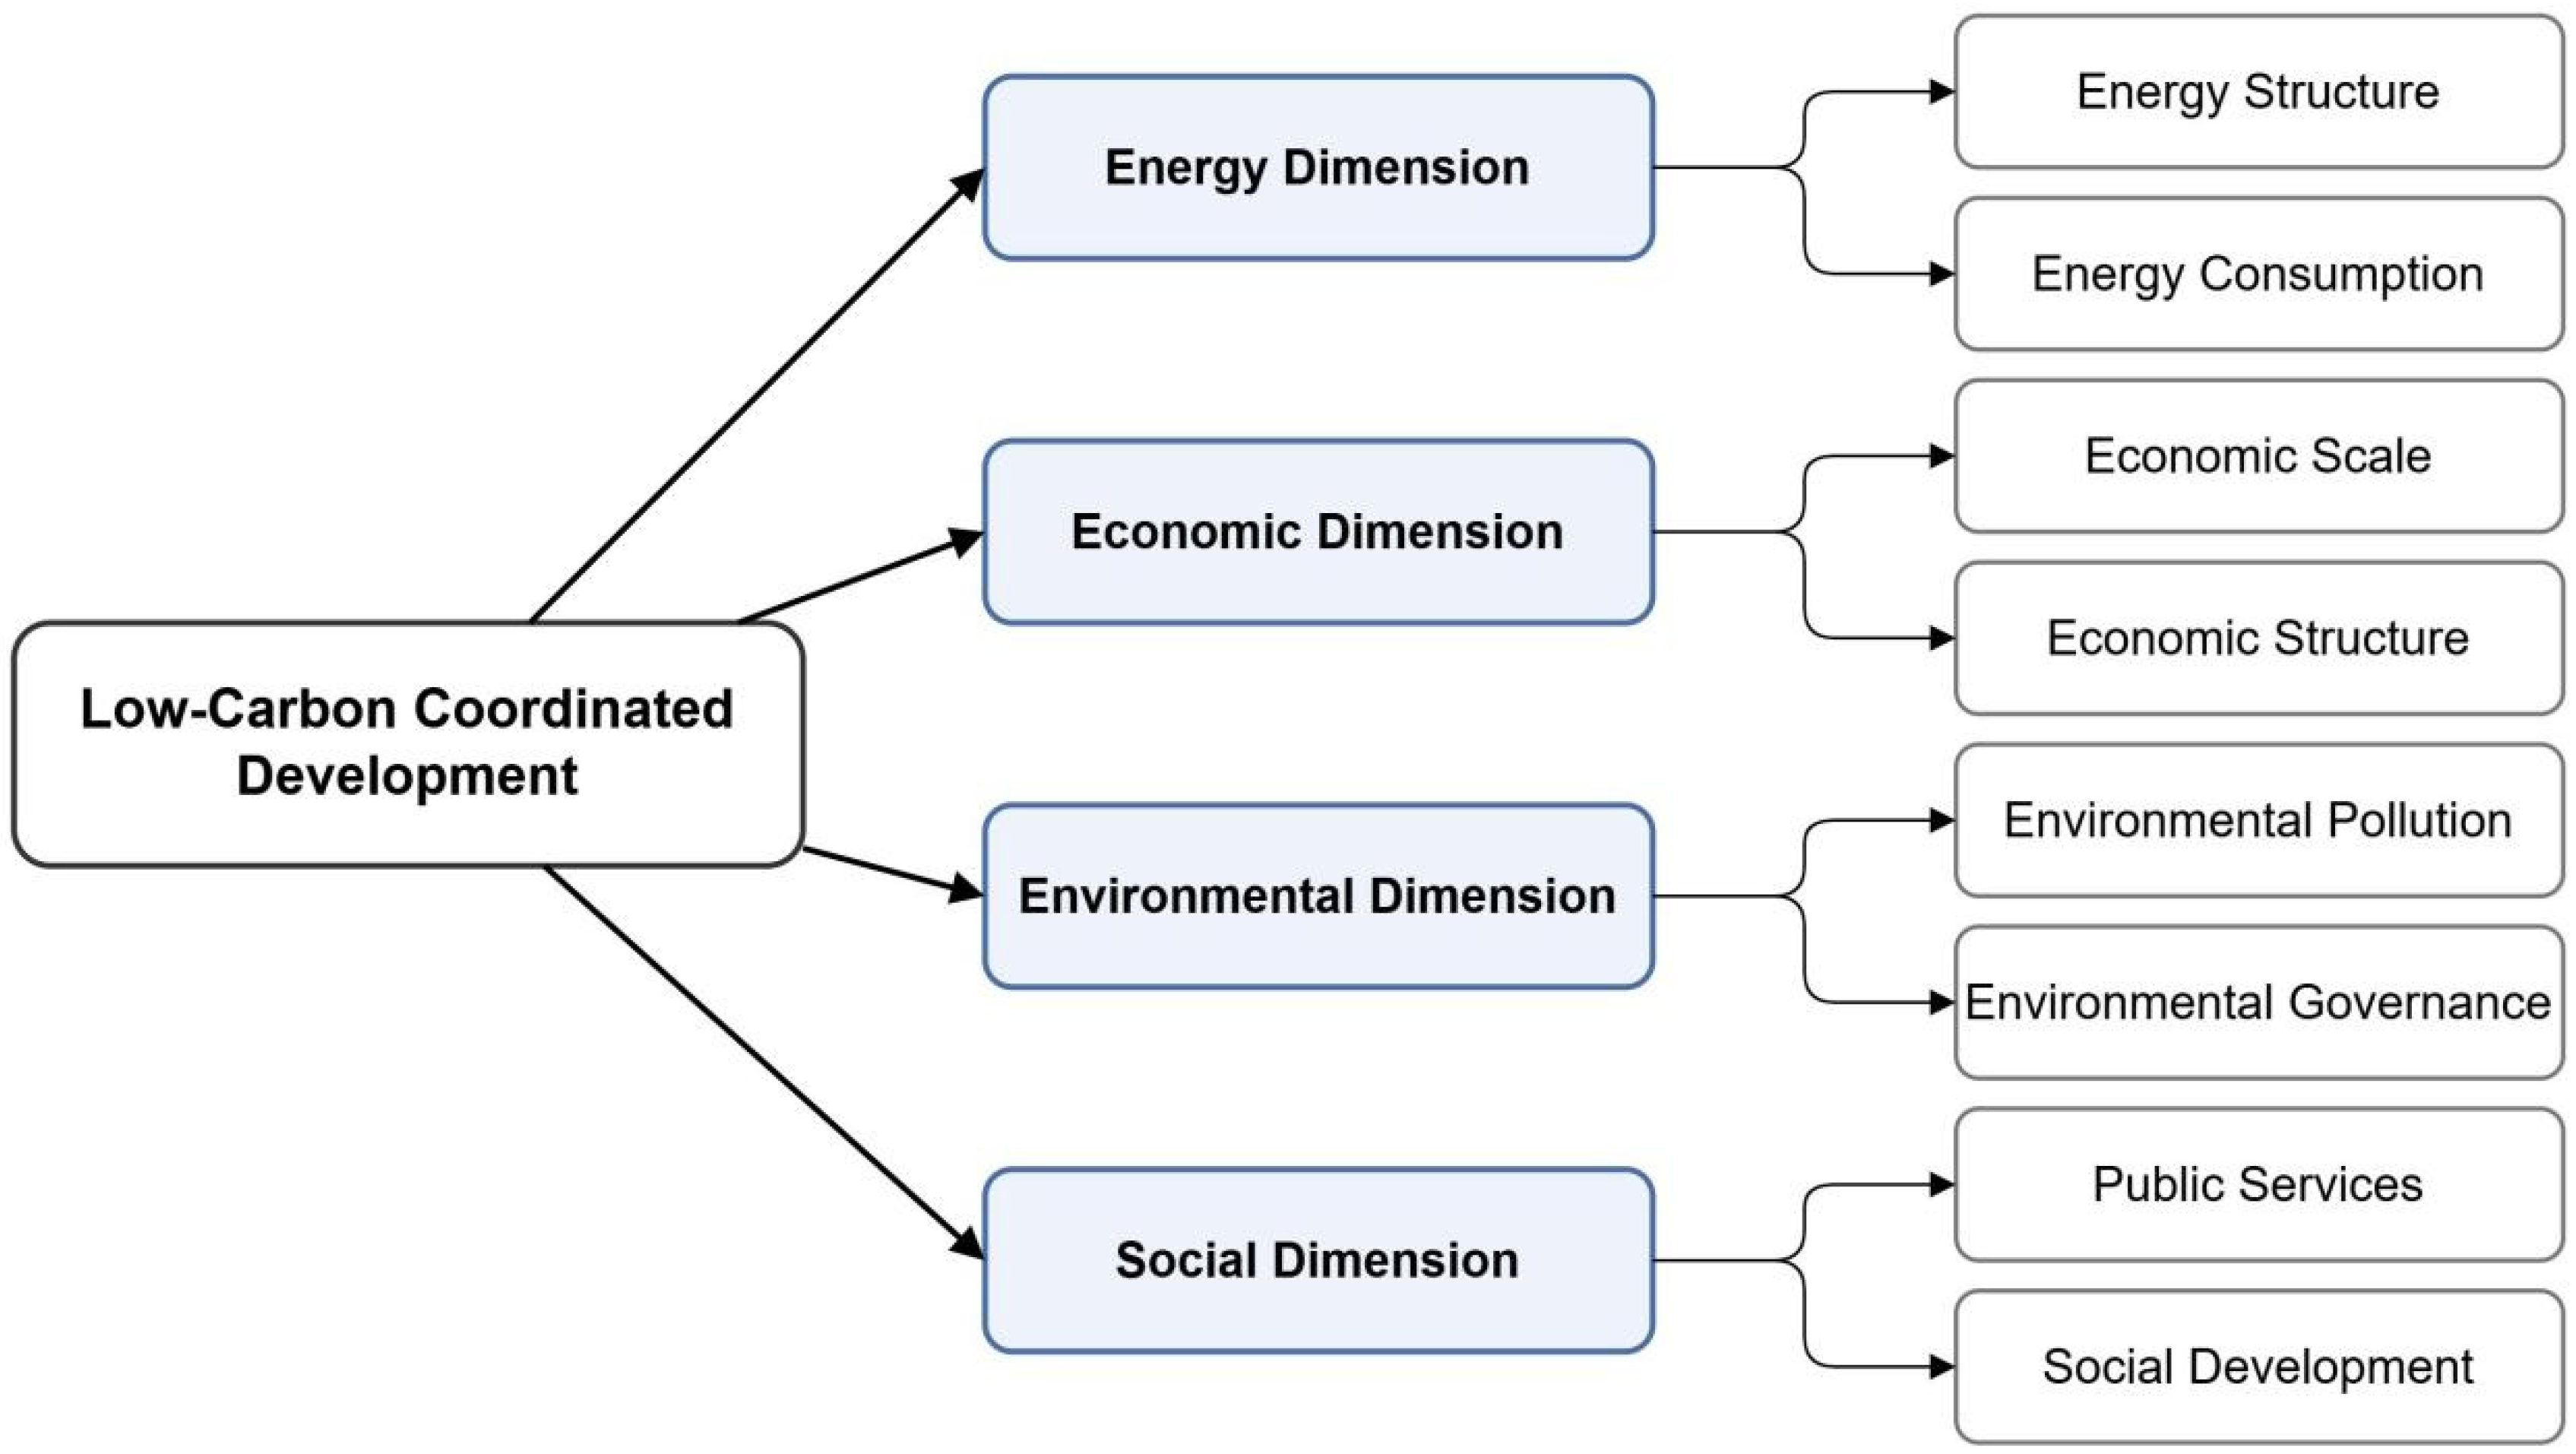
Taking into account indicator relevance, system integrity, and data availability, this study selects the energy, economic, environmental, and social dimensions as first-level indicators, which are further subdivided into eight second-level indicators: energy structure, energy consumption, economic scale, economic structure, environmental pollution, environmental governance, public services, and social development. On this basis, an evaluation indicator system for LCCD comprising 32 third-level indicators is constructed. The specific indicator composition is presented in Table 1.
By integrating the 3E1S system theory with synergetics theory, this study treats each city as an integrated system in the measurement of LCCD. The four first-level indicators—economy, energy, environment, and society—constitute the subsystems of the overall system; the second-level indicators serve as order parameters reflecting the synergistic evolution of the system; and the third-level indicators represent specific state variables. Based on these settings, an evaluation framework for LCCD is established, and its overall structure and logical relationships are illustrated in Figure 2.

4.2. Data Sources

This study employs balanced panel data for 271 prefecture-level and above cities in China, covering the period from 2005 to 2020. For a small number of indicators with missing values in certain years, interpolation methods are applied to ensure sample completeness and temporal continuity. Data on pollutant emissions—including carbon dioxide (CO2), sulfur dioxide (SO2), fine particulate matter (PM2.5), nitrogen oxides (NOx), and carbon monoxide (CO)—are obtained from the Multi-resolution Emission Inventory for China (MEIC), which provides gridded datasets of carbon and air pollutant emissions with a spatial resolution of 0.25° × 0.25°. These gridded data are spatially matched and aggregated based on municipal administrative boundaries to derive city-level emission indicators.
The urban innovation index is calculated following the indicator construction method proposed by Kou and Liu (2017) [56], using relevant city-level data. The green finance index is computed with reference to the framework developed by Liu and He (2021) [57] and calculated using the entropy method. The rural revitalization index is measured based on the indicator system proposed by Xu and Wang (2022) [58], also employing the entropy method. The marketization index is constructed according to the methodological approach proposed by Fan et al. (2021) [59], using statistical data at the prefecture-level city scale. Other socioeconomic, energy-related, and environmental indicators are mainly sourced from official statistical publications, including the Statistical Yearbook, China City Statistical Yearbook, and China Energy Statistical Yearbook.

4.3. Research Methods

4.3.1. Measurement Method for Low-Carbon Coordinated Development

The composite system synergy degree model is a commonly used empirical approach within synergetics theory. Its core idea is to measure the overall synergy level of a system by characterizing the changes in the order degree of different subsystems and integrating them accordingly. From a system evolution perspective, this model captures the interactive relationships among multiple subsystems and their synergistic evolutionary processes, making it well-suited for analyzing development issues with multidimensional structures and complex coupling characteristics.
Compared with methods such as the entropy method and TOPSIS, which mainly focus on composite ranking or relative efficiency evaluation, the composite system synergy degree model places greater emphasis on internal system structure and evolutionary trends. It is therefore more effective in revealing the dynamic process through which a system evolves from disorder to order. In addition, relative to the coupling coordination degree model, the composite system synergy degree model exhibits better interpretability in the context of multiple subsystems, as it can directly reflect how changes in the order degree of each subsystem contribute to the overall synergy level. This feature enables a clearer depiction of the intrinsic linkages among the energy, economic, environmental, and social subsystems. Given that low-carbon coordinated development is essentially a complex process characterized by the synergistic co-evolution of multiple subsystems, this study adopts the composite system synergy degree model to measure and analyze the level and evolutionary characteristics of LCCD in cities.
Let the energy, economic, environmental, and social subsystems be denoted as Sn, where Sn = {Sn1Sn2, …, Snt} represents the order parameter components (i.e., state variables or indicators) in the evolutionary process of subsystem Sn, with t ≥ 1. Let αnm and βnm denote the upper and lower bounds of the m-th order parameter component of subsystem Sn, respectively, such that βnm ≤ Snm ≤ αnm, m ∈ [1, t]. To avoid zero values in the calculation of order degrees caused by a zero numerator, the upper and lower bounds are typically obtained by multiplying the observed extreme values by a coefficient. Following Wu (2021) [60], the coefficients are set to 1.1 and 0.9, respectively. Finally, indicators are classified according to their directional attributes. Specifically, Sn1, Sn2, …, Sna are defined as positive indicators that are positively correlated with the subsystem order degree, whereas Sna+1, Sna+2, …, Snt are negative indicators that are negatively correlated with the subsystem order degree. Based on the directional properties of the indicators, the order degree of the m-th order parameter component of subsystem Sn is calculated using Equation (1).
μ n ( S n m ) = S n m β n m α n m β n m , m [ 1 , a ] , m [ 1 , b ] α n m S n m α n m β n m , m [ a + 1 , t ] , m [ b + 1 , t ]
As shown in Equation (1), the order degree of each order parameter component of a subsystem ranges from 0 to 1. A larger value of µn(Snm) indicates a greater contribution of the corresponding order parameter component to the order degree of the subsystem. Moreover, the overall synergy degree depends not only on the magnitude of individual order parameter components, but also on their combination patterns. Different combination patterns determine distinct system structures, which in turn dictate the integration rules. In general, two integration approaches are commonly used: the geometric mean method and the linear weighted summation method. This study adopts the geometric mean method to calculate the order degree of each subsystem. Let µn(Sn) denote the order degree of subsystem Sn; its calculation formula is given as follows:
μ n ( S n ) = m = 1 t μ n ( S n m ) t
As shown in Equation (2), the order degree of each subsystem also ranges from 0 to 1. A larger value of µn(Sn) indicates a greater contribution of the corresponding subsystem to the overall order of the composite system. Based on the subsystem order degrees obtained above, suppose that at the initial time t0, the order degree of subsystem Sn is µn0(Sn), and when the composite synergistic system evolves to time t1, the order degree of each subsystem becomes µn1(Sn). The composite system synergy degree is then calculated as follows:
C S S D = θ n = 1 n [ μ n 1 ( S n ) μ n 0 ( S n ) ] n
θ = min [ μ n 1 ( S n ) μ n 0 ( S n ) ] | min [ μ n 1 ( S n ) μ n 0 ( S n ) ] |
As indicated by Equations (3) and (4), CSSD represents the composite system synergy degree, with CSSD ∈ [−1,1], and larger values indicating a higher level of LCCD and smaller values indicating a lower level. The parameter θ is introduced to capture the direction of changes in subsystem order degrees. When the order degrees of the energy, economic, environmental, and social subsystems increase in the same direction, θ takes the value of 1, and the CSSD is fully amplified. Conversely, when the growth of one or more subsystems lags significantly or exhibits a decline, θ switches to −1, resulting in a substantial attenuation of the CSSD and indicating a state of system disharmony, denoted as CSSD ∈ [−1, 0]. This study adopts 2005 as the base year for measuring the level of urban LCCD. This choice is motivated by the fact that 2005 is widely used as a reference benchmark for China’s carbon intensity policies and low-carbon development assessments. For example, in 2009, China announced its commitment to reduce carbon dioxide emissions per unit of GDP by 40–45% by 2020 relative to 2005 levels, and this carbon intensity target was subsequently incorporated into the national system of economic and social development planning.

4.3.2. Spatiotemporal Characteristics and Evolutionary Analysis Methods

(1)
Standard Deviational Ellipse Method
The standard deviational ellipse (SDE), also known as directional distribution analysis, is a spatial analytical method used to examine the directional characteristics of spatial elements. It effectively captures the overall dominant orientation and the degree of dispersion of spatial elements along different directions. The area enclosed by an SDE contains approximately 68% of the total spatial elements. Its key parameters include the coordinates of the spatial mean center, the standard deviations of the major and minor axes, and the rotation angle. The specific calculation formulas are as follows:
S D E x = i = 1 n ( x i x 0 ) 2 n , S D E y = i = 1 n ( y i y 0 ) 2 n
where xi and yi denote the spatial coordinates of the observed samples, x0 and y0 represent the coordinates of the weighted mean center of the samples, and SDEx and SDEy indicate the coordinates of the ellipse center. Subsequently, taking due north as 0°, the rotation angle of the ellipse is defined as the clockwise angle from north to the major axis:
tan θ = A + B C
A = i = 1 n x ˜ i 2 i = 1 n y ˜ i 2
B = ( i = 1 n x ˜ i 2 i = 1 n y ˜ i 2 ) 2 + 4 ( i = 1 n x ˜ i 2 y ˜ i 2 ) 2
C = 2 i = 1 n x ˜ i y ˜ i
where x ˜ i and y ˜ i denote the deviations of xi and yi from the mean center coordinates, respectively. The standard deviations along the X-axis (major axis) and Y-axis (minor axis) are calculated as follows:
δ x = 2 i = 1 n ( x ˜ i cos θ y ˜ i sin θ ) 2 n
δ y = 2 i = 1 n ( x ˜ i sin θ + y ˜ i cos θ ) 2 n
where δ x and δ y denote the standard deviations along the X-axis and Y-axis, respectively.
(2)
Kernel Density Estimation Method
Kernel density estimation (KDE) is a nonparametric approach for estimating probability density functions based on sample data. It does not rely on specific distributional assumptions and is therefore capable of flexibly characterizing distributional shapes and their variations. Compared with parametric estimation methods, KDE exhibits clear advantages when handling data with potential skewness, multimodality, or nonlinear features, and has thus been widely applied in analyses of evolutionary characteristics in economic and social systems.
In this study, the KDE method is primarily employed to characterize the temporal evolution of the distributional features of subsystem order degrees and overall system synergy degree. Specifically, KDE is applied to the order degrees of the energy, economic, environmental, and social subsystems, as well as to the urban system synergy degree. Corresponding kernel density curves are then plotted to visually reveal the dynamic evolution of subsystem order degrees and the level of urban low-carbon coordinated development over the study period. The general expression of KDE is given as follows:
f ( x ) = 1 n h i = 1 n K x i x 0 h
where n denotes the number of sample observations, and h is the bandwidth parameter, which controls the degree of smoothness of the kernel density estimate. xi represents the i-th sample observation, and x0 denotes the mean of the sample observations. K(·) is the kernel function, which describes the contribution of each sample point to the probability density at the target location.
With respect to the choice of kernel function, this study adopts the Epanechnikov kernel. Compared with the Gaussian kernel, the Epanechnikov kernel is optimal in the sense of minimizing the mean integrated squared error and has a more concise functional form, which helps reduce computational complexity and improve estimation efficiency. Accordingly, the Epanechnikov kernel is employed to conduct KDE for the order parameters of the energy, economic, environmental, and social subsystems, as well as for the overall system order degree.
(3)
Moran’s I
Moran’s I is a commonly used indicator in spatial econometric analysis for testing spatial autocorrelation, and it is mainly applied to measure the degree of spatial dependence and clustering of a variable. This index reflects the similarity of attribute values among neighboring spatial units, thereby indicating whether a variable exhibits a statistically significant spatial correlation structure. Depending on the scale of analysis, Moran’s I can be classified into global Moran’s I and local Moran’s I. Global Moran’s I is used to characterize overall spatial autocorrelation, whereas local Moran’s I is designed to identify local spatial clustering patterns and spatial heterogeneity.
In this study, global Moran’s I is employed to examine the spatial autocorrelation of the order parameters of the energy, economic, environmental, and social subsystems, as well as the urban composite system synergy degree. The general expression of Moran’s I is given as follows:
I = n i = 1 n j = 1 n w i j ( x i x 0 ) ( x j x 0 ) S 2 i = 1 n j = 1 n w i j
where I denotes the global Moran’s I statistic, with a value range of I ∈ [−1, 1]. When I > 0, the variable exhibits positive spatial autocorrelation; when I < 0, it indicates negative spatial autocorrelation; and when I = 0, the variable is randomly distributed in space, implying no spatial dependence. Here, n represents the number of sample observations; xi and xj denote the observed values of the variable for spatial units i and j, respectively; and x0 is the mean of the sample observations. wij is the spatial weight matrix element that characterizes the spatial proximity between spatial units i and j, and S2 represents the sample variance.

5. Results and Analysis

5.1. Spatiotemporal Evolution and Distributional Dynamics of 3E1S Subsystem Order Degrees

5.1.1. Temporal Evolution and Distributional Dynamics of 3E1S Subsystem Order Degrees

(1)
Boxplot Analysis of the Order Degrees
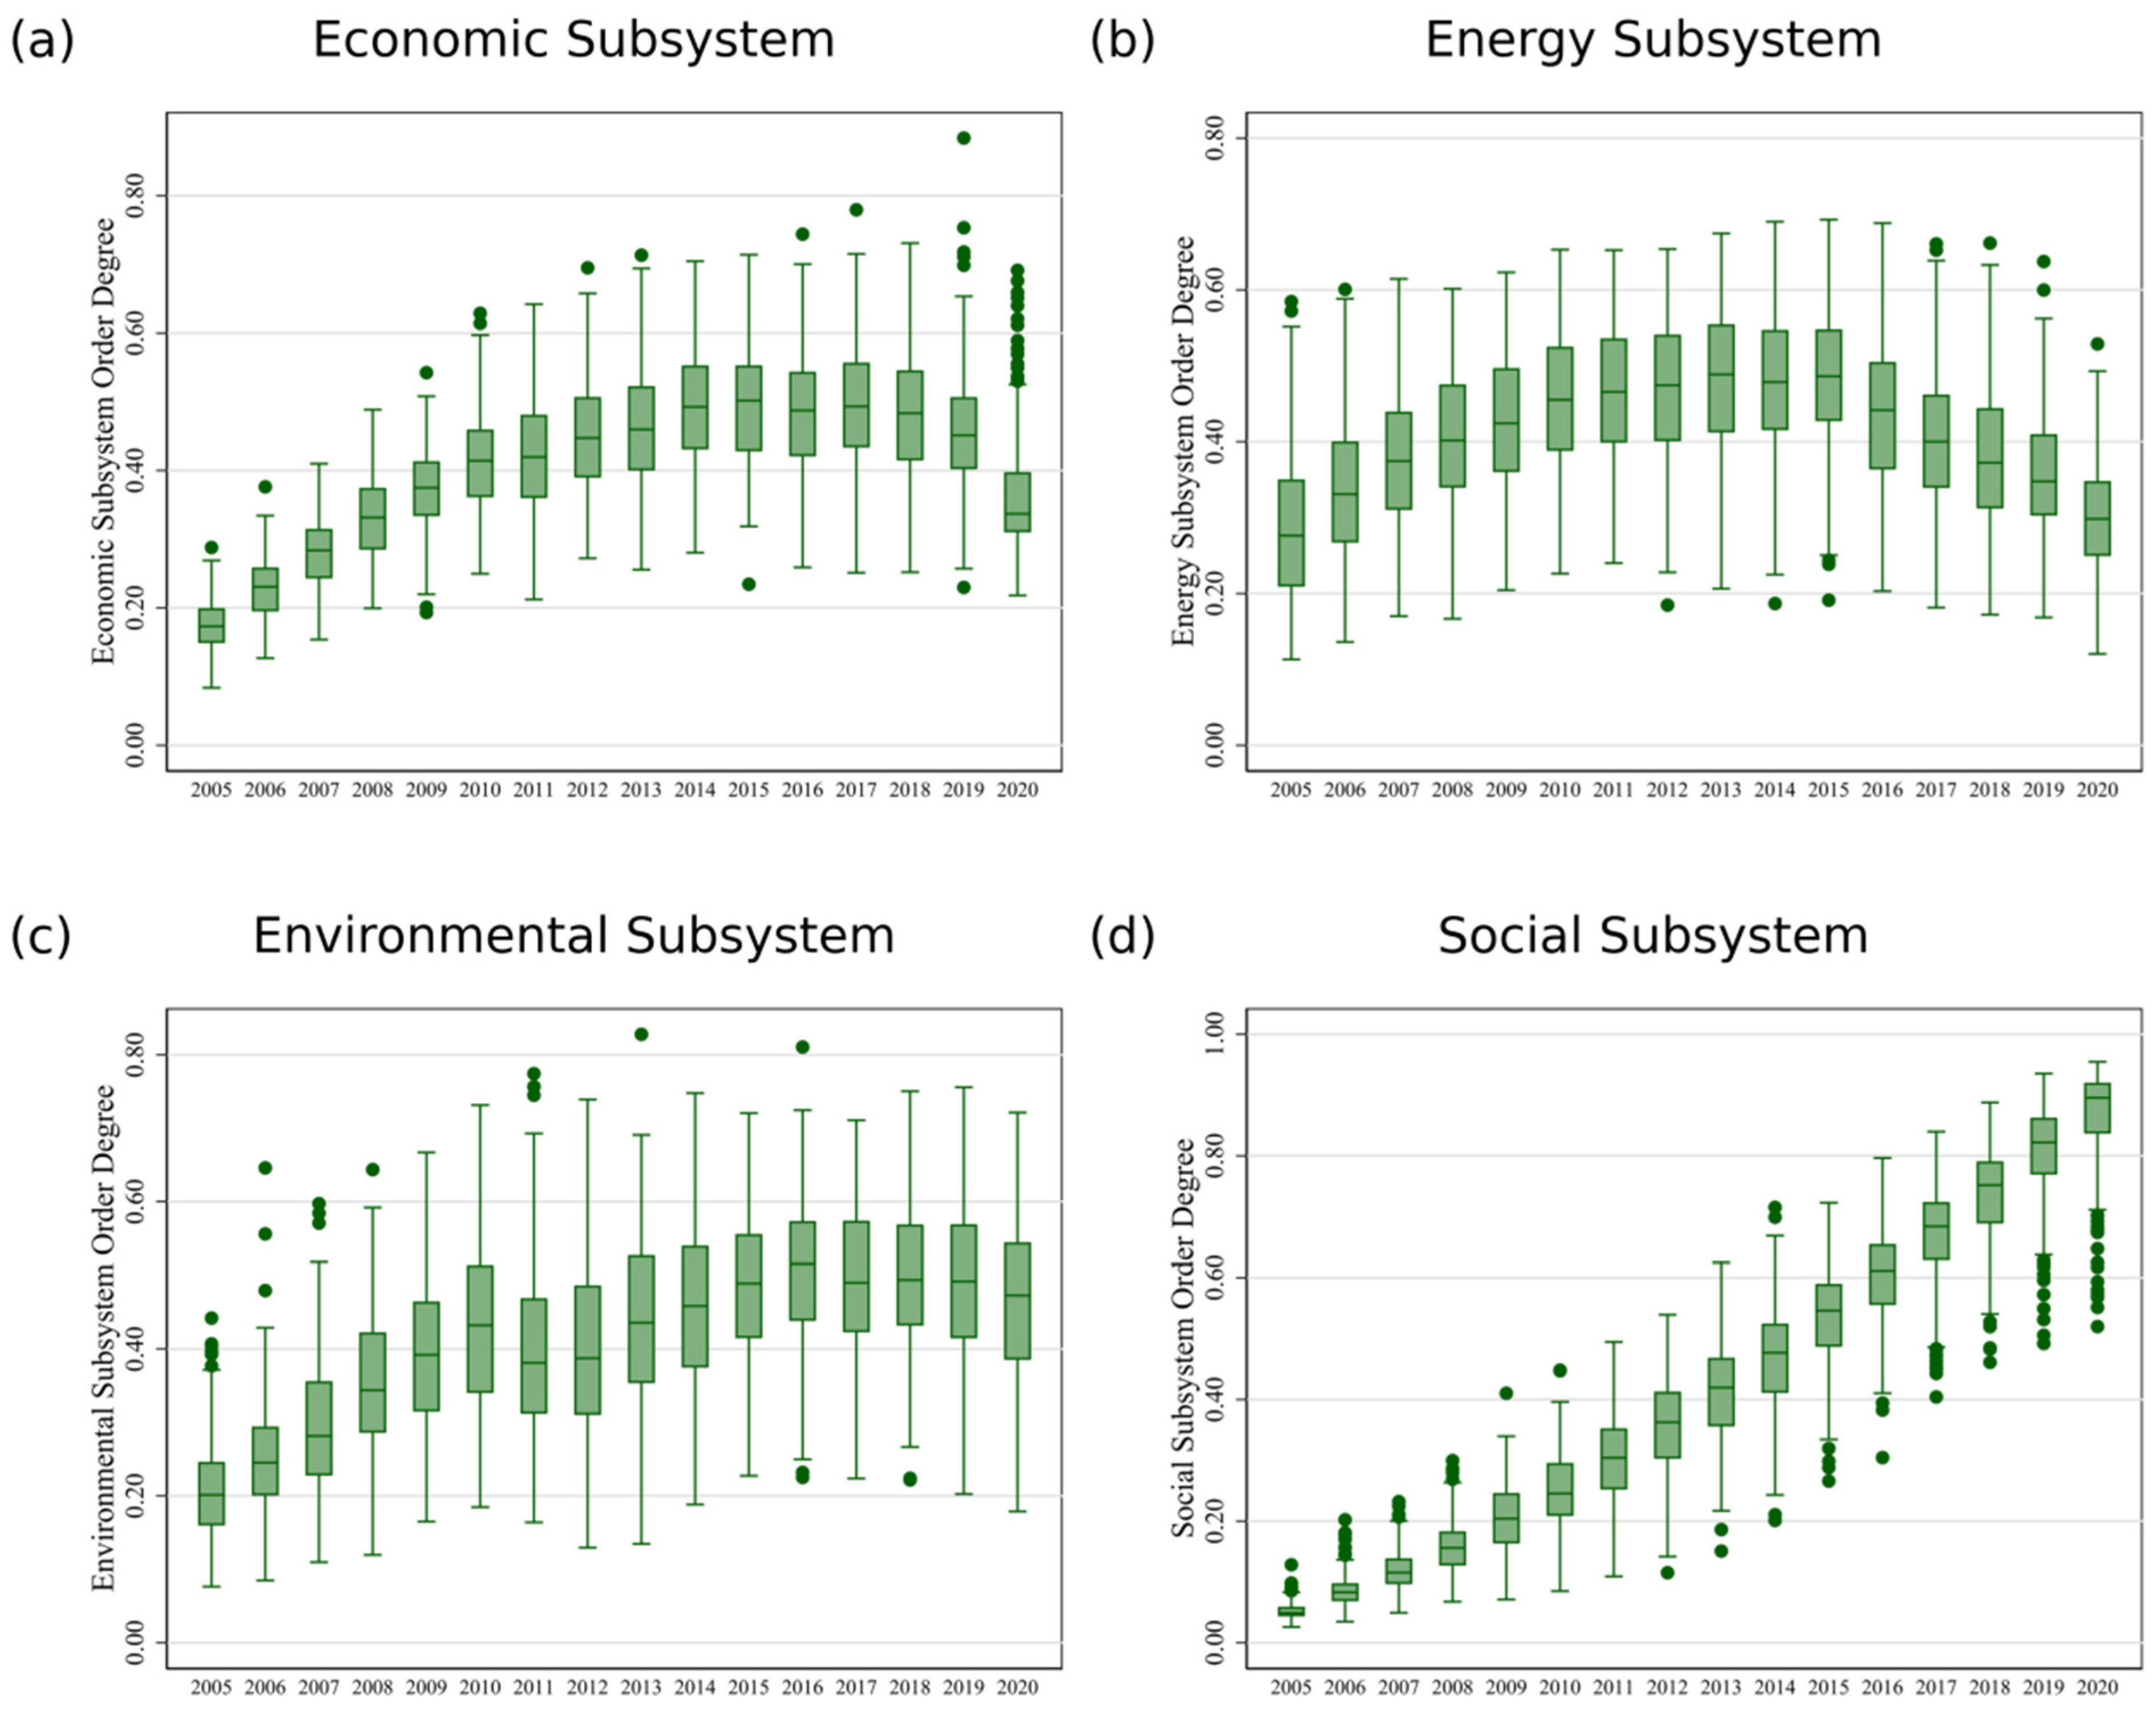
Figure 3a–d presents the annual boxplot distributions of the order degrees of the economic, energy, environmental, and social subsystems for 271 cities from 2005 to 2020. The boxplots depict the overall levels and intercity distributional differences of subsystem order degrees across years in terms of medians, interquartile ranges, extrema, and outliers. These patterns provide insight into how different dimensions of urban low-carbon development evolved across Chinese cities during the study period.
For the economic subsystem (Figure 3a), the median exhibits a clear rise–fall pattern over time. Specifically, the median increases steadily during 2005–2015 and then declines gradually during 2015–2020. The upward trend in the earlier period likely reflects rapid economic expansion, industrial upgrading, and urbanization in Chinese cities, which improved the overall performance of economic indicators associated with low-carbon development. The subsequent decline after 2015 may suggest that maintaining high economic subsystem performance became more challenging as cities entered a stage of structural economic adjustment and slower growth.
The dispersion of economic subsystem order degrees also changes across time. The box height expands continuously from 2005 to 2011, remains relatively stable during 2011–2018, and contracts in 2019 and 2020, indicating stage-specific variations in intercity differences. In addition, several high-value outliers appear above the upper quartile in 2019 and 2020, suggesting that a small group of economically advanced cities continued to maintain relatively strong economic performance compared with the broader urban system.
The energy subsystem (Figure 3b) shows a similar temporal pattern in its median, characterized by an initial increase followed by a decline. The median rises from 2005 to 2013 and then decreases gradually during 2013–2020. The early improvement likely reflects gains in energy efficiency and the expansion of energy infrastructure during a period of rapid economic development. The subsequent decline may indicate the increasing difficulty of further improving energy-system performance as cities face structural challenges associated with energy transition, including the gradual reduction of fossil-fuel dependence and the rising costs of energy transformation.
Meanwhile, the box height shrinks progressively after 2013, indicating a gradual convergence in the distribution of energy subsystem order degrees across cities. High-value outliers remain visible during 2017–2020, suggesting that a small number of cities advanced more rapidly in energy transition through technological progress or stronger policy implementation.
For the environmental subsystem (Figure 3c), the median demonstrates a fluctuating temporal pattern. It increases during 2005–2010, declines during 2010–2012, rises again during 2012–2016, and then decreases during 2016–2020. Such fluctuations may reflect the uneven implementation of environmental governance policies across regions as well as the time lag between environmental policy interventions and observable environmental improvements.
In terms of dispersion, the box height expands during 2005–2010 and contracts markedly during 2010–2016, reflecting stage-specific changes in intercity variation of environmental subsystem order degrees. These changes suggest that environmental governance outcomes varied across cities during different policy cycles, particularly during periods when national environmental regulations were strengthened. High-value outliers appear during 2005–2007, indicating that some cities achieved relatively high environmental subsystem performance in the early years.
The social subsystem (Figure 3d) exhibits a persistent upward shift in the median throughout the entire study period. From 2005 to 2020, the median increases steadily, with the boxplots gradually moving toward higher-value intervals. This continuous upward trend likely reflects gradual improvements in social development indicators such as public services, living standards, and social welfare conditions in Chinese cities.
The box height increases gradually during 2005–2014 and then slightly decreases during 2014–2020, suggesting moderate changes in intercity dispersion over time. High-value outliers appear during 2005–2008, while low-value outliers emerge during 2012–2020. These patterns indicate that although overall social conditions improved, disparities in social development among cities remained evident.
Overall, the four subsystems across the 271 cities exhibit clearly differentiated temporal evolution patterns during 2005–2020. The economic and energy subsystems both display inverted U-shaped trajectories, although their peak years differ. This pattern suggests that improvements in economic and energy-system performance may encounter structural constraints in later stages of development, particularly as cities transition toward more sustainable development pathways.
The environmental subsystem shows stage-specific fluctuations, which may reflect adjustments in environmental policy intensity and differences in policy implementation across regions. In contrast, the social subsystem demonstrates a relatively stable and continuous upward trend throughout the study period, indicating that improvements in social development have progressed more steadily than other dimensions of urban low-carbon transition.
From a distributional perspective, notable differences exist among subsystems in terms of dispersion and outlier patterns. The economic and energy subsystems exhibit relatively wide distributions in certain years and display several high-value outliers, indicating that some leading cities progressed more rapidly in economic restructuring and energy efficiency improvements than the overall urban system. The environmental subsystem shows clear stage-specific changes in dispersion. Meanwhile, the social subsystem gradually shifts from lower-value concentrations toward higher-value intervals while continuing to display outliers at both ends of the distribution. This pattern suggests that although social development improved overall, uneven development among cities remained a persistent feature of China’s urban system.
(2)
Kernel Density Estimation Analysis of the Order Degrees
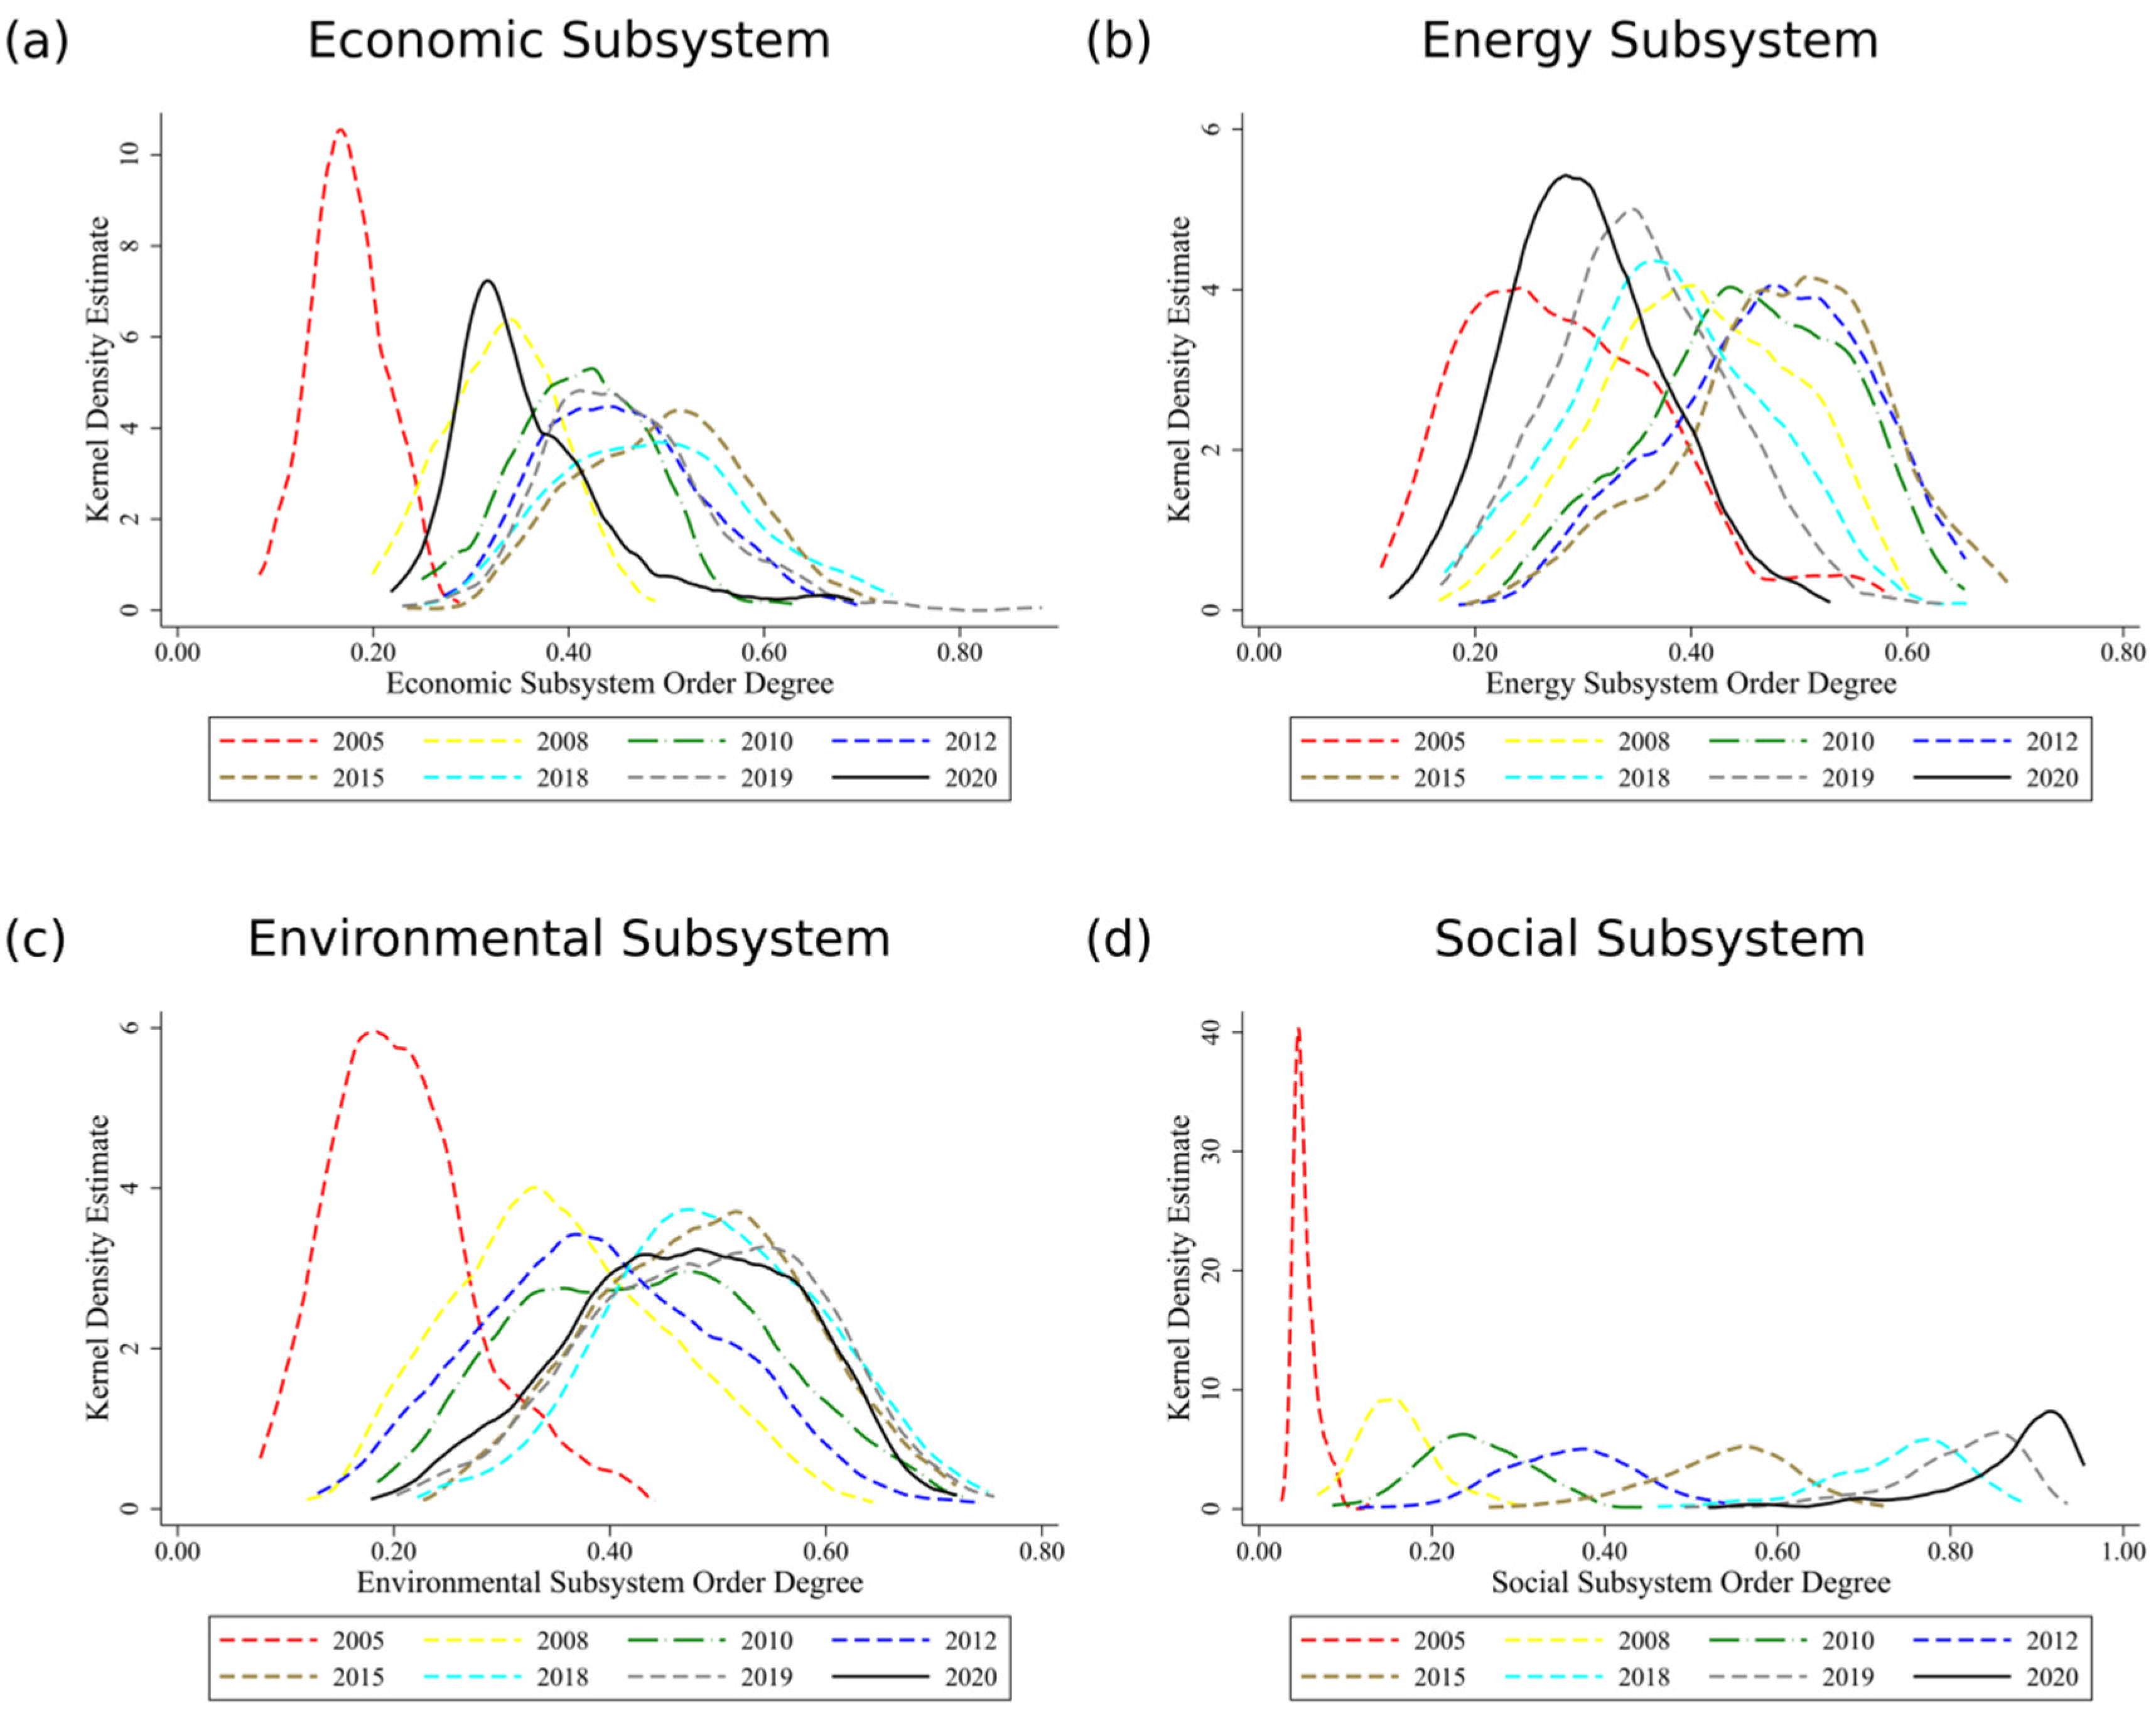
Figure 4a–d presents the KDE results for the order degrees of the economic, energy, environmental, and social subsystems across 271 cities in 2005, 2008, 2010, 2012, 2015, 2018, 2019, and 2020. The horizontal axis represents the subsystem order degree, while the vertical axis denotes the estimated kernel density. Different colors and line styles correspond to different years, illustrating the distributional forms of subsystem order degrees and their temporal evolution. In practical terms, the movements and shapes of these density curves help reveal how the development levels of different subsystems changed across cities and whether cities tended to converge or diverge in their low-carbon development trajectories.
As shown in Figure 4a, the kernel density curves of the economic subsystem order degree shift progressively to the right during 2005–2015, with the peak locations moving toward the medium-to-high order degree range. This rightward shift suggests that the overall economic performance related to low-carbon development improved in many cities during this period, likely reflecting rapid economic growth, industrial upgrading, and urban expansion. However, during 2017–2020, the curves shift back to the left, indicating a decline in the distributional center and exhibiting an overall inverted U-shaped temporal evolution. This reversal may indicate that maintaining strong economic performance within a low-carbon development framework became more challenging as cities entered a stage of economic restructuring and slower growth. Meanwhile, from 2005 to 2015, the peak heights gradually decrease and the distributional widths expand, with curve shapes transitioning from relatively steep to flatter profiles, reflecting increasing dispersion in the distribution of economic subsystem order degrees across cities. This widening distribution implies that cities differed increasingly in their economic development pathways, with some cities advancing more rapidly than others. In addition, the kernel density curves for 2019 and 2020 display pronounced right-tail features in the high-value range, suggesting changes in the proportion of cities with relatively high order degrees. This indicates that a small number of cities achieved particularly strong economic performance compared with the overall urban system.
Figure 4b shows that the kernel density curves of the energy subsystem order degree also shift rightward during 2005–2015, with steadily increasing peak positions, and then shift leftward during 2017–2020, forming a similar inverted U-shaped pattern. The initial rightward shift suggests that energy efficiency and energy-system performance improved in many cities during the earlier stages of development. In contrast, the later leftward movement may reflect the increasing difficulty of further improving energy-system performance as cities faced challenges related to energy transition, including reducing dependence on fossil fuels and adapting to more stringent energy policies. In terms of distributional shape, the kernel density curves for 2005, 2008, 2010, and 2015 exhibit relatively wide spreads, with some years displaying bimodal characteristics. These bimodal patterns may indicate that cities formed different development groups in terms of energy-system performance, with some cities progressing faster in energy transition than others. After 2015, the curves become progressively narrower and tend toward a unimodal distribution. This suggests that cities gradually became more similar in their energy-system development levels. In the early years, clear left-tail features are observed in the low-value range, whereas after 2015 these left tails largely disappear, indicating a more concentrated distribution.
As illustrated in Figure 4c, the kernel density curves of the environmental subsystem order degree move rightward overall during 2005–2015, with gradually increasing peak positions. This shift indicates that environmental conditions and environmental governance performance improved in many cities during the earlier years of the study period. During 2015–2020, the positional changes of the curves are relatively limited, and the distributional center remains largely stable. This stability suggests that improvements in environmental performance became more gradual during the later stages of the study period. Compared with 2005 and 2008, the peak heights in subsequent years decline and the distributional widths expand markedly, with curves evolving from steep to flatter shapes, indicating an expansion in the distributional range of order degrees. Such widening distributions suggest that cities experienced different environmental governance outcomes, reflecting variations in policy implementation capacity and environmental management practices. At the same time, the kernel density curves for 2015–2020 exhibit left-tail features in the low-value range, reflecting changes at the lower end of the distribution. These low-value tails indicate that some cities continued to face substantial environmental challenges despite overall improvements.
Figure 4d indicates that the kernel density curves of the social subsystem order degree exhibit a persistent rightward shift throughout 2005–2020, with peak positions moving steadily toward higher-order degree ranges. This continuous rightward movement suggests that social development conditions—such as public services, living standards, and social welfare—improved steadily in most cities during the study period. During 2005–2010, peak heights decreased and distributional widths increased, with curves transitioning from concentrated to relatively flattened shapes. This change implies that differences in social development across cities initially widened as some cities improved more rapidly than others. Between 2010 and 2020, the kernel density curves display more pronounced left-tail features in the low-value range, and distributional forms continue to vary across years. These low-value tails indicate that although overall social development improved, some cities still lagged behind in social conditions.
Overall, the kernel density distributions of the four subsystems display markedly differentiated evolutionary patterns over 2005–2020. The economic and energy subsystems both exhibit an initial rightward shift followed by a leftward return, with their distributional centers tracing inverted U-shaped trajectories over time, although differences exist in the magnitude of peak shifts and distributional adjustments. This pattern suggests that improvements in economic and energy-system performance were relatively strong in the earlier stages of development but became more constrained in later years as cities faced structural and transition-related challenges. The environmental subsystem shows a clear rightward shift in the early period, followed by relative stability in later years, with changes mainly reflected in distributional width and tail behavior. This indicates that environmental governance improved overall but remained uneven across cities. By contrast, the social subsystem demonstrates the most pronounced and continuous rightward shift in its distributional center, accompanied by widening distributions and evolving low-value tail characteristics. This reflects relatively steady progress in social development conditions, although disparities among cities persisted.
From a distributional perspective, notable differences are observed among subsystems in terms of peak height, spread, and tail behavior. The economic and environmental subsystems exhibit distributional widening and heavier tails in certain periods; the energy subsystem evolves from early-stage multimodal or skewed distributions toward more concentrated unimodal patterns; and the social subsystem maintains a relatively wide distribution while shifting overall toward higher values. Taken together, these patterns suggest that cities followed different development trajectories across subsystems, with varying capacities to improve economic performance, energy efficiency, environmental governance, and social conditions during the low-carbon transition process.

5.1.2. Spatiotemporal Evolution and Spatial Structural Characteristics of 3E1S Subsystem Order Degrees

(1)
Spatiotemporal Map Evolution Results and Analysis of the Order Degrees
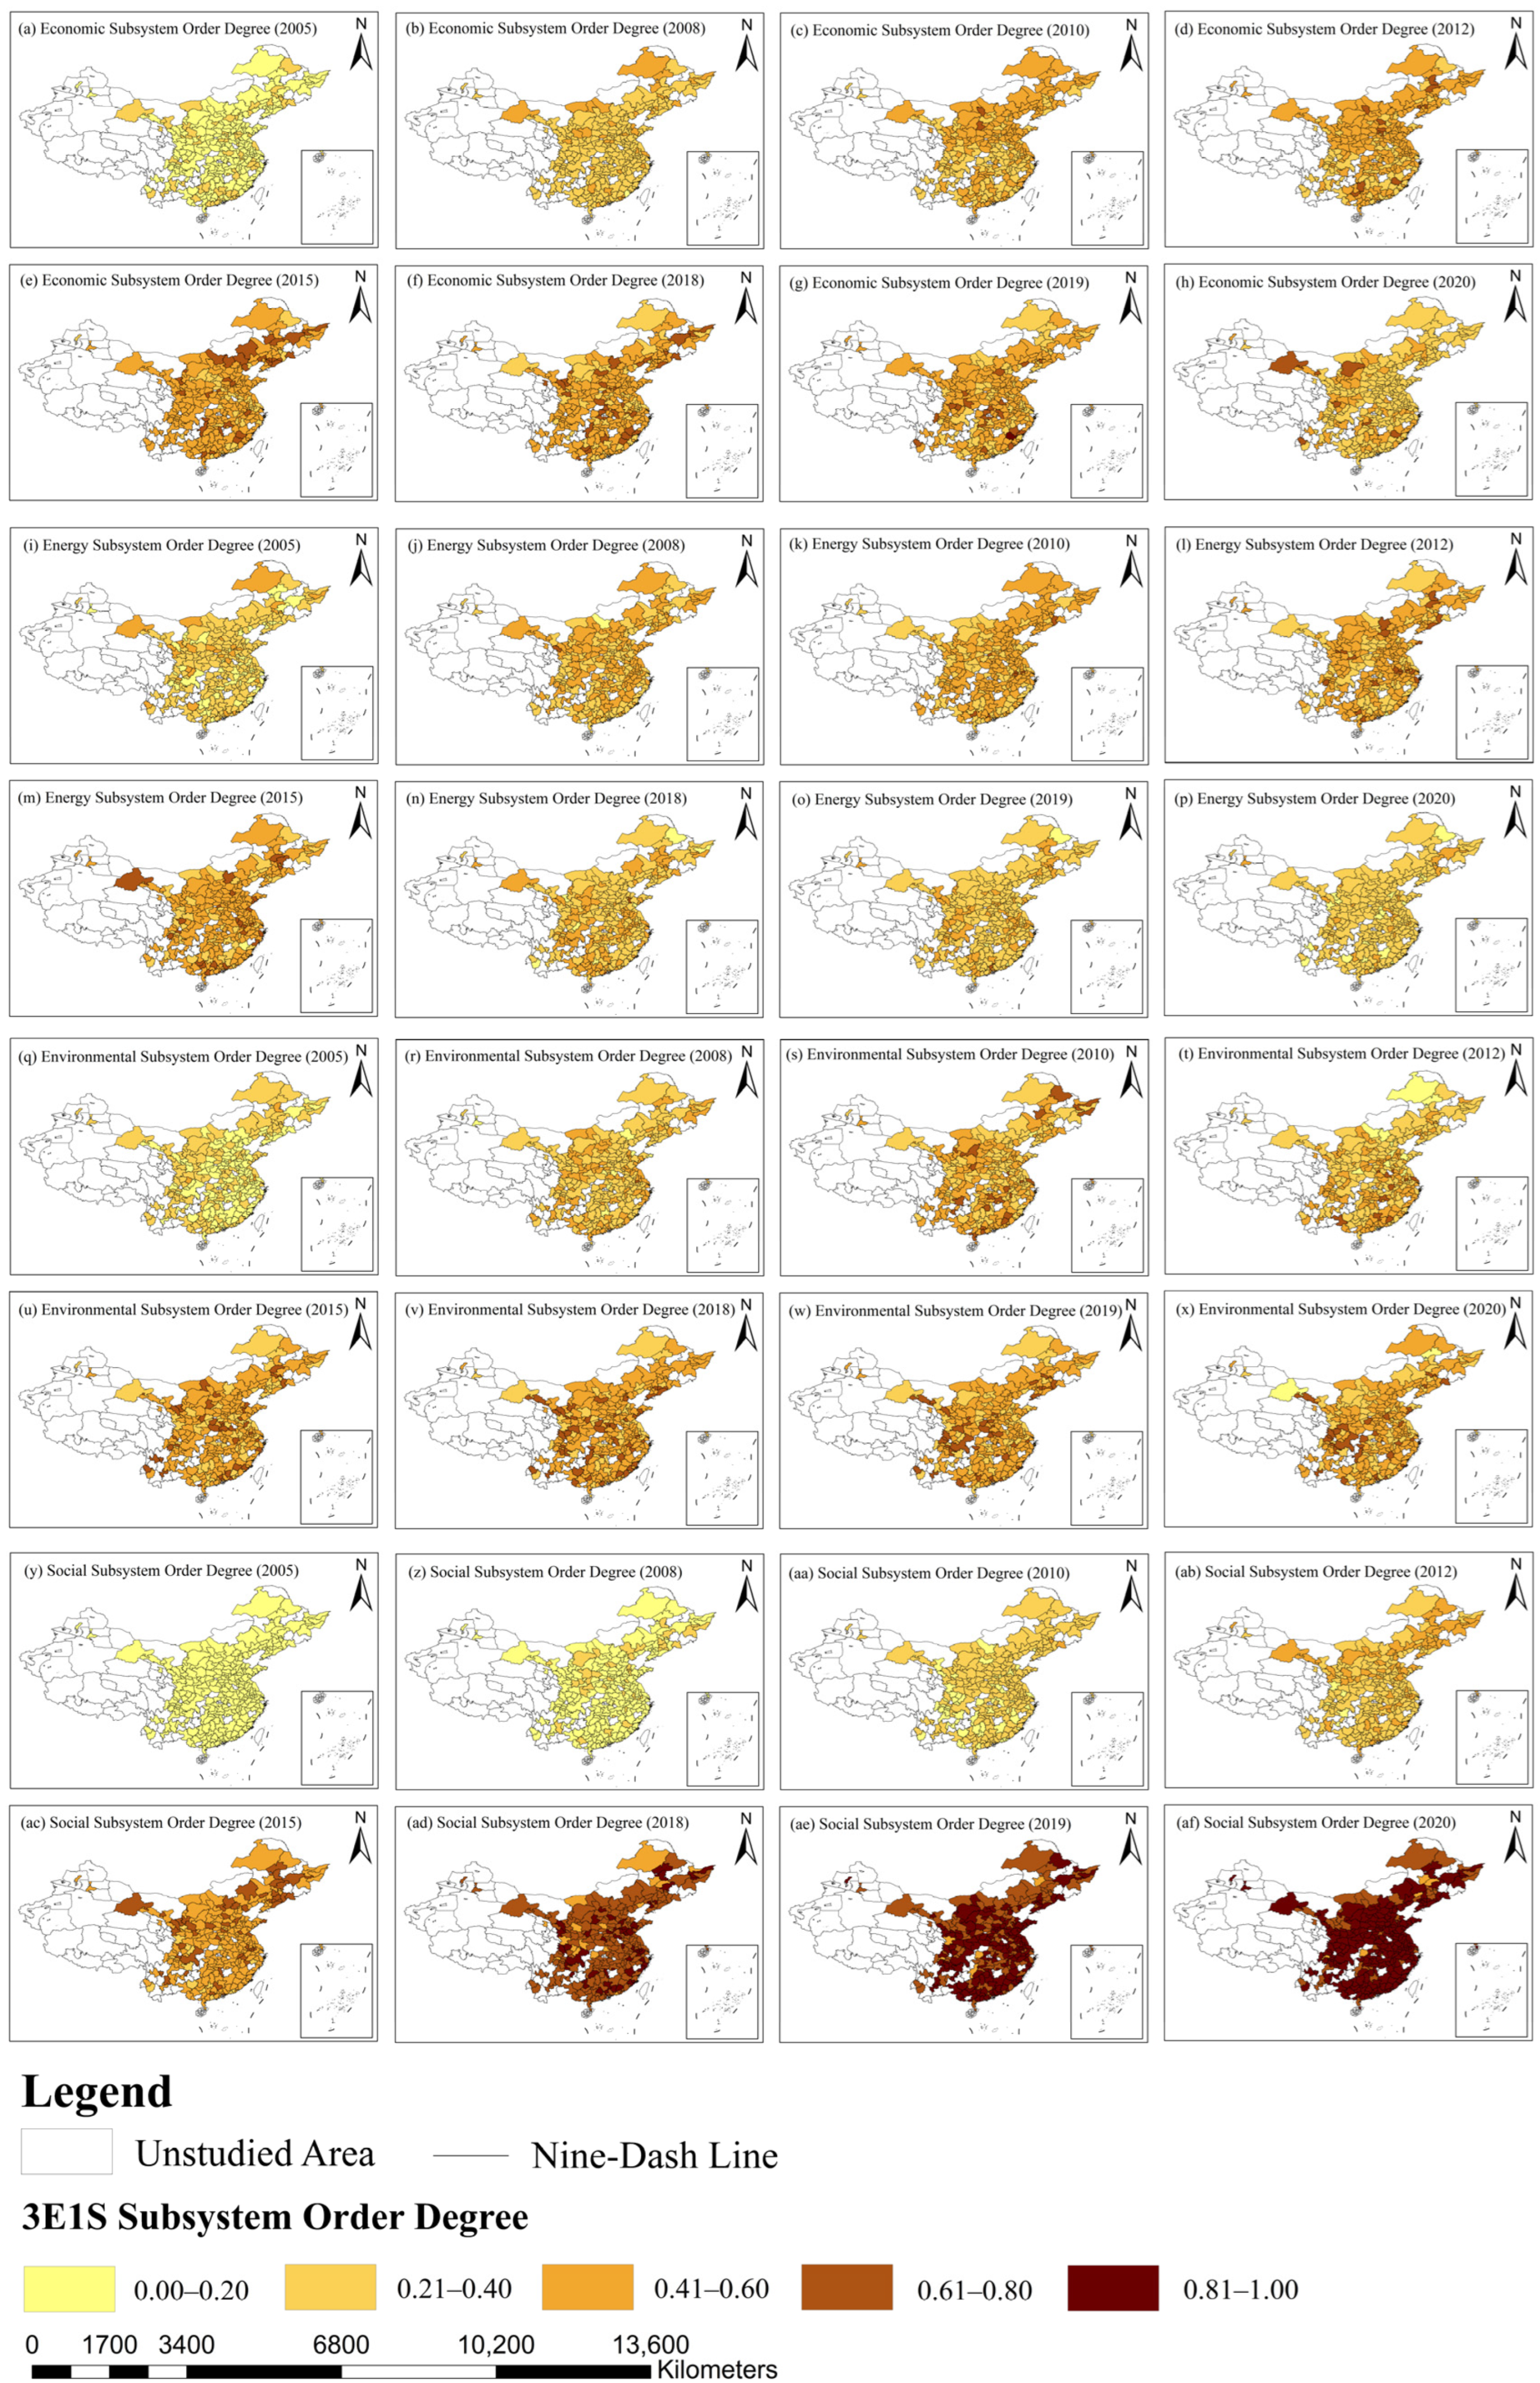
Figure 5a–af illustrates the spatial distribution patterns of the order degrees of the economic, energy, environmental, and social subsystems across 271 cities in 2005, 2008, 2010, 2012, 2015, 2018, 2019, and 2020. A graded color scheme is adopted to represent subsystem order degree levels, where 0.00–0.20, 0.21–0.40, 0.41–0.60, 0.61–0.80, and 0.81–1.00 correspond to increasing levels from low to high order. These spatial patterns can be interpreted in terms of differences in urban development performance reflected by key indicators such as economic scale and industrial structure, energy structure and energy consumption efficiency, environmental pollution and governance capacity, and the level of public service provision and social development.
From the perspective of the economic subsystem (Figure 5a–h), in 2005, most cities were concentrated in the 0.00–0.20 and 0.21–0.40 intervals, indicating predominantly low and medium–low order levels with relatively dispersed spatial distribution. This pattern reflects relatively limited economic scale and less optimized economic structures in many cities during the early stage of the study period. Over time, the number of cities in the 0.41–0.60 interval gradually increased, expanding spatially from localized clusters to broader areas. This improvement indicates gradual expansion of urban economic scale and adjustments in economic structure in many regions. Around 2015, some cities entered the 0.61–0.80 interval, and the number of high-order cities increased noticeably. Cities reaching these higher levels generally correspond to regions with stronger economic foundations and more advanced industrial structures. During 2018–2020, the order levels of certain regions declined to the 0.41–0.60 interval; however, the overall distribution remained dominated by medium and above-medium order levels.
The energy subsystem (Figure 5i–p) also exhibits stage-specific spatial evolution during the study period. In 2005, energy subsystem order degrees were mainly concentrated in the 0.00–0.20 and 0.21–0.40 intervals, with a relatively high proportion of low-level cities. This suggests that many cities still had relatively energy-intensive development patterns and less optimized energy structures in the early years. In subsequent years, the number of cities within the 0.41–0.60 interval increased gradually, forming relatively continuous spatial distributions. This upward trend indicates gradual improvements in energy consumption efficiency and adjustments in energy structure across many cities. Around 2015, some cities entered the 0.61–0.80 interval, and the overall order level of the energy subsystem reached a relatively high stage. Cities in these higher intervals generally correspond to areas where energy consumption efficiency has improved and energy structures have been gradually optimized. After 2018, the number of cities in the 0.61–0.80 interval declined somewhat, with more cities distributed in the 0.41–0.60 interval, resulting in a more balanced spatial pattern.
The spatial distribution characteristics of the environmental subsystem are presented in Figure 5q–x. In 2005, environmental subsystem order degrees were generally low, with most cities concentrated in the 0.00–0.20 and 0.21–0.40 intervals. These lower levels reflect relatively high environmental pollution and limited environmental governance capacity in many cities during the early stage of rapid industrial development. During 2008–2015, the number of cities in the 0.41–0.60 interval increased significantly, and some cities entered the 0.61–0.80 interval. This improvement indicates gradual progress in pollution control and environmental governance across many urban areas. Spatially, the pattern evolved from scattered distributions to more contiguous clusters. During 2018–2020, the majority of cities maintained order degrees at or above the 0.41–0.60 interval, although noticeable interregional disparities in order levels persisted. These differences suggest that cities vary substantially in their capacity for environmental governance and pollution management.
The social subsystem (Figure 5y–af) exhibits the most pronounced spatial evolution. In 2005, social subsystem order degrees were mainly concentrated in the 0.00–0.20 interval, indicating an overall low level. This suggests that the provision of public services and the overall level of social development were relatively limited in many cities at the beginning of the study period. In subsequent years, subsystem order levels increased steadily, with the numbers of cities in the 0.21–0.40 and 0.41–0.60 intervals rising year by year. This improvement reflects gradual expansion of public service systems and steady progress in social development across cities. After 2015, a large number of cities entered the 0.61–0.80 interval, and some further advanced to the 0.81–1.00 interval. Cities reaching these higher levels generally correspond to regions with stronger public service capacity and higher levels of social development. By 2018–2020, high-level cities displayed relatively continuous spatial distributions, and the overall order level of the social subsystem improved significantly.
In summary, all four subsystems exhibit clear spatial differentiation across years, yet their order-level distributions and evolutionary trajectories differ substantially. The economic and energy subsystems mainly fluctuate within the medium order interval (0.41–0.60) and adjacent levels. These patterns indicate gradual adjustments in economic scale, economic structure, energy consumption, and energy structure across cities. The environmental subsystem gradually converges toward medium-to-high order intervals, reflecting overall improvements in environmental pollution control and governance capacity. Meanwhile, the social subsystem enters high-order intervals (0.61–1.00) on a large scale in the later period, showing the most pronounced spatial transformation. This reflects significant improvements in public services and broader social development across many cities during the study period.
(2)
Standard Deviational Ellipse Results and Analysis of the Order Degrees
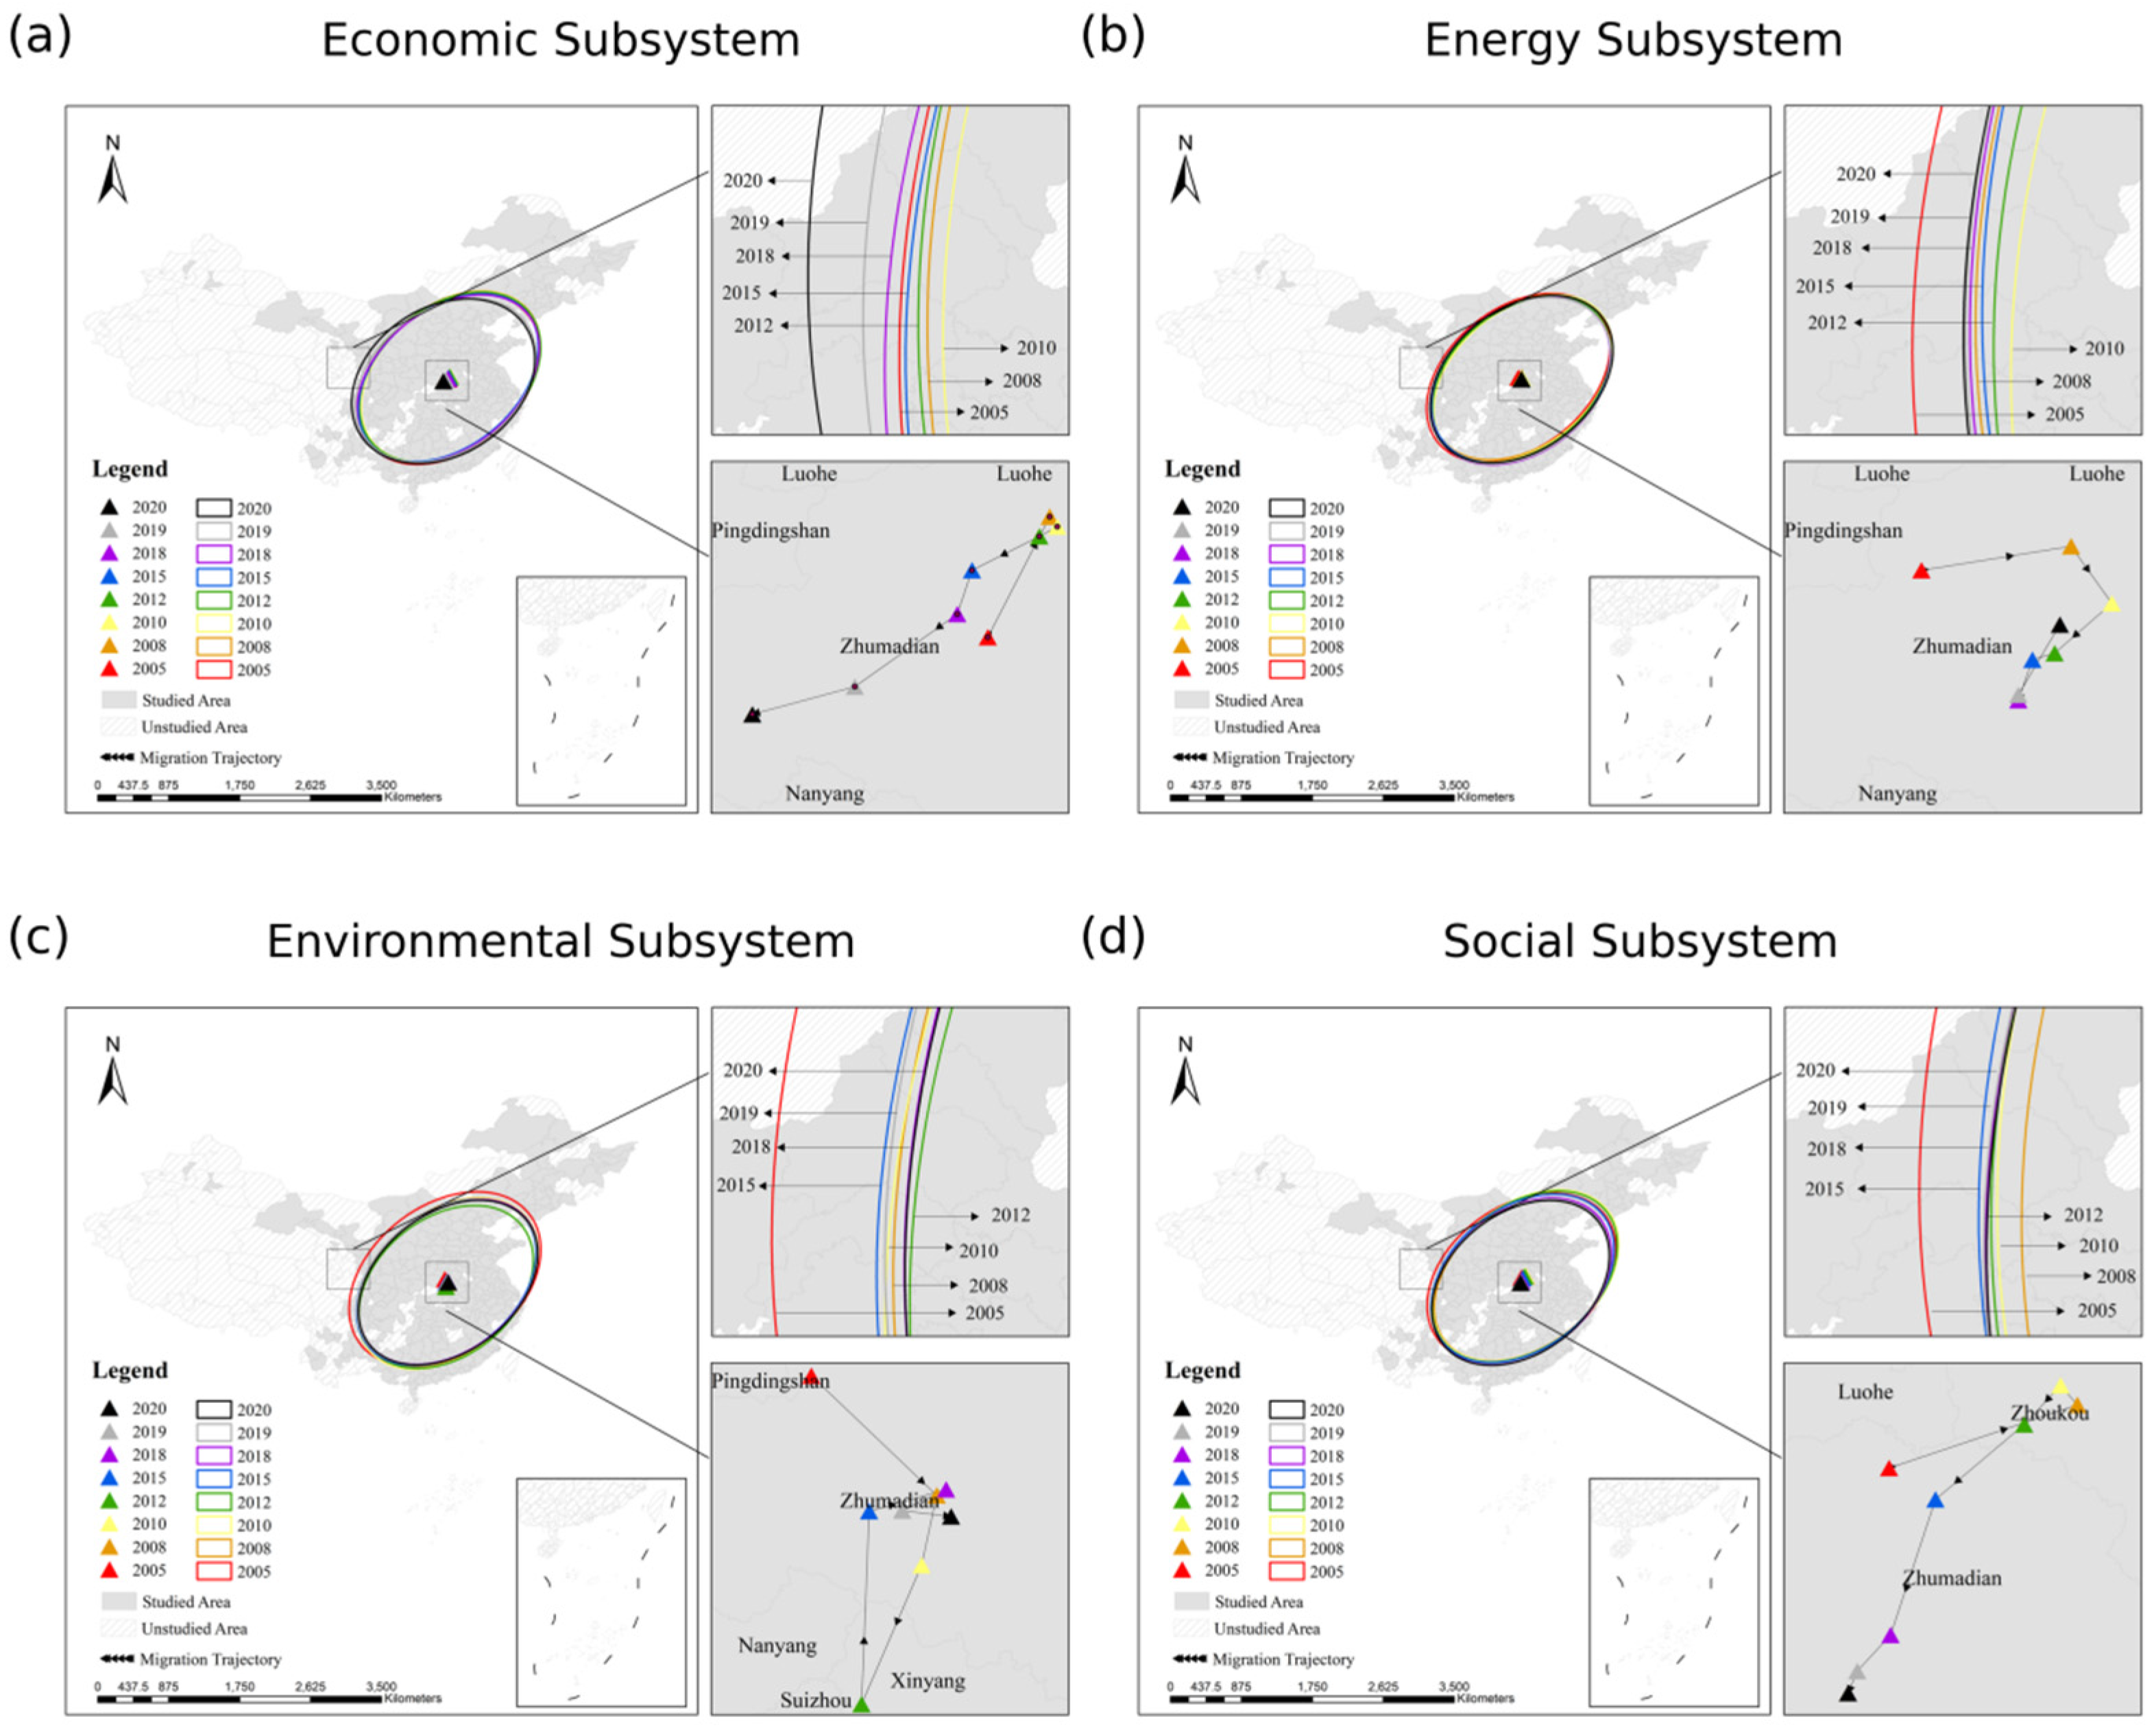
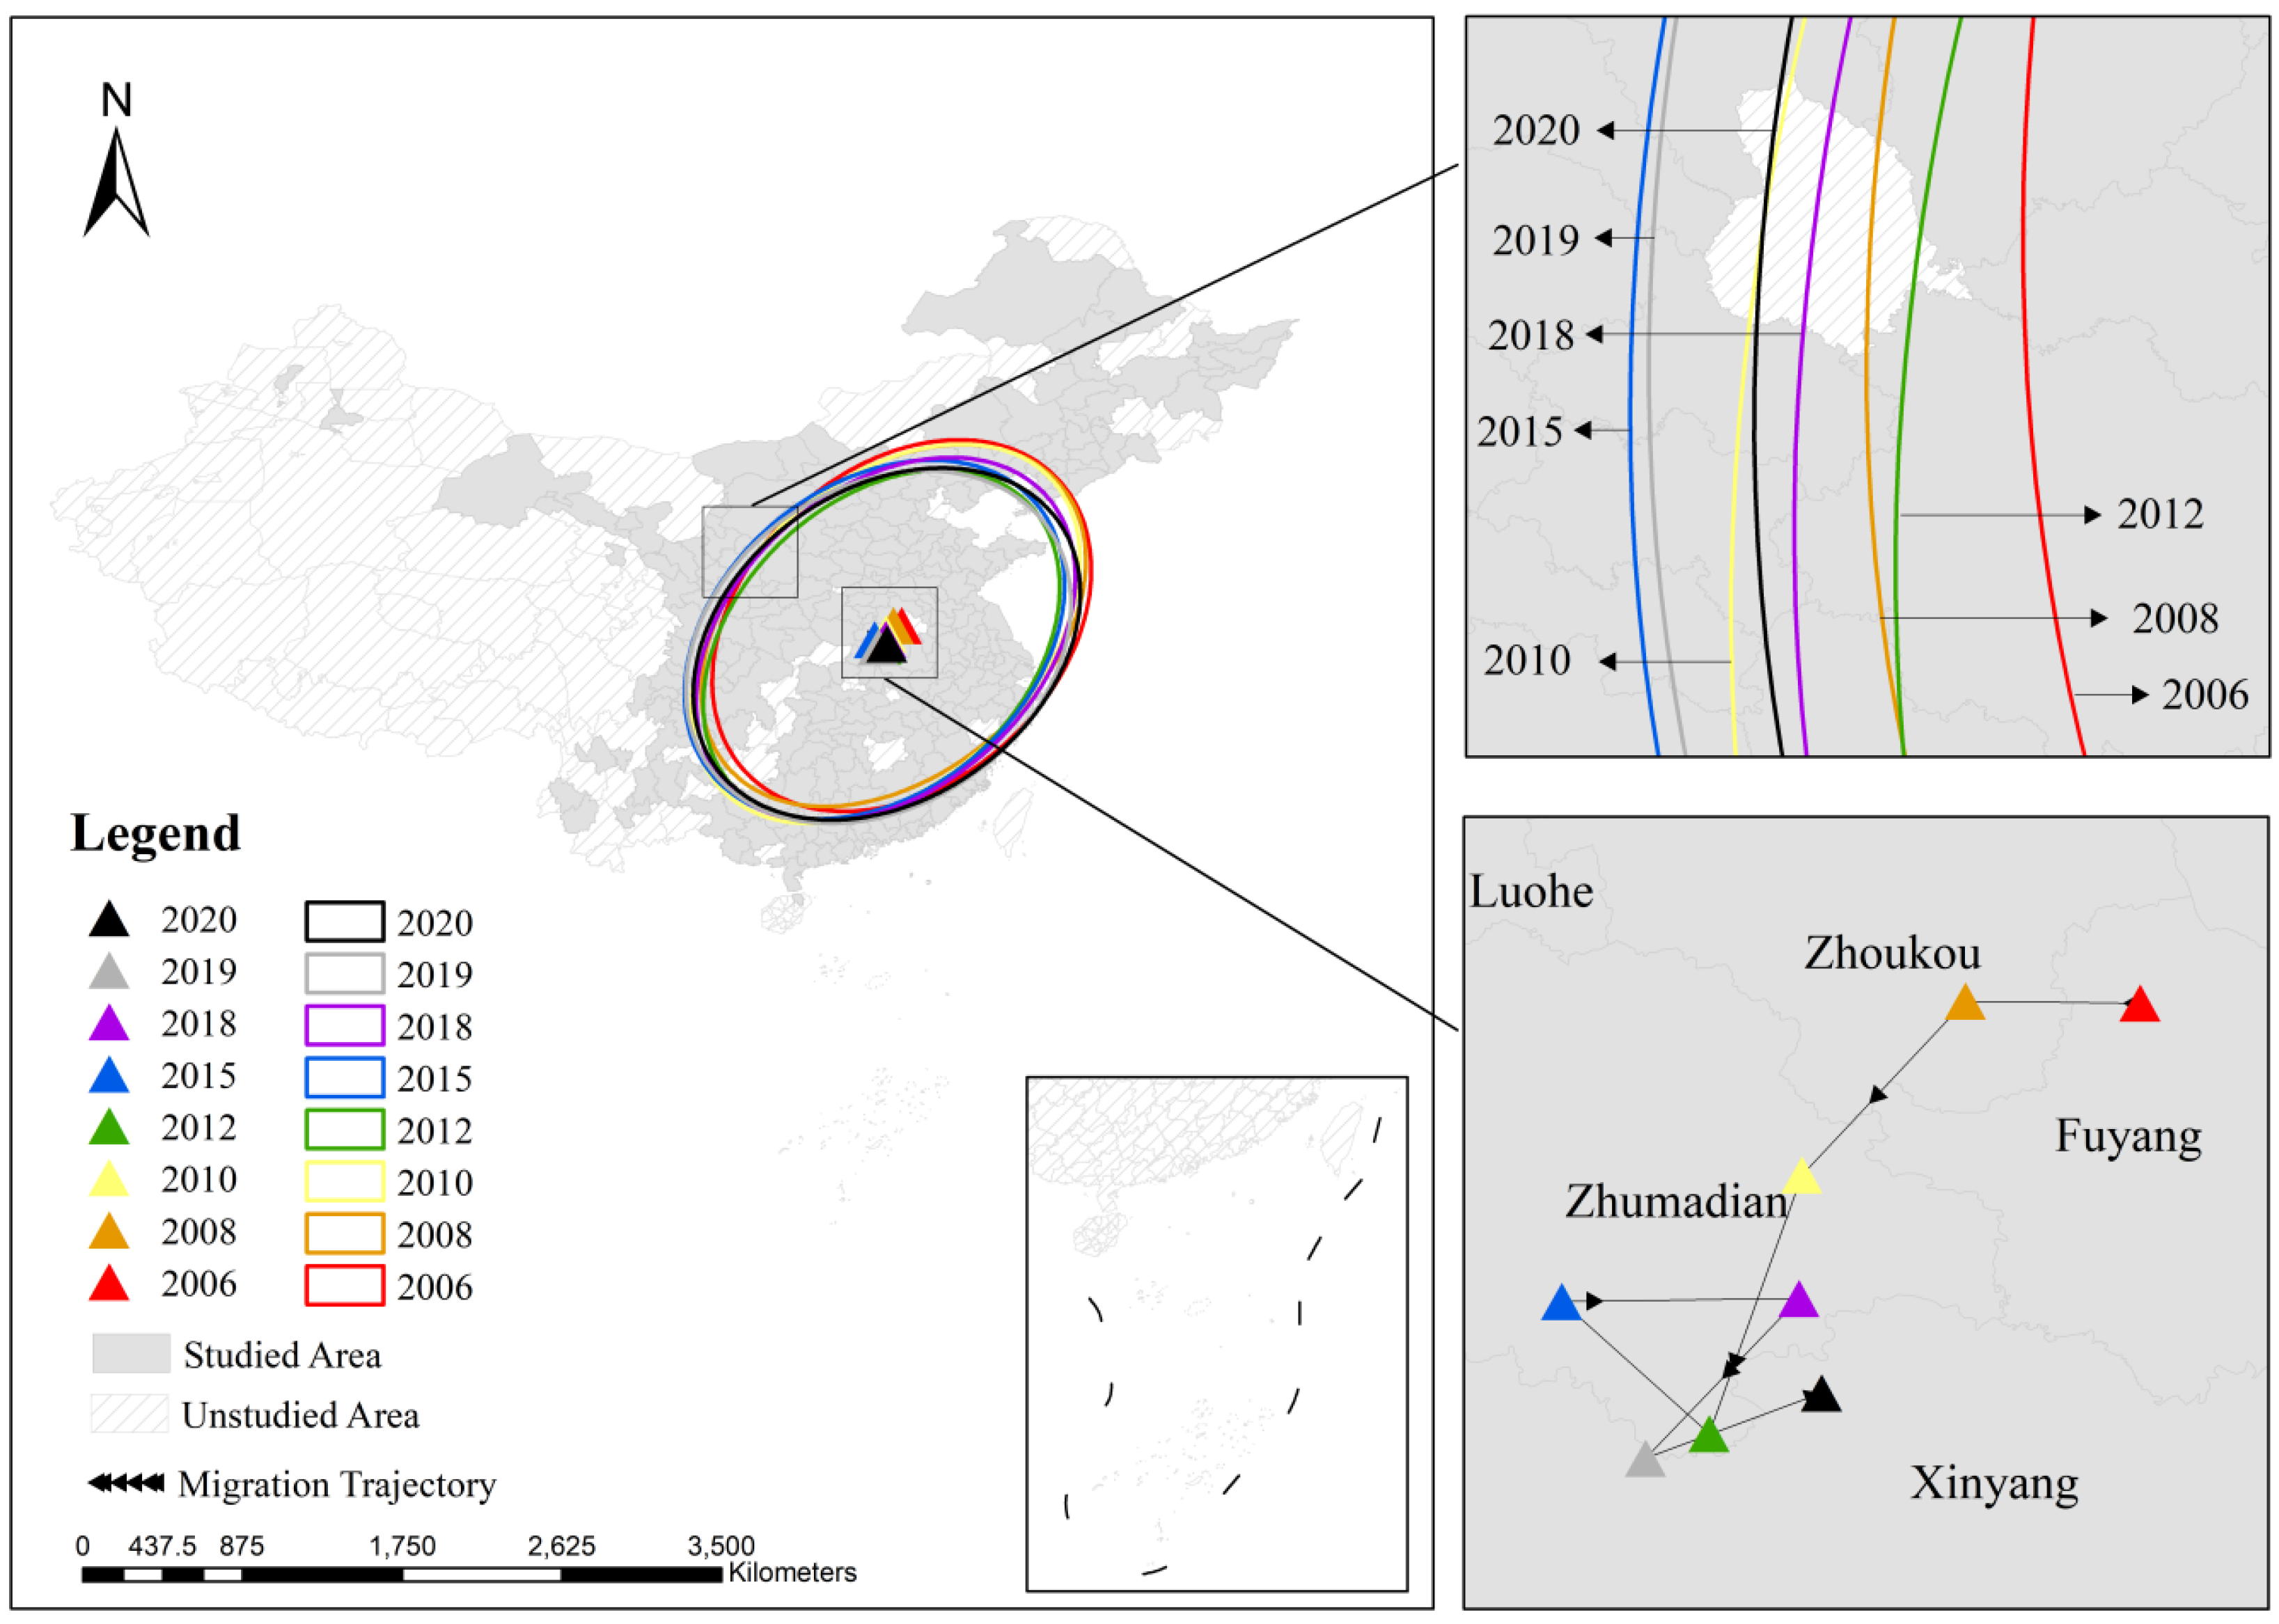
Figure 6a–d presents the SDEs and the trajectories of spatial centroid migration for the order degrees of the economic, energy, environmental, and social subsystems from 2005 to 2020. These results are used to characterize the overall spatial distribution direction, coverage range, and centroid evolution of each subsystem. The major axis of the ellipse indicates the dominant spatial distribution direction of subsystem order degrees, while the ellipse coverage reflects the degree of spatial dispersion. The colored triangles and connecting lines represent the positions of spatial centroids in different years and their migration paths.
For the economic subsystem (Figure 6a), the SDE exhibits a pronounced southwest–northeast orientation. The spatial coverage is mainly concentrated in the region east of the Hu Huanyong Line. The spatial positions of the ellipses remain relatively stable across years, with the centroid located near Zhumadian City in Henan Province. In terms of temporal evolution, the centroid of the economic subsystem order degree follows an overall northeast–southwest migration trajectory during 2005–2020, with stage-specific shifts occurring in different years.
The energy subsystem (Figure 6b) also displays a clear southwest–northeast orientation, with its coverage primarily located east of the Hu Huanyong Line. Its spatial centroid is likewise situated near Zhumadian City, Henan Province. Regarding the migration path, the centroid of the energy subsystem order degree experiences a multi-stage movement pattern during the study period, shifting sequentially in the southeast–southwest–northwest–northeast directions. Overall, compared with 2005, the centroid shows a relative southeastward shift by the end of the study period.
As shown in Figure 6c, the SDE of the environmental subsystem shares a similar spatial orientation with the economic and energy subsystems, exhibiting a southwest–northeast pattern and covering areas mainly east of the Hu Huanyong Line. The spatial centroid of the environmental subsystem order degree is also located near Zhumadian City, Henan Province. In terms of migration trajectory, the centroid undergoes stage-specific changes roughly following a southeast–northwest–northeast–southwest sequence during the study period, and overall shows a southeastward shift relative to its 2005 position.
The social subsystem (Figure 6d) similarly presents a pronounced southwest–northeast orientation, with spatial coverage concentrated east of the Hu Huanyong Line. Its centroid is mainly distributed between Zhumadian City and Zhoukou City in Henan Province. In terms of temporal evolution, the centroid was located near Zhumadian City in 2005, migrated to Zhoukou City by 2010, and subsequently continued to move southwestward, forming an overall northeast–southwest migration trajectory.
In summary, the SDEs of the four subsystems exhibit strong consistency in spatial orientation, all demonstrating a southwest–northeast pattern with coverage primarily east of the Hu Huanyong Line. However, notable differences exist in the migration paths, directions, and magnitudes of centroid shifts among the subsystems, with the social subsystem showing the most pronounced centroid migration characteristics.
(3)
Moran’s I Results and Analysis of the Order Degrees
Table 2 reports the global Moran’s I statistics for the order degrees of the 3E1S subsystems across 271 cities from 2005 to 2020, along with the corresponding significance levels. Overall, clear differences are observed among the subsystems in terms of magnitude, statistical significance, and temporal evolution of Moran’s I.
For the energy subsystem, Moran’s I is positive in most years during the study period, with statistical significance achieved in several years. From 2005 to 2008, Moran’s I ranges between 0.0552 and 0.0691, reaching significance at the 5% or 1% levels. During 2009–2012, the values are close to zero or slightly negative and fail to pass significance tests. After 2013, Moran’s I returns to positive values and becomes significant again in 2016–2018 and 2020, with values generally ranging from 0.0363 to 0.0756.
The economic subsystem maintains positive Moran’s I values throughout the entire study period, with most years significant at the 5% or 1% levels. In 2005–2006, Moran’s I is relatively low, at 0.0529 and 0.0511, respectively. From 2007 to 2012, Moran’s I increases markedly, reaching a peak of 0.2084 in 2011. During 2013–2020, although some fluctuations occur, Moran’s I remains within the range of 0.0400–0.1883, and most years continue to show statistical significance.
The environmental subsystem exhibits stage-specific changes in Moran’s I. From 2005 to 2014, Moran’s I is positive in most years and statistically significant at varying levels, with values ranging from 0.0507 to 0.1452. However, after 2015, Moran’s I declines significantly, with some years approaching zero. In 2018, a slight negative value (−0.0096) appears, and during 2015–2020, most years fail to pass significance tests.
The social subsystem generally displays relatively stable positive Moran’s I values and achieves statistical significance in most years. From 2005 to 2012, Moran’s I increases steadily from 0.0931 to 0.2281. During 2013–2015, the values declined somewhat but remained significant. Between 2016 and 2018, Moran’s I decreases further, with weakened significance in some years. In 2019, the value is relatively low and not significant, while in 2020 it rises again to 0.1614 and reaches significance at the 1% level.
A comparative analysis of the four subsystems shows that the economic and social subsystems exhibit relatively higher Moran’s I values overall, with statistical significance in most years, indicating pronounced and persistent positive spatial autocorrelation and clear spatial clustering patterns. The energy subsystem demonstrates stage-specific instability in spatial autocorrelation, with significance achieved in some years but not others, reflecting temporal fluctuations in its spatial clustering characteristics. In contrast, the environmental subsystem shows significant positive spatial autocorrelation in the early period, suggesting a certain degree of spatial clustering, but its significance weakens considerably in the later period, indicating a decline in spatial agglomeration effects.

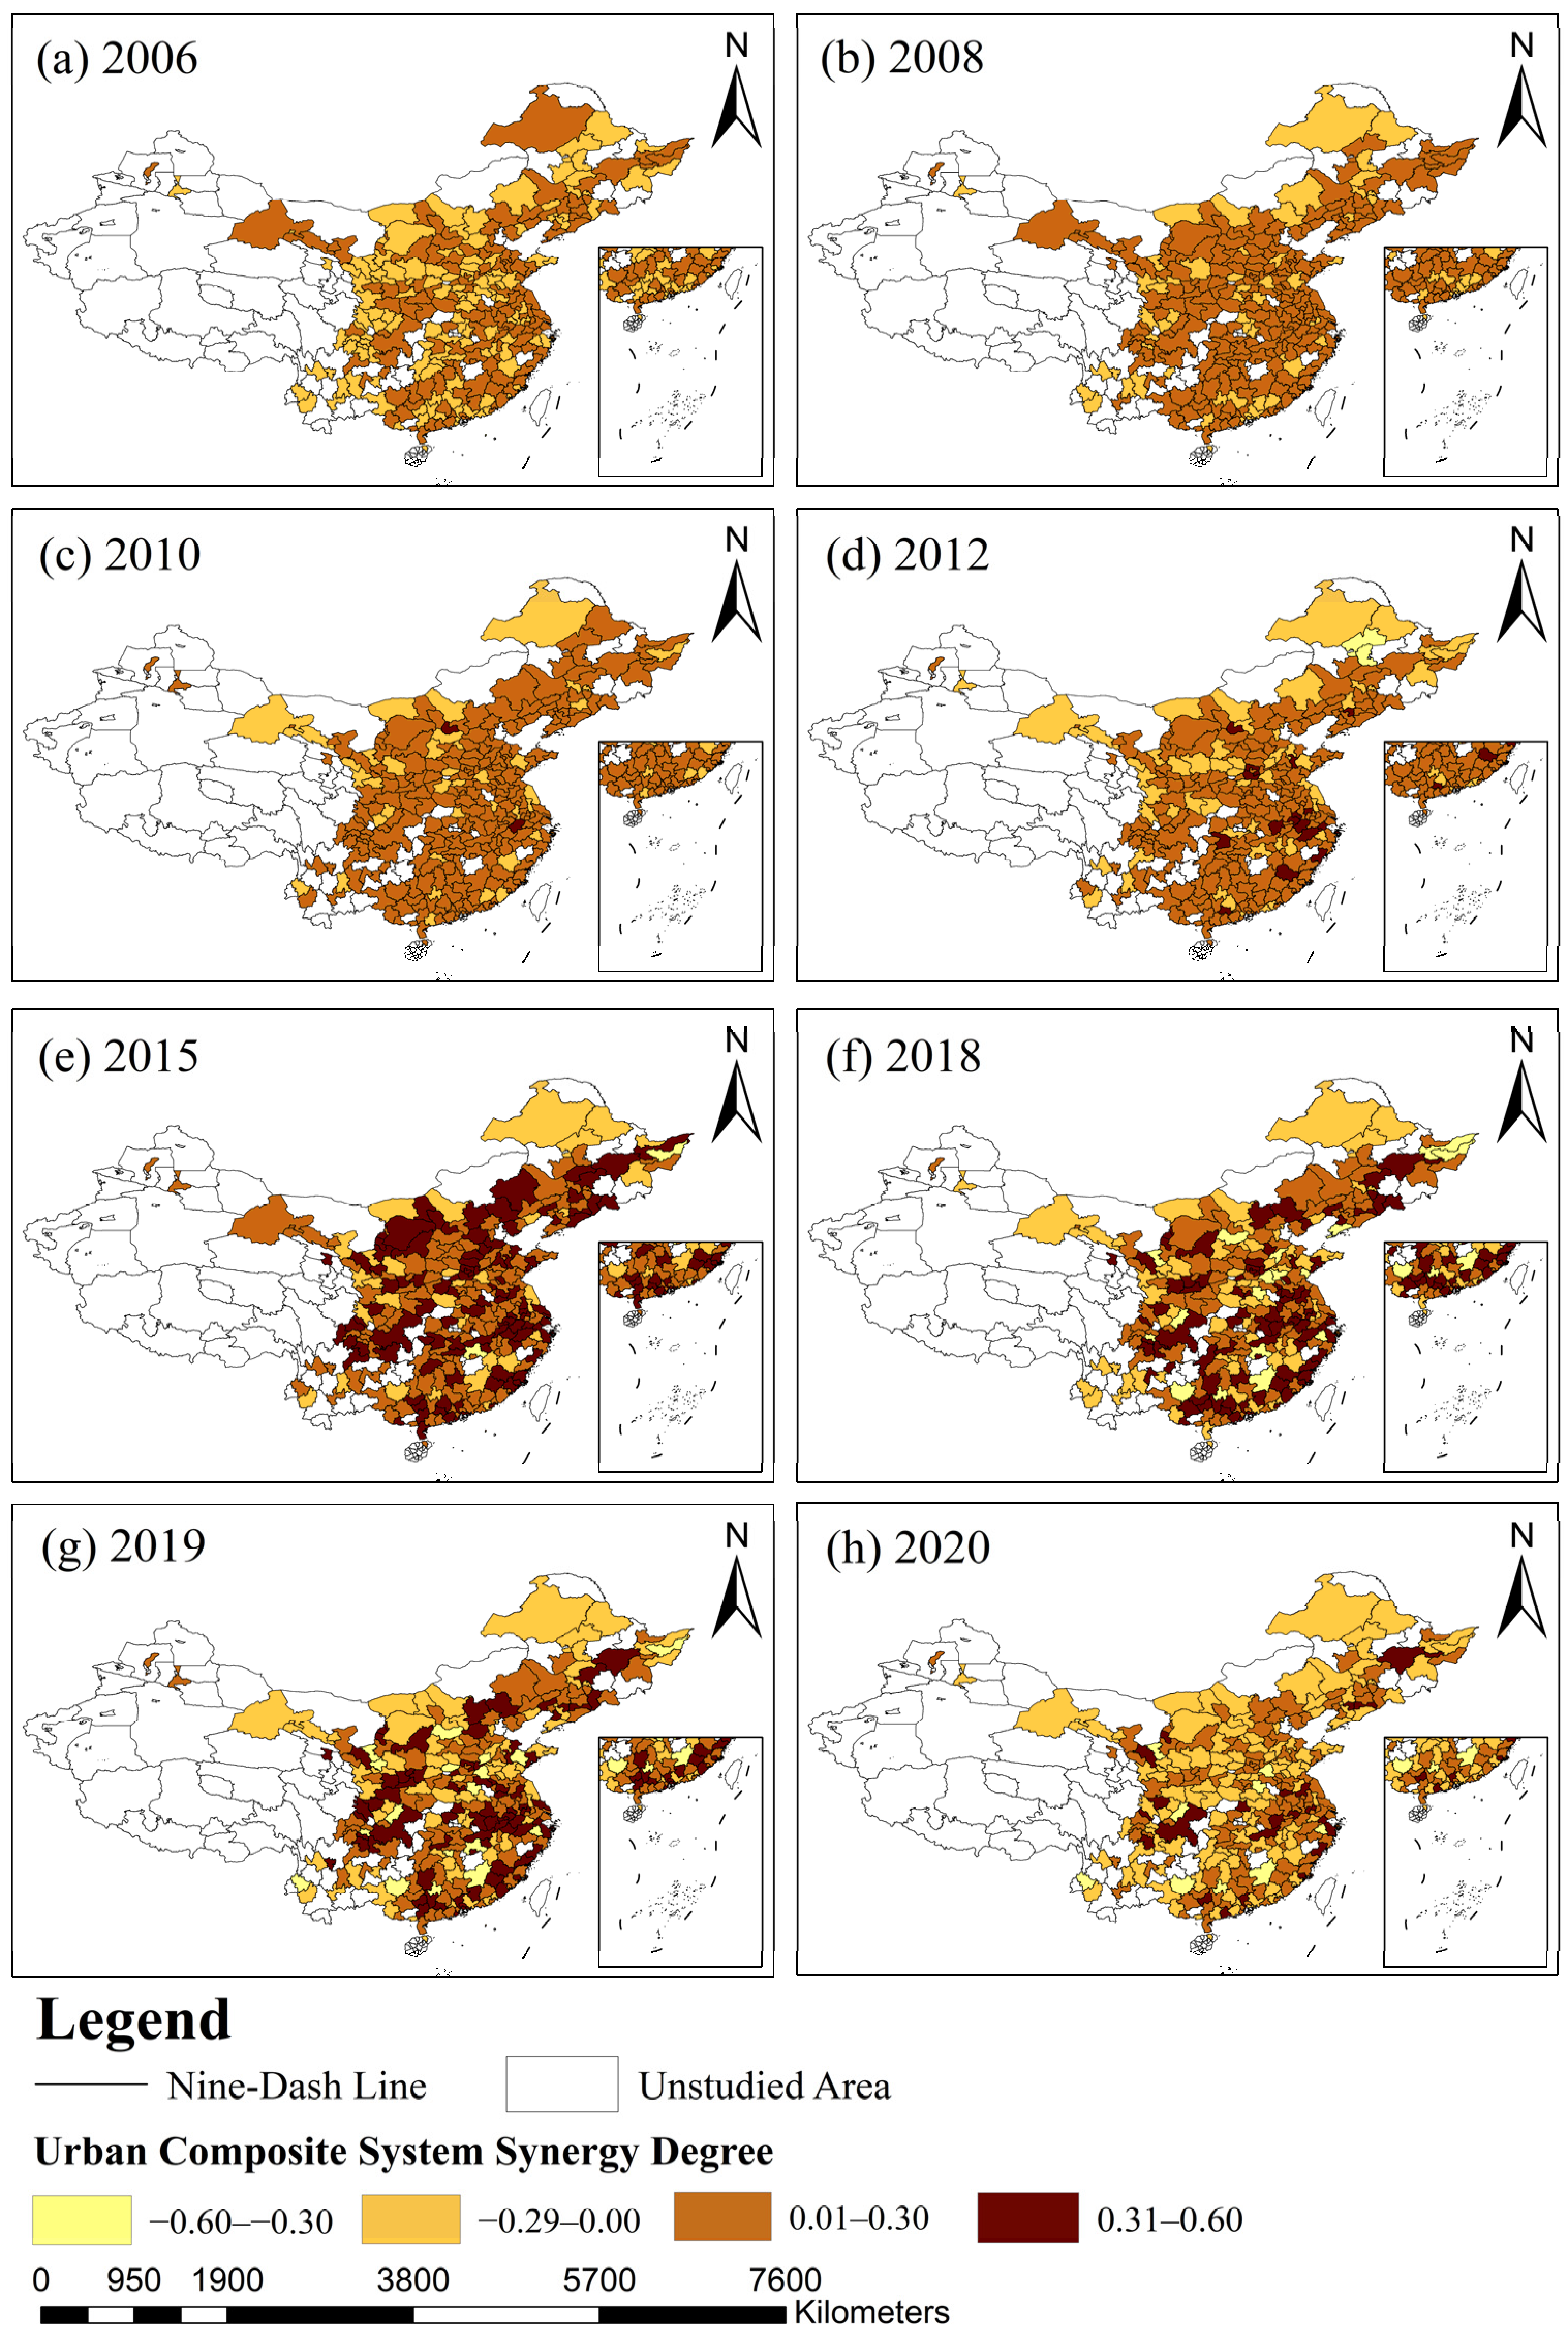
5.2. Spatiotemporal Evolution and Distribution Dynamics of the Urban Composite System Synergy Degree

5.2.1. Temporal Evolution and Distribution Dynamics of the Urban Composite System Synergy Degree

(1)
Boxplot Analysis of Synergy Degree
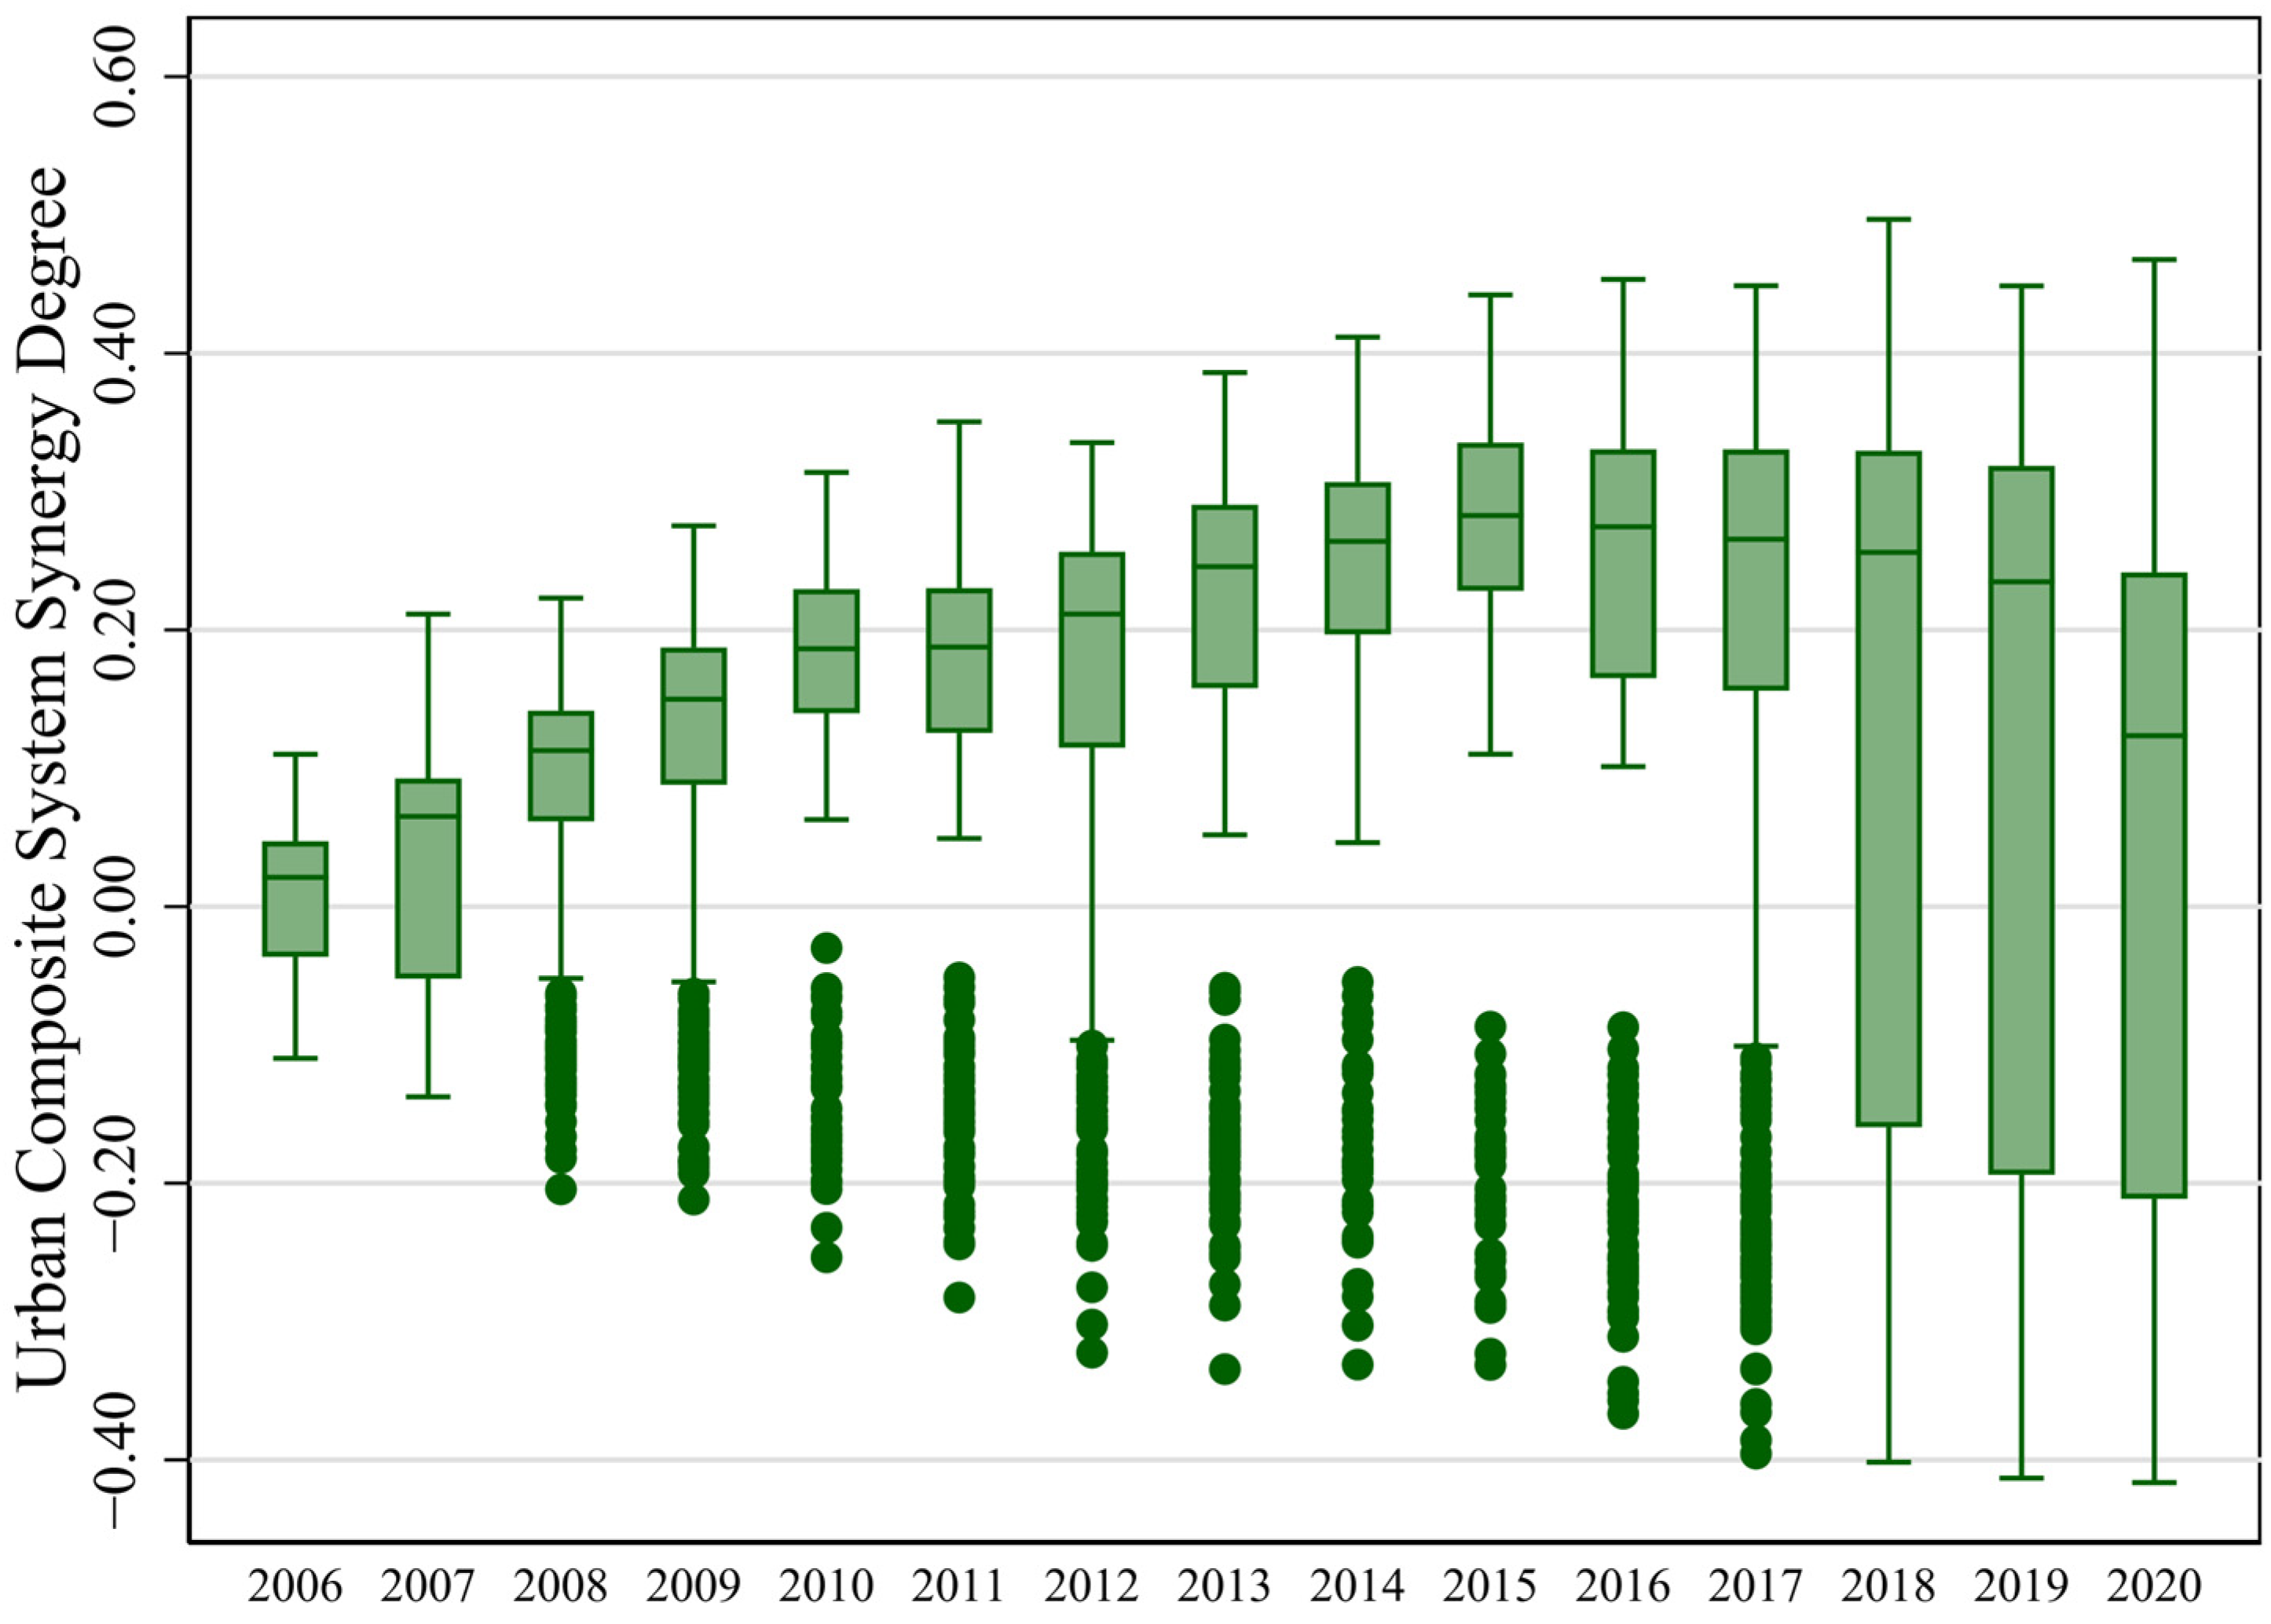
Figure 7 illustrates the annual boxplot distributions of the synergy degree of the urban composite system from 2006 to 2020. The horizontal axis denotes the year, while the vertical axis represents the synergy degree. The boxplots depict the median, interquartile range, overall range, and the distribution of outliers across different years. These patterns provide insight into how effectively the economic, energy, environmental, and social subsystems of cities develop in a coordinated manner over time.
In terms of median dynamics, the synergy degree exhibits a clear stage-based evolution over the study period. From 2006 to 2015, the median shows an overall upward trend, rising gradually from a value close to zero to approximately 0.25. This improvement suggests that many Chinese cities gradually strengthened coordination among economic development, energy utilization, environmental protection, and social development during this period. During 2016–2017, the median remained at a relatively high level, indicating that the overall level of coordinated low-carbon development reached a relatively stable stage in the mid-2010s. In contrast, from 2018 to 2020, the median declines markedly, and the center of the distribution shifts toward lower-value intervals. This decline may reflect the increasing difficulty of sustaining coordinated development as cities entered a stage of deeper structural adjustment and more complex low-carbon transition challenges.
With respect to distribution range and dispersion, the box height remains relatively small during 2006–2014 but gradually expands over time, indicating changes in the distribution range of the synergy degree among cities. The relatively narrow distribution in the earlier years suggests that most cities had similarly low levels of coordination among subsystems at the beginning of the study period. In 2015–2017, both the box height and the length of the whiskers reached relatively high levels, suggesting a higher degree of dispersion in this stage. This pattern indicates that cities began to diverge more significantly in their ability to promote coordinated development, possibly due to differences in local development strategies, industrial structures, and policy implementation capacities. After 2018, the box height increases substantially, and the whiskers extend further, reflecting more pronounced disparities in the synergy degree across cities in the later years. This widening gap suggests that some cities were able to maintain relatively higher levels of subsystem coordination, while others experienced increasing difficulties in balancing economic growth, energy transition, environmental governance, and social development.
Regarding outlier distribution, most years exhibit a considerable number of low-value outliers below the lower quartile, and these outliers extend toward lower values after 2010. These observations indicate that a group of cities consistently lagged behind in achieving coordinated development across subsystems. After 2017, the number of low-value outliers increased significantly, indicating that some cities experience particularly low levels of synergy. This may reflect structural challenges faced by certain cities during the later stages of low-carbon transition, such as economic slowdown, industrial restructuring pressures, or limited capacity to implement environmental and energy policies. By comparison, high-value outliers above the upper quartile are relatively few, and their distribution shows limited temporal variation. This suggests that only a small number of cities achieved significantly higher levels of coordinated low-carbon development than the national urban average.
Overall, from 2006 to 2020, the synergy degree of the urban composite system follows a trajectory characterized by “initial increase–mid-term high-level fluctuation–subsequent decline.” The distribution evolves from an early concentration at low levels to an expansion toward medium–high values, and then disperses again toward lower-value intervals in the later stage. This pattern indicates that although many cities made progress in promoting coordinated low-carbon development during the earlier years, maintaining high levels of subsystem coordination became increasingly challenging in the later stages of urban low-carbon transition. Meanwhile, dispersion increases markedly in the later years, suggesting that inter-city disparities in synergistic development have further widened. In practical terms, this implies that cities differ substantially in their ability to balance economic growth, energy transition, environmental governance, and social development under the pressures of low-carbon transformation.
(2)
Kernel Density Estimation Analysis of Synergy Degree
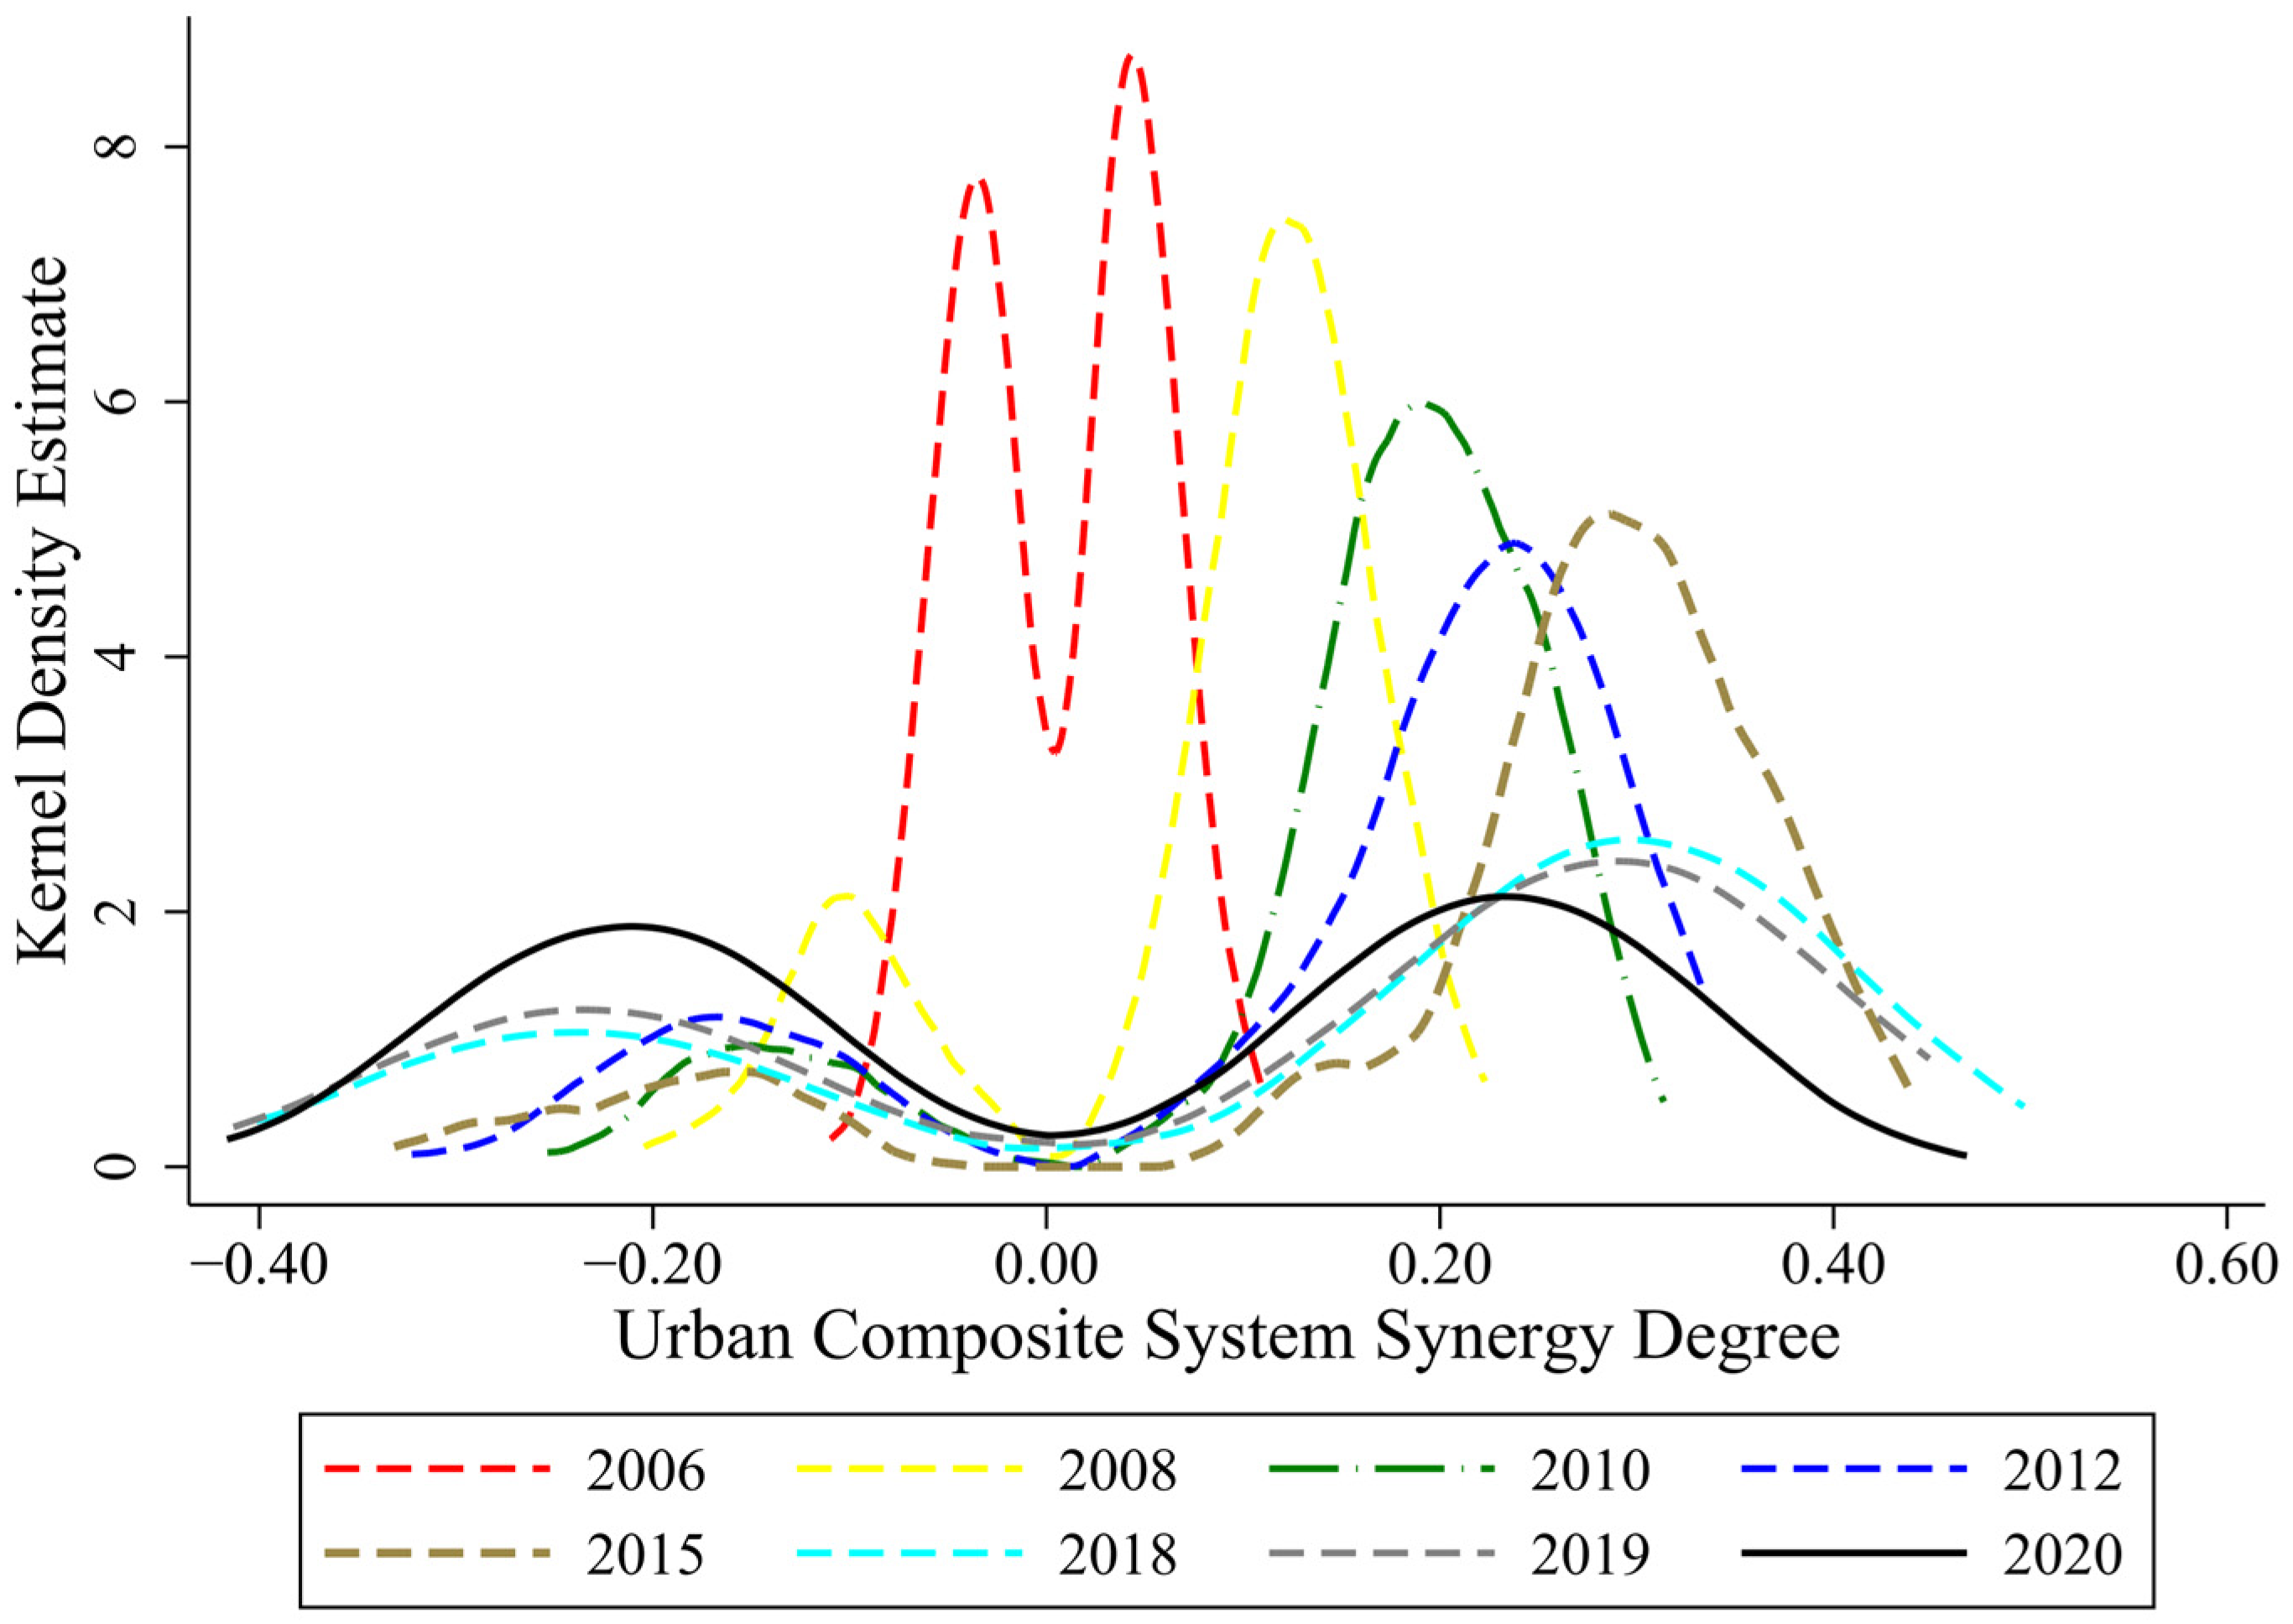
Figure 8 presents the KDE results of the synergy degree of the urban composite system for the years 2006, 2008, 2010, 2012, 2015, 2018, 2019, and 2020. The horizontal axis represents the synergy degree, while the vertical axis denotes the estimated kernel density. Different years are distinguished by different line types and colors to illustrate the distributional patterns of the synergy degree and their temporal evolution. In practical terms, the movement and shape of these density curves reflect how effectively cities coordinate economic development, energy use, environmental protection, and social development during the process of low-carbon transition.
From the perspective of overall distributional shifts, the synergy degree distribution exhibits a clear rightward movement from low-value intervals toward higher values during 2006–2015. In 2006, the kernel density curve was mainly concentrated around values close to zero, with a sharp peak and a relatively narrow distribution, indicating a high degree of concentration. This pattern suggests that, at the beginning of the study period, most cities had relatively low levels of coordination among economic, energy, environmental, and social subsystems. During 2008–2012, the curves shift steadily toward the positive-value range, with the peak position gradually increasing and the distribution width expanding simultaneously. This shift indicates that many cities gradually improved their ability to balance economic development with energy efficiency, environmental management, and social progress. By 2015, the main peak of the kernel density curve has further migrated to the medium–high synergy degree interval, suggesting that coordinated development across subsystems had improved substantially in a large number of cities during this stage.
In terms of distributional shape, pronounced differences can be observed across years with respect to peak height and dispersion. In the early period (2006–2008), the kernel density curves are characterized by high and steep peaks, suggesting a relatively concentrated distribution of the synergy degree. This indicates that cities were relatively similar in their low levels of subsystem coordination during the early stage of urban low-carbon transition. Over time, the curves become progressively flatter and wider, reflecting an expansion in the distribution range. The widening distribution implies that cities began to diverge in their ability to promote coordinated development, likely due to differences in economic structures, policy implementation, and technological capacity. In some intermediate years (e.g., 2010–2015), a distinct unimodal pattern emerges in the positive-value range, while a certain density is still retained in the low-value interval. This suggests that although many cities improved their coordination levels, a group of cities still lagged behind in achieving balanced development across subsystems.
In the later period (2018–2020), the distributional pattern changes noticeably. Compared with 2015, the kernel density curves during 2018–2020 shift back toward lower-value intervals, with a decline in the main peak position and a further widening of the distribution. This shift indicates that maintaining coordinated development among subsystems became more difficult for many cities in the later stages of low-carbon transition. In some years, the curves maintain non-negligible density in the negative-value range, indicating a relatively long tail at the low end of the synergy degree distribution. Such long lower tails suggest that some cities experienced particularly weak coordination among economic development, energy transition, environmental governance, and social development.
Overall, from 2006 to 2020, the kernel density distribution of the urban composite system’s synergy degree demonstrates a stage-based evolution, characterized by an initial shift toward higher values followed by a subsequent return toward lower values. The distribution transitions from an early concentrated pattern to a more dispersed configuration in the middle stage, and becomes increasingly scattered in the later period, with pronounced distributional differences across years. In practical terms, this pattern suggests that although many cities initially improved their ability to coordinate multiple development dimensions, sustaining high levels of subsystem coordination became increasingly challenging as urban low-carbon transition entered a more complex stage. At the same time, the widening distribution indicates that cities followed different development trajectories, reflecting variations in local development strategies, policy implementation capacity, and economic transformation pathways.

5.2.2. Spatiotemporal Evolution and Spatial Structural Characteristics of the Urban Composite System Synergy Degree

(1)
Spatiotemporal Map Evolution Results and Analysis of Synergy Degree
Figure 9a–h illustrates the spatial distribution patterns of the synergy degree of the urban composite system in 2006, 2008, 2010, 2012, 2015, 2018, 2019, and 2020. According to the classification criteria of the composite system synergy degree model [61], the synergy degree is divided into four levels: moderate disorder (−0.60 to −0.30), sub-disorder/weak conflict (−0.29 to 0.00), primary synergy (0.01 to 0.30), and moderate synergy (0.31 to 0.60).
From an overall spatial perspective, the synergy degree of the urban composite system exhibits pronounced spatial differentiation throughout the study period, with different synergy states interwoven across space. In 2006 (Figure 9a), most cities were classified into the sub-disorder/weak conflict (−0.29 to 0.00) and primary synergy (0.01 to 0.30) categories, indicating a dominance of low-to-medium synergy levels. Cities characterized by moderate disorder (−0.60 to −0.30) were sparsely distributed in certain regions. By 2008 (Figure 9b), the number of cities in the primary synergy category increased, showing a spatial expansion from localized areas to surrounding regions.
During 2010–2012 (Figure 9c,d), the overall synergy degree improved markedly. Primary synergy (0.01 to 0.30) became the dominant category, while some cities transitioned into the moderate synergy (0.31 to 0.60) state. Cities with moderate synergy gradually increased in number and began to exhibit spatial clustering. Meanwhile, the number of cities in the moderate disorder category declined, although such cities persisted in certain localized areas.
In 2015 (Figure 9e), the spatial distribution of the synergy degree underwent a notable shift. The number of cities classified as having moderate synergy (0.31 to 0.60) increased substantially and formed relatively contiguous spatial patterns, indicating that the overall synergy level of the urban composite system reached a comparatively high stage in this year. In 2018 (Figure 9f), cities with moderate synergy continued to occupy a large spatial extent; however, the spatial intermixing of different synergy states became more pronounced, with sub-disorder/weak conflict and primary synergy categories re-emerging in some regions.
During 2019–2020 (Figure 9g,h), the spatial pattern of the synergy degree was adjusted again. Compared with 2015, the number of cities in the moderate synergy category declined, while more cities reverted to the sub-disorder/weak conflict (−0.29 to 0.00) and primary synergy (0.01 to 0.30) categories. At the same time, cities characterized by moderate disorder showed an expansion in certain areas, accompanied by a clear increase in spatial dispersion.
Overall, from 2006 to 2020, the spatial evolution of the urban composite system’s synergy degree exhibits a clear stage-based pattern, characterized by an initial dominance of low-to-medium synergy levels, followed by an expansion toward moderate synergy, and subsequently a partial return to low-to-medium synergy states. The spatial extent, clustering intensity, and evolutionary trajectories of different synergy states change markedly over time, highlighting the pronounced spatial dynamics of synergy evolution in the urban composite system.
(2)
Standard Deviational Ellipse Results and Analysis of Synergy Degree
Figure 10 presents the SDEs of the synergy degree of the urban composite system and the corresponding trajectories of spatial gravity-center migration from 2006 to 2020, aiming to depict the overall spatial distribution direction, spatial coverage, and the evolution of the gravity center of the synergy degree. In the figure, the major axis of each ellipse indicates the dominant orientation of the spatial distribution of the synergy degree, the area of the ellipse reflects the degree of spatial dispersion, and the colored triangles together with connecting arrows denote the locations of the gravity center in different periods and their migration paths, respectively.
From the perspective of overall spatial orientation, the standard deviation ellipses of the urban composite system’s synergy degree consistently exhibit a pronounced southwest–northeast alignment throughout 2006–2020, with their spatial coverage mainly concentrated in regions east of the Hu Huanyong Line. The spatial positions and shapes of the ellipses remain highly consistent across different years, indicating that the dominant spatial distribution direction of the synergy degree is relatively stable over the study period.
In terms of the location of the spatial gravity center, the gravity centers of the urban composite system’s synergy degree are predominantly distributed in southern Henan Province, specifically around Zhumadian, Zhoukou, Fuyang, and Xinyang. In 2006, the gravity center was located near Fuyang City, followed by interannual shifts in subsequent periods. Around 2010, the gravity center moved toward Zhumadian; during 2012–2015, it oscillated between Zhumadian and Zhoukou; and during 2018–2020, it further shifted toward Xinyang.
Regarding the migration trajectory of the gravity center, the synergy degree of the urban composite system as a whole shows a clear northeast–southwest migration path over 2006–2020. Although the migration distance varies across different periods, the overall direction of movement remains consistent, suggesting a continuous adjustment of the spatial configuration of the synergy degree during the study period.
Overall, the spatial distribution of the urban composite system’s synergy degree is characterized by strong directional stability, with regions east of the Hu Huanyong Line serving as the main spatial domain and a southwest–northeast orientation as the dominant pattern. Meanwhile, the gravity center exhibits distinct stage-based migration characteristics, reflecting the dynamic spatial evolution of urban composite system synergy levels over time.
(3)
Moran’s I Results and Analysis of Synergy Degree
Table 3 reports the calculated results of the global Moran’s I for the synergy degree of the urban composite system from 2006 to 2020, together with the corresponding significance tests. From a temporal perspective, Moran’s I values in 2006 and 2007 were 0.0242 and 0.0120, respectively, and neither passed the significance test, indicating weak spatial dependence of the synergy degree during this initial stage. In 2008–2009, Moran’s I increased to 0.0520 and 0.0530 and was significant at the 1% level, suggesting that the synergy degree began to exhibit a statistically significant positive spatial autocorrelation.
During 2010–2011, Moran’s I values of the composite system’s synergy degree were close to zero and failed to pass the significance test, implying a marked weakening of spatial correlation. In 2012, Moran’s I rebounded to 0.0401 and was significant at the 5% level, indicating that spatial clustering of the synergy degree re-emerged in that year. From 2013 to 2017, Moran’s I remained at relatively low levels (0.0006–0.0224) and was not statistically significant, suggesting that the spatial distribution of the synergy degree during this period was closer to a random pattern.
In the later stage of the study period, the spatial autocorrelation of the composite system’s synergy degree strengthened again. In 2018, Moran’s I reached 0.0282 and passed the significance test at the 10% level; in 2019 and 2020, Moran’s I further increased to 0.0480 and 0.0372, respectively, and was significant at the 5% or 1% level. These results indicate a renewed emergence of significant positive spatial clustering of the synergy degree in recent years.
Overall, from 2006 to 2020, the spatial autocorrelation of the urban composite system’s synergy degree exhibits clear stage-specific fluctuations, and the overall intensity of spatial clustering remains relatively weak.

6. Discussion and Conclusions

6.1. Discussion

Earlier studies on low-carbon development have typically relied on single indicators such as carbon emissions, energy intensity, or efficiency measures [1,2,3]. In contrast, more recent research has increasingly emphasized the importance of integrated analytical frameworks capable of capturing interactions among multiple development dimensions. The results of this study support this emerging perspective by showing that the evolution of low-carbon development cannot be adequately understood through isolated indicators but instead reflects the coordinated adjustment of multiple subsystems. This perspective is consistent with recent studies that highlight the need for multidimensional sustainability assessment frameworks capable of linking economic, environmental, and social performance within a unified analytical structure [8]. In this respect, the findings extend previous studies by demonstrating how subsystem interactions shape the overall trajectory of urban low-carbon transitions.
The differentiated trajectories observed across the four subsystems also align with earlier studies that have documented heterogeneous development dynamics within China’s low-carbon transition process [19]. However, while many previous studies have primarily focused on environmental or energy-related indicators, the present results suggest that subsystem dynamics may diverge substantially when examined within a broader multisystem coordination framework. In particular, the relatively stable improvement observed in the social subsystem contrasts with the more cyclical dynamics of the economic and energy subsystems. This difference suggests that social development processes—such as improvements in welfare provision and public services—may follow a more gradual and persistent pathway than economic restructuring or energy transition. Such findings reinforce arguments in the sustainability literature that the social dimension represents an essential but often underexamined component of low-carbon development [62]. Similarly, recent empirical research has emphasized that sustainability transitions involve complex interactions among multiple development dimensions and cannot be fully understood without considering their systemic interconnections [9].
The distributional dynamics identified in this study further contribute to the literature on regional inequality in low-carbon development. Previous research has consistently reported substantial spatial disparities in China’s green and low-carbon transitions [19]. The results presented here confirm these findings while also showing that convergence patterns differ across subsystems. Although the energy subsystem displays signs of increasing convergence among cities, the economic and environmental subsystems exhibit periods of widening disparities. This divergence suggests that the low-carbon transition process may involve simultaneous processes of convergence and divergence across different development dimensions. Compared with earlier studies that primarily evaluated overall low-carbon performance, the present findings highlight the importance of examining subsystem-specific dynamics when assessing regional inequalities in low-carbon development.
The spatial patterns observed in this study are also broadly consistent with long-standing findings in China’s regional development literature. High-order-degree areas are predominantly concentrated east of the Hu Huanyong Line, reflecting the well-known east–west development gradient identified in China’s economic geography [63]. Previous studies have attributed this spatial pattern to differences in economic development levels, industrial structures, and technological capacities between eastern and western regions. The results presented here support this interpretation, indicating that the spatial distribution of low-carbon development remains closely linked to broader regional development structures. At the same time, the gradual shifts observed in the spatial centers of subsystem development suggest that the geography of low-carbon transition is evolving alongside broader regional economic transformations.
Finally, the composite-system analysis highlights an important aspect of multisystem coordination that has received relatively limited attention in previous research. While improvements in individual subsystems are widely documented in the literature, fewer studies have examined the extent to which these improvements translate into stronger overall system coordination. The results of this study indicate that such coordination remains difficult to sustain, as reflected in the stage-specific dynamics and relatively weak spatial clustering of the synergy degree. This finding supports arguments in the sustainability transition literature that improvements in individual dimensions do not automatically lead to stronger system-wide coordination. Recent research on sustainability transitions and circular economy policies has similarly emphasized that effective sustainability outcomes depend not only on improvements within individual sectors but also on coordinated policy frameworks that integrate economic, environmental, and institutional dimensions [18]. Compared with traditional economic indicators, which often exhibit strong spatial agglomeration [64,65], the relatively dispersed spatial pattern of LCCD suggests that multisystem coordination may evolve through gradual and spatially diffuse adjustments rather than through concentrated regional clusters.

6.2. Conclusions

Based on panel data for 271 Chinese cities from 2005 to 2020, this study constructs an evaluation framework for the order degree of the 3E1S subsystems and, by applying the composite system synergy degree model, systematically analyzes the evolutionary characteristics of urban low-carbon coordinated development from the perspectives of temporal evolution, distribution dynamics, and spatial structure. The main conclusions are as follows.
First, at the subsystem level, the order degrees of the 3E1S subsystems exhibit pronounced heterogeneity in their temporal evolution. The economic and energy subsystems follow an inverted U-shaped trajectory, although their peak years differ; the environmental subsystem displays clear stage-specific fluctuations; and the social subsystem shows a continuous upward trend throughout the study period, indicating a relatively stable improvement path. Distributional dynamics further reveal substantial differences among subsystems in terms of dispersion, peak shifts, and tail behavior, reflecting continuous adjustments in inter-city disparities of low-carbon-related systems across different stages.
Second, from the perspective of spatial structure, the order degrees of all four subsystems are predominantly concentrated east of the Hu Huanyong Line and aligned along a southwest–northeast spatial axis. Results from standard deviation ellipse and spatial gravity center analyses indicate that the spatial centers of the subsystems are clustered in the Central Plains region and undergo stage-specific shifts over time, suggesting that the spatial focus of urban low-carbon development is dynamically evolving. Spatial autocorrelation analysis shows that the economic and social subsystems exhibit significant and relatively stable positive spatial autocorrelation in most years, whereas the energy subsystem displays stage-dependent spatial correlation, and the environmental subsystem experiences a marked weakening of spatial clustering in the later period. These findings highlight substantial differences in spatial clustering intensity and stability across subsystems.
Third, at the composite-system level, the synergy degree of urban low-carbon coordinated development shows a clear stage-specific pattern characterized by an initial increase, a mid-period high plateau, and a subsequent decline during 2006–2020, accompanied by a notable widening of inter-city disparities in the later years. Spatial distribution and standard deviation ellipse results indicate that the synergy degree maintains relatively stable directionality and centrality, while its overall spatial clustering remains weak. Moran’s I results further suggest that positive spatial autocorrelation of the synergy degree is only observed in a limited number of years, implying that urban low-carbon coordinated development struggles to form a long-term, stable spatial clustering pattern and instead exhibits pronounced stage-specific spatial dependence.
Overall, urban low-carbon coordinated development is characterized by strong temporal stage effects, continuous distributional restructuring, and dynamic spatial evolution. Improvements in individual subsystems do not necessarily translate into sustained enhancements in composite-system synergy, particularly in the later stages when cross-system coordination faces increasingly complex constraints. This implies that promoting urban low-carbon development requires not only sustained improvements within individual dimensions but also greater attention to the stability of cross-system synergy and regional heterogeneity.
From a policy perspective, these findings suggest that future urban low-carbon governance should prioritize the long-term stability of composite-system synergy while consolidating the ordered operation of the economic, energy, and environmental subsystems. Differentiated, region-specific, and stage-adaptive policy strategies are needed to account for spatial heterogeneity and divergent evolutionary paths across subsystems. At the same time, cities and urban agglomerations with persistently low synergy degrees and widening disparities should be targeted through cross-regional cooperation and integrated policy mechanisms to enhance overall low-carbon coordinated development.
Although considerable efforts have been made in this study, several limitations remain. Future research could further explore the driving mechanisms behind stage-specific changes by incorporating major policy shocks or structural break analyses; employing local spatial autocorrelation or spatial econometric models to capture localized clustering and spillover effects; and conducting robustness and comparative analyses by refining indicator systems and weighting schemes to strengthen the reliability and generalizability of the conclusions.

Author Contributions

X.W.: conceptualization, writing—reviewing and editing. S.Z.: methodology, writing—original draft preparation. X.W.: conceptualization, writing—reviewing and editing. S.Z.: methodology, writing—original draft preparation. All authors have read and agreed to the published version of the manuscript.

Funding

This research received no external funding.

Data Availability Statement

The data supporting the findings of this study are available at Figshare, https://figshare.com/s/ddbd641c5aede12cd13e, accessed on 5 February 2026.

Conflicts of Interest

The authors declare that they have no known competing financial interests or personal relationships that could have appeared to influence the work reported in this paper.

References

  1. Kaya, Y.; Yokobori, K. (Eds.) Environment, Energy, and Economy: Strategies for Sustainability; United Nations University Press: Tokyo, Japan, 1997; Volume 4. [Google Scholar]
  2. Mielnik, O.; Goldemberg, J. Communication The evolution of the “carbonization index” in developing countries. Energy Policy 1999, 27, 307–308. [Google Scholar] [CrossRef] [Scilit]
  3. Glaeser, E.L.; Kahn, M.E. The greenness of cities: Carbon dioxide emissions and urban development. J. Urban Econ. 2010, 67, 404–418. [Google Scholar] [CrossRef] [Scilit]
  4. Tanguay, G.A.; Rajaonson, J.; Lefebvre, J.F.; Lanoie, P. Measuring the sustainability of cities: An analysis of the use of local indicators. Ecol. Indic. 2010, 10, 407–418. [Google Scholar] [CrossRef] [Scilit]
  5. Tan, S.; Yang, J.; Yan, J.; Lee, C.; Hashim, H.; Chen, B. A holistic low carbon city indicator framework for sustainable development. Appl. Energy 2017, 185, 1919–1930. [Google Scholar] [CrossRef] [Scilit]
  6. Zhang, F.; Zhang, J.; Hussain, M. The Impact of Multidimensional Regional Integration on Low-Carbon Development: Empirical Evidence from the Yangtze River Delta. Land 2025, 14, 2071. [Google Scholar] [CrossRef] [Scilit]
  7. Jin, H.; Xiao, B.; Zeng, S. Tracking China’s green low-carbon circular developing economic system: A hybrid multi-criteria evaluation framework. Environ. Dev. Sustain. 2025, 1–36. [Google Scholar] [CrossRef] [Scilit]
  8. Shmelev, S.E. Comparative multidimensional assessment of progress towards sustainability at the macro scale: The cases of 12 OECD countries, China, and Brazil. Sustainability 2025, 17, 7772. [Google Scholar] [CrossRef] [Scilit]
  9. Shmelev, S.E.; Lefievre, N.; Saadi, N.; Shmeleva, I.A. Interdisciplinary linkages among sustainability dimensions in the context of European cities and regions research. Sustainability 2023, 15, 14738. [Google Scholar] [CrossRef] [Scilit]
  10. Zhang, L.; Wu, J.; Xu, Y.; Yeh, C.H.; Zhou, P.; Fang, J. A data-driven approach to objective evaluation of urban low carbon development performance. J. Clean. Prod. 2022, 368, 133238. [Google Scholar] [CrossRef] [Scilit]
  11. Zhang, R.; Ma, Y.; Ren, J. Green development performance evaluation based on dual perspectives of level and efficiency: A case study of the Yangtze River Economic belt, China. Int. J. Environ. Res. Public Health 2022, 19, 9306. [Google Scholar] [CrossRef] [Scilit]
  12. Shen, C.; Zhang, J. K-means and RS based DEA model and its application in Chinese low-carbon efficiency. Commun. Stat.-Theory Methods 2025, 54, 6916–6938. [Google Scholar] [CrossRef] [Scilit]
  13. Yang, H.; Zhang, X.; Liu, B.; Huang, Y. Evaluation of green low-carbon innovation development efficiency: An improved two-stage non-cooperative DEA model. J. Clean. Prod. 2023, 400, 136662. [Google Scholar] [CrossRef] [Scilit]
  14. Xu, X.; Chen, L.; Du, X.; Chen, Q.; Yuan, R. Development pathways for low carbon cities in China: A dual perspective of effectiveness and efficiency. Ecol. Indic. 2024, 169, 112848. [Google Scholar] [CrossRef] [Scilit]
  15. Jia, Y.; Huang, Y.; Zhou, J.; Sun, J. Construction of evaluation indicator system and analysis for low-carbon economy development in Chengdu City of China. Systems 2025, 13, 573. [Google Scholar] [CrossRef] [Scilit]
  16. Li, D.; Sun, Y.; Zhu, X.; Wang, Y.; Huang, G. Spatiotemporal evolution and clustering of low-carbon development at the county level: Evidence from Jiangsu Province, China. Environ. Dev. Sustain. 2025, 1–39. [Google Scholar] [CrossRef] [Scilit]
  17. Xin, L.; Li, S.; Di, Y.; Rene, E.R.; Bing, Q.; Ma, W. Multidimensional responsive carbon neutrality capacity assessment index system for megacity from carbon sinks, energy supply and consumption side: Coupled AHP-SD-RF model. Sustain. Cities Soc. 2025, 130, 106563. [Google Scholar] [CrossRef] [Scilit]
  18. Hezardastan, B.; Shmelev, S.E. Policy instruments for circular economy: Evidence-Based assessment of sustainable waste management in the UK and Finland. J. Clean. Prod. 2025, 533, 146914. [Google Scholar] [CrossRef] [Scilit]
  19. He, Y.; Liu, G. Coupling coordination analysis of low-carbon development, technology innovation, and new urbanization: Data from 30 provinces and cities in China. Front. Public Health 2022, 10, 1047691. [Google Scholar] [CrossRef] [Scilit]
  20. Zhang, K.; Yang, Y.; Wan, J.; Wei, J.; Zhang, X. Coupling synergy level and interaction effect between the ecological environment and low-carbon development in the Yangtze River Delta urban agglomeration: Characteristics of spatial and temporal heterogeneity. Ecol. Indic. 2024, 166, 112535. [Google Scholar] [CrossRef] [Scilit]
  21. Song, Q.; Zhou, N.; Liu, T.; Siehr, S.A.; Qi, Y. Investigation of a “coupling model” of coordination between low-carbon development and urbanization in China. Energy Policy 2018, 121, 346–354. [Google Scholar] [CrossRef] [Scilit]
  22. Wang, Z.; Wang, X.; Li, H.; Tao, H.; Rao, Y. Evolutionary Analysis of the Spatiotemporal Dynamics of Coupled Coordination of Digital Economy, New Urbanization, and Low-Carbon Development in China. J. Urban Plan. Dev. 2025, 151, 04025048. [Google Scholar] [CrossRef] [Scilit]
  23. Yu, S.; Liu, J.; Zhou, S. Synergy evaluation of China’s economy–energy low-carbon transition and its improvement strategy for structure optimization. Environ. Sci. Pollut. Res. 2022, 29, 65061–65076. [Google Scholar] [CrossRef] [Scilit]
  24. Yi, M.; Guan, Y.; Wu, T.; Wen, L.; Sheng, M.S. Assessing China’s synergistic governance of emission reduction between pollutants and CO2. Environ. Impact Assess. Rev. 2023, 102, 107196. [Google Scholar] [CrossRef] [Scilit]
  25. Sun, Z.; Guan, H.; Zhao, A. Research on the synergistic effect of the composite system for high-quality development of the marine economy in China. Systems 2023, 11, 282. [Google Scholar] [CrossRef] [Scilit]
  26. Ning, X.; Zhang, G.; Li, L. Synergistic evolution of urban twin transformations and carbon emission reduction in the construction industry. Sustain. Cities Soc. 2025, 135, 106952. [Google Scholar] [CrossRef] [Scilit]
  27. Zhou, X.; Chen, X.; Wang, T.; Huang, J.; Zhou, G. Towards low-carbon and resilient cities: Coordinated development and its driving factors in 29 Chinese cities. Sustain. Cities Soc. 2025, 131, 106790. [Google Scholar] [CrossRef] [Scilit]
  28. Wang, S.J.; Kong, W.; Ren, L.; Zhi, D.D. Research on misuses and modification of coupling coordination degree model in China. J. Nat. Resour. 2021, 36, 793–810. [Google Scholar] [CrossRef] [Scilit]
  29. Wang, A.; Liang, S.; Wang, S. Coupling coordination development of water resources-economy-ecology system in Shanxi Province based on system dynamics. Sci. Rep. 2025, 15, 7370. [Google Scholar] [CrossRef] [Scilit] [PubMed]
  30. Zhang, Q.; Bee, H.; Wang, Y.; He, J. Coupling coordination and sustainability among water resource carrying capacity, urbanization, and economic development based on the integrated model. Front. Environ. Sci. 2025, 13, 1563946. [Google Scholar] [CrossRef] [Scilit]
  31. Mu, X.; Kong, L.; Tu, C.; Chen, J.; Hu, G. Correlation and synergy analysis of urban economy–energy–environment system—A case study of Beijing. Nat. Resour. Model. 2022, 35, e12329. [Google Scholar] [CrossRef] [Scilit]
  32. Chen, H.; Niu, D.; Zhang, X. Examining the carbon spillover effect of the economy–energy–environment system synergy: A validation based on panel data from 31 Provinces in China. Environ. Dev. Sustain. 2025, 1–32. [Google Scholar] [CrossRef] [Scilit]
  33. He, X.; Zeng, S. Measurement, Spatial-Temporal Evolution, and Optimization Path of the Level of Coordinated Development of Ecological Civilisation: The Case of China. Sustainability 2024, 16, 2126. [Google Scholar] [CrossRef] [Scilit]
  34. Cen, H.; Wang, W.; Chen, L.; Hao, W.; Guan, Z.; Lu, J.; Cai, G. Multi-Scenario Research on the Coupled and Coordinated Development of the Economic–Energy–Environmental (3E) System under the Reconstruction of the Power System—New Exploration Based on the “Dual Triangle” Theory. Energies 2024, 17, 3468. [Google Scholar] [CrossRef] [Scilit]
  35. Xie, Y.; Sun, Y.; Zhang, T.; Chen, X.L.; Deng, X.; Gao, Z.; Song, M. Coupling coordination analysis of the energy–economy–environment–society system from an energy transition perspective. Energy 2025, 337, 138709. [Google Scholar] [CrossRef] [Scilit]
  36. Jia, J.; Fan, Y.; Guo, X. The low carbon development (LCD) levels’ evaluation of the world’s 47 countries (areas) by combining the FAHP with the TOPSIS method. Expert Syst. Appl. 2012, 39, 6628–6640. [Google Scholar] [CrossRef] [Scilit]
  37. Qu, Y.; Liu, Y. Evaluating the low-carbon development of urban China. Environ. Dev. Sustain. 2017, 19, 939–953. [Google Scholar] [CrossRef] [Scilit]
  38. Wang, Y.; Fang, X.; Yin, S.; Chen, W. Low-carbon development quality of cities in China: Evaluation and obstacle analysis. Sustain. Cities Soc. 2021, 64, 102553. [Google Scholar] [CrossRef] [Scilit]
  39. Du, H.; Chen, Z.; Mao, G.; Li, R.Y.M.; Chai, L. A spatio-temporal analysis of low carbon development in China’s 30 provinces: A perspective on the maximum flux principle. Ecol. Indic. 2018, 90, 54–64. [Google Scholar] [CrossRef] [Scilit]
  40. Guo, X.; Li, J.; Ma, Y.; Chen, X.; Li, Y. Study on the coupling and coordination between urban resilience and low-carbon development of central plains urban agglomeration. Sustainability 2023, 15, 16748. [Google Scholar] [CrossRef] [Scilit]
  41. Xin, L.; Sun, H.; Xia, X. Spatial–temporal differentiation and dynamic spatial convergence of inclusive low-carbon development: Evidence from China. Environ. Sci. Pollut. Res. 2023, 30, 5197–5215. [Google Scholar] [CrossRef] [Scilit]
  42. Tang, Y.; Yuan, Y.; Tian, B. Assessment of spatio-temporal evolution trends and driving factors of green development in Harbin-Changchun urban agglomeration. Sci. Rep. 2023, 13, 16785. [Google Scholar] [CrossRef] [Scilit]
  43. Shen, L.; Du, X.; Cheng, G.; Shi, F.; Wang, Y. Temporal-spatial evolution analysis on low carbon city performance in the context of China. Environ. Impact Assess. Rev. 2021, 90, 106626. [Google Scholar] [CrossRef] [Scilit]
  44. Liang, H.; Zeng, Y.; Jiang, X.; Li, Y. Dynamic evaluation of low-carbon development in China’s power industry and the impact of carbon market policies. Heliyon 2023, 9, e13467. [Google Scholar] [CrossRef] [Scilit]
  45. Xiang, C.; Li, Y.; Liu, N. Evaluation of urban low-carbon development efficiency: Evidence from 30 cities in China. Environ. Res. Commun. 2024, 6, 095030. [Google Scholar] [CrossRef] [Scilit]
  46. Wang, S.; Gao, S.; Huang, Y.; Shi, C. Spatiotemporal evolution of urban carbon emission performance in China and prediction of future trends. J. Geogr. Sci. 2020, 30, 757–774. [Google Scholar] [CrossRef] [Scilit]
  47. Yang, G.; Gui, Q.; Supanyo, P.; Zhang, F.; Yang, X.; Gong, G. Temporal and spatial changes and influencing factors of low-carbon economy efficiency in China. Environ. Monit. Assess. 2023, 195, 55. [Google Scholar] [CrossRef] [Scilit] [PubMed]
  48. Meadows, D.H.; Meadows, D.L.; Randers, J.; Behrens, W.W. The Limits to Growth; Universe Books: New York, NY, USA, 1972. [Google Scholar]
  49. Brundtland, G.H. World commission on environment and development. Environ. Policy Law 1985, 14, 26–30. [Google Scholar] [CrossRef] [Scilit] [PubMed]
  50. Zhao, X.; Zhang, Y.; Liang, J.; Li, Y.; Jia, R.; Wang, L. The sustainable development of the economic-energy-environment (3E) system under the carbon trading (CT) mechanism: A Chinese case. Sustainability 2018, 10, 98. [Google Scholar] [CrossRef] [Scilit]
  51. Liu, N.; Liu, C.; Xia, Y.; Da, B. Examining the coordination between urbanization and eco-environment using coupling and spatial analyses: A case study in China. Ecol. Indic. 2018, 93, 1163–1175. [Google Scholar] [CrossRef] [Scilit]
  52. Dong, Q.; Zhong, K.; Liao, Y.; Xiong, R.; Wang, F.; Pang, M. Coupling coordination degree of environment, energy, and economic growth in resource-based provinces of China. Resour. Policy 2023, 81, 103308. [Google Scholar] [CrossRef] [Scilit]
  53. Haken, H. Synergetics—An Introduction: Nonequilibrium Phase Transitions and Self-Organization in Physics, Chemistry and Biòlogy; Springer: Berlin, Germany, 1977. [Google Scholar]
  54. Haken, H. Synergetics: An approach to self-organization. In Self-Organizing Systems: The Emergence of Order; Springer: Boston, MA, USA, 1987; pp. 417–434. [Google Scholar]
  55. Mainzer, K.; Landauer, R. Thinking in Complexity: The Complex Dynamics of Matter, Mind, and Mankind; Springer: Berlin, Germany, 1997; Volume 3. [Google Scholar]
  56. Kou, Z.L.; Liu, X.Y. FIND Report on City and Industrial Innovation in China (2017); Fudan Institute of Industrial Development, School of Economics, Fudan University: Shanghai, China, 2017. [Google Scholar]
  57. Liu, H.; He, C. The mechanism and empirical test of green finance promoting high-quality urban economic development: Evidence from 272 prefecture-level cities in China. Investig. Res. 2021, 40, 37–52. (In Chinese) [Google Scholar]
  58. Xu, X.; Wang, Y. Measurement, regional disparity decomposition, and dynamic evolution of rural revitalization in China. J. Quant. Technol. Econ. 2022, 39, 64–83. [Google Scholar] [CrossRef]
  59. Fan, G.; Wang, X.; Ma, G. NERI Index of Marketization of China’s Provinces 2021 Report; Economic Science Press: Beijing, China, 2021. [Google Scholar]
  60. Wu, C. Synergistic effects of low-carbon economic development in China. Manag. World 2021, 37, 105–117. (In Chinese) [Google Scholar]
  61. Yang, Z.; Liu, J.; Xing, Q. Evaluation of synergy between low-carbon development and socio-economic development based on a composite system: A case study of Anhui Province (China). Sci. Rep. 2022, 12, 20294. [Google Scholar] [CrossRef] [Scilit] [PubMed]
  62. Siciliano, G.; Wallbott, L.; Urban, F.; Dang, A.N.; Lederer, M. Low-carbon energy, sustainable development, and justice: Towards a just energy transition for the society and the environment. Sustain. Dev. 2021, 29, 1049–1061. [Google Scholar] [CrossRef] [Scilit]
  63. Fan, C.C. Uneven development and beyond: Regional development theory in post-Mao China. Int. J. Urban Reg. Res. 1997, 21, 620–639. [Google Scholar] [CrossRef] [Scilit]
  64. Anselin, L. Local indicators of spatial association—LISA. Geogr. Anal. 1995, 27, 93–115. [Google Scholar] [CrossRef] [Scilit]
  65. Elhorst, J.P. Spatial Econometrics: From Cross-Sectional Data to Spatial Panels; Springer: Heidelberg, Germany, 2014; Volume 479, p. 480. [Google Scholar]
Figure 1. Theoretical analysis framework.
Land 15 00504 g001
Figure 2. Evaluation framework for low-carbon coordinated development.
Land 15 00504 g002
Figure 3. Boxplots of the order degrees of the 3E1S subsystems.
Land 15 00504 g003
Figure 4. Kernel density curves of the order degrees of the 3E1S subsystems.
Land 15 00504 g004
Figure 5. Spatial distribution of the 3E1S subsystem order degree: (ah) economic subsystem (2005–2020); (ip) energy subsystem (2005–2020); (qx) environmental subsystem (2005–2020); (yaf) social subsystem (2005–2020).
Land 15 00504 g005
Figure 6. Spatial pattern changes of the order degrees of the 3E1S subsystems.
Land 15 00504 g006
Figure 7. Boxplots of the urban composite system synergy degree.
Land 15 00504 g007
Figure 8. Kernel density curves of the urban composite system synergy degree.
Land 15 00504 g008
Figure 9. Spatiotemporal map evolution of the urban composite system synergy degree.
Land 15 00504 g009
Figure 10. Spatial pattern changes of the urban composite system synergy degree.
Land 15 00504 g010
Table 1. Evaluation indicator system for low-carbon coordinated development.
DimensionOrder ParameterOrder VariableAttribute
EnergyEnergy structureShare of coal consumption (%)
Share of manufactured gas and natural gas consumption (%)+
Share of liquefied petroleum gas consumption (%)+
Energy intensity (10,000 tons of standard coal/CNY 10 billion)
Energy consumptionTotal supply of manufactured gas and natural gas (10,000 m3)
Total supply of liquefied petroleum gas (tons)
Total electricity consumption (10,000 kWh)
Total energy consumption (10,000 tons of standard coal)
EconomyEconomic scaleGross domestic product (CNY 10 billion)+
GDP per capita (CNY)+
Total retail sales of consumer goods (CNY 10,000)+
General public budget expenditure (CNY 10,000)+
Economic structureShare of secondary industry in GDP (%)
Share of tertiary industry value added in GDP (%)+
Share of employment in the tertiary industry (%)+
Industrial structure upgrading index+
EnvironmentEnvironmental pollutionCarbon dioxide emissions (tons)
Sulfur dioxide emissions (tons)
PM2.5 emissions (tons)
Nitrogen oxides emissions (tons)
Environmental governanceSulfur dioxide removal rate (%)+
Industrial smoke and dust removal rate (%)+
Comprehensive utilization rate of industrial solid waste (%)+
Domestic wastewater treatment rate (%)+
SocietyPublic servicesNumber of urban public buses and trolleybuses in operation (units)+
Area of public green space (hectares)+
Green coverage area in built-up areas (hectares)+
Road area (10,000 m2)+
Social developmentUrban innovation index+
Green finance index+
Rural revitalization index+
Marketization index+
Table 2. Moran’s I results for the order degrees of the 3E1S subsystems.
YearEnergy SubsystemEconomic SubsystemEnvironmental SubsystemSocial Subsystem
20050.0691 ***0.0529 **0.1342 ***0.0931 ***
20060.0651 ***0.0511 **0.1027 ***0.0363
20070.0646 ***0.1377 ***0.0896 ***0.0901 ***
20080.0552 **0.1741 ***0.0630 **0.1358 ***
2009−0.03580.1254 ***0.1047 ***0.1712 ***
2010−0.00670.1976 ***0.0650 ***0.2206 ***
2011−0.00400.2084 ***0.1148 ***0.2281 ***
2012−0.00050.1501 ***0.1452 ***0.1783 ***
20130.0977 *0.1883 ***0.0601 **0.1983 ***
20140.00630.1844 ***0.0507 **0.1669 ***
20150.00280.1121 ***0.02830.1009 ***
20160.0756 ***0.0559 **0.0553 **0.0775 ***
20170.0714 ***0.0444 *0.00060.0520 **
20180.0703 ***0.0400 *−0.00960.0195
20190.03630.0921 ***0.02270.0231
20200.0482 **0.1680 ***0.02280.1614 ***
Note: *, **, and *** denote significance at the 10%, 5%, and 1% levels, respectively; the same applies below.
Table 3. Moran’s I results for the urban composite system synergy degree.
YearComposite System Synergy Degree
20060.0242
20070.0120
20080.0520 ***
20090.0530 ***
2010−0.000
20110.0086
20120.0401 **
20130.0224
20140.0006
20150.0110
20160.0074
20170.0144
20180.0282 *
20190.0480 ***
20200.0372 **
Note: *, **, and *** denote significance at the 10%, 5%, and 1% levels, respectively; the same applies below.
Disclaimer/Publisher’s Note: The statements, opinions and data contained in all publications are solely those of the individual author(s) and contributor(s) and not of MDPI and/or the editor(s). MDPI and/or the editor(s) disclaim responsibility for any injury to people or property resulting from any ideas, methods, instructions or products referred to in the content.