2. Materials and Methods
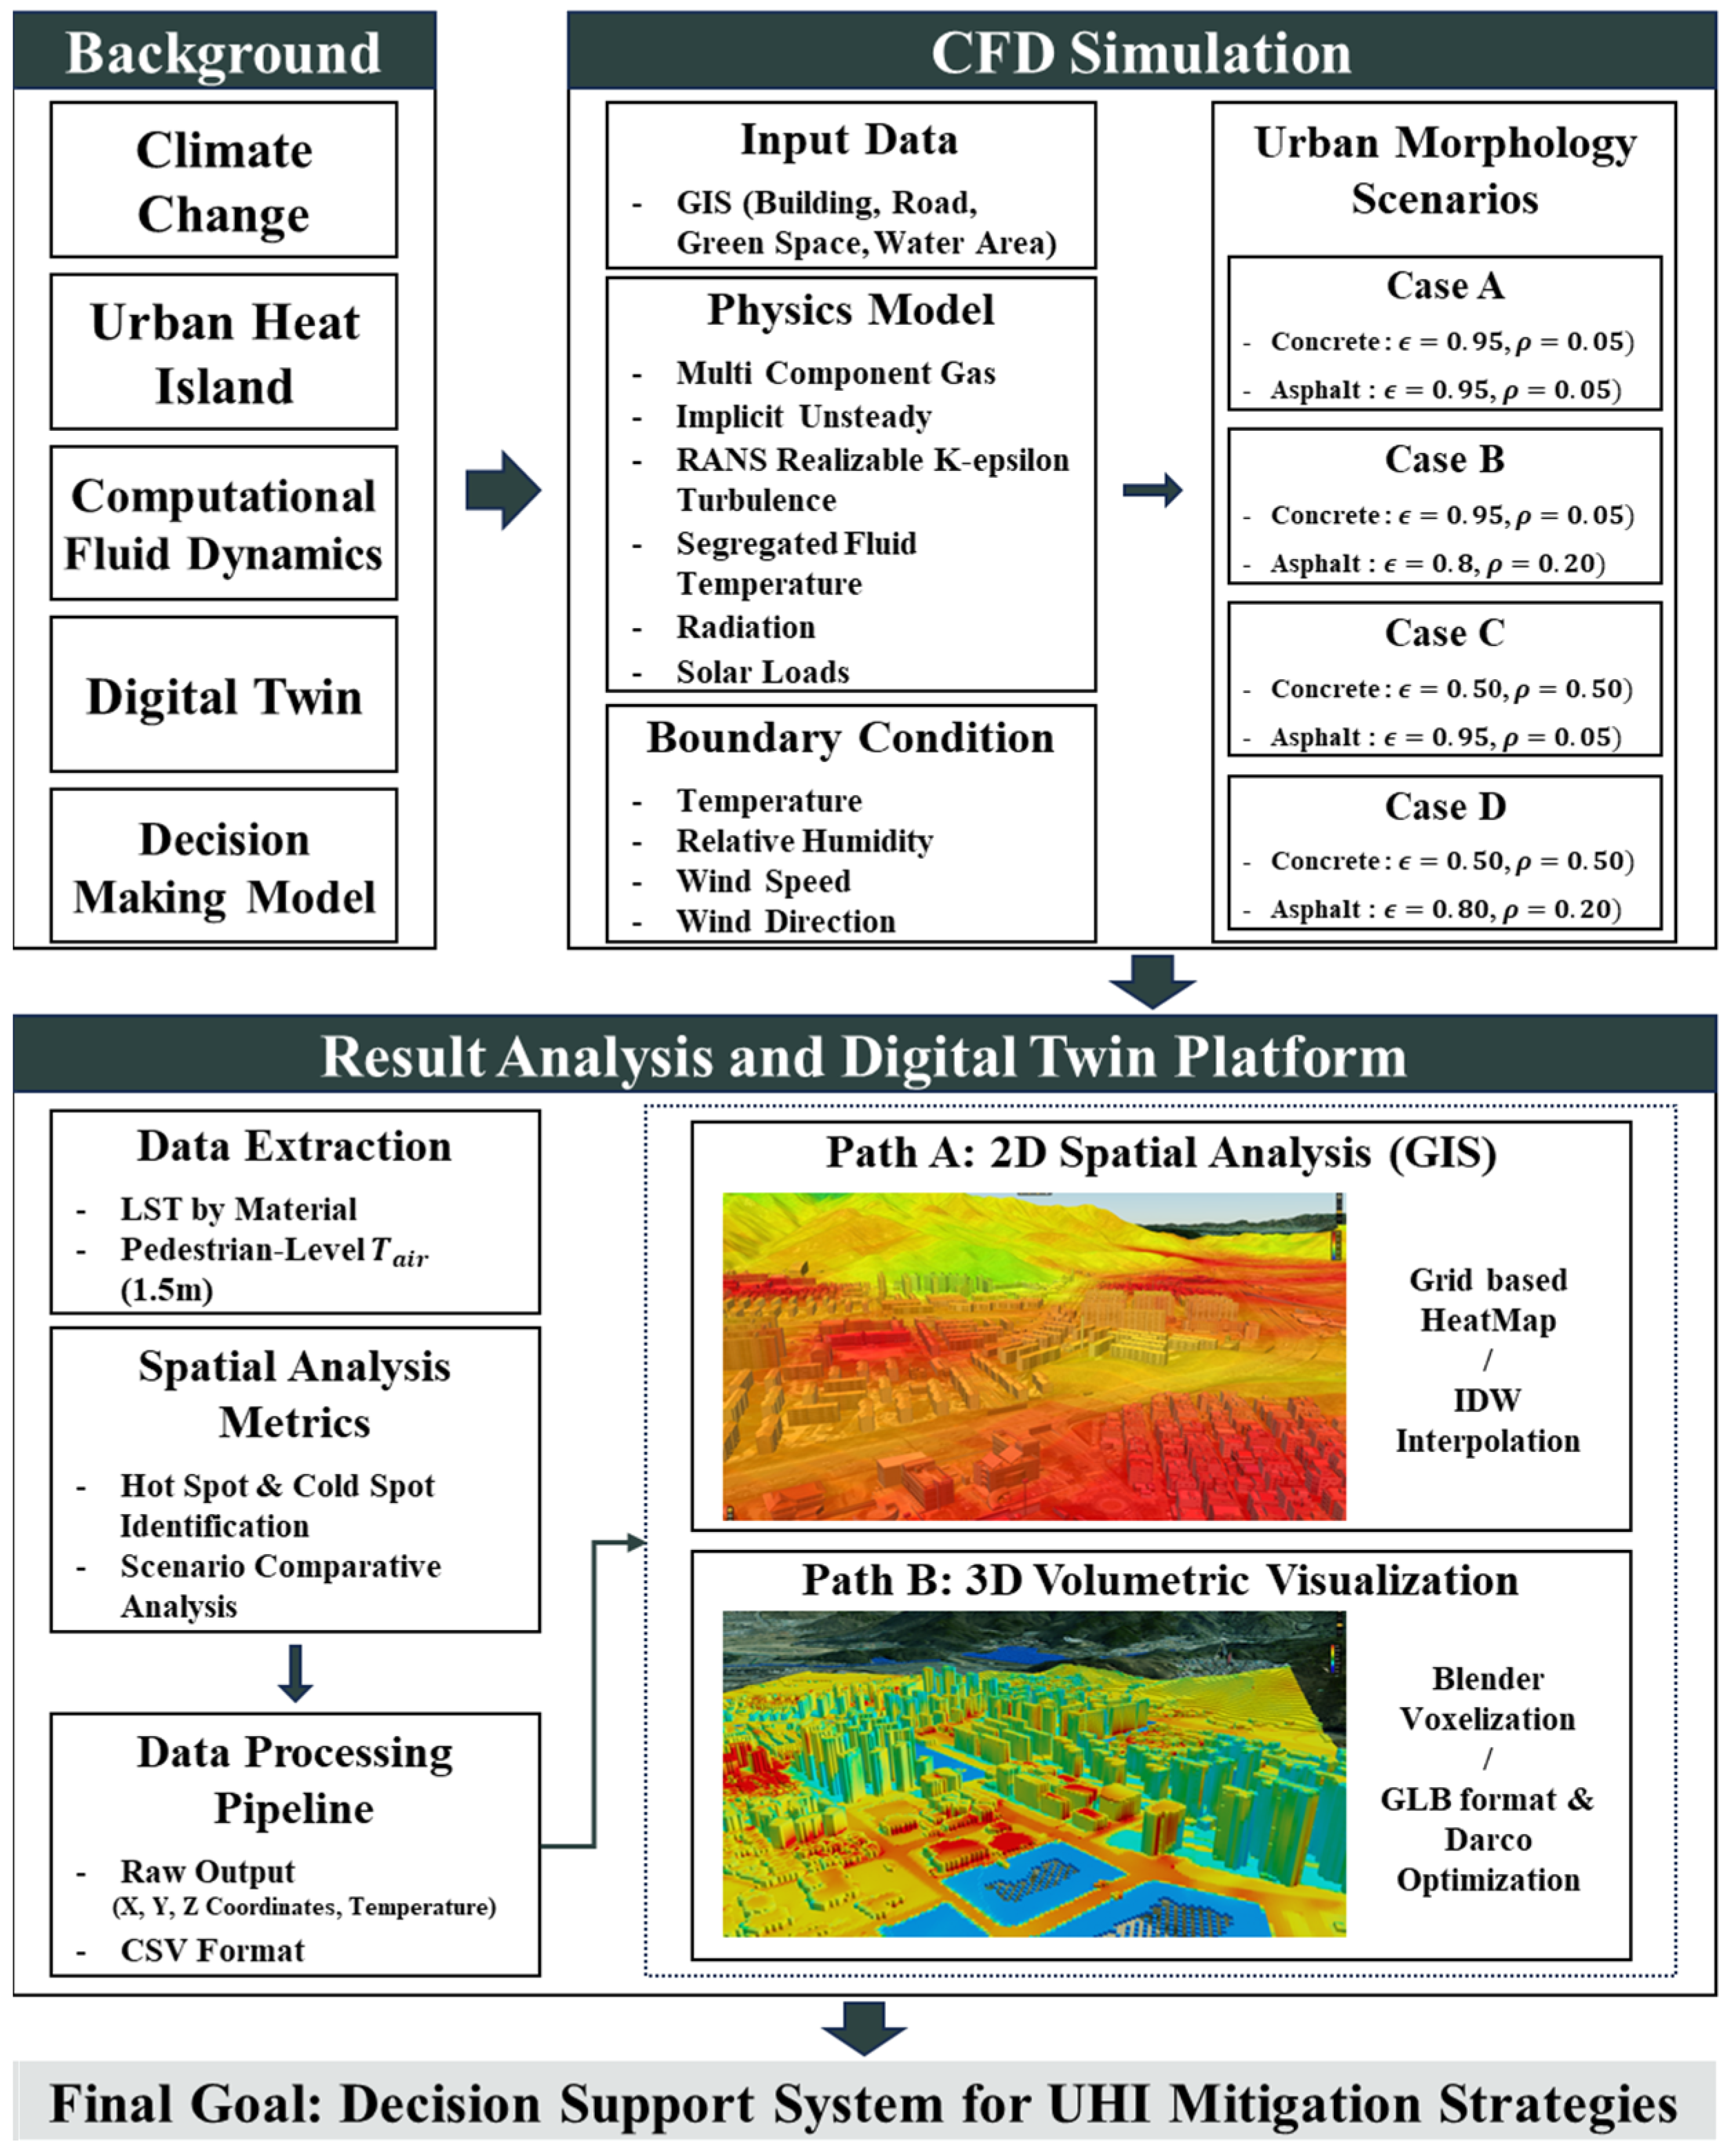
The comprehensive methodological framework of this study is systematically structured as illustrated in
Figure 1, encompassing a sequential progression that integrates geographic information system (GIS) data synthesis, three-dimensional (3D) geometric modeling, and computational fluid dynamics (CFD) simulations, culminating in the development of a digital twin visualization platform for comparative scenario analysis.
Initially, to precisely characterize the spatial configuration of the target research site, multi-layered spatial datasets—including building footprints, hydrological features, road networks, and the distribution of urban green spaces—were meticulously collected and analyzed to identify key spatial elements contributing to the formation of the urban thermal environment. These GIS-based analytical outputs served as a fundamental parameter for defining the CFD computational domain, assigning material-specific thermophysical properties such as emissivity and thermal conductivity, and establishing rigorous boundary conditions essential for accurate numerical modeling.
Following the data acquisition phase, a high-fidelity 3D geometric model of the study area was constructed using Rhino 8, which was subsequently imported into commercial CFD software STAR-CCM+ 2310, to establish a sophisticated simulation environment. This integration involved the generation of optimized computational meshes, the selection of appropriate turbulence models—specifically, the RANS Realizable K-Epsilon model and radiation physics—as well as the application of dynamic boundary conditions including Solar Loads and ambient meteorological data.
In this study, four distinct simulation scenarios (Case A to Case D) were devised based on the optimization of surface emissivity for asphalt and concrete, allowing for a rigorous comparative assessment of the thermal mitigation effects. The analysis specifically focused on identifying the spatial extent and occurrence patterns of urban “Hot Spots” and “Cool Spots”, while simultaneously evaluating time series surface temperature fluctuations and atmospheric temperature variations at the pedestrian level (1.5 m) across the different scenarios.
In the final stage, a 3D digital twin model was developed by integrating the derived thermal environmental data, enabling a spatio-temporal visualization of temperature shifts and a comparative analysis of scenario-based impacts. By intuitively representing the complex patterns of urban heat through a Blender-based digital twin platform, this research ultimately aims to provide a robust decision-making support model that can be effectively utilized by urban planners and policymakers to formulate strategic interventions for enhancing urban thermal environments.
To facilitate a clear understanding of the experimental design, the key elements described in
Figure 1 are synthesized into an “Inputs–Models–Outputs” framework in
Table 1. This summary highlights the transition from raw data acquisition to the final digital twin output.
2.1. Study Area: Gwacheon City—Burim- and Byeoryang-Dong
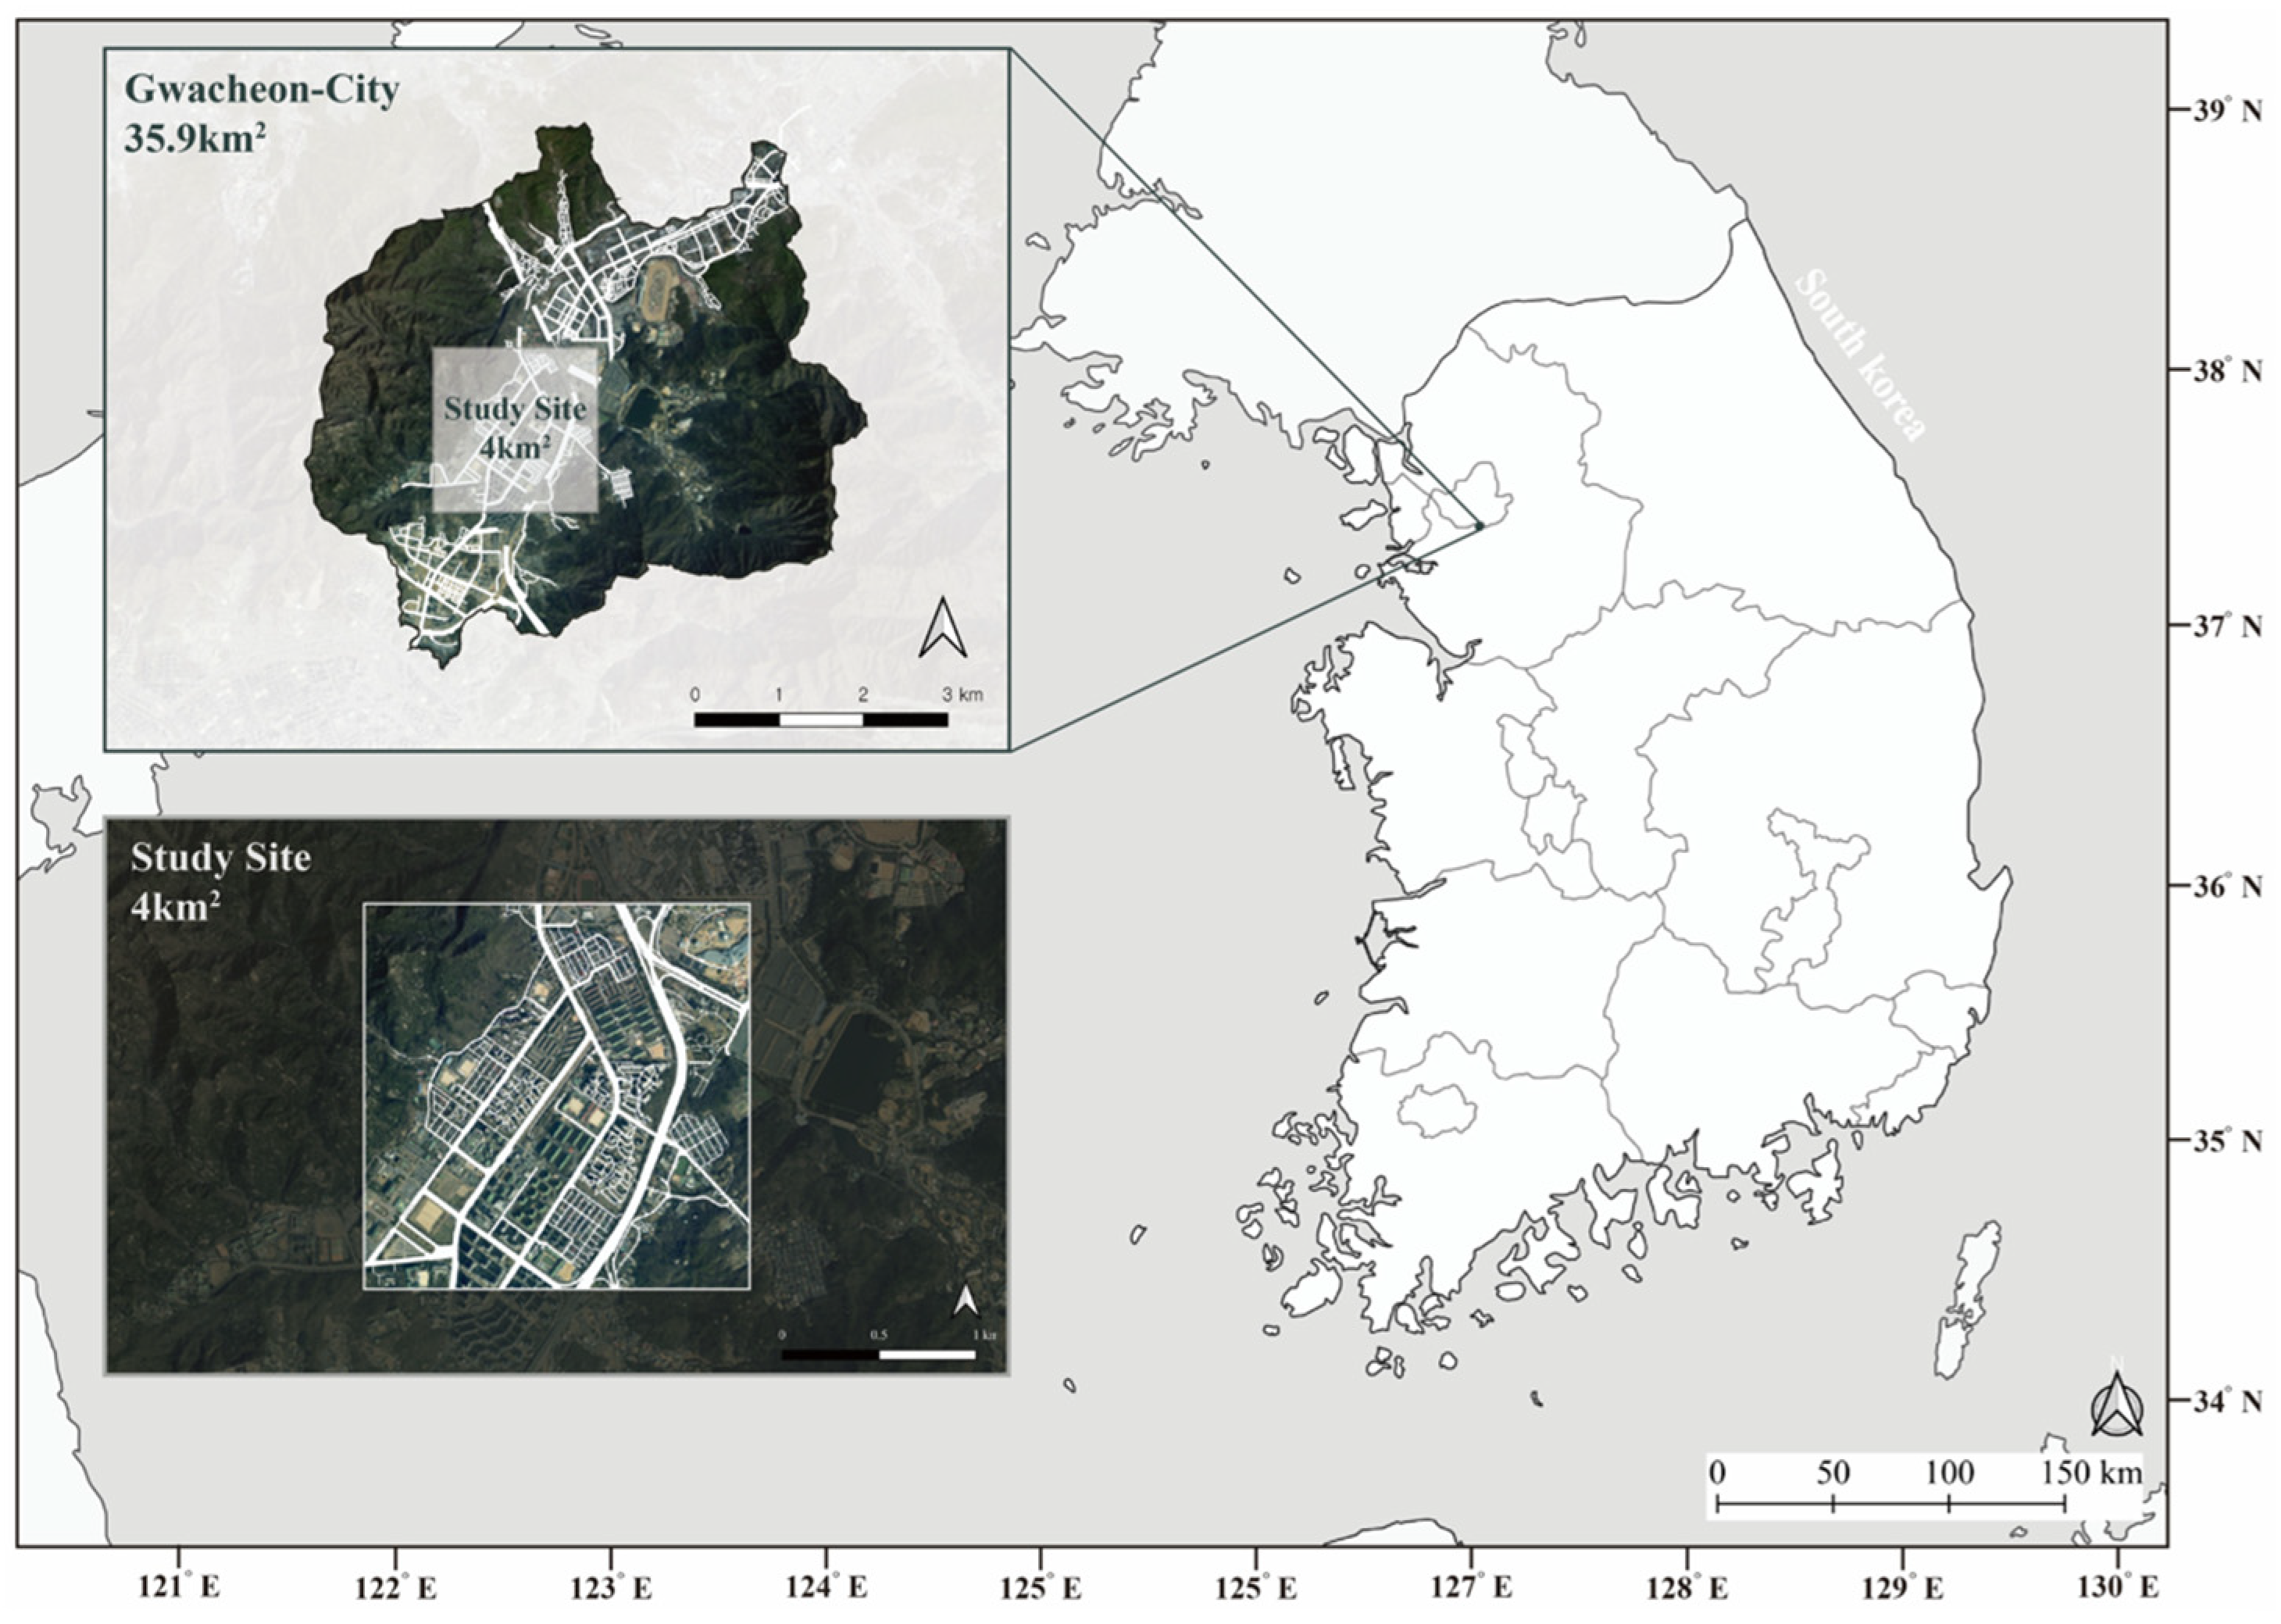
This study designates the areas of Byeoryang-dong and Burim-dong in Gwacheon City, Gyeonggi-do, Republic of Korea, as the primary research site, encompassing a total area of approximately 4 km
2 (
Figure 2).
This region was selected for its unique suitability for urban thermal environment and climate change mitigation strategy analysis based on the following criteria:
Gwacheon is characterized as a classic inland basin, surrounded by Mt. Gwanak (629 m) to the northwest and Mt. Cheonggye (618 m) to the east [
30]. This topographical configuration inherently restricts atmospheric circulation, making the area susceptible to temperature inversion phenomena. During the summer, heat often becomes trapped within the basin, significantly intensifying the UHI effect. Such environmental conditions provide an ideal setting for simulating and observing sensitive thermal fluctuations resulting from modifications in surface cover.
- 2.
Urban Planning Context: Coexistence of Planned Infrastructure and Redevelopment
Established in 1982, alongside the construction of the Government Complex Gwacheon, the city serves as a representative example of early planned urban development in Republic of Korea. Its grid-like road networks and systematic land use zoning facilitate high-precision, data-driven spatial analysis. Furthermore, under the “2020 Gwacheon Master Plan for Urban and Residential Environment Improvement”, the area is currently undergoing a major structural transformation as low-to-midrise complexes are replaced by high-rise residential developments [
30]. This transition allows for a multi-faceted analysis of how varying building heights influence solar shading, wind paths, and surface temperature distributions within a single computational domain.
- 3.
Strategic Significance as a Climate Demonstration City
Gwacheon holds high practical value as a site for demonstrating advanced climate technologies. It was at the forefront of national projects aimed at developing AI and digital twin-based climate prediction models to minimize environmental damage. The city’s distinct UHI characteristics—which are often pronounced enough to cause localized meteorological differences compared with neighboring Seoul—render it a highly reliable and representative environment for validating the field applicability of the decision-making model proposed in this study.
- 4.
Climatic Characteristics in Gwacheon City
Gwacheon City experiences a humid continental climate with four distinct seasons. Based on 2025 meteorological data from the Gwacheon Automatic Weather Station, the annual mean temperature is 13.1 °C, with monthly averages ranging from −13.5 °C in January to 37.4 °C during summer heat waves. Annual precipitation totals approximately 1477 mm, with the majority concentrated during the monsoon season (June–August). The combination of high summer temperatures (mean maximum temperature: 18.8 °C), basin topography restricting ventilation, and dense urban infrastructure makes the study area particularly vulnerable to urban heat island effects during extreme heat events, underscoring the importance of evaluating thermal mitigation strategies.
2.2. Geometry and CFD Model Configuration
To quantitatively evaluate the impact of urban surface material modifications on the thermal environment, this study developed a CFD model encompassing the areas of Byeoryang-dong and Burim-dong in Gwacheon. Numerical simulations were conducted using the commercial CFD software package STAR-CCM+ 2310, which solves the Reynolds-Averaged Navier–Stokes (RANS) equations based on the Finite Volume Method (FVM) [
31,
32,
33,
34]. STAR-CCM+ is widely recognized in urban microclimate research for simulating coupled multi-physics phenomena, including convection, radiation, and conduction, within complex urban geometries. Its integrated functionalities for complex heat transfer, radiation modeling, and unsteady flow analysis make it particularly suitable for investigating UHI effects and thermal fluctuations driven by surface material transitions.
For the construction of the three-dimensional urban model, geospatial data including contour lines, elevation points, building footprints, hydrological features, and road networks were acquired from the National Geographic Information Institute (NGII) [
35]. These datasets were processed using the Grasshopper algorithm within Rhino 8.0 to generate a comprehensive 3D representation of the terrain and architectural structures [
36,
37]. The core computational domain was defined as 2 km × 2 km; however, to ensure the full development of the atmospheric boundary layer at the inlet and to allow for the stable dissipation of wakes at the outlet, a 1 km buffer zone was established around the periphery, resulting in a total domain size of 4 km × 4 km [
38,
39]. The vertical height of the domain was set to approximately 850 m, which exceeds six times the height of the tallest building (approx. 100 m) in the study area, thereby satisfying the domain height criteria to minimize artificial flow acceleration and upper boundary interference. Furthermore, a slip condition was applied to the upper boundary to simulate free-atmosphere conditions, while the subsurface region was modeled to a depth of a 100 m to stably reflect the thermal capacity and conductivity of the soil during unsteady-state simulations.
In the FVM, optimizing the mesh resolution for different components is critical for achieving accurate thermal and flow results. Given the significant thermal and velocity gradients occurring at building surfaces and ground boundary layers, a relatively dense mesh was applied to these regions. In contrast, the upper atmospheric and lower subsurface regions were configured with coarser grids based on the established literature, as detailed in
Table 2. This meshing strategy resulted in the generation of approximately 21.2 million cells, comprising 1.95 million building-related cells and 6.1 million terrain-specific cells. Compared with the baseline mesh settings established in previous research by Kim et al. (2025), this configuration employs a significantly higher resolution to enhance both the visual fidelity of the digital twin platform and the numerical accuracy of the urban microclimate simulation [
29].
The computational grid generated using the configurations in
Table 2 is presented in
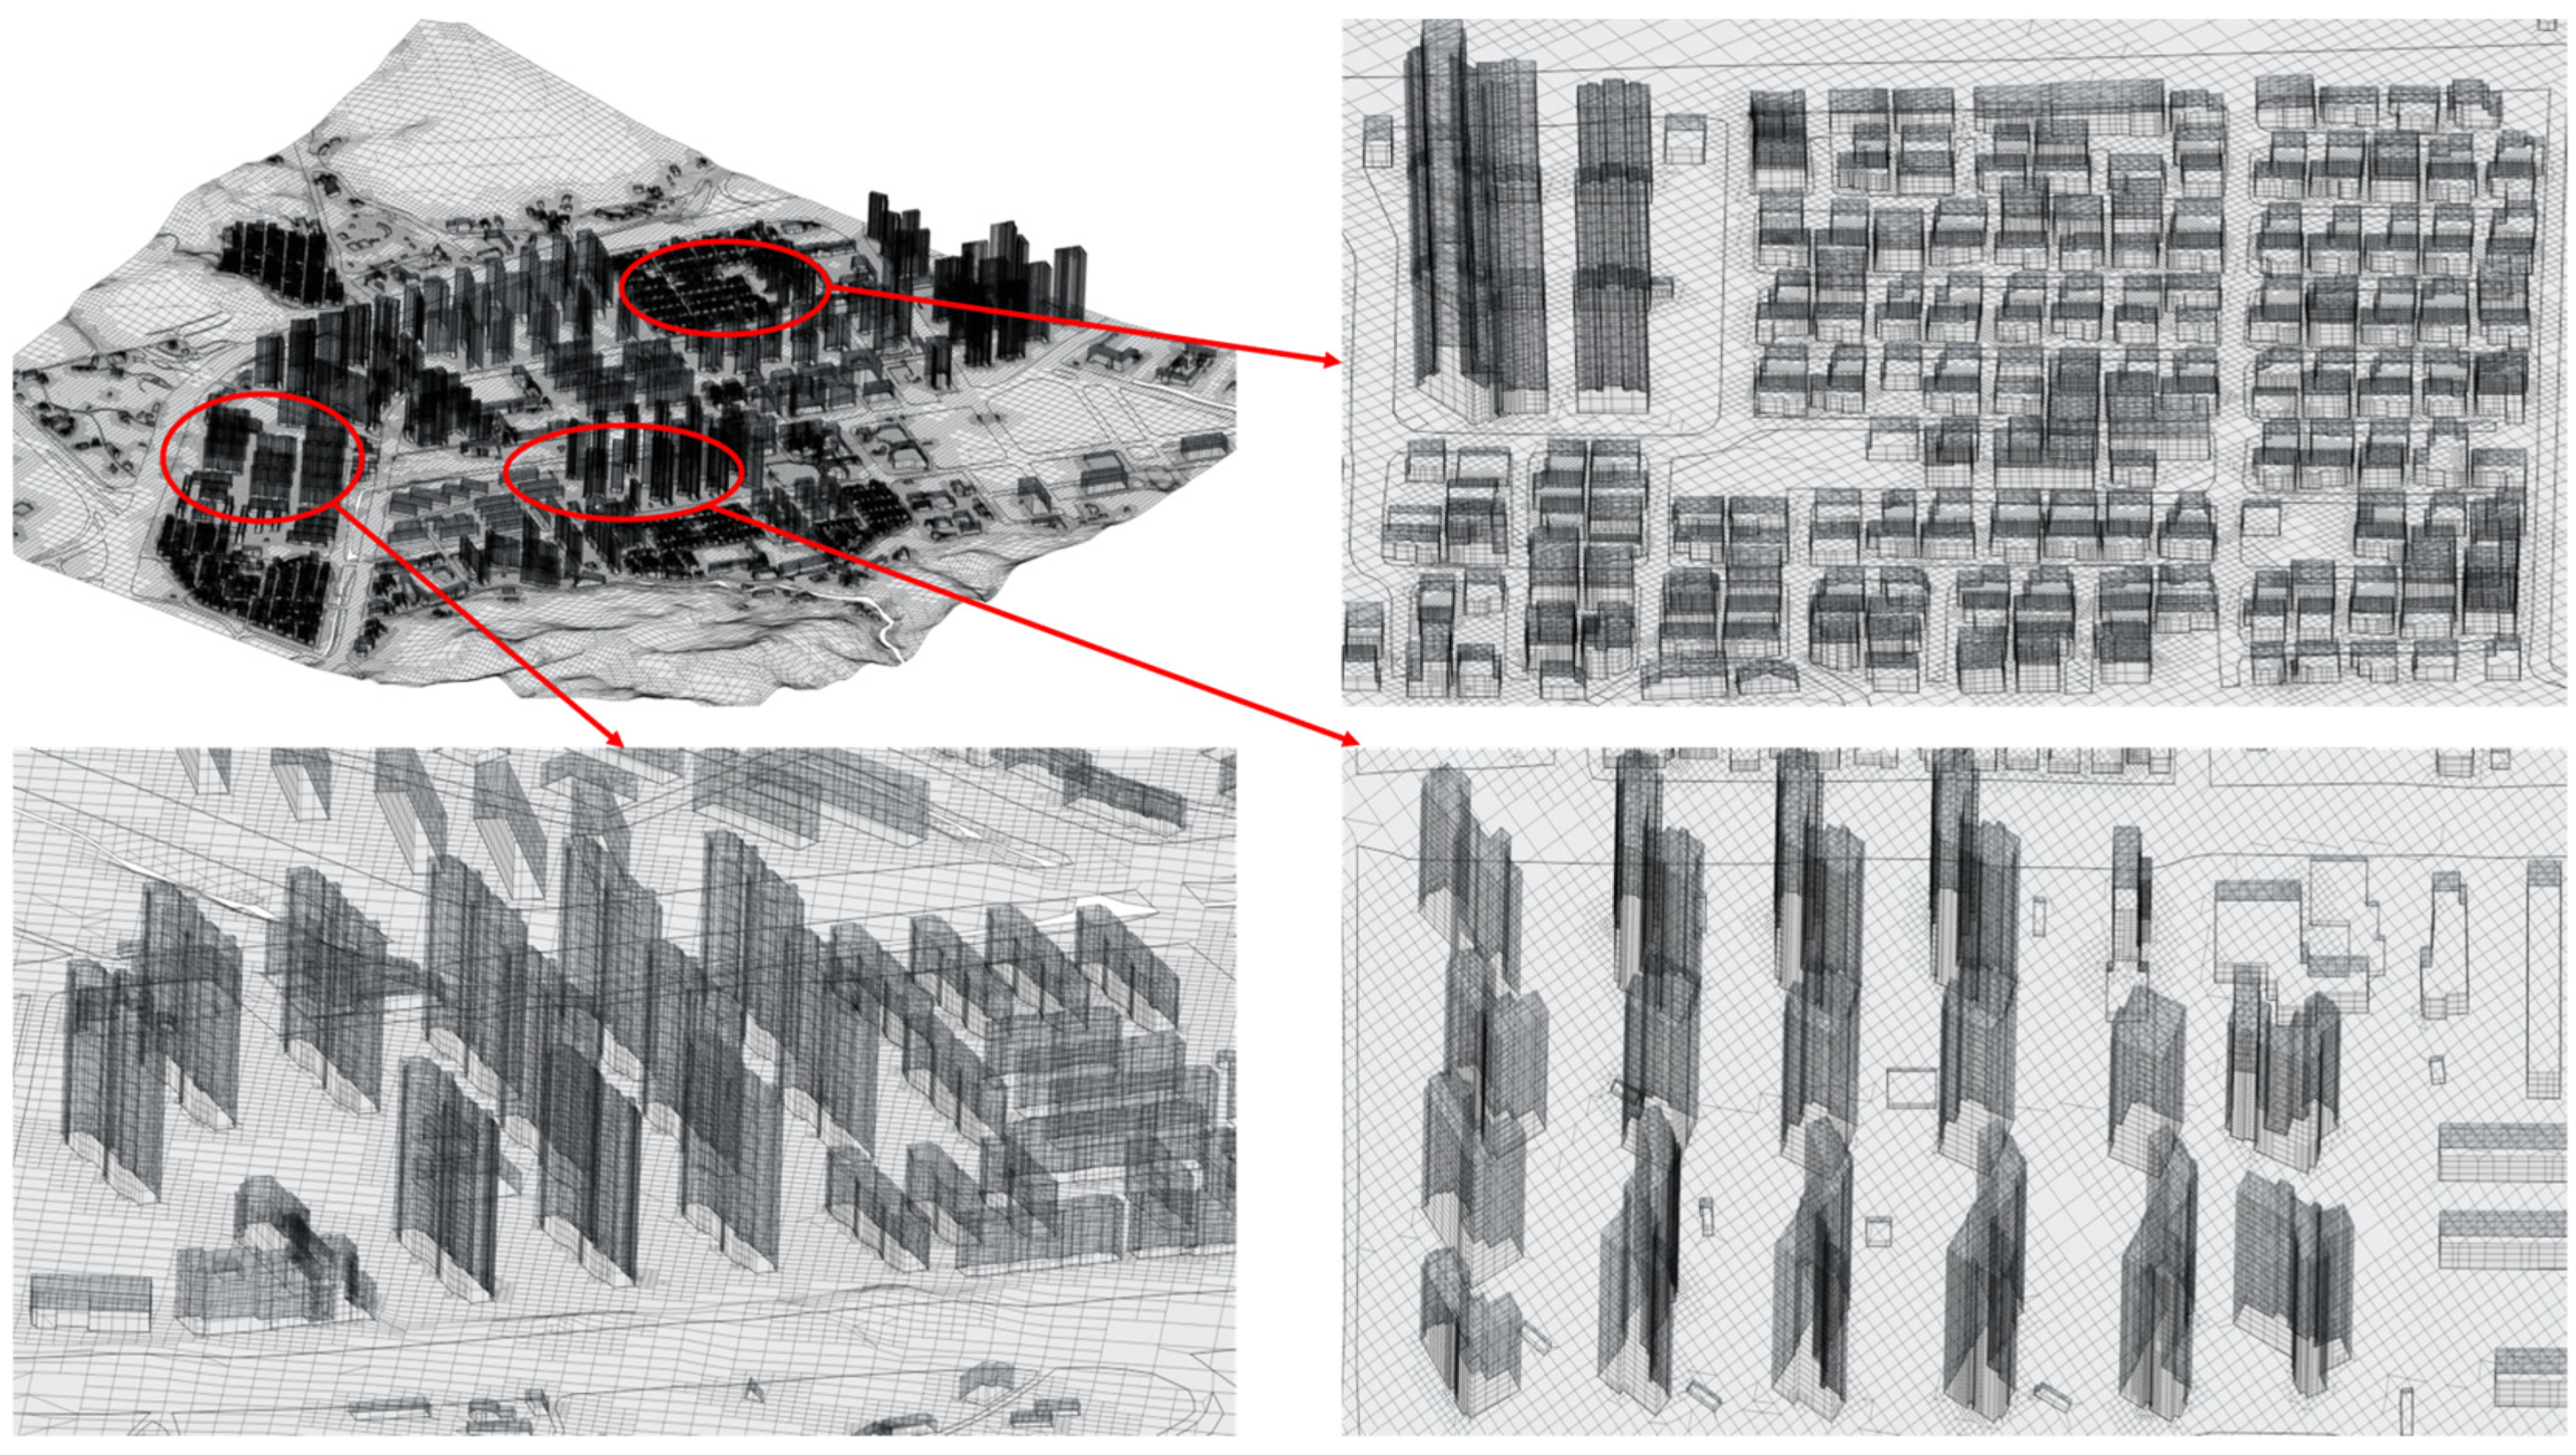
Figure 3.
Figure 3 illustrates the three-dimensional mesh structure of the study domain; the upper-left panel shows the full computational domain encompassing the entire 4 km × 4 km study area with building geometries and terrain features, while the remaining three panels provide magnified views of mesh refinement applied to specific sub-regions. These close-up views demonstrate the refined mesh resolution applied to building clusters, individual building surfaces, and ground-level features. The prism layer mesh visible in the magnified panels ensures the accurate resolution of thermal and velocity gradients within the boundary layer, which is essential for capturing surface heat transfer and convective cooling effects in the complex urban canopy.
Accurately replicating complex heat transfer phenomena—such as surface heating by solar radiation, longwave radiation exchange between buildings and the ground, and convective heat transfer between the atmosphere and surfaces—is paramount in CFD-based urban thermal analysis. Accordingly, this study integrated 22 distinct physical models, supplemented by 12 custom field functions developed specifically for evaluating surface temperatures by material type. Key models included the Realizable K-Epsilon Two-Layer turbulence model, Solar Loads, and Surface-to-Surface (S2S) Radiation.
The primary turbulence closure model employed in this study is the Realizable K-Epsilon Two-Layer model, which is a Reynolds-Averaged Navier–Stokes (RANS)-based formulation. This model was developed to overcome the limitations of the standard
model by satisfying mathematical constraints on the Reynolds stresses, consistent with the physics of turbulent flow. The two-layer approach enhances accuracy in the near-wall region by decomposing the domain into an inner layer and an outer layer, applying distinct treatment to the viscosity-affected regions. In this model, the transport for the turbulent kinetic energy (
) and the dissipation rate (
) are expressed as Equations (1) and (2).
where
denotes the dynamic viscosity,
is the turbulent (eddy) viscosity,
and
are the turbulent Prandtl numbers for
and
, respectively,
represents the production of turbulent kinetic energy,
is the modulus of the mean rate of the strain tensor, and
is the kinematic viscosity. The model constants
and
are assigned values of 1.44 and 1.9, respectively.
A key feature of the Realizable K-Epsilon model is the treatment of , which is calculated as a function of the mean strain and rotation rates, ensuring that the model remains consistent with the physical law of fluid motion. This formulation prevents the occurrence of non-physical negative values for the Reynolds normal stresses, which can arise in the standard model under high strain rates.
The S2S radiation model was particularly crucial for simulating the longwave radiative exchange between solid surfaces (e.g., walls, ground, roads) and accounting for multi-reflection effects within the urban canyon. Based on the Discrete Ordinates Method (DOM), this model calculates radiative heat transfer between diffuse and specular surfaces, incorporating radiative properties such as emissivity (), reflectivity (), and transmissivity ().
2.3. Boundary Conditions and Simulation Scenarios
The meteorological boundary conditions for the CFD simulation were established using observational data from the Korea Meteorological Administration (KMA) for Gwacheon City. 8 July 2025 was selected as the target date for the simulation, as the highest ambient air temperature in Gwacheon during the summer season of that year was recorded that day. The hourly meteorological variables including air temperature, relative humidity, wind speed, and wind direction were integrated as time-varying inlet boundary conditions for the simulation domain to replicate the dynamic atmospheric state (
Table 3).
To ensure the reliability and numerical consistency of the CFD model, the model was validated by comparing the simulated air temperature at a height of 1.5 m against the corresponding KMA observational data. The simulated air temperature was spatially averaged across the entire study domain and compared against hourly observations from the Gwacheon Automatic Weather Station (AWS). The Gwacheon AWS, located at approximately 36.44° N, 127.00° E, serves as the representative meteorological observation point for the study area and is classified as an urban-type observation environment. Model accuracy was evaluated using the coefficient of determination (R2) and root mean square error (RMSE). This validation step confirms that the numerical model accurately reflects the actual urban thermal environment, providing a robust baseline for subsequent scenario evaluations.
The thermal characteristics of materials constituting urban surfaces are pivotal variables that determine the intensity of the UHI effect. The radiative properties of these materials vary significantly depending on their composition and surface conditions. Generally, urban surfaces absorb shortwave solar radiation and actively re-emit it into the atmosphere as longwave radiation. Within dense urban environments, this re-emission triggers a cycle of multiple reflections and subsequent absorption between building facades and ground surfaces, ultimately intensifying the thermal load at the pedestrian level.
In this study, the improvement of the thermal environment through modified paving materials is defined as an “Optimization” process. Specifically, scenarios were constructed to evaluate the impact of surface property modifications on concrete and asphalt pavements. According to the prior literature, the applicable emissivity ranges for these materials in CFD simulations are between 0.8 and 0.95 for asphalt and between 0.5 and 0.95 for concrete [
29]. In radiative heat transfer, the thermal properties of urban construction materials are characterized by emissivity (
), reflectivity (
), and transmissivity (
). According to the principle of energy conservation, these three properties must satisfy Equation (3):
For opaque materials (
= 0), this reduces to
+
= 1, indicating that reducing emissivity inherently increases reflectivity. In this study, an emissivity of 0.95 was assigned to both concrete and asphalt to represent a thermally vulnerable baseline state. Building upon this, four distinct scenarios (Case A to Case D) were established as detailed in
Table 4.
2.4. Analysis and Evaluation Metrics
To rigorously evaluate the impact of surface material optimization on the urban thermal environment, this study employed a multi-faceted analytical framework focusing on LST, pedestrian-level air temperature (), and spatial clustering patterns. LST was extracted as a primary indicator to quantify the thermal response of impervious urban surfaces, with data collected separately for concrete and asphalt to identify the unique thermal behavior of each material under varying emissivity and reflectivity scenarios. In addition to standard LST mapping, Python 3.13.8-based cell-level spatial subtraction was performed to quantify the cooling intensity () across the entire study area. By calculating the temperature difference for each individual grid cell between the optimized scenarios and the baseline, where , the spatial distribution of thermal mitigation was visualized with high precision, allowing for a localized assessment of the cooling effects provided by each cooling strategy.
Furthermore, to characterize the temporal evolution of the urban thermal environment, the time series distribution of domain-wide surface temperatures was analyzed from 09:00 to 18:00. This analysis focused on two primary statistical indicators, the mean surface temperature () and the spatial variability, represented by the standard deviation (), which serves as a metric for the spatial variability within the urban fabric. By monitoring these metrics hourly, this study quantitatively evaluated how surface modifications influence not only the absolute temperature reduction but also the spatial homogeneity of the thermal environment under varying solar radiation intensities.
Beyond surface-level analysis, the thermal environment experienced by citizens was evaluated based on extracted at a height of 1.5 m above the ground. This elevation corresponds to the average breathing zone for adults and constitutes the atmospheric layer most directly influenced by terrestrial radiation and sensible heat flux. Since the heat transfer characteristics from the surface to the atmosphere can vary independently of surface temperature, this study analyzed the correlation between LST and to quantitatively verify how surface modifications effectively mitigate perceived heat stress at the pedestrian level.
Finally, spatial clustering analysis was performed to identify Hot Spots and Cold Spots across the study site in Gwacheon. Hot Spots were defined as thermally vulnerable zones where urban heat island (UHI) effects are concentrated, while Cold Spots represented regions with relatively lower temperatures functioning as thermal buffers. The location, total area, and intensity of these zones were compared across the four simulation scenarios to provide foundational evidence for prioritizing urban interventions and selecting optimal locations for cooling strategies, such as high-albedo materials.
2.5. Data Processing and Construction of the Digital Twin Visualization
This study established a comprehensive data processing pipeline consisting of spatial data extraction, GIS-based heat map generation, and an integrated 3D voxelization–optimization process to enable the efficient visualization of high-resolution CFD results on a web-based digital twin platform. The primary physical quantity, air temperature, along with its corresponding 3D spatial coordinates (X, Y, Z), was extracted from the STAR-CCM+ simulation domain and converted into a universal CSV format to bridge the gap between complex computational fluid dynamics datasets and digital twin environments. For the study site, which generates approximately 2,000,000 data points per hour, structural optimization and data reduction were prioritized to prevent excessive computational loads on the GPU and CPU during rendering.
The first visualization approach utilized GIS technology and inverse distance weighting (IDW) interpolation to transform discrete 3D point clouds into a continuous surface [
40,
41]. IDW operates as a deterministic spatial interpolation technique based on the principle that the influence of a sampled point on an unobserved location decreases as the distance between them increases. By mapping these interpolated values onto a uniform grid, a heat map was generated to allow for an intuitive assessment of thermal patterns near road networks and green spaces, serving as a critical tool for urban spatial decision-making.
The second approach involved a procedural voxelization and optimization pipeline designed for real-time 3D integration. Utilizing geometry nodes in Blender 4.1, a 2.5 m × 2.5 m × 2.5 m cube was instanced at each coordinate point, which were subsequently merged into a single mesh object to minimize rendering overhead [
42,
43]. Temperature values were normalized and stored directly in the vertex color layer of the voxel mesh, ensuring rapid rendering across web platforms without the need for external texture files. Finally, the models were exported in the GLB binary format with Google Draco mesh compression to achieve a 70–90% reduction in file size, thereby optimizing the data structure for spatio-temporal analysis [
44].
3. Results
3.1. Model Validation and Correlation Analysis
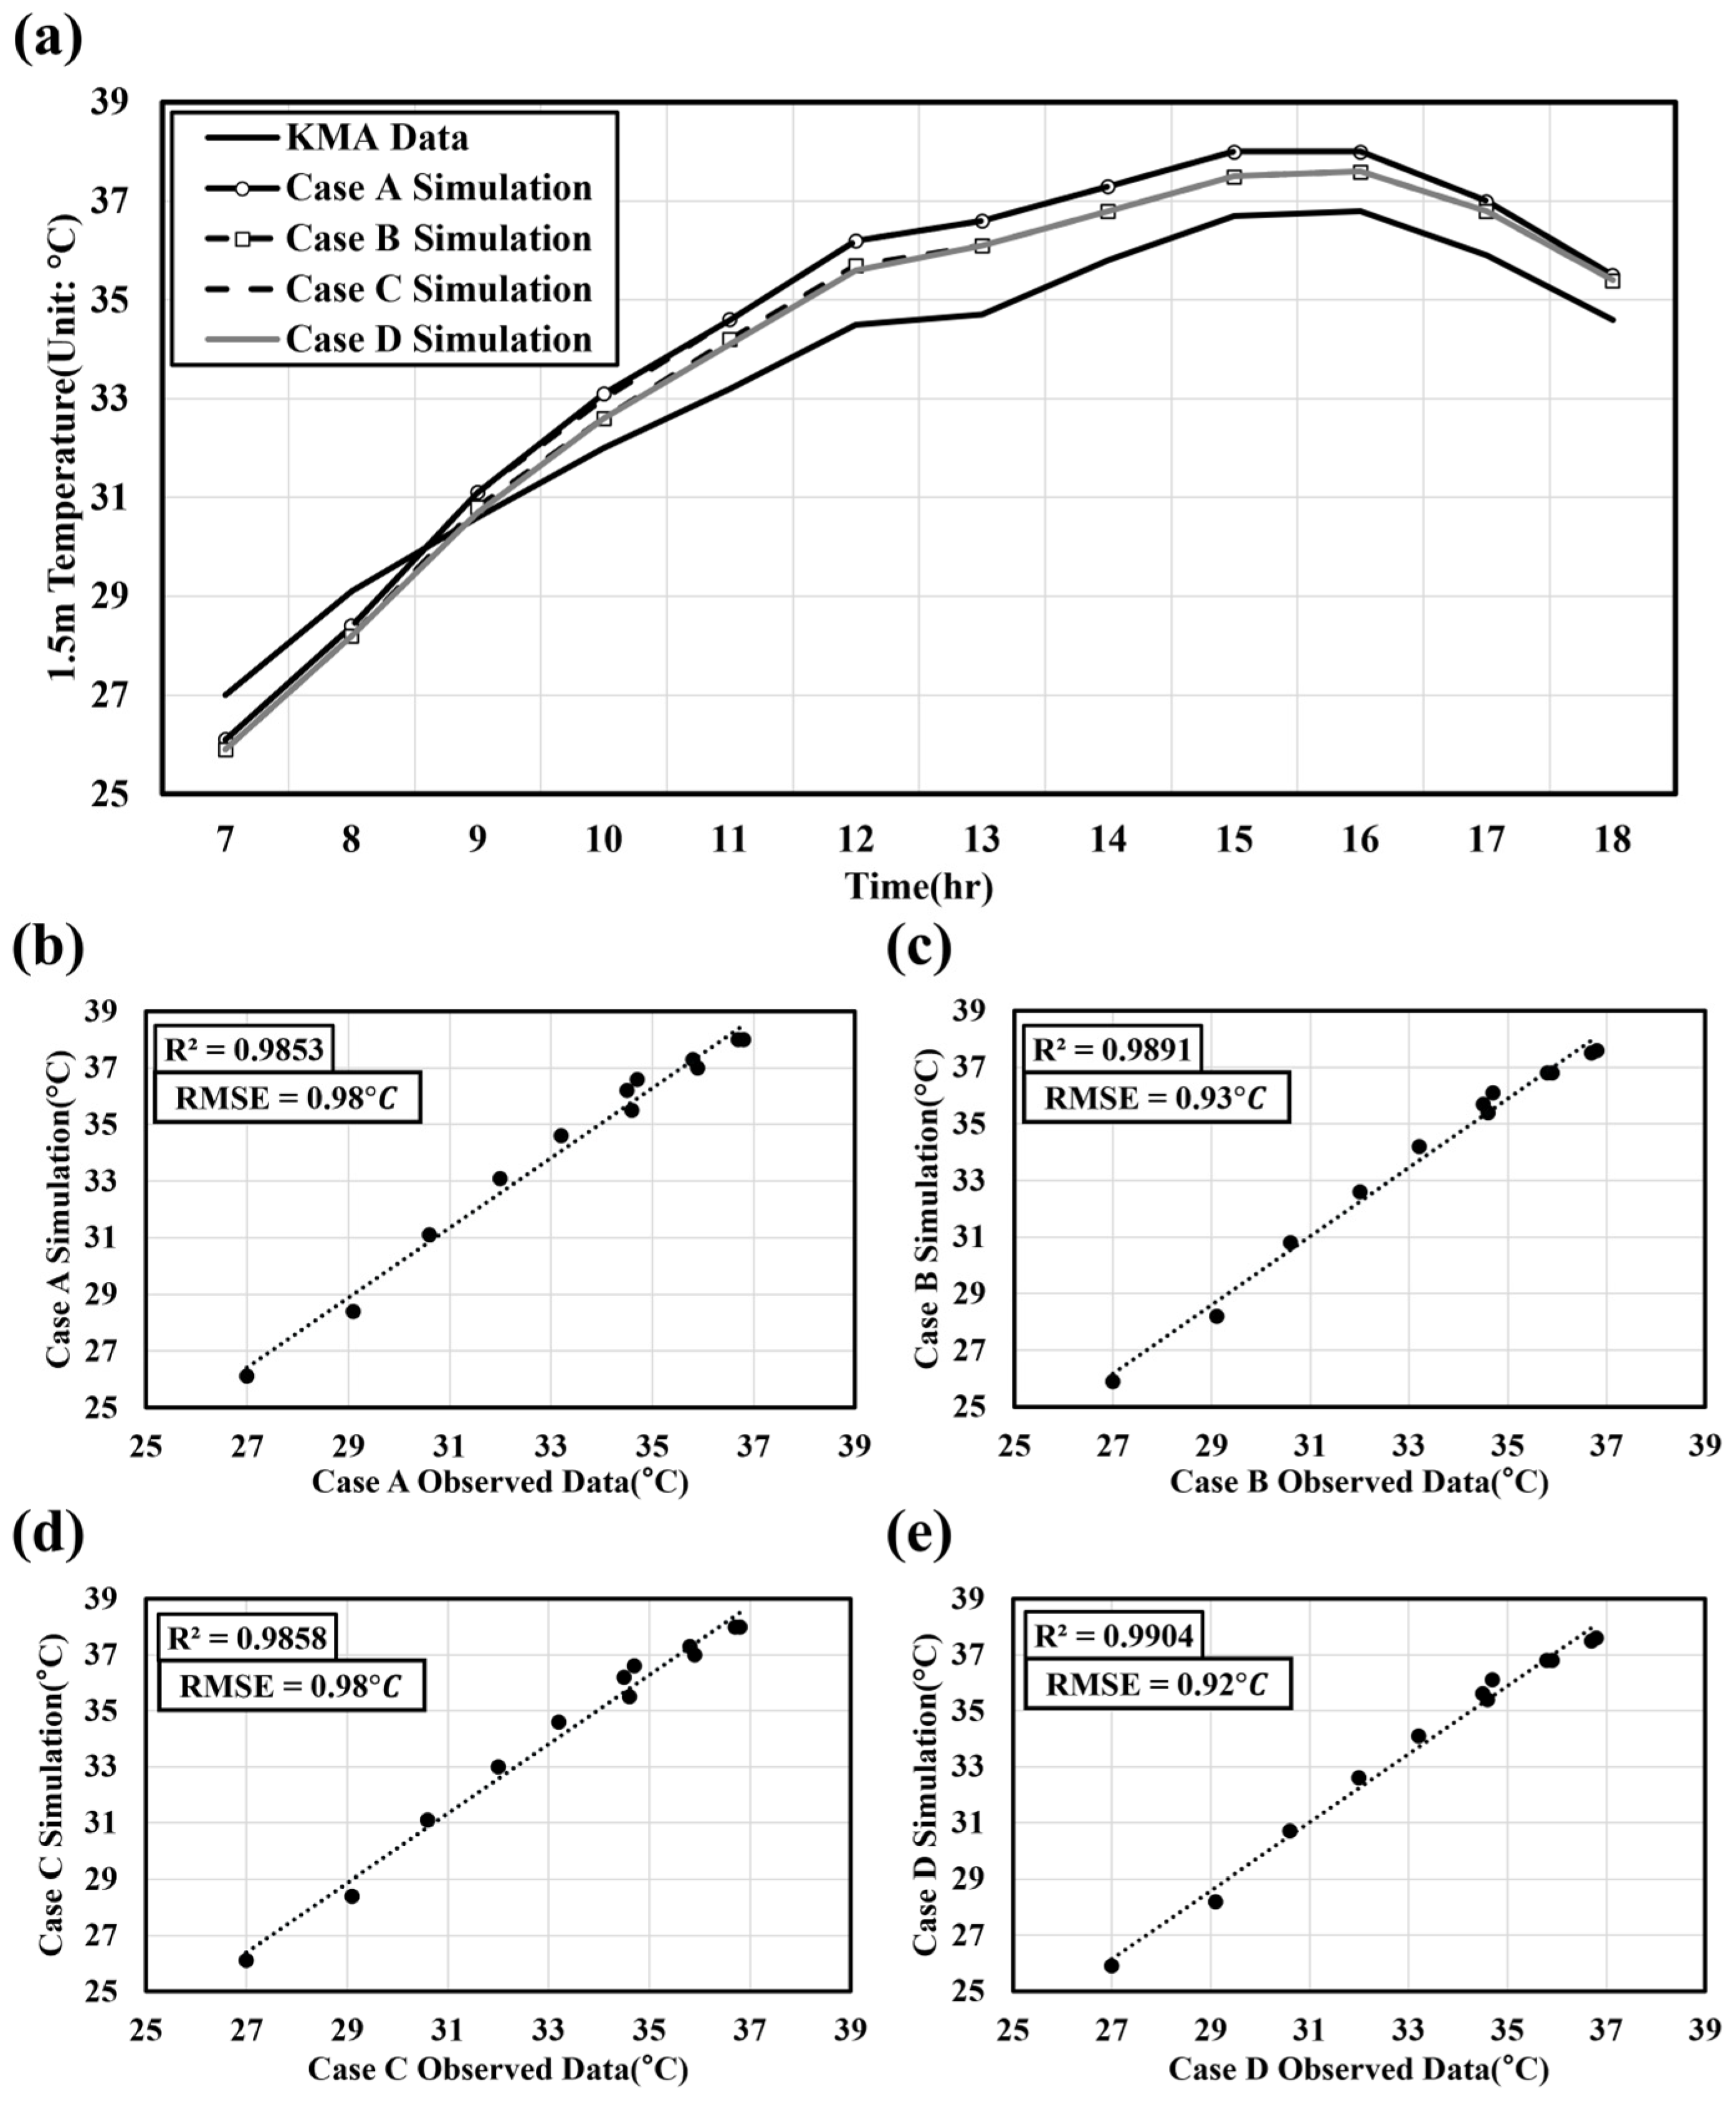
To ensure the reliability of the numerical model, a correlation analysis was performed between the input meteorological boundary conditions and the resulting CFD simulation outputs. The primary objective of this validation was to verify whether the simulation successfully replicates the temporal heating and cooling trends dictated by the actual atmospheric data. As illustrated in
Figure 4, two statistical metrics were calculated for each scenario: the coefficient of determination (R
2) to assess temporal correlation, and root mean square error (RMSE) to quantify absolute prediction accuracy.
The results demonstrated an exceptionally high degree of correlation across all scenarios, with R2 values of 0.9853 for Case A, 0.9891 for Case B, 0.9858 for Case C, and 0.9904 for Case D. RMSE values were 0.98 °C for Case A, 0.93 °C for Case B, 0.98 °C for Case C, and 0.92 °C for Case D. These metrics, with R2 values nearing 1.0 and RMSE values below 1 °C, indicate that the CFD model accurately captures the dynamic variations in the urban thermal environment throughout the target day.
3.2. Analysis of CFD-Based LST and 1.5 m Air Temperature by Scenario
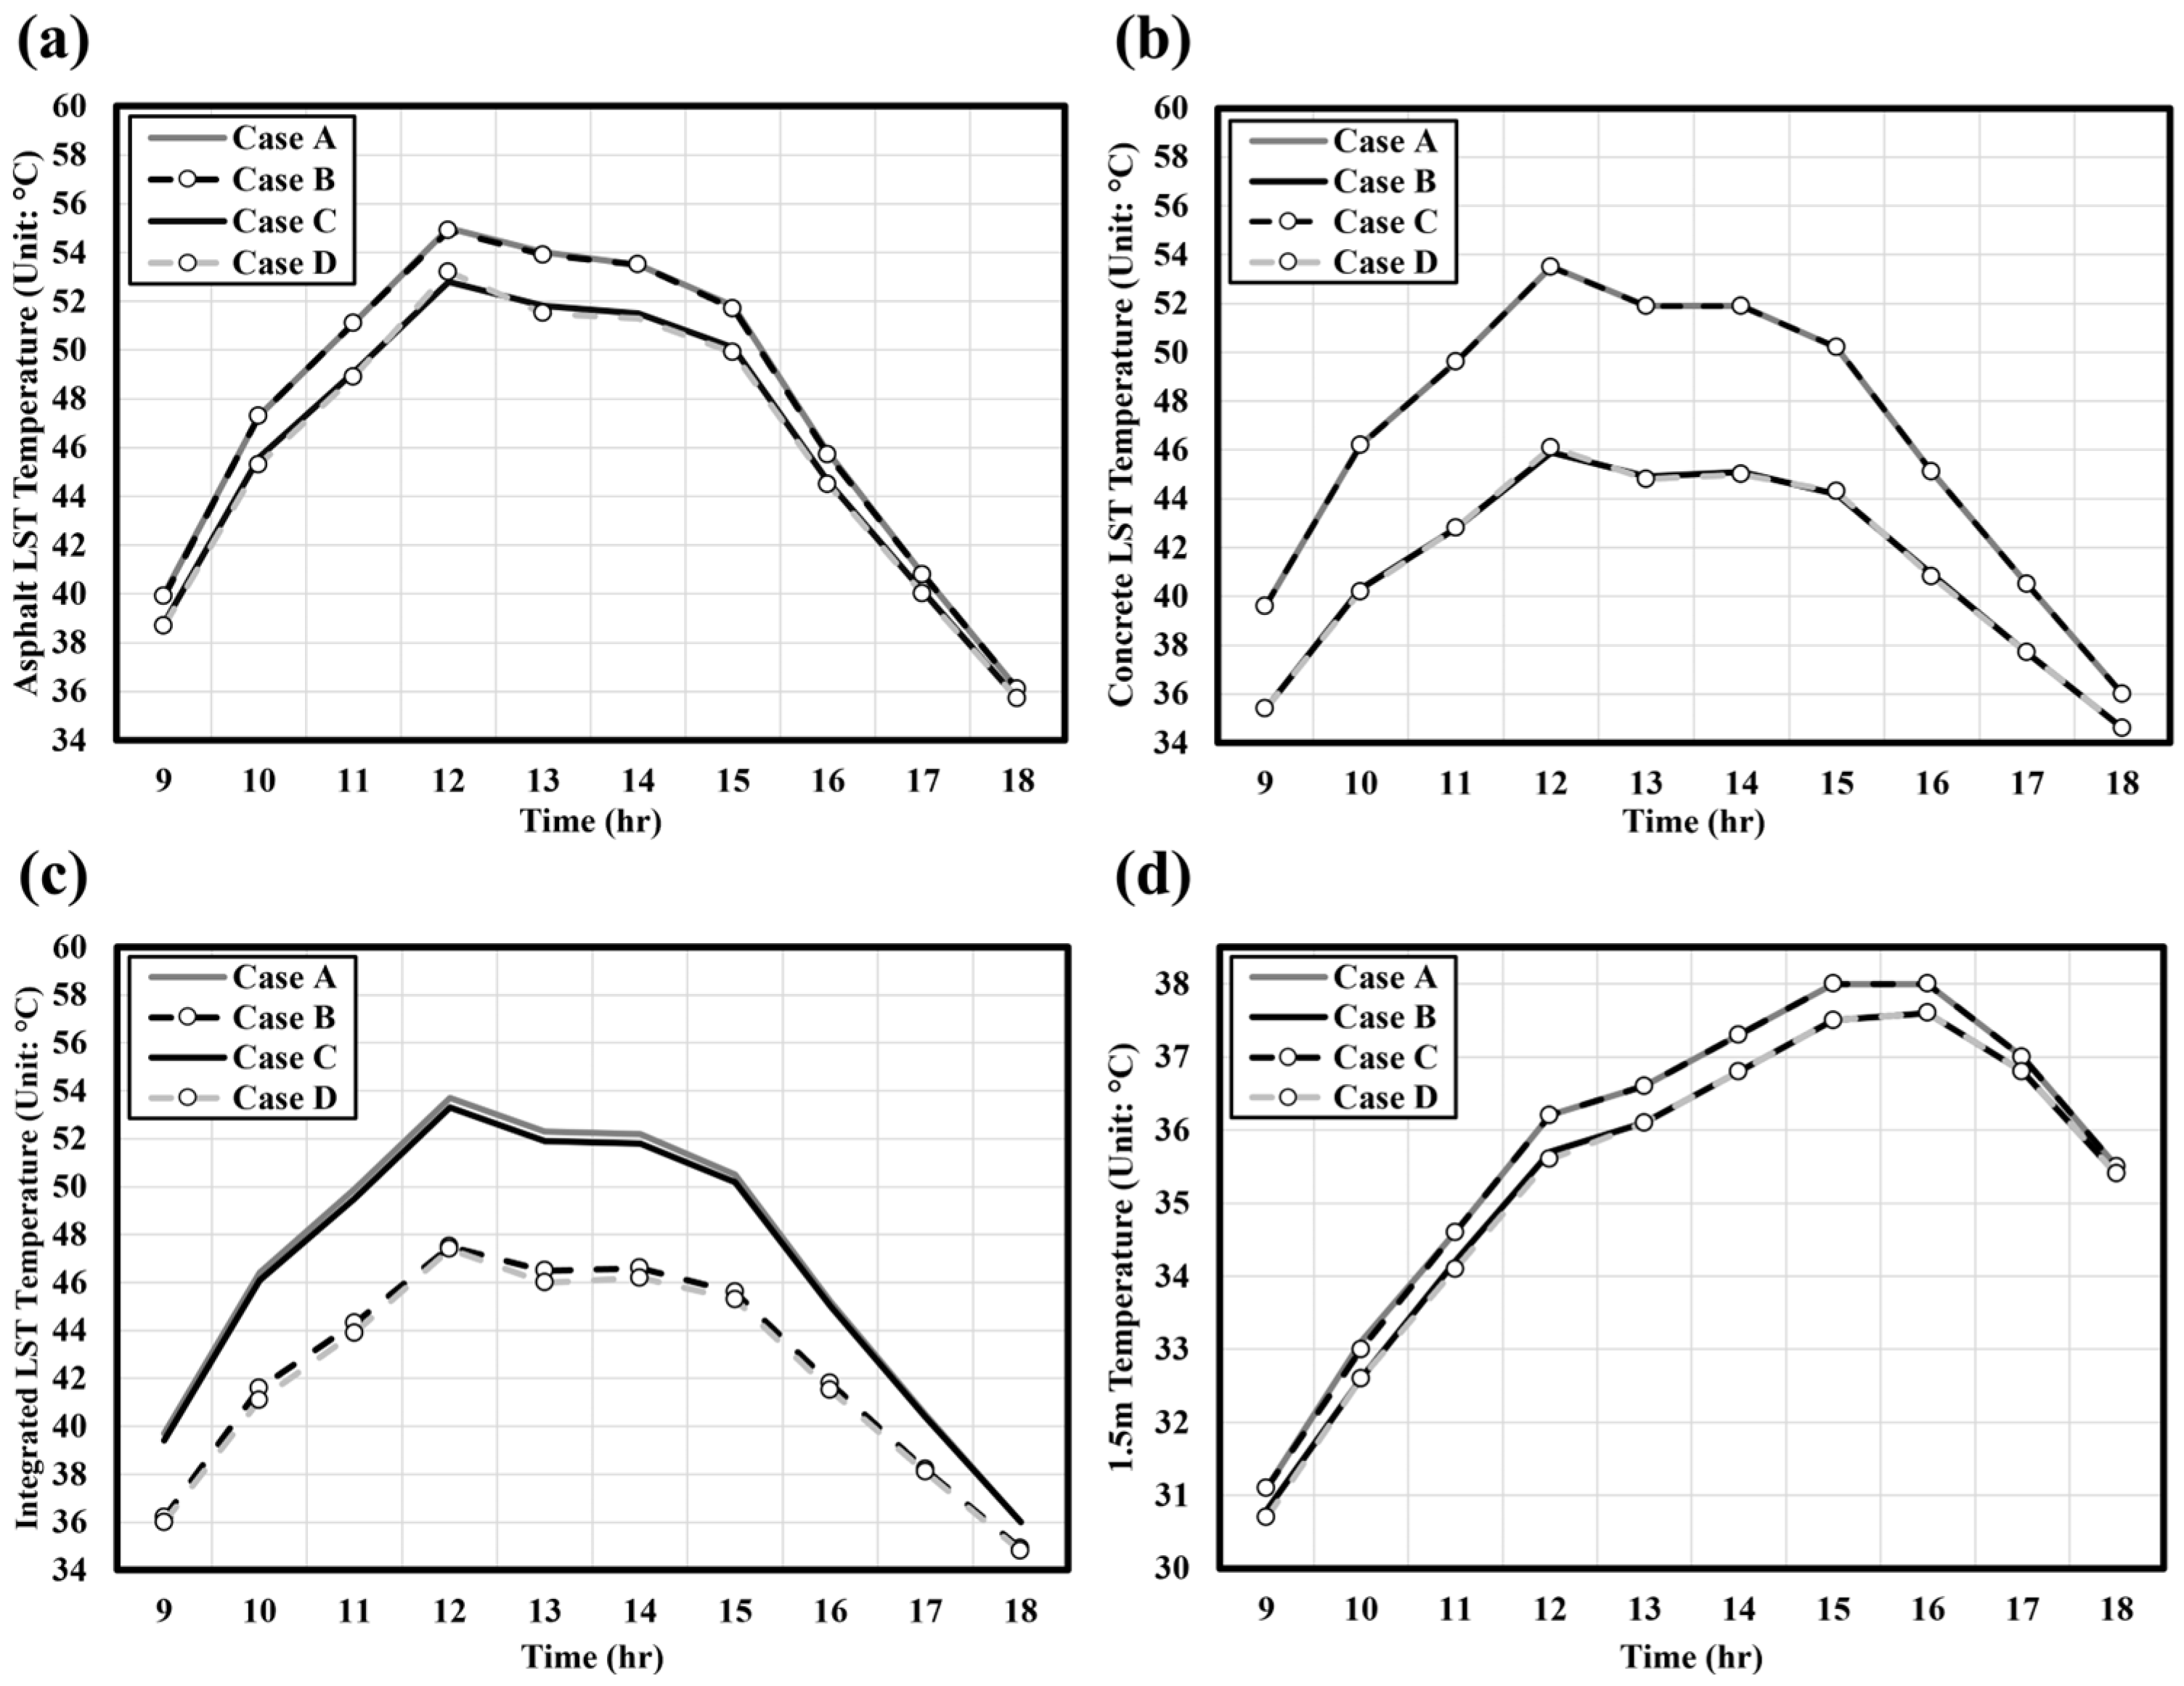
The UHI mitigation effects were analyzed by applying improved radiative properties to thermally vulnerable urban construction materials. The hourly variation in temperature for each scenario is illustrated in
Figure 5, while the quantitative hourly results for the maximum and average temperature are summarized in
Table 5. The maximum temperature denotes the peak hourly LST value recorded during the simulation period (9:00–18:00 KST, 1 h intervals) and the average temperature represents the arithmetic mean of hourly LST values over the same period.
3.2.1. Land Surface Temperature (LST) Analysis
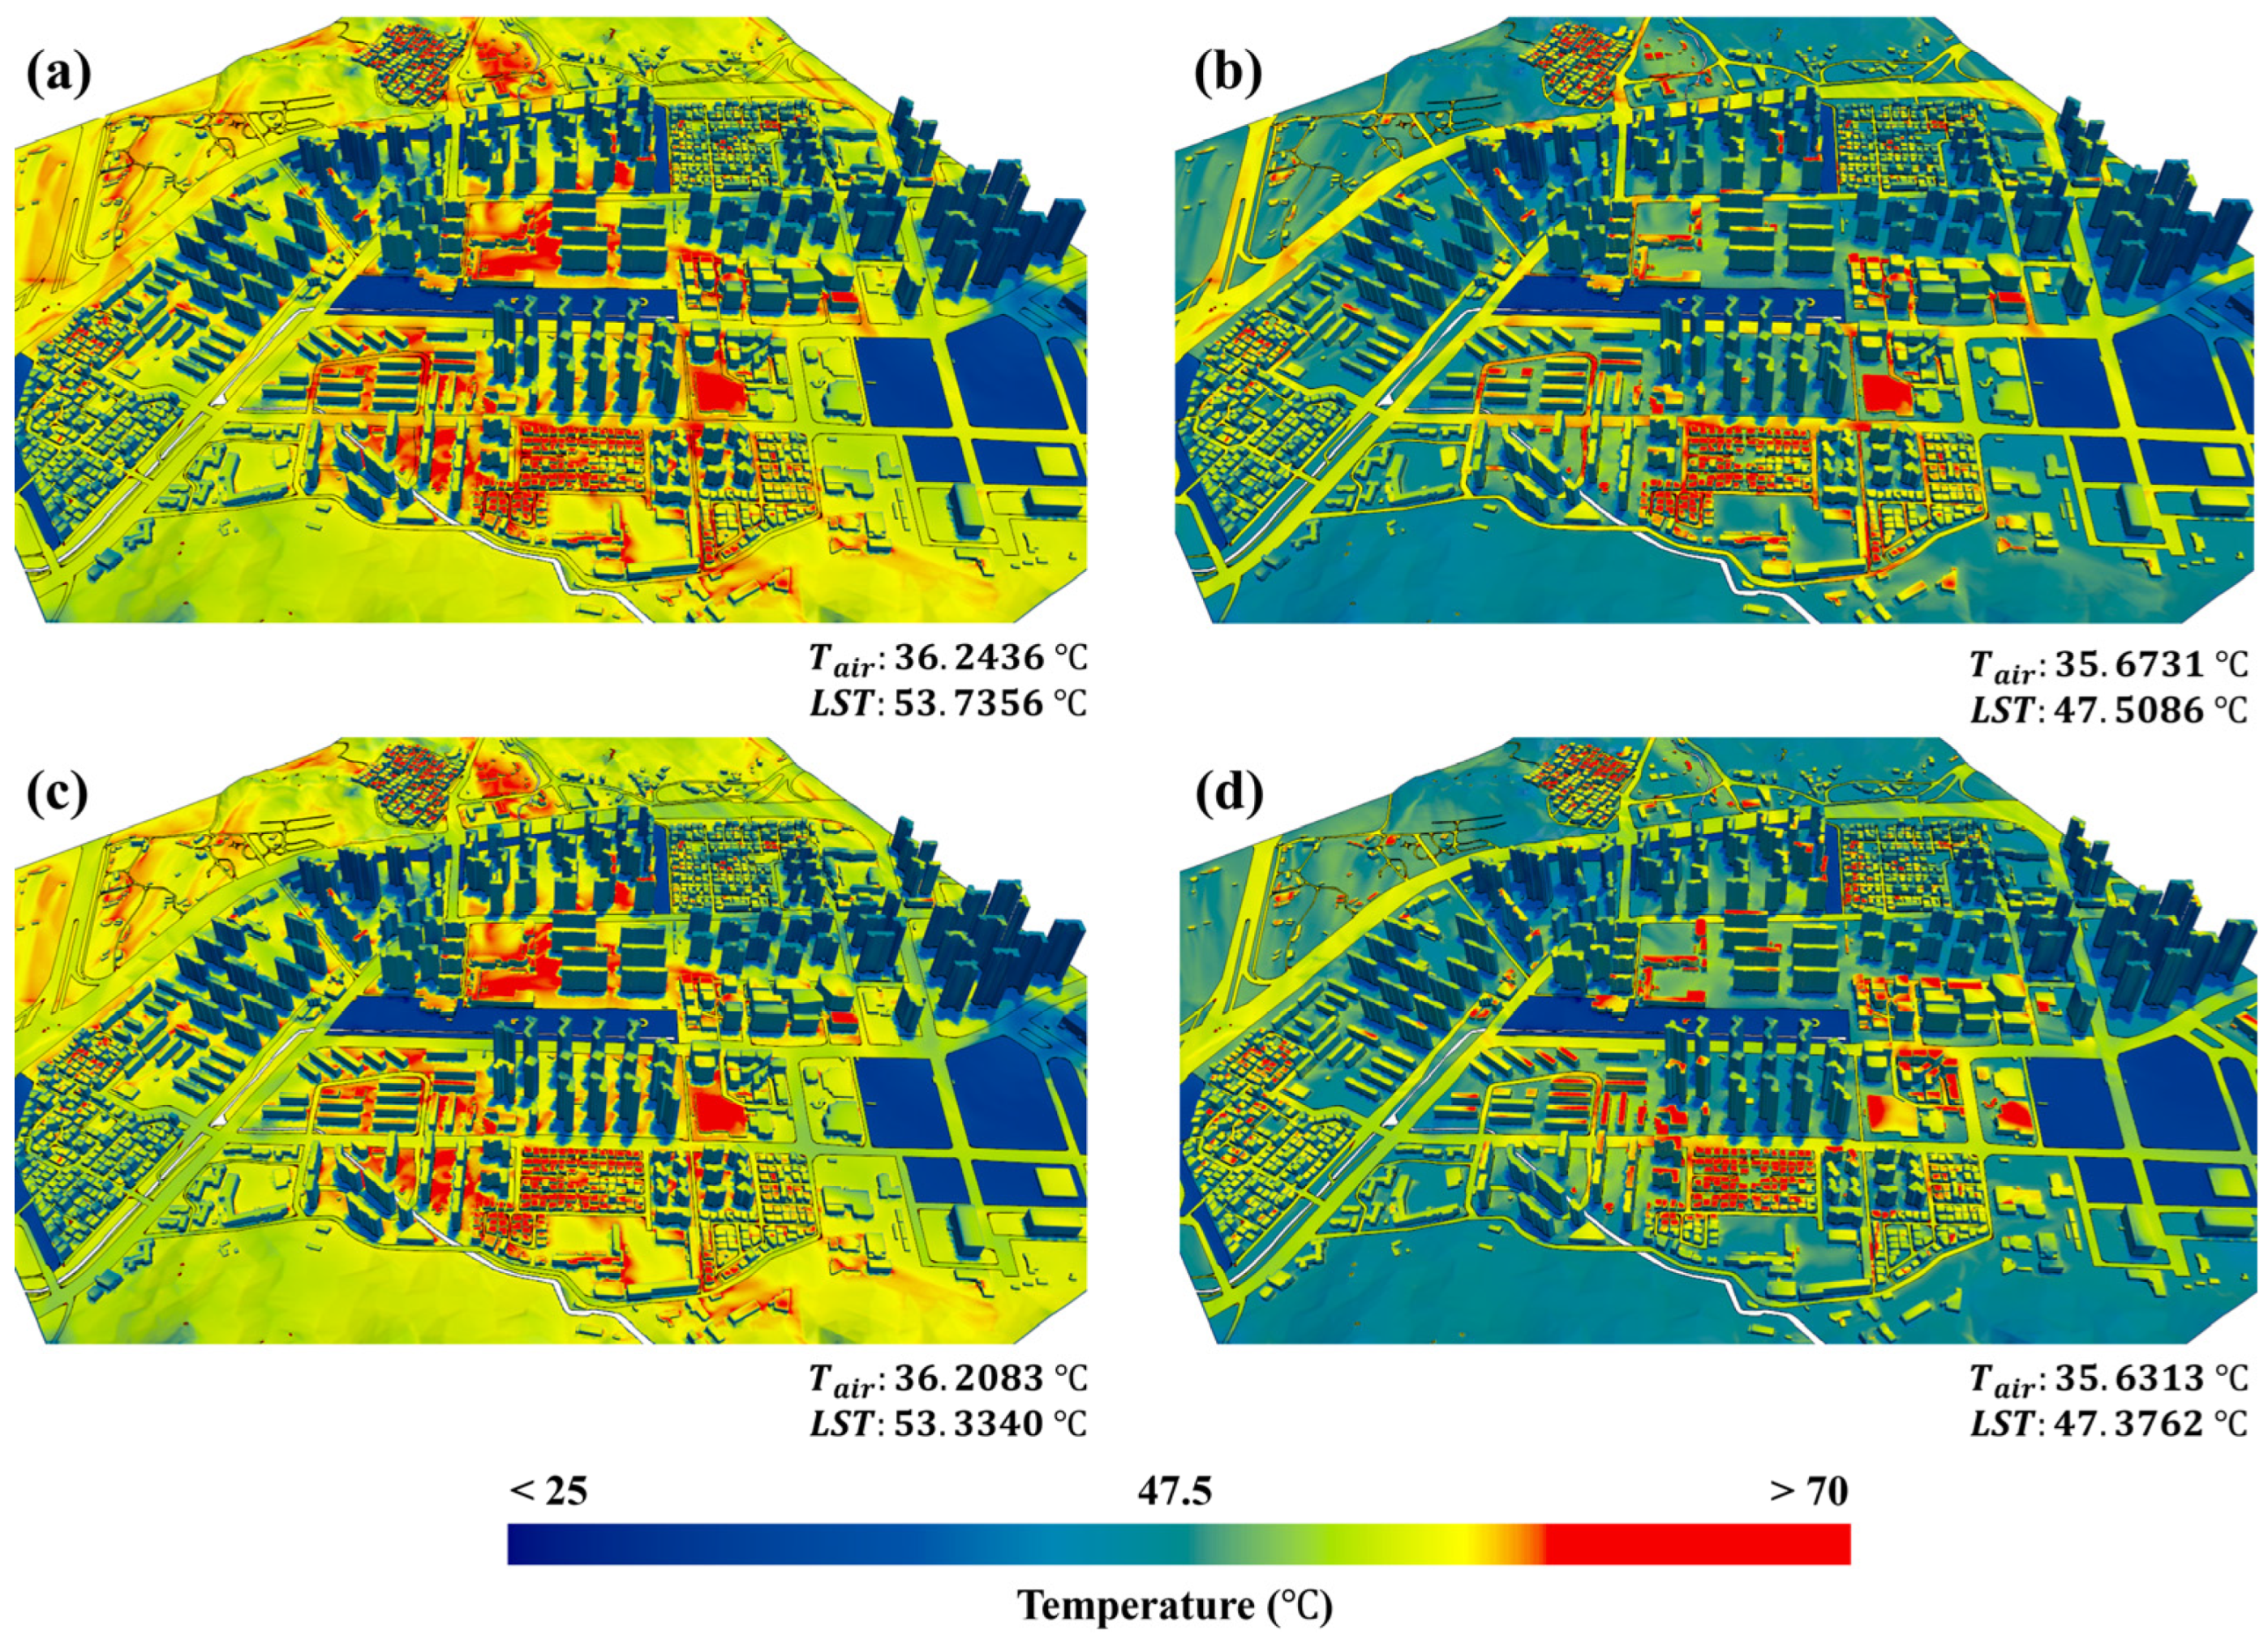
The spatial distribution of LST within the CFD simulation domain is presented in
Figure 6. According to the analysis of average surface temperatures, the baseline scenario (Case A) exhibited a mean concrete surface temperature of about 46.5
, with a maximum reaching 53.5
. In Case B, where only concrete surfaces were optimized, the mean temperature dropped to 41.2
and the maximum to 45.9
. This represents a significant reduction of 5.3
in average temperature and 7.6
in maximum temperature compared with Case A.
Higher thermal accumulation was recorded for the asphalt surfaces in Case A than for concrete, with a mean of 47.5 and a maximum of 55.0 . In Case C, which focused on asphalt optimization, the average temperature decreased to 46.0 and the maximum to 52.8 . This indicates reductions of 1.5 in the average and 2.2 in the maximum relative to Case A, which is notably lower than the mitigation intensity observed in concrete optimization.
Comprehensive optimization in Case D (both concrete and asphalt) achieved the highest UHI mitigation performance. For concrete, the mean temperature was 41.2 with a maximum of 46.1 , representing a reduction of 5.3 and 7.4 respectively, compared with Case A. For the combined impervious surface, the average temperature was 42.0 and the maximum was 47.4 , representing a reduction of 4.6 and 6.3 respectively, compared with Case A.
Comparing the two materials, concrete optimization (Case B) was found to be more effective than asphalt optimization (Case C), with an additional reduction of 4.1 in mean temperature and 5.8 in maximum temperature. This suggests that improving the radiative properties of concrete is a more dominant factor in lowering urban surface temperatures. Furthermore, the mean total surface temperature of Case D (42.0 ) closely aligns with the median value of the individual material improvements, reflecting the combined physical contribution of both strategies.
3.2.2. Pedestrian-Level Air Temperature () Analysis
The results of the analysis of air temperature at a height of 1.5 m, which is influenced by both terrestrial radiation and sensible heat flux from the surface, showed a trend similar to LST, though with a smaller magnitude of reduction. Case A recorded a of 35.7 and a maximum of 38.0 . In contrast, Case D showed an average of 35.3 and a maximum of 37.6 , achieving a reduction of about 0.4 .
A critical finding of the 1.5 m analysis is that the mitigation effects of Case B and Case D were nearly identical. Case B achieved an average reduction of 0.39 , while Case D achieved 0.42 —a marginal difference of only 0.03 . Conversely, Case C showed a negligible average reduction remaining nearly identical to Case A at 35.7 . These results demonstrate that concrete material improvement exerts a dominant influence on pedestrian-level air temperature reduction, whereas the additional contribution of asphalt optimization is highly limited.
These findings imply that improving the thermal properties of urban construction materials is effective for mitigating both surface and atmospheric temperatures. Specifically, the simultaneous optimization of concrete and asphalt provides the most significant overall thermal reduction, contributing to enhanced thermal comfort in urban environments.
3.3. Spatial Distribution of Cooling Intensity and Domain-Wide Thermal Heterogeneity
To determine the optimal urban cooling strategy, this study performed a spatio-temporal analysis of the domain-wide temperature distribution. Unlike surface-level assessments, this analysis utilized the comprehensive 3D grid data—consisting of absolute X, Y, and Z coordinates and corresponding temperature values extracted from the computational domain.
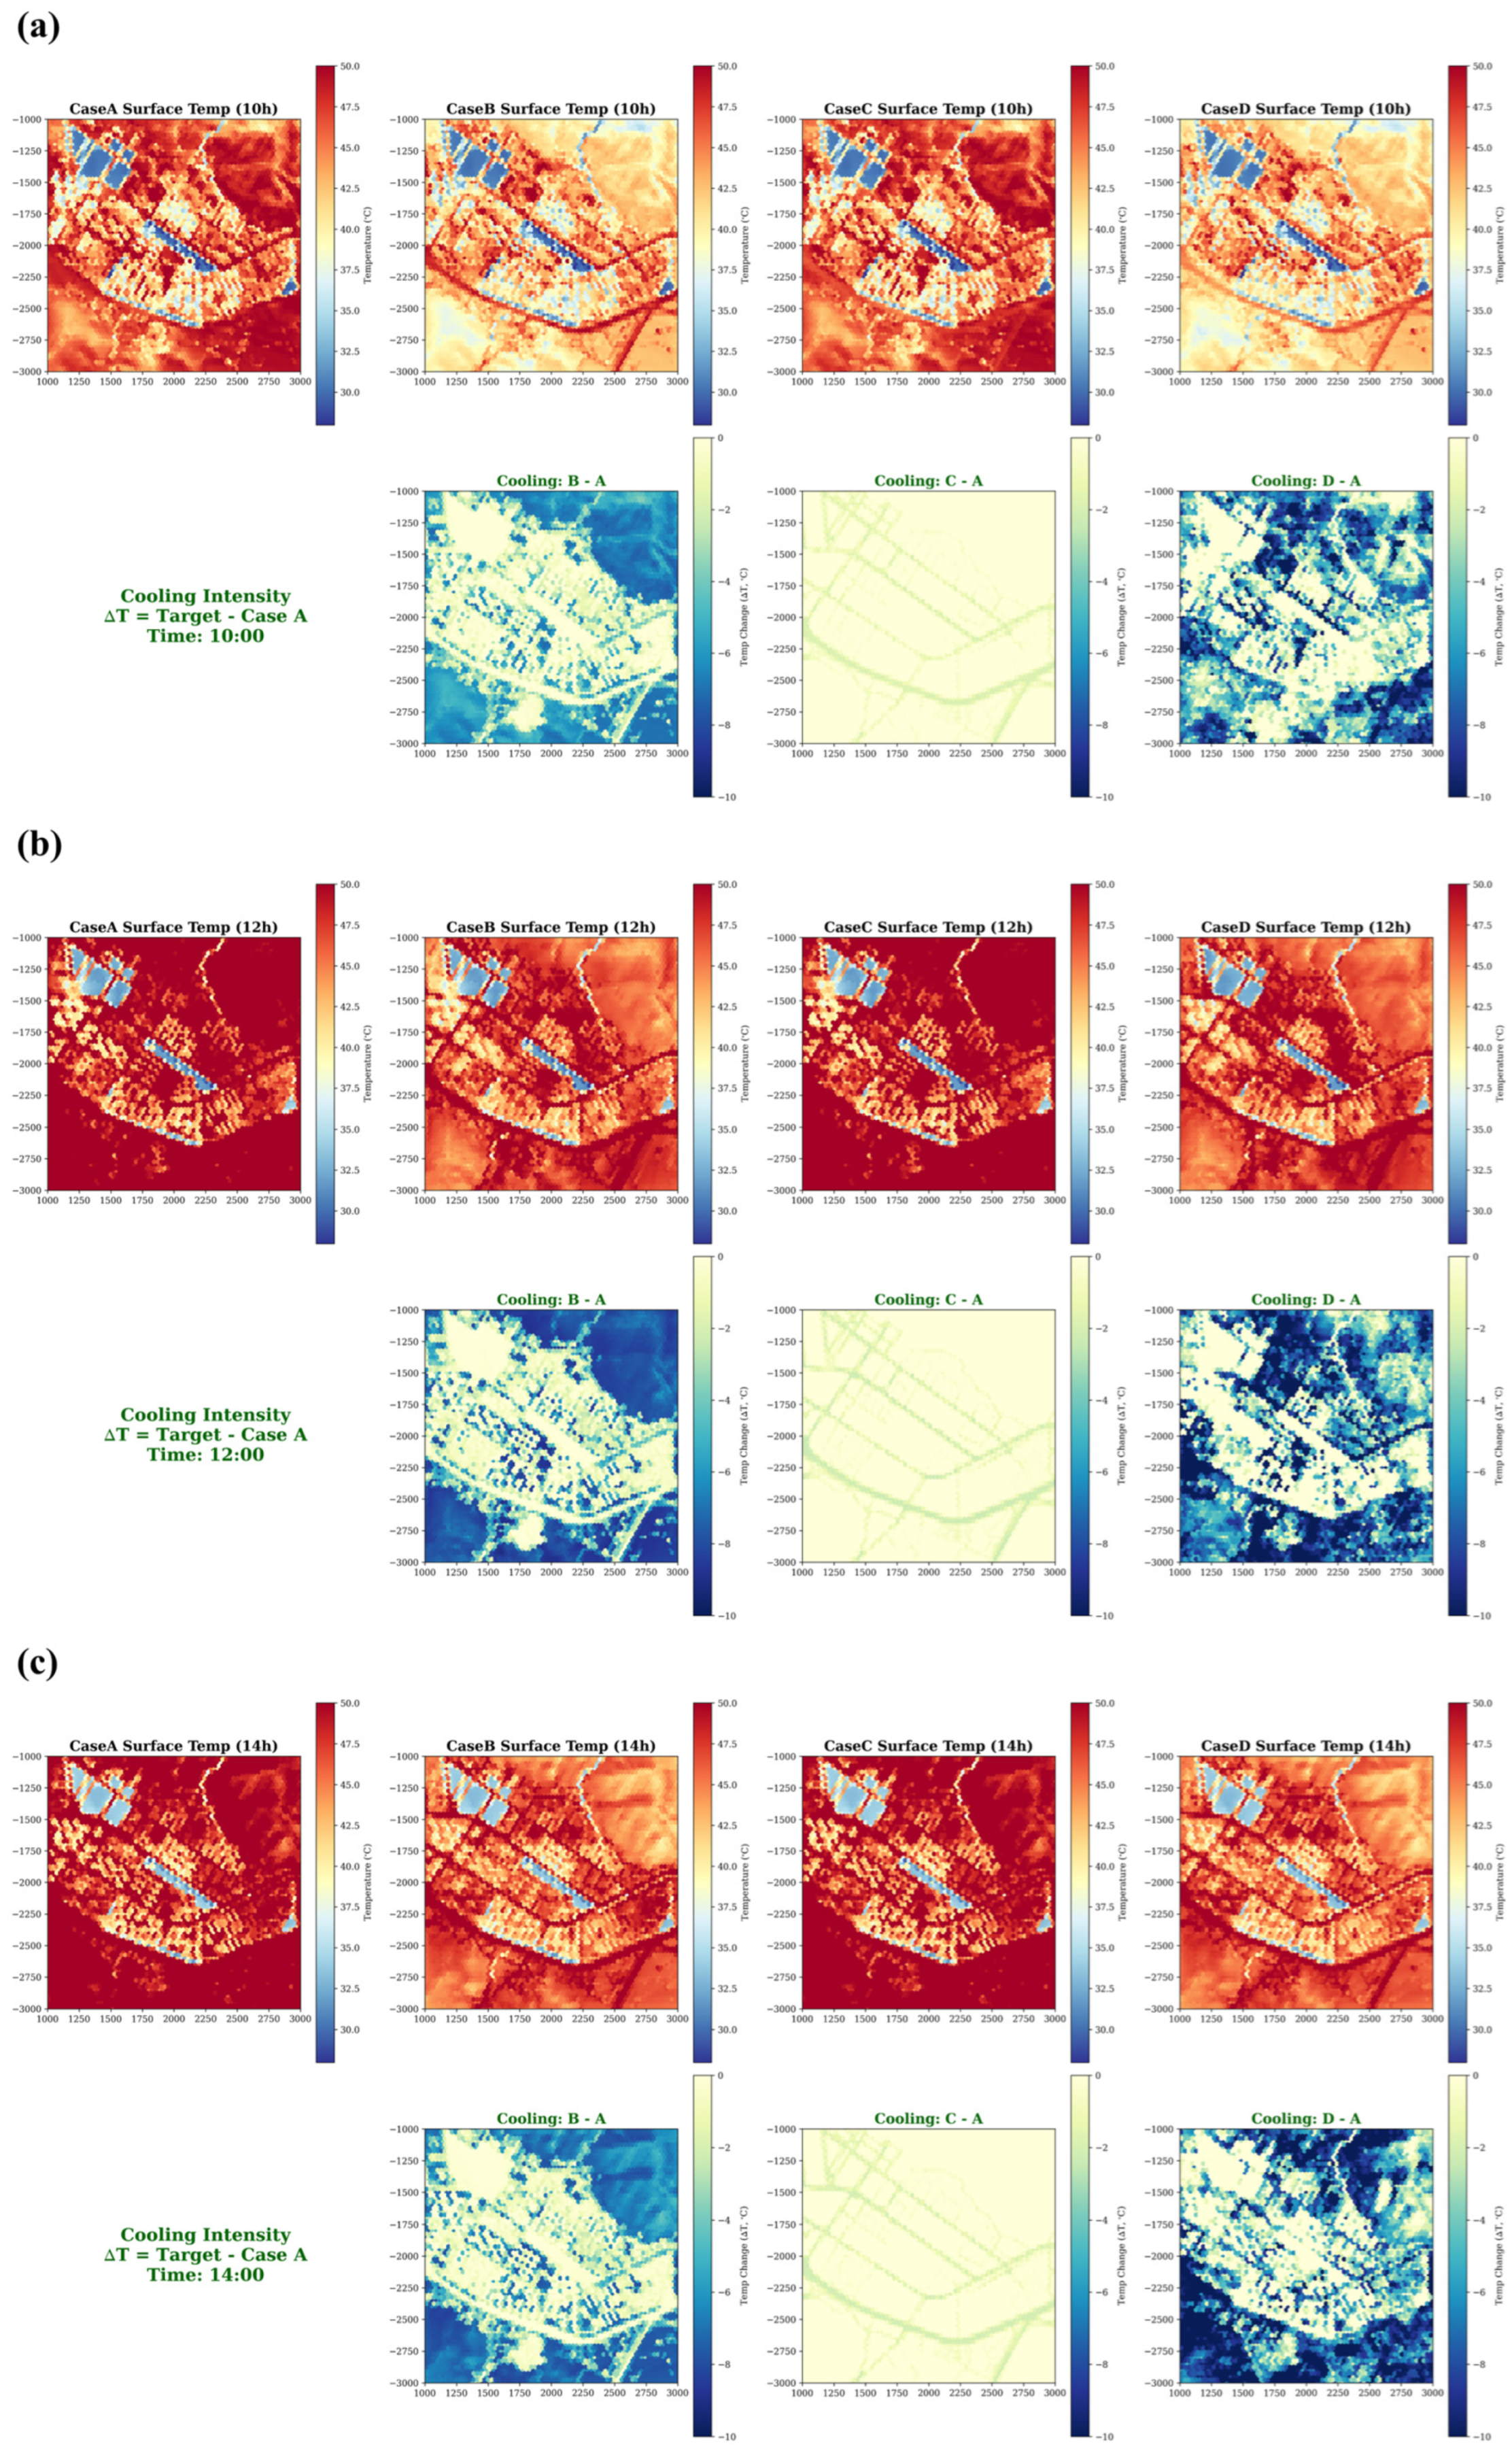
Figure 7 illustrates the hourly distribution of this grid temperature and the cooling intensity relative to Case A from 09:00 to 18:00.
The results of the analysis of the entire computational grid revealed that the mean temperature for Case A was 43.67 . In comparison, the mean temperatures for the optimized scenarios were 42.43 for Case B, 43.57 for Case C, and 42.30 for Case D. The temperature reduction relative to Case A was 1.24 for Case B, 0.10 for Case C, and 1.37 for Case D. Notably, the difference in mitigation performance between Case B and Case D was only 0.13 . This indicates that optimizing concrete surfaces alone can achieve about 90.5% of the total thermal reduction provided by the comprehensive optimization of both materials.
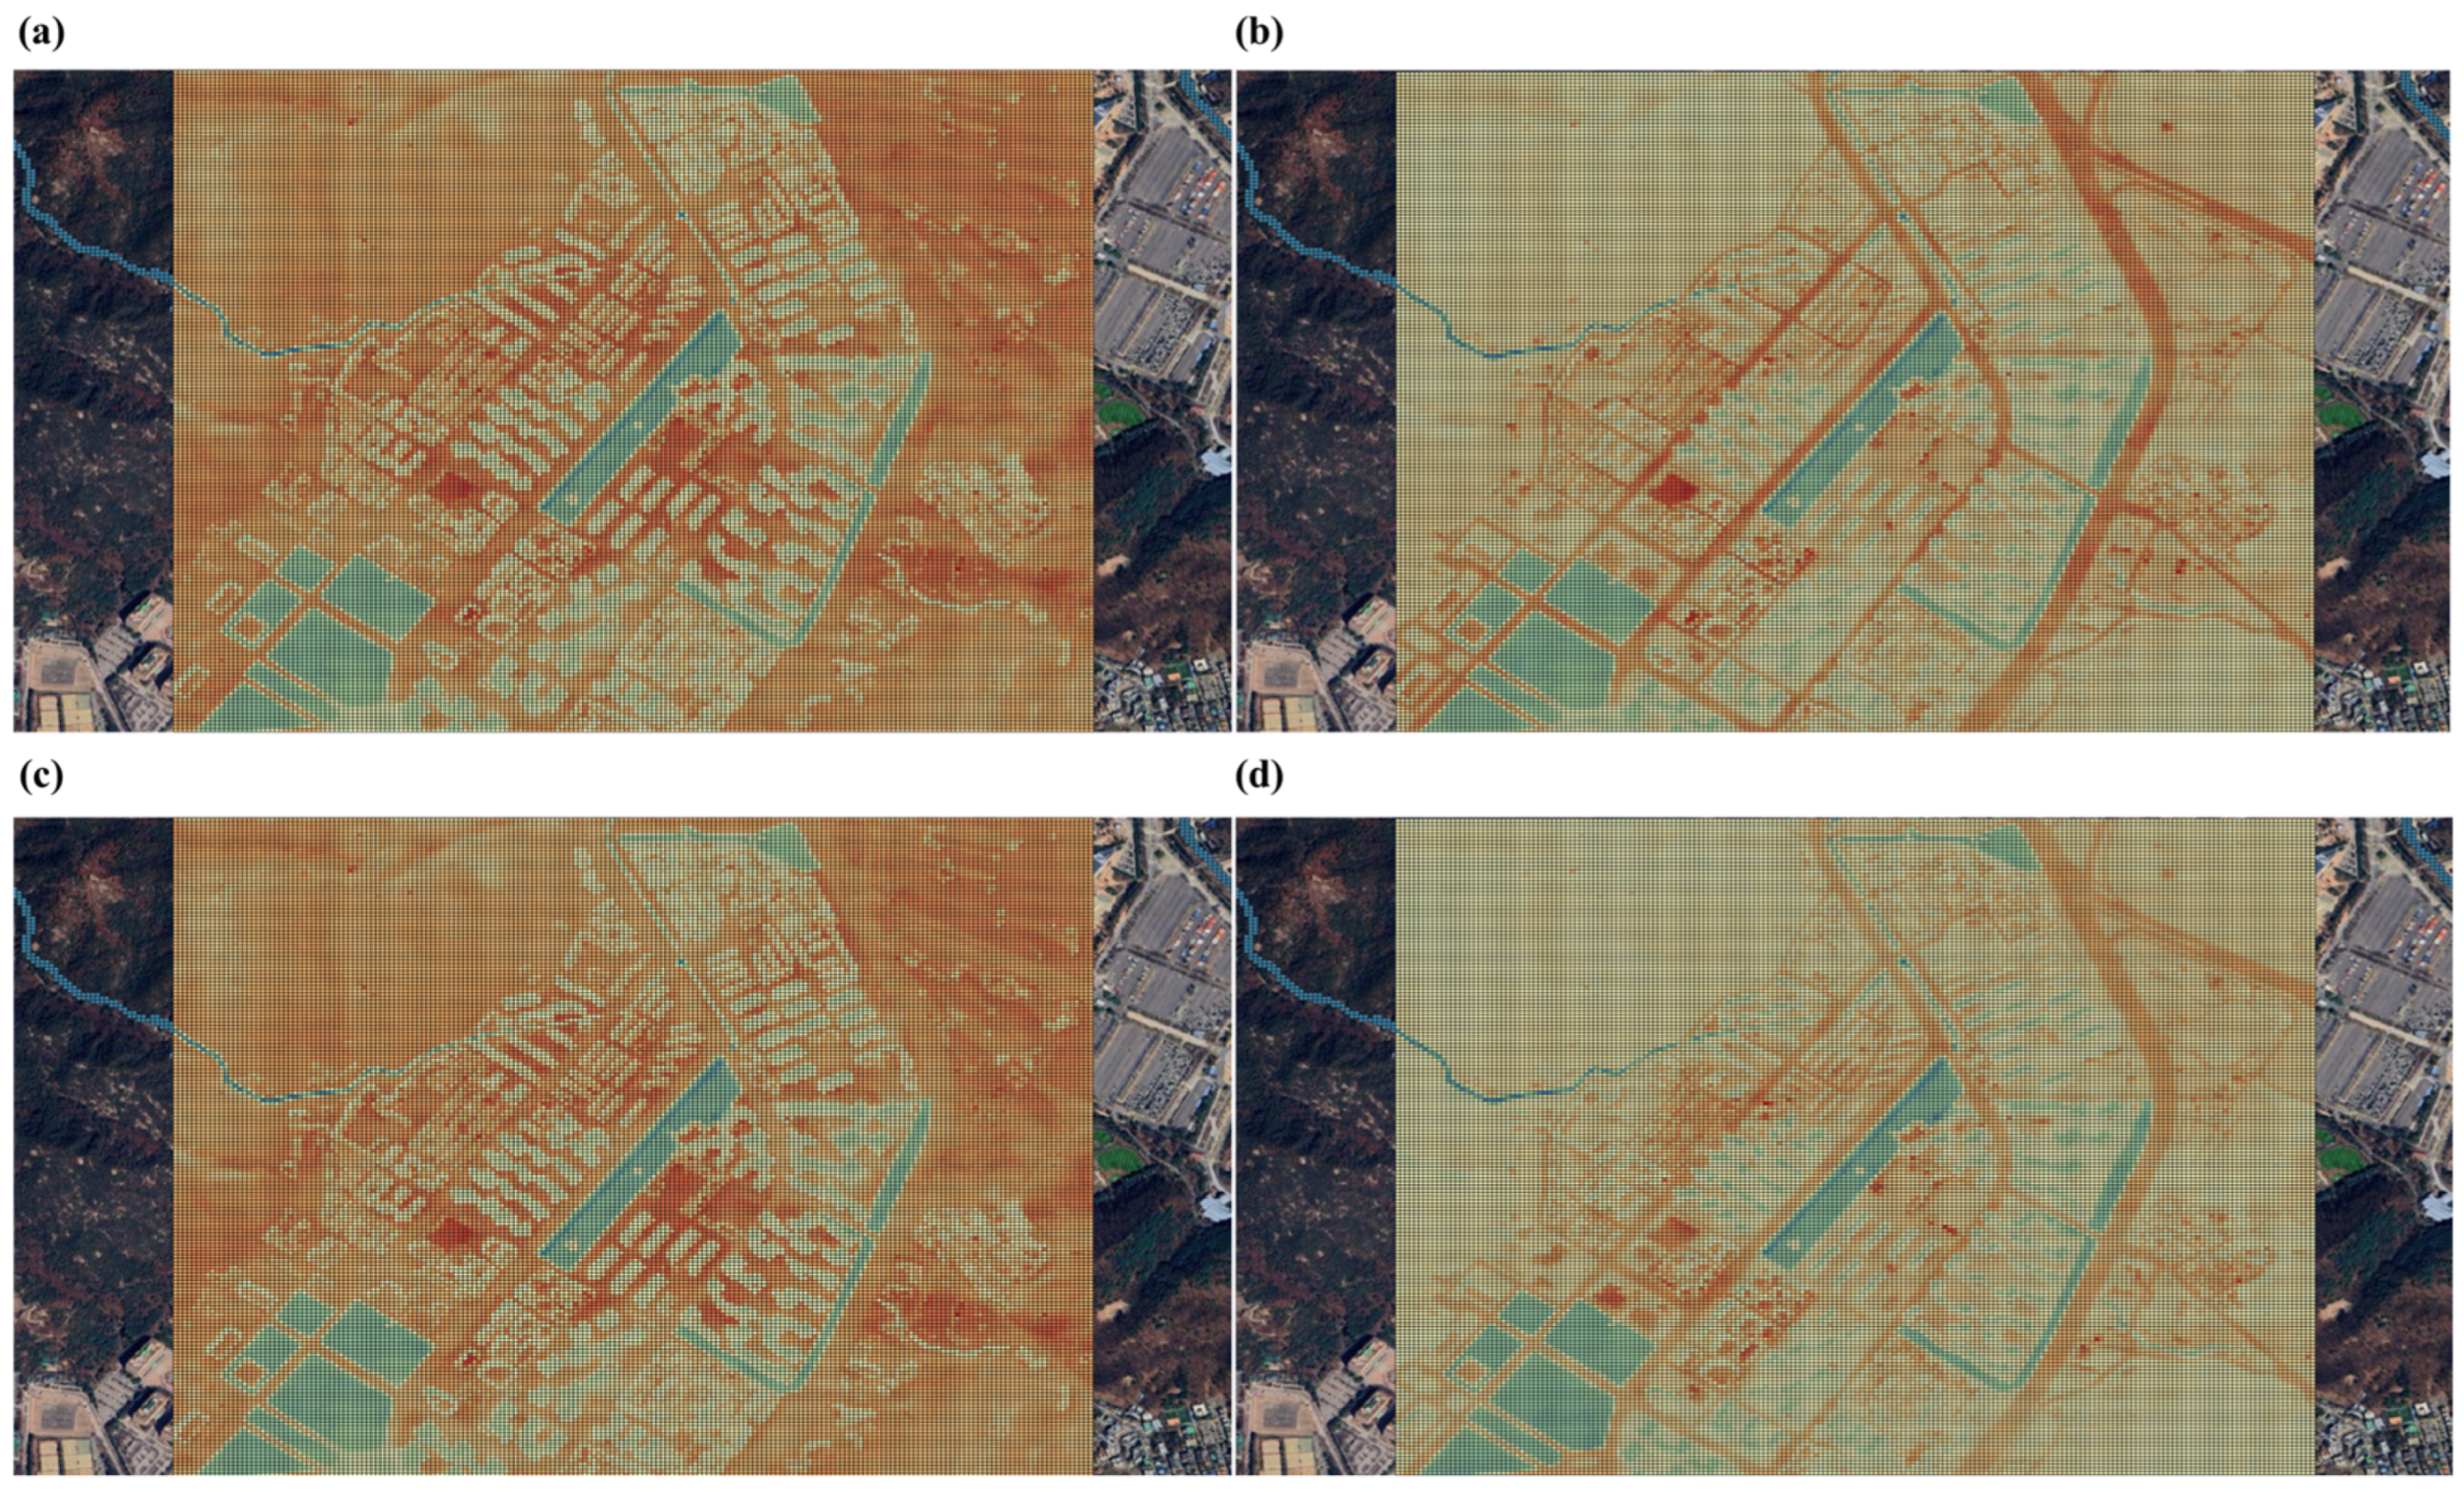
The spatial patterns shown in
Figure 7 and
Appendix A further support these quantitative findings. The cooling intensity maps for Case B and Case D exhibit similar high-intensity cooling patterns within the grid points associated with concrete paved zones, with localized temperature reductions of up to −6
to −8
. In contrast, Case C is characterized by light colors across the entire domain, representing a negligible cooling intensity nearing 0
. These results confirm that concrete material improvement is the decisive factor in lowering the temperature of the urban air volume across the grid.
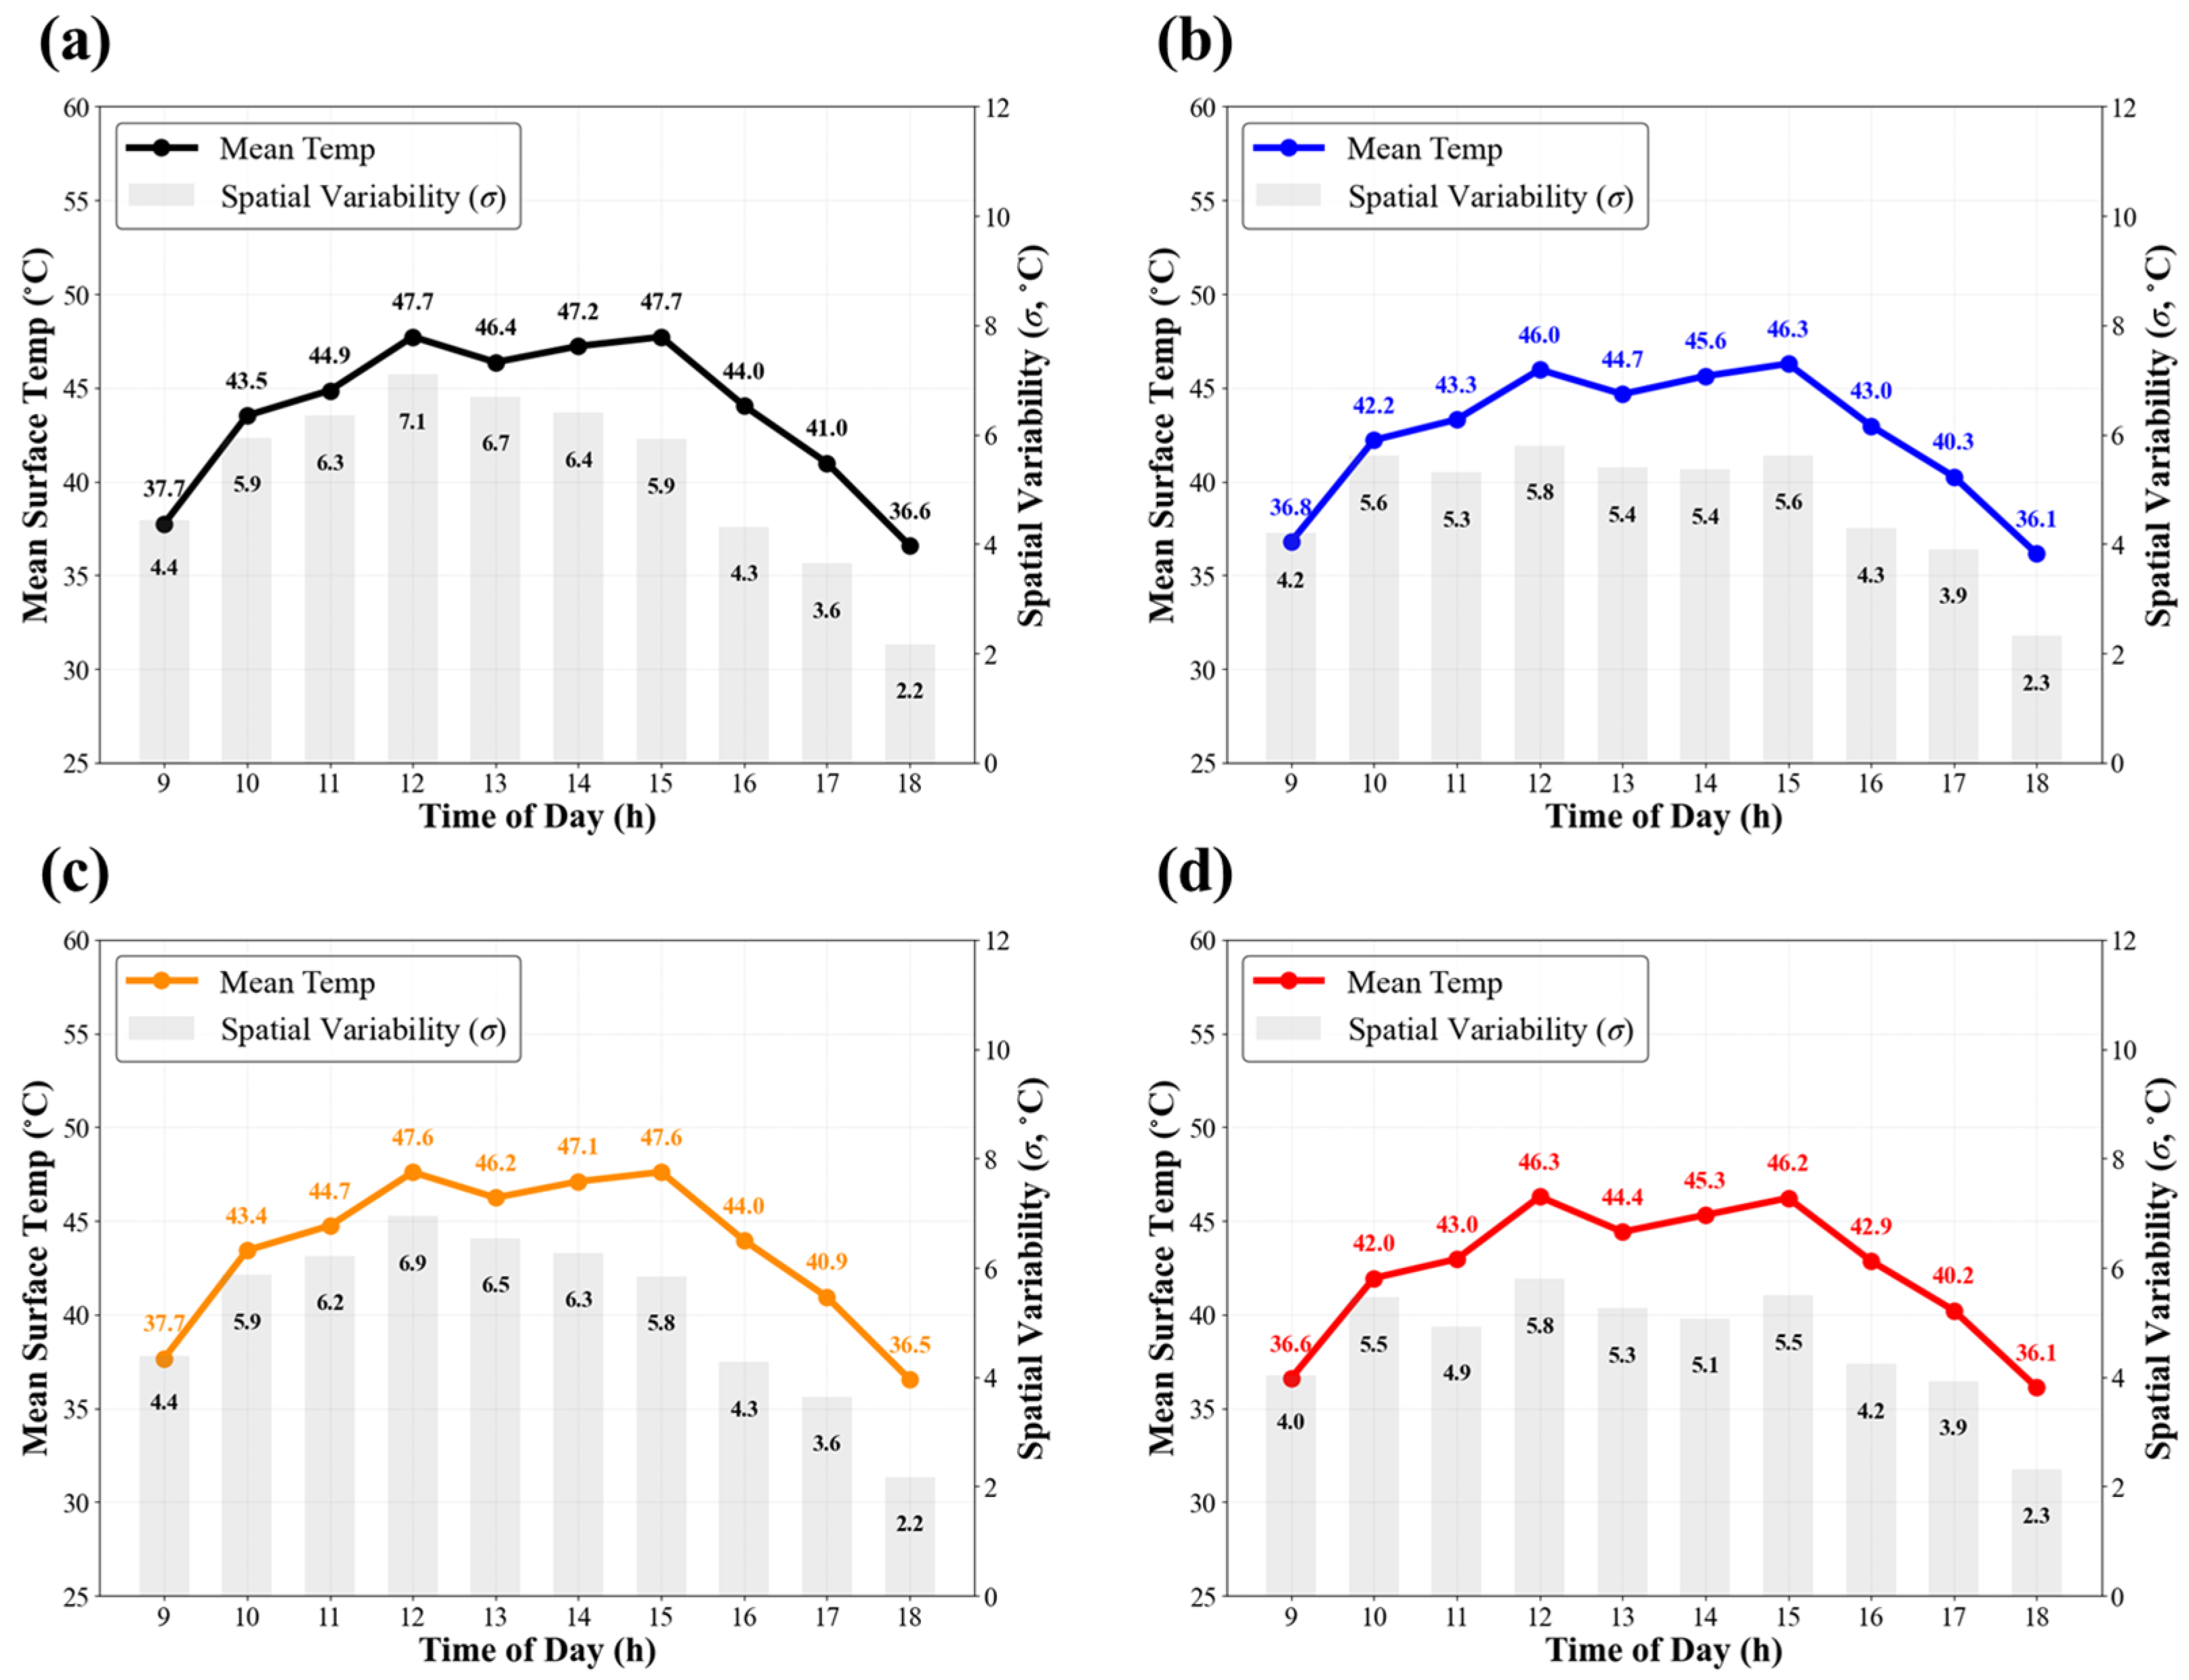
Figure 8 presents the hourly variations in mean domain-wide temperature and spatial variability (
). Regarding spatial variability (
), which serves as a metric for the spatial variability within the grid, Case A (mean
= 5.28) and Case C (mean
= 5.21) exhibited similar levels of heterogeneity. Conversely, Case B (mean
= 4.91) and Case D (mean
= 4.65) demonstrated lower variability, indicating the creation of a more uniform thermal environment across the 3D space. The most significant reduction in spatial variability for Case B compared with Case A occurred during the peak solar radiation period between 11:00 and 14:00. This suggests that concrete optimization is highly effective in alleviating spatial variability during peak hours, which can positively influence pedestrian thermal comfort in the Gwacheon area.
From a practical feasibility standpoint, while Case D provides an additional 0.13 (approx. 9.5%) reduction compared with Case B, it requires the full replacement of asphalt, incurring additional costs. Since Case B achieves over 90% of the maximum possible mitigation effect, it is judged to be the superior strategy in terms of resource allocation efficiency. Furthermore, the results of Case C highlight the limitations of asphalt-only optimization; its cooling effect (0.10 ) is only about 8% of that achieved by Case B (1.24 ).
To provide a consolidated overview of the thermal performance across all simulation scenarios, the key results from
Section 3.1,
Section 3.2 and
Section 3.3 are summarized in
Table 6. This table integrates material-specific LST, pedestrian-level air temperature (
), domain-wide 3D grid temperature, spatial variability (σ), and model validation metrics to facilitate direct cross-scenario comparison.
3.4. CFD-Based Hot Spot and Cool Spot Analysis by Scenario
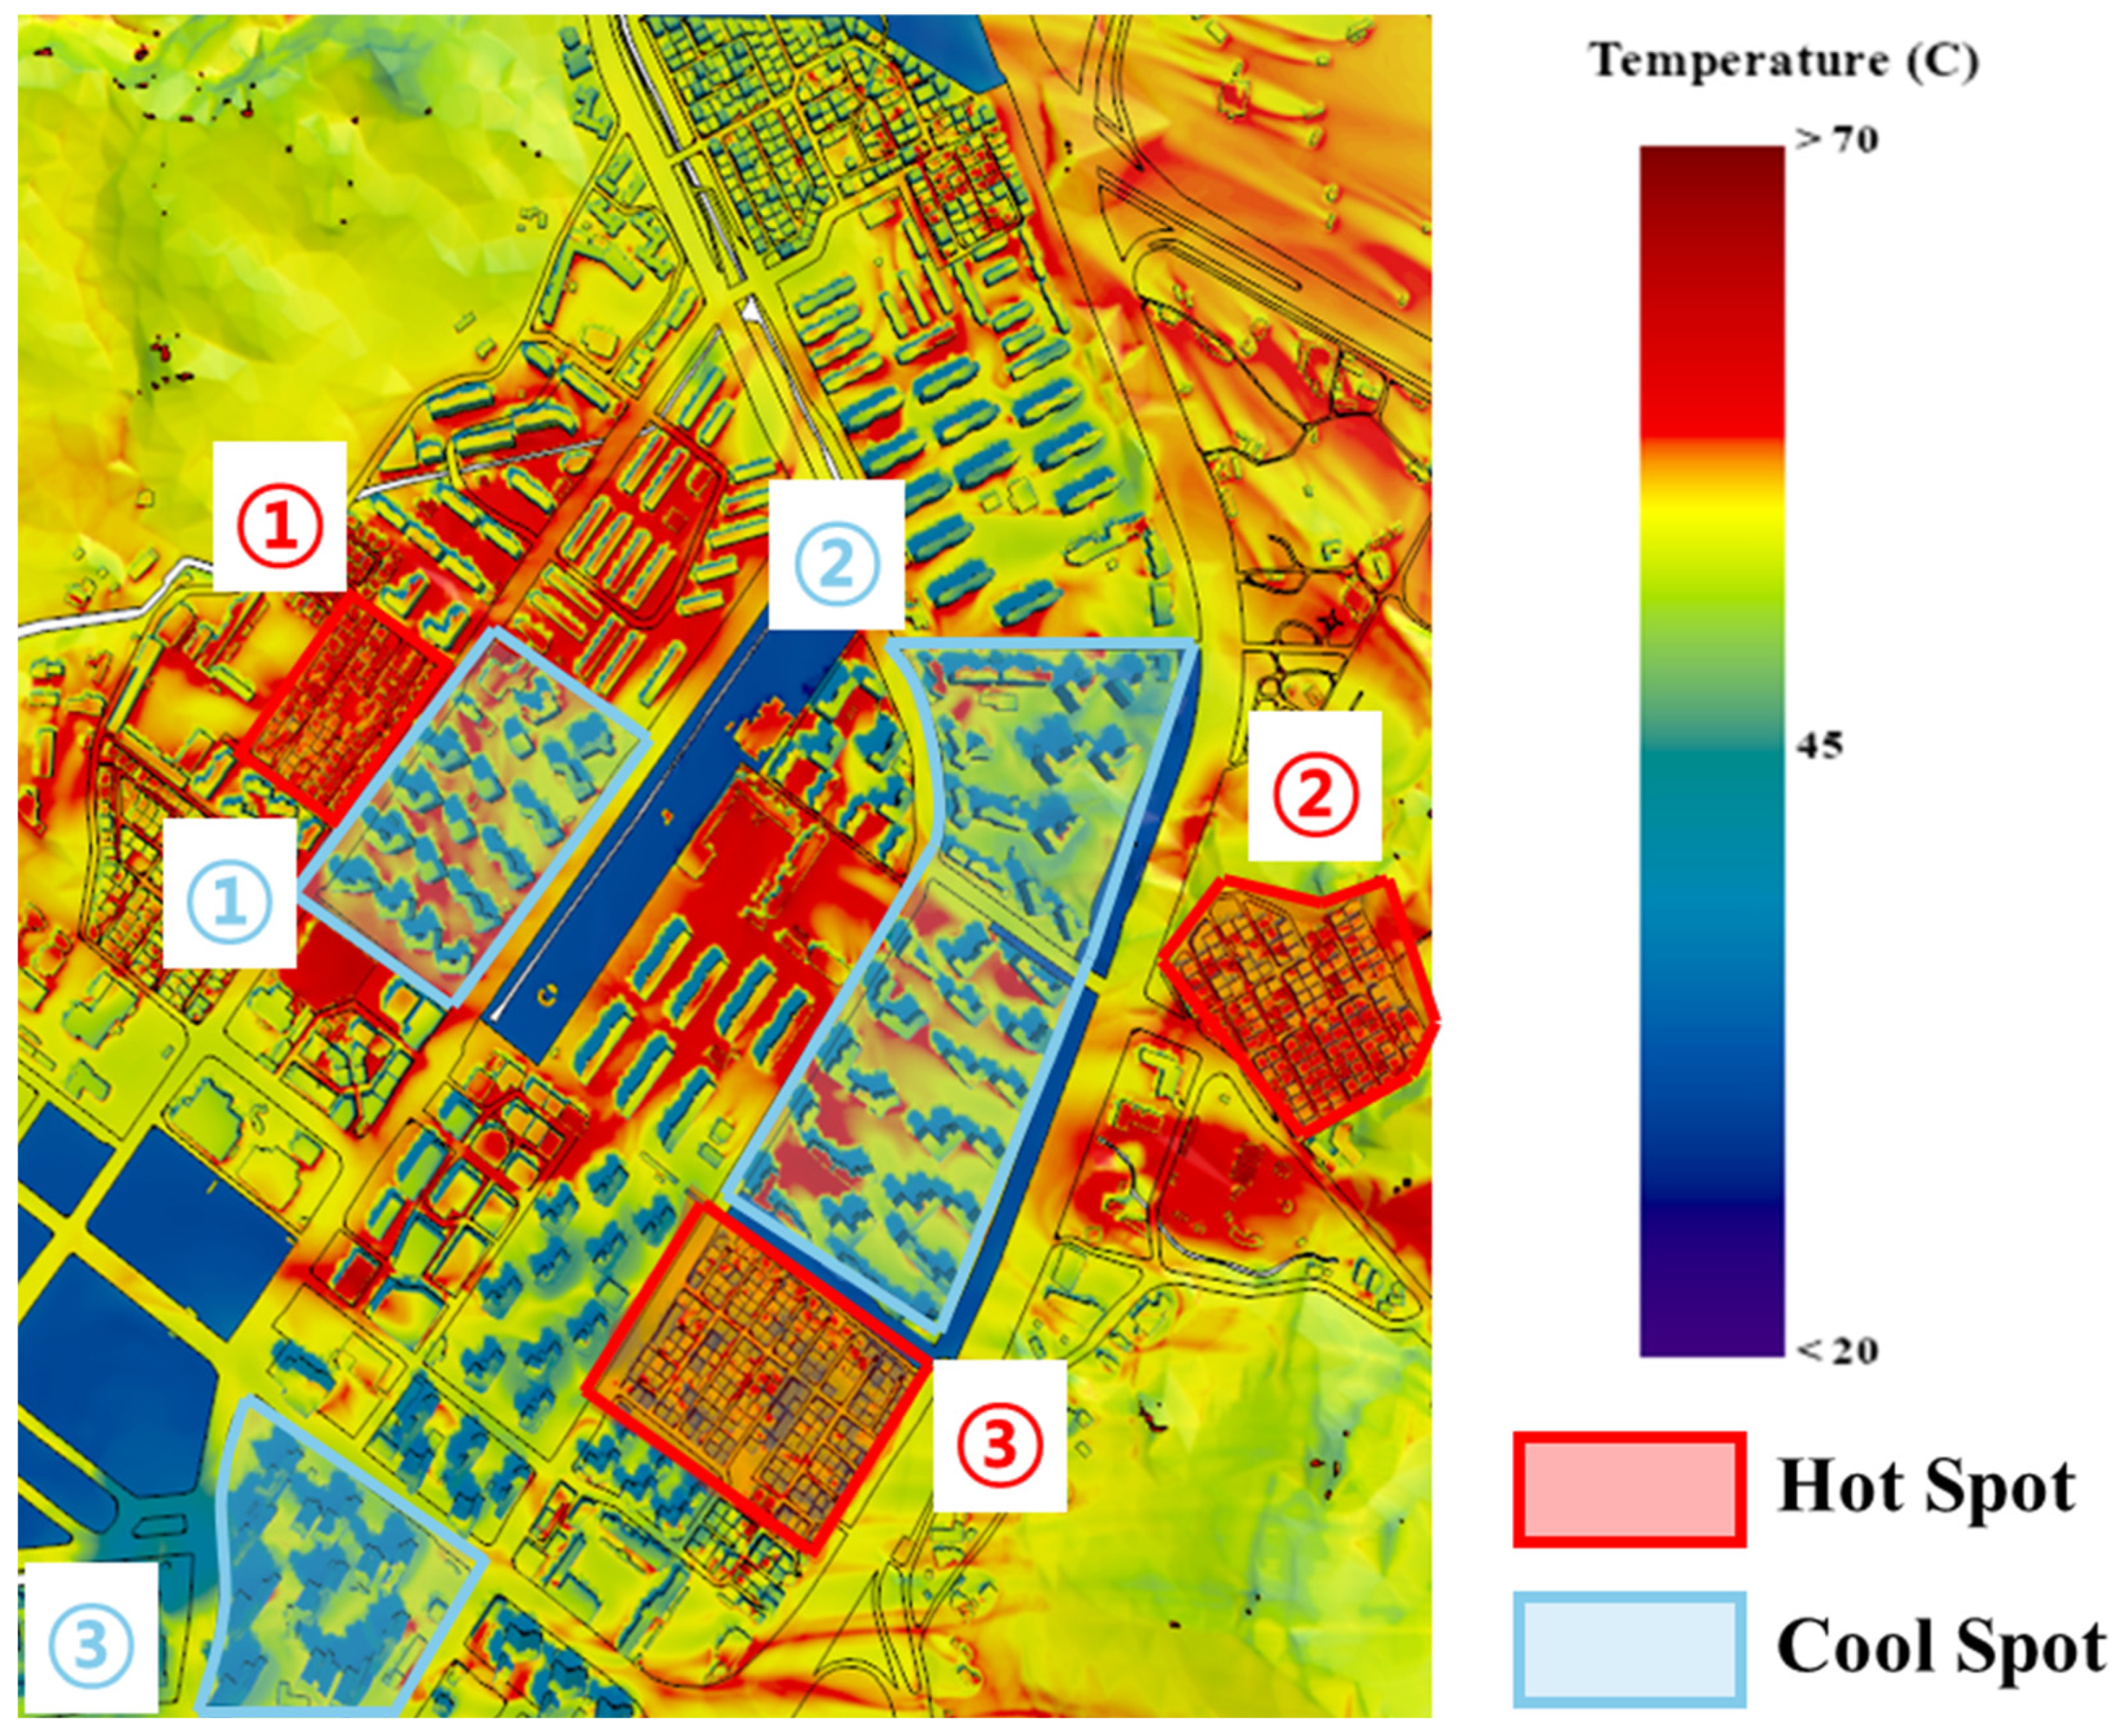
To evaluate the spatial distribution of thermal vulnerability, Hot Spot and Cool Spot regions were identified for Case A (baseline) and Case D (full optimization based on the results at 12:00, the period of peak solar intensity). As shown in
Figure 9, the LST for Case A ranged from approximately 34.2
to 86.2
, while Case D exhibited a lower range of 32.2
to 82.3
, confirming an overall reduction in thermal stress across the domain.
To categorize these thermal zones, a threshold of 3 from the mean LST at 12:00 was applied. Consequently, for Case A (mean LST = 53.7 ), Hot Spots were defined as areas 56.7 and Cool Spots as 50.7 . For Case D (mean LST = 47.4 ), Hot Spots were categorized as 50.4 and Cool Spots as 44.4
The analysis results revealed that both Case A and Case D formed Hot and Cool Spots in the same three specific zones. This suggests that the radiative improvement of urban materials does not significantly alter the spatial location of thermal extremes but is highly effective in reducing the absolute temperature within those zones. An investigation into the causes of Hot Spot formation indicated that these areas are characterized by high impervious surface ratios (concrete and asphalt) and a significant lack of green space. Specifically, prolonged exposure of road networks to direct solar radiation leads to intense heat accumulation, which is further exacerbated by poor ventilation caused by building density. The absence of solar shading and limited evapotranspiration from vegetation are identified as the primary drivers of these high-temperature zones.
Conversely, Cool Spot regions benefited from building arrangements that facilitate better ventilation. In these areas, shadows cast by high-rise buildings reduced direct solar exposure on pavement surfaces, and their proximity to green spaces allowed for lower ambient temperatures through evaporative cooling. Specifically, Cool Spot 1 was significantly influenced by the internal greenery and roadside trees integrated within residential blocks, which provide localized cooling through vegetation. Cool Spot 2 benefited from its location adjacent to the mountainous forests surrounding the residential complex, where the evapotranspiration from the dense forest canopy acts as a thermal buffer. Furthermore, Cool Spot 3 was characterized by being enclosed by a continuous network of roadside trees and its immediate proximity to a large-scale urban park situated directly across the street, which collectively enhanced the cooling intensity at the pedestrian level.
Appendix B illustrates the hourly temperature variations within these identified zones. The Hot Spots began to exhibit higher temperatures than the surrounding areas starting at 10:00, reaching their peak intensity at 12:00, followed by a gradual decrease in temperature differentials after 14:00. Cool Spots maintained lower temperatures relative to the domain average throughout the day, with the most pronounced cooling effect observed between 12:00 and 14:00. Across all time steps, Case D consistently maintained lower Hot Spot temperatures compared with Case A, indicating that material optimization provides a sustained thermal mitigation effect regardless of the time of day.
These findings demonstrate that improving the thermal properties of concrete and asphalt can mitigate the thermal environment of residential complexes. However, the results also suggest that for fundamental improvement, material optimization should be integrated with comprehensive urban planning strategies, such as the expansion of green infrastructure.
3.5. Multi-Dimensional Digital Twin Visualization and Comparative Methodology
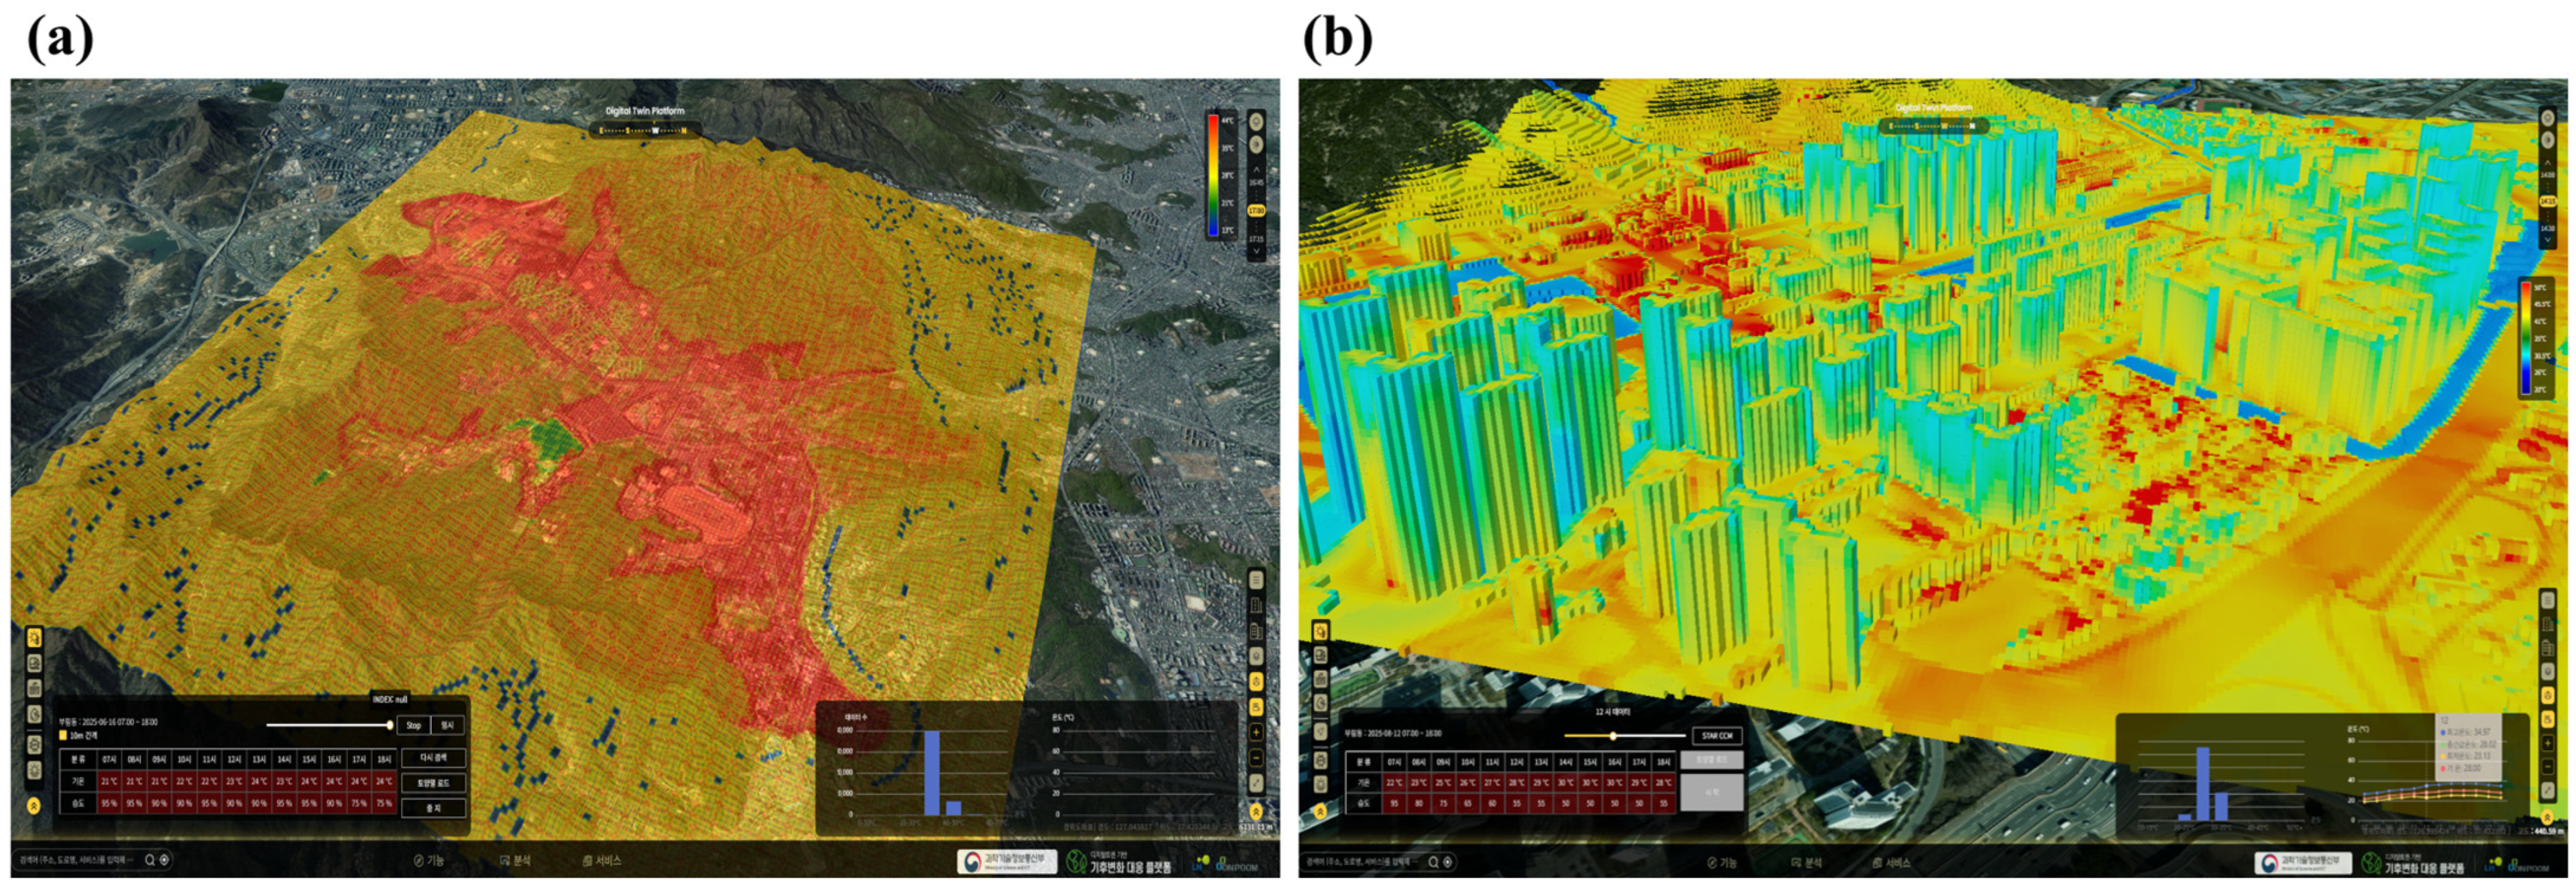
To maximize the practical utility of the CFD simulation results, the multi-layered thermal data were integrated into a digital twin environment. This platform enables an intuitive inspection of urban microclimate dynamics, providing stakeholders with a comprehensive tool for evaluating the efficacy of material optimization strategies. The initial result of this integration, illustrating the synchronized temperature data within the virtual urban model of the Gwacheon site, is presented in
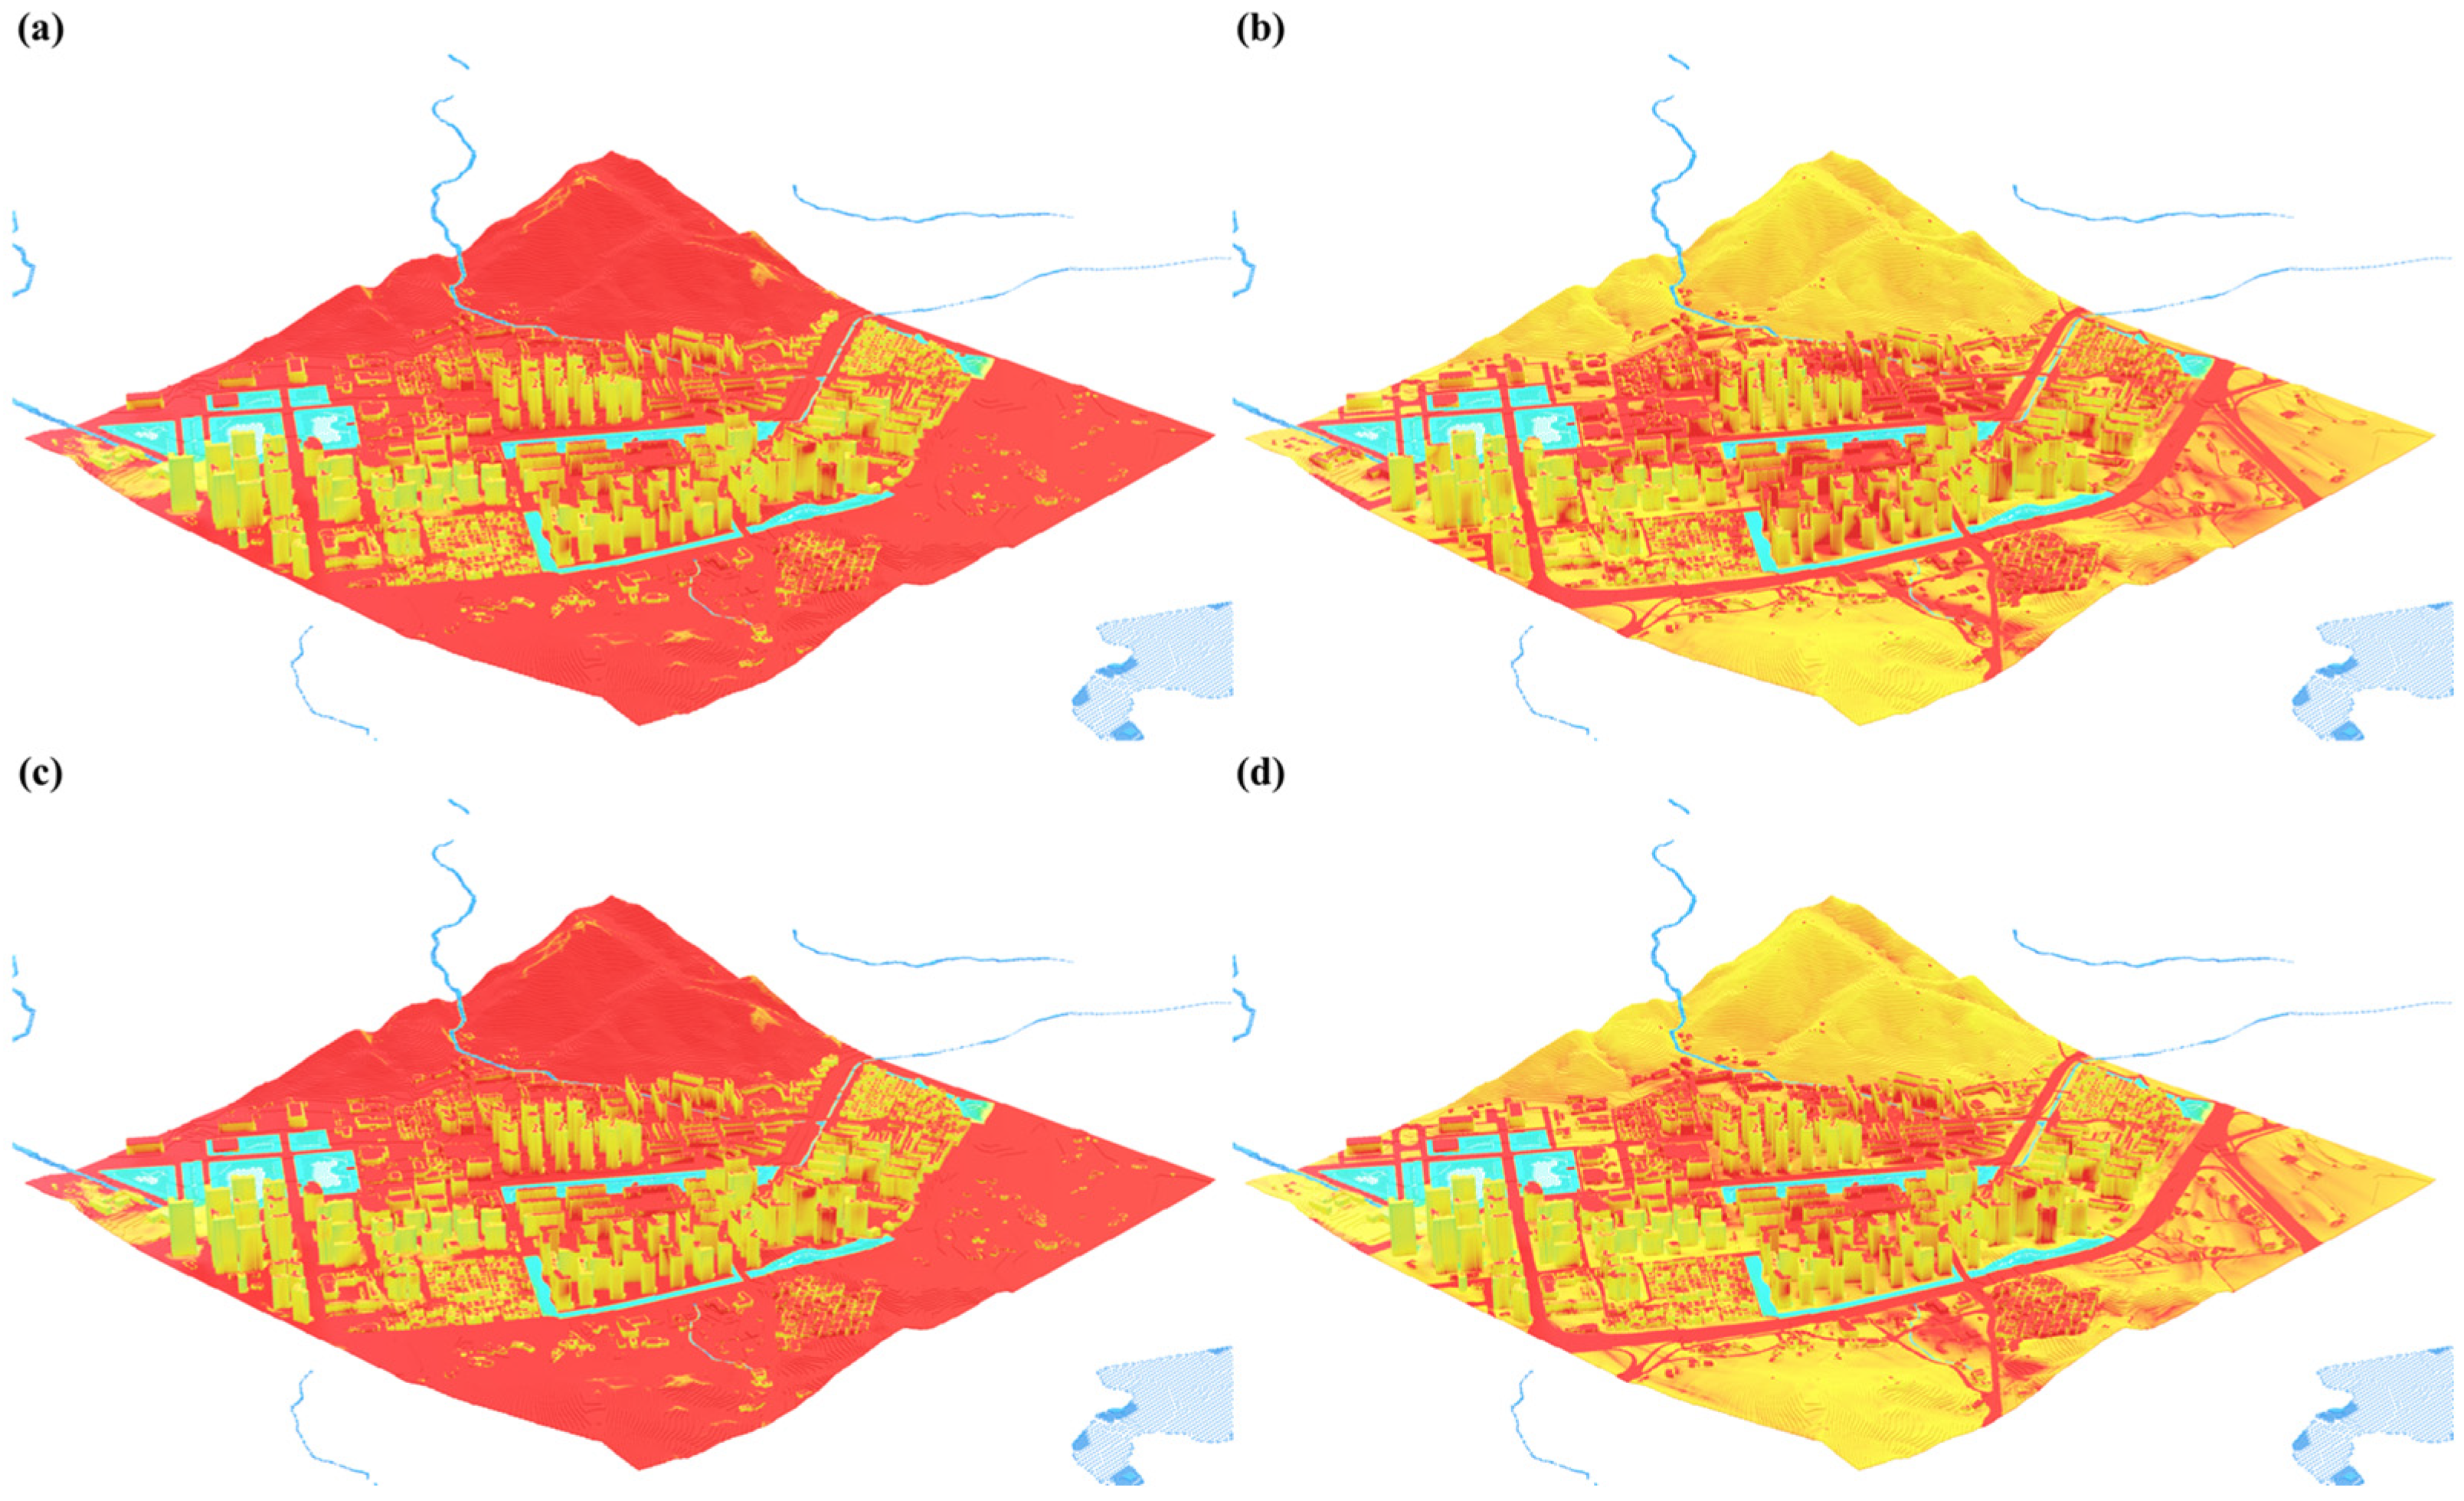
Figure 10. Within this framework, two distinct spatial visualization techniques—GIS-based heat mapping and voxelization—were comparatively evaluated using the peak thermal data recorded at 12:00 for all scenarios.
As shown in
Figure 11, the GIS-based heat map approach utilized X and Y spatial coordinates to generate a continuous thermal surface. This method is particularly advantageous for its ease of interpretation, offering a seamless and visually fluid representation of temperature gradients across the horizontal plane. Due to its straightforward computational logic, GIS heat mapping provides a rapid macroscopic view of thermal trends, making it highly effective for identifying broad surface-level temperature variations.
Conversely, the voxelization method, illustrated in
Figure 12, discretizes the computational domain into 2.5 m volumetric units. While this approach results in a more discrete, grid-like visual appearance compared with the smooth GIS interpolation, it offers more robust representation of the complex 3D urban canopy. Unlike the 2D heat map, voxelization allows for the comprehensive integration of vertical information, such as temperature variations along building facades and the complex shading effects caused by urban morphology.
4. Discussion
The results of the comparative analysis of the four simulation scenarios provide critical insights into the strategic prioritization of urban cooling interventions. Analysis of the LST within the pedestrian realm reveals a clear hierarchy in mitigation efficiency. The baseline mean LST of 46.6
for impervious surfaces was reduced to 42.0
in the fully optimized scenario (Case D), representing a maximum reduction of 4.6
. This magnitude of cooling is consistent with the findings of Santamouris et al. (2011), who observed that advanced cool materials can lower surface temperatures by 4–10 depending on the fabric [
16]. Notably, the optimization of concrete surfaces alone (Case B, 42.3
) captured most of this thermal benefit, leaving a marginal difference of only 0.3
compared with the simultaneous improvement of both concrete and asphalt. This suggests that concrete surfaces, which are present in complex building geometries and pedestrian squares, are the primary sources of terrestrial heat accumulation. As established by Oke (1988) in the “urban canyon” theory, vertical and horizontal concrete facets trap radiation through multiple reflections, making them more critical targets for intervention than relatively open asphalt roads [
11].
In addition to surface temperatures, the impact of pedestrian-level air temperature highlights the effectiveness of targeted material optimization in the human breathing zone. The baseline
of 35.7
was mitigated to 35.3
in Case D, achieving an average reduction of 0.42
. The performance of Case B (0.39
reduction) was nearly identical to that of Case D, with a negligible difference of only 0.03
. This relatively subtle reduction in air temperature compared with LST is a common phenomenon in urban microclimate CFD studies, as noted by Blocken (2015), due to convective mixing and urban ventilation [
25]. These results confirm that sensible heat flux from concrete surfaces is the dominant driver of thermal stress at the pedestrian level, and its selective improvement can effectively alleviate near-surface air temperatures.
Finally, the analysis of the domain-wide grid temperature data—representing the 3D point cloud extracted from the computational volume—further underscores the efficiency of resource allocation. While the mean domain-wide temperature for the baseline (Case A) was 43.67 , the optimized scenarios achieved reductions to 42.43 (Case B) and 42.30 °C (Case D). The performance gap between Case B and Case D was found to be only 0.13 , indicating that concrete optimization alone accounts for about 90.5% of the maximum possible cooling effect. Conversely, asphalt-only optimization (Case C) provides a negligible reduction of only 0.10 , suggesting that prioritizing concrete treatments is approximately 12 times more effective for urban climate adaptation in high-density residential areas.
Furthermore, the mitigation of thermal heterogeneity (
) is as crucial as the reduction in absolute temperatures in enhancing urban livability. High spatial variability in temperature often leads to thermal shock for pedestrians as they move between thermally vulnerable Hot Spots and shaded Cool Spots. This aligns with the argument by Mirzaei and Haghighat (2010) that reducing microclimatic imbalance is key to preventing localized heat stress [
26]. Our analysis shows that concrete optimization is particularly effective in alleviating this imbalance during peak solar radiation periods, reducing the spatial standard deviation from 7.1 to 5.8. By dampening the intensity of Hot Spots—which are primarily driven by high impervious surface ratios and poor ventilation—material optimization contributes to a more uniform and stable microclimate. This suggests that material-based interventions can serve as a vital mid-term solution in dense high-rise districts where structural changes to building geometry or ventilation corridors are physically or economically constrained.
Finally, the integration of these physics-based results into a multi-dimensional digital twin environment represents a significant methodological advancement for urban decision-support. While traditional 2D GIS heat maps provide an intuitive macroscopic overview for rapid reporting, the voxelization approach adopted in this study offers superior long-term utility for urban climate management. By preserving the volumetric integrity of the air and accounting for the complex 3D interactions between building facades and solar shading, voxel-based representations allow for precise “what-if” simulations of future climate scenarios. This high-resolution visualization framework ensures that cooling interventions are not only data-driven but also spatially accurate, enabling city managers to evaluate the vertical thermal stratification that 2D models oversimplify. Ultimately, this integrated simulation and visualization workflow provides a scalable foundation for developing intelligent, climate-responsive urban digital twins.
However, a methodological limitation should be acknowledged. The model validation was limited to temporal comparison of domain-averaged air temperature against a single representative observation point (KMA Gwacheon AWS). While the high R2 values (0.98–0.99) and low RMSE values (0.92–0.98 °C) demonstrate strong temporal agreement, spatial validation of LST distribution was not performed due to the absence of distributed in situ measurements and the unavailability of cloud-free satellite thermal imagery for the simulation date. Future studies should incorporate multi-point spatial validation using data from distributed sensor networks or thermal remote sensing to strengthen model confidence across heterogeneous urban surfaces.
Furthermore, it should be noted that this study focused primarily on evaluating the integrated impact of modifying surface radiative properties rather than decoupling the individual physical contributions of shortwave and longwave radiation. In the proposed scenarios, the optimization of urban materials was implemented by adjusting radiative properties to maintain the energy conservation principle. Future research that adopts advanced multi-spectral radiation models will be necessary to distinguish these effects and identify the primary physical drivers of urban heat island mitigation.
In addition to these methodological aspects, this study acknowledges certain limitations regarding its environmental scope. Firstly, the results are influenced by the specific basin-type topography of Gwacheon, which inherently traps heat and restricts airflow. Secondly, the use of a single representative summer day for worst-case scenario analysis limits the temporal generalization of the cooling effects. Finally, the simplified representation of anthropogenic heat sources, such as traffic and HVAC, may lead to the slight underestimation of local thermal intensity. Addressing these factors in future multi-seasonal and multi-scale studies will further enhance the scientific rigor of the proposed framework.