Article

Balancing Productivity and Ecosystem Services in Major Crops Under Intensive Management in a Semi-Arid Region, Iran


1
Department of Environment, Science & Engineering, Arak University, Arak 38481-77584, Iran
2
School of Geosciences, University of Sydney, Sydney, NSW 2006, Australia
*
Author to whom correspondence should be addressed.
Land 2026, 15(2), 345; https://doi.org/10.3390/land15020345
Submission received: 18 December 2025 / Revised: 4 February 2026 / Accepted: 14 February 2026 / Published: 20 February 2026

Abstract

This study provides a comprehensive economic valuation of ecosystem services and environmental impacts across four major agroecosystems—wheat, barley, sugar beet, and coriander—under intensive management in the semi-arid Nahavand County, Iran. Soil properties, ecosystem service provision, and environmental disservices such as greenhouse gas emissions, soil erosion, and nutrient leaching were systematically assessed using field surveys, farmer questionnaires, and established ecological models. Coriander exhibited the highest net ecosystem service value, ranging from $115,840 to $154,750 ha−1, driven by superior provisioning services (39.77% of total value) and the lowest environmental costs. In contrast, sugar beet presented the greatest ecological burden, with environmental costs exceeding $22,000 ha−1, leading to the lowest net benefits ($51,940–$79,300 ha−1). Nonlinear Gaussian regression models demonstrated strong predictive capacity (R = 0.91 to 0.99) for marketable value based on yield metrics, highlighting the importance of biomass productivity in economic valuation. These findings underscore the multifunctionality of coriander and emphasize the pivotal role of crop selection in optimizing agroecosystem sustainability, balancing food security, ecosystem health, and environmental conservation in semi-arid agricultural landscapes.

1. Introduction

Ecosystem services (ESs) refer to the diverse benefits that humans derive from natural and managed ecosystems, encompassing provisioning, regulating, supporting, and cultural services that underpin human well-being [1]. These services play a fundamental role in securing food supply, regulating climate, purifying water, maintaining soil fertility, and supporting biodiversity. Given that agricultural landscapes cover approximately 38% of the Earth’s terrestrial surface, they are crucial both as providers and potential degraders of these services, depending largely on land management practices [2].
In recent decades, the intensification of agricultural production to meet rising food demands has led to substantial declines in ecosystem service quality and availability. This includes increased greenhouse gas emissions, biodiversity loss, and water resource depletion, all of which pose significant threats to the sustainability of global food systems [3]. Such pressures are particularly acute in semi-arid and arid regions, where fragile ecosystems are highly vulnerable to climate variability and anthropogenic stressors [4]. Consequently, accurate quantification and valuation of ecosystem services in agricultural systems have emerged as essential tools for promoting sustainable land management and policy development.
Semi-arid agricultural systems face compounded environmental and socio-economic challenges, such as limited water availability, soil degradation, extreme temperature fluctuations, and heightened exposure to climate change impacts [5,6]. These ecosystems are highly sensitive to land-use changes: unsustainable farming practices can accelerate soil erosion, salinization, and consequent declines in productivity [7]. Iran exemplifies such conditions, characterized by extensive semi-arid and arid zones and a heavy reliance on agriculture for economic stability and rural livelihoods. Notably, nearly 90% of Iran’s water resources are allocated to agriculture, yet water-use efficiency remains suboptimal [8]. Unsustainable practices, including over-irrigation, excessive fertilizer application, and monoculture cultivation, exacerbate environmental degradation manifesting as groundwater depletion, soil salinity, and biodiversity loss [9]. Within this context, understanding ecosystem services in Iranian agricultural landscapes is critical for developing integrated strategies that balance agricultural productivity with environmental stewardship. Identifying trade-offs and synergies among provisioning, regulating, supporting, and cultural services is pivotal for enhancing food system resilience and conserving natural capital. The Nahavand region in Hamedan Province, western Iran, typifies a semi-arid agricultural zone with cold winters and warm, dry summers. It supports key food crops such as wheat, barley, sugar beet, and coriander, cultivated under both irrigated and rainfed conditions depending on local water availability and soil characteristics [10]. Despite a rich agricultural heritage, the Nahavand region faces growing environmental pressures, including water scarcity, soil fertility decline, and biodiversity loss [10]. Traditional farming methods, compounded by climate variability, have increased the vulnerability of local agroecosystems, raising concerns over their long-term sustainability. Recent literature emphasizes the need for localized, site-specific ecosystem service assessments to inform sustainable land management tailored to regional conditions [11].
Globally, numerous studies have highlighted the multifunctionality of agroecosystems and the importance of evaluating ecosystem services comprehensively. Power [12] emphasized the simultaneous provision of market and non-market benefits in agroecosystems, while Zhang et al. [13] demonstrated that agricultural intensification often entails trade-offs between provisioning and regulating services. More recent integrated frameworks [14,15,16] have advanced methodologies for quantifying ecosystem service values across diverse agricultural management scenarios. Despite increasing recognition of these dynamics, comprehensive assessments integrating multiple ecosystem services at the farm scale remain scarce in Iran. Existing studies tend to focus on single aspects such as water use efficiency [17] or biodiversity impacts from land-use changes [18], without a unified framework that captures the complex interactions and trade-offs inherent in different cropping systems. Moreover, comparative analyses of ecosystem service provision and economic outputs among key crops—wheat, barley, sugar beet, and coriander—are largely absent.
This gap highlights the need for crop-specific and management-sensitive ecosystem service assessments that go beyond single-service or yield-centered evaluations, particularly in data-scarce semi-arid regions. While previous studies have often focused on individual ecosystem services or modeled scenarios, empirical farm-scale comparisons that simultaneously integrate ecosystem services and environmental disservices under comparable management conditions remain limited [16,17,18,19].
In this context, the present study offers a novel, integrated assessment of agroecosystem performance by monetizing both ecosystem services and environmental disservices across four major crops—wheat, barley, sugar beet, and coriander—using primary data from 150 intensively managed smallholder farms in the semi-arid Nahavand region of Iran. Unlike many existing valuations, this approach explicitly accounts for trade-offs between provisioning, regulating, supporting, and cultural services and the associated environmental costs, allowing net ecosystem service values to be compared across cropping systems under similar management intensity. By adopting a farm-scale, crop-level comparative framework in a semi-arid, data-limited context, this study advances ecosystem service accounting from descriptive valuation toward decision-support analysis. The results provide empirically grounded insights into how crop choice alone—under broadly similar intensive practices—can lead to markedly different sustainability outcomes. These findings are intended to inform integrated land-use planning and agricultural policy by highlighting management-relevant trade-offs among productivity, environmental integrity, and rural livelihoods, with implications extending beyond the regional case to other water-limited agricultural landscapes.

2. Materials and Methods

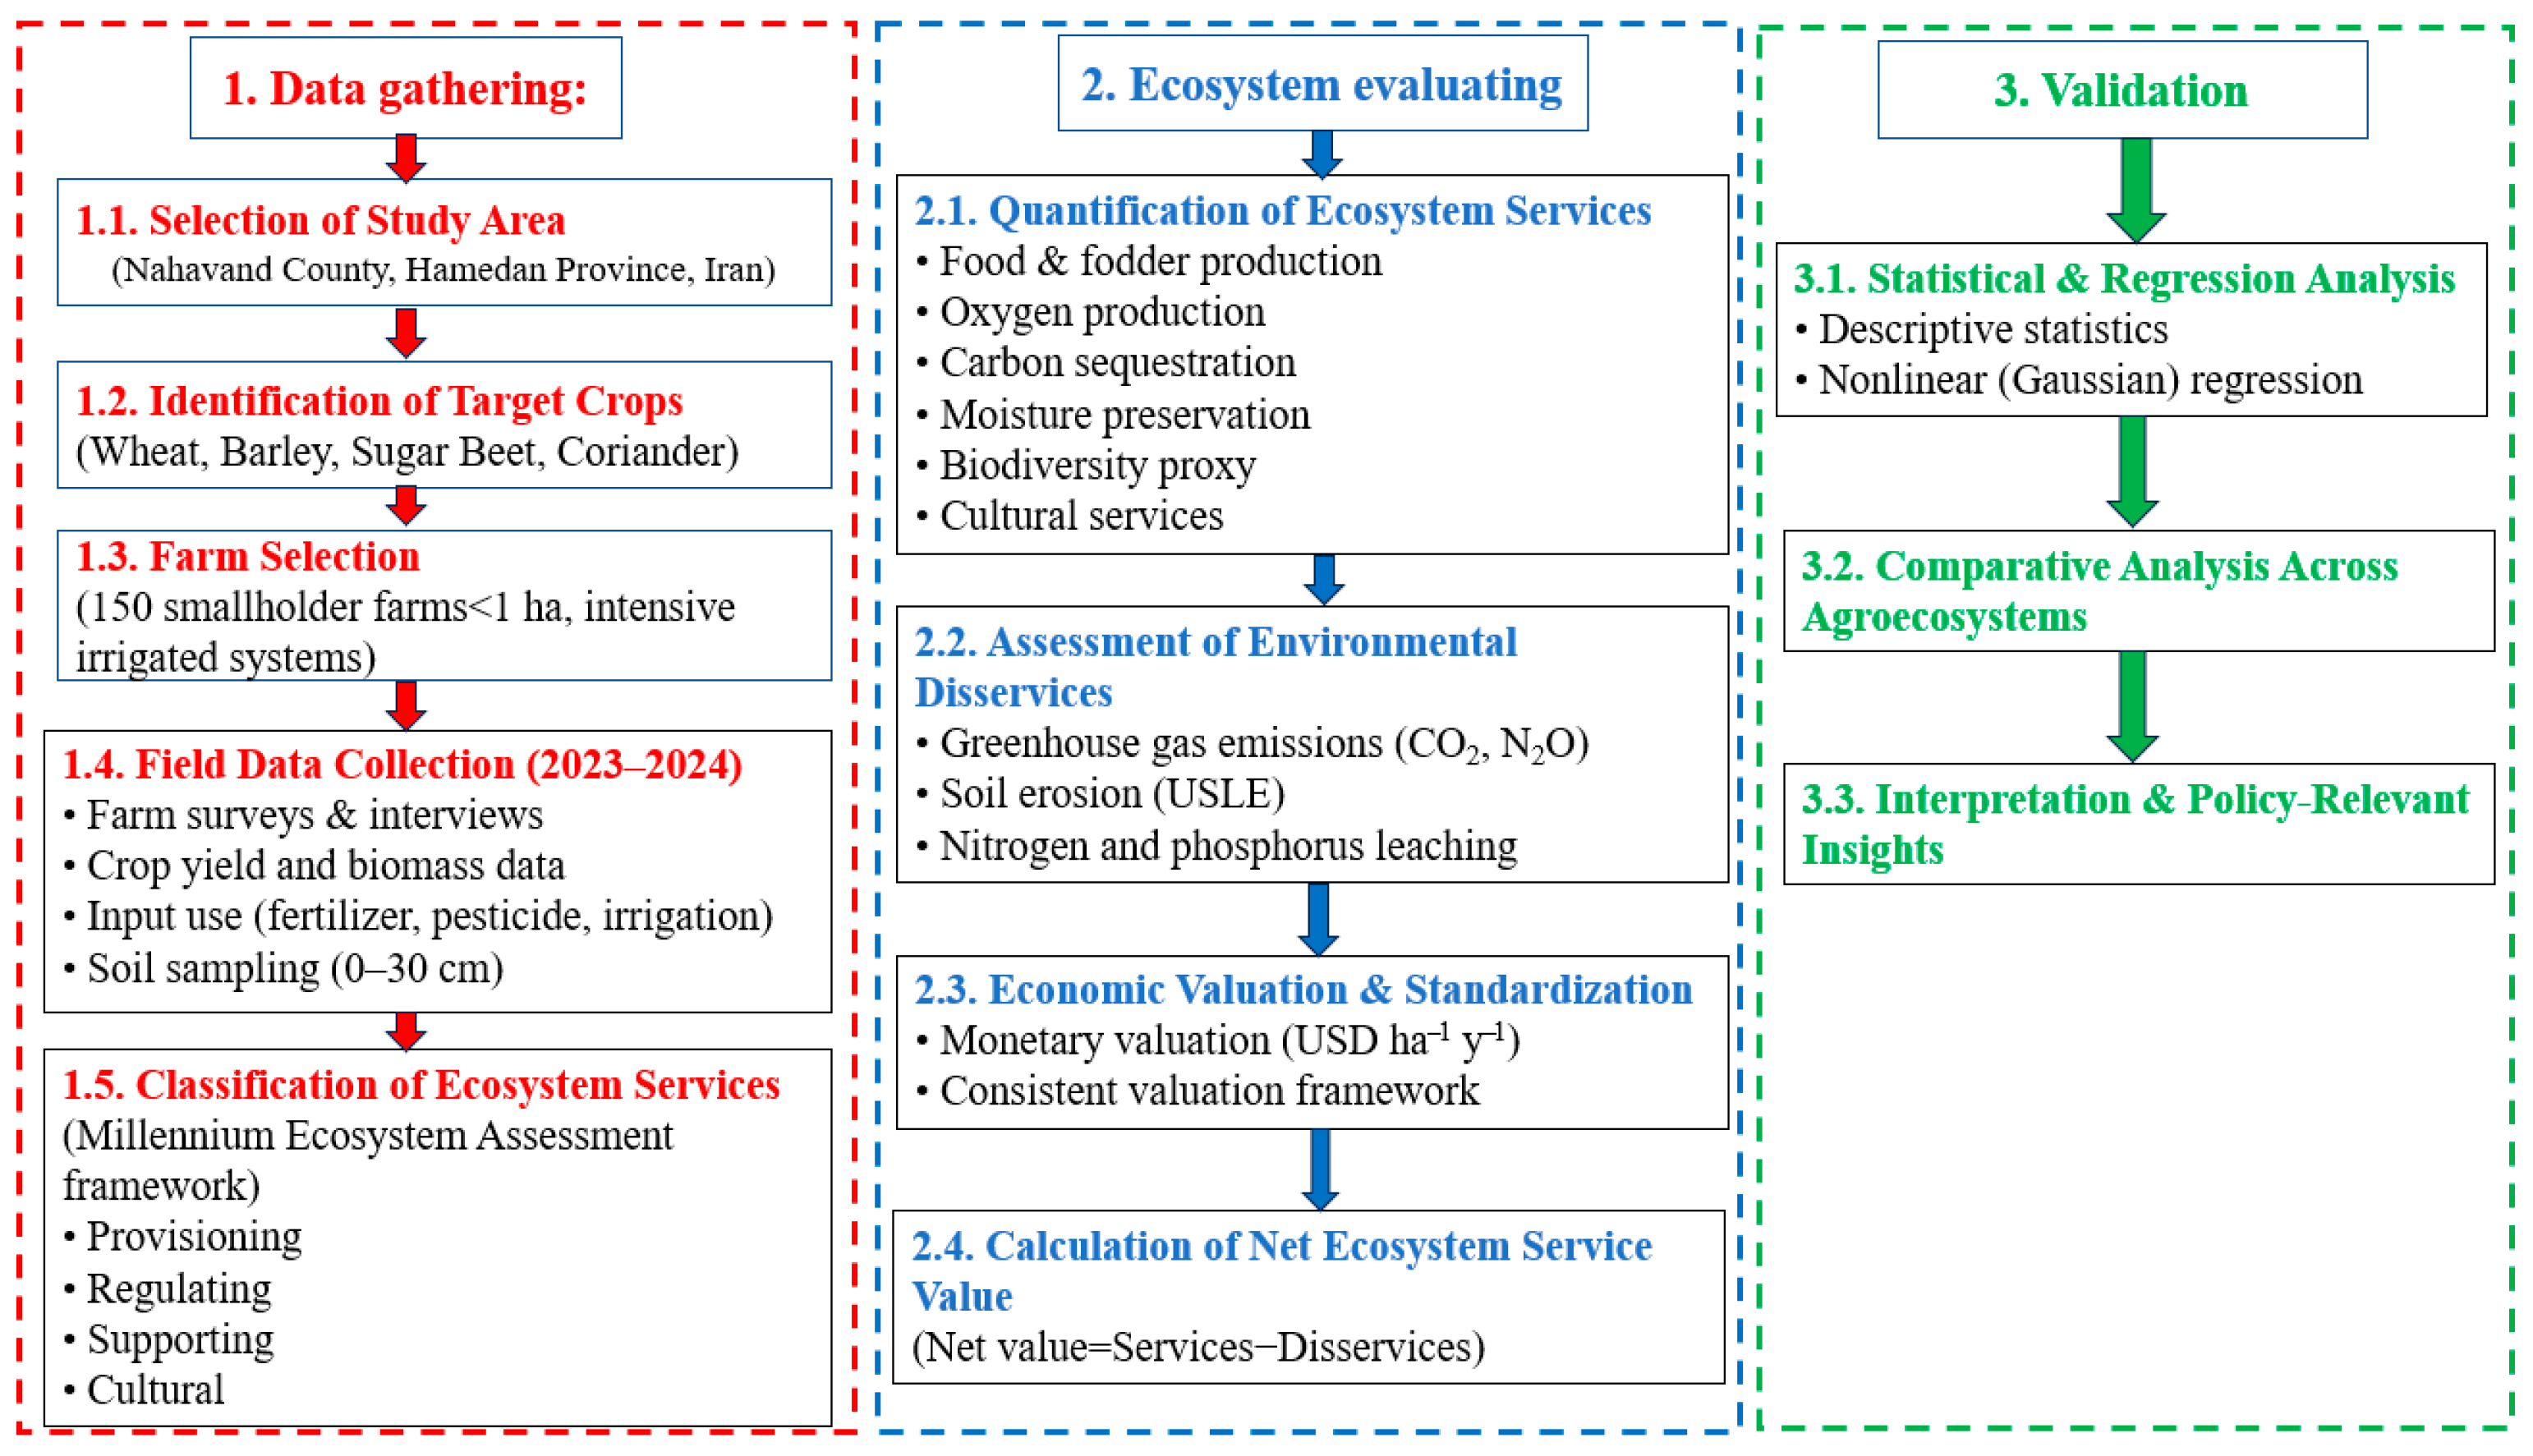
The methodological framework of this study is organized into three main phases, as illustrated in Figure 1. The first phase focuses on data gathering and includes study area characterization, farm selection, and collection of farm-level agronomic and socio-economic data through field surveys and interviews. The second phase involves ecosystem evaluation, encompassing the quantification and monetary valuation of ecosystem services and environmental disservices across the studied agroecosystems. The third phase addresses validation and analysis, including statistical assessment, modeling, and consistency checks to ensure robustness and comparability of the results across crops. This phased approach was adopted to enhance transparency, methodological clarity, and reproducibility of the ecosystem service assessment.

2.1. Study Area and Agronomic Conditions

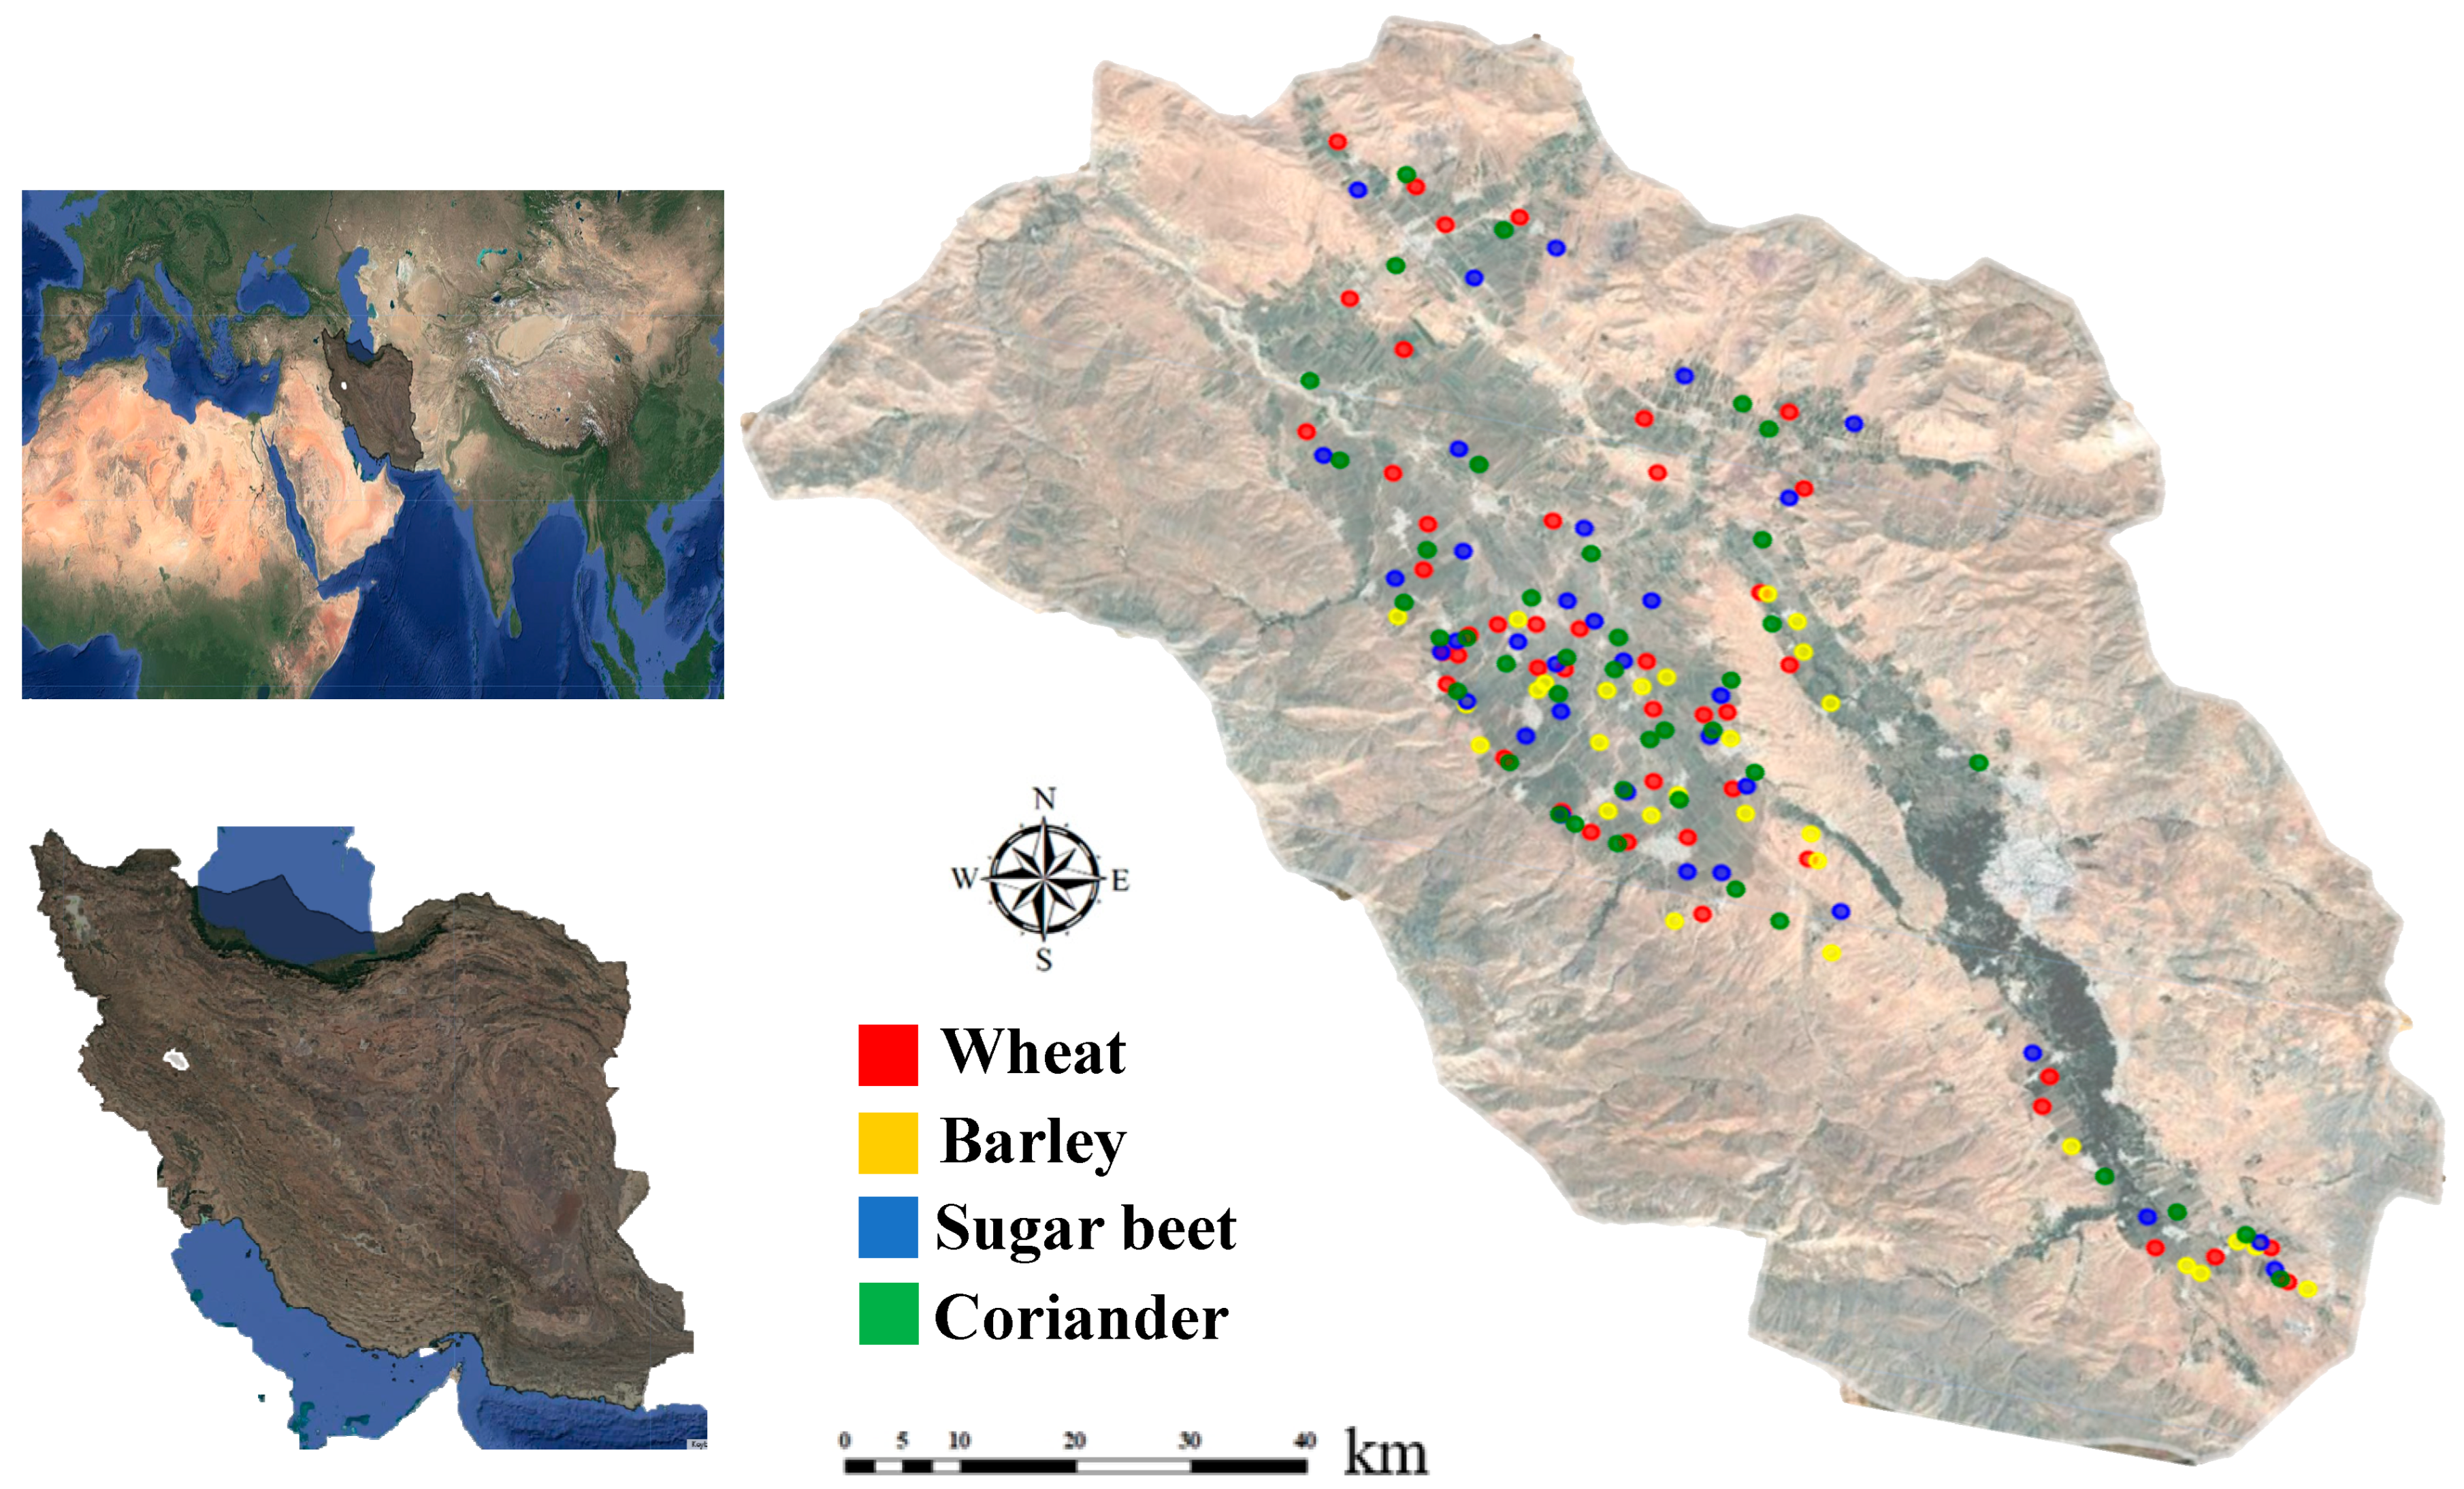
This study evaluates the ecosystem service values of four major food crops—wheat, barley, sugar beet, and coriander—cultivated across 150 smallholder farms in Nahavand County, Hamedan Province, western Iran (Figure 2). All sampled plots represent single-crop systems managed under intensive irrigated conditions during the 2023–2024 growing season. Each field was dedicated to one dominant crop, reflecting the prevailing small-scale farming structure of the region, where fragmented landholdings are typically managed as individual crop units rather than diversified rotations. The management systems are characterized by high input intensity, including frequent irrigation, substantial fertilizer application, and mechanized field operations.
Nahavand County is located between 33°57′ N and 47°53′ E and is classified as arid according to Dumarten’s system and as arid–cold under the Ambergris climate classification. The mean annual temperature is 14.37 °C, with July as the warmest month (36.65 °C) and January the coldest (−2.52 °C). During the 2023–2024 cropping period, the two-year mean annual precipitation was 327.6 mm, while reference evapotranspiration reached approximately 1952.5 mm, indicating strong seasonal water limitation and high evaporative demand during the summer months [6].
Agriculture plays a central socio-economic role in Nahavand County. The total population of the county is approximately 178,787 inhabitants, of whom about 85,333 are directly dependent on agricultural activities. Local agricultural statistics report approximately 13,551 registered agricultural operators, managing a total agricultural area of about 153,600 ha. Of this area, nearly 66,388 ha are under cultivation, including irrigated (28,153 ha) and rainfed (17,516 ha) systems. Although rainfed agriculture is present at the regional scale, the present study focuses exclusively on intensive irrigated farms to ensure consistency in management conditions and comparability across cropping systems.
The agricultural landscape is dominated by smallholder fields (<1 ha) embedded within a heterogeneous mosaic of farmland and natural patches, reflecting long-established land-use configurations and shared local farming practices. Nahavand represents a relatively compact and physiographically homogeneous unit, characterized by gently sloping terrain and broadly similar soil and climatic conditions. As illustrated in Figure 1, the sampled farms are spatially interspersed across the county rather than concentrated in distinct environmental zones. To minimize the influence of confounding environmental factors, fields located on steep slopes, atypical landforms, or within urbanized and industrial areas were intentionally excluded.
Given the limited spatial extent of the county and the uniformity of intensive management practices among smallholder farmers, differences in ecosystem service values observed among wheat, barley, sugar beet, and coriander agroecosystems are interpreted primarily as a function of crop-specific traits and management characteristics rather than underlying natural gradients. The final dataset therefore represents typical intensive, irrigated smallholder production systems in Nahavand County, providing a consistent basis for comparative ecosystem service assessment.

2.2. Data Collection

Official statistics on the exact number of farms cultivating wheat, barley, sugar beet, and coriander in Nahavand County were not available. To address this information gap, farm population estimates were derived through a combination of literature review, consultation with local agricultural officers, and field reconnaissance. Based on these sources, the total farming population of the county was estimated at approximately 77,986 individuals (expert-based estimate).
Sampling was intentionally restricted to intensive smallholder systems, in line with the objective of assessing ecosystem services under high-input irrigated cultivation. A total of 150 farms were surveyed across the four target crops. All sampled plots were irrigated, managed intensively—characterized by frequent irrigation events, elevated fertilizer inputs, and mechanized field operations—and smaller than 1 ha. Rainfed (dryland) farms were explicitly excluded from the sampling frame to ensure consistency in management conditions and comparability among agroecosystems. Each sampled plot represented a single-crop field managed by an individual farmer during the 2023–2024 cropping season.
Data collection combined structured face-to-face interviews with farmers, direct field measurements of crop yield and cultivated area, and examination of farm records where available. A standardized questionnaire was used to collect detailed farm-level information on input use (types and quantities of chemical fertilizers and organic manure, irrigation frequency, fuel consumption, and machinery use), production outputs (grain and straw yields), and management practices relevant to ecosystem service assessment.
The minimum required sample size was determined using Cochran’s formula (Equation (1)). The final sample of 150 farms satisfies the calculated requirement for estimating mean ecosystem service indicators within the intensive irrigated smallholder stratum at a 95% confidence level. Following this calculation, potential respondents were systematically approached for face-to-face interviews to achieve balanced representation across crop types.
n = n = 150 i = 1 z 2 p q d 2 1 + 1 N z 2 p q d 2 1
where n represents the calculated sample size, N is the total farm population, z is the Z-value corresponding to the 95% confidence level, p and q denote the estimated proportion of farms exhibiting the trait of interest and its complement, respectively, and d indicates the desired margin of error.
Given that a substantial proportion of smallholder farmers have limited literacy, all questionnaires were administered orally and completed by the researchers based on farmers’ verbal responses to ensure consistency and data quality. The questionnaire captured information on farm size and land tenure, farmer characteristics (age, farming experience, and education level), labor inputs, degree of mechanization, crop rotation history and fallow periods, fertilizer and pesticide application rates, presence and characteristics of windbreaks, and indicators related to cultural ecosystem services, including visitor frequency and duration of farm visits.

2.3. Ecosystem Services and Environmental Impacts

This study quantified ecosystem services (ES) and environmental disservices (EDS) across the sampled 150 intensive smallholder farms cultivating wheat, barley, sugar beet, and coriander in Nahavand County. Ecosystem services were classified following the Millennium Ecosystem Assessment framework [1]. Given the characteristics of intensive agricultural systems and the availability of reliable farm-level data, the analysis focused on ecosystem services and disservices that could be consistently quantified across all sampled farms [20,21].
The evaluated ecosystem services included provisioning services (food and fodder production), regulating services (oxygen production, moisture preservation, carbon sequestration, and soil erosion control), supporting services (biodiversity maintenance), and cultural services (recreational value). Environmental disservices comprised greenhouse gas (GHG) emissions, soil erosion, and pollution associated with fertilizer and pesticide use. Environmental disservices were treated as costs and subtracted from the total value of ecosystem services to calculate the net ecosystem service value (NESV) for each farm. All monetary values are reported in U.S. dollars per hectare per year (USD ha−1 y−1), using the average exchange rate for the 2023–2024 period.
(A) Provisioning services: Food and fodder production were valued using market prices of harvested grain and straw. Crop yields were obtained from farmer questionnaires and field measurements. The resulting value represents the direct market contribution of each agroecosystem to food supply and livestock feeding [22].
(B) Regulating services:
1. Oxygen production. Oxygen production was estimated using total dry matter (TDM) production as a proxy. A conversion factor of 1.2 kg O2 per kg of dry biomass was applied [23]. The total amount of oxygen produced was monetized using prevailing industrial oxygen prices.
2. Moisture preservation. For farms with windbreaks, moisture preservation was estimated following the method of Kumar [24], which assumes a 10% reduction in soil evaporation per row of medium-density windbreaks. The volume of water conserved was valued using local irrigation water prices [25].
3. Carbon sequestration. Carbon sequestration was assessed based on (i) carbon stored in aboveground biomass and (ii) changes in soil organic carbon (SOC) where crop residues were returned to the soil. Biomass carbon content was assumed to be approximately 45% of dry matter. Carbon stocks were converted to CO2 equivalents and monetized using European carbon tax rates as a standardized reference value [23].
(C) Supporting services:
1. Biodiversity. Biodiversity impacts were estimated indirectly based on pesticide application intensity. Following Kumar [24], pesticide use was assumed to result in a 10–15% reduction in ecosystem biodiversity. For valuation purposes, biodiversity was assumed to account for up to 15% of total ecosystem service value, consistent with the MEA [1] framework. For self-pollinated crops (wheat, barley, and coriander), direct pollination services were not valued, although indirect ecological functions of insects were acknowledged.
(D) Cultural services; Cultural ecosystem services were estimated using farmer-reported information on visitor frequency and duration of visits to farms. Economic values were derived using the average travel cost approach, based on local public transportation fares, following De Groot et al. [20].
(E) Environmental disservices:
1. Greenhouse gas emissions. GHG emissions considered here were CO2 and N2O. Methane (CH4) emissions were not included in the CO2-equivalent calculations because all sampled farms were managed under aerobic, non-flooded cropping systems (wheat, barley, sugar beet, and coriander) with no periods of waterlogging during the study year. Under such conditions, CH4 fluxes from cropland soils are generally negligible compared to N2O and CO2 emissions. Accordingly, consistent with IPCC guidelines and previous studies on upland intensive cropping systems, only N2O and CO2 were considered as the dominant greenhouse gases.
GRG emissions were calculated in CO2 equivalents using emission factors reported for field crops: 0.036 kg m−2 y−1 for N2O and 264.7 g m−2 y−1 for CO2 [1,26]. The monetary value of GHG emissions (VGHG) was calculated as Equation (2):
V G H G = C T × T C e q
where VGHG refers to the price of GHGs, CT denotes to the carbon tax (the price per unit of CO2 based on the global standard price), and TCeq represents the total amount of GHGs produced, equivalent to CO2. The value of TCeq is calculated from Equation (3):
T C e q = ( E N 2 O + N 2 O e q ) + E C O 2 × C O 2 e q
where E N 2 O represents the amount of N2O emissions, E C O 2 represents the amount of CO2 emissions, N 2 O e q is the CO2 equivalent for N2O, which, according to the IPCC report, is equal to 310 [27] and C O 2 e q is also the CO2 equivalent, which was considered to be 1.
2. Soil erosion. Soil loss was estimated using the Universal Soil Loss Equation (USLE). This evaluation is as follows Equation (4):
U S L E = R K L S C P
where USLE represents the annual average soil erosion (t ha−1 y−1), R is the rainfall erosivity index for the geographical region, K is the soil erodibility factor, L is the slope length, S is the slope angle, C is the vegetation cover, and P is the soil conservation practice factor.
In the absence of official soil erosion maps, all input parameters required for estimating soil loss were derived from a combination of available data sources and field-based measurements on the 150 sampled farms. The R factor (rainfall erosivity) was computed using long-term precipitation records obtained from the Nahavand meteorological station. Soil erodibility (K factor) was determined through laboratory analyses of soil samples collected from each farm. At each farm, surface soils (0–30 cm) were sampled using a composite strategy in which five subsamples—taken from the four corners and the center of the field—were combined to obtain a representative sample for plots smaller than 1 ha.
Slope length and steepness (L-S factor) were measured directly in the fields to capture farm-specific topography. Cover and management (C factor) were evaluated using on-site observations of crop cover, residue management, and prevailing agronomic practices. Support practices (P factor) were estimated by assessing the presence and effectiveness of soil conservation measures, integrating both field observations and information provided by farmers, complemented with secondary data from official reports when available. Using these RUSLE parameters, soil loss was calculated individually for each farm, providing the most accurate estimates possible given the available data.
Soil organic carbon (SOC) depletion was measured to a depth of 30 cm in two phases: pre-planting and post-harvest. The observed SOC losses were primarily attributed to biological and microbial activity within the soil. The decline in soil organic matter (SOM), which is largely released as CO2, was exacerbated in commercial farming systems by repeated tillage, high nitrogen fertilizer application, and ensuing accelerated biological and chemical processes. Additional contributors to SOC loss included the suppression of weed growth—an important source of SOM—and various other site-specific factors.
Soil erosion was estimated using Equation (4), derived from the Universal Soil Loss Equation (USLE) model, following the approach outlined by Vaezi et al. [28] and Ostovari et al. [29]. In addition, the loss of SOM over the course of the production period was calculated by determining the decrease in SOM mass per hectare, as described in Equation (5):
S O M L = C O M × S B D × S L T × A r e a
where SOML is soil organic matter lost, COM is the changed organic content (%), SBD represents soil bulk density (kg m−3), SLT is soil layer thickness (m), and Area is the area of cultivation (m2 ha−1 10,000) × (ha).
3. Pollution from fertilizer and pesticide use. The environmental costs associated with fertilizer and pesticide use were estimated for all 150 farms based on the actual input data collected during field surveys. Nitrogen (N) and phosphorus (P), as the primary contributors to agroecosystem pollution, were assessed in terms of their leaching potential. In Iranian agroecosystems, nitrogen uptake efficiency is approximately 40%, implying that 60% of applied nitrogen is susceptible to leaching [30]. For each farm, nitrogen fertilizer application rates ranged from 500 to 1000 kg ha−1 depending on the crop, with a N content of 45%. Phosphorus fertilizers, which are less soluble, have an estimated leaching rate of 17% [26], and were applied at rates of 0–250 kg ha−1 according to crop type. Potassium fertilizers and organic amendments were also recorded, although their contribution to leaching was negligible. Pesticide applications, including herbicides and insecticides, were quantified in liters per hectare for each farm (Table 1). Environmental damage costs from both nutrient leaching and pesticide use were monetized using global standard coefficients [24]. All monetary values were converted to U.S. dollars using the average 2023–2024 exchange rate. Finally, the estimated environmental costs were subtracted from the gross value of ecosystem services to derive the net ecosystem service value for each crop and farm.

2.4. Data Analysis

This study employed regression-based statistical analyses to examine relationships between crop yield indicators and marketable value across intensive agroecosystems. All statistical analyses were conducted using the AAA software package (Version 2.5) [31], which supports linear and non-linear regression modeling and has been applied previously in agricultural and environmental studies in arid and semi-arid regions [32,33].
The analytical workflow consisted of two complementary components. First, descriptive and comparative analyses were used to summarize ecosystem service and disservice values across crops. Second, regression modeling was applied to explore the functional relationship between biomass productivity (grain yield and total dry matter) and marketable value at the farm level. To model the relationship between yield variables and marketable value, two alternative functional forms were evaluated:
(1) Gaussian regression model. The Gaussian model was applied to capture non-linear relationships between yield indicators and marketable value, particularly where productivity responses exhibited saturation or peak behavior. Such response patterns are commonly observed in intensive agricultural systems, especially under semi-arid conditions where ecological constraints may limit marginal yield gains at higher input levels.
(2) Plane (linear) regression model. A plane equation was used to represent linear relationships between yield variables and marketable value, providing a simplified benchmark for comparison. This model facilitates interpretation where proportional changes in yield translate directly into economic outcomes.
Model performance was evaluated using standard goodness-of-fit metrics, including the coefficient of determination (R), mean squared error (MSE), and significance levels. To assess model robustness and avoid overfitting, cross-validation was implemented by partitioning the dataset into training and validation subsets, following the procedures described by Liu et al. [31]. Model parameters were estimated using the training data, and predictive performance was evaluated on withheld observations. The comparative performance of Gaussian and plane models is reported in Section 3.
Uncertainty associated with ecosystem service valuation arises primarily from the use of standardized coefficients and price proxies (e.g., carbon prices, biodiversity valuation assumptions) rather than from measurement error in farm-level production data. In this study, uncertainty was managed by applying consistent valuation parameters across all crops and farms, thereby preserving internal comparability among agroecosystems. The resulting estimates are intended for relative comparison of cropping systems under similar management conditions rather than for absolute policy pricing or site-specific optimization. The implications of these assumptions and their influence on result transferability are addressed explicitly in Section 4.

3. Results

3.1. Soil Properties

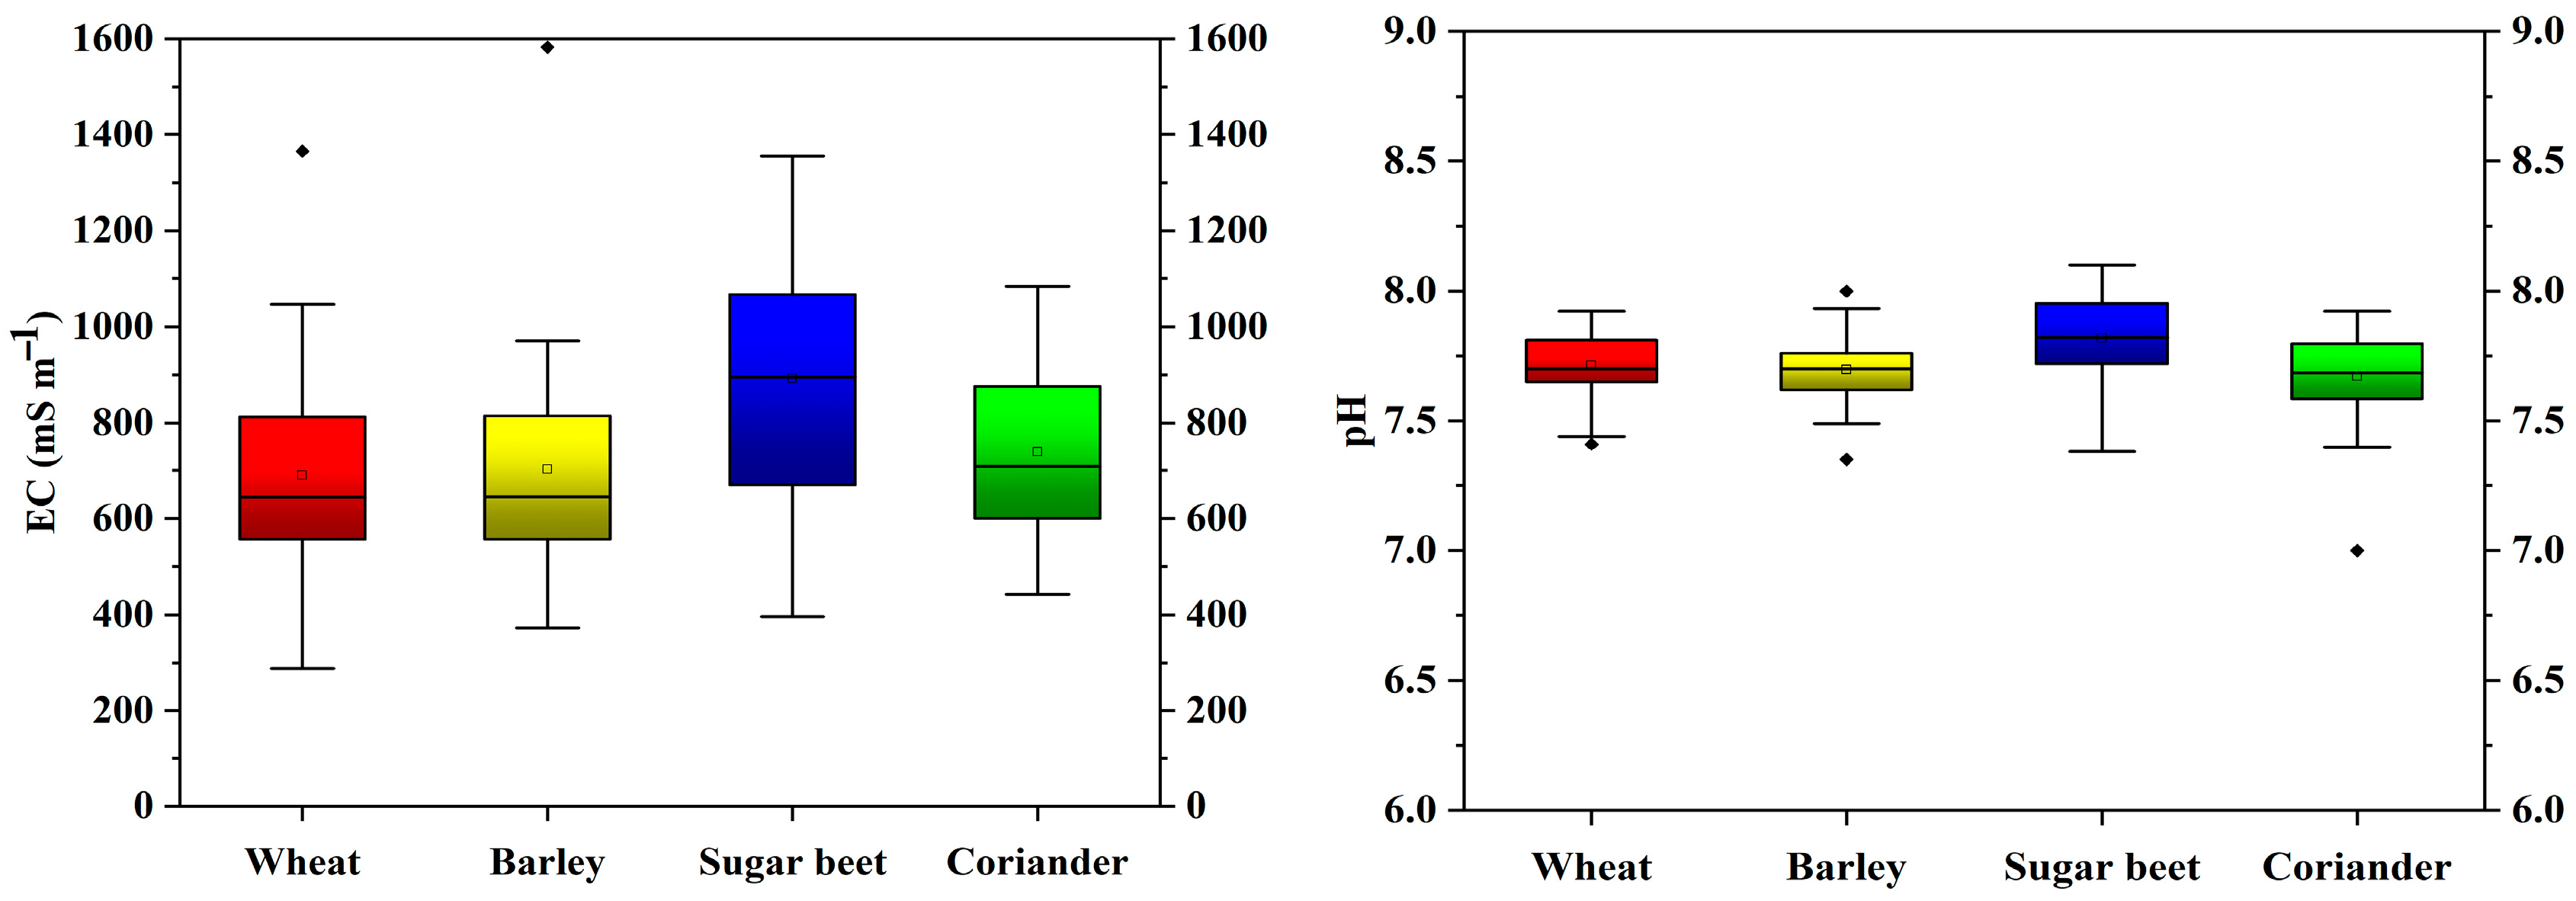
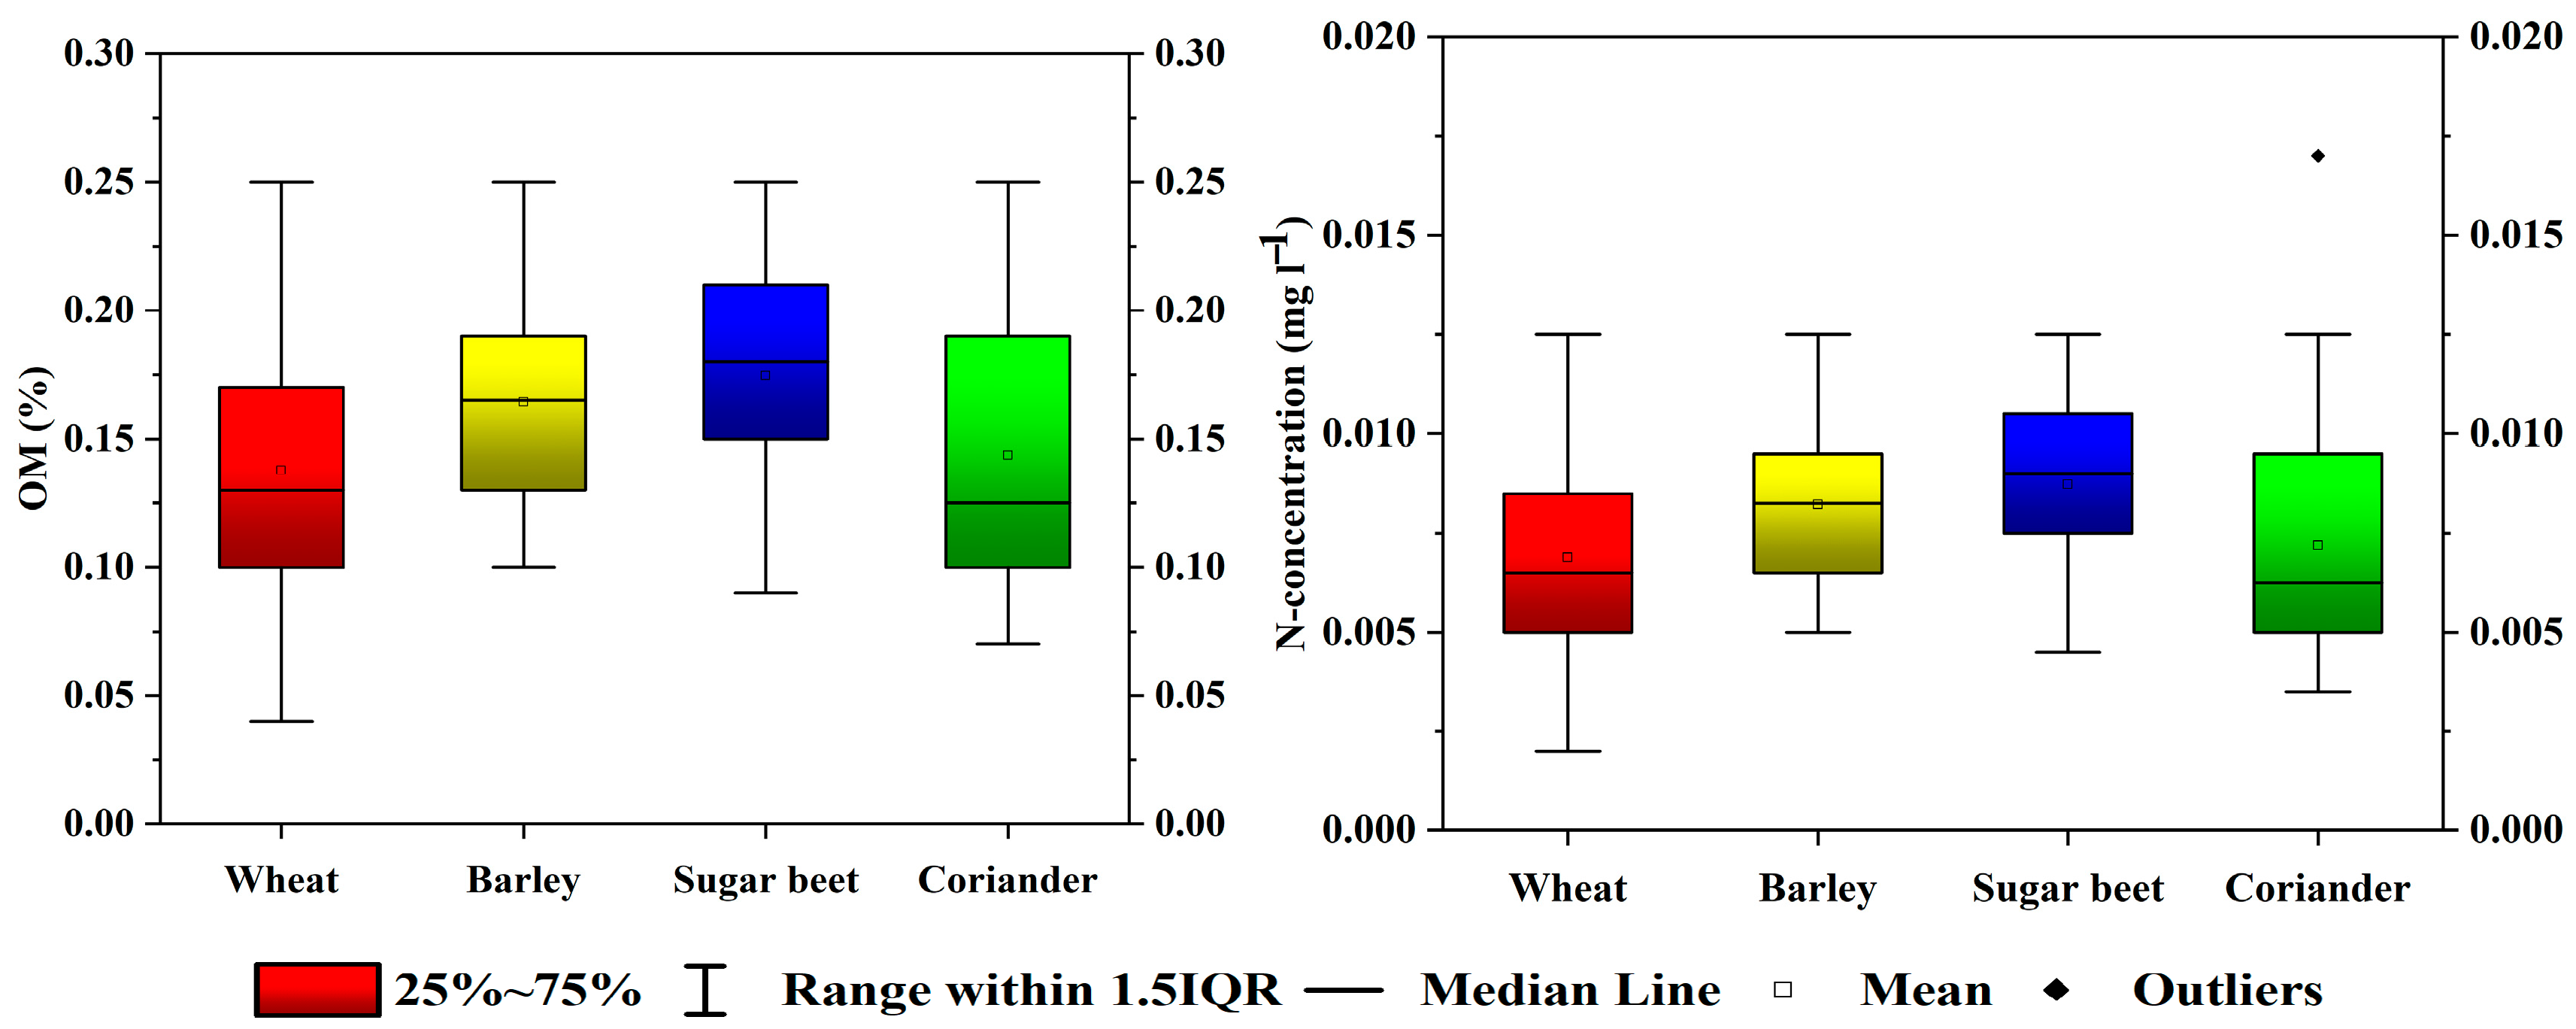
The physicochemical properties of soils under the four cultivated crops exhibited distinct but overlapping ranges across the study area (Figure 3). Soils in the Nahavand agricultural plain are generally light- to medium-textured and characterized by low organic matter content, a common feature of intensively cultivated semi-arid systems. These background conditions provide an important context for interpreting nutrient mobility and related agroecosystem processes.
Electrical conductivity (EC) values varied among cropping systems. Wheat fields showed moderate EC values ranging from approximately 320 to 1365 μS cm−1. Barley soils displayed a wider distribution, with several observations exceeding 1500 μS cm−1. Sugar beet fields consistently exhibited higher EC levels, commonly ranging from about 400 to over 1800 μS cm−1. In contrast, coriander soils showed comparatively lower and more stable EC values, mostly clustering between 400 and 1100 μS cm−1.
Soil pH values across all sampled farms fell within a neutral to slightly alkaline range (7.0–8.1). Wheat and barley soils were primarily concentrated between pH 7.4 and 7.9, while sugar beet fields occasionally exceeded pH 8.0. Coriander soils exhibited a pH range of 7.0–7.9 and a relatively lower spatial variability compared to sugar beet.
Organic matter (OM) content was low overall but showed crop-specific variation. Wheat soils exhibited OM values between 0.04% and 0.25%, with most observations between 0.10% and 0.20%. Barley soils tended to have slightly higher OM contents, with several samples exceeding 0.25%. Sugar beet soils generally ranged between 0.10% and 0.25%. Coriander soils showed the lowest median and the widest range of OM values, from 0.07% to 0.34%.
Soil nitrogen concentrations also differed among cropping systems. Wheat soils exhibited nitrogen concentrations ranging from approximately 0.002 to 0.0125 mg L−1, with most values between 0.004 and 0.009 mg L−1. Barley soils showed a similar range but with a higher frequency of values above 0.009 mg L−1. Sugar beet fields generally ranged from 0.0045 to 0.0125 mg L−1, with occasional values exceeding 0.01 mg L−1. Coriander soils exhibited the greatest variability in nitrogen concentrations, ranging from 0.0035 to 0.017 mg L−1 across sampled farms.

3.2. Agroecosystems Management

Each of the studied 150 intensively managed farms was treated as an independent sampling unit and classified based on the dominant crop cultivated during the 2023–2024 growing season. Accordingly, the sampled farms were grouped into four agroecosystem types: wheat (45 farms), barley (30 farms), sugar beet (35 farms), and coriander (40 farms).
Cropping patterns in the study area are relatively simple and are largely confined to rotation among these four dominant crops, with occasional short fallow periods. Extended fallowing or permanent shifts to alternative crop types were not observed during the study period. As a result, each agroecosystem type was treated as a recurrent and stable production system rather than a transient land-use state.
Across all sampled farms, irrigation regimes, fertilizer application, and general crop management practices were broadly comparable and representative of intensive agricultural systems in western Iran. Differences among agroecosystems therefore arise primarily from crop-specific characteristics rather than from fundamental differences in management intensity. For each agroecosystem, the economic values of key ecosystem services—including provisioning services (food and feed production), regulating services (oxygen production, moisture preservation, and carbon sequestration), supporting services (biodiversity), and cultural services (farm visits)—were quantified. Environmental disservices, including GHG emissions, soil erosion, and nitrogen–phosphorus leaching, were also estimated. Net ecosystem service value was calculated as the difference between total ecosystem service values and total environmental disservice costs.

3.3. Agroecosystem Services

Estimates of ecosystem service values and environmental disservices for the four cropping systems are summarized in Table 2. All values are reported on a per-hectare, per-year basis (USD ha−1 y−1). Net ecosystem service value is defined as the difference between total positive ecosystem services and total environmental disservices.
For the wheat agroecosystem, total positive ecosystem service values ranged from USD 74,490 to 99,220 ha−1 y−1. Oxygen production constituted the largest share, accounting for 64.52% of the total service value and 88.58% of the net value. Food and feed provisioning contributed 11.44% of the total value and 15.71% of the net value, while moisture preservation, biodiversity, carbon sequestration, and cultural services each accounted for smaller proportions. Total environmental disservices ranged from USD 10,630 to 16,540 ha−1 y−1, primarily driven by GHG emissions, followed by soil erosion and nitrogen–phosphorus leaching. As a result, net ecosystem service values for wheat ranged from USD 58,650 to 85,320 ha−1 y−1.
In the barley agroecosystem, total positive ecosystem service values were higher than those of wheat, ranging from USD 88,600 to 119,910 ha−1 y−1. Oxygen production remained the dominant service, contributing 66.19% of the total value, followed by food and feed provisioning (11.74%) and biodiversity-related services (4.14%). Environmental disservices ranged from USD 11,620 to 18,310 ha−1 y−1, again dominated by GHG emissions. Net ecosystem service values for barley were estimated between USD 73,370 and 105,170 ha−1 y−1.
For sugar beet, total positive ecosystem service values ranged from USD 73,040 to 97,170 ha−1 y−1. Compared to wheat and barley, food and feed provisioning represented a relatively larger share of both total (14.21%) and net ecosystem service values (22.83%). However, sugar beet systems exhibited the highest environmental disservices, with total negative values ranging from USD 16,550 to 22,280 ha−1 y−1. Greenhouse gas emissions accounted for the largest proportion of these disservices, followed by soil erosion and nutrient leaching. Consequently, sugar beet showed the lowest net ecosystem service values among the studied systems, ranging from USD 51,940 to 79,300 ha−1 y−1.
The coriander agroecosystem exhibited the highest total ecosystem service values, ranging from USD 128,690 to 166,240 ha−1 y−1. In contrast to the cereal and sugar beet systems, food and feed provisioning constituted the largest share of total ecosystem services (39.77%) and net ecosystem service values (47.01%), closely followed by oxygen production (42.72% and 50.50%, respectively). Biodiversity, moisture preservation, and cultural services also contributed to the overall service portfolio. Environmental disservices in coriander systems were comparatively low, ranging from USD 8540 to 17,380 ha−1 y−1. As a result, coriander achieved the highest net ecosystem service values, between USD 115,840 and 154,750 ha−1 y−1.
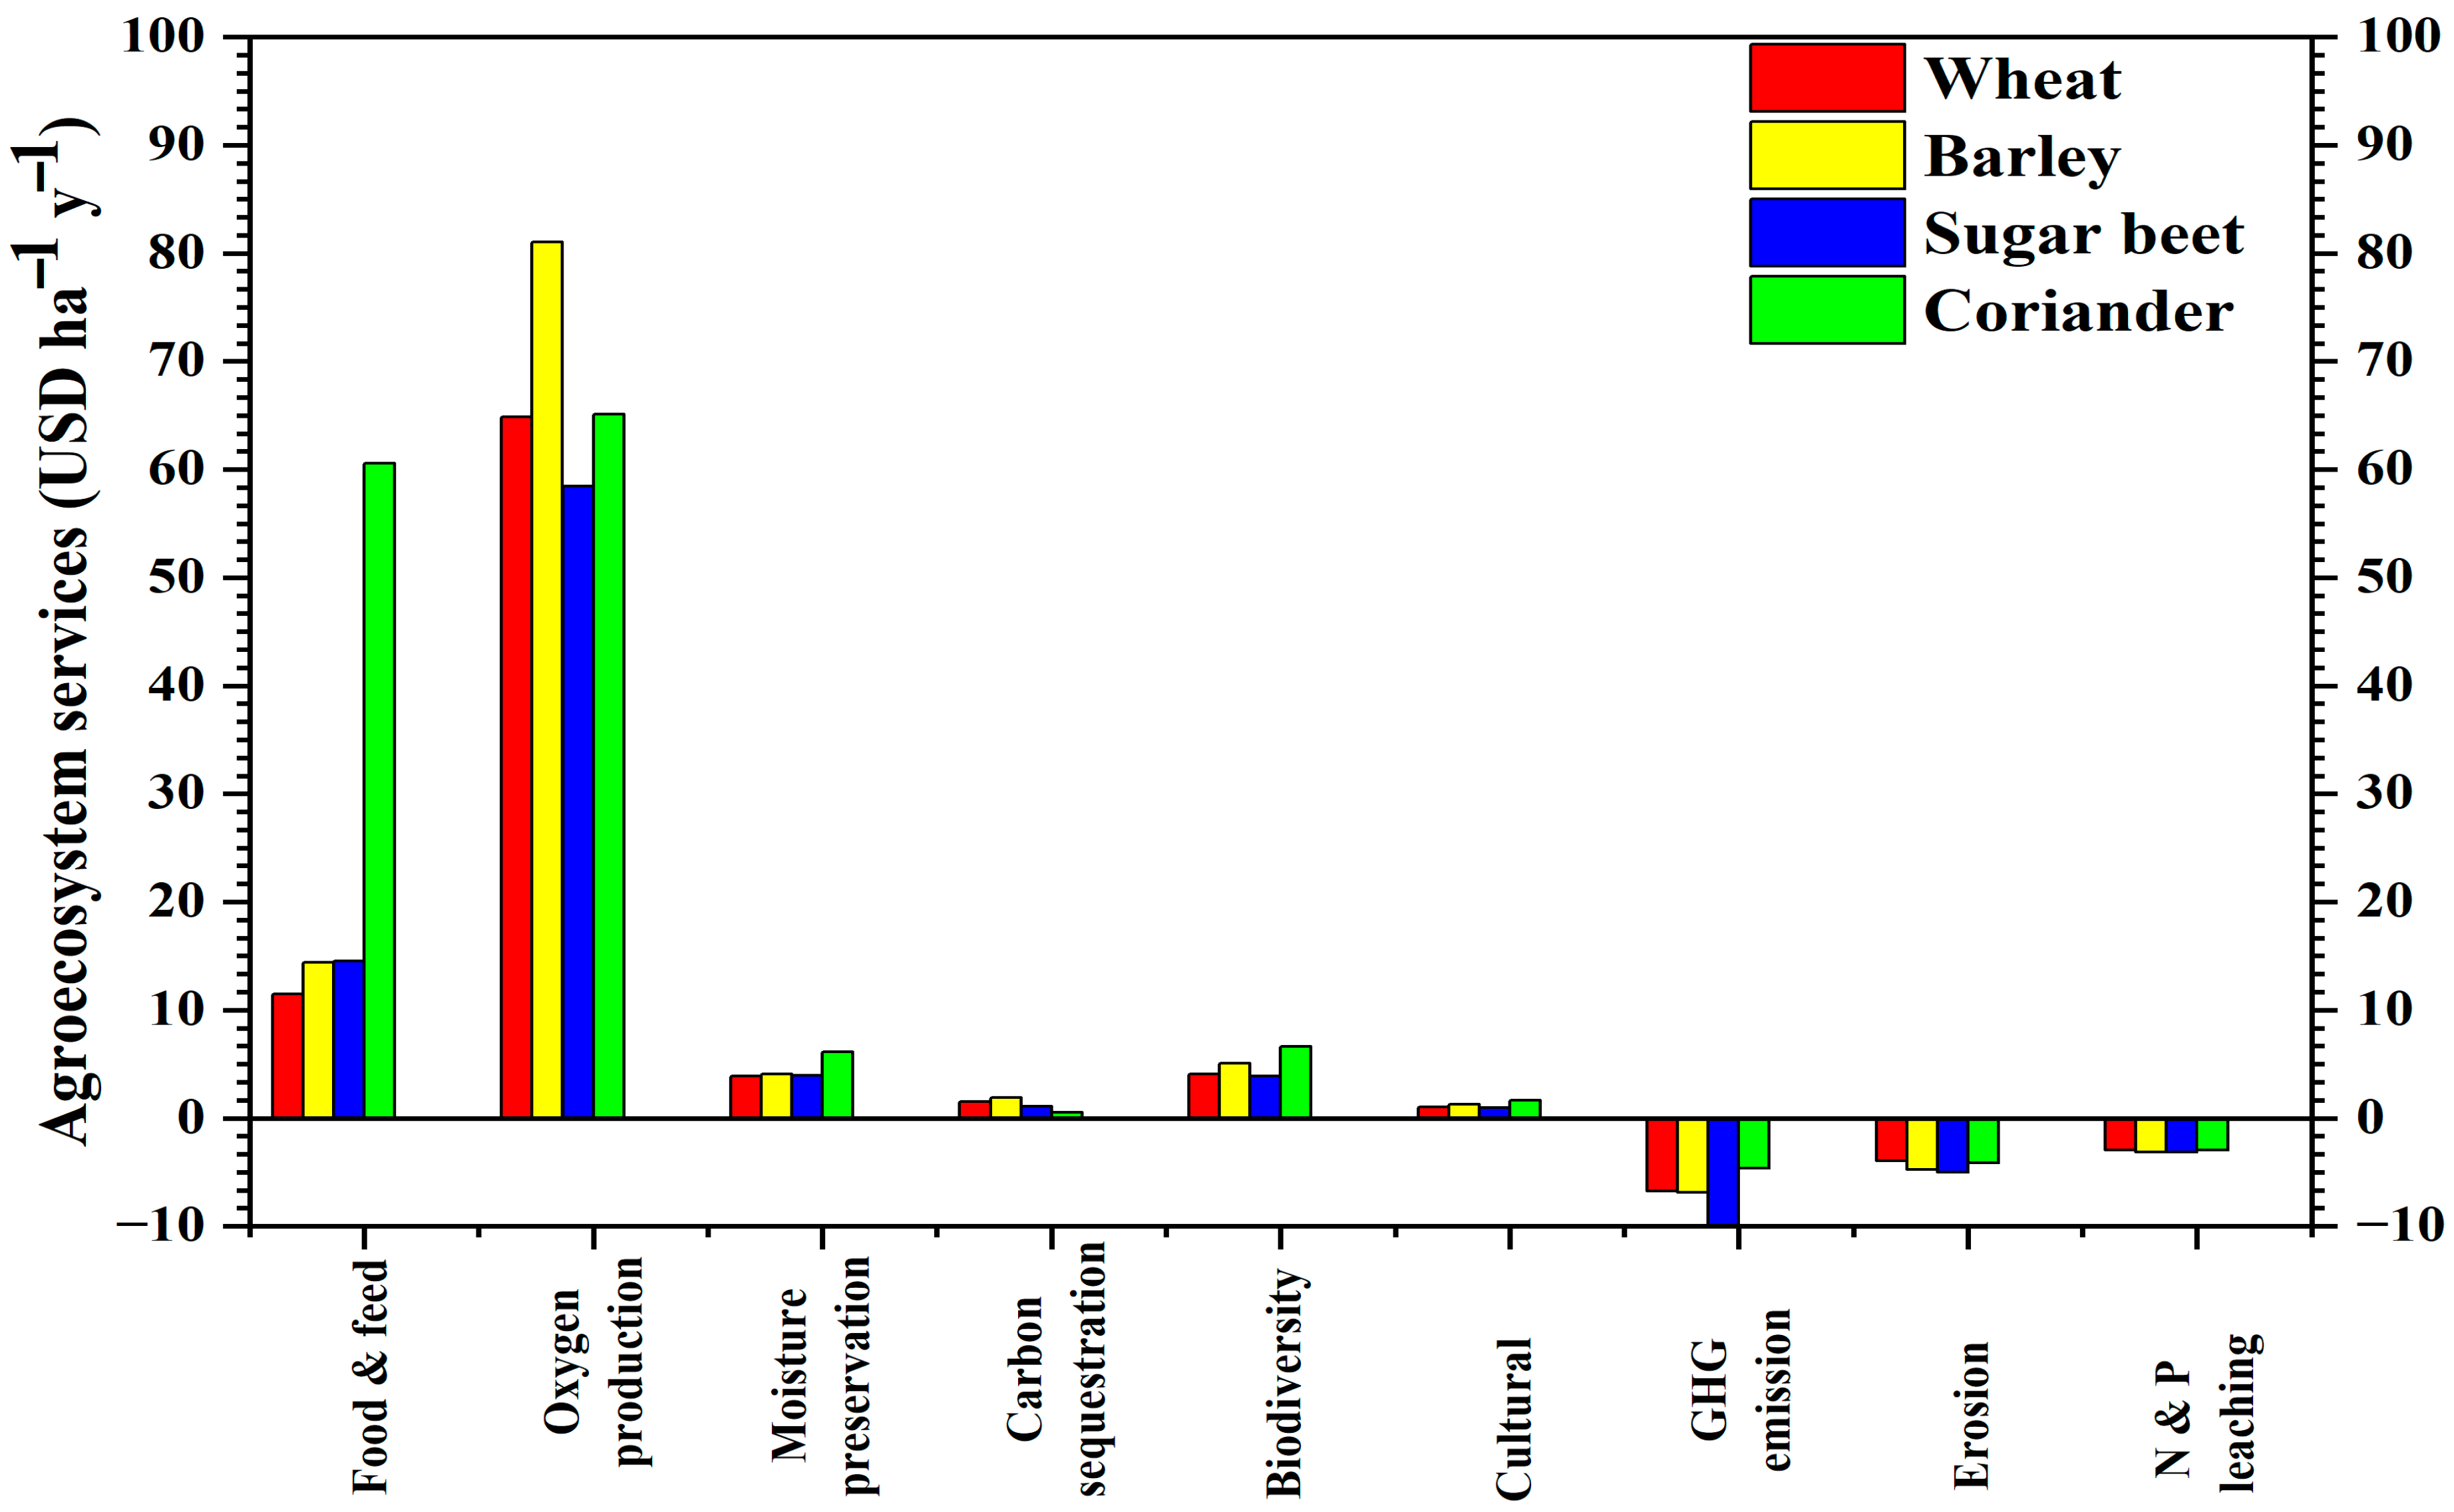
Figure 4 presents the comparative economic values of ecosystem services and environmental disservices for wheat, barley, sugar beet, and coriander under intensive management, expressed in USD ha−1 y−1. The figure illustrates clear differences in both the magnitude and composition of ecosystem service portfolios among the four cropping systems.
Provisioning services show pronounced variation across crops. Coriander exhibits the highest value for food and feed production (60.59 USD ha−1 y−1), substantially exceeding wheat (11.50), barley (14.37), and sugar beet (14.51). Oxygen production contributes substantially across all systems, with the highest values observed in barley (81.07), followed by coriander (65.10), wheat (64.86), and sugar beet (58.44). Moisture preservation capacity is also highest in coriander (6.13), while wheat (3.87), barley (4.09), and sugar beet (3.94) display comparatively lower and similar values.
Environmental disservices differ markedly among agroecosystems. Sugar beet exhibits the highest GHG emissions (−11.10), followed by barley (−6.85), wheat (−6.74), and coriander (−4.63). A similar pattern is observed for soil erosion, with sugar beet showing the largest losses (−5.02) and coriander the lowest (−4.14), while wheat (−3.96) and barley (−4.73) occupy intermediate positions. Nitrogen and phosphorus leaching is also greatest in sugar beet systems (−3.16), whereas wheat (−2.94), barley (−3.11), and coriander (−2.98) show comparable and slightly lower values.
Overall, the figure highlights clear contrasts in agroecosystem performance. Coriander combines high provisioning service values with comparatively low environmental disservices, resulting in a more balanced ecosystem service profile. In contrast, sugar beet exhibits higher environmental costs that offset its provisioning benefits. Wheat and barley display intermediate profiles, characterized by moderate service provision and environmental impacts. These results emphasize crop-specific differences in ecosystem service structure under intensive management conditions.

3.4. Positive and Negative Agroecosystem Services Assessment

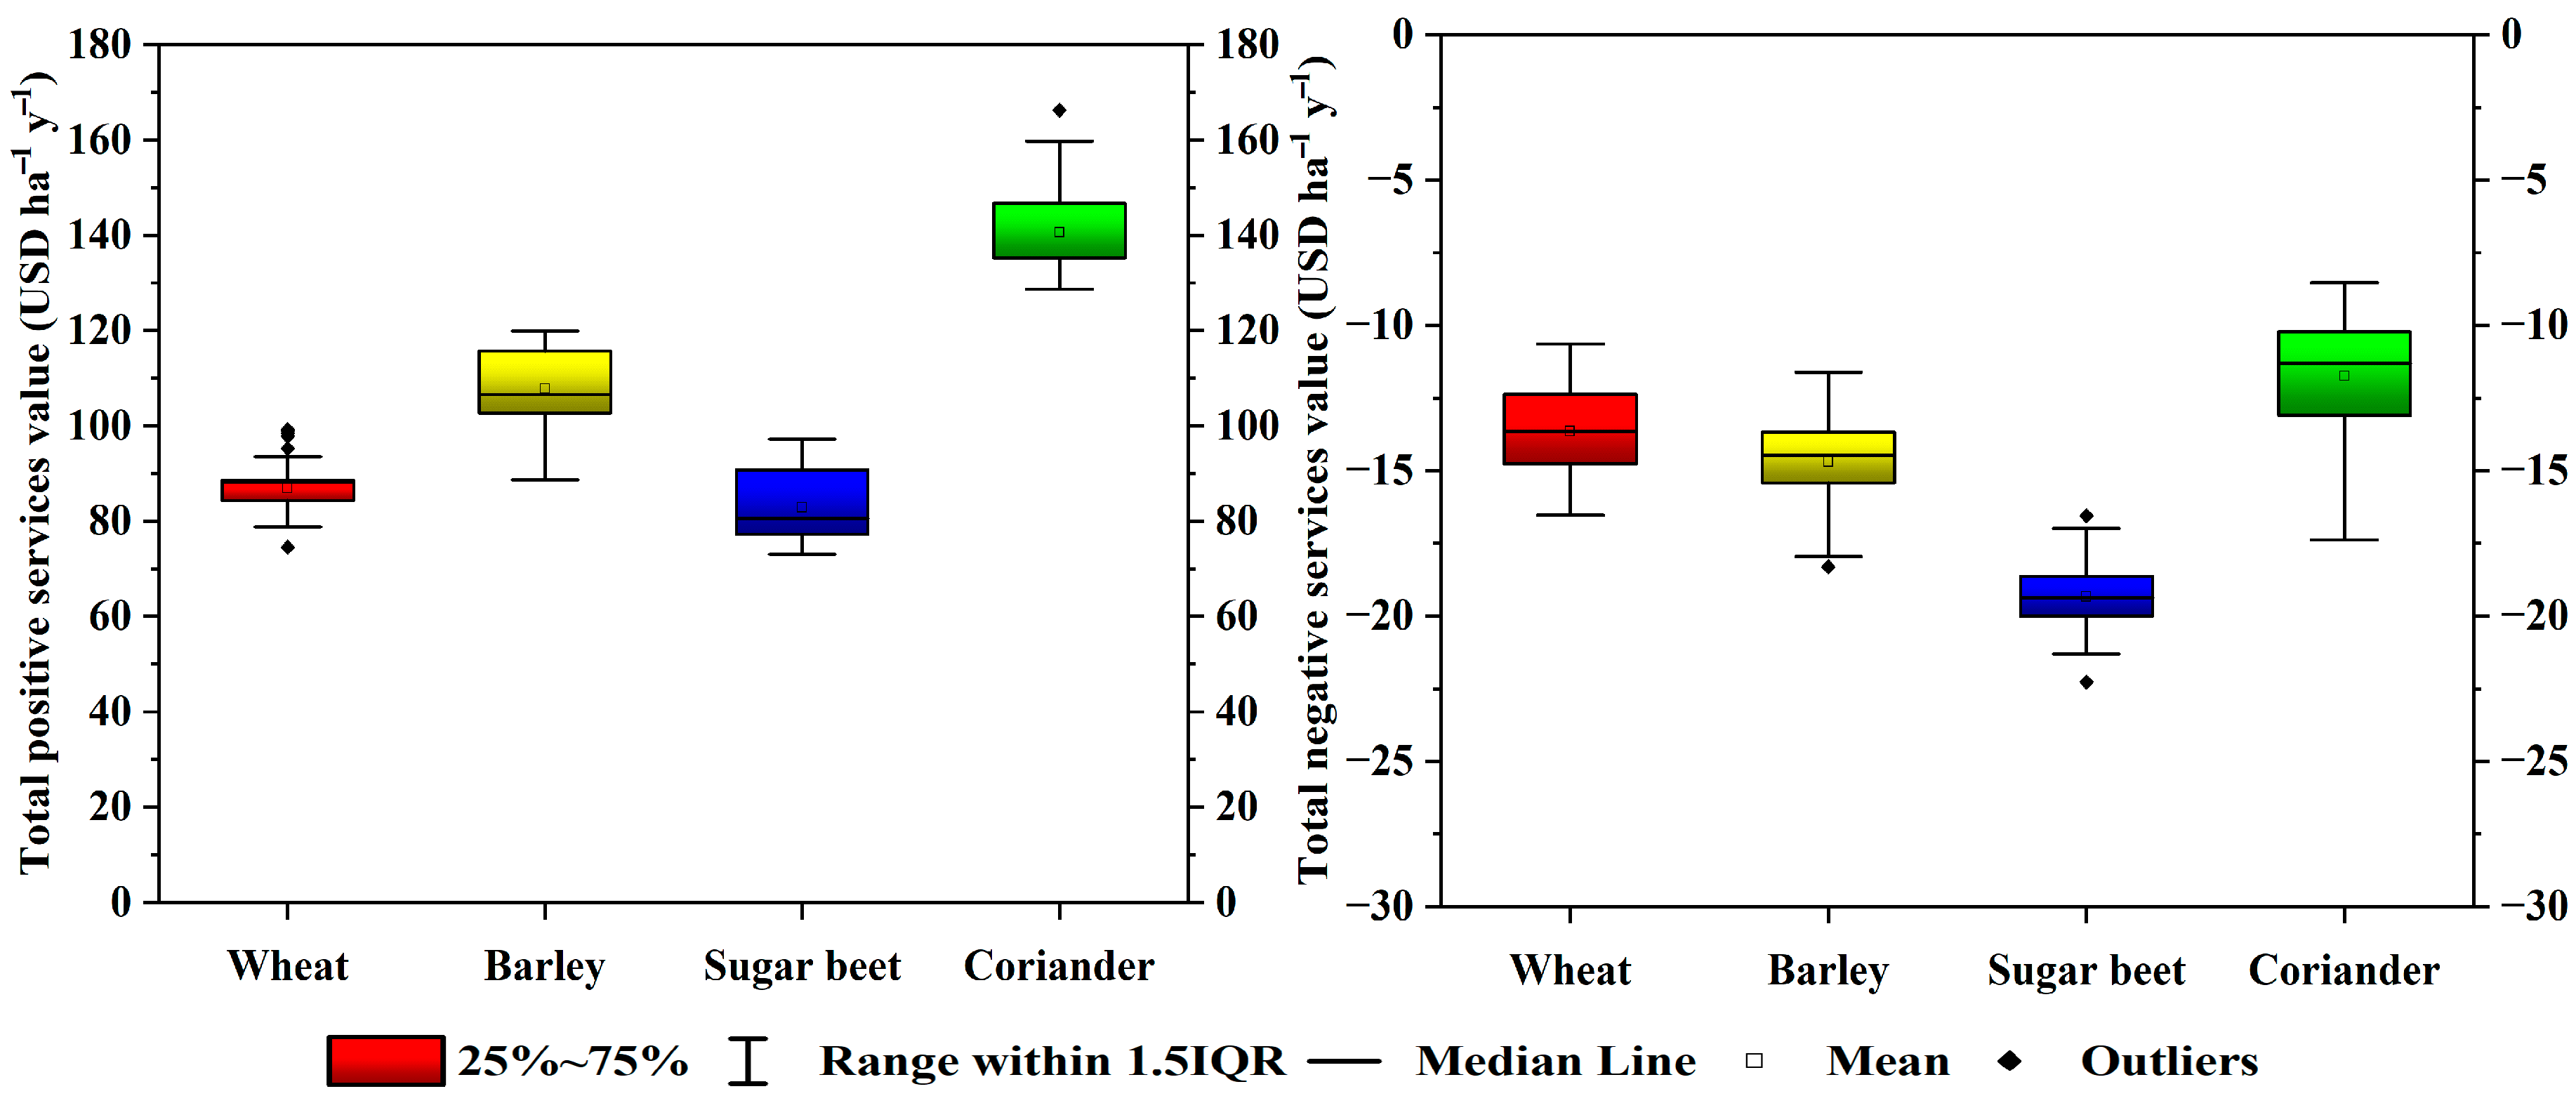
The comparative assessment of total positive and negative ecosystem service values across the four agroecosystems—wheat, barley, sugar beet, and coriander—reveals clear differences in overall ecosystem service performance (Figure 5). All values are expressed in USD ha−1 y−1.
Total positive ecosystem service values, including provisioning, regulating, supporting, and cultural services, varied substantially among crops. Coriander consistently exhibited the highest positive service values, frequently exceeding 135 USD ha−1 y−1 and reaching a maximum of approximately 166.2 USD ha−1 y−1. Wheat showed moderate and relatively stable positive service values, largely ranging between 74 and 99 USD ha−1 y−1. Barley displayed greater variability, with positive service values often exceeding 100 USD ha−1 y−1 and reaching up to approximately 119.9 USD ha−1 y−1. Sugar beet exhibited the lowest positive service values, with most observations clustered between 73 and 95 USD ha−1 y−1.
Negative ecosystem service values, representing environmental disservices such as greenhouse gas emissions, nutrient leaching, and soil erosion, also differed markedly among agroecosystems. Sugar beet recorded the highest magnitude of negative values, frequently below −20 USD ha−1 y−1 and reaching a minimum of −22.27 USD ha−1 y−1. Coriander exhibited the lowest negative service values, generally ranging between −8.5 and −14 USD ha−1 y−1. Wheat and barley occupied intermediate positions, with negative service values typically ranging from −11 to −17 USD ha−1 y−1.
Taken together, these results indicate distinct contrasts in the balance between ecosystem service provision and environmental disservices among the studied cropping systems. Coriander combines high positive service values with comparatively low negative impacts, whereas sugar beet shows lower positive service values alongside higher environmental disservices. Wheat and barley exhibit intermediate profiles, characterized by moderate levels of both positive and negative ecosystem service values.

3.5. Net Service Valuation

Net ecosystem service values were calculated as the difference between total positive ecosystem service values and total environmental disservices for each crop and are reported in USD ha−1 y−1 (Table 2).
Across the 150 sampled farms, wheat exhibited net ecosystem service values ranging from approximately 58 to 85 USD ha−1 y−1. The distribution of values showed moderate dispersion, with a concentration between 70 and 76 USD ha−1 y−1. Barley presented higher net values, spanning approximately 73 to 105 USD ha−1 y−1, with most observations clustered between 85 and 100 USD ha−1 y−1. Sugar beet recorded the lowest net ecosystem service values, characterized by wide variability and multiple observations below 60 USD ha−1 y−1, with minimum values approaching 55 USD ha−1 y−1. Coriander consistently exhibited the highest net ecosystem service values, with all observations exceeding 115 USD ha−1 y−1 and reaching maxima above 154 USD ha−1 y−1. The majority of coriander farms showed net values tightly grouped between 120 and 140 USD ha−1 y−1.
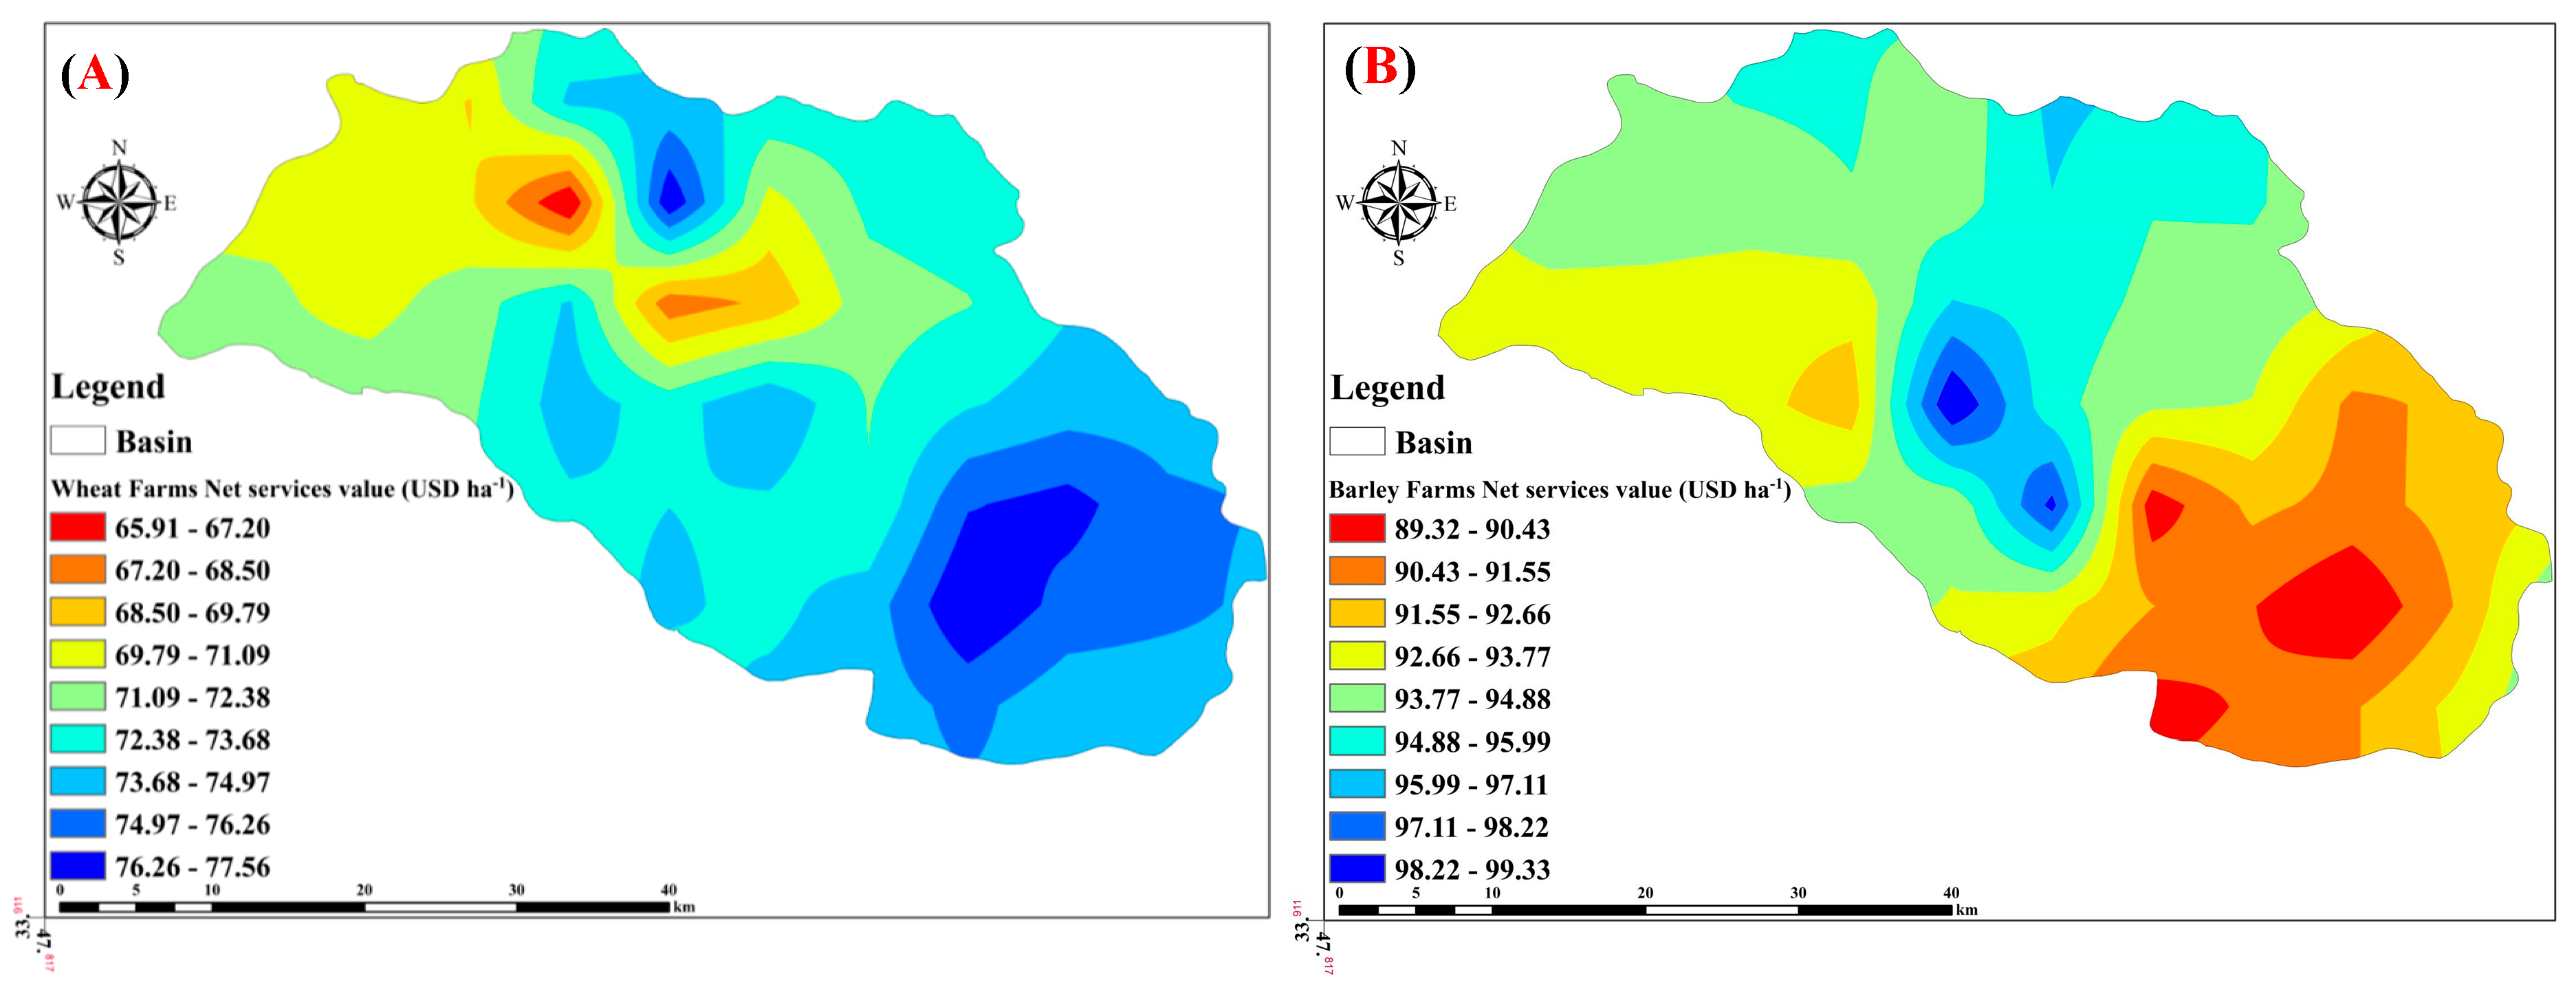
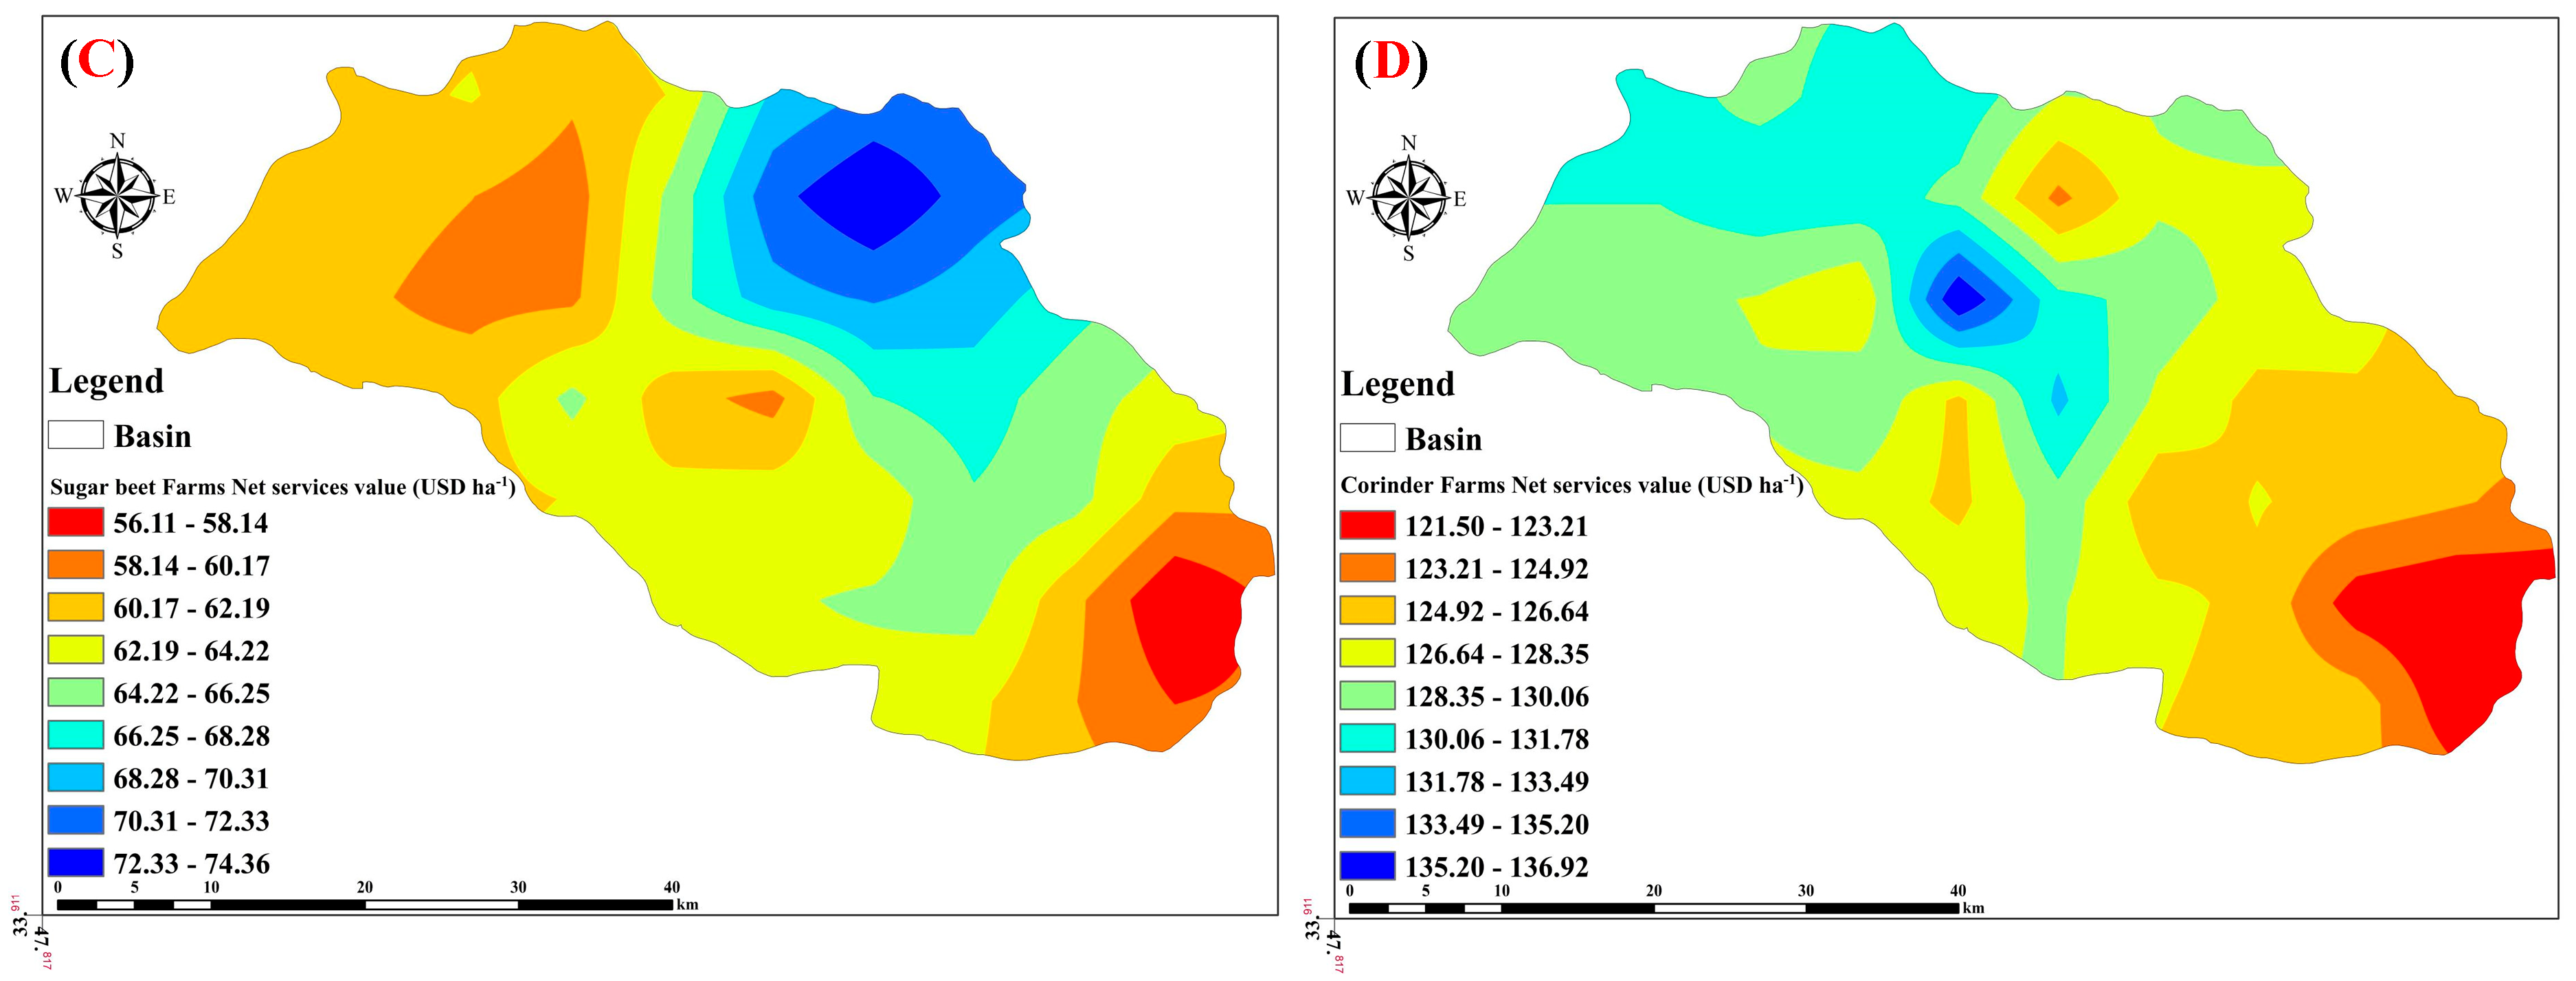
The spatial distribution of net ecosystem service values is illustrated in Figure 6, with separate maps presented for each crop to avoid scale-induced misinterpretation. These maps highlight intra-crop spatial variability as well as differences in the geographic distribution of high and low net values among crops. For wheat, areas with relatively higher net values were primarily located in the southeastern portion of the study area, whereas corresponding locations for barley, sugar beet, and coriander generally exhibited lower net values. In sugar beet systems, the highest net values were concentrated in the mid-northeastern area of the county and did not spatially coincide with high-value zones of the other crops. Coriander showed its highest net ecosystem service values predominantly in the north–central part of Nahavand County, where wheat and sugar beet systems tended to display lower net values.
Although these spatial patterns represent generalized distributions, they demonstrate that optimal locations for net ecosystem service provision differ among agroecosystem types within the study area. Presenting crop-specific maps allows clearer interpretation of spatial heterogeneity without confounding effects caused by differing value ranges among crops.

3.6. Marketable Value Modeling

Nonlinear regression analysis using a Gaussian model was applied as a diagnostic tool to examine how marketable value (MV) scales with biophysical productivity indicators, namely grain yield (GY) and total dry matter (TDM), across the four studied agroecosystems (Table 3). This analysis was not intended to model price formation or market behavior, but rather to assess whether yield-based indicators provide a consistent and comparable proxy for economic outcomes within the integrated ecosystem service assessment framework.
The Gaussian functional form was selected following preliminary diagnostics that suggested non-linear scaling and saturation effects between biomass productivity and marketable value, particularly at higher yield levels. Model performance was evaluated using the coefficient of determination (R), mean squared error (MSE), mean square (MS), and significance level (Pvalue).
Across all cropping systems, the models exhibited high explanatory power (R = 0.91–0.99), indicating that biophysical yield indicators captured a substantial share of variability in marketable value under intensive smallholder conditions. Coriander showed the strongest correspondence between yield metrics and marketable value (R = 0.99; MSE = 0.006; P = 0.009), reflecting a stable linkage between biomass production and economic return. Wheat and barley also displayed robust relationships (R = 0.96 and 0.94, respectively), supporting the internal consistency between productivity and valuation components used in the ecosystem service accounting. In contrast, sugar beet exhibited comparatively lower model performance (R = 0.91) and higher error terms (MSE = 2.003), despite remaining statistically significant (P = 0.021). This reduced precision suggests that factors beyond yield quantity—such as management intensity, input costs, or market structure—introduce additional variability in the relationship between biomass production and marketable value for this crop.
Overall, this analysis serves as a supportive consistency check, confirming that yield-based biophysical indicators reasonably align with observed economic values across agroecosystems, while also revealing crop-specific deviations. These deviations reinforce the need to interpret marketable value within a broader ecosystem service framework rather than as a simple function of yield alone.

4. Discussion

The comprehensive evaluation of ecosystem services across the four major agroecosystems in Nahavand County—wheat, barley, sugar beet, and coriander—provides a nuanced understanding of how crop choice and management interact to shape agricultural productivity, ecosystem functioning, and environmental sustainability in a semi-arid context. By jointly accounting for ecosystem services and environmental disservices at the farm scale, this study adopts an integrated land-use perspective that emphasizes relative trade-offs among cropping systems rather than absolute welfare estimates. This comparative framing is particularly relevant in data-limited contexts, where site-specific economic valuation parameters are often unavailable, yet decision-relevant insights can still be derived from internally consistent assessments across management alternatives.
Provisioning services, especially food and fodder production, constitute the most direct link between agroecosystem performance, food security, and rural livelihoods [34,35,36]. The results indicate that coriander-based systems generate substantially higher economic returns from food and feed production compared to wheat, barley, and sugar beet. This highlights coriander’s capacity to function as a high-value crop within intensive smallholder systems, reinforcing its contribution to household income and local supply chains. The strong correspondence between yield components and marketable value, confirmed by the Gaussian regression model (R = 0.99), supports the internal consistency of this pattern [37,38]. Wheat and barley, although characterized by more moderate provisioning values, remain indispensable due to their strategic role in food security and their deep integration into the agroecological and socio-economic structure of Nahavand County [39]. Sugar beet, while economically important as a cash crop, exhibits a less favorable balance between provisioning benefits and environmental costs, illustrating a recurrent tension between short-term profitability and long-term ecosystem sustainability. These findings underscore the importance of integrated crop selection strategies that explicitly consider ecological trade-offs alongside productivity objectives [40,41,42,43].
Beyond provisioning services, regulating functions emerge as critical determinants of agroecosystem sustainability in this semi-arid environment [44,45]. Oxygen production dominates the regulating service category across all crops, reflecting differences in overall biomass productivity. It is important to note that oxygen production in open-field agroecosystems represents a non-excludable public good rather than a marketable commodity. Accordingly, its monetization in this study should be interpreted as a biophysical productivity proxy that facilitates relative comparison among cropping systems under a uniform valuation framework, rather than as a direct estimate of realized economic welfare. When applied consistently across all systems, this proxy captures differences in photosynthetic performance and biomass accumulation, thereby supporting comparative inference without altering the relative ranking of agroecosystems.
Carbon sequestration results further highlight crop-specific differences in climate regulation potential. Cereal-based systems, particularly barley, exhibit greater capacity for carbon storage in both biomass and soil organic carbon pools, contributing to partial offsetting of greenhouse gas emissions [46,47]. In contrast, sugar beet systems combine relatively low carbon sequestration with elevated greenhouse gas emissions, amplifying their overall environmental footprint. The carbon price applied in this study is based on European carbon tax benchmarks, which should be interpreted as an upper-bound scenario in the absence of an established carbon pricing mechanism in Iran. While alternative price assumptions would affect the absolute magnitude of carbon-related values, the comparative patterns observed among crops—and the identification of relative climate mitigation performance—remain robust under consistent valuation assumptions [48]. These contrasts reinforce the relevance of aligning crop selection with climate mitigation objectives within agricultural landscapes [49,50].
Moisture preservation constitutes another key regulating service in Nahavand County, where water scarcity is a central constraint on agricultural sustainability. The higher moisture retention observed in coriander fields likely reflects favorable canopy structure, root architecture, and microclimatic effects. Enhanced moisture conservation reduces irrigation demand, mitigates drought stress, and supports more resilient water management strategies under semi-arid conditions [51]. Biodiversity support, a cornerstone of long-term ecosystem resilience [52,53,54], was also most pronounced in coriander-based agroecosystems. This pattern may be associated with lower pesticide pressure, more heterogeneous field conditions, and improved habitat suitability for beneficial organisms, including pollinators and soil microorganisms. The relatively higher cultural ecosystem service values associated with coriander further suggest that such systems may foster stronger social engagement and conservation incentives within rural communities [55,56].
Despite these positive contributions, the analysis reveals substantial environmental disservices associated with certain cropping systems, most notably sugar beet. Elevated greenhouse gas emissions, intensified soil erosion, and increased nitrogen and phosphorus leaching consistently offset a significant portion of sugar beet’s provisioning benefits. This imbalance highlights the necessity of explicitly incorporating environmental disservices into agricultural assessment and decision-making frameworks [57,58]. Nutrient leaching, in particular, represents a major pathway of agrochemical pollution with implications for soil and water quality [59,60,61]. The comparatively lower leaching rates observed in wheat, barley, and coriander systems indicate more stable nutrient cycling and point to opportunities for further improvement through integrated nutrient management strategies [22].
Soil erosion follows a similar pattern, with sugar beet systems exhibiting the highest losses, likely driven by intensive tillage, canopy characteristics, and management intensity. In contrast, coriander systems show the lowest erosion rates, indicating stronger soil conservation potential. Maintaining soil integrity is essential for sustaining long-term productivity and ecosystem service provision, particularly in semi-arid regions vulnerable to degradation [61]. Taken together, these findings position coriander as a comparatively balanced agroecosystem that combines high provisioning and regulating service performance with relatively low environmental costs. Wheat and barley occupy an intermediate position, offering stable but less multifunctional service profiles. While their role in regional food security remains critical, targeted improvements in fertilizer management, soil conservation, and biodiversity enhancement could further strengthen their sustainability performance [44,62,63].
The sustainability profile of sugar beet cultivation in Nahavand County is of particular concern and clearly indicates the need for targeted management interventions to mitigate its environmental impacts. Elevated greenhouse gas emissions, intensified nutrient leaching, and higher soil erosion rates suggest that current intensive practices in sugar beet systems impose disproportionately high ecological costs relative to their provisioning benefits. Importantly, these findings do not imply that sugar beet cultivation is inherently unsustainable; rather, they highlight the limitations of uniform intensification strategies when applied without consideration of ecosystem service trade-offs. Addressing these challenges therefore requires integrated, crop-specific management approaches rather than further input intensification. Precision agriculture techniques, improved nutrient management strategies, cover cropping, and soil conservation measures have been widely recognized as effective pathways for reducing environmental pressures while maintaining productivity [64,65,66,67]. Within the comparative framework of this study, such interventions emerge as particularly critical for aligning sugar beet systems with broader sustainability objectives in semi-arid agricultural landscapes.
More broadly, the findings reinforce the conceptual linkage between ecosystem health and food security, particularly in water-limited environments. Agroecosystems that sustain higher levels of biodiversity, carbon storage, and soil moisture are better positioned to support resilient food production systems under climatic variability. The cumulative contribution of regulating and cultural ecosystem services—such as oxygen production, moisture conservation, and landscape-related social values—should be interpreted as indicators of ecosystem functioning that complement provisioning services, rather than as direct market substitutes. When evaluated consistently across cropping systems, these indicators provide a meaningful basis for comparing multifunctionality and long-term sustainability potential. In this context, the observed spatial variability in net ecosystem service values among farms reflects localized influences, including microclimatic conditions, soil quality, and management intensity. Such heterogeneity underscores the necessity of site-specific interventions and tailored management practices to optimize ecosystem multifunctionality, rather than relying on generalized or one-size-fits-all recommendations.
From an integrated land-use management perspective, the results highlight the importance of simultaneously accounting for provisioning services, regulating functions, and environmental disservices when evaluating agricultural systems. Optimizing land use based solely on crop yield or short-term market value risks overlooking critical ecological trade-offs that ultimately determine long-term sustainability. The comparative assessment of wheat, barley, sugar beet, and coriander agroecosystems under broadly similar intensive management conditions demonstrates that crop selection alone can lead to markedly different sustainability outcomes. Systems that combine relatively high provisioning services with lower environmental costs—such as coriander in the present study—offer clear opportunities for integrated land-use strategies that support food security, rural livelihoods, and ecosystem resilience. Conversely, cropping systems associated with higher ecological burdens highlight the need for targeted, crop-specific management interventions rather than uniform intensification approaches. These findings directly support integrated land-use management frameworks that explicitly incorporate ecosystem service trade-offs into agricultural planning, particularly in environmentally vulnerable, semi-arid regions.
Despite the comprehensive nature of the ecosystem service assessment presented here, several limitations should be acknowledged. Certain cultural ecosystem services could not be fully quantified due to data constraints, and partial reliance on farmer-reported information introduces potential variability. Moreover, the complex interactions among ecosystem components limit the extent to which causal relationships can be inferred from a single-season, farm-scale assessment. Future research would benefit from longitudinal monitoring to capture temporal dynamics in ecosystem service provision, as well as broader landscape-scale analyses to assess connectivity between agroecosystems and surrounding natural habitats. Incorporating socio-economic drivers, farmer decision-making processes, and policy frameworks would further strengthen understanding of sustainable agricultural transitions. Advances in remote sensing and precision agriculture technologies also offer promising avenues to improve data resolution and management optimization.
A further methodological limitation relates to soil texture, which was not directly measured due to financial and logistical constraints. Soil texture exerts strong control over water retention, nutrient leaching, and erosion processes, and may interact with crop type to influence ecosystem service outcomes. However, all sampled farms were located within similar geomorphological units of Nahavand County and were managed under comparable intensive agricultural systems. This reduces—though does not entirely eliminate—the likelihood that the observed differences among wheat, barley, sugar beet, and coriander agroecosystems were primarily driven by soil textural variability rather than crop-specific traits and management practices. Future studies incorporating detailed soil texture measurements (sand–silt–clay fractions) would enable a more refined assessment of soil–crop interactions and their role in shaping agroecosystem multifunctionality.

5. Conclusions

This study presents a farm-level assessment of ecosystem services and environmental disservices across four dominant agroecosystems—wheat, barley, sugar beet, and coriander—under intensive smallholder management in Nahavand County, Iran. By monetizing both positive services and negative externalities, the analysis demonstrates that crop choice plays a decisive role in shaping net ecosystem service outcomes, even under broadly similar management conditions.
Among the evaluated systems, coriander consistently exhibited the highest net ecosystem service values, driven by strong provisioning services, relatively high moisture preservation and biodiversity contributions, and lower associated environmental costs. Wheat and barley showed intermediate performance, combining stable food production with moderate regulating services and environmental impacts. In contrast, sugar beet was associated with the highest greenhouse gas emissions, soil erosion, and nutrient leaching, which substantially reduced its net ecosystem service value despite its economic relevance as a cash crop.
These findings underscore the importance of incorporating ecosystem service accounting into agricultural assessment frameworks, particularly in semi-arid regions where resource constraints amplify trade-offs between productivity and environmental integrity. The results highlight that optimizing land use based solely on yield or market value may obscure critical sustainability differences among cropping systems. An integrated land-use management perspective—one that simultaneously considers provisioning services, regulating functions, and environmental disservices—offers a more robust basis for evaluating agricultural sustainability at the farm scale.
While the conclusions are specific to intensive, irrigated smallholder systems in Nahavand County, the methodological framework applied here provides a transferable approach for comparative agroecosystem assessment in similar semi-arid contexts. Future work should extend this analysis through longitudinal monitoring, expanded spatial coverage, and sensitivity analyses of key valuation parameters to better capture uncertainty and enhance generalizability. Such efforts would further strengthen the role of ecosystem service-based metrics in supporting sustainable agricultural decision-making in water-limited landscapes.

Author Contributions

Conceptualization, S.S.; methodology, S.S., M.L. and D.D.; formal analysis, S.S.; investigation, S.S.; data curation, S.S.; writing—original draft preparation, S.S.; writing— review and editing, S.S. and D.D. All authors have read and agreed to the published version of the manuscript.

Funding

This research received no external funding.

Institutional Review Board Statement

This study did not involve any invasive procedures or sensitive personal data. According to Arak University, ethical approval was not required for this type of non-interventional research. However, all participants were informed about the purpose of the study, the voluntary nature of their participation, and the measures taken to ensure the confidentiality and anonymity of their responses.

Informed Consent Statement

Informed consent was obtained from all participants involved in this study. Participants were assured that their anonymity would be maintained and that the data collected would be used solely for research purposes.

Data Availability Statement

All data used can be requested from the corresponding author.

Conflicts of Interest

The authors declare no conflicts of interest.

References

  1. Millenium Ecosystem Assessment (MEA). Ecosystems and Human Well-Being: Current State and Trends: Findings of the Condition and Trends Working Group; Island Press: Washington, DC, USA, 2005; ISBN 1559632275. [Google Scholar]
  2. FAO. The State of the World’s Land and Water Resources for Food and Agriculture—Systems at Breaking Point; Synthesis Report 2021; FAO: Rome, Italy, 2021. [Google Scholar] [CrossRef] [Scilit]
  3. Zhang, J.; Ma, L.; Bai, Z.; Ma, W. Using the nexus approach to realise sustainable food systems. Curr. Opin. Environ. Sustain. 2024, 67, 101427. [Google Scholar] [CrossRef] [Scilit]
  4. Manyanga, M.; Pedzisa, T.; Hanyani-Mlambo, B. Adoption of agroecological intensification practices in Southern Africa: A scientific review. Cogent Food Agric. 2023, 9, 2261838. [Google Scholar] [CrossRef] [Scilit]
  5. Rockström, J.; Williams, J.; Daily, G.; Noble, A.; Matthews, N.; Gordon, L.; Wetterstrand, H.; DeClerck, F.; Shah, M.; Steduto, P. Sustainable intensification of agriculture for human prosperity and global sustainability. Ambio 2017, 46, 4–17. [Google Scholar] [CrossRef] [Scilit] [PubMed]
  6. Sharafi, S.; Omidvari, F.; Mottaghi, F. Enhancing drought monitoring through regional adaptation: Performance and calibration of drought indices across varied climatic zones of Iran. J. Hydrol. Reg. Stud. 2025, 59, 102350. [Google Scholar] [CrossRef] [Scilit]
  7. Lal, R. Managing soils for addressing global issues of the 21st century. In The International Dimension of the American Society of Agronomy: Past and Future; American Society of Agronomy: Madison, WI, USA, 2010; pp. 107–114. [Google Scholar]
  8. Nazari, B.; Liaghat, A.; Akbari, M.R.; Keshavarz, M. Irrigation water management in Iran: Implications for water use efficiency improvement. Agric. Water Manag. 2018, 208, 7–18. [Google Scholar] [CrossRef] [Scilit]
  9. Ahmadaali, J.; Barani, G.-A.; Qaderi, K.; Hessari, B. Analysis of the effects of water management strategies and climate change on the environmental and agricultural sustainability of Urmia Lake Basin, Iran. Water 2018, 10, 160. [Google Scholar] [CrossRef] [Scilit]
  10. Nouri, M.; Homaee, M.; Pereira, L.S.; Bybordi, M. Water management dilemma in the agricultural sector of Iran: A review focusing on water governance. Agric. Water Manag. 2023, 288, 108480. [Google Scholar] [CrossRef] [Scilit]
  11. Barrett, G.W.; Rodenhouse, N.; Bohlen, P.J. Role of sustainable agriculture in rural landscapes. In Sustainable Agricultural Systems; CRC Press: Boca Raton, FL, USA, 2020; pp. 624–636. [Google Scholar]
  12. Power, A.G. Ecosystem services and agriculture: Tradeoffs and synergies. Philos. Trans. Royal Soc. B Biol. Sci. 2010, 365, 2959–2971. [Google Scholar] [CrossRef] [Scilit]
  13. Zhang, W.; Ricketts, T.H.; Kremen, C.; Carney, K.; Swinton, S.M. Ecosystem services and dis-services to agriculture. Ecol. Econ. 2007, 64, 253–260. [Google Scholar] [CrossRef] [Scilit]
  14. Schröter, M.; Ring, I.; Schröter-Schlaack, C.; Bonn, A. The ecosystem service concept: Linking ecosystems and human wellbeing. In Atlas of Ecosystem Services: Drivers, Risks, and Societal Responses; Schröter, M., Bonn, A., Klotz, S., Seppelt, R., Baessler, C., Eds.; Springer: Berlin/Heidelberg, Germany, 2019; pp. 7–11. [Google Scholar]
  15. Malinga, R.; Gordon, L.J.; Jewitt, G.; Lindborg, R. Mapping ecosystem services across scales and continents–A review. Ecosyst. Serv. 2015, 13, 57–63. [Google Scholar] [CrossRef] [Scilit]
  16. Kremen, C.; Merenlender, A.M. Landscapes that work for biodiversity and people. Science 2018, 362, eaau6020. [Google Scholar] [CrossRef] [Scilit]
  17. Zarei, A.R.; Shabani, A.; Mahmoudi, M.R. Evaluation of the influence of occurrence time of drought on the annual yield of rain-fed winter wheat using backward multiple generalized estimation equation. Water Resour. Manag. 2020, 34, 2911–2931. [Google Scholar] [CrossRef] [Scilit]
  18. Saber, Z.; van Zelm, R.; Pirdashti, H.; Schipper, A.M.; Esmaeili, M.; Motevali, A.; Nabavi-Pelesaraei, A.; Huijbregts, M.A.J. Understanding farm-level differences in environmental impact and eco-efficiency: The case of rice production in Iran. Sustain. Prod. Consum. 2021, 27, 1021–1029. [Google Scholar] [CrossRef] [Scilit]
  19. Bennett, E.M.; Peterson, G.D.; Gordon, L.J. Understanding relationships among multiple ecosystem services. Ecol. Lett. 2009, 12, 1394–1404. [Google Scholar] [CrossRef] [Scilit] [PubMed]
  20. De Groot, R.; Brander, L.; Van Der Ploeg, S.; Costanza, R.; Bernard, F.; Braat, L.; Christie, M.; Crossman, N.; Ghermandi, A.; Hein, L. Global estimates of the value of ecosystems and their services in monetary units. Ecosyst. Serv. 2012, 1, 50–61. [Google Scholar] [CrossRef] [Scilit]
  21. Costanza, R.; d’Arge, R.; De Groot, R.; Farber, S.; Grasso, M.; Hannon, B.; Limburg, K.; Naeem, S.; O’neill, R.V.; Paruelo, J. The value of the world’s ecosystem services and natural capital. Nature 1997, 387, 253–260. [Google Scholar] [CrossRef] [Scilit]
  22. Sharafi, S.; Mohammadi Ghaleni, M.; Dragovich, D. Simulated Runoff and Erosion on Soils from Wheat Agroecosystems with Different Water Management Systems, Iran. Land 2023, 12, 1790. [Google Scholar] [CrossRef] [Scilit]
  23. Thornes, J. Atmospheric services. Ecosyst. Serv. 2010, 30, 70–103. [Google Scholar]
  24. Kumar, P. The Economics of Ecosystems and Biodiversity: Ecological and Economic Foundations; Routledge: London, UK, 2012. [Google Scholar]
  25. Sharafi, S.; Nahvinia, M.J. Sustainability insights: Enhancing rainfed wheat and barley yield prediction in arid regions. Agric. Water Manag. 2024, 299, 108857. [Google Scholar] [CrossRef] [Scilit]
  26. Lv, Y.; Gu, S.; Guo, D. Valuing environmental externalities from rice–wheat farming in the lower reaches of the Yangtze River. Ecol. Econ. 2010, 69, 1436–1442. [Google Scholar] [CrossRef] [Scilit]
  27. IPCC. Climate Change 2013: The Physical Science Basis. Contribution of Working Group I to the Fifth Assessment Report of the Intergovernmental Panel on Climate Change; Stocker, T.F., Qin, D., Plattner, G.-K., Tignor, M., Allen, S.K., Boschung, J., Nauels, A., Xia, Y., Bex, V., Midgley, P.M., Eds.; Cambridge University Press: Cambridge, UK; New York, NY, USA, 2013. [Google Scholar]
  28. Vaezi, A.R.; Sadeghi, S.H.R.; Bahrami, H.A.; Mahdian, M.H. Modeling the USLE K-factor for calcareous soils in northwestern Iran. Geomorphology 2008, 97, 414–423. [Google Scholar] [CrossRef] [Scilit]
  29. Ostovari, Y.; Ghorbani-Dashtaki, S.; Bahrami, H.-A.; Naderi, M.; Dematte, J.A.M.; Kerry, R. Modification of the USLE K factor for soil erodibility assessment on calcareous soils in Iran. Geomorphology 2016, 273, 385–395. [Google Scholar] [CrossRef] [Scilit]
  30. Mahallati, M.N.; Koocheki, A. Trend analysis of nitrogen use and productivity in wheat (Triticum aestivum L.) production systems of Iran. Agroecology 2017, 9, 360–378. [Google Scholar]
  31. Liu, H.; Li, X.; Chen, F.; Härdle, W.; Liang, H. A comprehensive comparison of goodness-of-fit tests for logistic regression models. Stat. Comput. 2024, 34, 175. [Google Scholar] [CrossRef] [Scilit]
  32. Bernardes, R.C.; Botina, L.L.; Ribas, A.; Soares, J.M.; Martins, G.F. Artificial intelligence-driven tool for spectral analysis: Identifying pesticide contamination in bees from reflectance profiling. J. Hazard. Mater. 2024, 480, 136425. [Google Scholar] [CrossRef] [Scilit]
  33. El Afandi, G.; Ismael, H.; Fall, S. Application of OpenAir and AgDRIFT models to estimate organophosphate pesticide spray drift: A case study in Macon County, Alabama. Agriculture 2023, 13, 1763. [Google Scholar] [CrossRef] [Scilit]
  34. Bailey, I.; Buck, L.E. Managing for resilience: A landscape framework for food and livelihood security and ecosystem services. Food Secur. 2016, 8, 477–490. [Google Scholar] [CrossRef] [Scilit]
  35. Marshall, F.; Dolley, J.; Bisht, R.; Priya, R.; Waldman, L.; Randhawa, P.; Scharlemann, J.; Amerasinghe, P.; Saharia, R.; Kapoor, A. Recognising peri-urban ecosystem services in urban development policy and planning: A framework for assessing agri-ecosystem services, poverty and livelihood dynamics. Landsc. Urban Plan. 2024, 247, 105042. [Google Scholar] [CrossRef] [Scilit]
  36. Aryee, G.A.; Sardinha, I.D.; Branquinho, C. Linking drivers of food insecurity and ecosystem services in Africa. Front. Sustain. Food Syst. 2024, 8, 1272332. [Google Scholar] [CrossRef] [Scilit]
  37. Painkra, S.; Singh, K.P.; Singh, B.; Jhariya, M.K.; Banerjee, A.; Sahu, K.; Haldar, P.; Kumar, B. Energy budgeting and economic analysis of coriander crop production in central India. Environ. Dev. Sustain. 2025, 1–21. [Google Scholar] [CrossRef] [Scilit]
  38. Ahmadi, M.; Mondani, F.; Nabavi-Pelesaraei, A. Evaluation of Environmental, Energy, and Economic Indices in Irrigated and Dryland Coriander Production Systems Using a Life Cycle Assessment. Agrotechniques Ind. Crops 2025, 5, 218–227. [Google Scholar]
  39. Sethuraman, G.; Mohd Zain, N.A.; Yusoff, S.; Ng, Y.M.; Baisakh, N.; Cheng, A. Revamping ecosystem services through agroecology—The case of cereals. Agriculture 2021, 11, 204. [Google Scholar] [CrossRef] [Scilit]
  40. RECROP COST. Integrative approaches to enhance reproductive resilience of crops for climate-proof agriculture. Plant Stress 2025, 15, 100704. [Google Scholar] [CrossRef] [Scilit]
  41. Eash, L. Cover Crops for Ecological Management of US Agricultural Systems: Quantifying Ecosystem Services Across Multiple Scales. Doctoral Dissertation, Colorado State University, Fort Collins, CO, USA, 2023. [Google Scholar]
  42. Peng, Z.; Duan, Z.; Wang, J. Balancing Agricultural Productivity and Ecosystem Resilience: A Multi-Species Interaction and Simulation Framework. E3S Web Conf. EDP Sci. 2025, 630, 2020. [Google Scholar] [CrossRef] [Scilit]
  43. Zou, Y.; Liu, Z.; Chen, Y.; Wang, Y.; Feng, S. Crop rotation and diversification in China: Enhancing sustainable agriculture and resilience. Agriculture 2024, 14, 1465. [Google Scholar] [CrossRef] [Scilit]
  44. Diyaolu, C.O.; Folarin, I.O. The role of biodiversity in agricultural resilience: Protecting ecosystem services for sustainable food production. Int. J. Res. Publ. Rev. 2024, 5, 1560–1573. [Google Scholar] [CrossRef] [Scilit]
  45. Nungula, E.Z.; Chappa, L.R.; Ranjan, S.; Sow, S.; Alnemari, A.M.; Seleiman, M.F.; Mwadalu, R.; Maitra, S.; Gitari, H.I. Ecosystem services through agroforestry systems and its sustainability. In Agroforestry; Raj, A., Jhariya, M.K., Banerjee, A., Jha, R.K., Singh, K.P., Eds.; Wiley-Scrivener: USA, 2024; pp. 223–254. [Google Scholar] [CrossRef] [Scilit]
  46. Baldoni, N. Innovations to Enhance Ecosystem Services in Mediterranean Forage-Cereal System. Doctoral Dissertation, Marche Polytechnic University, Ancona, Italy, 2021. Available online: https://tesidottorato.depositolegale.it/handle/20.500.14242/96417 (accessed on 20 August 2024).
  47. Ali, S.A.; Krishna, K.M.; Nithinkumar, K.; Kumari, M.; Jena, T.; Ezing, U.M.; Devika, A.R.; Saikia, N.; Borate, R.B.; Jha, R. Soil-Centric Cropping Systems Building Climate Resilience. In Climate-Smart Agricultural Technologies: Approaches for Field Crops Production Systems; Springer: Berlin/Heidelberg, Germany, 2025; pp. 247–283. [Google Scholar]
  48. Agathokleous, E.; Frei, M.; Knopf, O.M.; Muller, O.; Xu, Y.; Nguyen, T.H.; Gaiser, T.; Liu, X.; Liu, B.; Saitanis, C.J. Adapting crop production to climate change and air pollution at different scales. Nat. Food 2023, 4, 854–865. [Google Scholar] [CrossRef] [Scilit]
  49. Mena, G.T.; Gospodarek, J. White mustard, Sweet alyssum, and Coriander as insectary plants in agricultural systems: Impacts on ecosystem services and yield of crops. Agriculture 2024, 14, 550. [Google Scholar] [CrossRef] [Scilit]
  50. Prisa, D.; Fresco, R.; Jamal, A.; Saeed, M.F.; Spagnuolo, D. Exploring the potential of macroalgae for sustainable crop production in agriculture. Life 2024, 14, 1263. [Google Scholar] [CrossRef] [Scilit]
  51. Rastogi, M.; Kolur, S.M.; Burud, A.; Sadineni, T.; Sekhar, M.; Kumar, R.; Rajput, A. Advancing water conservation techniques in agriculture for sustainable resource management: A review. J. Geog. Environ. Earth Sci. Int. 2024, 28, 41–53. [Google Scholar] [CrossRef] [Scilit]
  52. Ferrante, M.; Lövei, G.L.; Lavigne, L.; Vicente, M.C.; Tarantino, E.; Lopes, D.H.; Monjardino, P.; Borges, P.A.V. Flowering coriander (Coriandrum sativum) strips do not enhance ecosystem services in Azorean orchards. Insects 2023, 14, 634. [Google Scholar] [CrossRef] [Scilit]
  53. Gawdiya, S.; Sharma, R.K.; Singh, H.; Kumar, D. Crop diversification as a cornerstone for sustainable agroecosystems: Tackling biodiversity loss and global food system challenges. Discov. Appl. Sci. 2025, 7, 373. [Google Scholar] [CrossRef] [Scilit]
  54. Gupta, A.; Singh, U.B.; Sahu, P.K.; Paul, S.; Kumar, A.; Malviya, D.; Singh, S.; Kuppusamy, P.; Singh, P.; Paul, D. Linking soil microbial diversity to modern agriculture practices: A review. Int. J. Environ. Res. Public Health 2022, 19, 3141. [Google Scholar] [CrossRef] [Scilit] [PubMed]
  55. Altieri, M.A.; Nicholls, C.I.; Dinelli, G.; Negri, L. Towards an agroecological approach to crop health: Reducing pest incidence through synergies between plant diversity and soil microbial ecology. npj Sustain. Agric. 2024, 2, 6. [Google Scholar] [CrossRef] [Scilit]
  56. Tayyab, M.; Wakeel, A.; Mubarak, M.U.; Artyszak, A.; Ali, S.; Hakki, E.E.; Mahmood, K.; Song, B.; Ishfaq, M. Sugar beet cultivation in the tropics and subtropics: Challenges and opportunities. Agronomy 2023, 13, 1213. [Google Scholar] [CrossRef] [Scilit]
  57. Haß, M. Coupled support for sugar beet in the European Union: Does it lead to market distortions? J. Agric. Econ. 2022, 73, 86–111. [Google Scholar] [CrossRef] [Scilit]
  58. Sharafi, S.; Kheiralipour, K. Long-term trends of chemical fertilizer consumption and productivity in cultivating five major crops in Iran. Energy Nexus 2025, 18, 100444. [Google Scholar] [CrossRef] [Scilit]
  59. Sharafi, S.; Marzban, Z.; Dragovich, D. Ecosystem Service Values and Wheat Agroecosystem Management Types in a Semi-Arid Region, Iran. Land 2025, 14, 865. [Google Scholar] [CrossRef] [Scilit]
  60. Losacco, D.; Ancona, V.; De Paola, D.; Tumolo, M.; Massarelli, C.; Gatto, A.; Uricchio, V.F. Development of ecological strategies for the recovery of the main nitrogen agricultural pollutants: A review on environmental sustainability in agroecosystems. Sustainability 2021, 13, 7163. [Google Scholar] [CrossRef] [Scilit]
  61. Abdullahi, M.B.; Elnaggar, A.A.; Omar, M.M.; Murtala, A.; Lawal, M.; Mosa, A.A. Land degradation, causes, implications and sustainable management in arid and semi arid regions: A case study of Egypt. Egypt. J. Soil Sci. 2023, 63, 659–676. [Google Scholar] [CrossRef] [Scilit]
  62. Rehman, A.; Farooq, M.; Lee, D.-J.; Siddique, K.H.M. Sustainable agricultural practices for food security and ecosystem services. Environ. Sci. Pollut. Res. 2022, 29, 84076–84095. [Google Scholar] [CrossRef] [Scilit]
  63. Penuelas, J.; Coello, F.; Sardans, J. A better use of fertilizers is needed for global food security and environmental sustainability. Agric. Food Secur. 2023, 12, 5. [Google Scholar] [CrossRef] [Scilit]
  64. Gorai, T.; Yadav, P.K.; Choudhary, G.L.; Kumar, A. Site-specific crop nutrient management for precision agriculture—A review. Curr. J. Appl. Sci. Technol. 2021, 40, 37–52. [Google Scholar] [CrossRef] [Scilit]
  65. Pramanick, B.; Kumar, M.; Naik, B.M.; Kumar, M.; Singh, S.K.; Maitra, S.; Naik, B.; Rajput, V.D.; Minkina, T. Long-term conservation tillage and precision nutrient management in maize–wheat cropping system: Effect on soil properties, crop production, and economics. Agronomy 2022, 12, 2766. [Google Scholar] [CrossRef] [Scilit]
  66. Barman, A.; Hoque, A.; Bera, A.; Saha, P. Precision Nutrient Management as a Climate Smart Strategy under Conservation Agriculture-Based Cropping System. In Archives of Modern Agriculture; Bhumi Publishing: Kolhapur, India, 2022; pp. 21–36. [Google Scholar]
  67. Xing, Y.; Wang, X. Precision Agriculture and Water Conservation Strategies for Sustainable Crop Production in Arid Regions. Plants 2024, 13, 3184. [Google Scholar] [CrossRef] [Scilit]
Figure 1. Flowchart of the methodological framework used for ecosystem service and disservice valuation across four intensive agroecosystems in Nahavand County, Iran.
Land 15 00345 g001
Figure 2. Location of the studied farms in Nahavand County, Iran.
Land 15 00345 g002
Figure 3. Distribution of EC, pH, OM, and N-concentration in different intensive cropping systems in Nahavand County, Iran.
Land 15 00345 g003aLand 15 00345 g003b
Figure 4. Economic value of agroecosystem services per hectare (USD ha−1 y−1) in different intensive management systems, study area in Nahavand County, Iran.
Land 15 00345 g004
Figure 5. Total positive and negative services value per hectare (USD ha−1 y−1) in different intensive management systems, study area in Nahavand County, Iran.
Land 15 00345 g005
Figure 6. Spatial distribution of net agroecosystem service values (USD ha−1 y−1) under different intensive crop management systems in Nahavand County, Iran: (A) Wheat; (B) Barley; (C) Sugar beet; (D) Coriander. Note that scales used to denote ecosystem service values are different for each crop.
Land 15 00345 g006aLand 15 00345 g006b
Table 1. Descriptive statistics of fertilizer and pesticide applications in the study area.
VariableMeanMedianMinimumMaximumStd. Deviation
Nitrogen fertilizer (kg ha−1)50050001000-
Phosphorus fertilizer (kg ha−1)5005000500-
Potassium fertilizer (kg ha−1)58.3300250106.09
Pesticide (lit ha−1)3.303.4305.852.47
Table 2. Economic evaluation of ecosystem services and environmental impacts in wheat, barley, sugar beet and coriander agroecosystems in Nahavand County, Iran.
Agroecosystem ServicesMin ($)Max ($)CV (%)Portion of Total Value (%)Portion of Net Value (%)
Wheat
Food and feed9.8 × 10313.14 × 10313.211.4415.71
Oxygen production55.3 × 10374.1 × 10318.364.5288.58
Moisture preservation3.3 × 1036.6 × 10311.23.855.29
Carbon sequestration1.30 × 1031.74 × 1038.61.522.09
Biodiversity3.50 × 1034.67 × 1034.84.075.58
Cultural0.87 × 1031.16 × 1033.81.021.40
Total Positive Value (I)74.49 × 10399.22 × 10310.5--
Emission of greenhouse gases−8.54 × 10³−6.31 × 1036.36.719.21
Soil erosion−7.19 × 10³−1.15 × 10311.23.945.41
Nitrogen and phosphor leaching−3.03 × 10³−1.84 × 1036.32.934.02
Total Negative value (II)−16.54 × 10³−10.63 × 1038.7--
Net services value58.65 × 10385.32 × 103---
Barley
Food and feed11.77 × 10315.69 × 10312.511.7415.44
Oxygen production66.36 × 10388.48 × 10314.266.1987.08
Moisture preservation3.30 × 1036.60 × 1038.33.344.40
Carbon sequestration1.57 × 1032.09 × 10311.31.562.05
Biodiversity4.17 × 1035.64 × 1036.84.145.45
Cultural1.04 × 1031.41 × 1033.71.041.36
Total Positive Value (I)88.60 × 103119.91 × 1039.19--
Emission of greenhouse gases−8.73 × 10³−6.43 × 1033.65.607.36
Soil erosion−7.19 × 10³−2.88 × 10311.83.865.08
Nitrogen and phosphor leaching−3.27 × 10³−2.31 × 10310.82.543.34
Total Negative value (II)−18.31 × 10³−11.62 × 1039.7--
Net services value73.37 × 103105.17 × 103---
Sugar beet
Food and feed12.75 × 10317.06 × 10312.414.2122.83
Oxygen production51.35 × 10368.73 × 10313.857.2391.98
Moisture preservation2.20 × 1036.60 × 1038.43.866.20
Carbon sequestration0.94 × 1031.26 × 10311.61.051.69
Biodiversity3.44 × 1034.57 × 1036.83.826.13
Cultural0.86 × 1031.14 × 1034.70.951.53
Total Positive Value (I)73.04 × 10397.17 × 10313.6--
Emission of greenhouse gases−12.98 × 10³−10.51 × 1037.910.8717.47
Soil erosion−7.19 × 10³−2.59 × 1038.54.927.90
Nitrogen and phosphor leaching−3.39 × 10³−2.61 × 10313.43.104.98
Total Negative value (II)−22.28 × 10³−16.55 × 10310.1--
Net services value51.94 × 10379.30 × 103 --
Coriander
Food and feed55.89 × 10370.60 × 1039.639.7747.01
Oxygen production60.04 × 10375.84 × 10310.742.7250.50
Moisture preservation4.70 × 1039.40 × 1038.24.034.76
Carbon sequestration0.50 × 1030.63 × 10310.80.350.42
Biodiversity6.06 × 1037.82 × 1038.24.345.13
Cultural1.51 × 1031.96 × 10312.31.091.28
Total Positive Value (I)128.69 × 103166.24 × 10310.1--
Emission of greenhouse gases−5.32 × 10³−4.33 × 1035.63.043.59
Soil erosion−9.78 × 10³−2.01 × 1038.72.713.21
Nitrogen and phosphor leaching−3.22 × 10³−1.90 × 10310.91.952.31
Total Negative value (II)−17.38 × 10³−8.54 × 1038.4--
Net services value115.84 × 103154.75 × 103---
Table 3. Performance metrics of Gaussian nonlinear regression models relating marketable value (MV) to grain yield (GY) and total dry matter (TDM) in different agroecosystems of Nahavand County, Iran.
AgroecosystemSuitable EquationRMSEMSPvalue
Wheat f ( M V ) = 18.96 e 0.5 G Y 11.703 5.83 2 + T D M 6.76 3.37 2 0.961.93538.420.0022
Barley f ( M V ) = 22.89 e 0.5 G Y 14.13 7.04 2 + T D M 8.21 4.09 2 0.940.02348.090.0035
Sugar beet f ( M V ) = 24.46 e 0.5 G Y 150.99 75.32 2 + T D M 87.54 43.67 2 0.912.003393.960.021
Coriander f ( M V ) = 103.16 e 0.5 G Y 4.24 2.12 2 + T D M 2.46 1.23 2 0.990.006395.580.009
MV is marketable value; GY is grain yield; TDM is total dry matter. R: Regression; MSE: Mean squared error; MS: Mean square; Pvalue: significance level.
Disclaimer/Publisher’s Note: The statements, opinions and data contained in all publications are solely those of the individual author(s) and contributor(s) and not of MDPI and/or the editor(s). MDPI and/or the editor(s) disclaim responsibility for any injury to people or property resulting from any ideas, methods, instructions or products referred to in the content.