Article

Water Harvesting Techniques for Assessing Land Degradation Using MEDALUS Approach and GIS Analysis: Jeffara Region, Southern Tunisia

1
Laboratoire d’Erémologie et de Lutte Contre la Désertification (LR16IRA01), Institut des Régions Arides (IRA) de Médenine, University of Gabès, Medenine 4119, Tunisia
2
Centre International de Hautes Etudes Agronomiques Méditerranéennes (CIHEAM), 70010 Bari, Italy
*
Author to whom correspondence should be addressed.
Land 2026, 15(2), 324; https://doi.org/10.3390/land15020324
Submission received: 30 December 2025 / Revised: 25 January 2026 / Accepted: 30 January 2026 / Published: 14 February 2026
(This article belongs to the Section Land, Soil and Water)

Abstract

This study investigated land degradation sensitivity in Southern Tunisia’s Jeffara region and examined the effectiveness of water harvesting techniques (WHTs) as countermeasures. Land Degradation Sensitivity Index was calculated using a modified MEDALUS framework, in which thematic quality indices were derived from normalized indicators (climate, soil, vegetation, and management) and combined through a geometric mean within a GIS environment. The model is validated with field observations. The research found that almost the entire study area (≈99%) was classified as critically sensitive under the baseline scenario. Contributing factors include extreme aridity, limited vegetation cover, significant soil erosion, and human pressures. The most severely degraded areas are found in mountainous zones, desert plains, and mining areas, whereas regions dominated by olive orchards showed moderate sensitivity levels. This lower sensitivity is associated with the drought tolerance and deep root systems of olive trees, which enhance resistance to prolonged dry periods. This study modeled the impact of implementing traditional WHTs, notably Jessour and Tabias. Under this scenario, a clear qualitative improvement was observed, with the proportion of land classified as critical decreasing from 99% to 77.3%, indicating a measurable reduction in land degradation sensitivity associated with the implementation of WHTs. Despite their environmental benefits, such as enhancing soil moisture and stabilizing agricultural yields, the spatial expansion of WHTs remains limited.

1. Introduction

Land degradation has emerged as one of the most pressing environmental challenges facing human societies today [1]. Land is a vital non-renewable resource that is increasingly being degraded by a combination of socio-economic activities—including the expansion of urban, energy, transportation, and mining infrastructures—and climatic drivers, particularly climate change [2]. As an irreplaceable component of the ecosystem, land plays a critical role in providing a wide range of ecosystem services, and its degradation significantly undermines its capacity to deliver these benefits [3]. These services include, but are not limited to, agricultural productivity, clean air, fresh water, climate and disturbance regulation, recreational opportunities, and fertile soil [4]. Globally, land degradation is widespread. Approximately 40% of the Earth’s terrestrial surface is moderately degraded, while about 9% is considered highly degraded. These conditions result in a significant decline in agricultural productivity, reducing global crop yields by an estimated 13%. Furthermore, around 1.6 million hectares of land are lost to degradation each year [5]. The broader impacts are profound, with an estimated 3 billion people being affected, either directly or indirectly, by land degradation. Economically, land degradation is responsible for an annual loss equivalent to nearly 10% of word’s gross global product [6]. The issue is particularly severe in developing countries and in arid and semi-arid regions, where about 1.3 billion people live on degrading lands. Arid zones are especially vulnerable [7]. One specific form of land degradation, desertification, predominantly occurs in these arid, semi-arid, and dry sub-humid environments. In such ecosystems, water availability is the primary limiting factor influencing land performance and ecosystem stability [8].
The Middle East and North Africa (MENA) region, encompassing many arid countries, is particularly susceptible to desertification. The impacts here are profound, affecting food security, livelihoods, environmental sustainability, economic development, and even patterns of human migration [9]. North Africa, dominated by the vast Sahara Desert, is a clear example. The region experiences extreme temperatures, sometimes exceeding 50 °C [10], and faces additional pressures from wind and water erosion, nutrient depletion, soil salinization, and frequent sandstorms—all of which contribute to a decline in soil fertility and productivity [11]. Tunisia, located in the Maghreb region of North Africa, is among the countries most severely affected. About 40% of Tunisia is covered by the Sahara Desert, and the remaining arable areas are increasingly threatened by degradation. TME (2022) estimated that up to 75% of the country’s land was at risk of degradation, primarily due to wind and water erosion. More recent figures indicate that this number has risen to 80% [12], underscoring the critical nature of the issue. In response, Tunisia became a signatory of the United Nations Convention to Combat Desertification (UNCCD) in 1995 and launched its National Action Plan (NAP) in 1998. The NAP aligns with UNCCD objectives and included measures to finance integrated land management, restore productivity in affected areas, decentralize implementation, and support rural development initiatives [13]. As part of its land restoration strategy, Tunisia has promoted several Best Management Practices (BMPs) designed to control soil erosion and enhance agricultural productivity. These include techniques such as contour ridges, recharge structures, and traditional water harvesting systems [14]. Water harvesting techniques (WHTs) reduce runoff velocity and peak flow by increasing surface roughness and promoting water retention, thereby enhancing infiltration and limiting the detachment and transport of soil particles [15,16]. Moreover, the accumulation of fine sediments and organic matter upstream of these structures leads to improvements in soil texture, increases in soil water-holding capacity, and enhanced soil fertility [17]. The resulting prolongation of soil moisture availability supports vegetation establishment and ground cover development, which in turn contributes to further reductions in erosion risk and land degradation processes [18]. Specifically, systems like Meskat, Jessour, and check dams are widely used in the southern regions and serve dual functions, as both BMPs and WHTs, aimed at efficiently capturing and managing scarce rainfall. Studies have highlighted their potential: Jessour systems could increase available water resources by a factor of 2.5 [19], while cisterns can meet a household’s domestic water need [20]. However, despite their extensive implementation, comprehensive and systematic evaluations of their effectiveness in mitigating land degradation are still limited. To address this, various models have been developed to assess land degradation. One widely used approach is the MEDALUS framework [21,22], which integrates four primary factors—climate, soil, vegetation, and land management—to classify and visualize environmentally sensitive areas [8]. While several studies have used this model in Tunisia [23,24], none have explicitly evaluated environmentally sensitive areas under different land management scenarios that incorporate the presence of BMPs. This study seeks to fill that gap by assessing the sensitivity to desertification in the Jeffara region of Southern Tunisia. The MEDALUS framework has been widely used to assess land sensitivity to degradation; most existing studies rely on static biophysical indicators and give limited consideration to land management practices as dynamic drivers of change. In particular, the role of water harvesting techniques (WHTs) in modifying land sensitivity classes and mitigating degradation processes remains insufficiently understood, especially in highly arid regions subject to strong climatic stress and human pressures. This study addresses this gap by explicitly integrating WHTs into the MEDALUS-based assessment in the Jeffara region of southern Tunisia. By doing so, the research moves beyond descriptive sensitivity mapping and provides new insights into how water harvesting practices can be incorporated into land degradation assessments to better inform sustainable land management in arid environments. It evaluates the impact of two key water harvesting techniques—Tabias and Jessour. This study aims to assess land degradation sensitivity in the Jeffara region of southern Tunisia, with a focus on desertification in arid environments. It explicitly integrates water harvesting techniques (Tabias and Jessour) into the MEDALUS framework to evaluate their role in reducing land sensitivity and mitigating degradation through Geographic Information System (GIS)-based analysis over the period 2000–2022.

2. Materials and Methods

2.1. Study Site

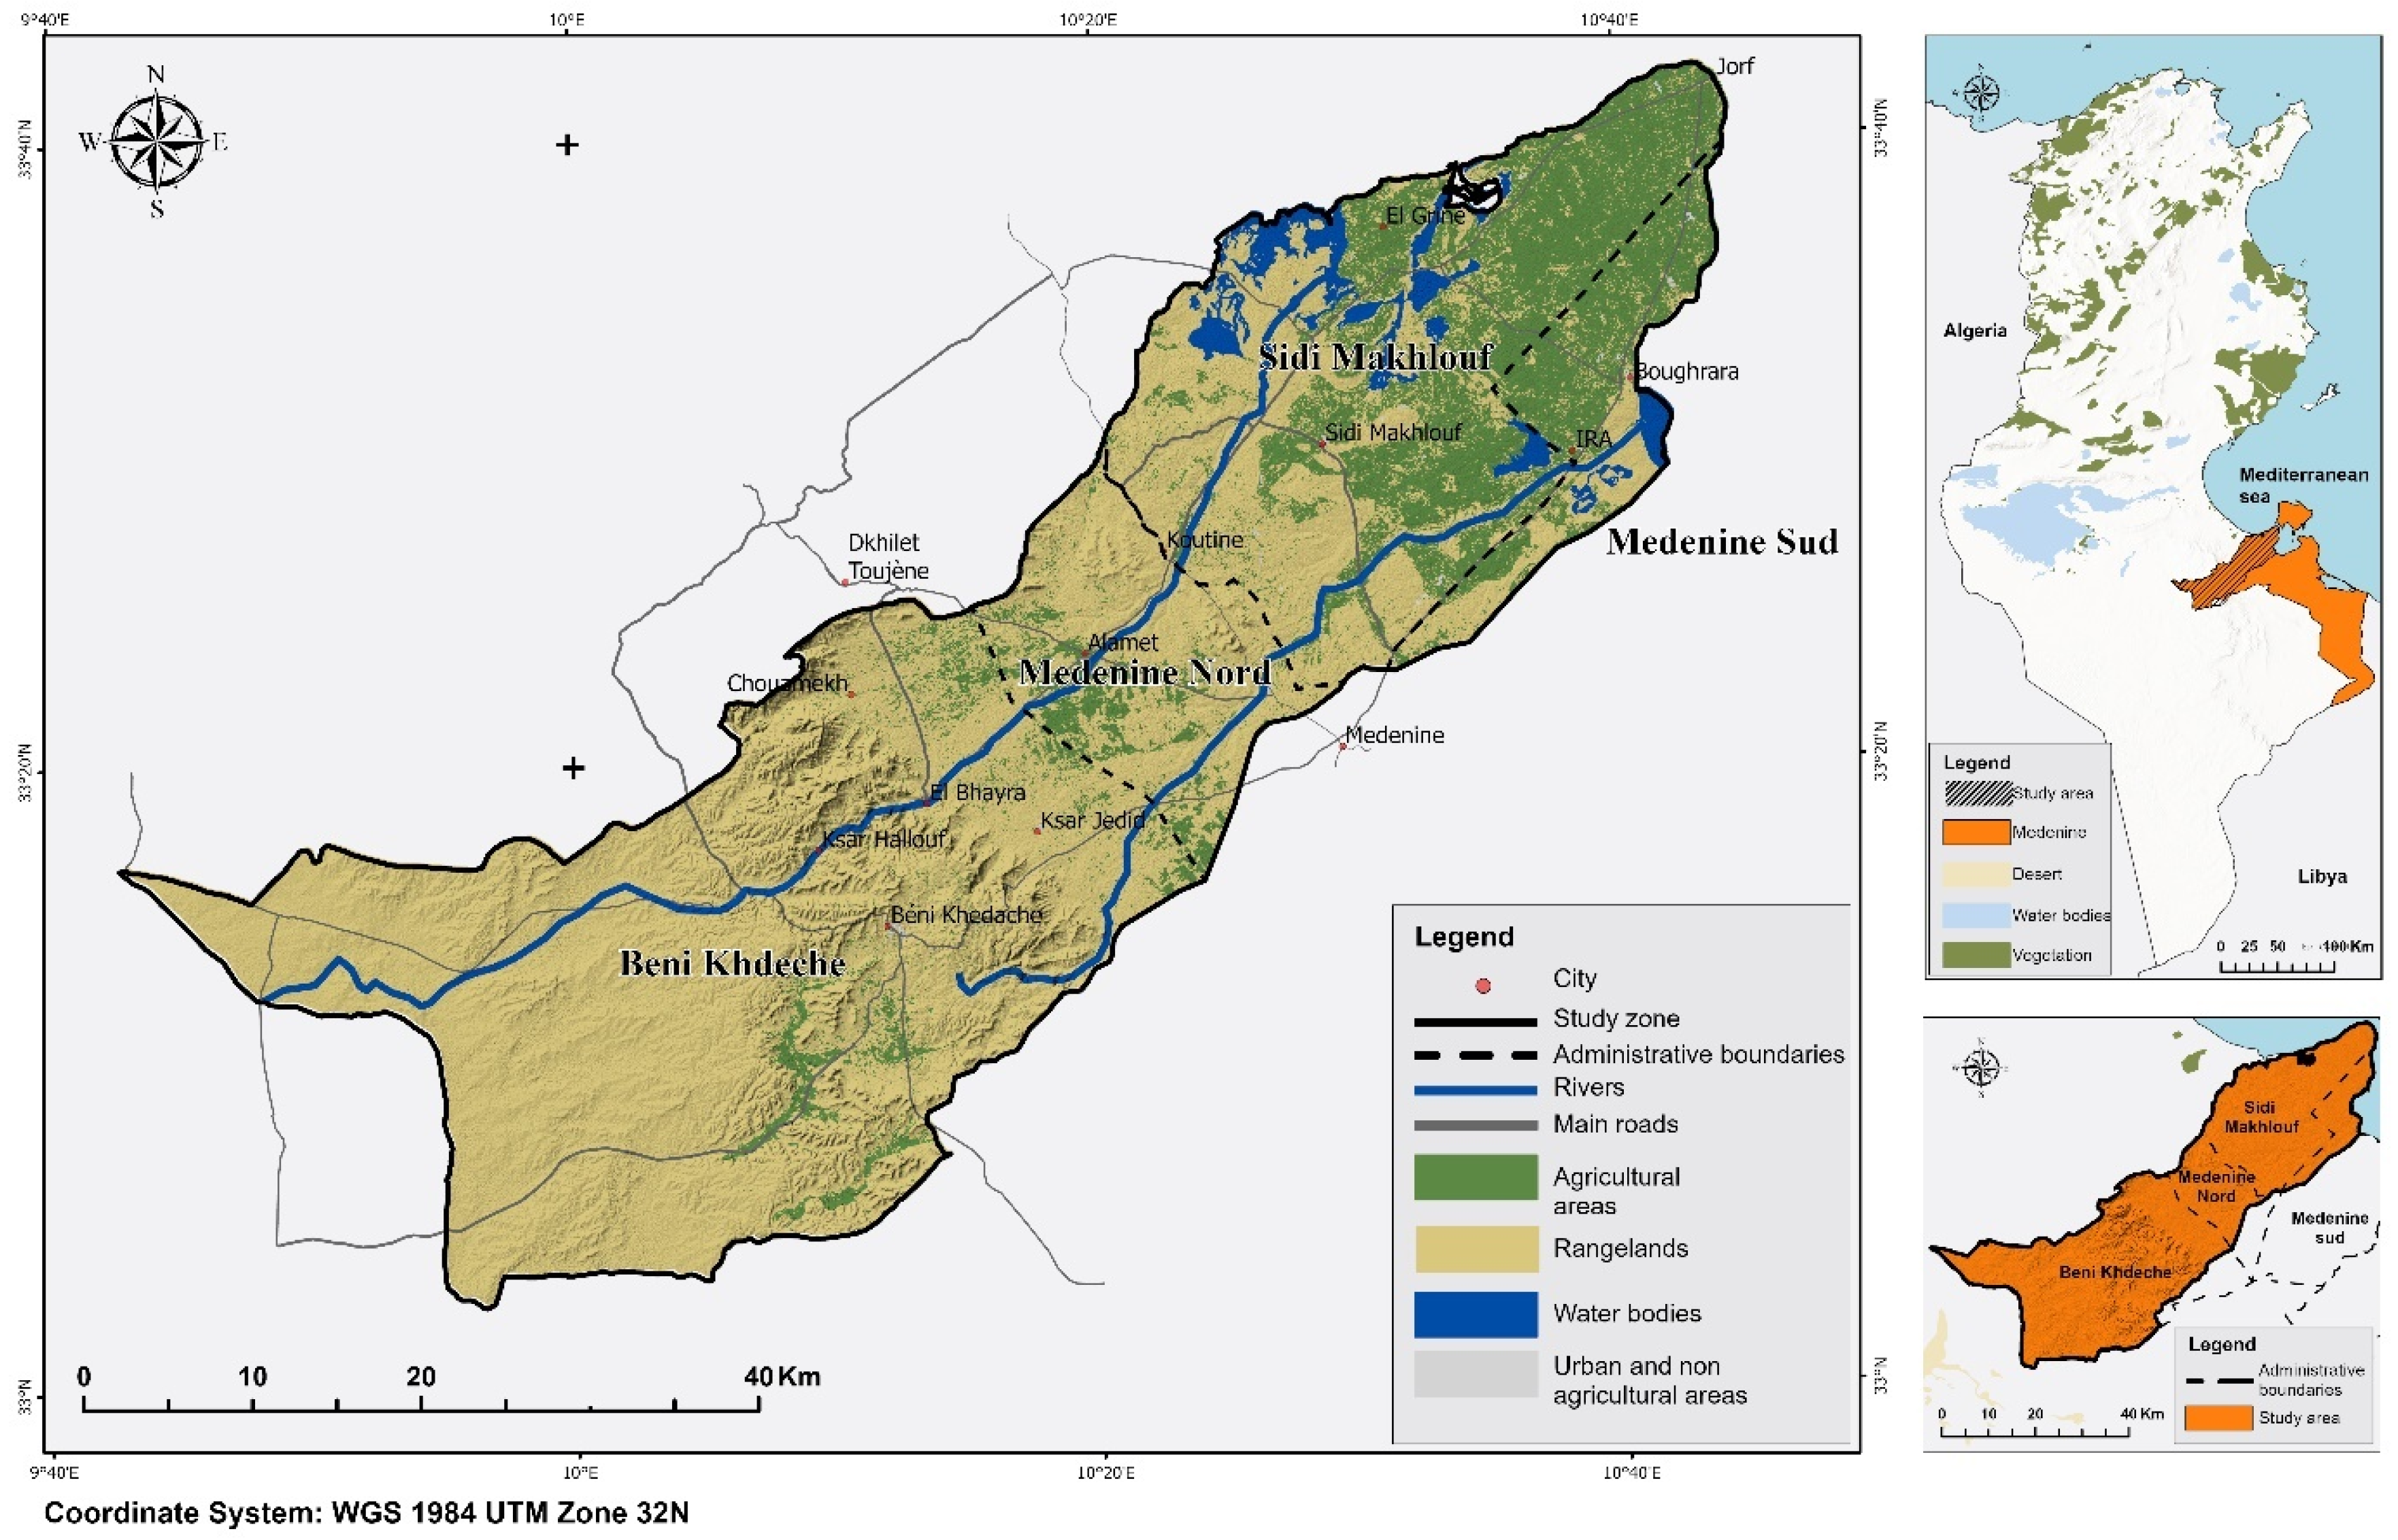
The country spans diverse climatic zones, with nearly two-thirds of its territory classified as arid [25]. Northern Tunisia experiences a Mediterranean climate marked by mild, wet winters and hot, dry summers, while conditions become increasingly arid moving southward, ultimately blending into the Saharan landscape. The present study focuses on a case area located in the Medenine governorate in southern Tunisia (Figure 1).
The governorate of Medenine, located on the south-east coast of Tunisia, covers an area of 9167 km2. It is bordered by the governorate of Gabès and the Mediterranean Sea to the north, Tataouine to the south, Libya and the Mediterranean Sea to the east, and Kebili to the west. According to the most recent census data, the total population is estimated at approximately 522,000, resulting in an average population density of 57 inhabitants per km2. The largest settlements include Medenine, Djerba, and Zarzis, which functions as the principal administrative and economic center.
The study area is located within the northern part of the Medenine governorate (Figure 1), covering approximately 2273 km2. It includes, from west to east, the delegations of Beni Khedache, Medenine North, part of Medenine South, and Sidi Makhlouf. The topography is generally gentle, with elevations ranging from 60 to 660 m above sea level.
The land use in this region is predominantly natural rangelands, covering about 74% of the total study area. Olive orchards constitute the second most common land use, accounting for 20% of the study area and 95% of the cultivated agricultural lands.
The soils in the study area are highly influenced by the underlying parent material. Soil depth increases from shallow soils around the mountainous zones to deeper profiles in the central and eastern parts. Stoniness follows a similar gradient, with rockier soils near the mountains and less stony soils in lower-lying areas. The dominant soil textures include loamy, silty clay loam, silty loam, loamy silty, and clay loam.

2.2. Climate

Updated precipitation data used in this study were obtained from the NASA open data portal, covering the period 2000–2022. Spatially, rainfall exhibits a declining gradient from the coastal east (averaging 168 mm annually) towards the interior southwest, where values drop to around 92 mm. A notable reduction is observed beyond the mountain range.
The highest amount of precipitation is in the month of December with 26.0 mm, and the lowest is in the month of July with 0.3 mm. The coldest period in the region occurs between December and February, while the hottest months span from June to August, during which maximum temperatures may reach up to 48 °C, and the average temperature is around 30 °C. The climate is characterized by extreme aridity, with an aridity index as low as 0.05, indicating harsh environmental conditions.

2.3. Methodological Framework

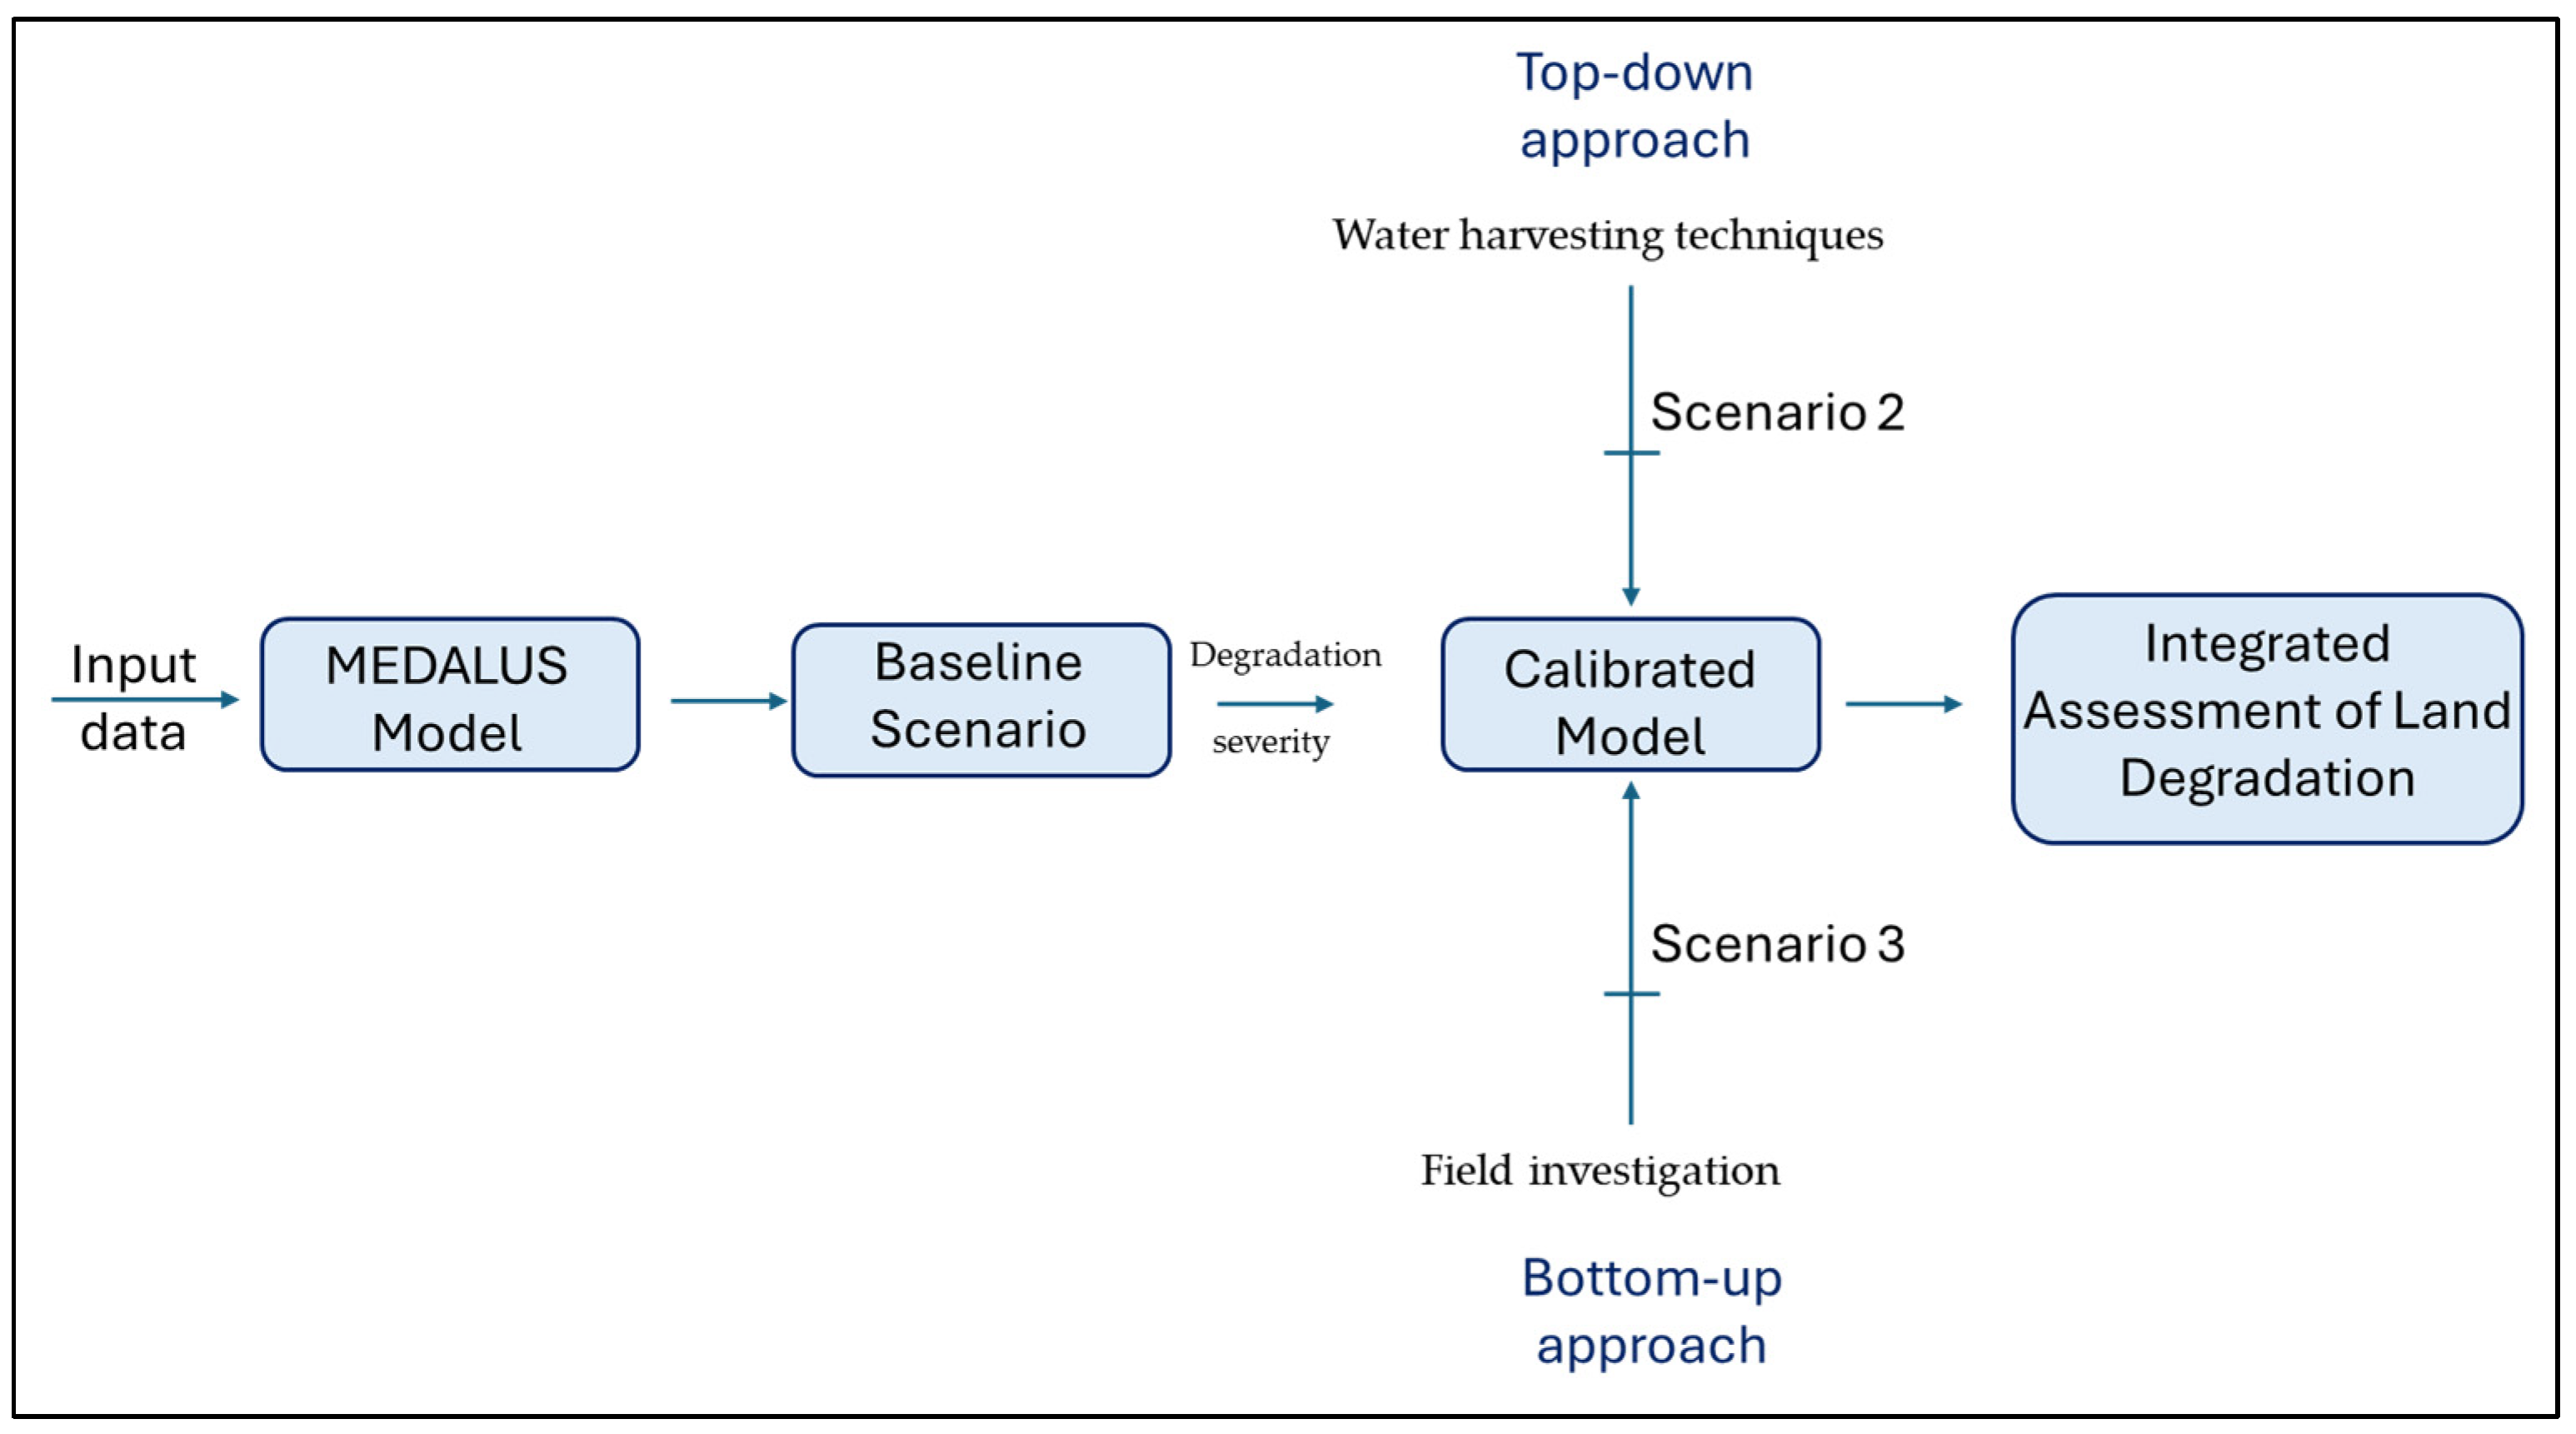
This research adopts an integrated methodology combining both top-down and bottom-up approaches, based on the implementation of three scenarios (Figure 2). MEDALUS was chosen because it offers a quantitative, GIS-based, and integrative assessment of land degradation sensitivity in arid regions, providing more locally relevant and actionable insights than GLASOD, ESAs, or WOCAT. In the first scenario, a baseline assessment of land degradation using the modified Mediterranean Desertification and Land Use (MEDALUS) model is applied across the study area. This provides a spatially explicit overview of degradation severity. The second scenario is based on simulating the potential impact of water harvesting techniques (WHTs) on land degradation dynamics, using the same methodology, offering a perspective-based scenario on landscape recovery and resilience. In the third scenario, a qualitative field investigation is carried out through structured surveys and stakeholder consultations which will be reintegrated into the MEDALUS model. This bottom-up component captures local perceptions regarding both the current state of land degradation and the effectiveness of WHTs interventions, thereby validating and enriching the model outputs with contextual knowledge.

2.4. Land Degradation Baseline Scenario

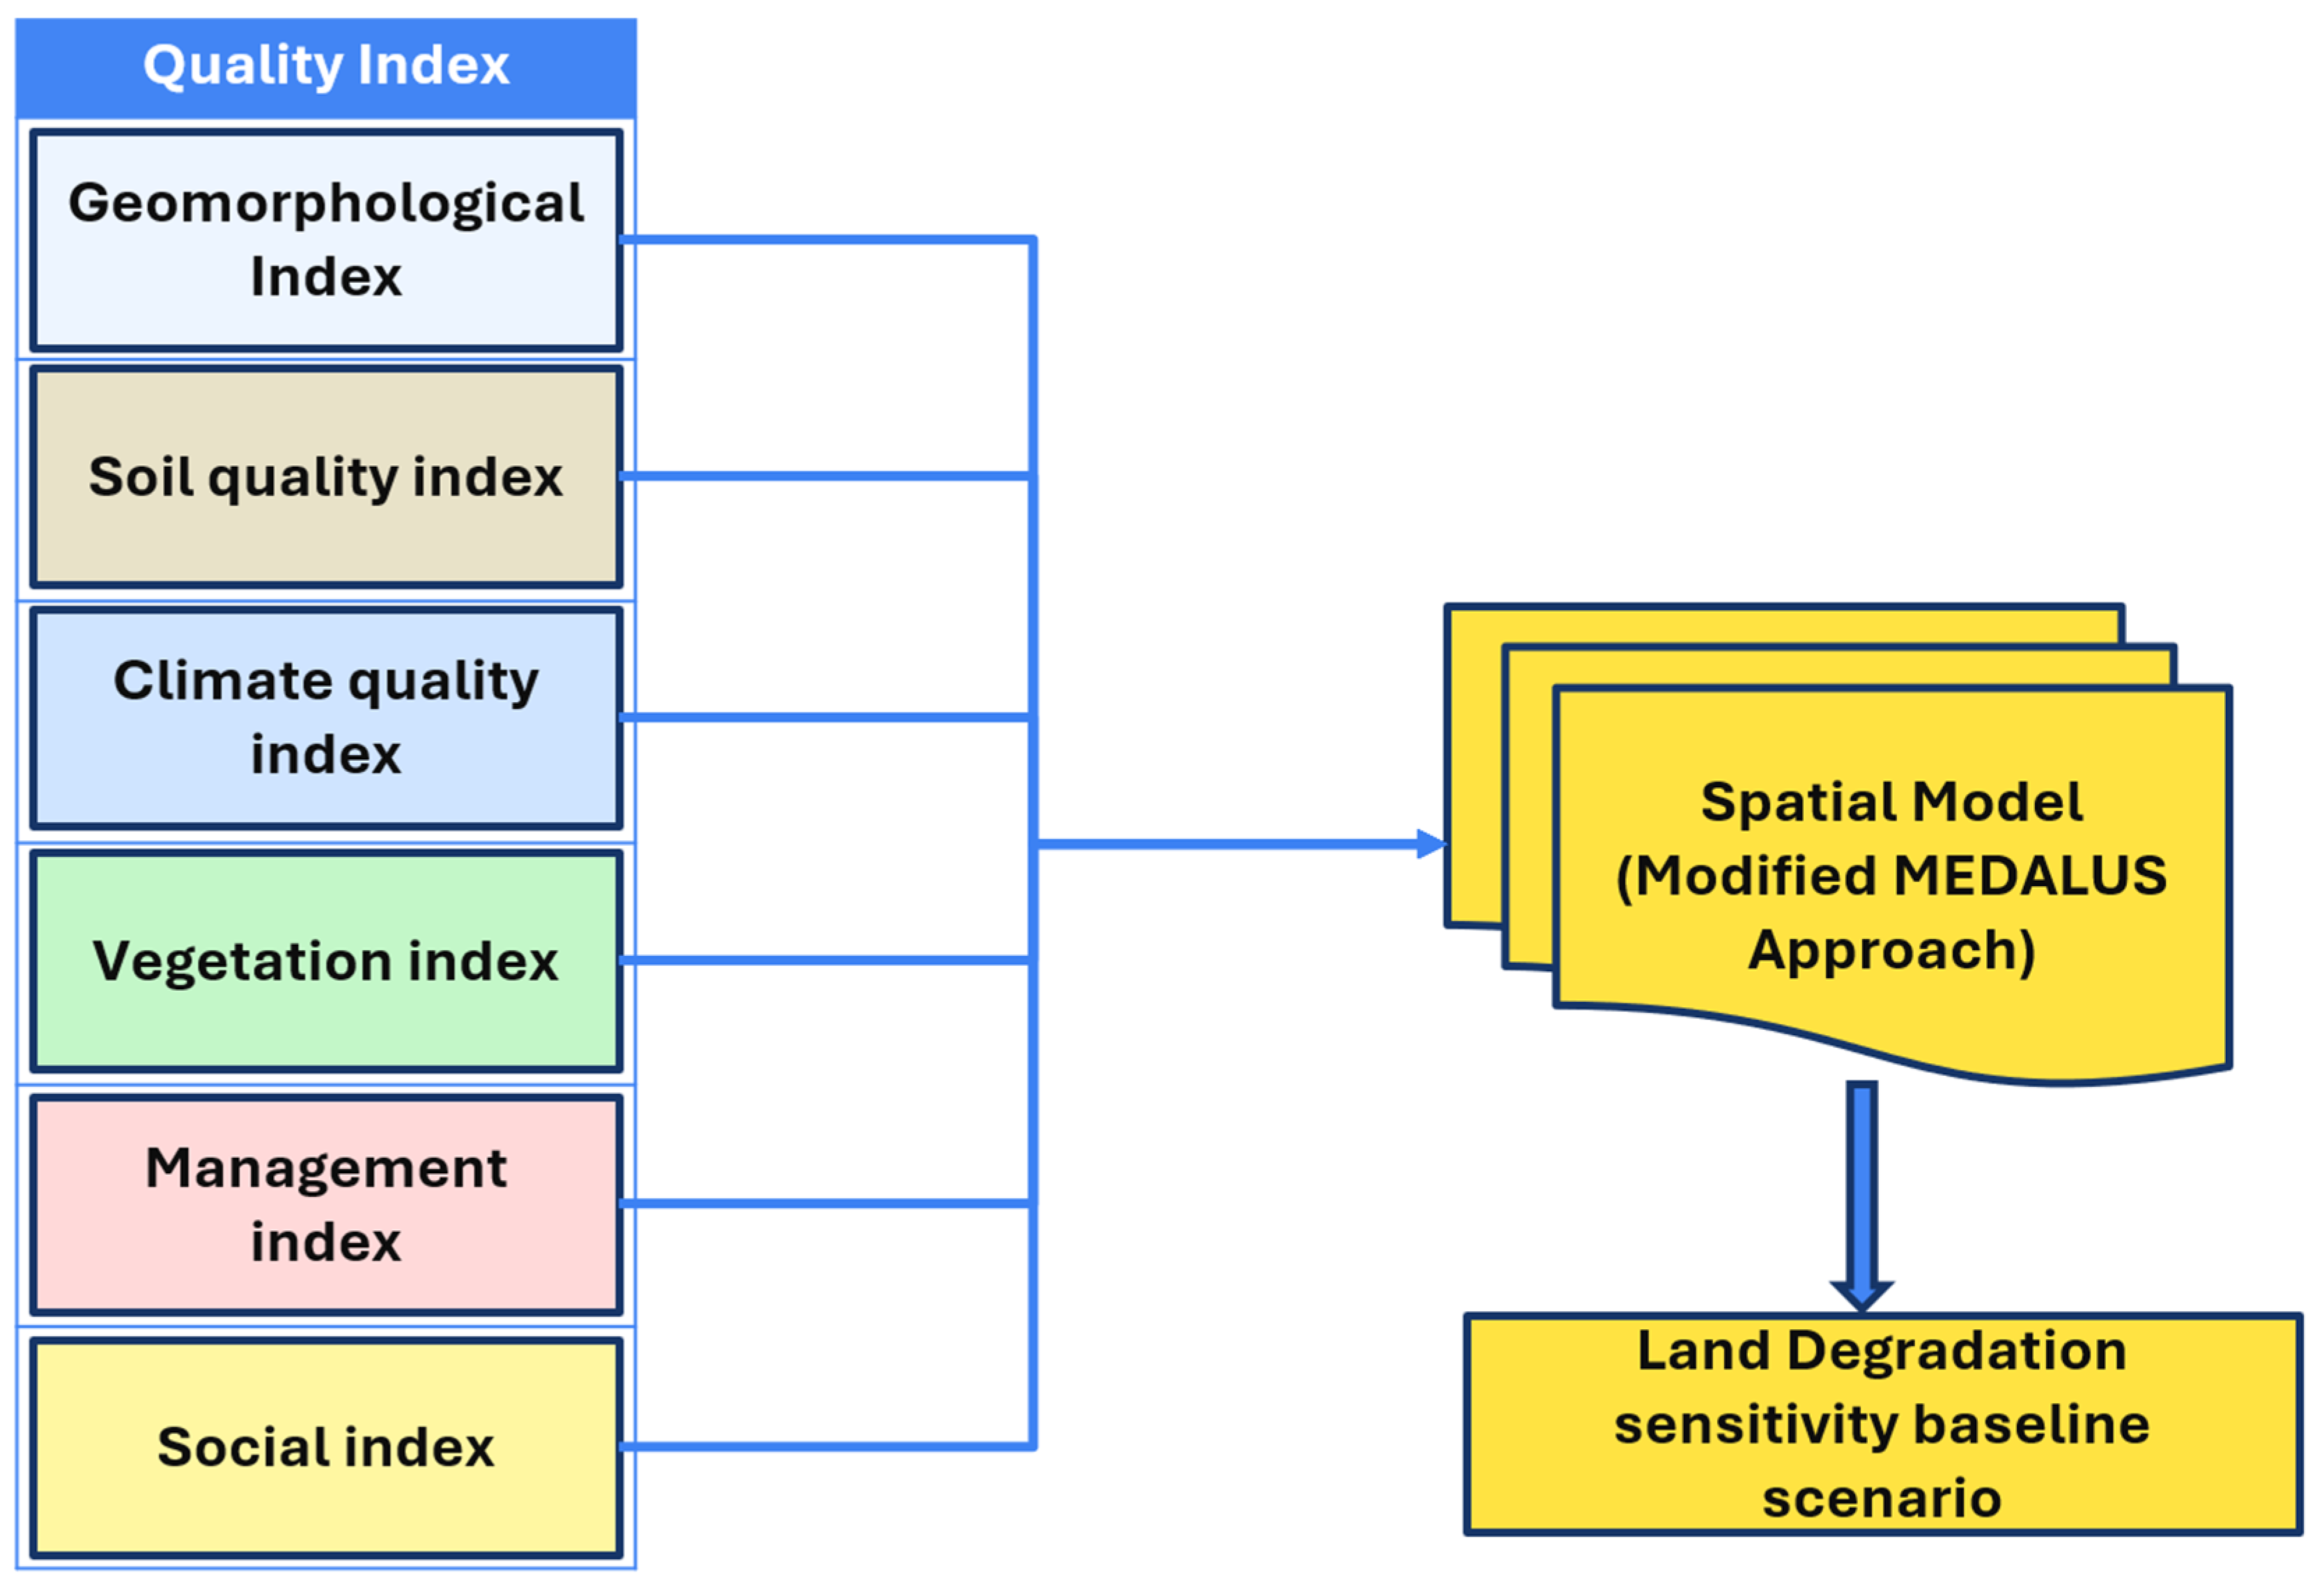
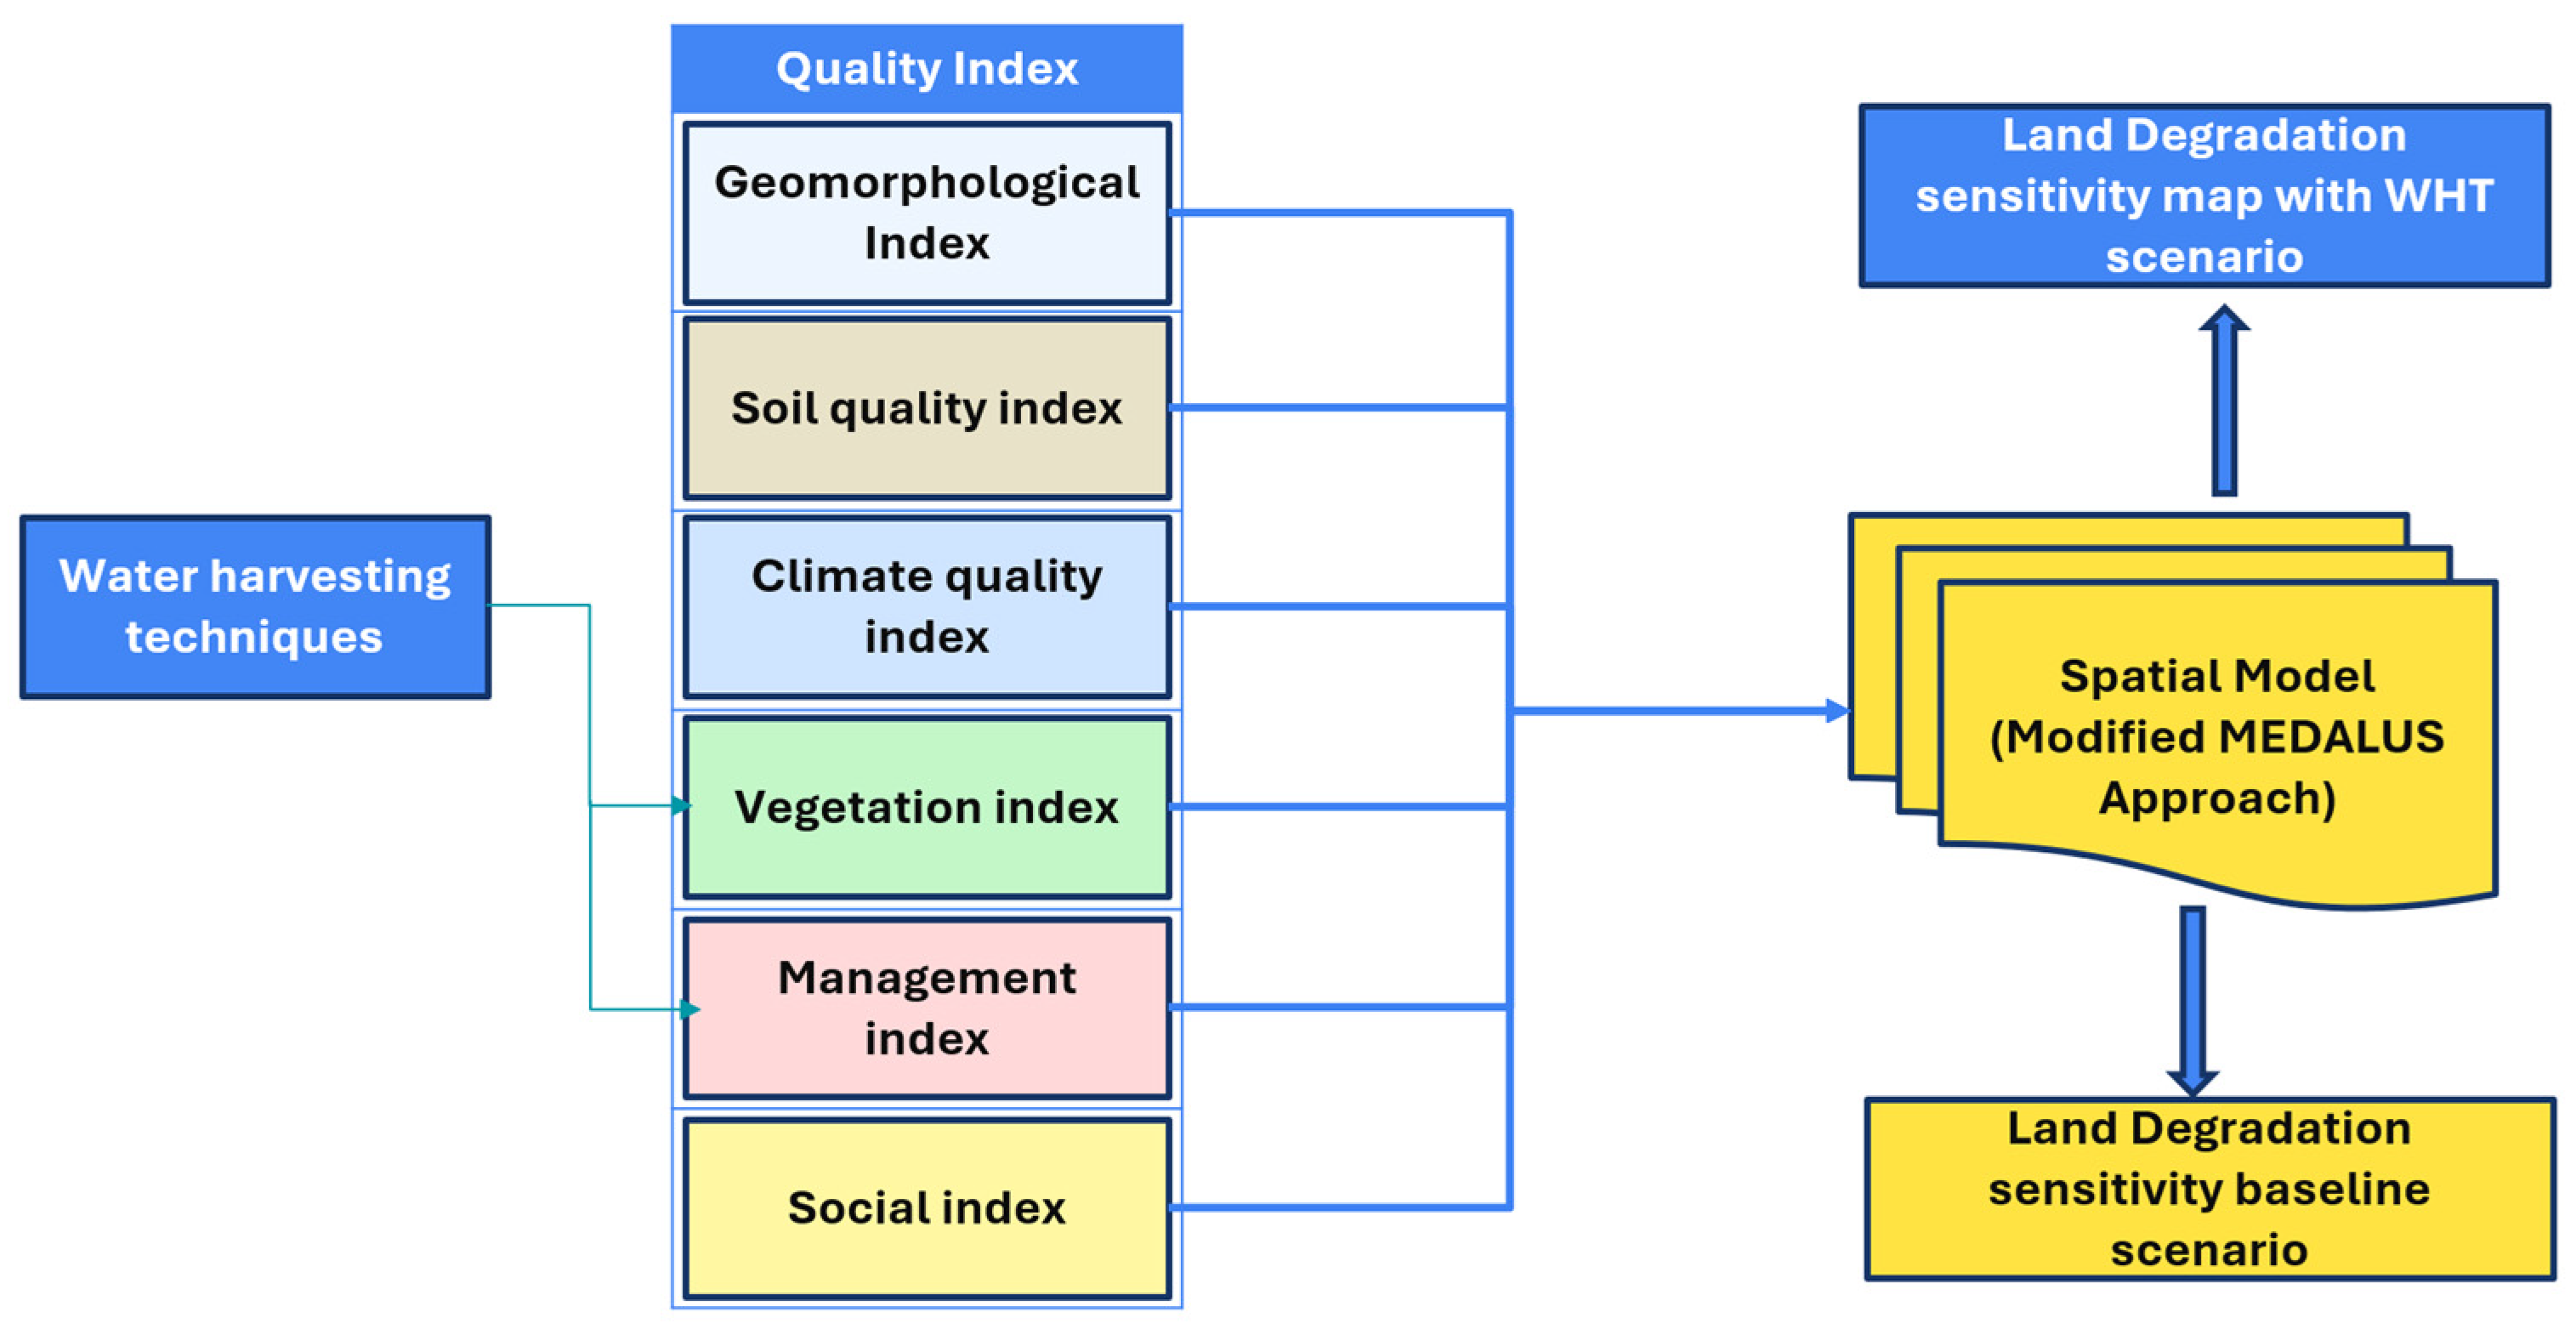
The assessment of land degradation sensitivity in this study was carried out using the MEDALUS methodology, which integrates a set of quality indexes originally developed under the European Soil Atlas (ESA) initiative (Figure 3). The model integrates four primary quality indices:
Climate Quality Index (CQI),
Soil Quality Index (SQI),
Vegetation Quality Index (VQI),
Management Quality Index (MQI).
Each index is constructed by evaluating a set of relevant sub-indexes or parameters (Table 1), selected based on their direct or indirect influence on land degradation processes.
The methodology involves spatial analysis of geographic datasets within a GIS environment, where each parameter is classified into sensitivity classes and converted into raster layers. Sub-indexes are assigned standardized scores ranging from 1 (low sensitivity) to 2 (high sensitivity). The values are then aggregated using geometric means to produce the respective quality indices. This systematic approach enables the identification of areas with varying susceptibility to degradation, following the original MEDALUS protocol.
To enhance the comprehensiveness of the assessment and leverage the adaptability of the MEDALUS methodology to local and national conditions, two additional indexes were incorporated: the Geomorphological Quality Index (GQI) and the Socio-Economic Quality Index (EQI) (Figure 3). These indexes complement the original MEDALUS framework by providing further insights into the physical and socio-economic factors influencing land degradation sensitivity [26]. In this study, the six indexes were processed using ArcGIS Pro 3.4.2, incorporating a total of 19 geographic variables. Thirteen of these variables corresponded to standard parameters from the original MEDALUS methodology, while the remaining six were specifically tailored to address land degradation conditions unique to the Medenine region. All indexes and sub-indexes were analyzed using raster data; all spatial datasets were projected in WGS 1984/UTM Zone 32N, standardized to a common spatial resolution of 30 m, reflecting the highest available spatial resolution of the input data.

2.4.1. Climate Quality Index

The first quality index was derived by integrating two geographic parameters from the original MEDALUS framework (Table 2), maintaining the classification scheme [27].
Annual and monthly precipitation data spanning from 2000 to 2022 were sourced from the NASA Earth Data platform as NETCDF files, which were then converted into feature points and subjected to raster regression-kriging. Kriging regression was used as it combines regression with spatial autocorrelation, improving prediction accuracy in areas with sparse observation points. A similar procedure was applied to derive air temperature, humidity, and sunshine duration data, which were subsequently used to calculate Potential Evapotranspiration (PET). PET was computed using the FAO-56 Penman–Monteith method, which will be used in determining the aridity index, as defined by the following formula:
A I = P / P E T
The Climate Quality Index (CQI) was then calculated by applying the geometric mean to the parameter score values, following the formula below:
C Q I = ( R a i n f a l l × A r i d i t y   I n d e x ) 1 / 2

2.4.2. Soil Quality Index

Soil characteristics, evaluated through this index, are crucial for assessing land sensitivity to degradation due to their influence on water retention and erosion resistance. For the Soil Quality Index (SQI), four pedological parameters were selected and analyzed, following the same approach as the original MEDALUS methodology [27]. Unlike the MEDALUS framework, where slope is incorporated into the SQI, in this study, slope was reclassified under the newly introduced Geomorphological Quality Index (GQI) in recognition of its derivation from morphometric data. Similarly, slope aspect, which was previously part of the CQI, was transferred to the GQI [22].
Due to the unavailability of recent soil data, information was obtained from the ISRIC study and the agricultural map provided by the CRDA. Although the ISRIC soil data dates to 2008, its use is deemed reliable, as soil parameters remain relatively stable over time, thus not significantly impacting the results. Data classification was performed using the standard MEDALUS model for texture and parent material, while for stoniness and soil depth, classifications from the agriculture map were directly applied (Table 3).
The SQI was subsequently calculated using the geometric mean of the parameter scores, as per the following formula:
S Q I = ( T e x t u r e × P a r e n t   m a t i e r a l × S t o n i n e s s × S o i l   d e p t h ) 1 / 4

2.4.3. Geomorphological Index

The four morphological variables incorporated in the GQI reflect the mechanisms through which lands may become vulnerable to erosion and, consequently, degradation. Slope, originally included in the SQI in the standard MEDALUS framework, serves as an index of the intensity of hydric erosion, with steeper slopes exhibiting higher erosion rates. Slope aspect influences land sensitivity to degradation by modulating differences in soil moisture, which in turn affects vegetation growth. Southern-facing slopes receive more direct sunlight compared to northern-facing slopes, resulting in higher evapotranspiration, reduced humidity, and, consequently, less robust vegetation (Table 4). These conditions increase the vulnerability of the land to both water and wind erosion [26,27].
Plan curvature, which represents the horizontal curvature of the slope, identifies convergent runoff areas (negative values), which are more susceptible to rapid surface runoff and, as a result, are at greater risk of hydric erosion. In contrast, divergent areas (positive values) experience slower runoff and are less prone to erosion. Profile curvature, which describes the vertical curvature of the slope, is linked to erosion potential, with convex slopes (negative values) exhibiting higher erosion risks due to faster, more intense runoff. In contrast, concave slopes (positive values) experience slower runoff, thus mitigating the erosion process [26].
The GQI was ultimately computed by applying the geometric mean to the parameter score values, following the formula below:
G Q I = ( S l o p e × S l o p e   a s p e c t × P l a n   c u r v a t u r e × P r o f i l e   c u r v a t u r e ) 1 / 4

2.4.4. Vegetation Quality Index

The role of vegetation characteristics in land sensitivity to degradation was evaluated using this index, which incorporates four standard parameters from the MEDALUS methodology: fire risk, erosion protection, drought resistance, and vegetation cover. These geographic variables were derived by processing land use/cover data for the Medenine region, extracted from the agricultural map. Each sub-index was calculated by classifying and weighing the land use/cover classes according to the original MEDALUS framework.
Fire risk assesses the vulnerability of different land cover types to wildfires, as well as their ability to regenerate post-fire [21,26]. Drought resistance evaluates the resilience of vegetation to drought conditions [16]. Finally, vegetation cover (Table 5), which reflects the density of vegetation in a given area, was estimated using Sentinel-2 imagery and classified following the method suggested by Nour-Eldin et al. [28] as it is common practice to use NDVI in place of the vegetation cover index when detailed vegetation quality data is unavailable. The same intervals suggested by the Nour-Eldin et al. [28] study were adapted as the climate and vegetation are similar. Sentinel-2 Level-2A imagery from 2022 was used to calculate NDVI. These images, dating from 2016 to 2022, are provided as atmospherically corrected surface reflectance. Scenes with significant cloud cover were excluded, although the study area is mostly cloud-free throughout the year. A representative NDVI composite was generated for the study period using mean values.
NDVI was calculated using the following formula:
N D V I = B a n d 8 B a n d 4 B a n d 8 + B a n d 4
The Vegetation Quality Index was calculated using the following formula:
V Q I = ( V e g e t a i o n   c o v e r N D V I × D r o u g h t   r e s i s t a n c e × E r o s i o n   p r o t e c t i o n × F i r e   r i s k ) 1 / 4

2.4.5. Management Quality Index

To obtain the Management Quality Index (MQI), which captures anthropogenic stress on the environment, geographical data were processed by considering two variables from the MEDALUS framework: agricultural intensity and policy enforcement (Table 6). Similarly to the Vegetation Quality Index (VQI), mapping for the MQI variables was conducted by classifying and weighting land cover/use classes, extracted from the agriculture map database.
The agricultural intensity sub-index evaluates the degree of anthropogenic intervention, particularly from agricultural activities [21]. This classification slightly deviates from the original MEDALUS framework, with stocking rates excluded due to the degraded condition of the rangelands and bare lands in the study area.
The policy enforcement sub-index assesses the strength of environmental protection policies based on their implementation for each land use type [21]. This classification follows the original MEDALUS methodology.
Finally, the MQI was calculated using the following equation:
M Q I = ( A g r i c u l t u r e   i n t e n s i t y × P o l i c y   e n f o r c e m e n t ) 1 / 2

2.4.6. Socio-Economic Quality Index

It captures the direct pressure exerted by human populations on ecosystems and, consequently, on land degradation [26,29]. In this case, the socio-economic index was derived using three anthropogenic factors: population density, population growth, and old age rate. These factors have been employed in comparable international studies (Table 7). The population data were provided by the ODS (Office de développement du Sud), specifically processed for the governorate of Medenine in the “Atlas de Medenine” report. The data was then assigned to each delegation within a GIS environment. The classification process followed approaches from a similar MEDALUS studies [29] and adhered to the classification system used by the ODS for the old age index, as this ratio is calculated differently across countries.
Finally, the EQI was processed/obtained based on the geometric mean of the parameters’ score values, using the following formula:
E Q I = ( P o p u l a t i o n   d e n s i t y × P o p u l a t i o n   g o r w t h × O l d   a g e   r a t i o ) 1 / 3

2.4.7. Land Degradation Sensitivity Index

After processing and obtaining the six quality indexes, the Land Degradation Sensitivity Index (LDSI) was derived by applying the geometric mean of the indexes, using the following formula:
L D S I = ( C Q I × S Q I × G Q I × V Q I × M Q I × E Q I ) 1 / 6
The land degradation sensitivity was then classified according to the standard MEDALUS methodology, as shown in the following table (Table 8):

2.5. Land Degradation Under WHTs Scenario

2.5.1. Water Harvesting Techniques Inventory

The dataset obtained from the CRDA, which delineates water harvesting structures, covered approximately 20% of the study area. Although limited, this dataset was sufficient to conduct semi-automatic classification. The dataset was transformed into simplified training data to enhance the classification process. Sentinel-2 imagery was utilized as the primary input for the classification, given its high spatial resolution and availability.
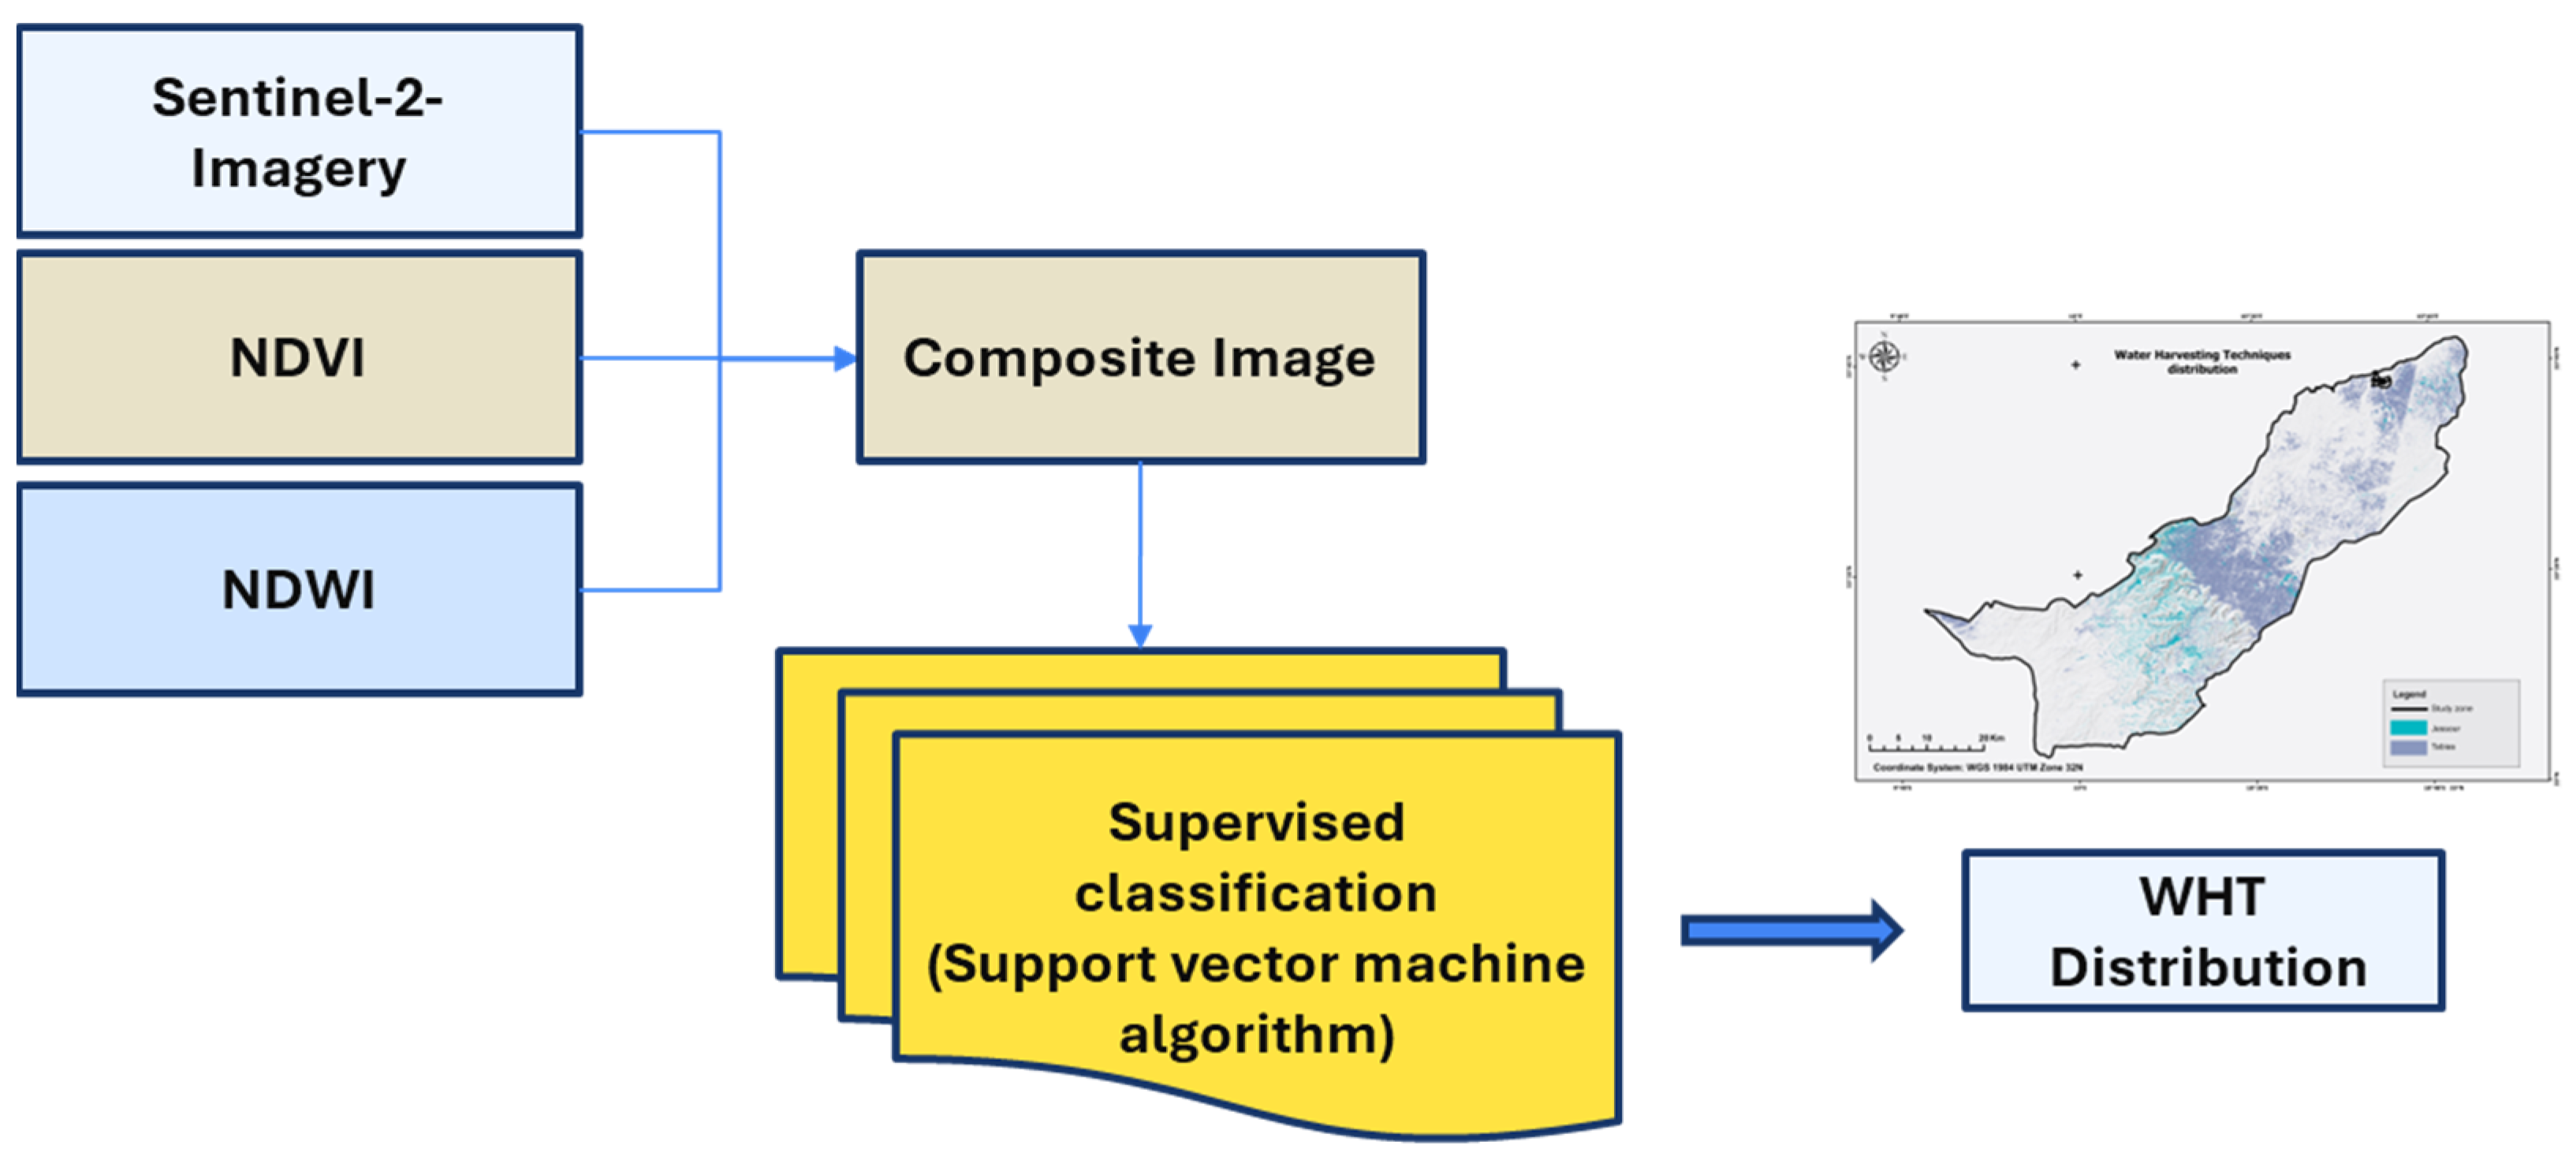
Water harvesting structures have a significant influence on vegetation, water content, and are often affected by topographic features such as slope. Therefore, in addition to the Sentinel-2 imagery, other indices were incorporated to improve classification accuracy. For instance, Jessour structures are predominantly found in mountainous areas, while Tabias are typically located on hills and plains with minimal slopes. To capture these variations, a slope map, NDVI (Normalized Difference Vegetation Index), and NDWI (Normalized Difference Water Index) were derived as additional bands from the Sentinel-2 imagery (Figure 4).
A Support Vector Machine (SVM) algorithm was employed to classify the land cover into seven distinct classes: Jessour, Tabias, Buildings, Rangelands, Breland, Mountains, and Water Bodies. This methodology, similar to land cover/land use classification, was adopted to train the algorithm effectively with sufficient samples and categories for improved results. SVM was specifically chosen because it is sensitive to minor changes in the training data, making it well-suited for detecting subtle differences in land cover types.
Following classification, the resulting WHTs (water harvesting techniques) raster was converted into a feature dataset, where non-relevant classes were removed, allowing the dataset to be used in the subsequent stages of the study. This approach ensured a more refined and accurate identification of water harvesting structures in the study area.

2.5.2. Water Harvesting Techniques Scenario Implementation

Soil and water conservation practices are primarily aimed at enhancing agricultural yield. On one hand, water harvesting techniques directly influence water supplementation, flood prevention, water table recharge, and control of erosion [30]. On the other hand, they indirectly improve yield stability and quality, particularly for olive trees, which are the primary agricultural crop in the study area [31,32].
To simulate the water harvesting techniques Scenario, the Management Quality Index (MQI) and Vegetation Quality Index (VQI) were masked in areas where Jessour or Tabias were present. In these areas, the sensitivity was assigned a value of 1, corresponding to good quality. The Soil Quality Index (SQI), Geomorphological Quality Index (GQI), Socio-Economic Quality Index (EQI), and Climate Quality Index (CQI) remained unchanged (Figure 5). Subsequently, the LDSI was recalculated over the entire study area using Equation (9), ensuring that differences between scenarios are solely attributable to changes in MQI and VQI values.

2.5.3. Field Validation

To obtain a holistic view of the effects of water harvesting techniques and the perception of land degradation, data were collected through a structured survey, consisting of both close-ended and open-ended questions, was conducted with various stakeholders. The target groups included farmers, farmer groups, extension services, and local authorities involved in the project. The surveys were tailored to either farmers or extension/authority agents.
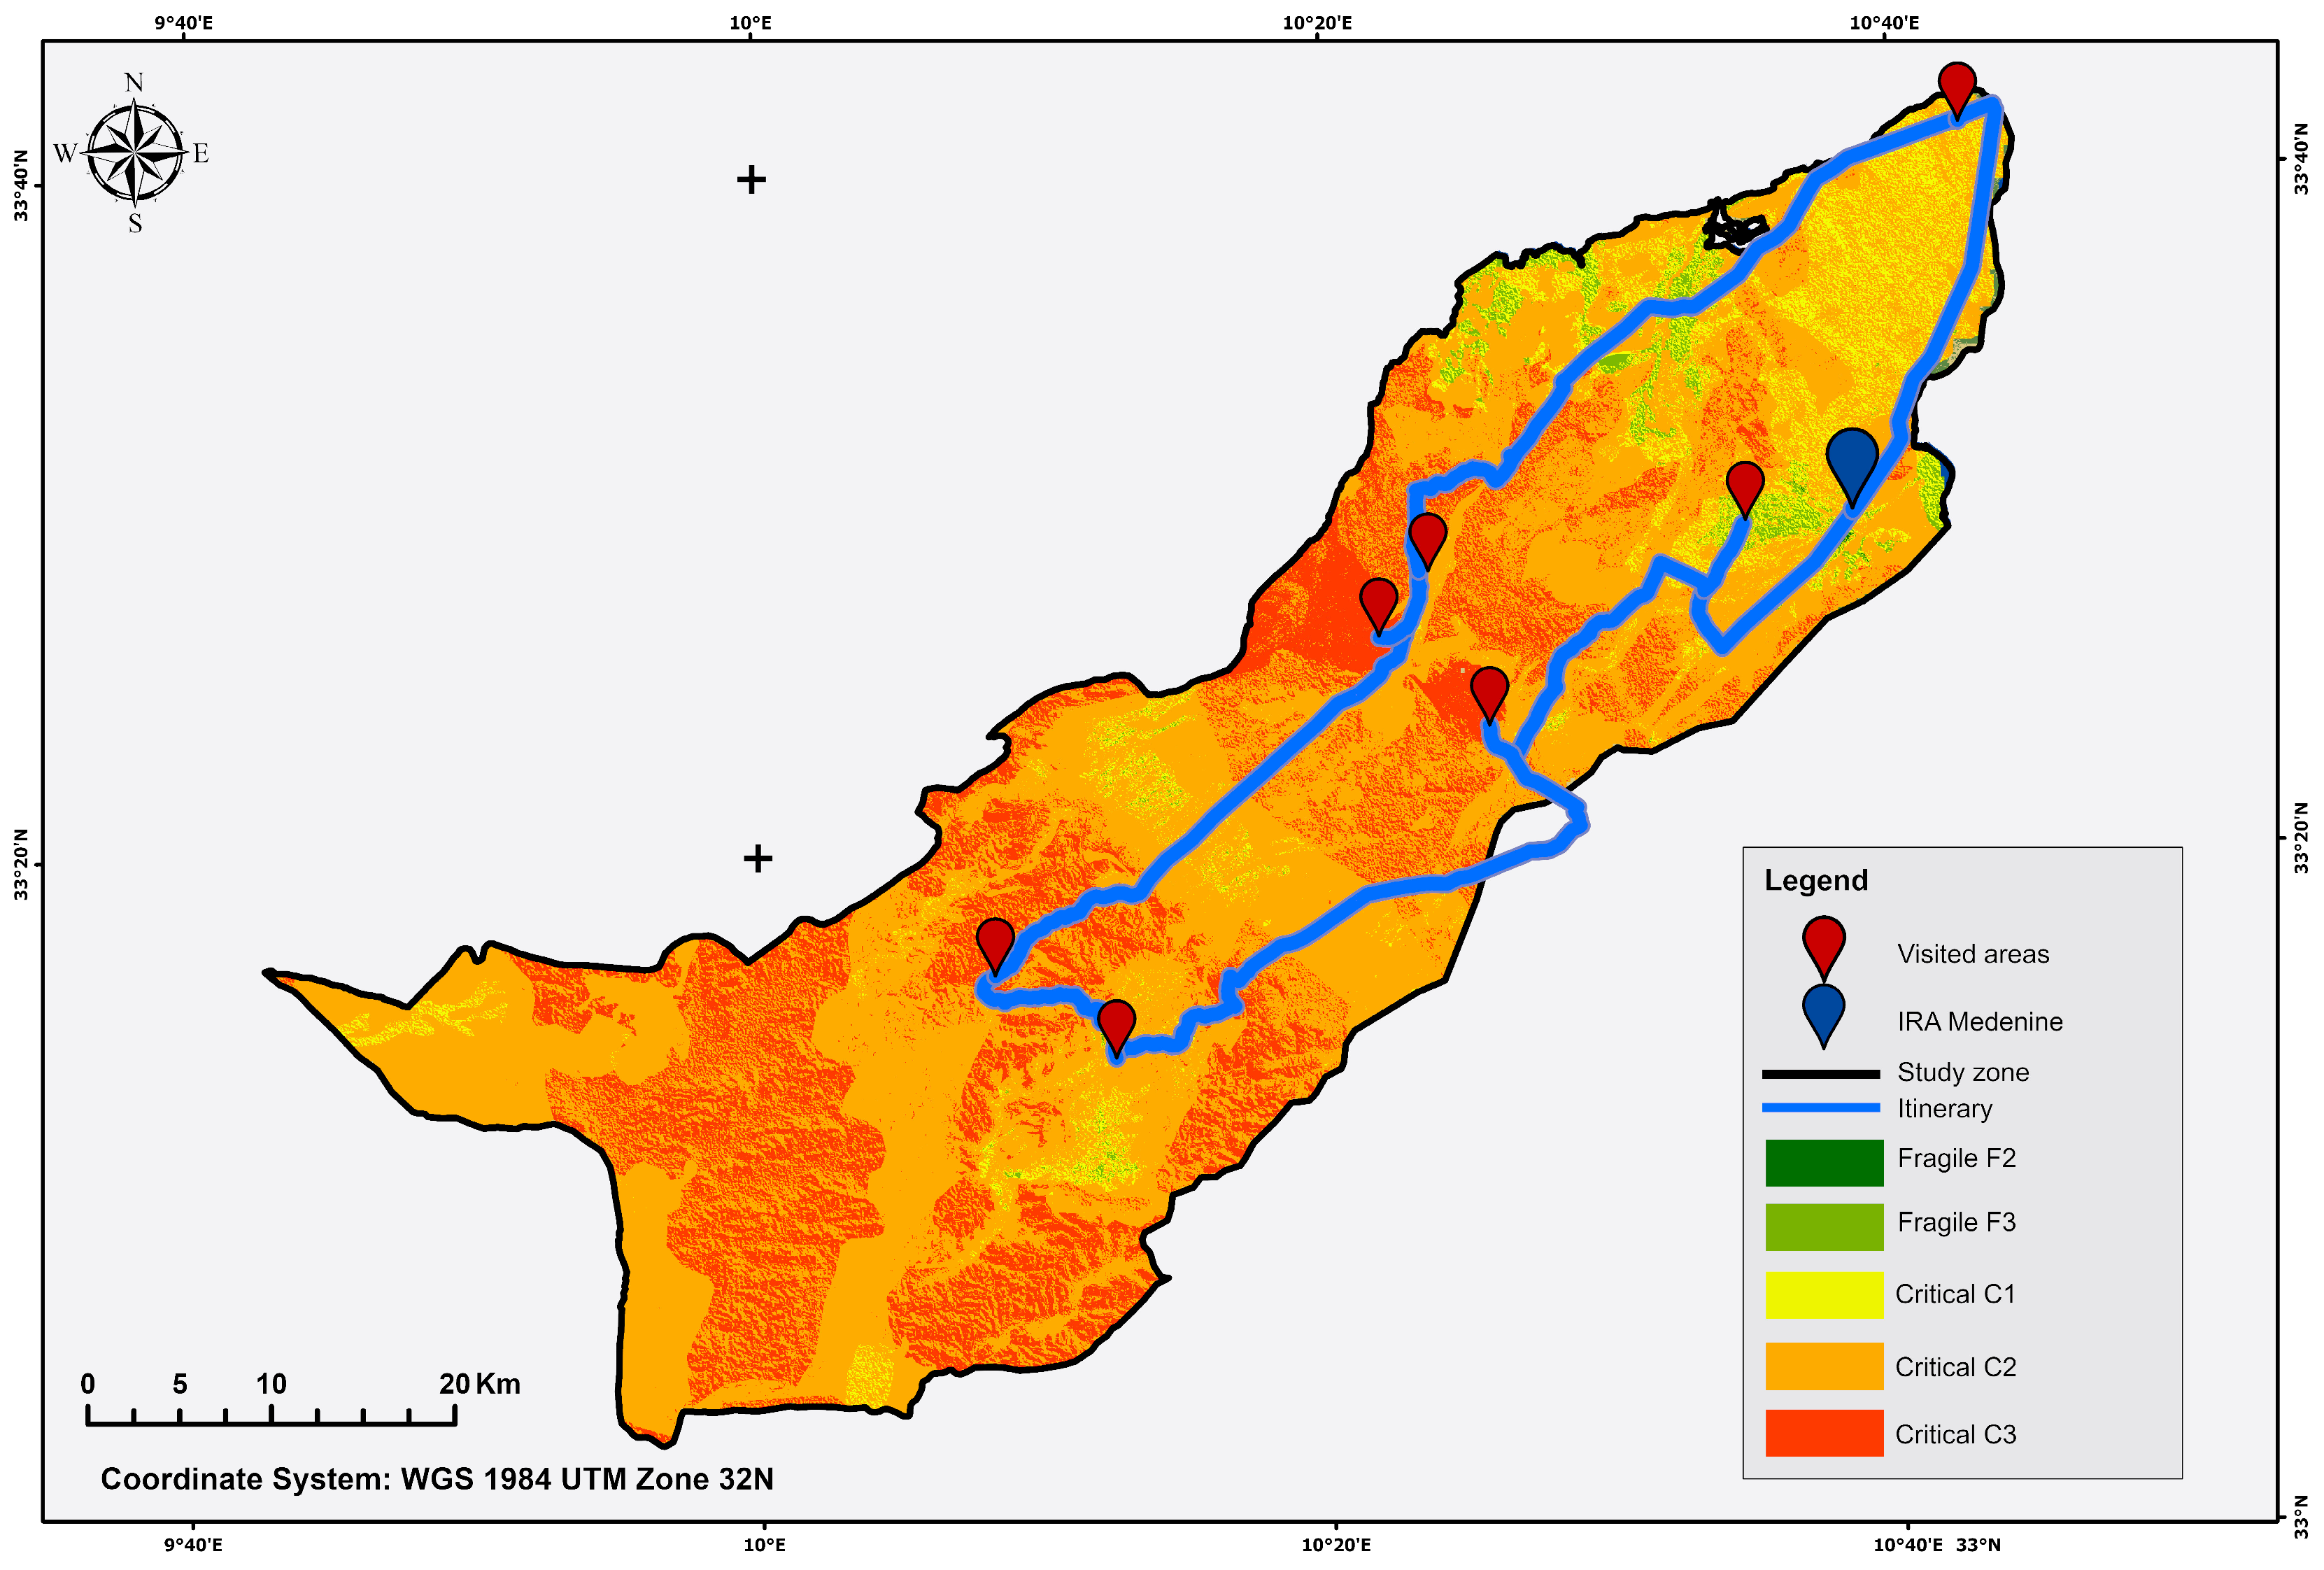
The goal of the survey was to gather insights into the status of land degradation (LD) in the study area, identify the most degraded areas, understand the perception of the indexes used in the MEDALUS framework, explore the environmental and socio-economic causes of LD and its consequences, and assess the effectiveness, limitations, and opportunities of water harvesting techniques. Data was collected through face-to-face interviews with a sample size of n = 15. The surveys took place during several meetings with stakeholders involved in the study area. The preliminary results of land degradation sensitivity were produced later, providing an opportunity for the validation of the results. The eight points of the visits (Figure 6) were chosen to reflect the diverse landscapes and varying severity of land degradation in the area.

3. Results

3.1. Baseline Scenario

3.1.1. Climate Quality Index Mapping

Potential Evapotranspiration ranged from 0.08 to 0.04, with lower values recorded west of the Mountains area towards the Sahara and higher values around the western and central part of the study area. Similarly, precipitation varied between 168 mm and 68 mm along the same gradient. These two variables decided the high sensitivity value of the CQI.
The Climate Quality Index showed no spatial variability. All values were equal to 2, above the threshold of 1.81 for low climatic quality. The lack of variation is attributed to the limited extent of the study area (approximately 2273 km2) and to the MEDALUS methodology being originally designed for assessing land degradation sensitivity on a regional or national level rather than a local level [33]. In central Tunisia, characterized by a milder climate, the CQI was observed with more variability using the same methodology [18].

3.1.2. Soil Quality Index Mapping

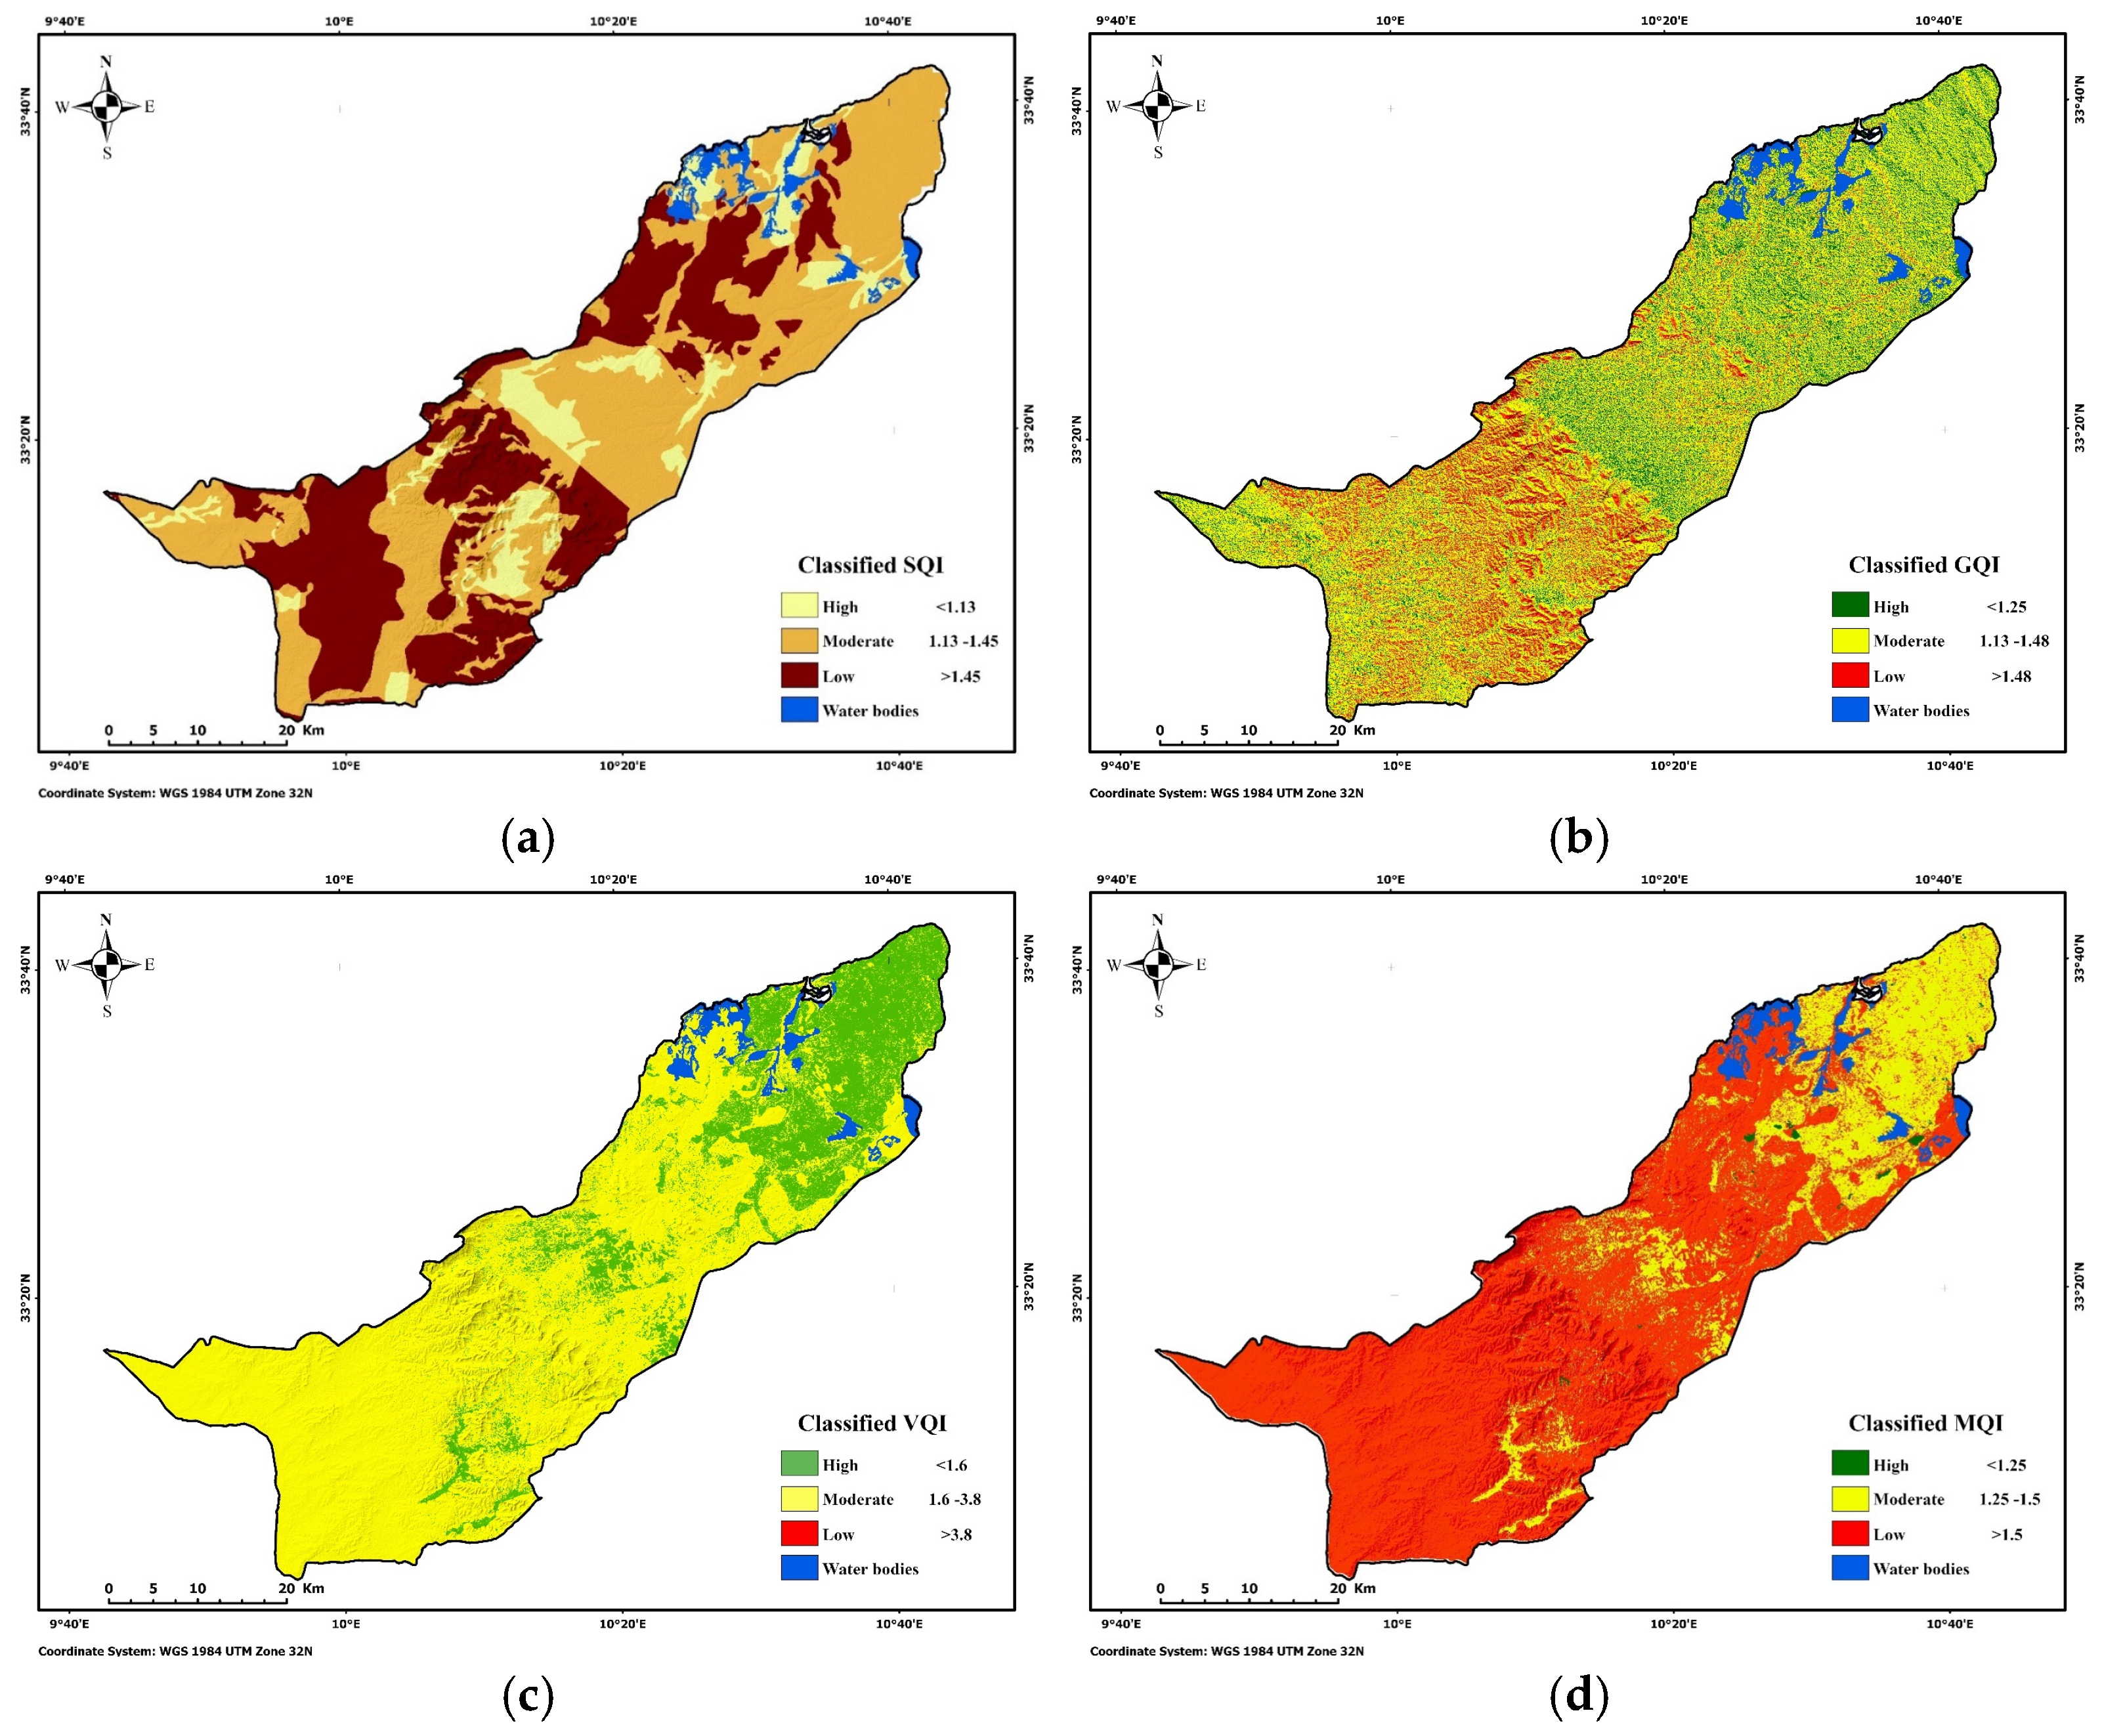
The Soil Quality Index indicated that 52% of the area was of moderate quality and 37% of low quality, mainly influenced by the parent material. Only 11% of the area was classified as high quality (Table 9).
Moderate to high SQI were mainly concentrated in the central and western parts, while low quality areas appeared in the mountainous zones, desert margins, and near mining sites in the northern part of the center (Figure 7a). No clear spatial pattern was observed for high-quality zones, which were instead scattered and influenced by soil depth and stoniness indexes. The spatial distribution of low- and moderate-quality indices closely mirrored the pattern of parent material. Parent material showed higher quality in the central part, where shallow soils around the mountains gave way to deeper profiles moving eastward. Stoniness followed a similar gradient while soil texture (loamy, silty clay loam, silty loam, loamy silty, and clay loam) was uniformly classified as high quality. Vegetation cover, as measured by NDVI, was classified as low across the study area, reflecting the sparse vegetation typical of the region. Even within olive orchards, the spacing between trees often reaches up to 10 meters, resulting in limited ground cover, while desertic rangelands are characterized by scarcer vegetation.

3.1.3. Geomorphological Index Mapping

The Geomorphological Quality Index classified most of the area as moderate (49%), followed by high (34%) and low (18%) quality (Table 10). The low-quality zones are primarily located around the Mountains area, where steep slopes contribute significantly to soil erosion and land degradation sensitivity, following the same pattern as the slope sub-indicator (Figure 7b).

3.1.4. Vegetation Quality Index Mapping

Vegetation quality across the study area was moderate overall, with 78% classified as moderate quality and 22% as high quality (Table 11). High-quality areas were primarily found in olive orchards, while the moderate-quality areas were mainly located in rangelands (Figure 7c).
Although vegetation cover was mostly low, the overall vegetation index was moderate or high due to the fire-risk and drought resistance sub-indices that received a better classification.

3.1.5. Management Quality Index Mapping

Land management quality was mostly low, covering 78% of the area, while 22% was classified as moderate (Figure 7d, Table 12).

3.1.6. Socio-Economic Quality Index Mapping

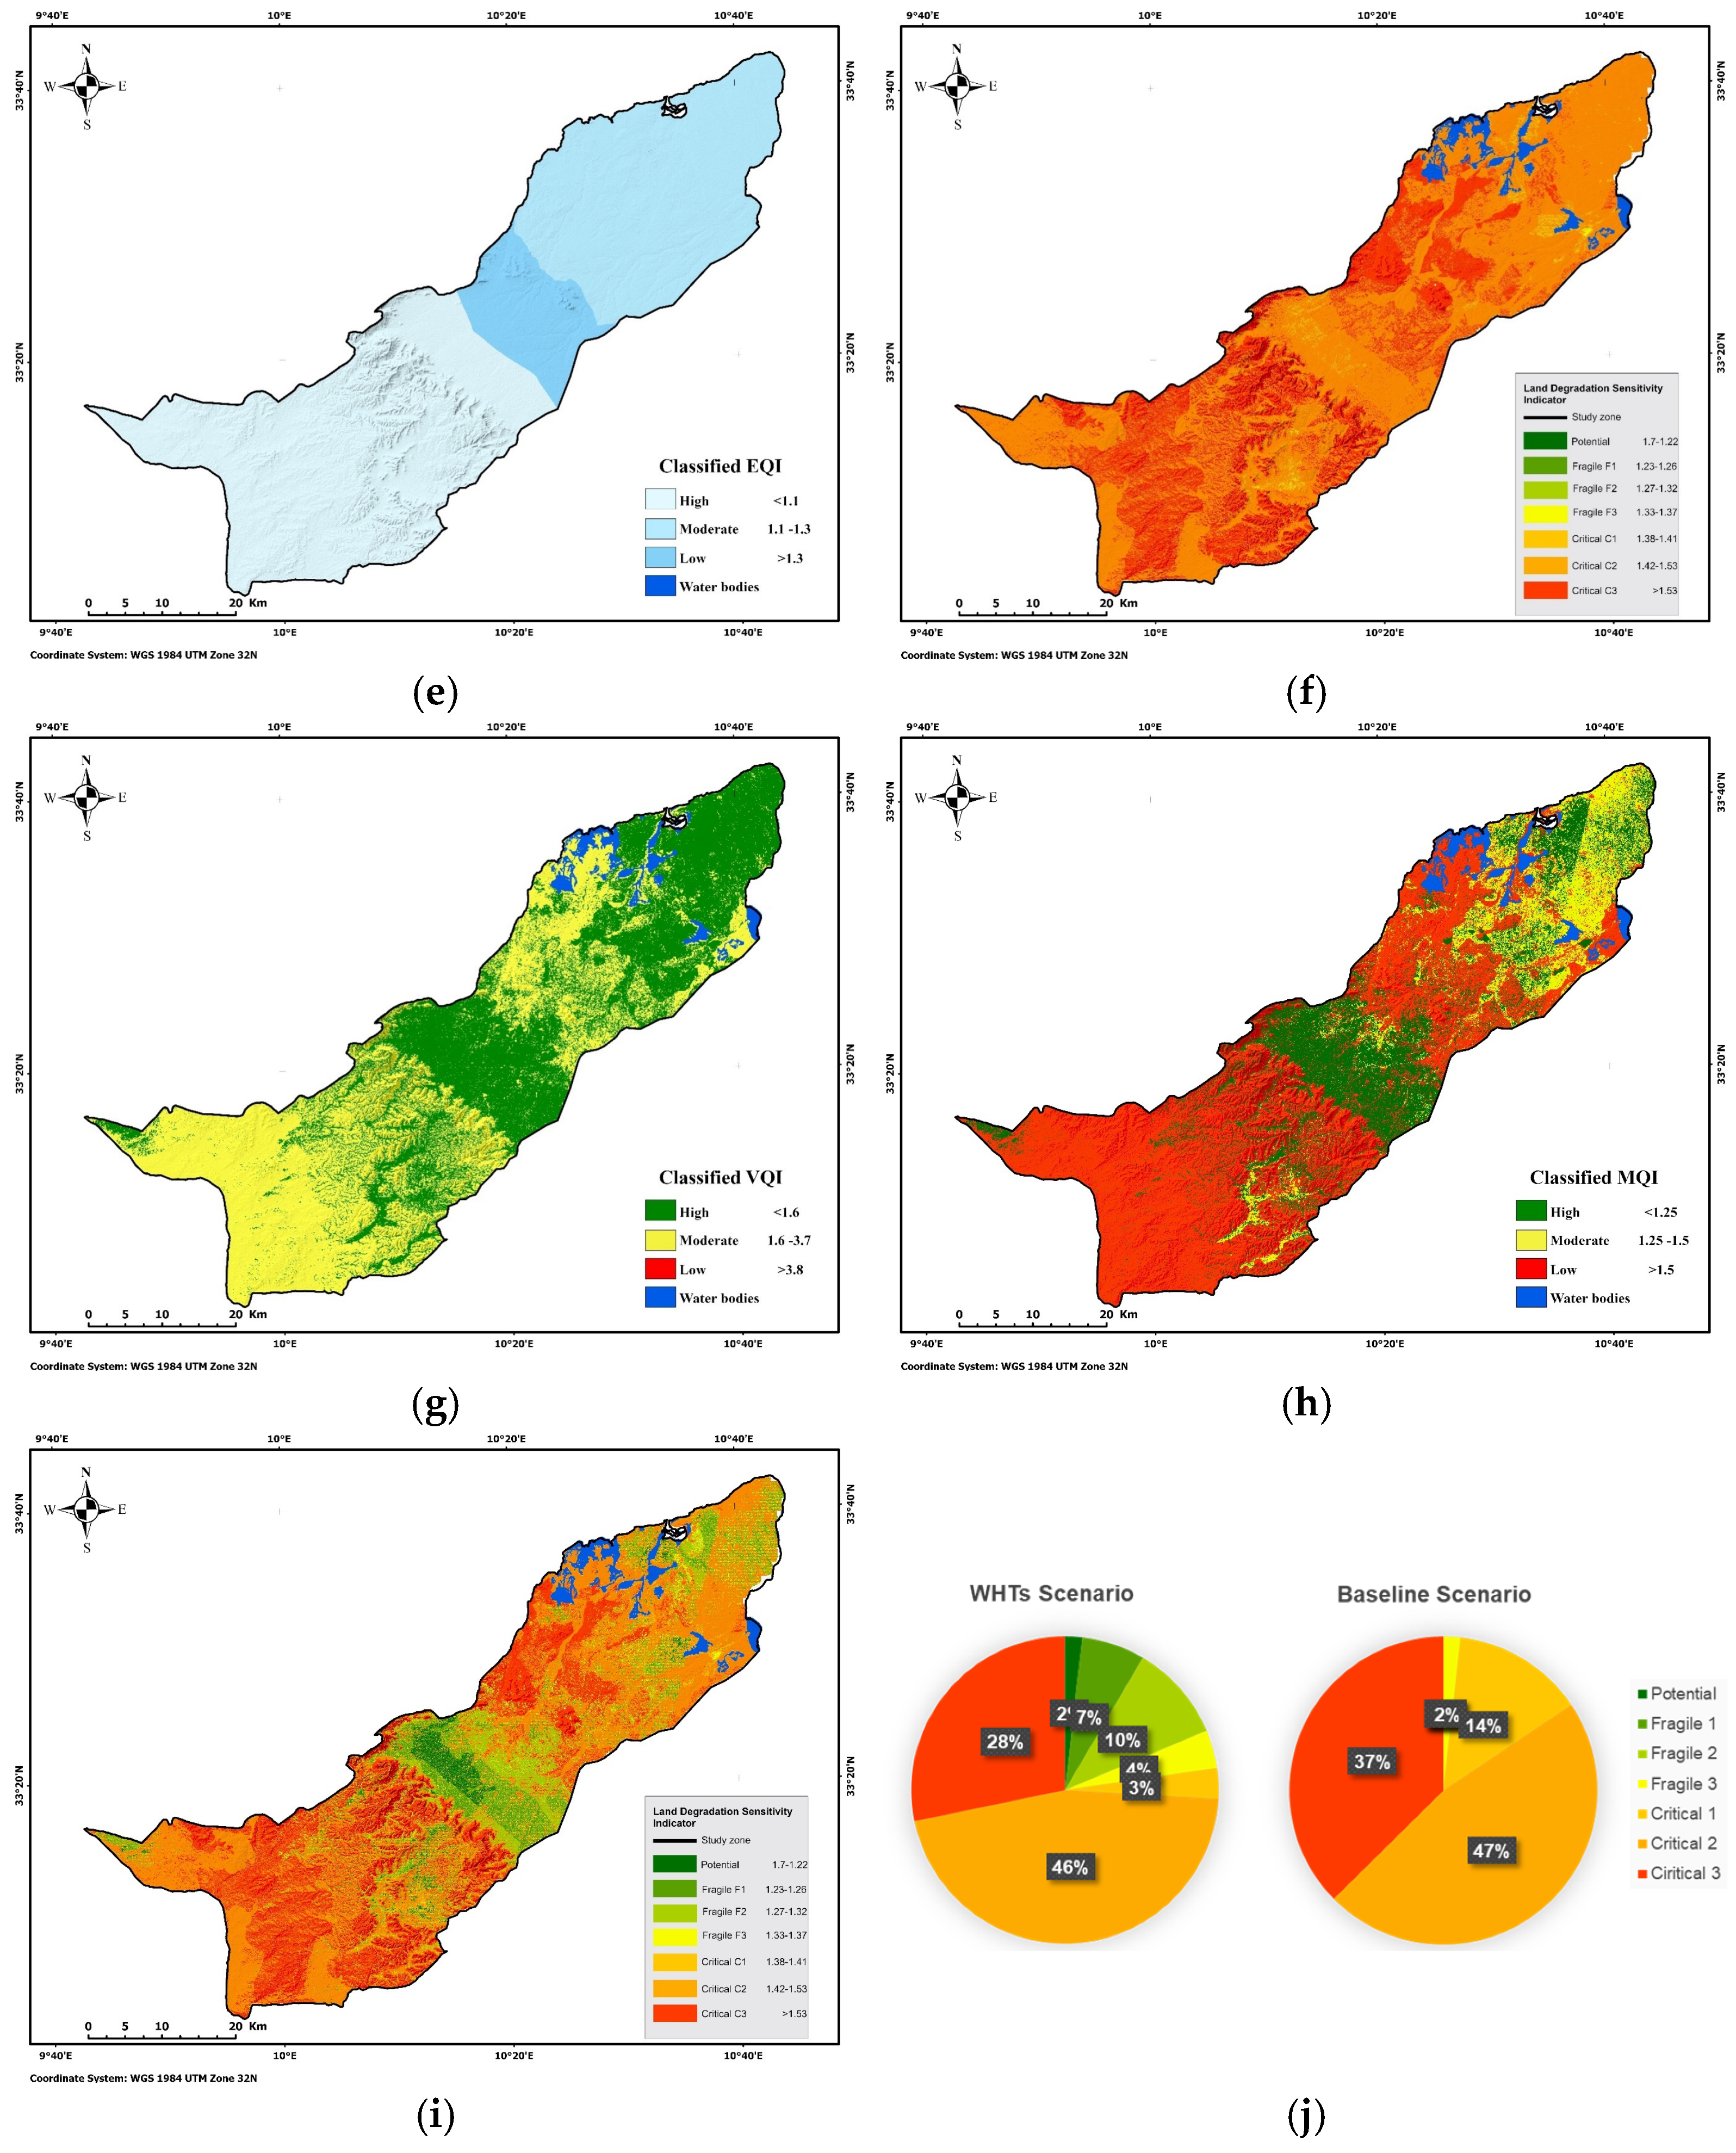
The Socio-Economic Quality index reflects the level of anthropogenic pressure on land. High-quality areas accounted for 55% of the region, followed by 34% being classified as moderate and 11% as low quality (Figure 7e, Table 13). Spatially, the variability in values is limited, as the index is calculated at the municipal level.

3.1.7. Land Degradation Sensitivity Index Mapping

The spatial analysis of the final LDSI product highlighted lands that are highly sensitive to degradation across the entire territory, both in terms of biophysical and anthropogenic conditions.
Based on the (LDSI) data for the study area, most of the region is highly sensitive to land degradation. Less than 1% of the area is classified as fragile, while the remaining 99% is categorized within the critical classes (Figure 7f). Of this, approximately 70%, located in the foothills of the mountains area and eastern part of the study area, is classified under Critical 2, indicating moderate sensitivity to degradation within the critical class. A further 23% is categorized as Critical 3 (Table 14), representing the highest levels of sensitivity to land degradation, located within the Mountains area, desert zones, mining sites, and bare lands. The least critical class C1 zone makes up only 6% of the area, located completely in areas with olive orchards, indicating a lower degradation sensitivity but still subject to LDS (Figure 7f).

3.2. Land Degradation Sensitivity Under WHTs Scenario

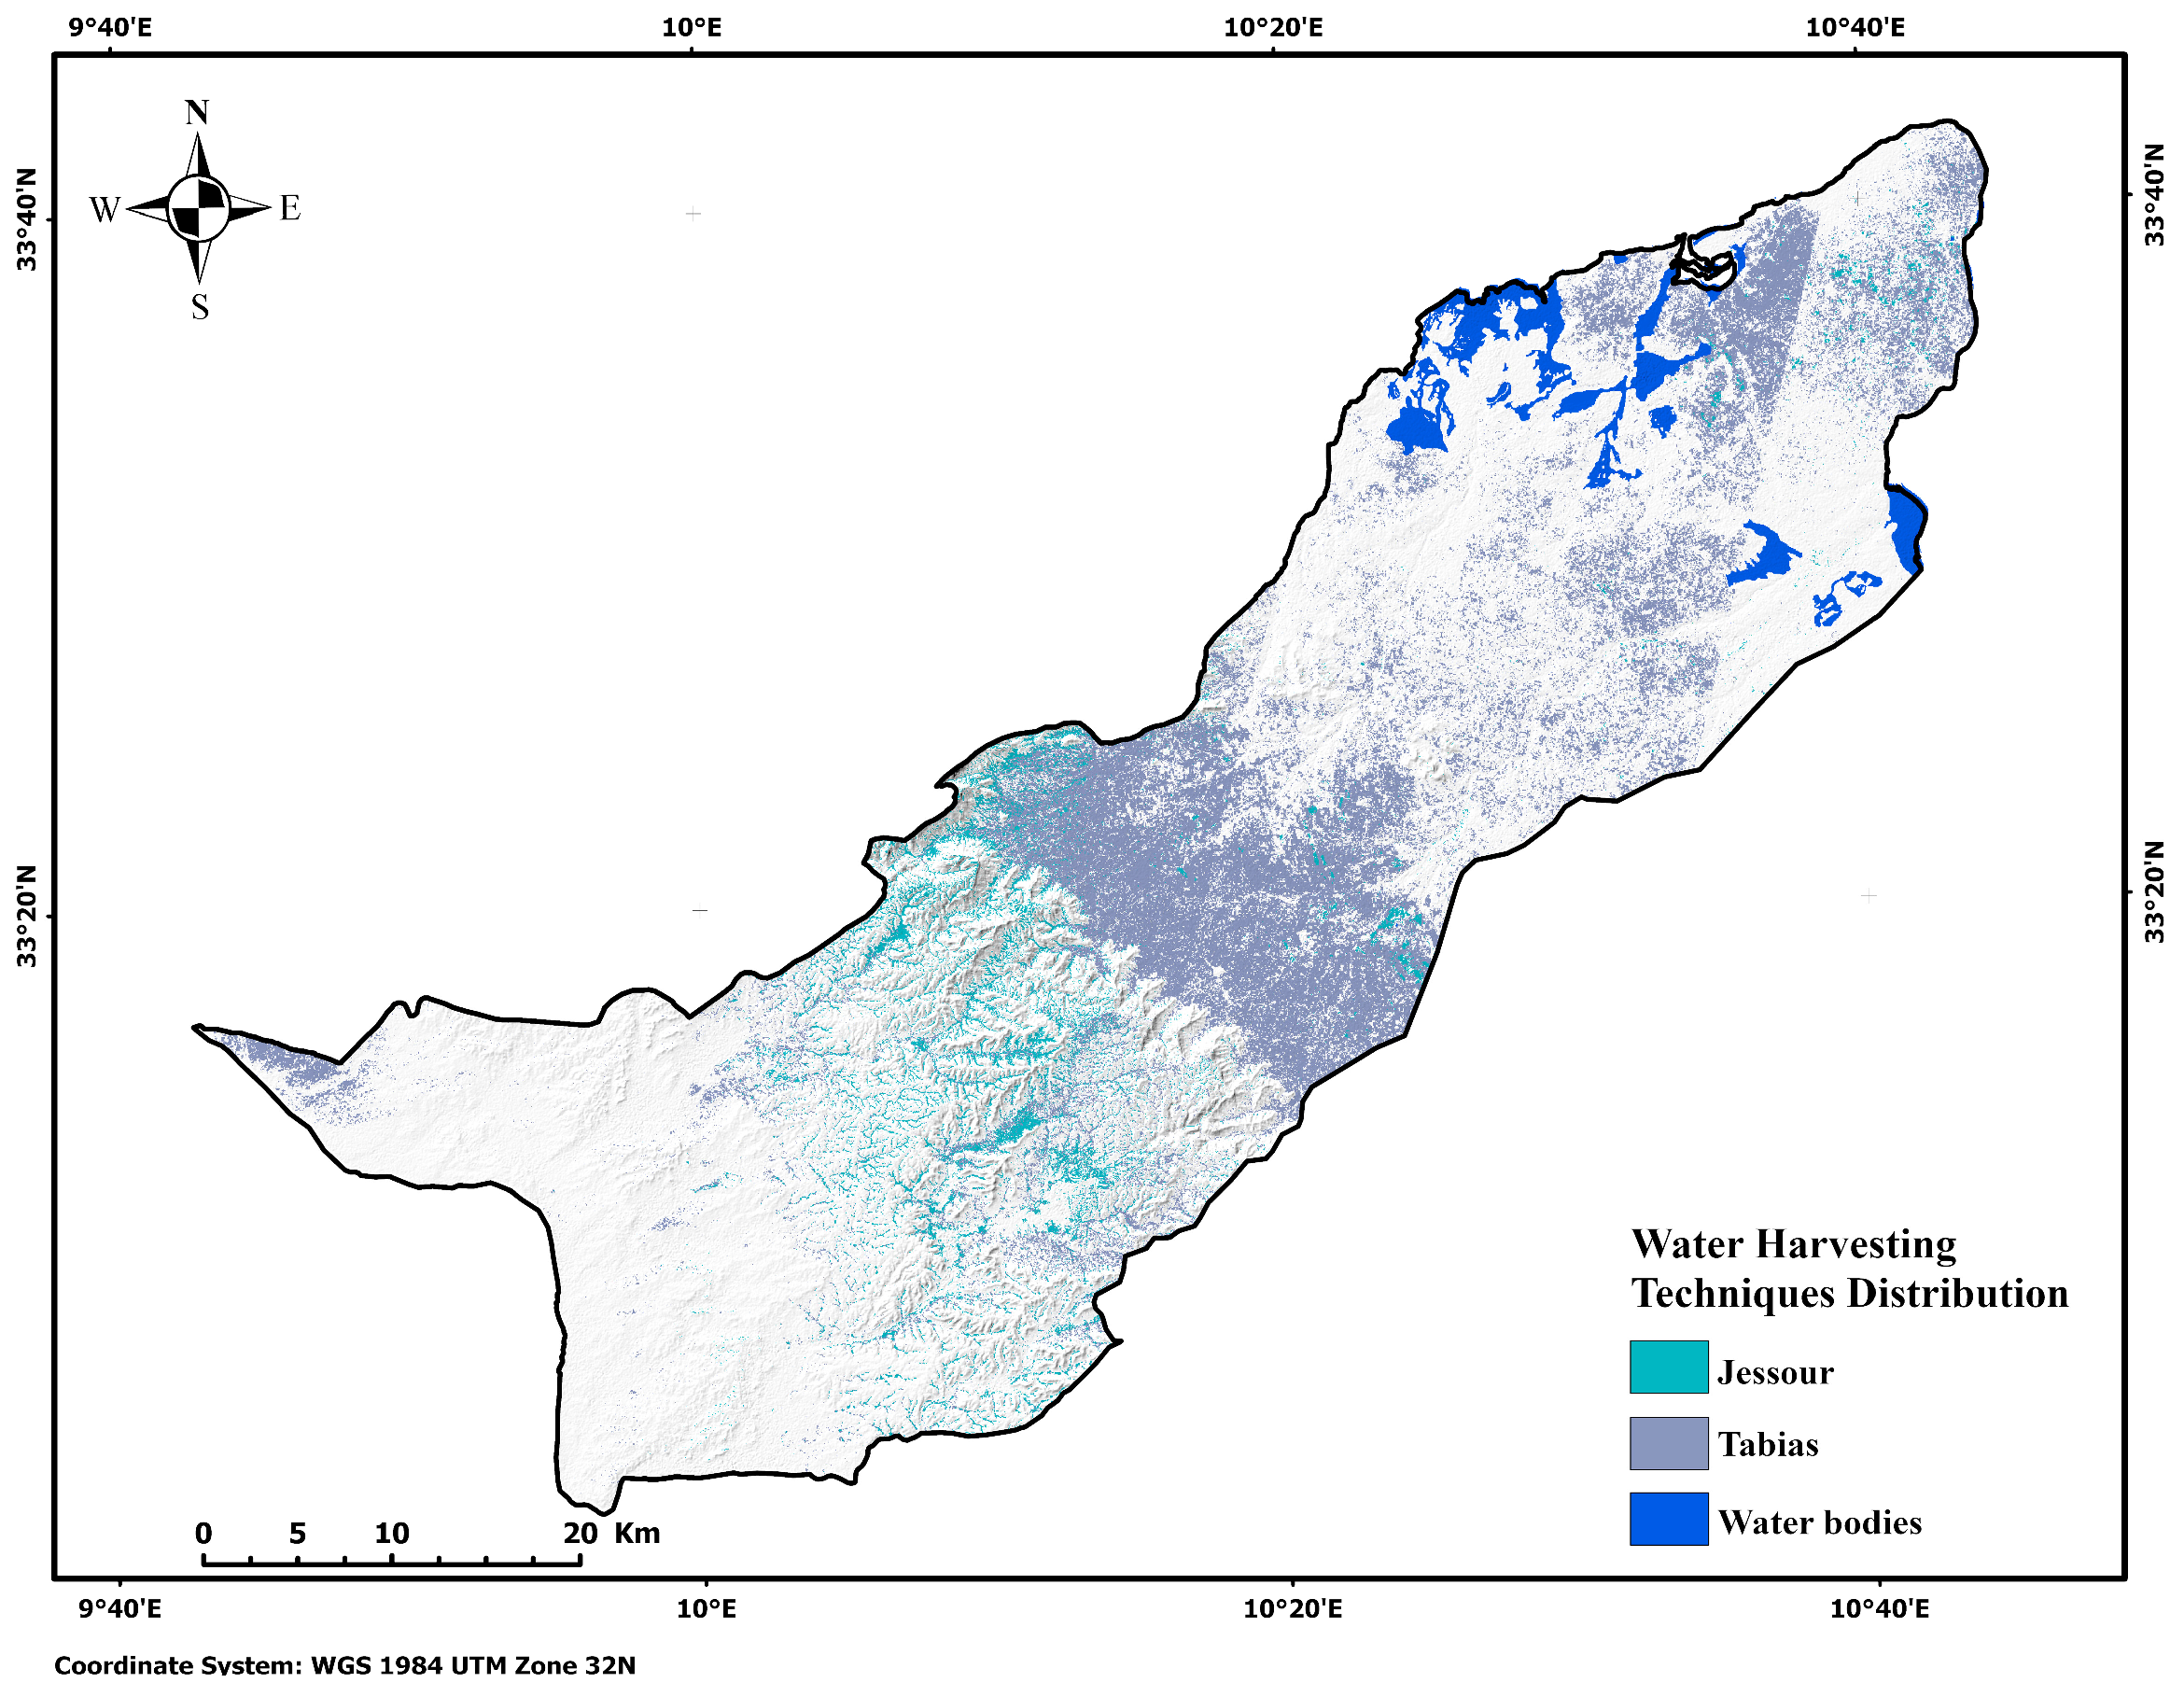
The WHTs distribution results serve as a tool to identify areas where they are located, rather than as a definitive outcome. This will allow us to eventually study their impact on land degradation. Jessour systems are typically located in steep, mountainous regions. They are concentrated within the Matmata mountain range, particularly in the valleys between mountain ridges where water runoff is likely to be significant. Tabias systems are more commonly found in the foothills and less steep areas. The highest concentration of Tabias systems is located in the foothills of the Jessour systems and decreasing to the central and western part of the study case (Figure 8).
As described in the methodology, the map was generated using a semi-automatic classification, which limits the precision of locating these systems and may show some inconsistencies. However, this tool provides an approximate indication of areas where Jessour or Tabias systems, or areas with similar slopes, vegetation, and water characteristics, are likely to occur.

3.2.1. Improvement of Vegetation Quality Under Water Harvesting Techniques

In the comparison between the baseline and WHTs scenarios, vegetation quality showed notable improvements. In the baseline scenario, 21.76% of the area exhibited high vegetation quality and 78.24% classified as moderate. Under the WHTS scenario, the high vegetation quality area increased to 37.65% while the moderate-quality area decreased to 62.35% (Table 15).
In the Mountains area valleys, where Jessour are located, vegetation quality improved significantly. Similarly, in the foothills where Tabias is present, VQI increased (Figure 7g). The eastern part, already characterized by high vegetation quality in the baseline scenario (Figure 7j), maintained these conditions with a less significant increase in the WHTs scenario as the quality was already high (Figure 7g).

3.2.2. Impact of Water Harvesting Techniques on Management Quality Index

In the comparison between the baseline and WHTS scenarios for the MQI, the spatial distribution of the classification changed. On first look (Table 16), the high-quality class was non-existent in the baseline scenario, while in the WHTS scenario this class showed a percentage of 23.75% (Table 16).
In the baseline scenario, 77.72% of the area was classified as low management quality, with 21.87% categorized as moderate. The WHTS scenario, however, revealed an improvement, with 23.75% of the area achieving high management quality, 14.14% classified as moderate, and 62.11% remaining in the low management quality class. Similarly to the VQI, the increase was mostly in the foothills of the Mountains area as Tabias are concentrated there and gradually decreased going westward as there are less Tabias systems. On the other hand, in the Mountains area the Jessour improved the MQI, but it was less relevant compared to VQI improvements. This is due to the high vegetation already existing between mountain valleys (Figure 7h).

3.2.3. LDSI Under WHTs Scenario

To analyze the impact of water harvesting techniques on land degradation sensitivity, the LDSI was recalculated using the new values of VQI and MQI while the rest of the indicators were kept the same as the baseline scenario. The results (Figure 7i) showed a significant variation in the percentage of areas classified as fragile and critical with less variation in potential. Initially, in the baseline scenario, 99% of the area was classified as critical while in the WHTs scenarios the LDSI decreased, indicating a higher quality. Furthermore, two less sensitive classes emerged (Fragile and potential).
The critical class decreased from a percentage of 99% to 77.3%. Within the critical class, C3 decreased by 9.15%, C2 decreased by 2% while C1 decreased by 10%. Within the fragile class, F3 increased by 2%. F2 and F1, initially non-existent, had values of 10.21% and 6.67%, respectively (Figure 7j). Additionally, no areas were potentially threatened by land degradation in the baseline scenario. However, this changed in the WHTs scenario demonstrated only 1% of this class.

3.3. Local Stakeholders’ Perception of Land Degradation

The socio-economic survey revealed that farmers perceived reduced water availability (32%), soil erosion (25%), and vegetation loss (25%) as the primary drivers of land degradation, while salinization and sand encroachment was cited by 14% and 4% of respondents, respectively. The indexes that we used for assessing land degradation received varying perception from the respondents and were used to identify the weights used for the stakeholder’s informed scenario. Only one area was cited as the most degraded part of the study case: “Dhaher”, in 100% of the surveys, which is located west of the Mountains area.

4. Discussion

The moderate to high overall Vegetation Index, despite low vegetation cover, is largely explained by the sparse vegetation in rangelands and the significant spacing between vegetation in olive orchards, which reduces fire risk. Additionally, crops cultivated, such as olives, are drought-resistant and well-adapted to the local climate, affecting positively the former index.
The high level of land management is primarily linked to two sub-indexes: agricultural intensity and policy enforcement. Olive-based agricultural systems received medium scores for both indexes, reflecting average management practices and policy application. In contrast, the already degraded condition of rangelands, combined with limited policy enforcement, contributed to higher degradation levels in those areas.
Population density and the old age index were the most influential sub-indexes, contributing to moderate and low scores in the central and western parts of the region for the socio-economic index. While these values remained high around the Mountains area, the population growth index was generally low across the region and had a minimal impact on increasing the overall EQI.
The dominance of low climatic quality across the study area is consistent with previous MEDALUS-based assessments conducted in semi-arid and arid environments of Tunisia and the southern Mediterranean basin [23]. In such contexts, low precipitation combined with high Potential Evapotranspiration has been widely identified as the primary driver of climate-related land degradation sensitivity [23,31]. However, unlike studies conducted at broader spatial scales in central Tunisia, where the Climate Quality Index (CQI) exhibited marked spatial variability [23,24], the CQI in the present study remained constant across the entire area. This lack of variability can be attributed both to the relatively limited spatial extent of the study area and to the scale at which the MEDALUS framework was originally conceived, namely for regional to national-scale assessments rather than local applications [21,22].
Soil quality emerged as a major determinant of land degradation sensitivity, with more than 85% of the study area classified as having moderate to low soil quality. This finding is strongly consistent with previous studies in Tunisia, which highlighted the vulnerability of soils developed on fragile parent materials, shallow profiles, and calcareous formations under semi-arid climatic conditions [23,31]. Several studies have emphasized that parent material and soil depth often exert a stronger control on soil degradation sensitivity than texture alone, particularly in Mediterranean drylands [24,31]. The spatial coincidence between low soil quality, mountainous zones, desert margins, and mining sites observed in this study further supports earlier findings that geomorphology and anthropogenic disturbances jointly accelerate soil degradation processes [8,23].
In line with earlier studies, olive-based agroecosystems showed higher vegetation quality compared to rangelands, reflecting the adaptive capacity of perennial crops to arid conditions and their stabilizing role in limiting erosion and land degradation [24,32]. Conversely, rangelands consistently appeared as more vulnerable systems due to sparse vegetation cover and continuous grazing pressure, a pattern widely documented in Tunisian steppe environments [8,23].
The Socio-Economic Quality Index indicated relatively high values over much of the study area, suggesting moderate overall anthropogenic pressure. However, as also reported in earlier MEDALUS-based studies, the calculation of socio-economic indicators at the municipal level tends to reduce spatial variability and may mask localized degradation hotspots which can explain why previously mentioned studies did not use a socio-economic indicator in their model.
Overall, the strong agreement between the present results and previous MEDALUS-based studies supports the robustness of the framework under Tunisian semi-arid conditions [21,23,31]. At the same time, the limited variability observed for certain indices highlights the need for methodological adaptations and the integration of management-oriented indicators, particularly when the objective is to assess land degradation sensitivity at local scales and under different land management scenarios [22,24].
The derived Land Degradation Sensitivity Index (LDSI) aligned with field observations and survey data, particularly in identifying severely degraded zones west of the Mountains area, where sand encroachment and degraded rangelands dominate. However, discrepancies arose in the northern area of the study case, where visible land degradation was not emphasized in survey responses. This divergence likely stems from the relatively localized impact of bare lands and extraction sites compared to the widespread degradation in western rangelands, which directly threatens livelihoods and thus may affect community perceptions. Migration emerged as both a driver and consequence of degradation as sustained rural outmigration since the 1990s has reduced labor and accelerated land abandonment in these areas [34]. This result is comparable to, and in some cases exceeds, findings reported in other Tunisian case studies, where fragile and critical classes together typically accounted for more than 80–90% of the total area [23,35]. The concentration of the highest sensitivity class (C3) in mountainous areas, desert zones, mining sites, and bare lands confirms the cumulative effect of adverse climatic conditions, fragile soils, steep slopes, and inadequate land management, as previously highlighted in MEDALUS applications across North Africa [8,21,22]. In contrast, olive orchards were predominantly associated with the least critical class (C1), reinforcing earlier evidence that perennial cropping systems can mitigate land degradation sensitivity when compared to extensively grazed rangelands.
Spatially, the increase followed the same pattern of WHTs distribution (Figure 7i). The areas classified as potential, F1, F2 colored with different shades of green, and F3 colored with yellow were located in the area containing Jessour, Tabias, and olive orchards. These areas are located within the valleys and foothills of the Mountains area. These areas, in the baseline scenario, were mostly in the Critical class. The Critical 3 class mostly saw less changes; the decrease was only 9.15%. The areas that stayed severely critical (C3) were mostly located around the Mountains area, desert, mining sites, and bare lands.
The most pronounced improvements were observed in areas containing maintained olive groves, associated with Tabias and Jessour where the shift from high to moderate sensitivity accounted for a substantial portion of the change. In contrast, areas dominated sharing similar geographical features with less to no vegetation did not show signs of improvement, reflecting the influence of maintenance and local functionality on WHT performance. Crete shows a similar trend: applying sustainable land management measures reduced highly sensitive areas from 28% to 23%, with corresponding increases in moderate-sensitivity areas [22]. While the magnitude of improvement in our study is slightly higher, particularly in olive groves, the pattern aligns with expectations under sustainable management scenarios. Differences in other WHT types (Tabias or Jessour) likely stem from local biophysical conditions, structure maintenance, and socio-economic constraints.
These improvements, however, assume idealized conditions of fully functional and maintained structures. In reality, non-maintained Jessour or abandoned Tabias are common and may underperform, suggesting that the modeled results represent optimistic scenarios. Furthermore, semi-automatic WHTs mapping using NDVI, NDWI, and DEM risked overestimating their spatial distribution, as natural features with similar spectral signatures can be misclassified. Therefore, locals’ input is irreplaceable to better map these management practices. Nevertheless, stakeholder perceptions illuminated the socio-economic barriers to WHTs adoption. While farmers were aware and recognized their benefits for water retention and erosion control, financial constraints and labor-intensive maintenance hindered widespread implementation. This paradox highlights the need for targeted subsidies and community-led stewardship programs to sustain WHTs efficacy. In the literature, using MEADLUS methodology with different scenarios is common, for instance [22], integrated future climate change scenarios and soil management scenarios, indicating that implementing sustainable land management practices could slightly mitigate the land degradation process for critical areas. Spatially, the distribution mostly stayed the same expect for highly critical areas. The concentration of C3 increased in the area west of the Mountains area range. This area was initially prioritized, as stakeholders consistently indicated that it was the most severely degraded within the study site.
At the community level, land degradation was associated with significant socio-economic impacts, including rural-to-urban migration, loss of biodiversity and reduced agricultural income, and poverty levels.
Migration emerged as the dominant socio-economic impact and also as the dominant driver (53%), followed by population growth and low education levels (20%) each. Only 7% of the respondents reported the old age ratio as a socio-economic cause.
Although various water harvesting techniques (WHTs) such as Jessour, Tabias, and cisterns were widely recognized, only 60% of respondents considered farmers to be well-informed about these techniques. The main barriers hindering WHTS implementation were primarily the high installation costs, labor requirements, and limited government support, while limited revenue generation and lack of knowledge were also noted. Nonetheless, WHTS were largely perceived as beneficial, with respondents highlighting improved water retention, enhanced crop productivity, and reduced erosion as the most significant opportunities.
A few limitations arose in this study. Spatial resolution varied among the input layers (30 m to 500 m), and resampling was applied to harmonize them, which may introduce numerical bias. Soil data were obtained from publicly available global maps (ISRIC, 2020), which may not fully capture local variability. Climate data, including precipitation and aridity index, have relatively coarse resolution (~50 km), which could affect the Climate Quality Index at fine scales. Vegetation data were derived from Sentinel-2 Level-2A composites; cloud-contaminated scenes were excluded, and NDVI thresholds followed the prior literature, which may introduce uncertainty in classification. However, the impact is minimal as both the vegetation and climatic responses consistently remained within the highest sensitivity levels. Validation relied on field observation points only, as no historical maps or previous studies for the same study area were available for direct comparison. To improve the spatial accuracy of these systems, further work is required to refine the WHTs in the region, which will support future case studies and analysis.

5. Conclusions and Recommendations

This study assessed land degradation sensitivity in the Jeffara region of Southern Tunisia and evaluated the role of water harvesting techniques (WHTs) as mitigation strategies. By integrating the MEDALUS framework with GIS-based spatial analysis and stakeholder-driven insights, this research revealed that over 99% of the study area falls under critical sensitivity classes (C1–C3), driven by extreme aridity, sparse vegetation, soil erosion, and anthropogenic pressures such as rural migration. The Mountains area, desert margins, and mining zones exhibited the highest degradation severity (C3), while olive orchards demonstrated marginally lower sensitivity due to drought-resistant vegetation and less fire risk.
The simulation of WHTs implementation, specifically Jessour and Tabias, highlighted their potential to reduce critical degradation zones, primarily in valleys and foothills. These techniques improved vegetation quality and management. The simulation of WHTs implementation highlighted their potential to reduce highly sensitive zones, primarily in valleys and foothills. Quantitatively, the highly sensitive area decreased from 831.41 km2 (21.76%) in the baseline scenario to 481.52 km2 (37.65%) after WHTs application, while moderately sensitive areas increased from 1376.73 km2 (78.24%) to 1731.26 km2 (62.35%). Improvements were most pronounced in areas containing maintained olive groves, where Tabias and Jessour areas showed significant effects.
However, stakeholder surveys underscored systemic barriers to WHTs adoption, including high installation costs and labor-intensive maintenance, which hinder their scalability despite recognized benefits in erosion control and yield stability.
Further, scaling the MEDALUS with decision-making-driven methodologies to other arid regions could standardize degradation sensitivity assessments while accommodating local socio-economic contexts. Limitations of this study include differences in spatial accuracy among datasets and reliance on older soil maps. Therefore, future research should refine WHTs mapping through high-resolution datasets and machine learning to reduce classification inaccuracies. Longitudinal studies on migration’s role in land abandonment and degradation feedback loops are also critical to inform holistic policy frameworks.
Ultimately, mitigating land degradation sensitivity in Jeffara and similar regions demands synergies between traditional practices, scientific innovation, and participatory governance. By aligning technical solutions with community needs and institutional capacities, Tunisia can advance sustainable land management while safeguarding livelihoods in its vulnerable arid ecosystems.


Author Contributions

Conceptualization, M.B.Z.; Methodology, M.E.B. and A.S.; Software, M.E.B.; Investigation, M.E.B.; Resources, M.E.B., M.B.Z. and A.S.; Writing—Original Draft, M.B.Z.; Writing—Review and Editing, M.E.B., A.S., R.H. and M.O.; Visualization, R.H. and R.K.; Supervision, M.B.Z., A.S., M.O. and F.A. All authors have read and agreed to the published version of the manuscript.

Funding

This publication was jointly funded by the European Union’s Horizon Europe Research and Innovation Programme, under the Soil Mission’s MONALISA project, Grant Agreement No. 101157867 and the Arid Regions Institute of Medenine IRA, Tunisia (Laboratory of Eremology and Combating Desertification: LR16IRA01).

Data Availability Statement

The datasets generated during and/or analyzed during the current study are available from the authors on reasonable request.

Acknowledgments

This work was conducted as part of the research program of the Eremelogy and Combating Desertification Laboratory (LR16IRA01) at the Institute of Arid Regions (IRA) funded mainly by the Ministry of Higher Education and Scientific Research in Tunisia. Special thanks are due to Hedi Kerdi and CRDA colleagues for their technical and field assistance. We gratefully acknowledge all the colleagues who participated in managing the field trips and laboratory analysis. The comments of the anonymous three reviewers significantly improved the paper.

Conflicts of Interest

The authors declare no conflicts of interest.

Abbreviations

The following abbreviations are used in this manuscript:
AIAridity Index
BMPBest Management Practices
CQIClimate Quality Index
CRDACommissariat Régional au Développement Agricole
DEMDigital Elevation Model
EQISocio-Economic Quality Index
ESAEuropean Soil Atlas
GQIGeomorphological Quality Index
GISGeographic Information System
LDLand Degradation
LDSILand Degradation Sensitivity Index
LDNLand Degradation Neutrality
MENAMiddle East and North Africa
MQIManagement Quality Index
NDVINormalized Difference Vegetation Index
NDWINormalized Difference Water Index
NAPNational Action Plan
ODSOffice de Développement du Sud
PETPotential Evapotranspiration
SDGSustainable Development Goals
SQISoil Quality Index
SVMSupport Vector Machine
UNCCDUnited Nations Convention to Combat Desertification
UNEPUnited Nations Environment Programme
VQIVegetation Quality Index
WHTWater Harvesting Technique
WOCATWorld Overview of Conservation Approaches and Technologies

References

  1. Prăvălie, R. Exploring the multiple land degradation pathways across the planet. Earth-Sci. Rev. 2021, 220, 103689. [Google Scholar] [CrossRef] [Scilit]
  2. Mahata, S.; Sharma, V.N. Department of Geography, Institute of Science, Banaras Hindu University, Varanasi The global problem of land degradation: A review. Natl. Geogr. J. India 2021, 67, 216–231. [Google Scholar] [CrossRef] [Scilit]
  3. Intergovernmental Panel On Climate Change. Climate Change and Land: IPCC Special Report on Climate Change, Desertification, Land Degradation, Sustainable Land Management, Food Security, and Greenhouse Gas Fluxes in Terrestrial Ecosystems, 1st ed.; Cambridge University Press: Cambridge, UK, 2022. [Google Scholar] [CrossRef] [Scilit]
  4. Sutton, P.C.; Anderson, S.J.; Costanza, R.; Kubiszewski, I. The ecological economics of land degradation: Impacts on ecosystem service values. Ecol. Econ. 2016, 129, 182–192. [Google Scholar] [CrossRef] [Scilit]
  5. Mohamed, E.; Belal, A.-A.; Ali, R.R.; Saleh, A.; Hendawy, E.A. Land Degradation. In The Soils of Egypt; El-Ramady, H., Alshaal, T., Bakr, N., Elbana, T., Mohamed, E., Belal, A.-A., Eds.; World Soils Book Series; Springer International Publishing: Cham, Switzerland, 2019; pp. 159–174. [Google Scholar] [CrossRef] [Scilit]
  6. Akgöz, R.; Deviren Saygin, S.; Erpul, G.; Tel, S. Monitoring seasonal and phenological variability of cover management factor for wheat cropping systems under semi-arid climate conditions. Environ. Monit. Assess. 2022, 194, 395. [Google Scholar] [CrossRef] [Scilit] [PubMed]
  7. Prăvălie, R.; Bandoc, G.; Patriche, C.; Sternberg, T. Recent changes in global drylands: Evidences from two major aridity databases. Catena 2019, 178, 209–231. [Google Scholar] [CrossRef] [Scilit]
  8. Kosmas, C.; Kairis, O.; Karavitis, C.; Ritsema, C.; Salvati, L.; Acikalin, S.; Alcalá, M.; Alfama, P.; Atlhopheng, J.; Barrera, J.; et al. Evaluation and Selection of Indicators for Land Degradation and Desertification Monitoring: Methodological Approach. Environ. Manag. 2014, 54, 951–970. [Google Scholar] [CrossRef] [Scilit] [PubMed]
  9. Zdruli, P. Land resources of the mediterranean: Status, pressures, trends and impacts on future regional development. Land Degrad. Dev. 2014, 25, 373–384. [Google Scholar] [CrossRef] [Scilit]
  10. UNEP. Embedding the Environment in Sustainable Development Goals; United Nations Environment Programme: Nairobi, Kenya, 2013; Available online: https://wedocs.unep.org/rest/api/core/bitstreams/4d4abcf2-5651-4b84-9bee-9459866aa53c/content (accessed on 29 January 2026).
  11. Ziadat, F.M.; Zdruli, P.; Christiansen, S.; Caon, L.; Monem, M.A.; Fetsi, T. An Overview of Land Degradation and Sustainable Land Management in the Near East and North Africa. Sustain. Agric. Res. 2021, 11, 11. [Google Scholar] [CrossRef] [Scilit]
  12. TME. Rapport National sur l’État de l’Environnement en Tunisie; Ministère de l’Environnement: Tunisia, Canada, 2022. Available online: https://www.environnement.gov.tn/fileadmin/Bibliotheque/Etats_environnement_national_regional/rnee_2022_ar.pdf (accessed on 29 January 2026).
  13. SCID. Programme D’action National de Lutte Contre la Désertification 2030-2018. Ministère de l’Environnement. Available online: https://www.environnement.gov.tn/fileadmin/Bibliotheque/SNTE/Rapport-Principal-PAN-LCD.pdf (accessed on 29 January 2026).
  14. Mtibaa, S.; Hotta, N.; Irie, M. Analysis of the efficacy and cost-effectiveness of best management practices for controlling sediment yield: A case study of the Joumine watershed, Tunisia. Sci. Total Environ. 2018, 616–617, 1–16. [Google Scholar] [CrossRef] [Scilit]
  15. Boers, T.M.; Ben-Asher, J. A review of rainwater harvesting. Agric. Water Manag. 1982, 5, 145–158. [Google Scholar] [CrossRef] [Scilit]
  16. Stroosnijder, L. Rainfall and land degradation. Catena 2009, 78, 305–317. [Google Scholar] [CrossRef]
  17. Mekdaschi Studer, R.; Liniger, H. Water Harvesting: Guidelines to Good Practice; Centre for Development and Environment (CDE), University of Bern: Bern, Switzerland, 2013. [Google Scholar]
  18. Ouessar, M.; Bruggeman, A.; Abdelli, F.; Mohtar, R.H.; Gabriels, D.; Cornelis, W.M. Modelling water-harvesting systems in arid areas. Hydrol. Earth Syst. Sci. 2013, 17, 2541–2556. [Google Scholar] [CrossRef] [Scilit]
  19. Calianno, M.; Fallot, J.-M.; Ben Fraj, T.; Ben Ouezdou, H.; Reynard, E.; Milano, M.; Abbassi, M.; Ghram Messedi, A.; Adatte, T. Benefits of Water-Harvesting Systems (Jessour) on Soil Water Retention in Southeast Tunisia. Water 2020, 12, 295. [Google Scholar] [CrossRef] [Scilit]
  20. WOCAT. Cistern (Tunisie). 2011. Available online: https://qcat.wocat.net/fr/wocat/technologies/view/technologies_1413/ (accessed on 29 January 2026).
  21. Kosmas, C.; Kirkby, M.; Geeson, N. Methodology for Mapping Environmentally Sensitive Areas (ESAs) to Desertification. In The MEDALUS Project Mediterranean Desertification and Land Use. Manual on Key Indicators of Desertification and Mapping ESAs EUR 18882; European Commission: Brussels, Belgium, 1999. [Google Scholar]
  22. Morianou, G.; Kourgialas, N.N.; Pisinaras, V.; Psarras, G.; Arambatzis, G. Assessing desertification sensitivity map under climate change and agricultural practices scenarios: The island of Crete case study. Water Supply 2021, 21, 2916–2934. [Google Scholar] [CrossRef] [Scilit]
  23. Bedoui, C. Study of desertification sensitivity in Talh region (Central Tunisia) using remote sensing, G.I.S. and the M.E.D.A.L.U.S. approach. Geoenviron. Disasters 2020, 7, 16. [Google Scholar] [CrossRef] [Scilit]
  24. Besser, H.; Hamed, Y. Environmental impacts of land management on the sustainability of natural resources in Oriental Erg Tunisia, North Africa. Environ. Dev. Sustain. 2021, 23, 11677–11705. [Google Scholar] [CrossRef] [Scilit]
  25. Henchiri, M.; Zhang, S.; Essifi, B.; Ouessar, M.; Bai, Y.; Jiahua, Z. Land cover change of arid environment in Tunisia based on analysis of Landsat images. Afr. J. Ecol. 2020, 58, 746–756. [Google Scholar] [CrossRef] [Scilit]
  26. Prăvălie, R.; Patriche, C.; Săvulescu, I.; Sîrodoev, I.; Bandoc, G.; Sfîcă, L. Spatial assessment of land sensitivity to degradation across Romania. A quantitative approach based on the modified MEDALUS methodology. Catena 2020, 187, 104407. [Google Scholar] [CrossRef] [Scilit]
  27. Kosmas, C.; Kirkby, M.; Geeson, N. Manual on Key Indicators of Desertification and Mapping Environmentally Sensitive Areas to Desertification; European Commission: Brussels, Belgium, 1999. [Google Scholar]
  28. Nour-Eldin, H.; Shalaby, A.; Mohamed, R.M.; Youssef, E.; Rostom, N.G.; Khedr, H.S. Assessment of Desertification Sensitivity Using the MEDALUS Model and Sentinel-2 Data in Northwestern El Minya, Egypt. Egypt. J. Remote Sens. Space Sci. 2023, 26, 758–767. [Google Scholar] [CrossRef] [Scilit]
  29. Symeonakis, E.; Karathanasis, N.; Koukoulas, S.; Panagopoulos, G. Monitoring Sensitivity to Land Degradation and Desertification with the Environmentally Sensitive Area Index: The Case of Lesvos Island. Land Degrad. Dev. 2016, 27, 1562–1573. [Google Scholar] [CrossRef] [Scilit]
  30. Ouessar, M.; Sghaier, M.; Mahdhi, N.; Abdelli, F.; De Graaff, J.; Chaieb, H.; Yahyaoui, H.; Gabriels, D. An integrated approach for impact assessment of water harvesting techniques in dry areas: The case of oued Oum Zessar watershed (Tunisia). Environ. Monit. Assess. 2004, 99, 127–140. [Google Scholar] [CrossRef] [Scilit]
  31. Majdoub, R.; Khlifi, S.; Ben Salem, A.; M’Sadak, Y. Impacts of the Meskat water-harvesting system on soil horizon thickness, organic matter, and canopy volume of olive tree in Tunisia. Desalination Water Treat. 2014, 52, 2157–2164. [Google Scholar] [CrossRef] [Scilit]
  32. Takatsu, H.; Kitamura, Y.; Ouessar, M.; Shimizu, K. Assessment of the Agricultural Productivity of a Traditional Agricultural System in Tunisia. 2020. Available online: https://www.cabidigitallibrary.org/doi/full/10.5555/20163289160 (accessed on 29 January 2026).
  33. Budak, M.; Günal, H.; Çelik, İ.; Yıldız, H.; Acir, N.; Acar, M. Environmental sensitivity to desertification in northern Mes-opotamia; application of modified MEDALUS by using analytical hierarchy process. Arab. J. Geosci. 2018, 11, 481. [Google Scholar] [CrossRef] [Scilit]
  34. ODS. Atlas de la Région de Médenine; Office du Developpement de Sud: Médenine, Tunisie, 2018. Available online: https://www.mehat.gov.tn/wp-content/uploads/2024/04/AtlasMedenineAr.pdf (accessed on 29 January 2026).
  35. Nouri, N.M.; Bouzidi, M.; Rezgui, W.; Soltani, F.; Rejeb, N. Desertification risks: Sensitivity and Limits of the MEDALUS Method in Semi-arid Areas (Center of Tunisia). Rev. Nat. Technol. 2020, 12, 30–37. [Google Scholar]
Figure 1. Geographical location of the study site.
Land 15 00324 g001
Figure 2. Flowchart of the two-pronged methodology combining top-down and bottom-up approaches.
Land 15 00324 g002
Figure 3. Illustration of the modified MEDALUS methodology.
Land 15 00324 g003
Figure 4. Illustration of the generation methodology for WHTS inventory.
Land 15 00324 g004
Figure 5. Illustration of the implementation of the WHTs scenario.
Land 15 00324 g005
Figure 6. Field visit locations.
Land 15 00324 g006
Figure 7. Spatial representation of Land Degradation Sensitivity Indices and related quality indices under baseline and alternative scenarios: (a) Soil Quality Index (SQI); (b) Geomorphological Quality Index (GQI); (c) Vegetation Quality Index (VQI); (d) Management Quality Index (MQI); (e) Socio-Economic Quality Index (SEQI); (f) Land Degradation Sensitivity Index (LDSI) under the baseline scenario; (g) Vegetation Quality Index (VQI) under the WHTs scenario; (h) Management Quality Index (MQI) under the WHTs scenario; (i) Land Degradation Sensitivity Index (LDSI) under the WHTs scenario; (j) LDSI classification under the baseline and WHTs scenarios.
Land 15 00324 g007aLand 15 00324 g007b
Figure 8. Water harvesting techniques distribution.
Land 15 00324 g008
Table 1. Characteristics of the used indexes and sub-indexes.
IndexParameterTime PeriodData SourceData Type
CQIRainfall2000–2022Nasa Open data portalRaster
50 km
Aridity Index2000–2022Nasa Open data portalRaster
50 km
SQIParent material1963–2004ISRIC data hubVector
Texture2008ISRIC Soil gridRaster 250 m
Soil depth-Agriculture map (CRDA)Vector
Stoniness-Agriculture map (CRDA)Vector
GQISlope2014Digital Elevation Model (USGS) SRTMRaster 30 m
Slope aspect2014Digital Elevation Model (USGS) SRTMRaster 30 m
Plan curvature2014Digital Elevation Model (USGS) SRTMRaster 30 m
Profile curvature2014Digital Elevation Model (USGS) SRTMRaster 30 m
VQIFire risk-Agriculture map (CRDA)Vector
Erosion protection-Agriculture map (CRDA)Vector
Drought resistance-Agriculture map (CRDA)Vector
Vegetation Cover (NDVI)2022Sentinel-2 (Copernicus)Raster 10 m
MQIAgriculture intensity-Agriculture map (CRDA)Vector
Policy enforcement-Agriculture map (CRDA)Vector
EQIPopulation density2022Medenine statistics (ODS)Vector
Population growth rate2022Medenine statistics (ODS)Vector
Old age index2022Medenine statistics (ODS)Vector
Table 2. Parameters used for calculating the Climate Quality Index (CQI).
IndexParameterClassesDescriptionScore
CQIRainfall (mm)1>6501
2280–6501.5
3<2802
Aridity Index (mm/mm)1Humid (>0.65)1
2Dy sub-humid (0.5–0.65)1.5
3Semi-arid (<0.5)2
Table 3. Parameters used for calculating the Soil Quality Index (SQI).
IndexParameterClassesDescriptionScore
SQIParent material1Colluvial, Eolian, Fluvial1
2Gypsum, Anhydrite, Limestone, Other Carbonate Rocks, Sandstone, Greywacke, Arkose1.7
3Marl and Other Mixtures2
Texture1Loam, Sandy Clay Loam, Sandy Loam, Loamy Sand, Clay Loam1
2Sandy Clay, Silt Loam, Silty Clay Loam1.2
3Silt, Clay, Silty Clay1.6
4Sand2
Soil depth1Deep Soil (200), Very Deep Soil (199)1
2Moderately Deep Soil (201)1.2
3Shallow Soil (202)1.6
4Very Shallow Soil (200), Skeletal Soil (199)2
Stoniness1Absent (604)1
2In Surface (600, 601)1.5
Table 4. Parameters used for calculating the Geomorphological Quality Index (GQI).
IndexParameterClassesDescriptionScore
GQISlope (%)1<61
26–181.2
318–351.5
4>352
Slope1N, NE, NW, V, flat areas1
2S, SE, SW, E2
Plan curvature1>0.111
2−0.50–0.111.5
3<−0.502
Profile curvature1>0.021
2−0.39–0.021.5
3<−0.392
Table 5. Parameters used for calculating the Vegetation Quality Index (VQI).
IndexParameterClassesDescriptionScore
VQIFire risk1Jessour cultivation (900), Olive Trees (200), Orchard (300), Vineyard (405), Rangeland/Pasture (700), Bare Soil (900), Garaa (1300). Unclassified * (1800, 1700, 1600, 1400, 1200, 1100, 1000).1
2Vegetable Crops (401, 402, 403, 404), Cereal Crops (110), Fodder Crops (120), Palm Grove (600), Forest (800).1.3
3-1.6
4-2
Erosion protection1-1
2-1.3
3Palm Grove (600), Forests (800), Jessour Cultivation (900).1.6
4Olive Trees (900), Orchard (300), Vegetable Crops (402, 404, 401, 403).1.8
3Cereal Crops (110), Fodder Crops (120), Vineyard (405), Rangeland/Pasture (700), Bare Soil (900), 1300 (Garaa), Unclassified * (1800, 1700, 1600, 1400, 1200, 1100, 1000).2
Drought resistance1-1
2Forest (800)1.2
3Olive Trees (200), Orchard (300), Vegetable Crops Under Olive Trees (404, 402), Vineyard (405), Jessour Cultivation (1900), Palm groves (600).1.4
Rangeland/Pasture (700).1.7
Cereal Crops (110), Fodder Crops (120), Vegetable Crops (401, 403), Bare Soil (900), Garaa (1300). Unclassified * (1800, 1700, 1600, 1400, 1200, 1100, 1000).2
Vegetation cover (NDVI)10.951
20.65–0.951.2
30.35–0.651.5
4<0.352
* Unclassified corresponds to classes that do not have vegetation: Urban (1000), major facility (1100), salt flat (1200), Garaa (1300), Chott (1400), saline area (1600), wastewater treatment plant (1700), water bodies (1800).
Table 6. Parameters used for calculating the Management Quality Index (MQI).
IndexParameterClassesDescriptionScore
MQILand use intensity 1Forest (800), Unclassified * (1800, 1700, 1600, 1400, 1200, 1100, 1000)1
2Cereal (110), Fodder Crop (120), Olive Trees (200), Orchard (300), Summer Vegetable Crop (401), Spring Vegetable Crop (402), Spring Vegetable Crop Under Olive Trees (403), Vineyard (405), Palm Grove (600), Jessour Cultivation (1900)1.5
Policy enforcement1Complete (75% of the area under protection)1
2Partial (25–75% of the area under protection)1.5
3Incomplete (<25% of the area under protection)2
* Unclassified corresponds to classes that do not have vegetation: Urban (1000), major facility (1100), salt flat (1200), Garaa (1300), Chott (1400), saline area (1600), wastewater treatment plant (1700), water bodies (1800).
Table 7. Parameters used for calculating the Socio-Economic Quality Index (EQI).
IndexParameterClassesDescriptionScore
EQIPopulation density (pop/km2)1<251
225–501.2
350–1001.4
4100–2001.6
5200–4001.8
6>4002
Population growth rate (%)1<21
22–41.2
34–61.4
46–81.6
58–101.8
6>102
Old age Index1<2001
2200–4001.3
3400–5001.6
4>5002
Table 8. Land Degradation Sensitivity Index characteristics.
ClassSub-ClassScore RangeDescription
Not affectedN<1.17No sensitive/very low-sensitive areas to LD (areas unthreatened/weakly threatened by LD)
PotentialP1.17–1.22Low-sensitive areas to LD (areas threatened by LD if significant climate changes or severe land use changes occur)
FragileF11.23–1.26Medium-sensitive areas to LD (areas on the verge of degradation, in which any perturbation of the fragile balance between environment and anthropogenic activities can lead to a fast LD)
F21.27–1.32
F31.33–1.37
CriticalC11.38–1.41High and very highly sensitive areas to land degradation (areas highly degraded, characterized by a strong decline of productivity economically and ecologically)
C21.42–1.53
C3>1.53
Table 9. The area, expressed in absolute and percentage, of the Soil Quality Index.
ClassArea (km2)Area (%)
High239.9710.93%
Moderate1137.1951.81%
Low817.6337.25%
Table 10. The area, expressed in absolute and percentage, of the Geomorphological Quality Index.
ClassArea (km2)Area (%)
High74133.5%
Moderate107548.77%
Low39317.88%
Table 11. The area, expressed in absolute and percentage, of the Vegetation Quality Index.
ClassArea (km2)Area (%)
High831.4121.76%
Moderate1376.7378.24%
Low--
Table 12. The area, expressed in absolute and percentage, of the Management Quality Index.
ClassArea (km2)Area (%)
High--
Moderate48621.87%
Low171677.72%
Table 13. The area, expressed in absolute and percentage, of the Socio-Economic Quality Index.
ClassArea (km2)Area (%)
High12,28855.55%
Moderate748833.8%
Low23710.7%
Table 14. The area, expressed in absolute and percentage, of the LDSI.
ClassArea (km2)Area (%)
Potential--
Fragile 1--
Fragile 20.270.01%
Fragile 313.230.60%
Critical 1124.465.64%
Critical 21555.8570.46%
Critical 3514.3223.29%
Table 15. The area, expressed in absolute and percentage of VQI under WHTs SCENARIO.
Baseline ScenarioWHTs Scenario
ClassArea (km2)Area (%)Area (km2)Area (%)
High831.4121.76%481.5237.65%
Moderate1376.7378.24%1731.2662.35%
Low----
Table 16. The area, expressed in absolute and percentage of MQI under WHTS Scenario.
Baseline ScenarioWHTs Scenario
ClassArea (%)Area (km2)Area (%)Area (km2)
High--23.75%525
Moderate21.87%48614.14%313
Low77.72%171662.11%1374
Disclaimer/Publisher’s Note: The statements, opinions and data contained in all publications are solely those of the individual author(s) and contributor(s) and not of MDPI and/or the editor(s). MDPI and/or the editor(s) disclaim responsibility for any injury to people or property resulting from any ideas, methods, instructions or products referred to in the content.