Article

Precise Extraction of Croplands from Remote Sensing Images in Egypt by a Dual-Encoder U-Net with Multi-Scale Axial Attention and Boundary Constraints


1
School of Earth Sciences and Engineering, Hohai University, Nanjing 211100, China
2
Institute for Environmental Futures, School of Geography, Geology and the Environment, University of Leicester, Space Park Leicester, 92 Corporation Road, Leicester LE4 5SP, UK
3
National Centre for Earth Observation, Space Park Leicester, 92 Corporation Road, Leicester LE4 5SP, UK
4
Land Satellite Remote Sensing Application Center, Ministry of Natural Resources, Beijing 100048, China
5
School of Computing and Mathematical Sciences, University of Leicester, University Road, Leicester LE1 7RH, UK
*
Authors to whom correspondence should be addressed.
Land 2026, 15(2), 305; https://doi.org/10.3390/land15020305
Submission received: 17 January 2026 / Revised: 4 February 2026 / Accepted: 7 February 2026 / Published: 11 February 2026

Abstract

Accurate cropland parcel mapping is essential for food security and sustainable land management in arid Africa, yet it remains challenging in Egypt due to edge blurring, spectral confusion, and fragmented fields in medium-resolution imagery. A novel dual-encoder deep learning method that integrates multi-scale axial attention and boundary constraints (MAA-BCNet) is proposed for the precise extraction of croplands in Egypt from Sentinel-2 multispectral images. A dual-path encoder is designed to fuse CNN-based local textures with an RMT global branch using spatial decay attention for complementary feature extraction. A multi-scale axial attention module is introduced to capture anisotropic parcel structures for improved spectral–spatial discrimination, and a multi-directional gradient edge enhancement module is developed for explicitly preserving boundary integrity. A U-Net++ decoder is employed for dense multi-scale aggregation. Experimental results in Egypt demonstrate that MAA-BCNet achieves superior performance in delineating cropland parcels, particularly for irregular or fragmented croplands with complex landscapes and fuzzy boundaries. Compared with the widely used segmentation models such as DeepLabV3_plus, PSPnet, Link_net, FCN_resnet101, and U-Net++ under the same training and evaluation settings, our model has the best performance, with Recall, Precision, IoU, and F1-Score reaching 94.92%, 90.77%, 86.57%, and 92.80%, respectively. These advancements make MAA-BCNet suitable for cropland mapping of large areas of Egypt, with applications in precision agriculture and sustainable land management.

1. Introduction

The arid regions of Africa face many threats to food security from global climate change, escalating water scarcity, and rapid population growth [1,2]. As a typical arid African nation, Egypt suffers these challenges due to its extreme aridity and population pressures [3,4]. Therefore, an accurate cropland mapping method is crucial, which can acquire rapid, precise spatial information of croplands to support agricultural planning and sustainable land-use management [5]. However, traditional methods of cropland survey have significant limitations such as high costs for large-scale coverage, difficulties in accessing remote desert areas, and time-intensive field surveys to map croplands in African arid regions.
Satellite remote sensing is suitable for extensive cropland mapping due to its capacity for efficient and periodic Earth observation. Early approaches of cropland extraction from remote sensing data are constrained by limited data availability and insufficient ability of processing large datasets, which mainly rely on unsupervised classification techniques [6] and conventional edge detection algorithms [7,8]. Moreover, low-spatial-resolution imagery influences extraction accuracy due to substantial noise and blurred boundaries.
With advancements in image resolution and computational capabilities, object-based and machine learning (ML) approaches have become predominant in cropland mapping. Object-Based Image Analysis (OBIA) clusters adjacent pixels with similar spectral characteristics into some objects by edge detection or segmentation [9,10] and then classifies them using rule-based methods. While OBIA is effective for homogeneous areas, it is likely to produce salt-and-pepper noise in heterogeneous agricultural landscapes, often leading to fragmented or artifactual boundaries [11]. Regional segmentation methods mitigate this problem by iteratively merging homogeneous regions, generating more continuous parcel boundaries [12]. Moreover, their performance heavily depends on parameter tuning, and inappropriate parameter settings can lead to under-segmentation or over-segmentation [13].
ML-based methods have emerged as alternative approaches that use labeled training data for supervised classification compared to the rule-based OBIA methods. Support Vector Machines (SVM) apply kernel-based transformations for non-linear classification in high-dimensional spaces [14] but struggle with complex cropland boundary shapes, particularly in spectrally complex arid environments. Random Forest (RF) aggregates outputs from multiple decision trees through voting or averaging [15], providing robust handling of noisy data and feature importance ranking. However, it is likely to generate inconsistent predictions near class boundaries due to conflicting tree outputs, compromising boundary stability. Additional ML approaches, including Gradient Boosting Machines (GBMs) and k-Nearest Neighbors (k-NN), have shown promise in specific contexts but face similar challenges with boundary delineation and computational scalability for extensive classification tasks [15,16]. While these ML approaches have significant improvements over traditional object-based methods in terms of automation and handling high-dimensional feature spaces, they rely on handcrafted features and have limited capacity for spatial context modeling.
To overcome these limitations of object-based and traditional ML-based approaches, deep learning approaches have become increasingly prominent for cropland extraction [17,18]. Encoder–decoder architectures are particularly effective in modeling complex non-linear relationships and capturing global contextual information [19]. For instance, Persello et al. [20] achieved F-scores above 0.6 through an edge-focused encoder–decoder network for small croplands in Nigeria. Zhang et al. [21] developed a recursive residual U-Net to combine the features of different levels for addressing pixel-level challenges such as high intra-class variability. These approaches with a single encoder lack the capacity for complex land cover representation due to the limited diversity of feature scales [22,23]. Fused encoder designs attempt to combine multiple feature types but often suffer from information loss, feature distortion, and imbalanced weighting. U-Net preserves low-level information through skip connections [24], but the performance deteriorates on high-aspect-ratio images due to inadequate inter-layer feature interaction. These limitations highlight the critical need for more sophisticated feature fusion frameworks capable of maintaining multi-scale discriminative ability while minimizing information loss across network layers.
Dual-encoder architectures have emerged as a promising alternative for addressing the limitations of conventional approaches, which have some distinct advantages such as enhanced multi-scale representation for improved generalization, complementary feature learning through different network pathways, and superior inference efficiency through parallelized feature extraction [25,26,27]. Khan et al. [28] combined DenseNet and U-Net to preserve low-level features while strengthening semantic segmentation capabilities. The integration of Transformer architectures has further improved global context modeling in vision tasks [29]. Wang et al. [30] used both CNN and Transformer encoders for land cover segmentation of high-resolution images. In order to address the issues of Vision Transformers (ViT) [31], such as lacking explicit spatial priors and high computational costs, Fan et al. [32] employed the Recurrent Memory Transformer module to incorporate the spatial decay matrices and factorized attention mechanisms inspired by temporal decay in natural language processing [33]. Li et al. [34] combined Manhattan Vision Transformer and convolutional blocks using a dual-path encoder to capture multi-scale features and then fused the feature maps through the module of spatial prior convolutional attention integration.
Cropland mapping in arid environments presents unique challenges due to spectral confusion with similar land cover types [35,36] and highly fragmented spatial patterns. Attention mechanisms have proven effective in suppressing irrelevant features and highlighting informative regions [37]. And the specialized edge detection modules improve boundary precision by amplifying transitions between cropland and non-cropland areas [38]. For example, John et al. [39] embedded attention modules in skip connections to highlight deforestation boundaries. Miao et al. [40] integrated spatial-channel squeeze-and-excitation (scSE) attention into decoder subnetworks to increase feature discriminability. Lu et al. [41] further improved agricultural segmentation by combining deep supervision, edge refinement, and dual attention mechanisms.
For precise cropland mapping in African arid regions such as Egypt, a novel dual-encoder deep learning method that integrates multi-scale axial attention and boundary constraints (MAA-BCNet) is proposed for precise extraction of croplands in Egypt from Sentinel-2 multispectral images. A dual-path encoder is designed to fuse CNN-based local textures with an RMT (Retentive Networks Meet Vision Transformers) global branch using spatial decay attention for complementary feature extraction. A multi-scale axial attention module is introduced to capture anisotropic parcel structures for improved spectral–spatial discrimination, and a multi-directional gradient edge enhancement module is developed for explicitly preserving boundary integrity. A U-Net++ decoder is employed for dense multi-scale aggregation. The main contributions of the work in the paper include:
  • A novel dual-encoder framework is proposed to couple local detail preservation with global context acquisition for cropland parcel extraction, which can reduce boundary fragmentation and semantic inconsistency in various scenes by fusing a CNN encoder (VGG16) with an RMT-based global encoder for long–short range dependency modeling.
  • A multi-scale spectral–spatial axial attention module is introduced to better represent parcel geometry and directional structures, which is capable of capturing anisotropic field patterns and improving discrimination under spectral confusion, where conventional spatial attention and single-scale context aggregation are often insufficient.
  • An edge-aware boundary enhancement mechanism is designed to explicitly use multi-directional gradient cues into the cropland segmentation, which can mitigate mixed-pixel-induced boundary misclassification and produce more accurate and continuous parcel outlines, especially for irregular and fragmented cropland patches.
The remainder of this paper is organized as follows: Section 2 presents the study area, materials, and methods, including the proposed dual-encoder network with multi-scale axial attention and boundary constraints, as well as the RMT, CBAM_s, and EdgeDetect modules, evaluation metrics, and parameter settings. Section 3 reports the experimental results, including ablation and comparative experiments. Finally, Section 4 concludes the paper.

2. Materials and Methods

2.1. Study Area

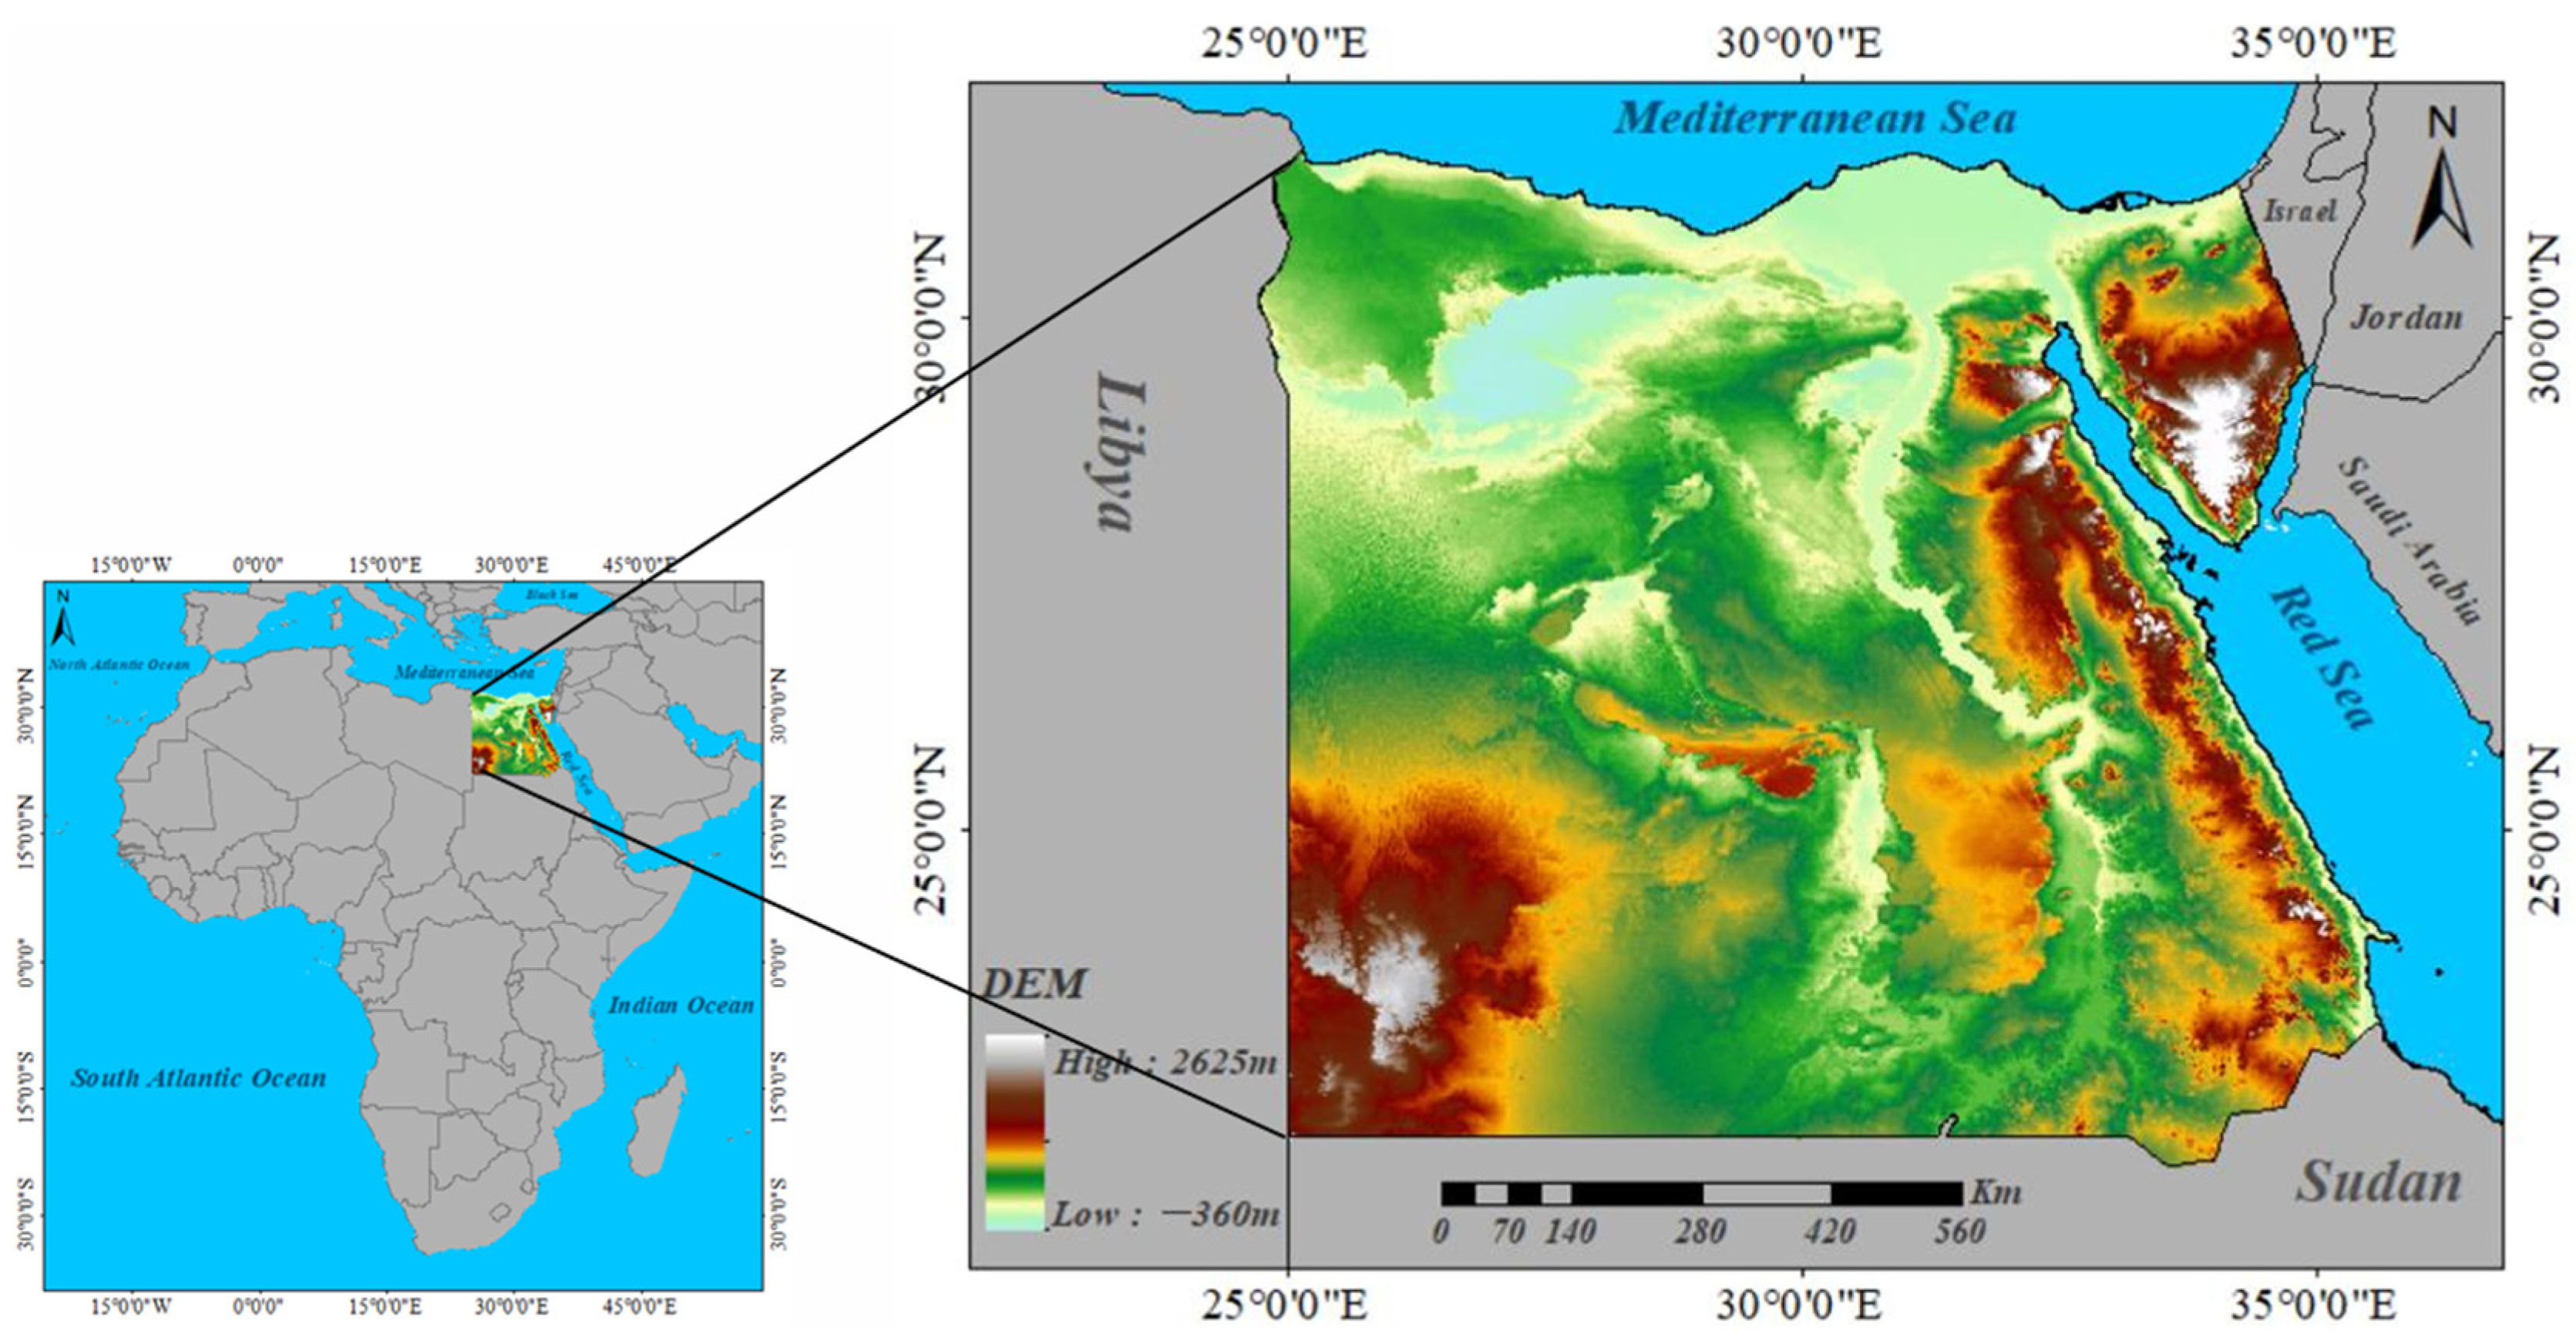
As a typical arid region of North Africa, Egypt encompasses approximately 1.01 million km2 of predominantly desert landscape [3]. The nation’s agricultural activity is heavily concentrated in the Nile River Valley and Delta regions (Figure 1), which form Egypt’s primary cultivable land base [42]. This limited arable area faces mounting pressures from multiple fronts such as rapid population growth driving agricultural expansion, climate change exacerbating water scarcity, urban encroachment consuming fertile lands, and increasing farmland abandonment due to marginal productivity. These compounding challenges highlight the critical need for large-scale, rapid, and precise cropland monitoring systems capable of delivering precise spatial data to inform sustainable agricultural policies, optimize water resource allocation, and ultimately safeguard both food security and economic development [43].

2.2. Materials

High-quality multispectral images are acquired by the Sentinel-2 satellite across various spectral bands (443–2190 nm) that are suitable for agricultural monitoring applications. We utilized Sentinel-2 Level-2A surface reflectance data with cloud cover below 5% from January to December 2023, accessed through the Google Earth Engine. The bands of B2, B3, B4, and B8 have a 10 m resolution, and the bands of B5, B6, B7, B8a, B11, and B12 have a 20 m resolution. After applying cloud masking to reduce atmospheric effects, the bands of B5, B6, B7, B8a, B11, and B12 were resampled to a 10 m resolution by bilinear interpolation to have a consistent resolution for the subsequent calculation and analysis.
To balance discriminative power and feature compactness, we selected nine vegetation indices as input features because they provide complementary sensitivity to crop biophysical properties and are relatively robust to background effects (e.g., bare soil and mixed pixels) that commonly occur in the Nile Delta. This design follows the common practice in Sentinel-2 crop mapping of leveraging a band–index hybrid feature space to enhance class separability, where vegetation indices often contribute strongly to crop-type discrimination and complement the original reflectance bands. The band-plus-index feature design combined with feature selection has been shown to be effective for multi-temporal Sentinel-2 crop mapping using Random Forest [42]. Specifically, NDVI and EVI were included as two of the most widely used indices that capture canopy greenness and vegetation structure, and they are frequently adopted in crop detection and classification studies due to the strong red absorption by chlorophyll and high NIR reflectance driven by leaf internal structure [43]. To improve robustness under sparse vegetation and soil-exposed conditions, we further included soil-adjusted and background-resistant indices, which are widely used as complementary inputs together with greenness indices in agricultural remote sensing. The recent research [44] also demonstrates the effectiveness of combining indices such as NDVI, GNDVI, EVI, and MSAVI as input features and analyzing their relative contributions for crop-related classification tasks. Moreover, Sentinel-2 red-edge NDVI variants (NDVIre) were incorporated to exploit the red-edge bands, which have been demonstrated to be strongly linked to chlorophyll content and green LAI over agricultural sites, thereby providing additional physiological sensitivity beyond conventional red–NIR indices [45]. Overall, this compact index set helps reduce redundant spectral information and improves model generalization compared with using a larger, highly collinear set of indices, as summarized in Table 1.
Feature selection critically influences extraction accuracy in cropland mapping, which strategically balances discriminative power with computational efficiency, focusing on the features most sensitive to key crop traits while maintaining processing feasibility for large-scale analysis. We assessed feature importance through out-of-bag (OOB) error analysis from the RF [49,50,51], which systematically introduced noise perturbation to each feature of the OOB samples and quantified the corresponding accuracy reduction to determine each feature’s contribution to classification performance. And then the TOP-K method [52] was employed for feature selection. The workflow is as follows:
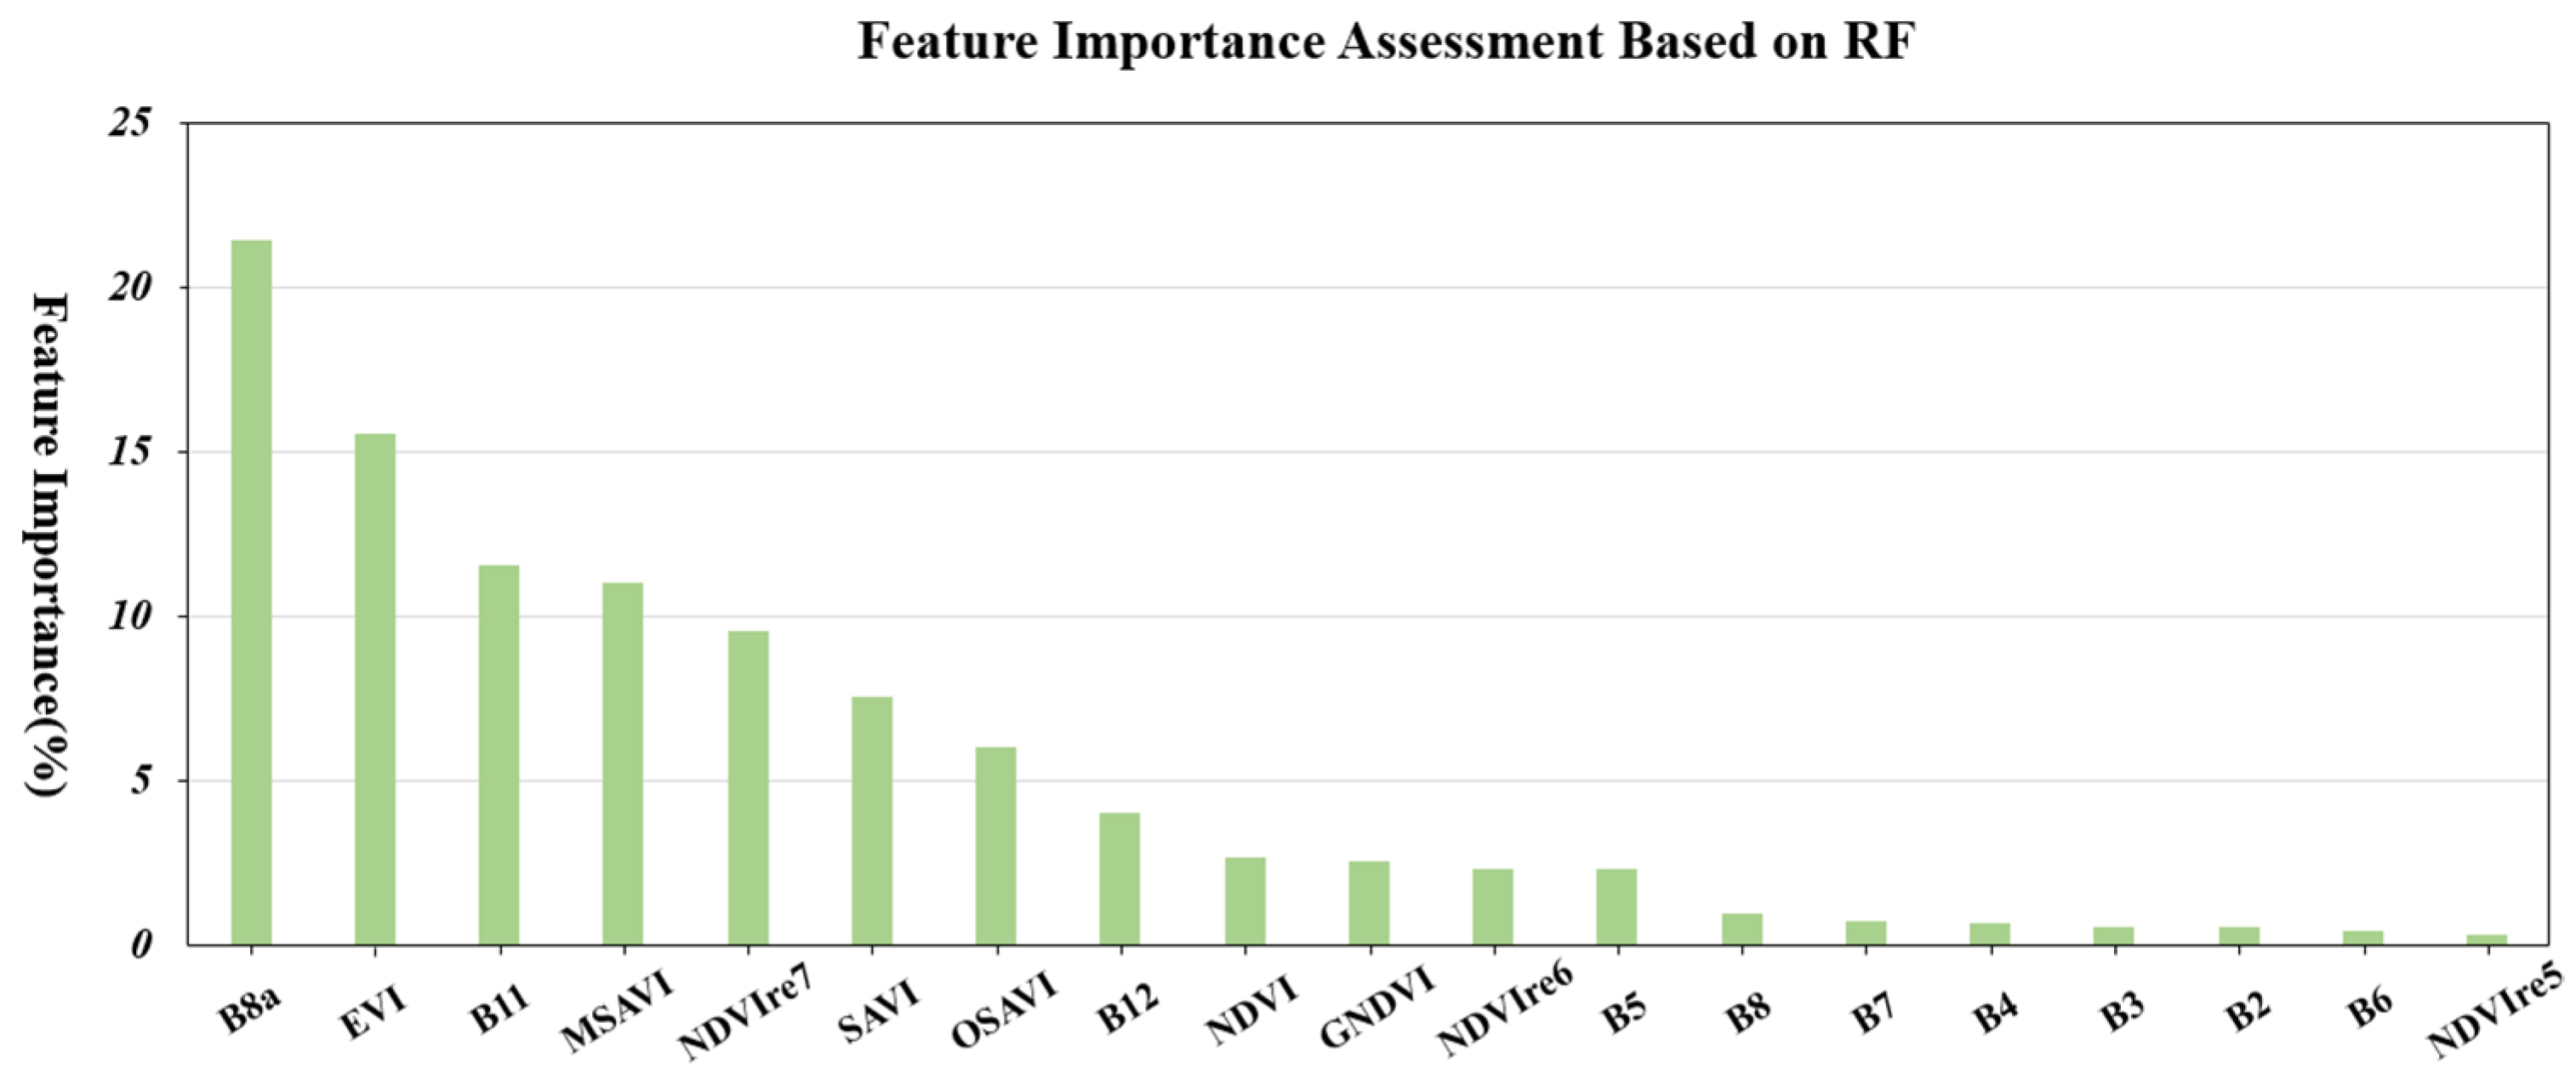
  • Feature ranking. A total of nineteen features including ten original bands and nine vegetation indices were ranked by feature importance based on RF as in Figure 2.
  • Feature subset assessing. Feature subsets were iteratively constructed by selecting the top-K features. For each subset, an RF model was retrained and evaluated using cross-validation. The average accuracy across folds served as the evaluation metric. By varying K, the model’s performance was assessed.
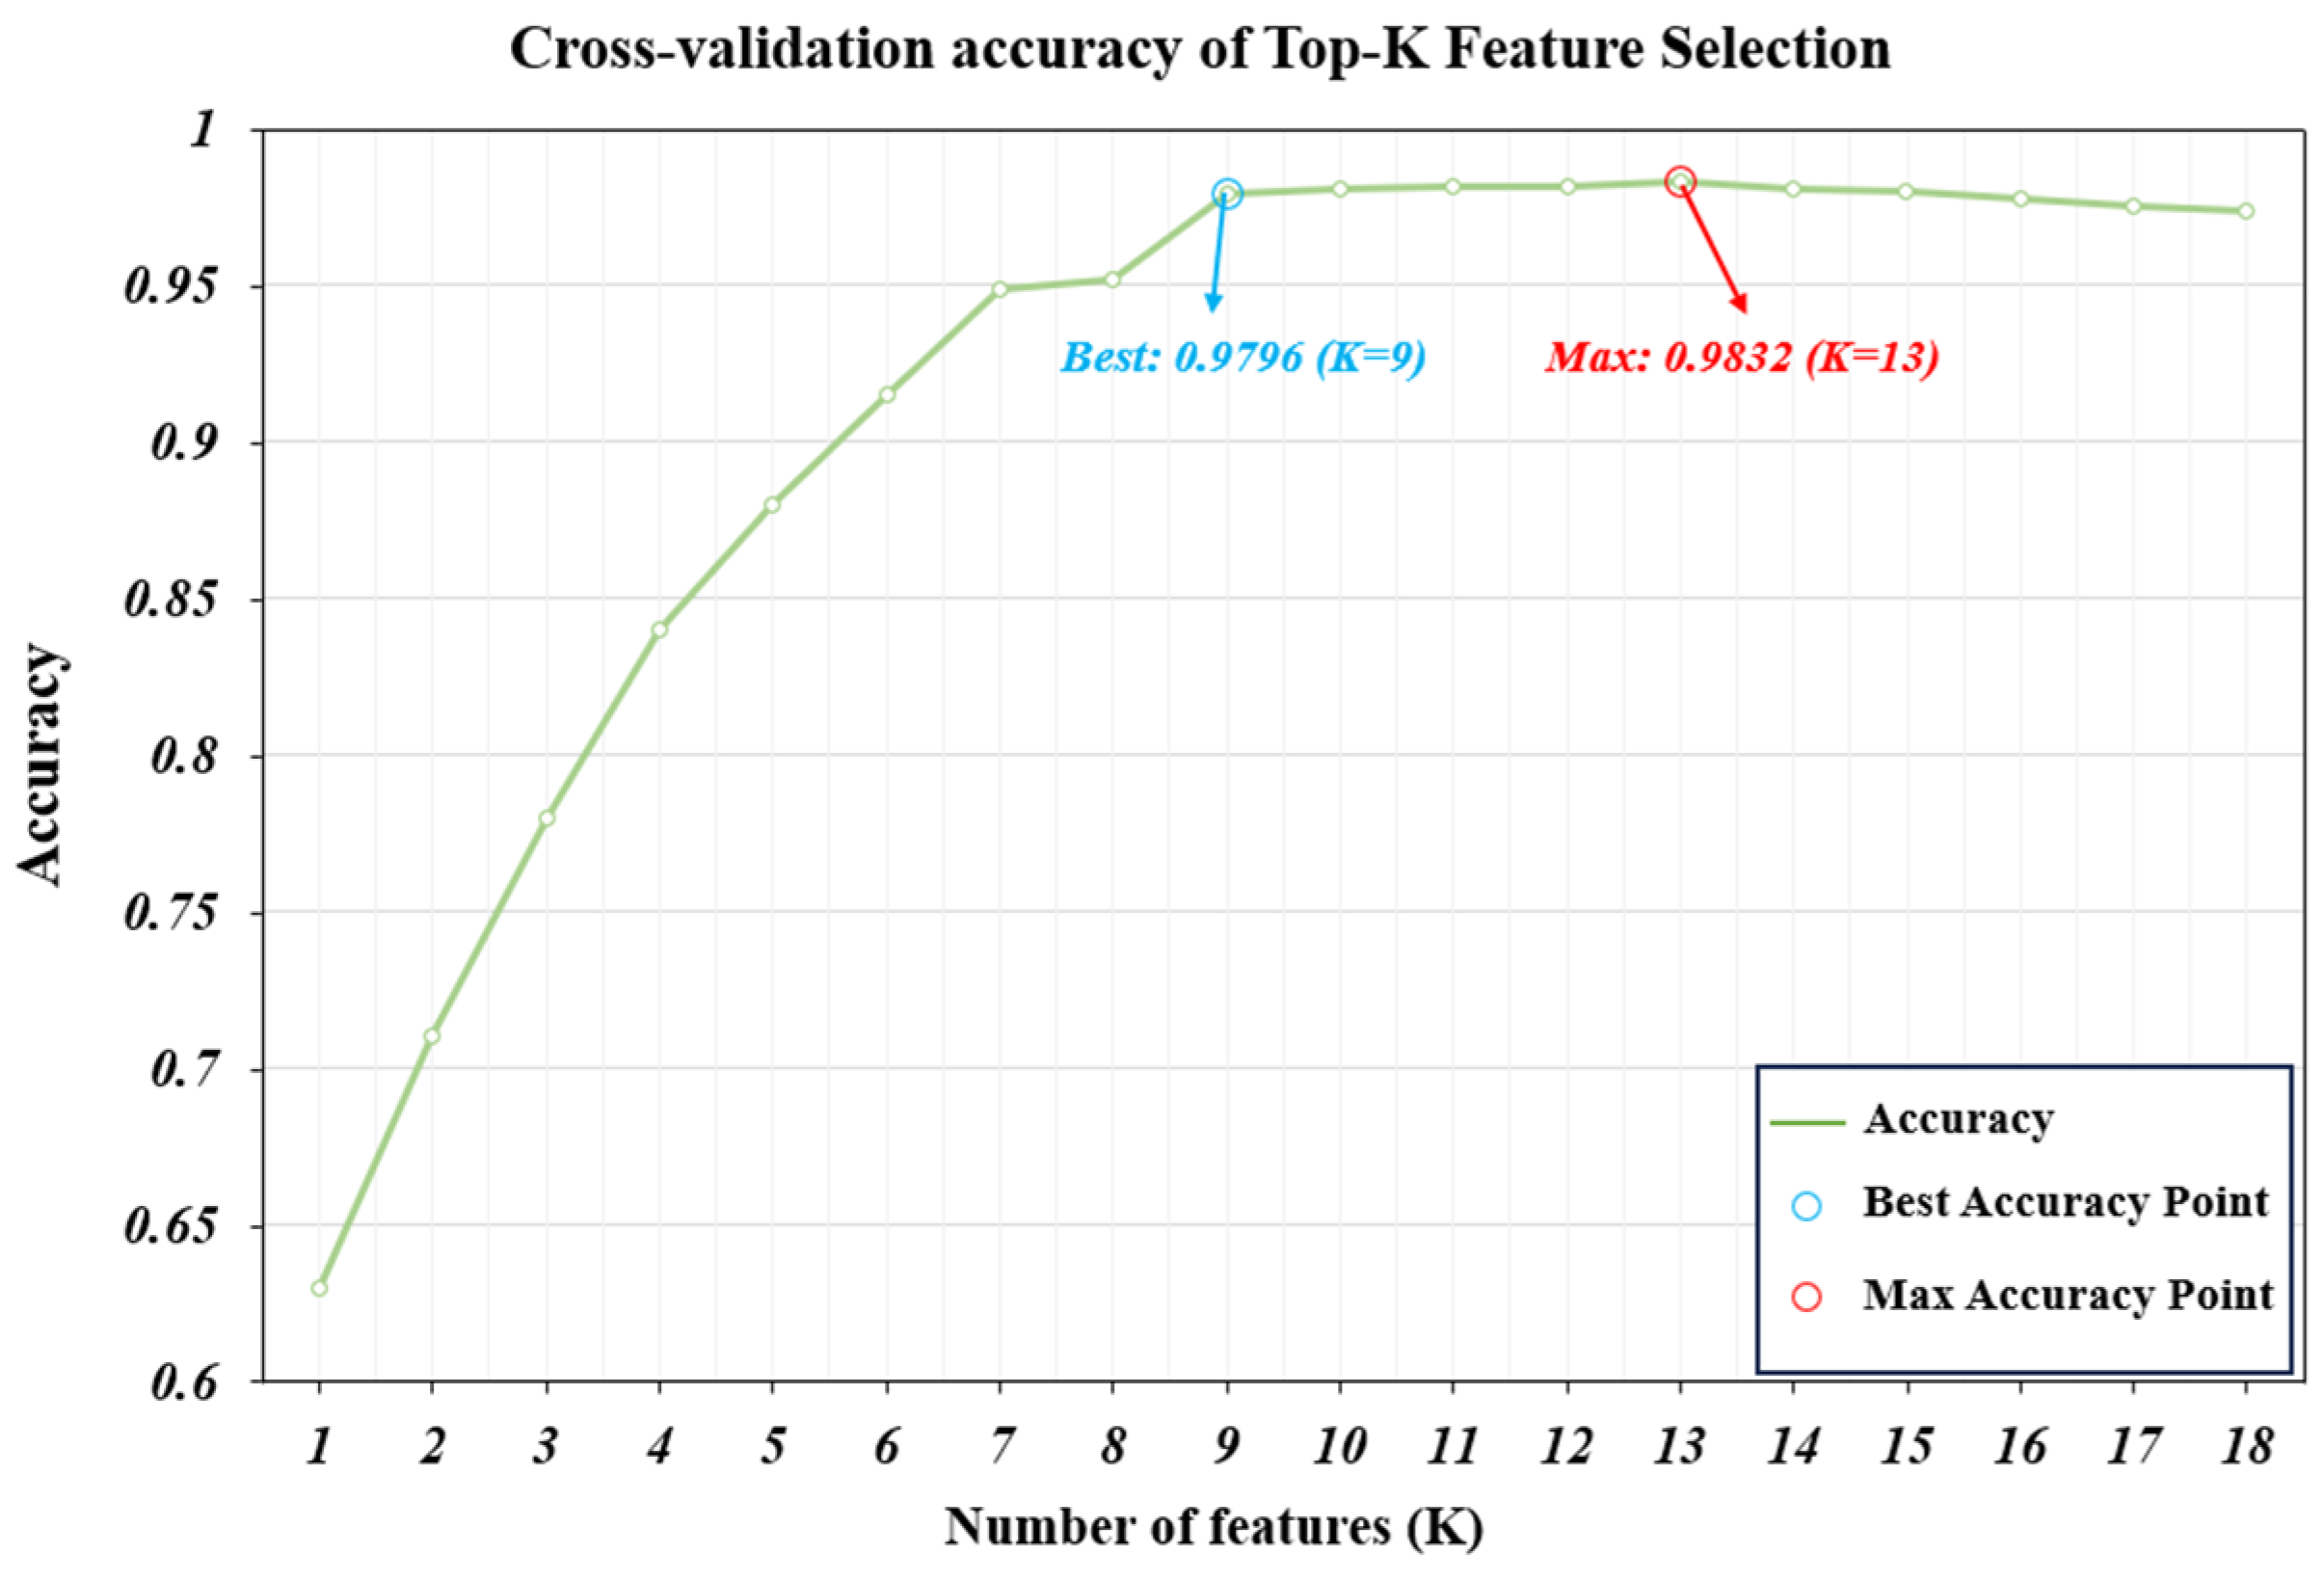
  • Optimal K selection. The model achieves a peak cross-validation accuracy of 0.9796 when K = 9, as shown in Figure 3. Adding more features only yields marginal accuracy with computation increasing. And the classification accuracy exhibits a gradual decline when K exceeds 13 due to the redundant or noisy features that may compromise model performance.
Based on comprehensive feature importance analysis, we selected nine optimal features for dimensionality reduction in subsequent modeling, which are B8a, B11, B12, EVI, MSAVI, NDVI, NDVIre7, OSAVI, and SAVI. This strategic selection achieves an optimal classification accuracy while effectively reducing the dimensionality in deep learning applications. The chosen features collectively capture essential vegetation characteristics while minimizing redundant spectral information.
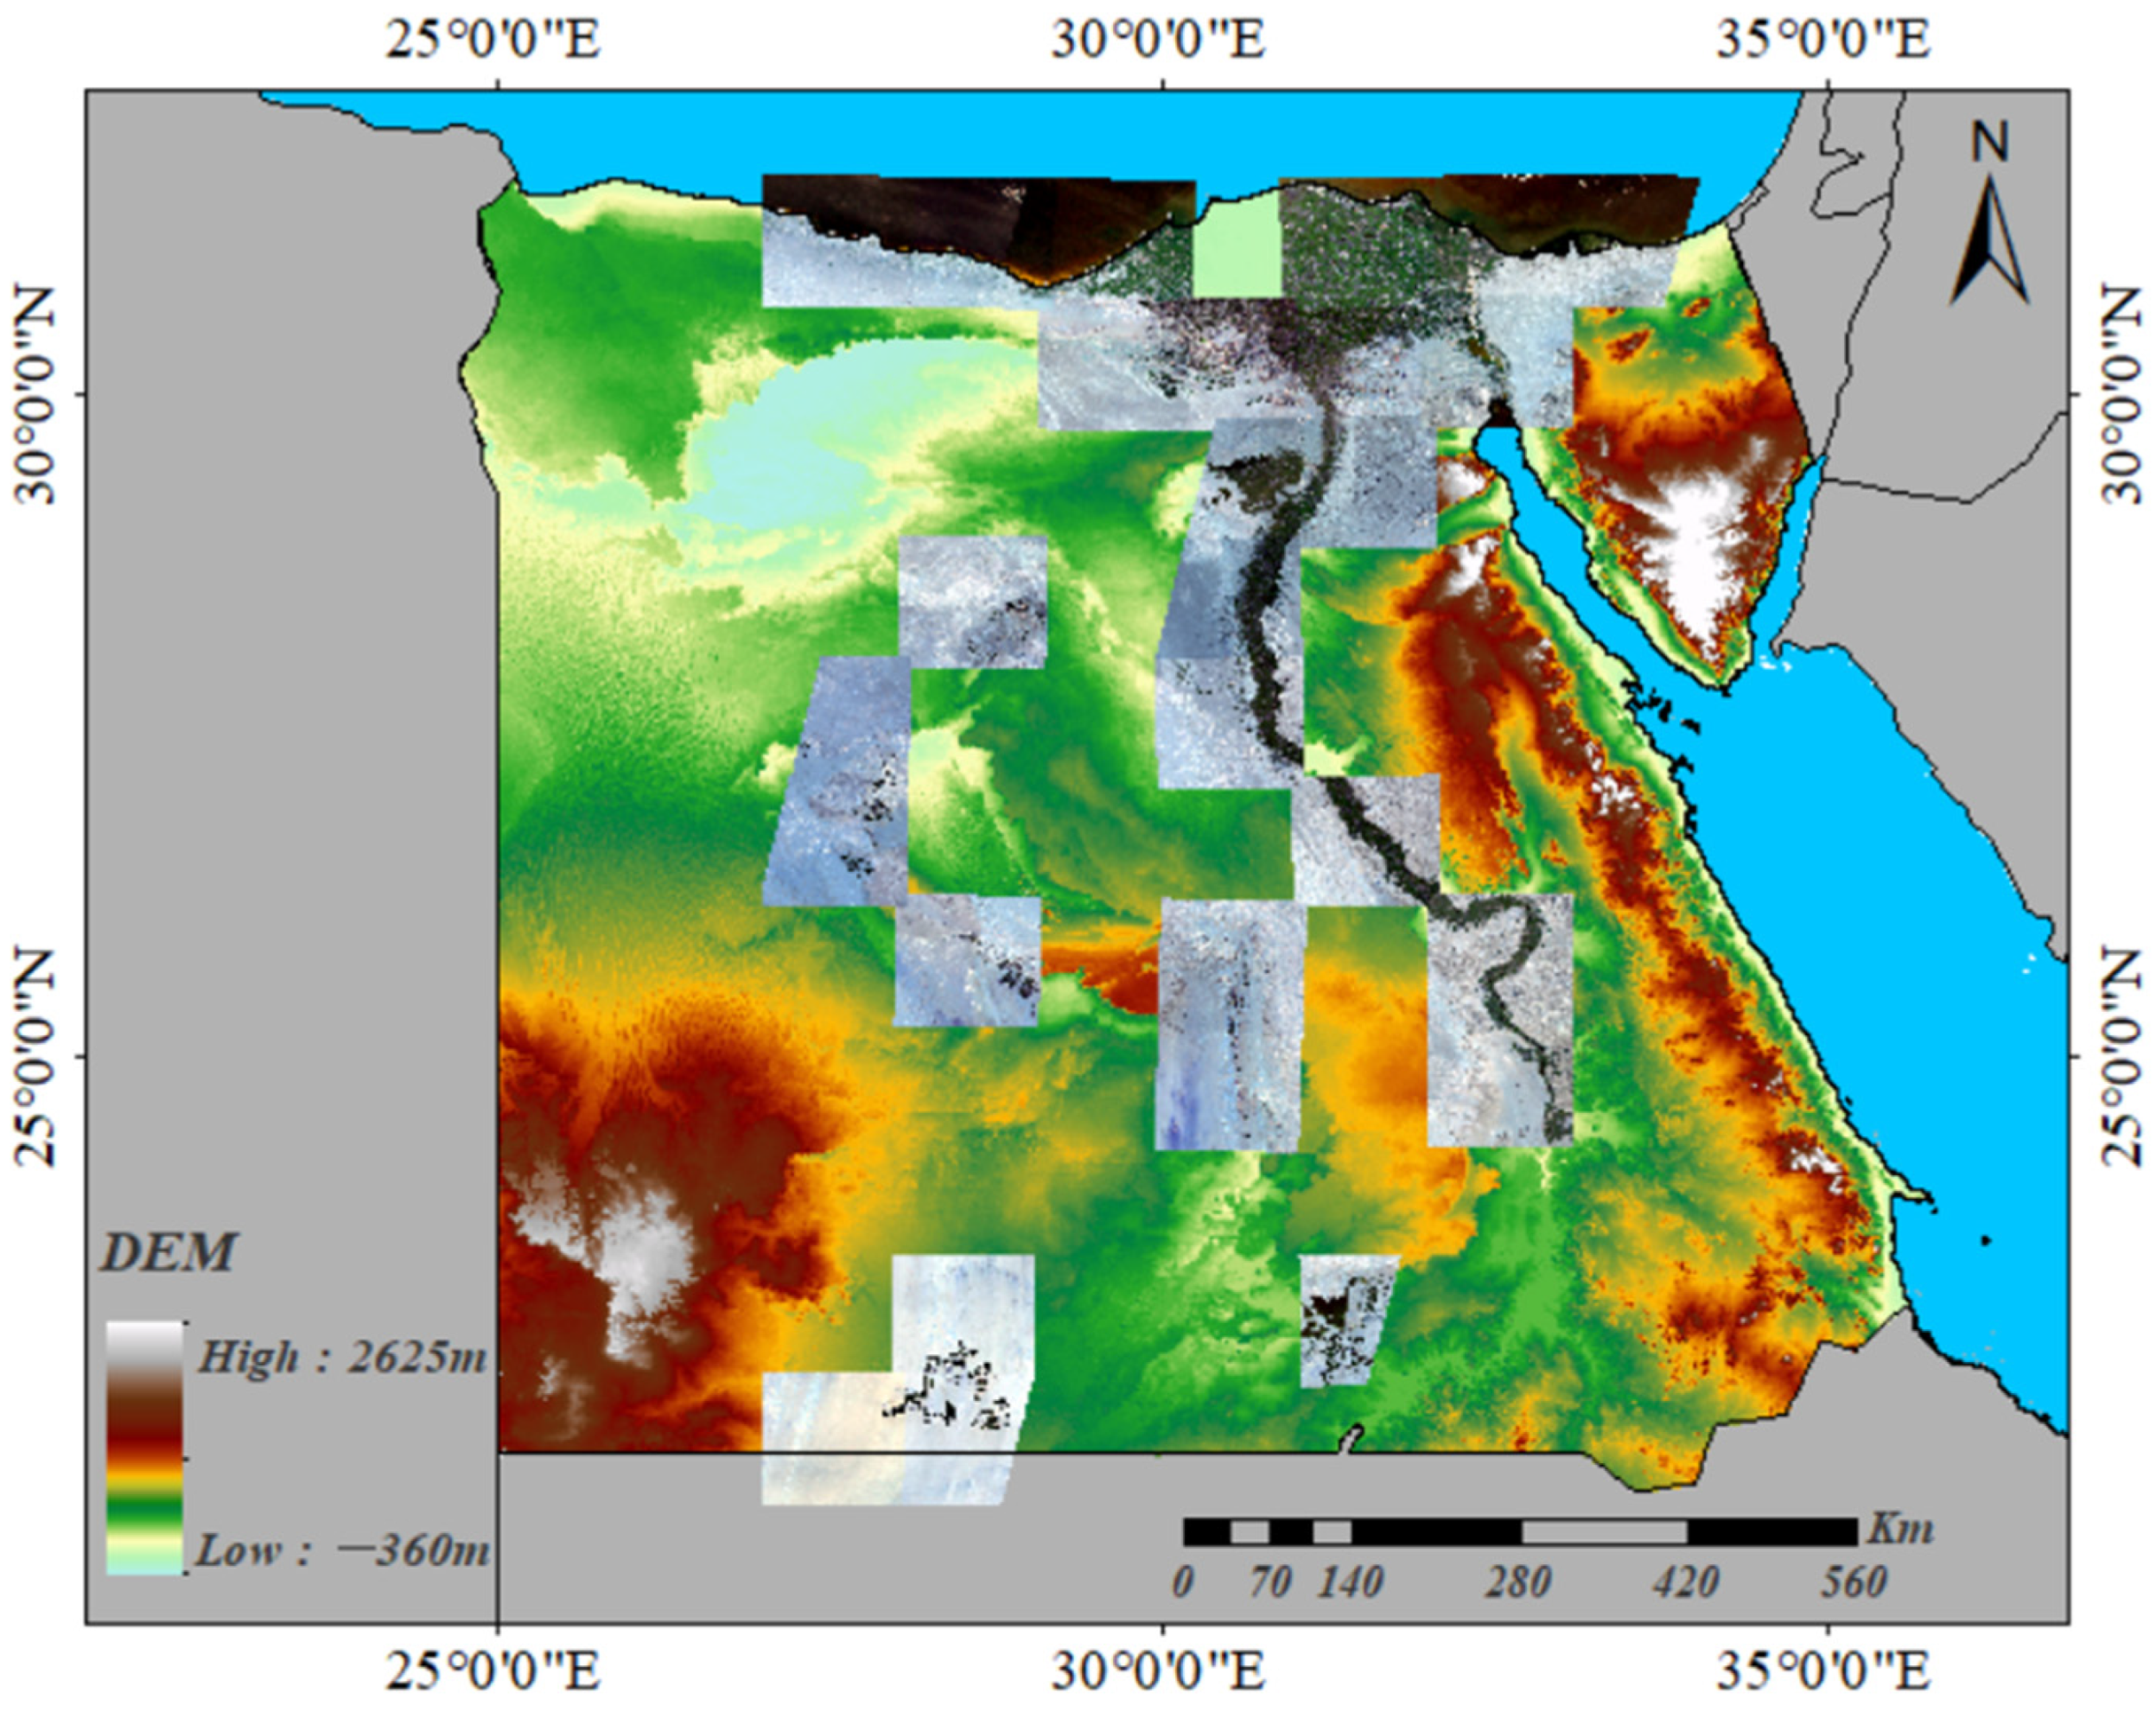
The sampling dataset is critical for training and evaluating models in remote sensing applications. To ensure geographical diversity and model generalizability across arid African landscapes, the sample areas were selected across representative Egypt regions such as the Nile Delta, Middle Nile Valley, Upper Nile, and the Dakhla and Kharga Oases (Figure 4). The significantly different landscapes lead to pronounced variability in field shape, background composition, and irrigation patterns, providing a challenging but representative basis for evaluating model robustness under heterogeneous surface conditions. Ground-truth labels were generated through visual interpretation and manual editing in ArcMap10.8, with verification against high-resolution reference imagery from GF-1 satellite and Google Earth to ensure labeling precision for Sentinel-2 data. In addition, public land cover products (e.g., ESA and Esri Land Cover) were used to support sample delineation and improve labeling consistency.
The processed images and corresponding labels were divided into non-overlapping patches of 256 × 256 pixels to ensure sample independence. After label balancing and exclusion of samples dominated by non-cropland areas, a total of 4470 image–label pairs were obtained. These samples were initially split into training, validation, and test sets in a ratio of 5:2.5:2.5. For improving data diversity and model robustness, multiple augmentation methods were applied to the training data, including affine transformations (such as rotation and mirroring) and noise injection. Finally, we obtained 8938 samples for training, 1117 samples for validation, and 1117 samples for testing, supporting model training, hyperparameter optimization, and unbiased performance evaluation.

2.3. Methods

2.3.1. Dual-Encoder Network with Multi-Scale Axial Attention and Boundary Constraints

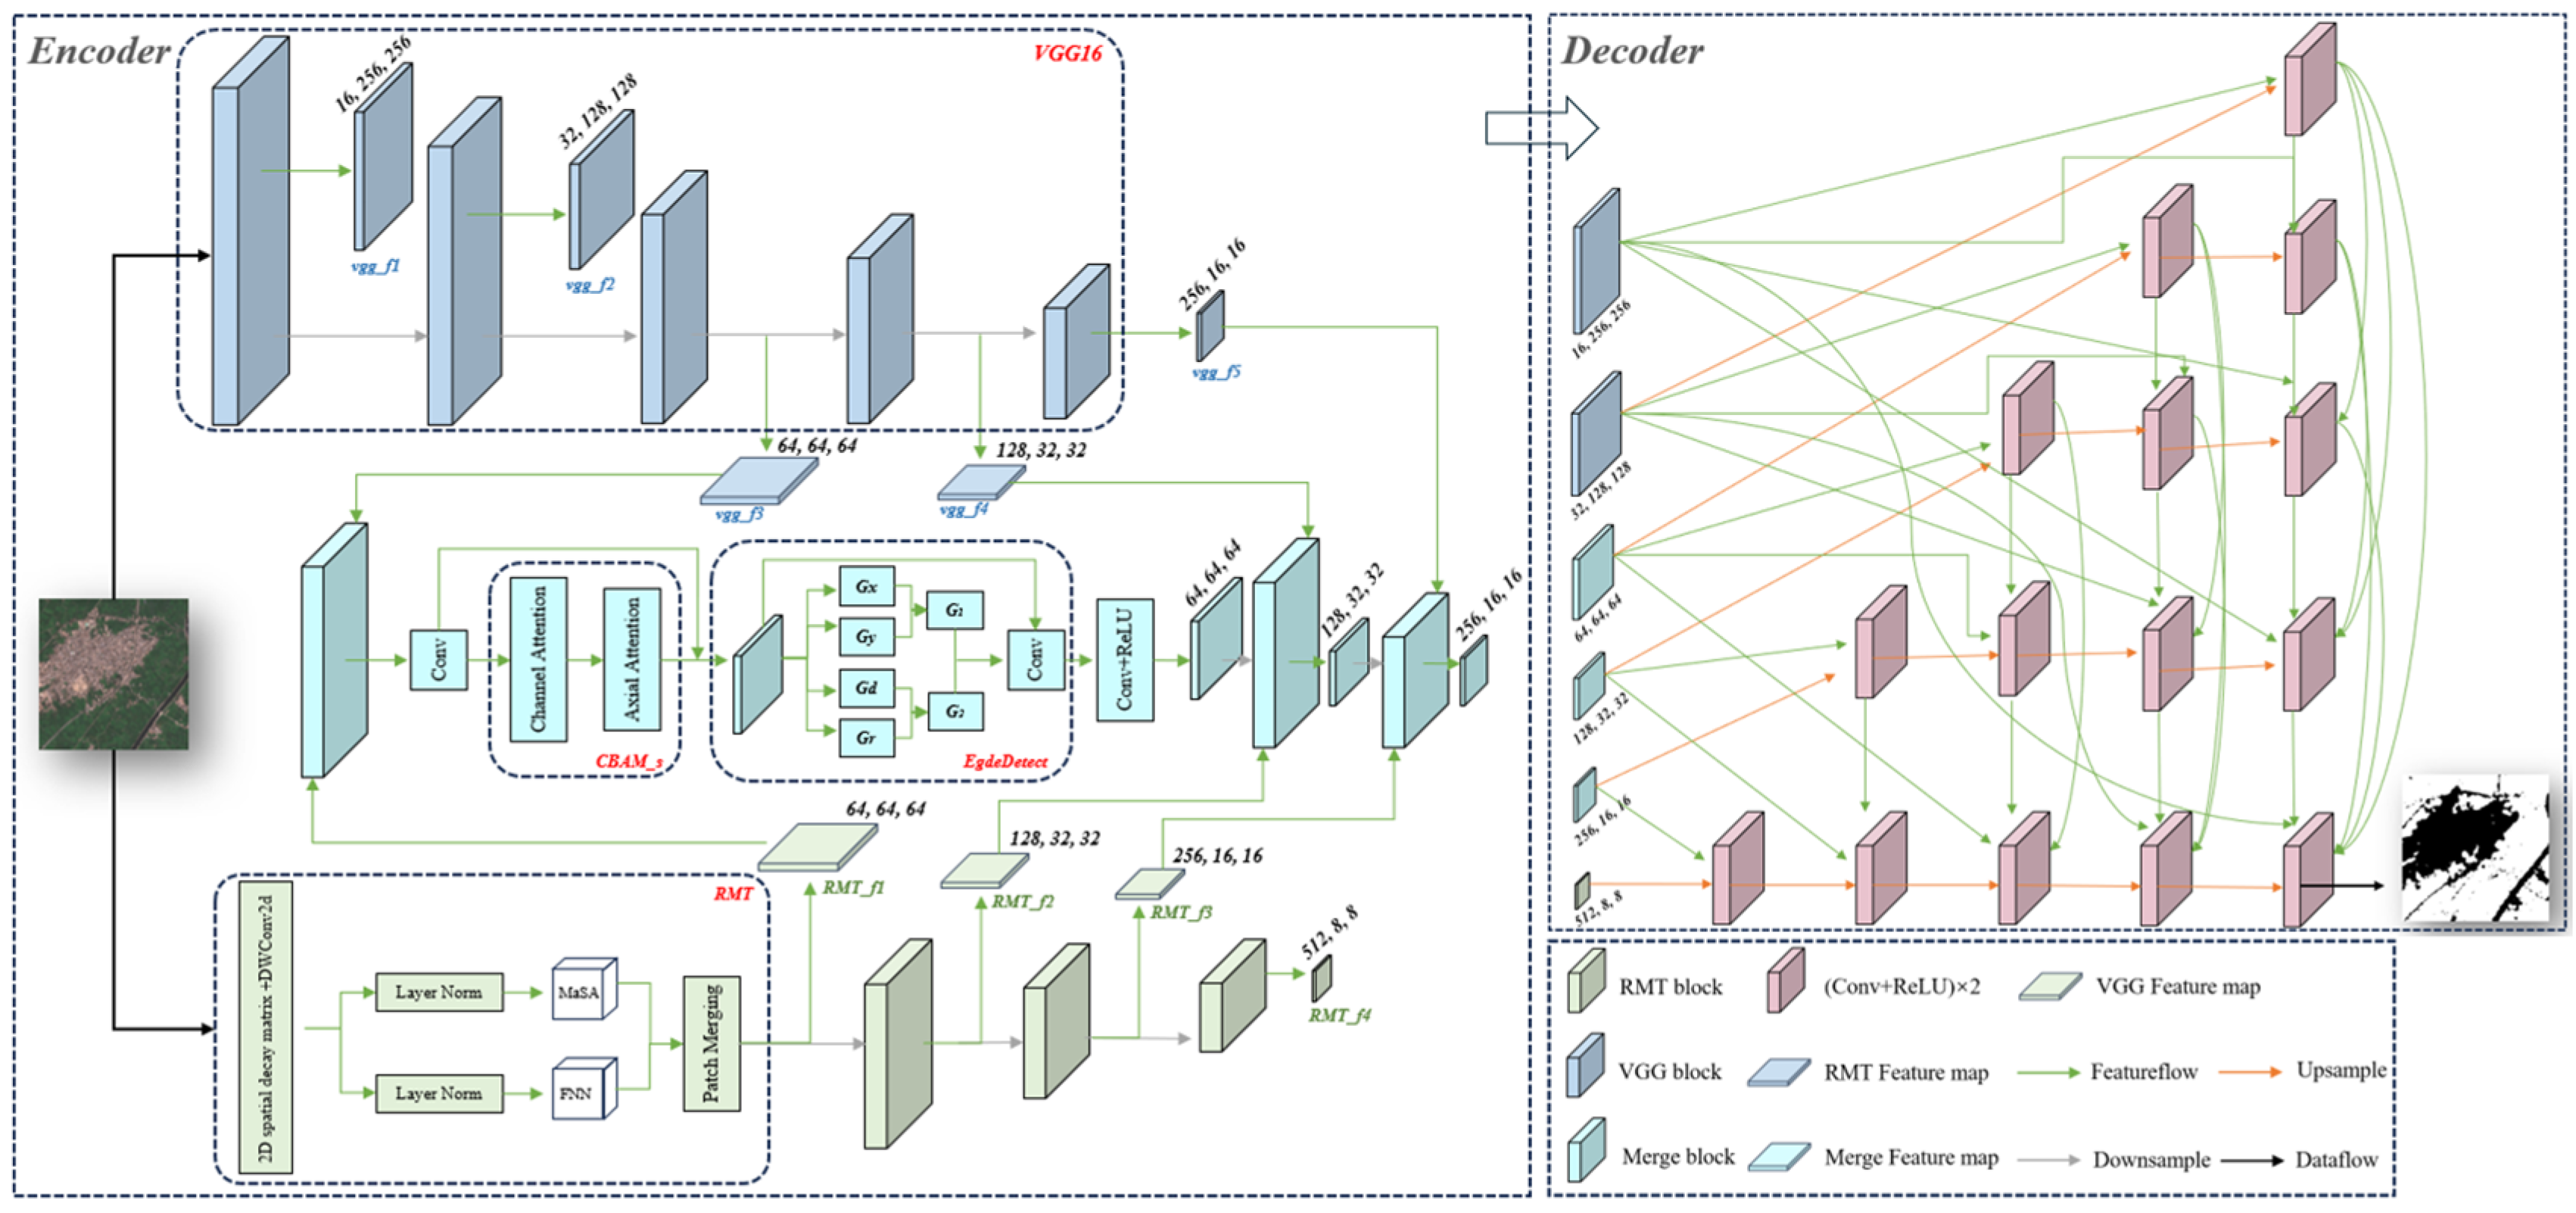
To address the challenge of blurred boundary segmentation in cropland parcels primarily caused by complex spectral and spatial characteristics of arid African landscapes, this study proposes the multi-scale axial attention and boundary-constrained U-Net (MAA-BCNet). This framework employs the parallel dual-path encoders for complementary feature extraction, the multi-scale axial attention module for better spectral–spatial representation, and the improved U-Net++ decoder with boundary constraints as shown in Figure 5. This integrated design enables precise cropland delineation by simultaneously leveraging hierarchical spectral features and explicit edge features from satellite imagery.
The proposed model employs a dual-encoder architecture that combines a CNN-based local feature extractor (VGG16) and a hybrid global encoder (RMT) integrating Manhattan Self-Attention with Vision Transformer modules. This dual-path design enables comprehensive feature extraction from both local and global perspectives. The pre-trained VGG16 encoder [53] captures hierarchical local features through five convolutional stages, which facilitate precise boundary localization and improve recognition of small and fragmented cropland parcels. In parallel, the four-layer RMT module establishes global spatial correlations by multi-scale self-attention mechanisms, effectively enhancing semantic coherence across regions and increasing adaptability to variable parcel sizes including large contiguous fields. By fusing detailed local edge information with global contextual dependencies, this architecture addresses the challenges posed by fragmented land parcels and semantic ambiguity in complex agricultural landscapes.
To effectively integrate multi-scale features from both encoders, a three-level fusion strategy is designed to consider typical cropland parcel scales ranging from 50 × 50 to 200 × 200 pixels in Sentinel-2 imagery. Each fusion level utilizes a Merge_Block to concatenate complementary features from the corresponding stages of the VGG16 and RMT along the channel dimension. For instance, the first Merge_Block combines VGG16’s third-layer features (vgg_f3) with RMT’s first-layer features (RMT_f1). The concatenated features are then passed through convolutional layers, enhanced by a Convolutional Block Attention Module with an axial spatial module (CBAM_s) for adaptive feature refinement and an EdgeDetect module to explicitly extract boundary information. The refined features are subsequently downsampled using max pooling, followed by convolution and ReLU activation to complete the fusion process.
The decoder employs a progressively upsampling process through deconvolution operations based on U-Net++ [54]. Each deconvolution layer utilizes a 4 × 4 kernel with stride 2 and padding 1, doubling the spatial resolution of feature maps at each stage. The five-stage upsampling pipeline hierarchically aggregates three to six multi-scale features at each level through channel-wise concatenation. Following each feature aggregation step, the combined features are further refined by sequential convolutional layers with ReLU activation, and the final cropland output is generated by reconstructing high-resolution feature maps. The hierarchical design facilitates preservation of boundary details and robust handling of scale variations, effectively addressing the spectral complexity and geometric diversity in the challenging arid cropland environments of Africa.

2.3.2. RMT Module

The RMT introduces a spatial decay mechanism that is adapted from the temporal decay mechanism of Retentive Networks (RetNet) to computer vision tasks by Manhattan Self-Attention (MaSA) [32]. For any two pixels ( x n , y n ) and ( x m , y m ) in an input image, the spatial decay weight D n m 2 d is defined as
D n m 2 d = γ | x n x m | + | y n y m |
where γ is a decay factor controlling the attenuation rate. When γ approaches 1, the slow decay allows capturing long-range contextual dependencies such as global field shapes. Conversely, smaller γ values prioritize local interactions, preferentially enhancing fine-scale features such as cropland boundaries. The Manhattan distance | x n x m | + | y n y m | quantifies the relative positional difference between tokens in 2D space. This mechanism incorporates explicit spatial priors, enabling adaptive focus on local and global relationships. It specifically addresses the challenge of edge detection in agricultural landscapes by automatically assigning higher attention weights to proximal pixels, which is particularly valuable for delineating abrupt land cover transitions such as those between croplands and adjacent roads or bare soil. The adaptive nature of this approach enhances sensitivity to detailed boundary variations and mitigates edge blurring or fragmentation.
MaSA integrates 2D spatial priors into the attention mechanism, which is defined as
M a S A ( X ) = S o f t m a x ( Q K T )   D 2 d V
where V, K, and Q represent value, key, and query matrices obtained by the input features X. The raw attention scores are normalized by Softmax(QKT) to generate a probability distribution matrix, which converts similarity scores into normalized attention weights. These weights indicate the relative degree of attention each token allocates to other tokens. Croplands often exhibit regular geometric patterns such as rectangular fields and grid-like distributions. By using the Manhattan distance decay matrix D 2 d , MaSA improves interactions between spatially adjacent regions, enabling the model to more effectively learn field boundaries and intra-field consistency.
To reduce computational complexity, RMT employs the decomposed MaSA, decoupling 2D attention into 1D spatial decay operations of horizontal ( D H ) and vertical ( D W ) dimensions. This decomposition linearly decreases computational costs while preserving the receptive field shape. In the high-resolution stages of RMT Blocks 1–3, the decomposed MaSA focuses on local edge refinement and fine-grained feature extraction. Conversely, the low-resolution stages of RMT Block 4 retain the full MaSA to model the global structural patterns, such as the cropland distribution and spatial relationships with non-cropland objects. This hierarchical design ensures simultaneous preservation of pixel-level edge precision and region-level semantic consistency, enabling robust representation across scales in arid agricultural landscapes.

2.3.3. CBAM_s Module

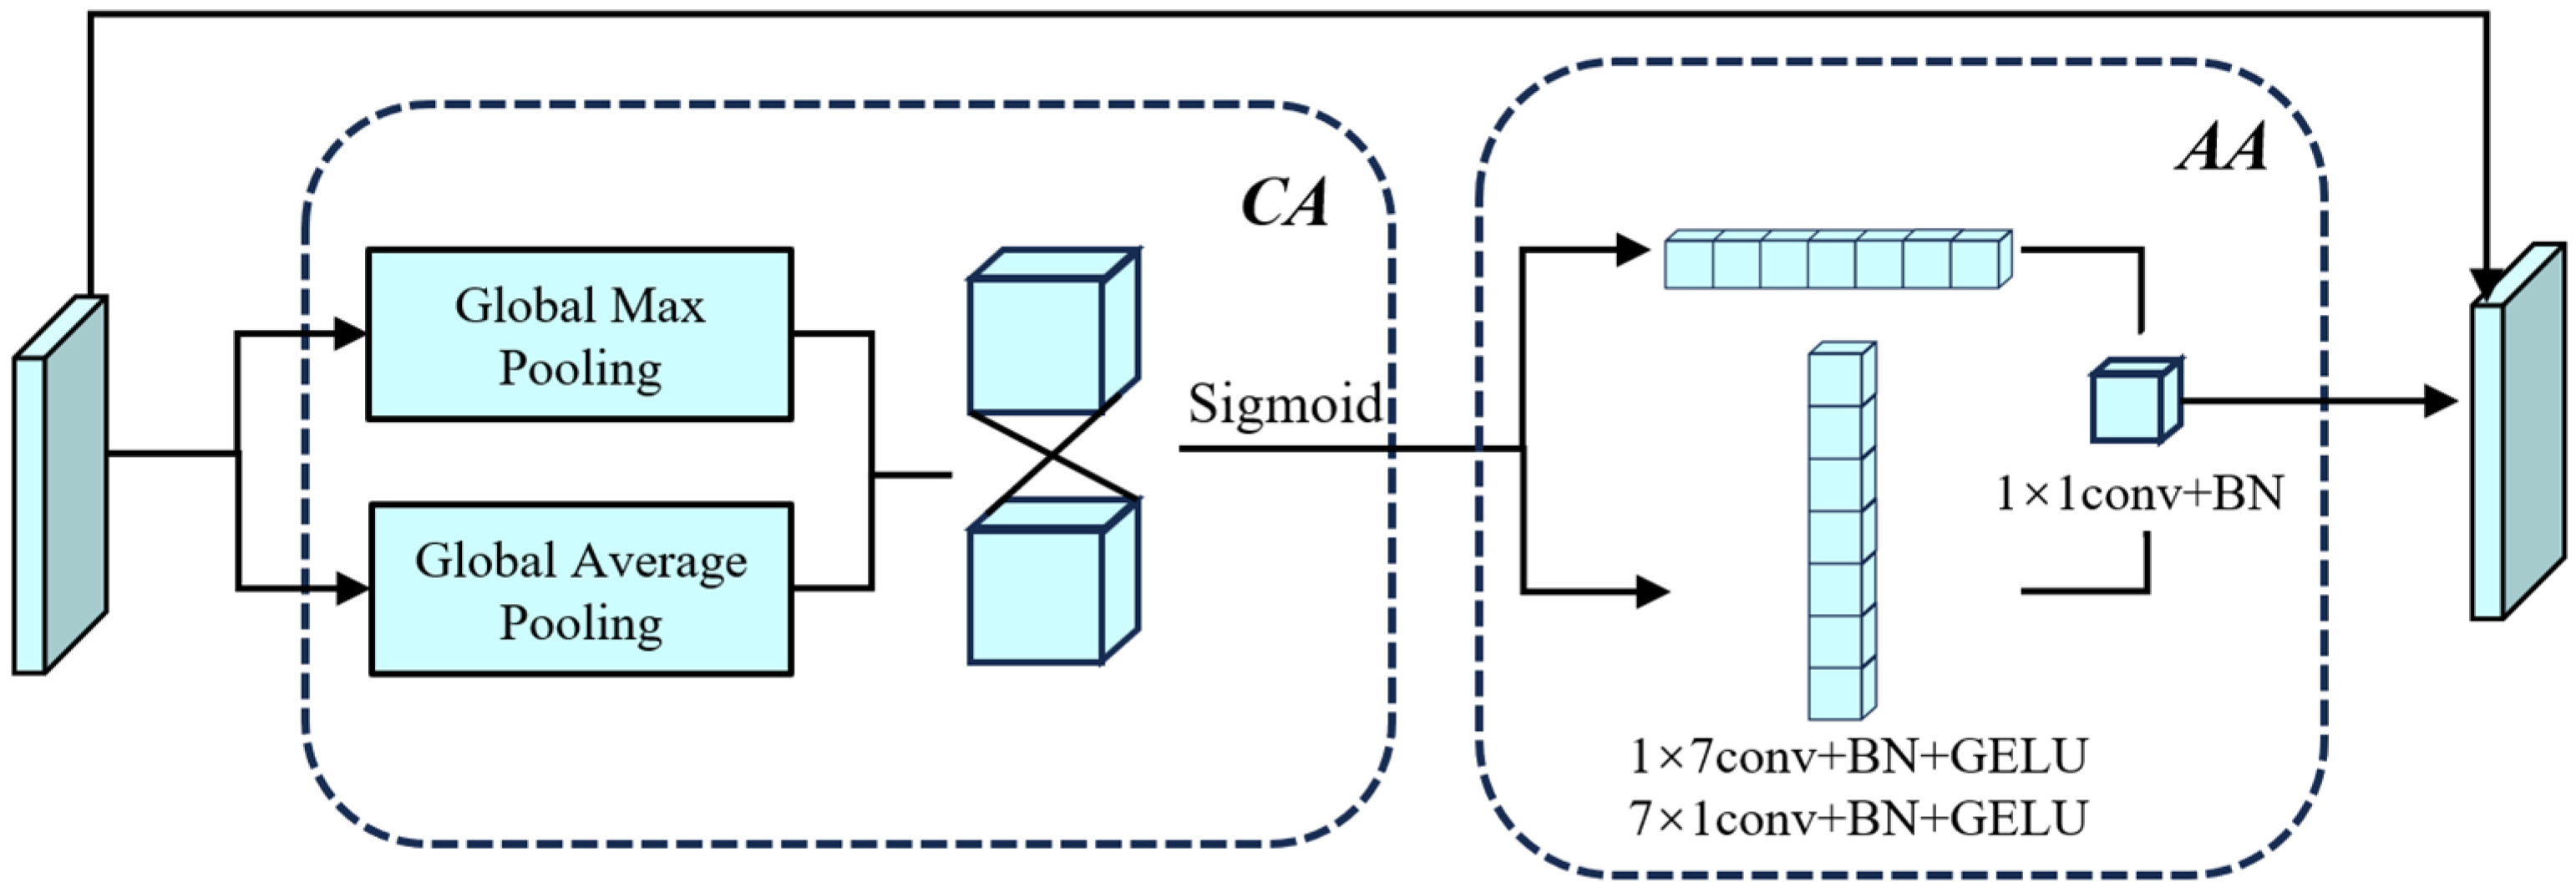
The CBAM_s module (Figure 6) improves the conventional Convolutional Block Attention Module (CBAM) through replacing standard spatial attention with integrating channel attention and axial attention mechanisms. This design optimizes the spatial and spectral features for croplands in arid regions.
The channel attention submodule adaptively changes by channel-wise feature responses. Given an input feature map x, the channel attention weight CA(x) is calculated as
C A ( x ) = σ { M L P [ M a x P o o l ( x ) ] + M L P [ A v g P o o l ( x ) ] }
where σ denotes the Sigmoid function, and MLP comprises two 1 × 1 convolutional layers, a Gaussian Error Linear Unit (GELU) activation, and a Batch Normalization (BN) layer. The spatial information is aggregated by the global max pooling (MaxPool) and average pooling (AvgPool). The GELU activation introduces smoother nonlinearity than ReLU, enhancing discriminative ability for cropland-specific spectral patterns. The final Sigmoid operation generates the channel-wise weights, amplifying the influences of critical features.
Inspired by the decomposed MaSA, the axial attention submodule captures long-range spatial dependencies along horizontal and vertical axes, which replaces CBAM’s spatial attention with
A A ( x ) = F u s e [ C o n v 1 × 7 ( C A ( x ) ) + C o n v 7 × 1 ( C A ( x ) ) ]
where Conv1 × 7 and Conv7 × 1 represent the convolutions along horizontal and vertical axes followed by BN and GELU. These convolutions extract directional edge features such as field boundaries aligned with irrigation grids. The Fuse operation combines the two directional features through summation.
To prevent over-suppression of semantic context, the output is formulated as out = AA(x) + x, employing residual connections instead of a Sigmoid-activated mask. This design preserves original feature semantics while refining edge responses, particularly beneficial for low-contrast cropland–background scenes such as arid fields blending with bare soil. By explicitly modeling horizontal and vertical dependencies, axial attention strengthens information propagation in RMT’s previous layers, ensuring coherent integration of directional edge cues and spectral-channel priorities.

2.3.4. EdgeDetect Module

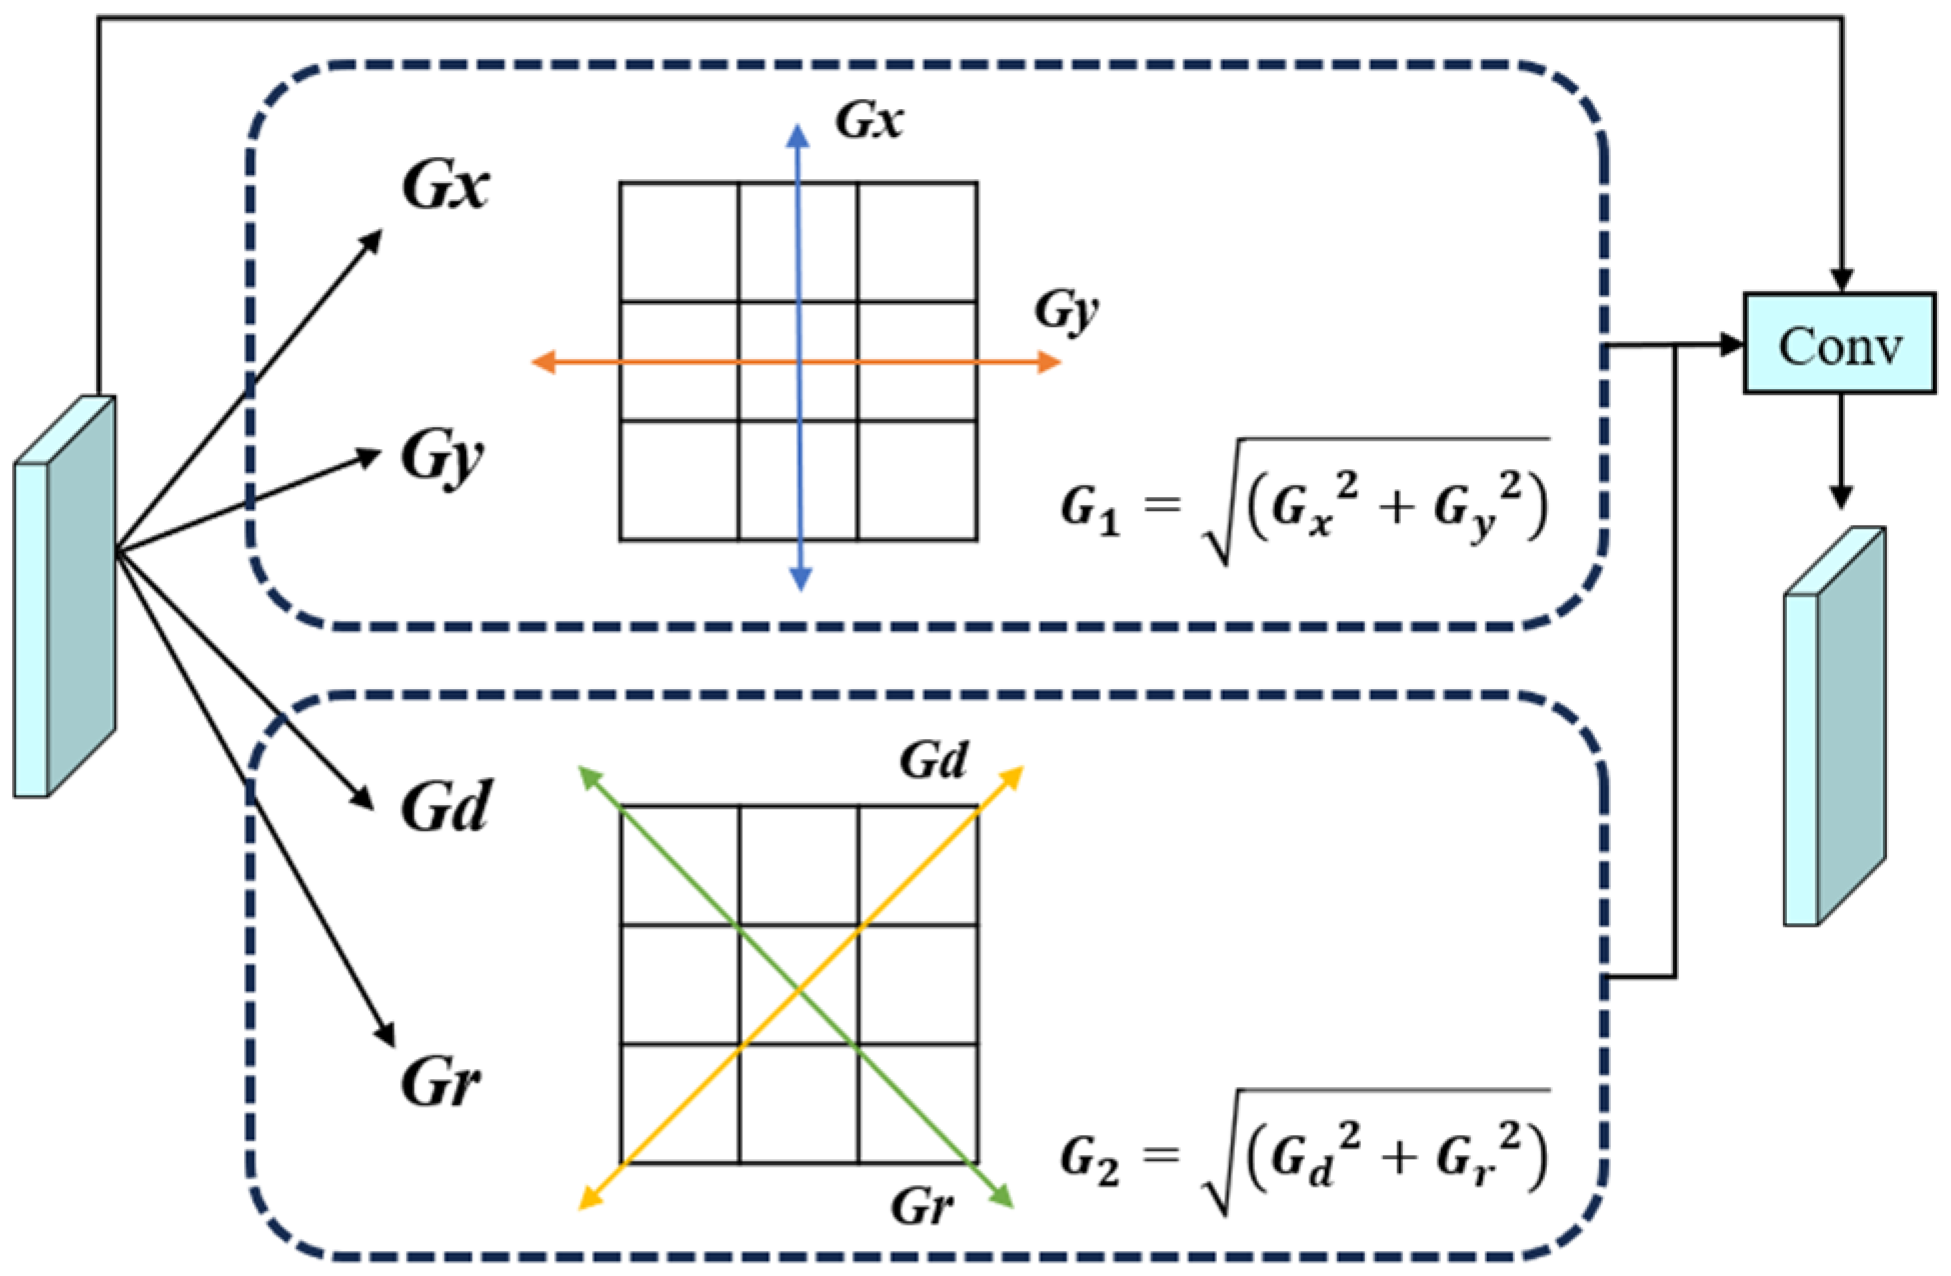
To enhance edge-aware feature learning, an EdgeDetect module (Figure 7) is employed after the CBAM_s block, which uses multi-directional gradient information to refine cropland boundaries. The module applies four Sobel filters to detect edges along horizontal, vertical, and two diagonal directions (45° and 135°). The output feature map Out can be calculated as follows:
O u t = { [ s o b e l 1 ( x ) 2 ] + [ s o b e l 2 ( x ) 2 ] } + { [ s o b e l 3 ( x ) 2 ] + [ s o b e l 4 ( x ) 2 ] }
where sobel1–4 represent the convolutional operations with Sobel kernels of four directions, and x denotes the input feature map. These kernels focus on the gradient magnitudes aligned with common cropland geometries such as rectangular fields with orthogonal or diagonal boundaries.
The EdgeDetect module forms a cascaded refinement pipeline after CBAM_s as follows:
  • Semantic enhancement. CBAM_s prioritizes cropland regions via channel-axial attention.
  • Spatial localization. Multi-directional Sobel operations extract gradient cues of field edges.
  • Boundary refinement. Gradient features are fused and normalized to suppress noise while sharpening the edges.
This design compensates for edge detail loss in axial attention such as irregular boundaries in fragmented plots and mitigates spectral confusion in low-contrast arid landscapes. By explicitly considering geometric characteristics, the module improves robustness to edge blurring caused by mixed pixels or cropland heterogeneity.

2.3.5. Evaluation Metrics

We employ some widely used metrics to evaluate the performance of models, which include Precision, Recall, F1-Score, IoU (Intersection over Union), AUC (Area Under the Curve), and ROC (Receiver Operating Characteristic) as follows:
R e c a l l = T P T P + F N
P r e c i s i o n = T P T P + F P
I o U = T P T P + F P + F N
F 1 - S c o r e = 2 T P 2 T P + F P + F N
T P R = T P T P + F N
F P R = F P F P + T N
where TP denotes the correctly classified cropland pixels, TN is the correctly classified background pixels, FP refers to the misclassified cropland pixels, and FN represents the misclassified background pixels. Precision is used to measure the reliability of positive identifications. Recall is used to assess the model’s ability to identify cropland pixels completely. The F1-Score is a harmonic mean of Recall and Precision to provide a comprehensive performance measure. IoU is calculated as the overlap area between the classified and ground-truth areas divided by the union, which is used to evaluate spatial alignment accuracy of the classified and ground-truth areas. The relationship of False Positive Rate (FPR) and True Positive Rate (TPR) is plotted by ROC curve, and the AUC is used to assess the overall classification ability of the model.

2.3.6. Parameters

We carried out the experiments on a Windows 10 system with PyTorch2.3.0, utilizing a CPU of Intel i7-9750H, a GPU of NVIDIA GeForce GTX 1650, and 32.0 GB RAM. All models were trained with uniform hyperparameters including the AdamW optimizer, cosine annealing for learning rate decay, an initial learning rate of 0.0001, a batch size of 4, and 100 training epochs. To address class imbalance and enhance boundary sensitivity, a hybrid loss combining Focal Loss and Dice Loss [55] was employed as follows:
F o c a l   L o s s   =   α t ( 1     p t ) γ   l o g ( p t )
D i c e   L o s s = 1 [ 2     Σ ( p i     g i ) + ε ] [ Σ ( p i ) + Σ ( g i ) + ε ]
where αt is a balancing factor, pt denotes the predicted probability for the positive class of cropland, γ modulates the focus on hard examples, gi and pi are the ground truth and predicted probability for the ith pixel, and ϵ ensures numerical stability.

3. Results

3.1. Ablation Experiments

To evaluate the contribution of the proposed architectural design, we conducted some ablation experiments on the following variants: (1) VGG16-U-Net++ (CNN-only single encoder), (2) RMT-U-Net++ (Transformer-only single encoder), (3) U-Net++ (single-encoder baseline), and (4) the proposed Dual-Encoder U-Net++ (VGG + RMT dual encoder). All variants were trained and evaluated with the same training data, and performance was compared using Precision, Recall, F1-Score, and IoU.
As shown in Table 2, the proposed Dual-Encoder U-Net++ achieves the best performance for cropland extraction, with an IoU of 78.46% and an F1-Score of 87.93%, outperforming VGG16-U-Net++, RMT-U-Net++, and the U-Net++ decoder baseline. It also attains a high Recall of 91.55% while maintaining competitive Precision (84.58%), indicating reduced omission errors without introducing excessive false positives. These results confirm that combining CNN-based local features with Transformer-based global context improves the accuracy and robustness of cropland extraction.
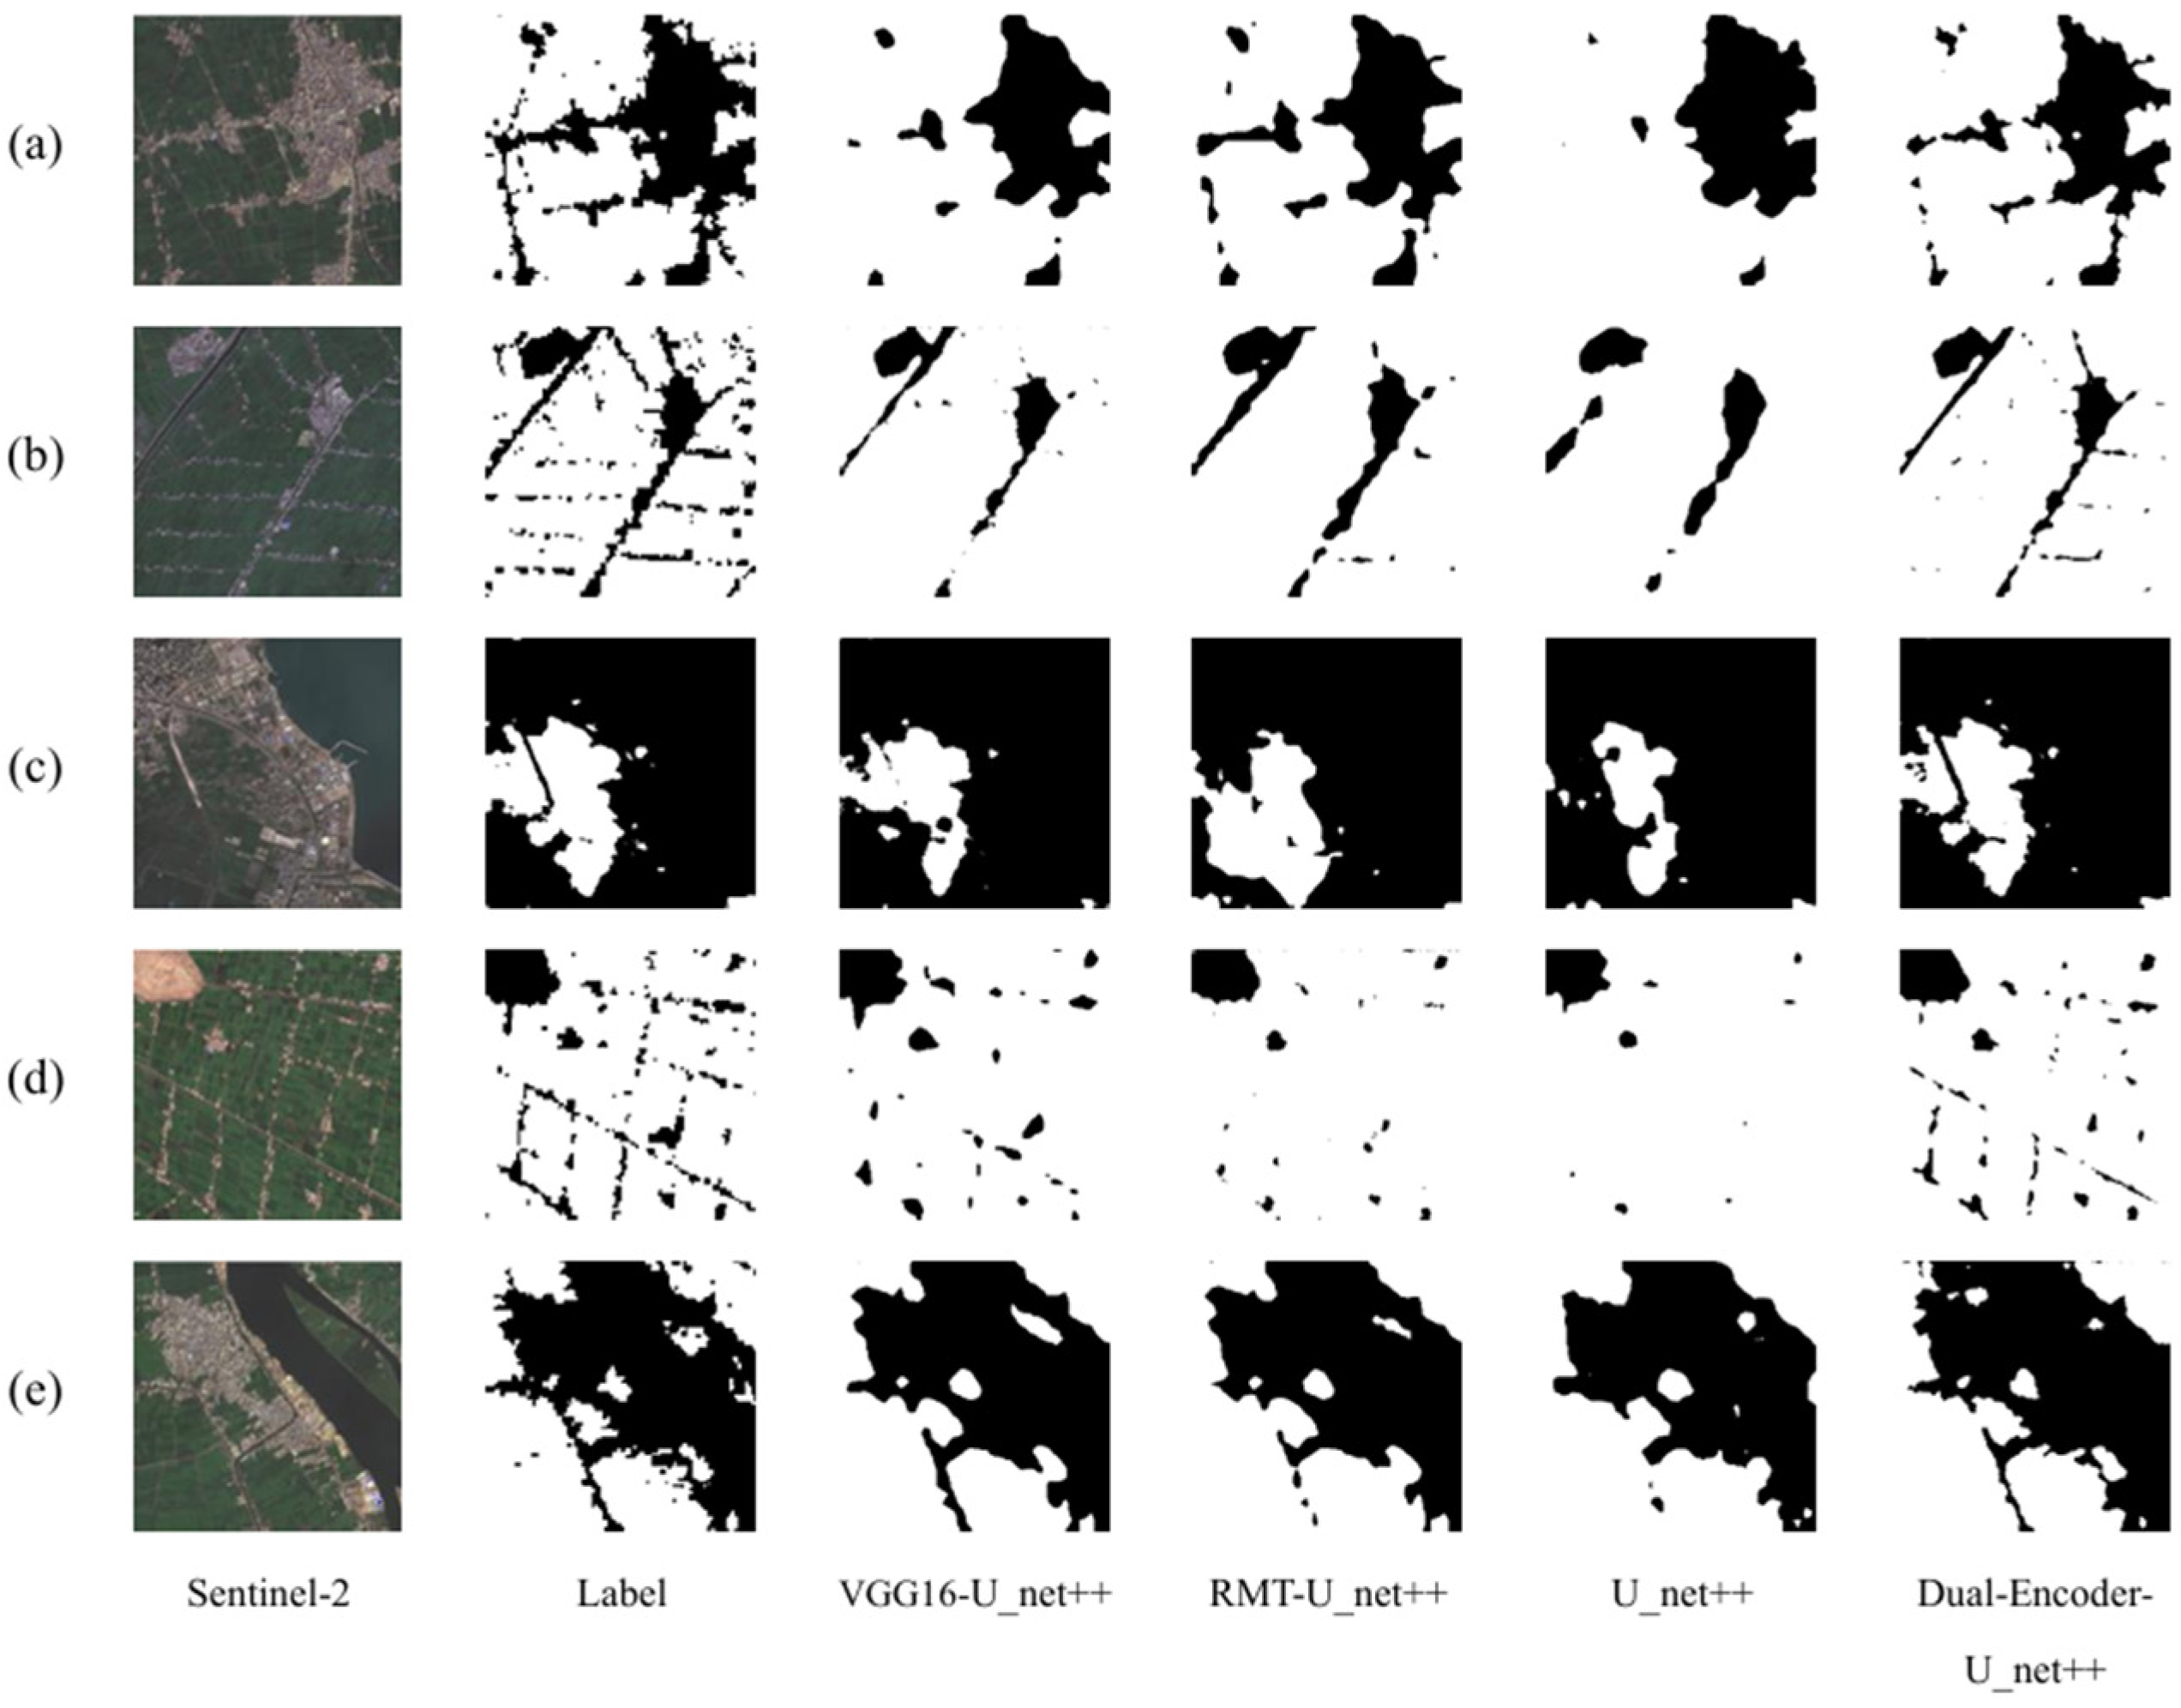
Figure 8 shows the visual comparison of single-encoder and dual-encoder variants for ablation analysis. Figure 8a presents a relatively compact cropland patch, where all models obtain the main parcel, but the single-encoder variants show more fragmented edges and false predictions than the proposed method. In Figure 8b,d, which contain thin, linear cropland structures, VGG16-U-Net++ produces noticeable scattered noise and discontinuities, while RMT-U-Net++ and the U-Net++ decoder baseline still exhibit broken segments. In contrast, the Dual-Encoder U-Net++ better preserves the continuity of these narrow features. In Figure 8c, all methods delineate the dominant cropland region, yet the dual-encoder output is closer to the label in terms of boundary integrity and internal consistency. The Dual-Encoder U-Net++ provides the most complete shape reconstruction with fewer holes and boundary defects, as shown in Figure 8e, which involves a large and morphologically complex cropland area. Overall, these visual comparisons indicate that combining CNN-based local detail encoding with Transformer-based global context improves both boundary delineation and robustness in different backgrounds for cropland mapping.
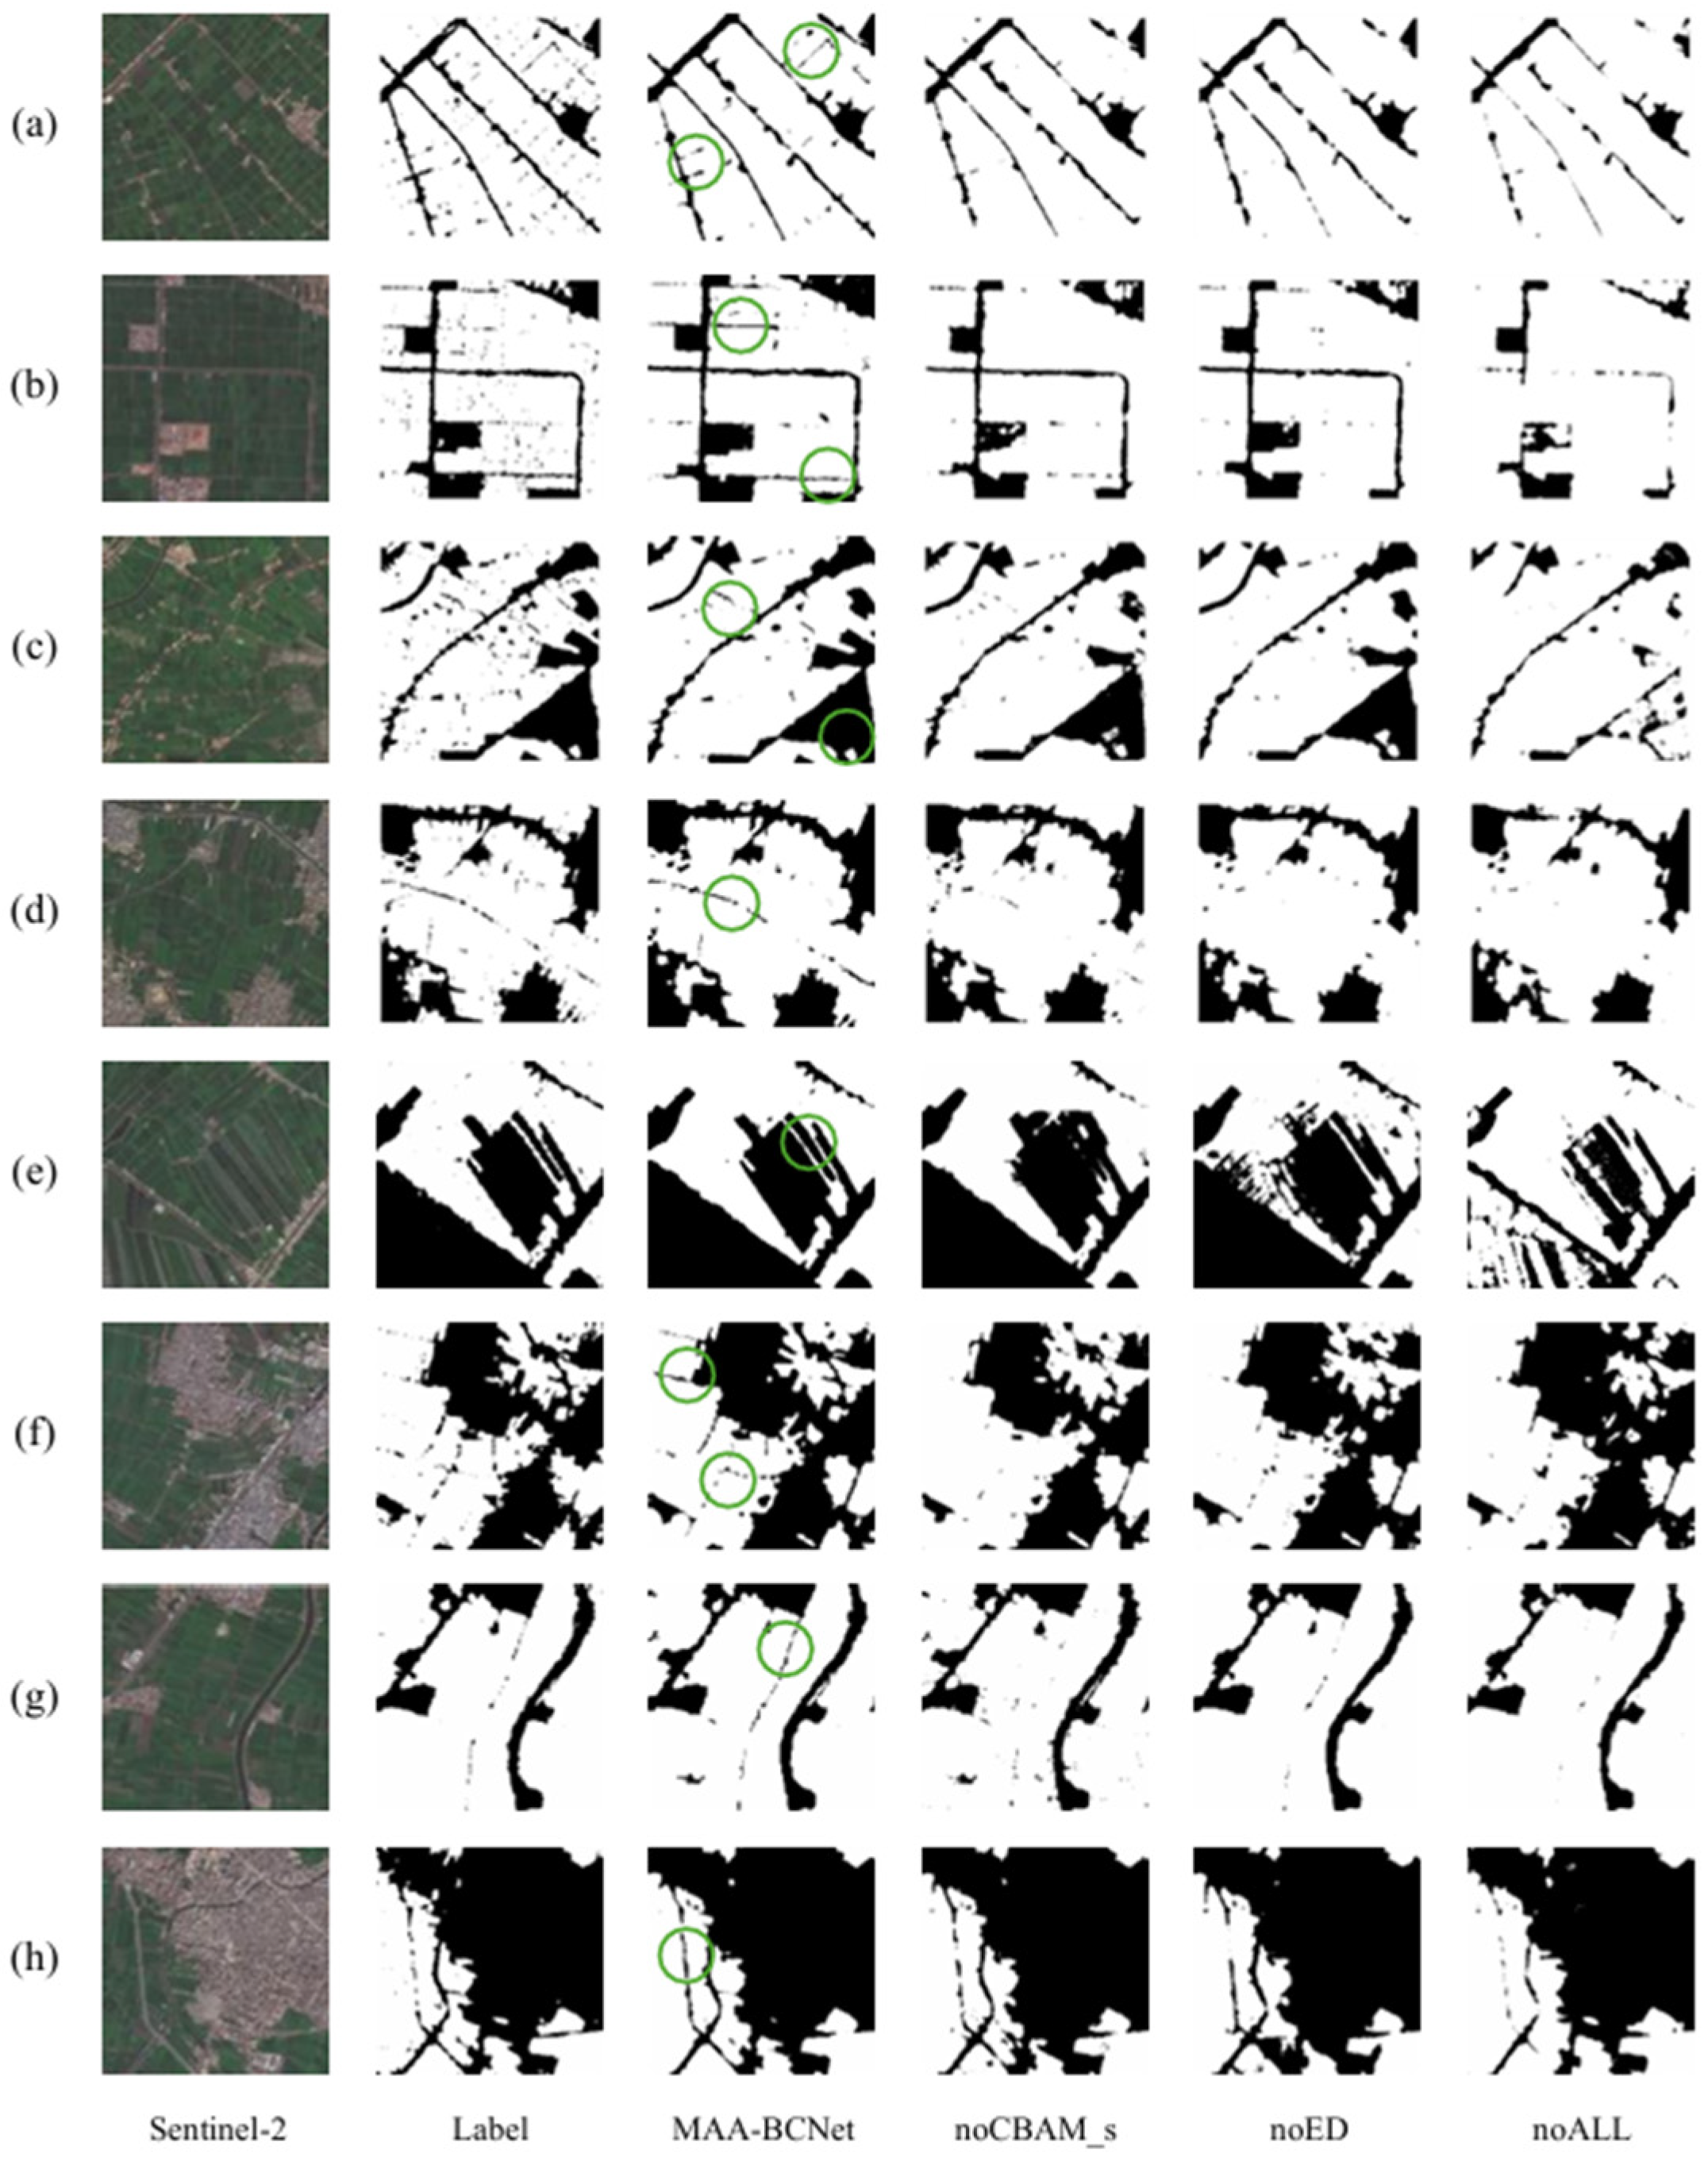
To assess the effectiveness and accuracy of modules proposed in this study, ablation experiments were conducted on models including: (1) the original MAA-BCNet, (2) MAA-BCNet without the EdgeDetect (ED) module, (3) MAA-BCNet without the CBAM_s module, and (4) MAA-BCNet without both modules.
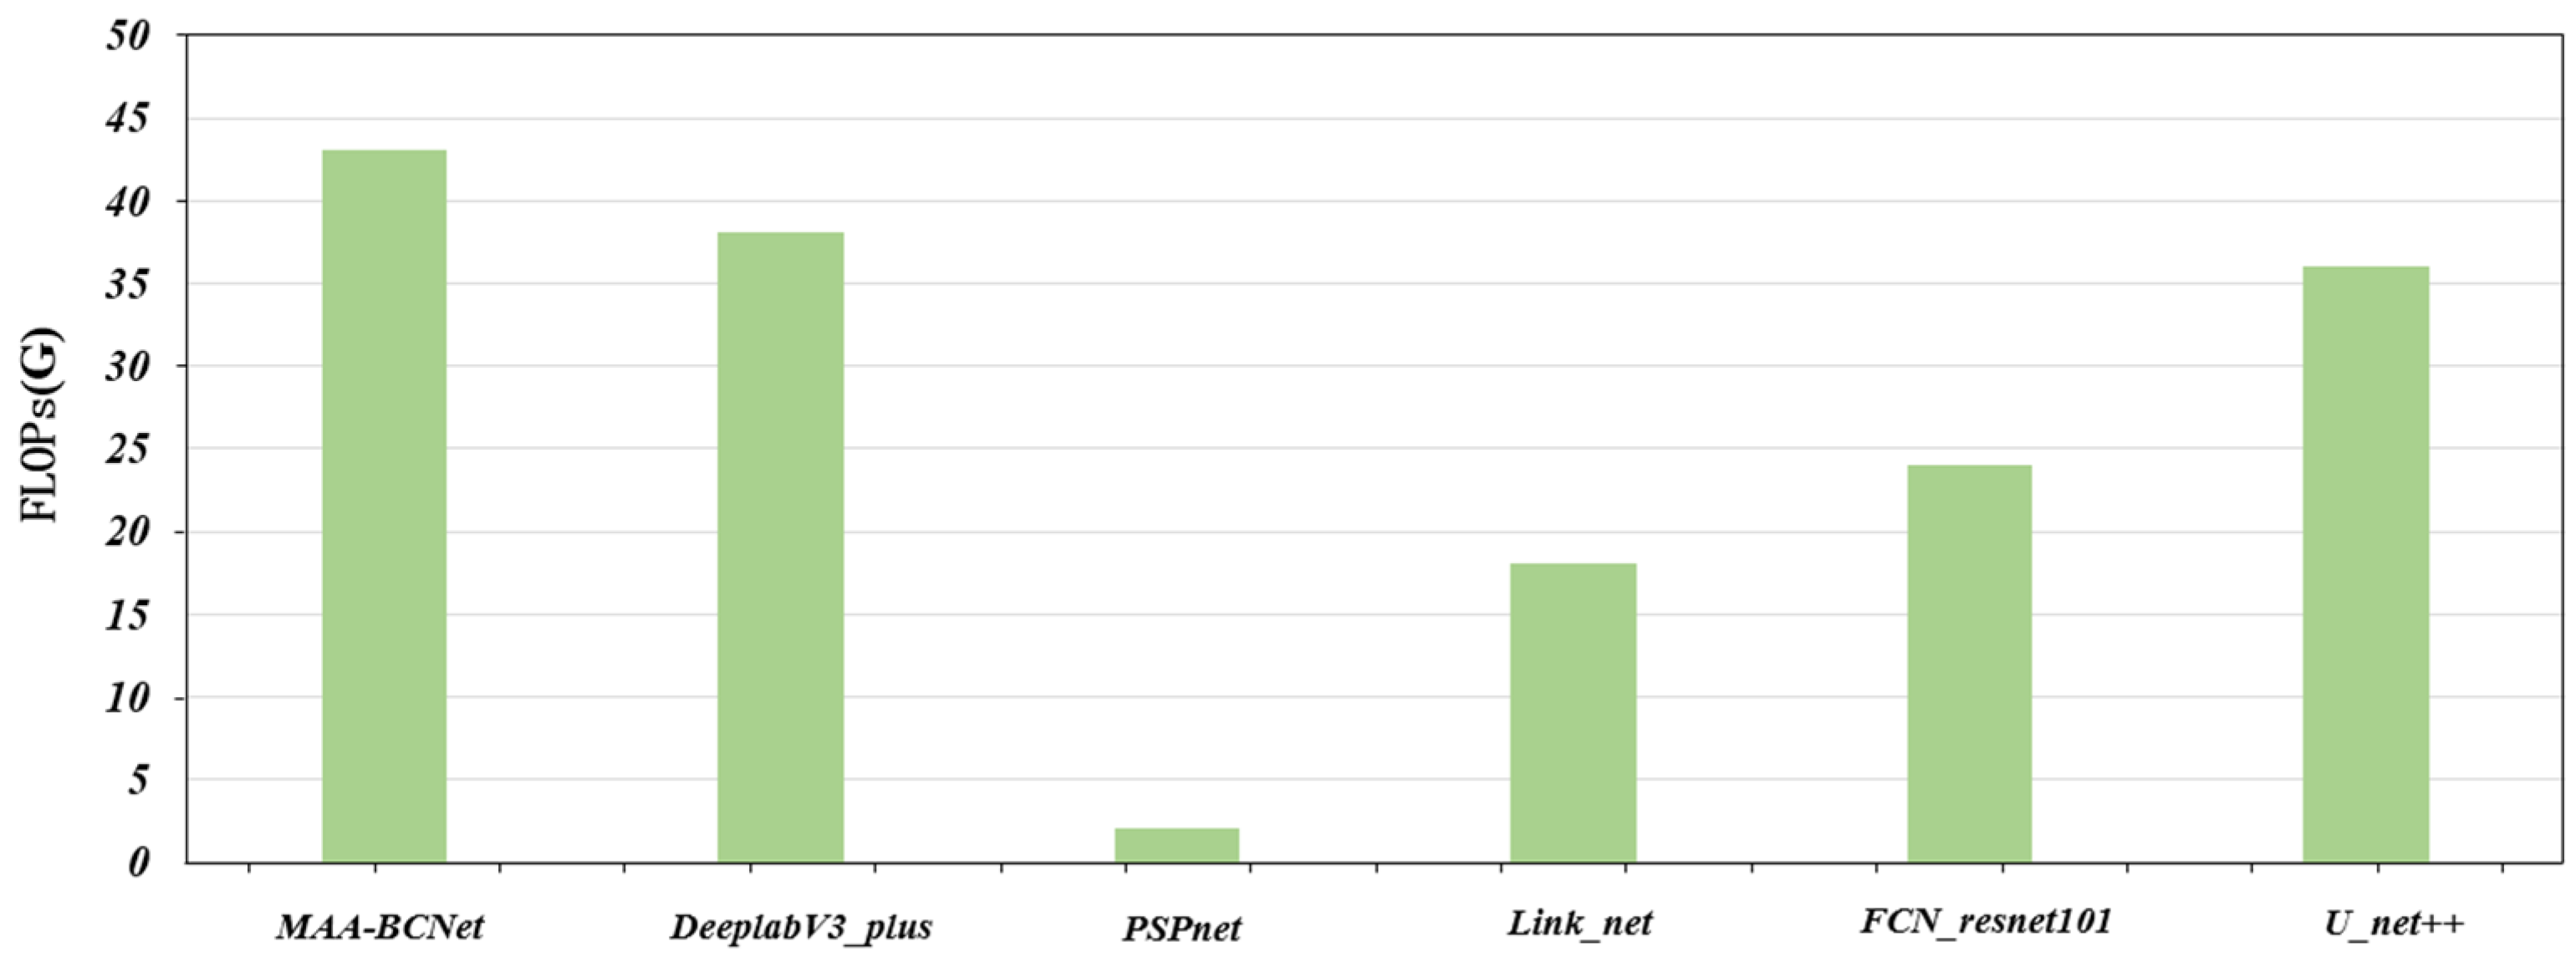
As shown in Table 3, the full MAA-BCNet, which integrates with both CBAM_s and ED modules, achieved an IoU of 86.57%, outperforming the noCBAM_s, noED, and noALL models by 3.05%, 3.83%, and 8.11%, respectively. The results show that the two proposed modules have significantly improved classification performance, enabling the model to accurately classify not only well-defined cropland parcels but also sparse or morphologically complex patterns. The inclusion of the CBAM_s module improved Precision and Recall to 87.51% and 93.82%, representing gains of 2.93% and 2.27% over the model without CBAM_s. This demonstrates that CBAM_s effectively suppresses irrelevant features and reduces both commission and omission errors of cropland classification. The ED module enhanced the model’s F1-Score and IoU to 91.02% and 83.52%, reflecting improvements of 3.09% and 5.06% relative to the baseline without ED. These results demonstrated the ED module’s effectiveness in improving the accuracy and reliability of cropland extraction. In terms of FLOPs, incorporating CBAM_s and ED only slightly increases the computational cost from 38.68 G to 43.27 G, yet it yields a substantial accuracy improvement, with IoU rising from 78.46% to 86.57% and F1-Score increasing from 87.93% to 92.80%, demonstrating a favorable performance–complexity trade-off.
As illustrated in Figure 9, the representative images with complex distributions of cropland and background features are selected to compare the models in boundary delineation and irregular parcel extraction. In the labeling and extracted maps, white and black regions denote cultivated and non-cultivated areas, respectively. Figure 9a is the densely cultivated flat terrain near towns with homogeneous vegetation coverage. Figure 9b,c contain diverse non-cultivated shapes including linear roads, rectangular built-up areas, and urban areas that demand precise boundary segmentation. Figure 9d–f present complex land cover patterns incorporating linear canals, fragmented built-up areas, and artificial grasslands, posing great challenges for cropland identification. Figure 9g,h exhibit smaller cropland proportions with complex boundary configurations requiring refined detection capabilities.
According to the cropland extraction results in Figure 9, Figure 9a exhibits dense cultivation with relatively homogeneous land cover types, leading to minimal performance discrepancies among all models, where road and building edges are accurately segmented. In Figure 9b,c, characterized by diverse non-cultivated shapes, the baseline model demonstrates the poorest classification performance, while the three enhanced architectures significantly reduce misclassification errors, particularly in the triangular built-up area at the upper-right corner. For Figure 9d,f, which exhibit heterogeneous landscapes, the baseline model frequently misclassifies artificial grasslands as cropland and fails to fully capture linear canal structures. The noED variant effectively suppresses background noise, and the noCBAM_s variant retains fine spatial details. In Figure 9g,h, where cropland occupies only a small portion of the area, the full MAA-BCNet architecture delivers the most accurate boundary delineation, particularly around buildings and narrow roads. By integrating both the CBAM_s and ED modules, MAA-BCNet achieves optimal performance, minimizing both commission and omission errors in cropland segmentation. The results confirm the complementary advantages of two modules for complex arid-region landscapes.

3.2. Comparison Experiments

Under identical network architecture and training settings, we conducted some experiments by varying only the input feature composition to evaluate segmentation accuracy and computational complexity as in Table 4. The result by using the ten raw spectral bands is F1 = 0.9172 and IoU = 0.8526. When the input is replaced with the top-K selected nine-dimensional feature set (B8a, B11, B12, and six spectral indices), F1 and IoU further increase to 0.9297 and 0.8682, respectively, accompanied by a slight reduction in FLOPs, suggesting that removing redundant information facilitates more efficient discriminative learning. Using nine spectral indices only produces slightly lower accuracy than the top-K mixed features. After further reducing the nine-dimensional feature set to three principal components via PCA, the model has a minor decrease in F1 and IoU. Therefore, we use the nine top-K-selected optimal features as the model input for the best performance.
To further evaluate the advantages and effectiveness of the proposed MAA-BCNet for cropland extraction, five widely used semantic segmentation models, including DeepLabV3+, PSPNet, LinkNet, FCN-ResNet101, and U-Net++, were employed for comparative experiments. All models were trained and tested by the same dataset. The proposed MAA-BCNet outperforms other models across all evaluation metrics, as shown in Table 5. In particular, it improves the F1-Score by 3.32%, 4.73%, 5.54%, 8.27%, and 3.51% over DeepLabV3+, PSPNet, LinkNet, FCN-ResNet101, and U-Net++, respectively. These advancements indicate a substantial reduction in commission and omission errors for the croplands. The IoU values are also higher by 3.92%, 6.04%, 7.10%, 7.95%, and 4.66%. Although DeepLabV3+ achieves relatively high Recall, its lower Precision indicates a higher rate of misclassification, resulting in more false positives compared to MAA-BCNet. FCN-ResNet101 has the weakest performance, particularly in segmenting cropland parcels with complex spatial features in Egypt.
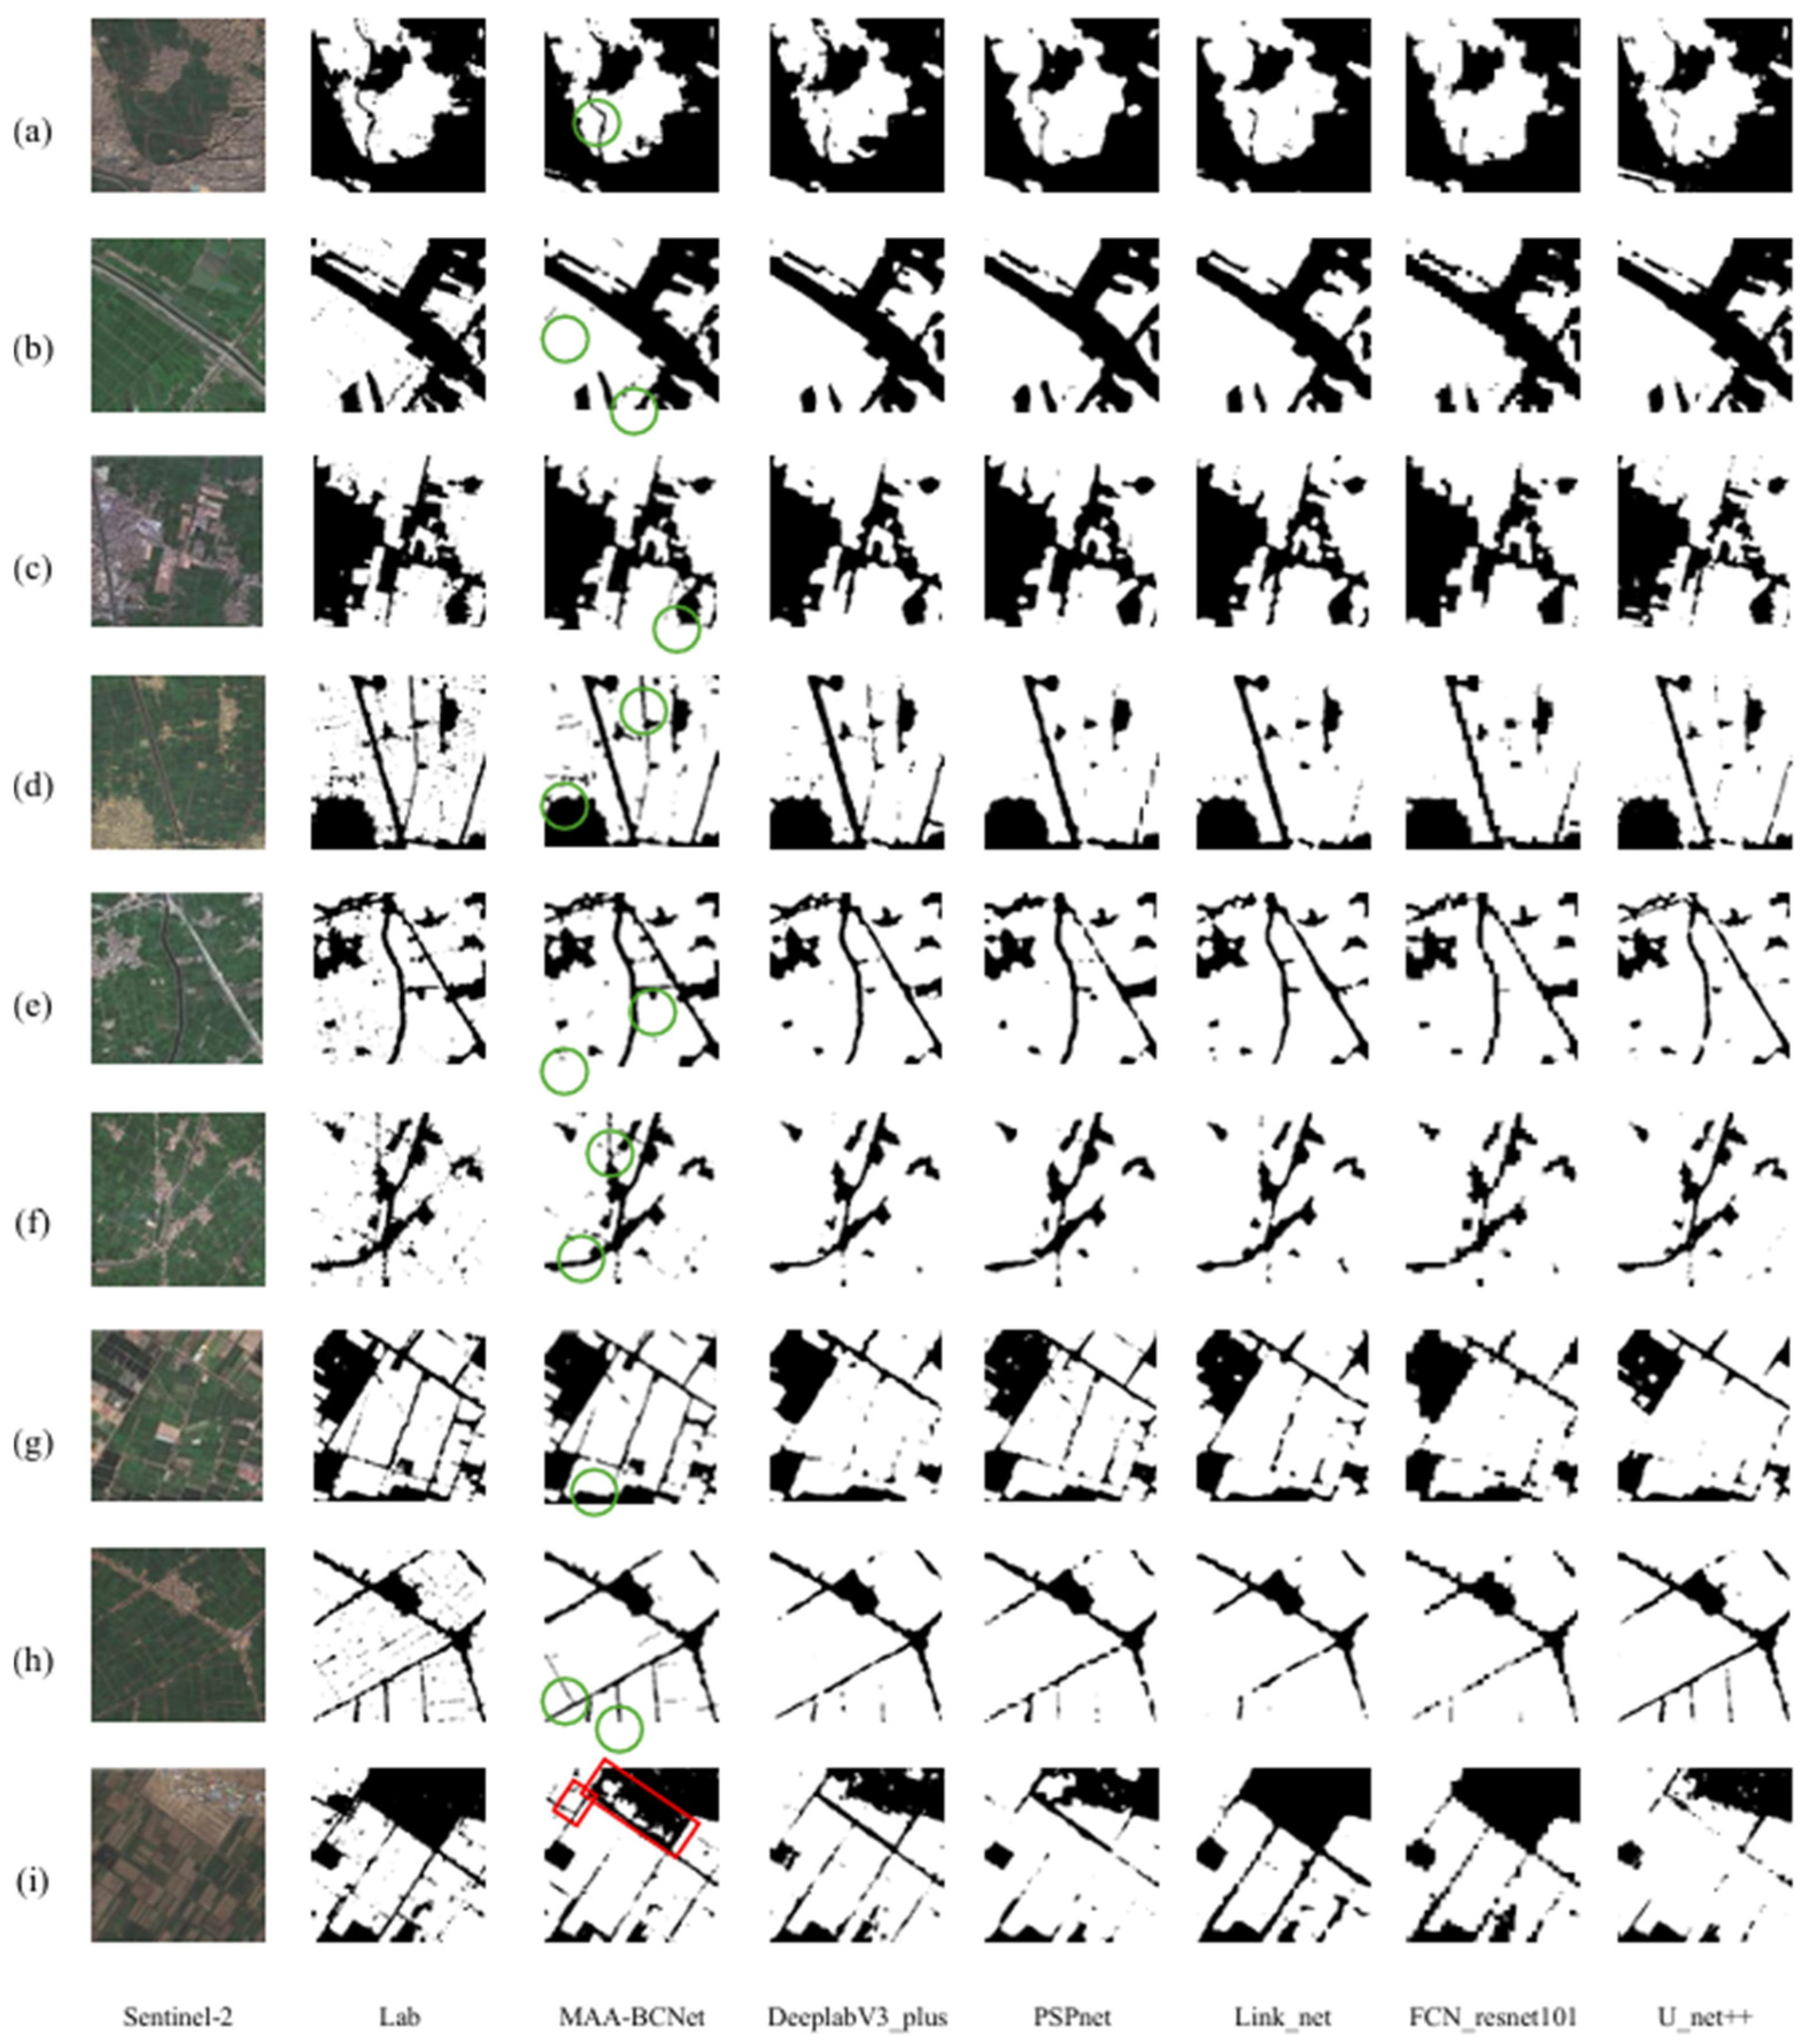
To visually compare MAA-BCNet with other models, the representative images with varying landscapes were selected for classification result comparison, as shown in Figure 10. Figure 10a–c contain a low proportion of cropland, dominated by background features. The reduced parcel size and irregular boundaries in these regions require refined detection capability. Figure 10d–f include a mix of linear, circular, and irregularly shaped built-up areas along with canals, increasing segmentation difficulty. Figure 10g,h are characterized by densely distributed cultivated parcels with subtle intra-class variations.
As illustrated in Figure 10, for Figure 10a–c, which contain geometrically diverse non-cultivated features, MAA-BCNet, DeepLabV3+, and PSPNet effectively delineate narrow roads adjacent to cropland. MAA-BCNet exhibits the fewest commission and omission errors. LinkNet and FCN-ResNet101 show inferior performance, often misclassifying narrow roads and fragmented bare soils or built-up regions. In Figure 10d–f, the proposed MAA-BCNet outperforms all other models in distinguishing linear transportation networks, canals, and irregularly shaped cropland parcels. It demonstrates superior spatial precision and boundary delineation of MAA-BCNet, especially in areas with complex topographic and spectral variations. For densely cultivated Figure 10g,h, although all models achieve generally satisfactory segmentation results, only MAA-BCNet and U-Net++ successfully extract subtle features such as narrow roads and fine paddy field boundaries, which confirms their strength in handling spatial detail in high-density agricultural landscapes. Figure 10i illustrates a representative misclassification case of MAA-BCNet. When fallow or non-cultivated cropland appears in the imagery, MAA-BCNet tends to incorrectly label shrubland as cropland. This is likely because sparse shrubs exhibit vegetation-like spectra and patchy textures at a 10 m resolution, and their edge-adjacent mosaics can blur the cropland–non-cropland boundary, causing false positives. In contrast, Link_net and FCN_resnet101 mitigate this confusion more effectively, which may be attributed to their stronger reliance on backbone-derived high-level semantic representations and spectral–statistical discrimination.
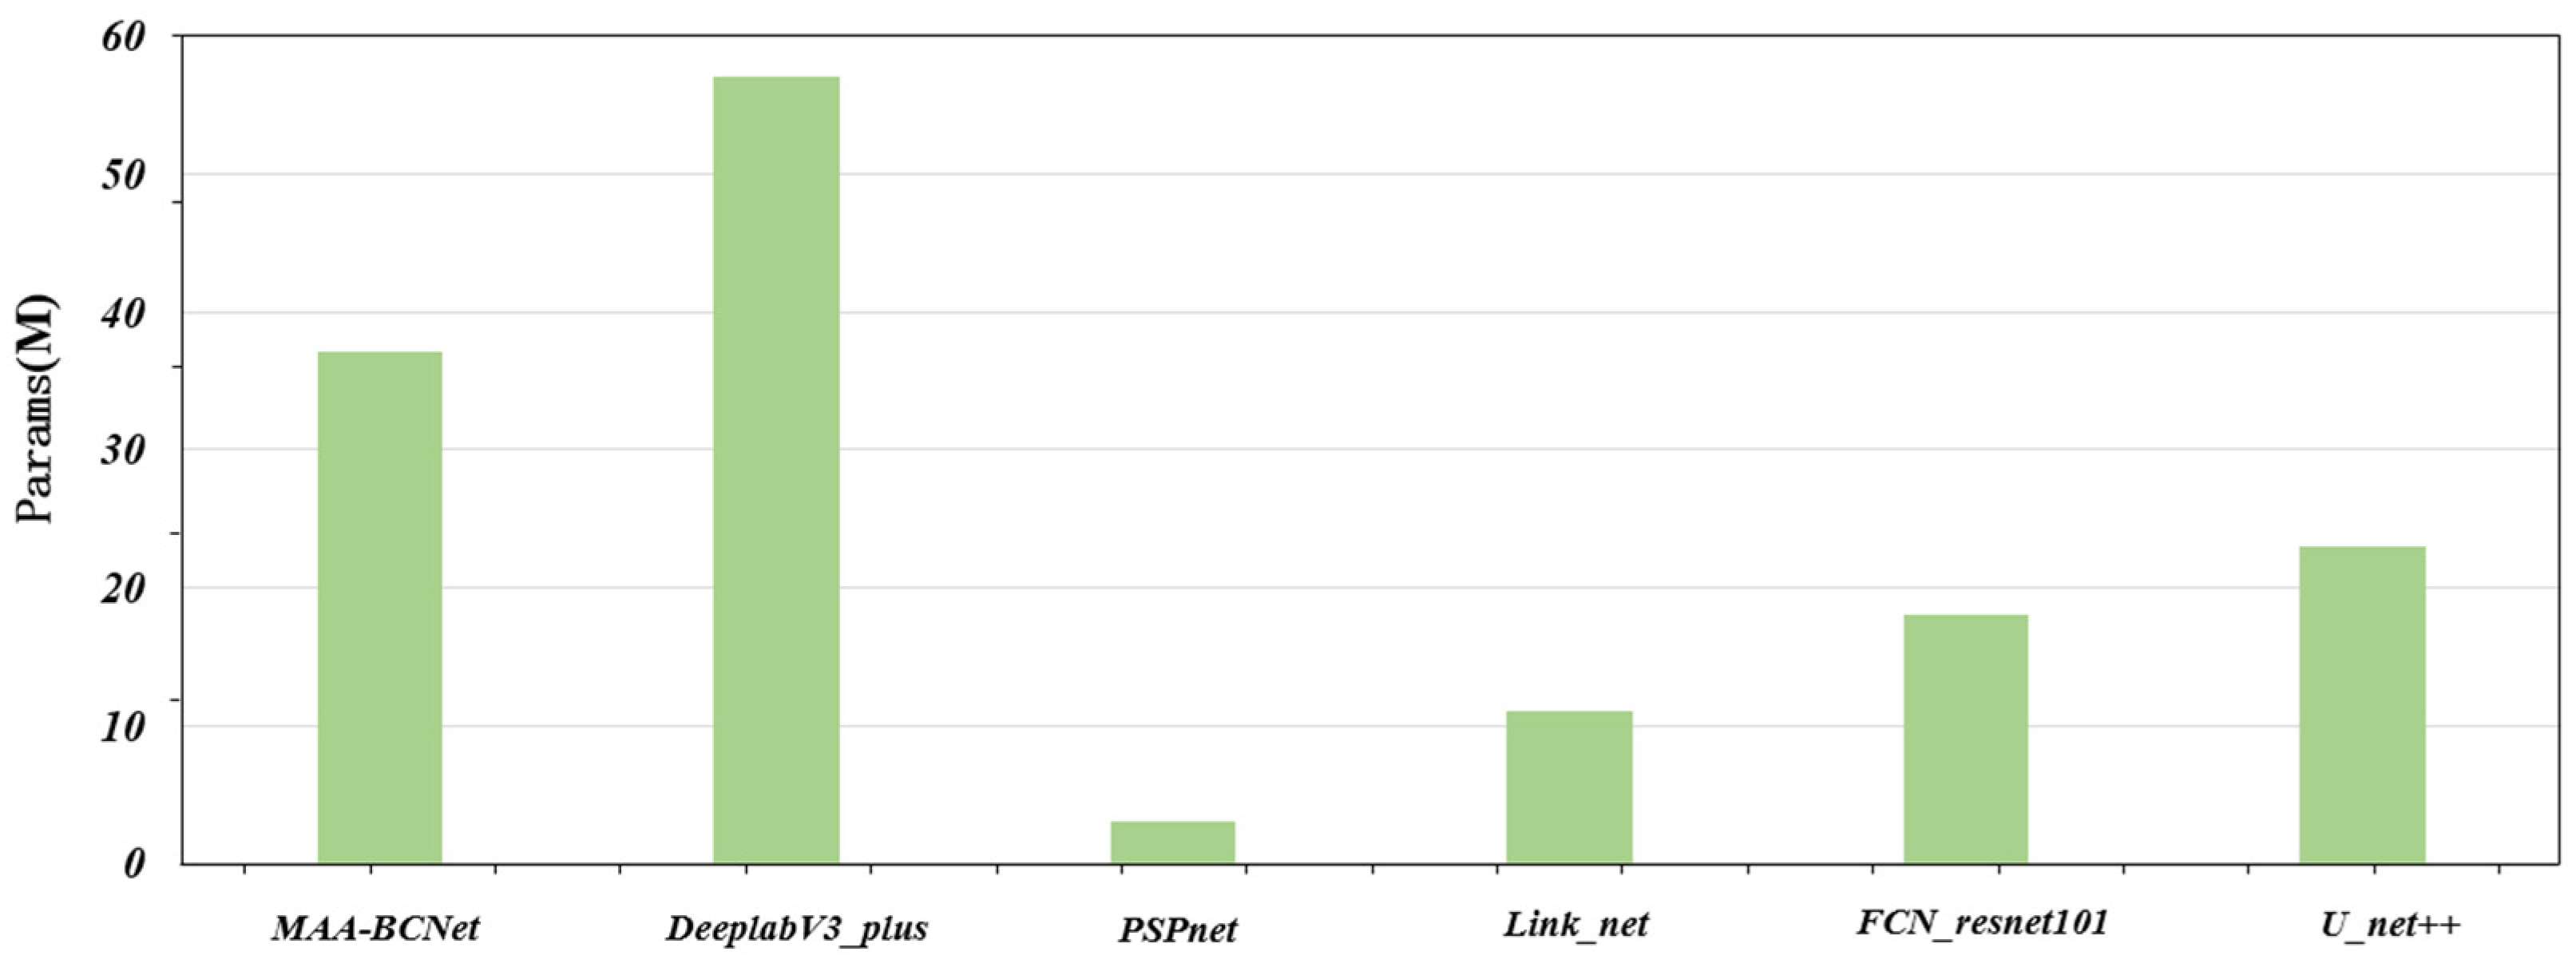
In this study, the number of parameters and FLOPs (floating-point operations) of the proposed MAA-BCNet and the baseline models were systematically computed and analyzed to evaluate computational cost and efficiency for cropland extraction. The results are shown in Figure 11 and Figure 12. MAA-BCNet ranks third in terms of parameter count and first in terms of FLOPs among all models, indicating a relatively high computational complexity. Although its computational demand is relatively high, MAA-BCNet achieves the best performance in key metrics such as IoU, F1-Score, and Precision, demonstrating strong capability in feature extraction and spatial information fusion. This advantage is likely attributed to the multi-scale feature fusion strategy and efficient attention mechanisms adopted in the network, which improve segmentation accuracy and generalization at the expense of increased computational cost. Overall, compared with other models, MAA-BCNet achieves a favorable trade-off between performance and computational resource consumption.
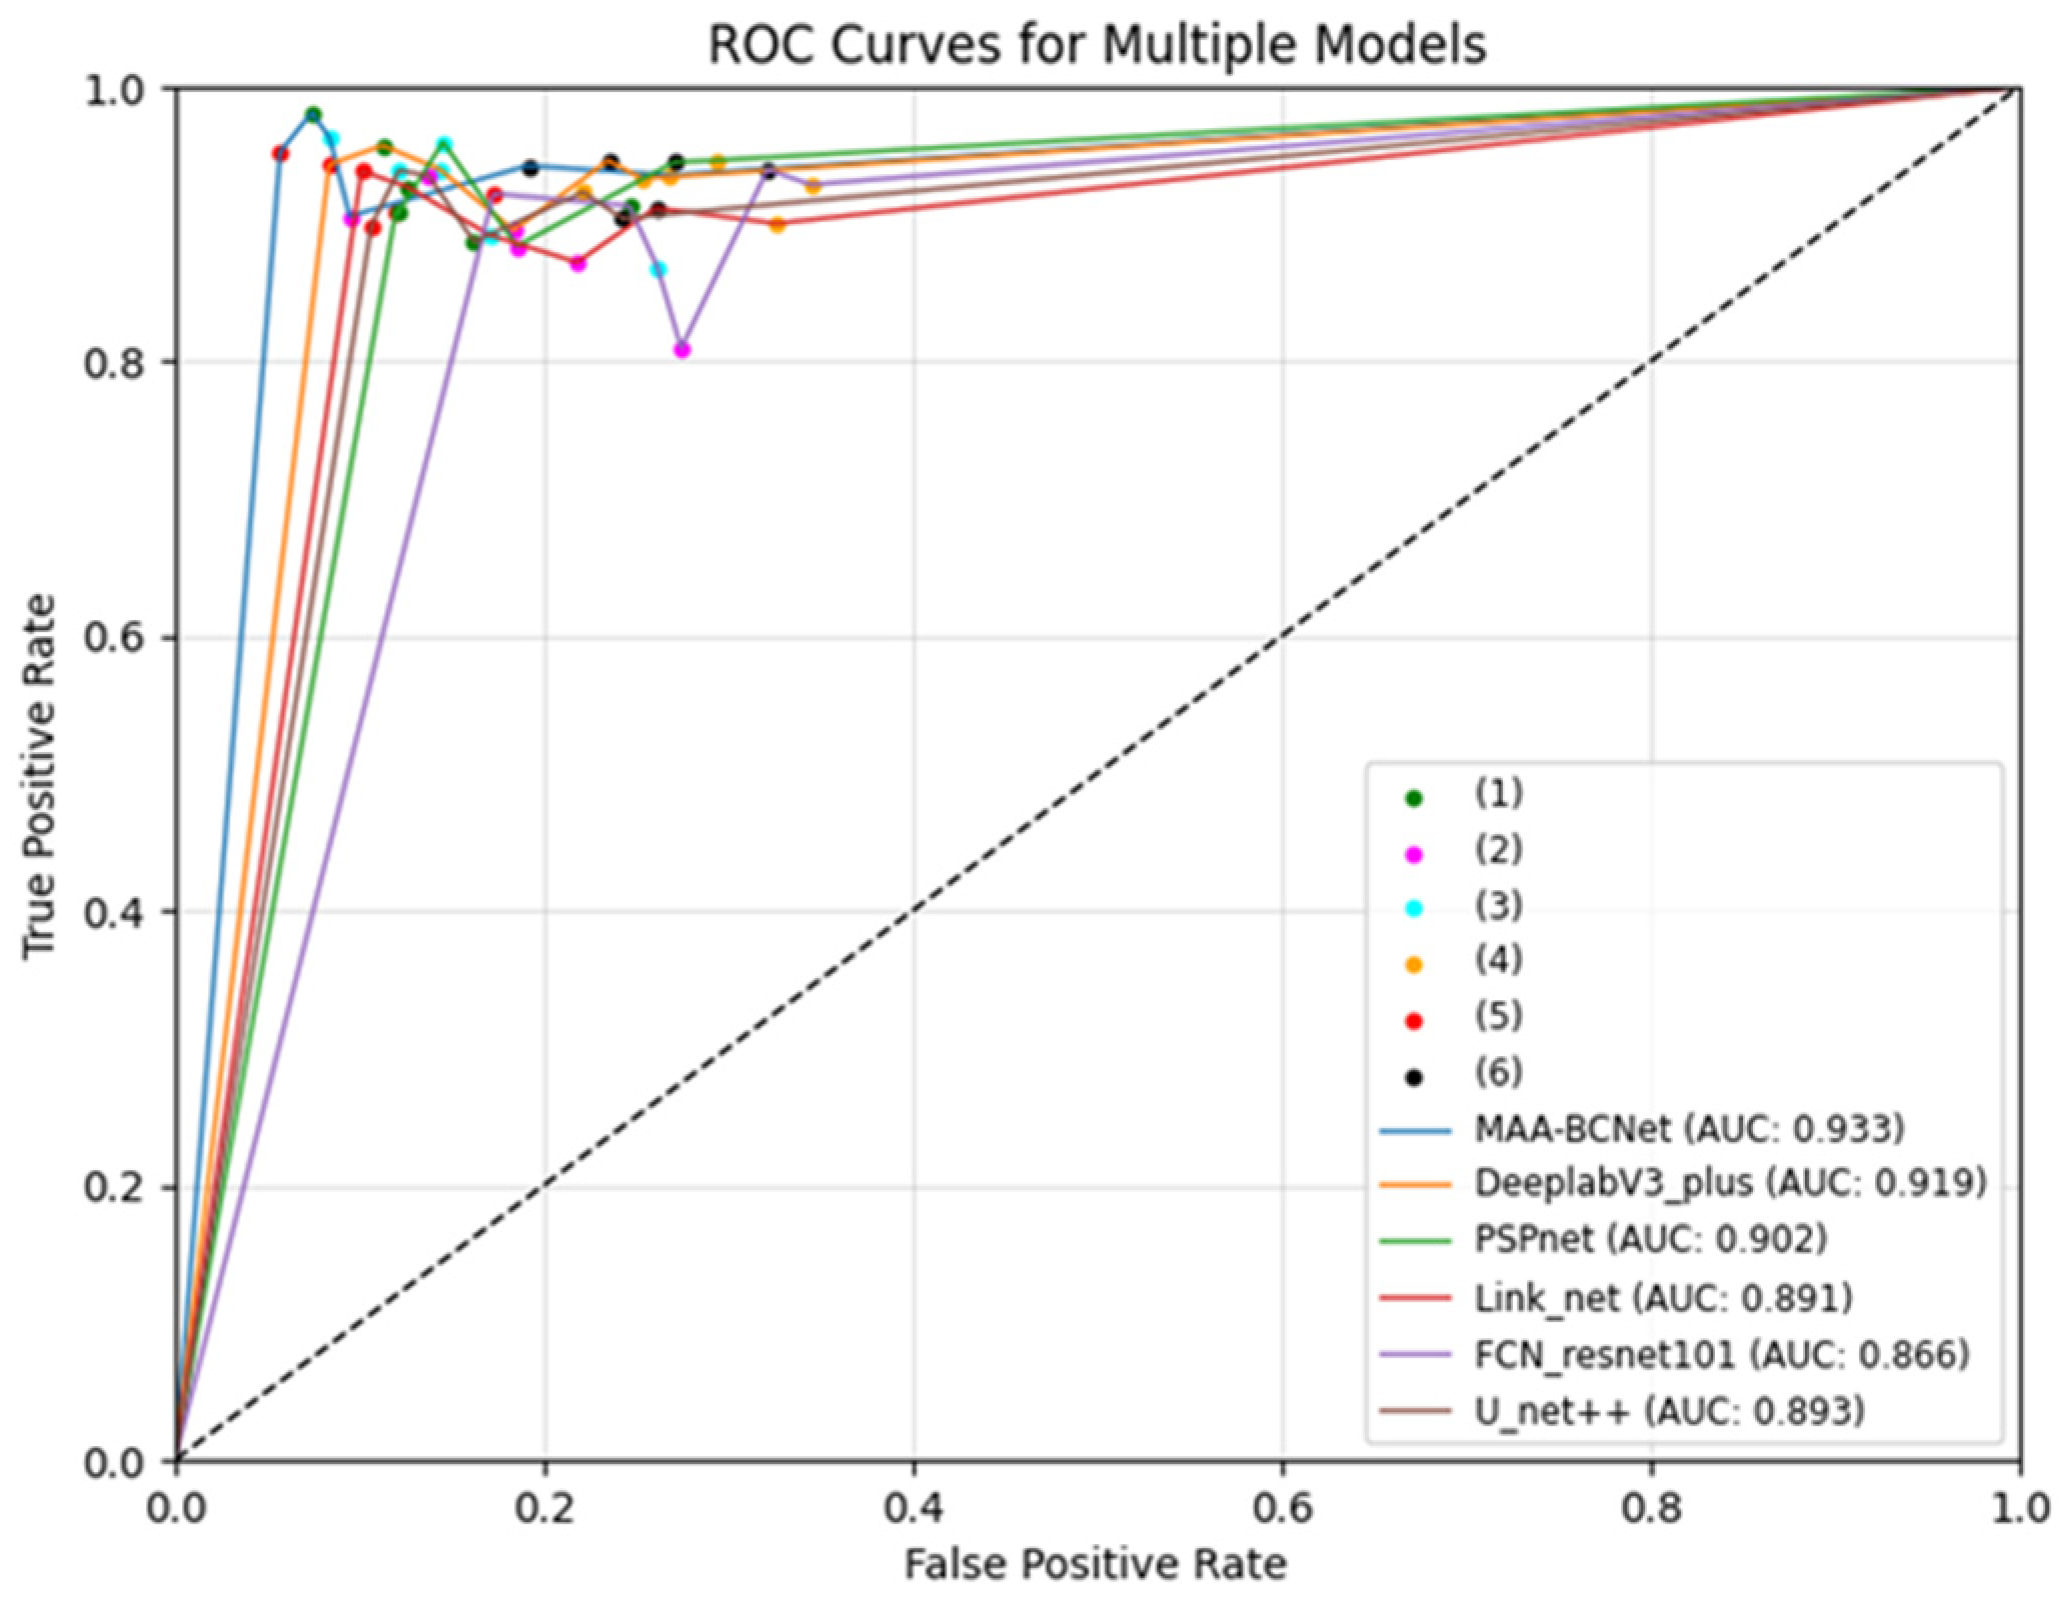
Figure 13 shows the ROC curves for comparing the classification performances of different models. Six subsets of the test dataset were constructed by selecting images with croplands and backgrounds similar to those challenging scenes in Figure 10a–f. Each model was evaluated on these subsets, and the corresponding AUC values were obtained. As shown in Figure 13, LinkNet consistently showed the weakest performance across all six test subsets (1)–(6), characterized by higher FPR and lower TPR compared to other models. PSPNet exhibited the lowest TPR on test subset (2), indicating its limited ability to distinguish narrow linear features such as roads and canals. In test subset (4), all models demonstrated lower TPR values due to the presence of irregular and complex backgrounds that increased classification difficulty. By comparing ROC curves and AUC values, MAA-BCNet consistently outperformed other models across all six subsets, which confirms its superior ability to delineate cropland parcel boundaries with higher accuracy and robustness in varying complex landscapes.
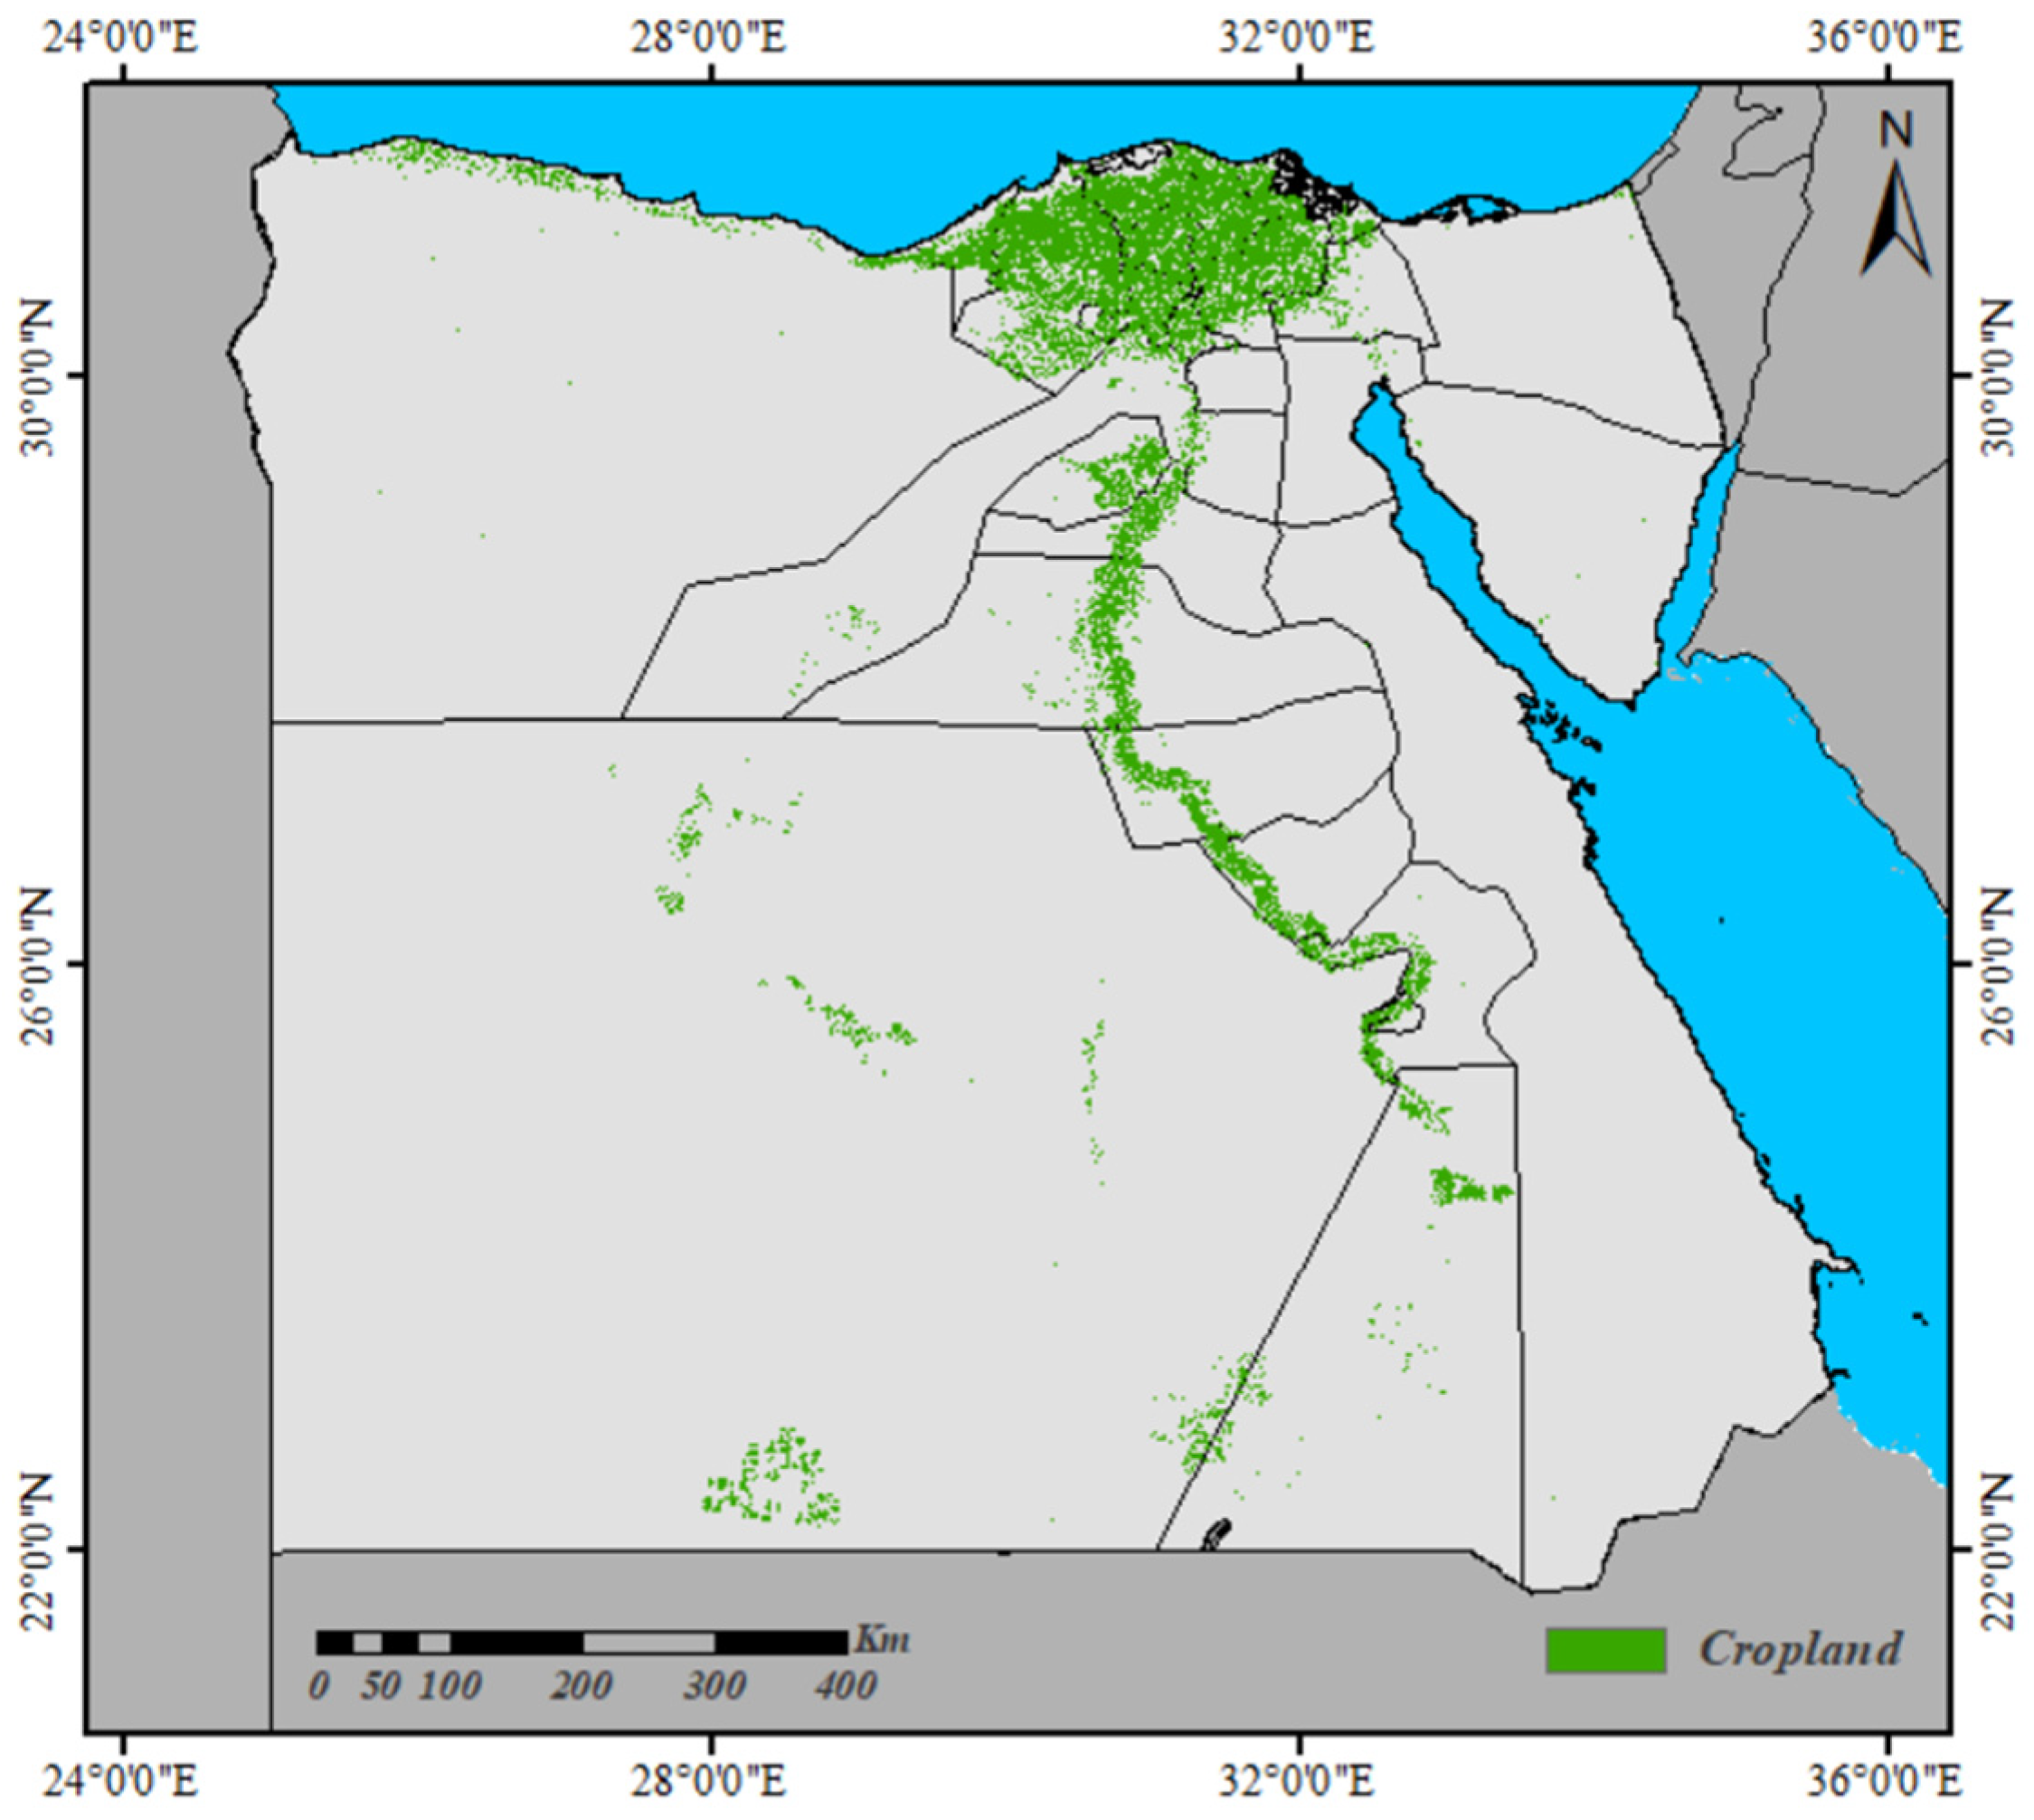
We used the trained MAA-BCNet model to predict cropland using Sentinel-2 imagery across Egypt, resulting in the cropland distribution of Egypt as shown in Figure 14. Egypt’s cropland occupies only a small proportion of the national territory and is strongly constrained by the Nile River and its irrigation system. It is predominantly distributed in a narrow south–north belt along the Nile Valley and becomes highly concentrated in the Nile Delta at the river mouth, which constitutes the largest and most contiguous agricultural core area in the country. In addition, a few scattered oases and artificially irrigated reclamation zones are present in the Western Desert, around the Suez Canal, on the Sinai Peninsula, and along the Red Sea coast.
Although the proposed framework achieves strong performance on the Sentinel-2 dataset over Egypt, there are several limitations. First, the reference labels are derived from visual interpretation, and minor uncertainty may remain along complex or fragmented parcel boundaries. Second, our experiments are conducted on samples from a specific region and period, and extending the training data to additional years and broader geographic settings would help further assess generalization under different conditions. Finally, the dual-encoder and attention-based design improves accuracy but introduces additional computation, and future work could explore more lightweight variants for large-scale areas.

4. Conclusions

MAA-BCNet was developed to improve cropland extraction in Egypt from Sentinel-2 imagery, particularly for fragmented parcels and blurred field boundaries. Quantitative experiments show that the proposed method achieves the best overall segmentation accuracy among the compared baselines, reaching a Precision of 90.77%, a Recall of 94.92%, an F1-Score of 92.80%, and an IoU of 86.57%, while also producing cleaner and more continuous parcel boundaries in complex agricultural scenes. Ablation studies further verify that both the CBAM_s attention refinement and the EdgeDetect boundary enhancement are effective and complementary, and the full model improves IoU from 78.46% to 86.57% compared with the variant without both modules. In terms of efficiency, the full model increases FLOPs only slightly from 38.68 G to 43.27 G relative to the simplest variant, yet it delivers a substantial gain in accuracy, indicating a favorable performance–complexity trade-off. Overall, these results demonstrate that MAA-BCNet provides a robust solution for large-area cropland mapping in Egypt and can support agricultural monitoring and sustainable land management.
Future research can focus on evaluating the generalizability and applicability of MAA-BCNet across more extensive geographic zones and exploring other remote sensing data, such as hyperspectral and SAR imagery, to further improve the model’s performance.

Author Contributions

Conceptualization, H.D. and Y.L.; methodology, H.D. and Y.L.; software, H.D.; validation, H.D., Y.L. and T.S.; formal analysis, L.S.; investigation, M.L. and X.L.; resources, H.W. and Y.G.; data curation, H.D., T.S. and L.S.; writing—original draft preparation, H.D.; writing—review and editing, H.D., Y.L., H.B., V.F. and H.Z.; visualization, H.D. and Y.L.; supervision, Y.L.; project administration, Y.L. and Y.G.; funding acquisition, Y.L. and Y.G. All authors have read and agreed to the published version of the manuscript.

Funding

This work was supported by the National Key R&D Program of China (Grant No. 2023YFE0207900); the National Natural Science Foundation of China (Grant No. 41977394). Heiko Balzter was supported by the Natural Environment Research Council (NERC) through the National Centre for Earth Observation (NCEO) in the UK (Grant No. NE/W004895/1). Vagner G. Ferreira was supported by the National Natural Science Foundation of China (Grant No. W2432026).

Institutional Review Board Statement

Not applicable.

Data Availability Statement

Data will be made available on request.

Acknowledgments

We gratefully acknowledge the Land Satellite Remote Sensing Application Center for providing high-resolution satellite remote sensing data. We also thank Heiko Balzter, Vagner Ferreira, Huiyu Zhou et al. for their valuable suggestions on the experiments and for their help in revising the manuscript.

Conflicts of Interest

The authors declare that they have no known competing financial interests or personal relationships that could have appeared to influence the work reported in this paper.

Abbreviations

The following abbreviations are used in this manuscript:
MAA-BCNetA novel dual-encoder deep learning method that integrates multi-scale axial attention and boundary constraints
MLMachine learning
OBIAObject-Based Image Analysis
SVMSupport Vector Machines
RFRandom Forest
GBMsGradient Boosting Machines
k-NNk-Nearest Neighbors
ViTVision Transformer
scSEspatial-channel squeeze-and-excitation
RMTRetentive Networks Meet Vision Transformers
OOBOut-of-bag
CBAM_sConvolutional Block Attention Module with axial spatial module
RetNetRetentive Network
MaSAManhattan Self-Attention
CBAMConvolutional Block Attention Module
GELUGaussian Error Linear Unit
MaxPoolMax Pooling
BNBatch Normalization
AvgPoolAverage Pooling
IoUIntersection over Union
AUCArea Under the Curve
ROCReceiver Operating Characteristic
FPRFalse Positive Rate
TPRTrue Positive Rate
EDEdgeDetect

References

  1. Namany, S.; Govindan, R.; Al-Ansari, T. Operationalising transboundary cooperation through game theory: An energy water food nexus approach for the Middle East and North Africa. Futures 2023, 152, 103198. [Google Scholar] [CrossRef]
  2. Omar, A.R.; Bardsley, D.K. Conceptualising climate change vulnerability across the agrarian transition: The example of Egypt. Environ. Dev. 2024, 52, 101087. [Google Scholar] [CrossRef]
  3. Robson, J.S.; Ayad, H.M.; Wasfi, R.A.; El-Geneidy, A.M. Spatial disintegration and arable land security in Egypt: A study of small- and moderate-sized urban areas. Habitat Int. 2012, 36, 253–260. [Google Scholar] [CrossRef]
  4. Sattar, A.; Brown, C.; Rounsevell, M.; Alexander, P. Typology analysis of Egyptian agricultural households reveals increasing income diversification and abandonment of agricultural activities. Agric. Syst. 2024, 218, 104000. [Google Scholar] [CrossRef]
  5. Zhao, Y.; Ji, C.; Chen, Y.; Zhu, X. Who gains, who loses?—The impact of the belt and road initiative on bilateral agricultural trade. China Econ. Rev. 2024, 88, 102284. [Google Scholar] [CrossRef]
  6. Gopal, S.; Woodcock, C.E.; Strahler, A.H. Fuzzy Neural Network Classification of Global Land Cover from a 1° AVHRR Data Set. Remote Sens. Environ. 1999, 67, 230–243. [Google Scholar] [CrossRef]
  7. Rydberg, A.; Borgefors, G. Integrated method for boundary delineation of agricultural fields in multispectral satellite images. IEEE Trans. Geosci. Remote Sens. 2001, 39, 2514–2520. [Google Scholar] [CrossRef]
  8. Turker, M.; Kok, E.H. Field-based sub-boundary extraction from remote sensing imagery using perceptual grouping. ISPRS J. Photogramm. Remote Sens. 2013, 79, 106–121. [Google Scholar] [CrossRef]
  9. Graesser, J.; Ramankutty, N. Detection of cropland field parcels from Landsat imagery. Remote Sens. Environ. 2017, 201, 165–180. [Google Scholar] [CrossRef]
  10. Belgiu, M.; Csillik, O. Sentinel-2 cropland mapping using pixel-based and object-based time-weighted dynamic time warping analysis. Remote Sens. Environ. 2018, 204, 509–523. [Google Scholar] [CrossRef]
  11. Cheng, T.; Ji, X.; Yang, G.; Zheng, H.; Ma, J.; Yao, X.; Zhu, Y.; Cao, W. DESTIN: A new method for delineating the boundaries of crop fields by fusing spatial and temporal information from World View and Planet satellite imagery. Comput. Electron. Agric. 2020, 178, 105787. [Google Scholar] [CrossRef]
  12. Cai, Z.; Hu, Q.; Zhang, X.; Yang, J.; Wei, H.; He, Z.; Song, Q.; Wang, C.; Yin, G.; Xu, B. An Adaptive Image Segmentation Method with Automatic Selection of Optimal Scale for Extracting Cropland Parcels in Smallholder Farming Systems. Remote Sens. 2022, 14, 3067. [Google Scholar] [CrossRef]
  13. Ming, D.; Li, J.; Wang, J.; Zhang, M. Scale parameter selection by spatial statistics for GeOBIA: Using mean-shift based multi-scale segmentation as an example. ISPRS J. Photogramm. Remote Sens. 2015, 106, 28–41. [Google Scholar] [CrossRef]
  14. Lambert, M.-J.; Waldner, F.; Defourny, P. Cropland Mapping over Sahelian and Sudanian Agrosystems: A Knowledge-Based Approach Using PROBA-V Time Series at 100-m. Remote Sens. 2016, 8, 232. [Google Scholar] [CrossRef]
  15. Phalke, A.R.; Özdoğan, M.; Thenkabail, P.S.; Erickson, T.; Gorelick, N.; Yadav, K.; Congalton, R.G. Mapping croplands of Europe, Middle East, Russia, and Central Asia using Landsat, Random Forest, and Google Earth Engine. ISPRS J. Photogramm. Remote Sens. 2020, 167, 104–122. [Google Scholar] [CrossRef]
  16. Ramezan, C.A.; Warner, T.A.; Maxwell, A.E.; Price, B.S. Effects of Training Set Size on Supervised Machine-Learning Land-Cover Classification of Large-Area High-Resolution Remotely Sensed Data. Remote Sens. 2021, 13, 368. [Google Scholar] [CrossRef]
  17. Li, Y.; Liu, W.; Ge, Y.; Yuan, S.; Zhang, T.; Liu, X. Extracting Citrus Growing Regions by Multiscale UNet Using Sentinel-2 Satellite Imagery. Remote Sens. 2024, 16, 36. [Google Scholar] [CrossRef]
  18. Zhang, D.; Pan, Y.; Zhang, J.; Hu, T.; Zhao, J.; Li, N.; Chen, Q. A generalized approach based on convolutional neural networks for large area cropland mapping at very high resolution. Remote Sens. Environ. 2020, 247, 111912. [Google Scholar] [CrossRef]
  19. Xu, J.; Zhu, Y.; Zhong, R.; Lin, Z.; Xu, J.; Jiang, H.; Huang, J.; Li, H.; Lin, T. DeepCropMapping: A multi-temporal deep learning approach with improved spatial generalizability for dynamic corn and soybean map ping. Remote Sens. Environ. 2020, 247, 111946. [Google Scholar] [CrossRef]
  20. Persello, C.; Tolpekin, V.A.; Bergado, J.R.; de By, R.A. Delineation of agricultural fields in smallholder farms from satellite images using fully convolutional networks and combinatorial grouping. Remote Sens. Environ. 2019, 231, 111253. [Google Scholar] [CrossRef]
  21. Zhang, H.; Liu, M.; Wang, Y.; Shang, J.; Liu, X.; Li, B.; Song, A.; Li, Q. Automated delineation of agricultural field boundaries from Sentinel-2 images using recurrent residual U-Net. Int. J. Appl. Earth Obs. Geoinf. 2021, 105, 102557. [Google Scholar] [CrossRef]
  22. Cai, Z.; Hu, Q.; Zhang, X.; Yang, J.; Wei, H.; Wang, J.; Zeng, Y.; Yin, G.; Li, W.; You, L.; et al. Improving agricultural field parcel delineation with a dual branch spatiotemporal fusion network by integrating multimodal satellite data. ISPRS J. Photogramm. Remote Sens. 2023, 205, 34–49. [Google Scholar] [CrossRef]
  23. Wang, H.; Zhang, M.; Li, W.; Gao, Y.; Gui, Y.; Zhang, Y. Unbalanced Class Learning Network with Scale-Adaptive Perception for Complicated Scene in Remote Sensing Images Segmentation. IEEE Trans. Geosci. Remote Sens. 2024, 62, 4406712. [Google Scholar] [CrossRef]
  24. Ronneberger, O.; Fischer, P.; Brox, T. U-Net: Convolutional Networks for Biomedical Image Segmentation. In Medical Image Computing and Computer-Assisted Intervention—MICCAI 2015; Navab, N., Hornegger, J., Wells, W., Frangi, A., Eds.; Springer: Cham, Switzerland, 2015; Volume 9351. [Google Scholar] [CrossRef]
  25. Wei, H.; Xu, X.; Ou, N.; Zhang, X.; Dai, Y. DEANet: Dual Encoder with Attention Network for Semantic Segmentation of Remote Sensing Imagery. Remote Sens. 2021, 13, 3900. [Google Scholar] [CrossRef]
  26. Wang, D.; Sun, Y.; Chen, H.; Zhao, X. Image segmentation network based on enhanced dual encoder. Sci. Rep. 2025, 15, 35983. [Google Scholar] [CrossRef]
  27. Ahmed, A.; Sun, G.; Bilal, A.; Li, Y.; Ebad, S.A. Precision and efficiency in skin cancer segmentation through a dual encoder deep learning model. Sci. Rep. 2025, 15, 4815. [Google Scholar] [CrossRef]
  28. Khan, S.D.; Alarabi, L.; Basalamah, S. Deep Hybrid Network for Land Cover Semantic Segmentation in High-Spatial Resolution Satellite Images. Information 2021, 12, 230. [Google Scholar] [CrossRef]
  29. Vaswani, A.; Shazeer, N.; Parmar, N.; Uszkoreit, J.; Jones, L.; Gomez, A.N.; Kaiser, L.; Polosukhin, I. Attention Is All You Need. arXiv 2017, arXiv:1706.03762. [Google Scholar]
  30. Wang, Z.; Xia, M.; Weng, L.; Hu, K.; Lin, H. Dual Encoder–Decoder Network for Land Cover Segmentation of Remote Sensing Image. IEEE J. Sel. Top. Appl. Earth Obs. Remote Sens. 2024, 17, 2372–2385. [Google Scholar] [CrossRef]
  31. Dosovitskiy, A.; Beyer, L.; Kolesnikov, A.; Weissenborn, D.; Zhai, X.; Unterthiner, T.; Dehghani, M.; Minderer, M.; Heigold, G.; Gelly, S.; et al. An image is worth 16 × 16 words: Transformers for image recognition at scale. arXiv 2020, arXiv:2010.11929. [Google Scholar] [CrossRef]
  32. Fan, Q.; Huang, H.; Chen, M.; Liu, H.; He, R. RMT: Retentive Networks Meet Vision Transformers. In Proceedings of the IEEE/CVF Conference on Computer Vision and Pattern Recognition (CVPR), Seattle, WA, USA, 17–21 June 2024; pp. 5641–5651. [Google Scholar] [CrossRef]
  33. Sun, Y.; Dong, L.; Huang, S.; Ma, S.; Xia, Y.; Xue, J.; Wang, J.; Wei, F. Retentive Network: A Successor to Transformer for Large Language Models. arXiv 2023, arXiv:2307.08621. [Google Scholar] [CrossRef]
  34. Li, Y.; Liu, X.; Ferreira, V.; Balzter, H.; Zhou, H.; Ge, Y.; Lai, M.; Chu, S.; Ding, H.; Gu, Z. Surface water mapping from remote sensing in Egypt’s dry season using an improved U-Net model with multi-scale information and attention mechanism. Int. J. Appl. Earth Obs. Geoinf. 2025, 142, 104666. [Google Scholar] [CrossRef]
  35. Ghaznavi, A.; Saberioon, M.; Brom, J.; Itzerott, S. Comparative performance analysis of simple U-Net, residual attention U-Net, and VGG16-U-Net for inventory inland water bodies. Appl. Comput. Geosci. 2024, 21, 100150. [Google Scholar] [CrossRef]
  36. Zhang, G.; Zhao, C.; Jia, M.; Zhang, R.; Jiang, H.; Wang, Z. Mapping dominant plant communities in the degraded Zoige swamp using Sentinel-1/2 imagery and its implications for vegetation restoration. Ecol. Indic. 2025, 175, 113557. [Google Scholar] [CrossRef]
  37. Liu, J.; Yan, J.; Wang, L.; Huang, L.; He, H.; Liu, H. Remote Sensing Time Series Classification Based on Self-Attention Mechanism and Time Sequence Enhancement. Remote Sens. 2021, 13, 1804. [Google Scholar] [CrossRef]
  38. Zheng, J.; Fu, Y.; Chen, X.; Zhao, R.; Lu, J.; Zhao, H.; Chen, Q. EGCM-UNet: Edge Guided Hybrid CNN-Mamba UNet for farm land remote sensing image semantic segmentation. Geocarto Int. 2024, 40, 2440407. [Google Scholar] [CrossRef]
  39. John, D.; Zhang, C. An attention-based U-Net for detecting deforestation within satellite sensor imagery. Int. J. Appl. Earth Obs. Geoinf. 2022, 107, 102685. [Google Scholar] [CrossRef]
  40. Miao, L.; Li, X.; Zhou, X.; Yao, L.; Deng, Y.; Hang, T.; Zhou, Y.; Yang, H. SNUNet3+: A full-scale connected Siamese network and a dataset for cultivated land change detection in high-resolution remote-sensing images. IEEE Trans. Geosci. Remote Sens. 2024, 62, 4400818. [Google Scholar] [CrossRef]
  41. Lu, R.; Zhang, Y.; Huang, Q.; Zeng, P.; Shi, Z.; Ye, S. A refined edge aware convolutional neural networks for agricultural parcel delineation. Int. J. Appl. Earth Obs. Geoinf. 2024, 133, 104084. [Google Scholar] [CrossRef]
  42. Gohar, A.A.; Cashman, A.; El-bardisy, H.A.E.H. Modeling the impacts of water-land allocation alternatives on food security and agricultural livelihoods in Egypt: Welfare analysis approach. Environ. Dev. 2021, 39, 100650. [Google Scholar] [CrossRef]
  43. Bratley, K.H.; Woodcock, C.E. Estimating the expansion and reduction of agricultural extent in Egypt using Landsat time series. Int. J. Appl. Earth Obs. Geoinf. 2024, 133, 104141. [Google Scholar] [CrossRef]
  44. Akbari, E.; Amini, J.; Sumfleth, K. Crop mapping using Random Forest and Particle Swarm Optimization: A classification–feature selection ensemble procedure for multi-temporal Sentinel-2 data. Remote Sens. 2020, 12, 1449. [Google Scholar] [CrossRef]
  45. Snevajs, H.; Charvat, K.; Onckelet, V.; Kvapil, J.; Zadrazil, F.; Kubickova, H.; Seidlova, J.; Batrlova, I. Crop detection using time series of Sentinel-2 and Sentinel-1 and existing land parcel information systems. Remote Sens. 2022, 14, 1095. [Google Scholar] [CrossRef]
  46. Judith, J.; Tamilselvi, R.; Beham, M.P.; Lakshmi, S.S.P.; Panthakkan, A.; Mansoori, S.A.; Ahmad, H.A. Remote sensing based crop health classification using NDVI and fully connected neural networks. arXiv 2025, arXiv:2504.10522. [Google Scholar] [CrossRef]
  47. Delegido, J.; Verrelst, J.; Alonso, L.; Moreno, J. Evaluation of Sentinel-2 Red-Edge Bands for Empirical Estimation of Green LAI and Chlorophyll Content. Sensors 2011, 11, 7063–7081. [Google Scholar] [CrossRef]
  48. Qi, J.; Chehbouni, A.; Huete, A.R.; Kerr, Y.H.; Sorooshian, S. A modified soil adjusted vegetation index. Remote Sens. Environ. 1994, 48, 119–126. [Google Scholar] [CrossRef]
  49. Fei, H.; Fan, Z.; Wang, C.; Zhang, N.; Wang, T.; Chen, R.; Bai, T. Cotton Classification Method at the County Scale Based on Multi-Features and Random Forest Feature Selection Algorithm and Classifier. Remote Sens. 2022, 14, 829. [Google Scholar] [CrossRef]
  50. Liu, J.; Feng, Q.; Gong, J.; Zhou, J.; Liang, J.; Li, Y. Winter wheat mapping using a random forest classifier combined with multi-temporal and multi-sensor data. Int. J. Digit. Earth 2018, 11, 783–802. [Google Scholar] [CrossRef]
  51. Belgiu, M.; Drăguţ, L. Random forest in remote sensing: A review of applications and future directions. ISPRS J. Photogramm. Remote Sens. 2016, 114, 24–31. [Google Scholar] [CrossRef]
  52. Yu, G.; Goussies, N.A.; Yuan, J.; Liu, Z. Fast Action Detection via Discriminative Random Forest Voting and Top-K Subvolume Search. IEEE Trans. Multimed. 2011, 13, 507–517. [Google Scholar] [CrossRef]
  53. Simonyan, K.; Zisserman, A. Very deep convolutional networks for large-scale image recognition. arXiv 2014, arXiv:1409.1556. [Google Scholar] [CrossRef]
  54. Zhou, Z.; Siddiquee, M.M.R.; Tajbakhsh, N.; Liang, J. UNet++: Re designing Skip Connections to Exploit Multiscale Features in Image Seg mentation. arXiv 2020, arXiv:1912.05074. [Google Scholar] [CrossRef]
  55. Zhu, W.; Huang, Y.; Zeng, L.; Chen, X.; Liu, Y.; Qian, Z.; Du, N.; Fan, W.; Xie, X. AnatomyNet: Deep learning for fast and fully automated whole-volume segmentation of head and neck anatomy. Med. Phys. 2018, 46, 576–589. [Google Scholar] [CrossRef] [PubMed]
Figure 1. The study area of Egypt.
Land 15 00305 g001
Figure 2. Feature importance assessment based on Random Forest.
Land 15 00305 g002
Figure 3. Cross-validation accuracy of top-K feature selection.
Land 15 00305 g003
Figure 4. Images of sample areas for croplands in Egypt.
Land 15 00305 g004
Figure 5. The architecture of MAA-BCNET.
Land 15 00305 g005
Figure 6. The structure of CBAM_s module.
Land 15 00305 g006
Figure 7. The structure of EdgeDetect Module. The four arrows indicate the four Sobel filtering directions (horizontal, vertical, 45°, and 135°).
Land 15 00305 g007
Figure 8. Visual comparison of single-encoder and dual-encoder variants for ablation analysis. (ae) are some representative regions for cropland mapping.
Land 15 00305 g008
Figure 9. Comparison of ablation experiment results. (ah) are some representative regions for cropland mapping.
Land 15 00305 g009
Figure 10. Visual comparison of cropland parcel extraction results of different models. (ai) are some representative regions for cropland mapping.
Land 15 00305 g010
Figure 11. Number of parameters for different models.
Land 15 00305 g011
Figure 12. FLOPs for different models.
Land 15 00305 g012
Figure 13. ROC curves and AUC values of different models on the testing dataset.
Land 15 00305 g013
Figure 14. Egyptian croplands obtained by the MAA-BCNet model.
Land 15 00305 g014
Table 1. Spectral vegetation index.
IndicesEquationsReference
NDVI ( B 8 B 4 ) / ( B 8 + B 4 )[45]
EVI 2.5 ( B 8 B 4 ) / ( B 8 + 6 B 4 7.5   B 2 + 1 )[45]
GNDVI ( B 8 B 3 ) / ( B 8 + B 3 )[46]
MSAVI 2 B 8   +   1 + ( 2 B 8 + 1 ) 2 8 ( B 8 B 4 ) / 2[46]
NDVIre5 ( B 8 B 5 ) / ( B 8 + B 5 )[47]
NDVIre6 ( B 8 B 6 ) / ( B 8 + B 6 )[47]
NDVIre7 ( B 8 B 7 ) / ( B 8 + B 7 )[47]
SAVI 1.5 ( B 8 B 4 ) / ( B 8 + B 4 + 0.5 )[48]
OSAVI 1.6 ( B 8 B 4 ) / ( B 8 + B 4 + 0.16 )[48]
Table 2. Quantitative comparison of single-encoder and dual-encoder variants (ablation study) on the Sentinel-2 cropland extraction dataset.
ModelPrecisionRecallF1 ScoreIoUFLOPs
VGG16-U_net++0.83270.91890.87370.776837.71
RMT-U_net++0.83850.90270.86940.770338.15
U_net++0.84640.88290.86430.761035.73
Dual-Encoder-U_net++0.84580.91550.87930.784638.68
Table 3. Ablation experiment results. ED denotes the EdgeDetect module, and CBAM_s represents the axial attention module. √ means that the model has the module, and × indicates that the model does not have the module.
ModelED ModuleCBAM_s ModulePrecisionRecallF1-ScoreIoUFLOPs
MAA-BCNet0.90770.94920.92800.865743.27
MAA-BCNetnoCBAM_s×0.87870.94410.91020.835241.34
MAA-BCNetnoED×0.87510.93820.90560.827439.78
MAA-BCNetnoAll××0.84580.91550.87930.784638.68
Table 4. Performance and computational complexity of the proposed model with different input features.
Feature SelectionF1-ScoreIoUFLOPs
Raw bands (10-band)0.91720.852659.74
Selected features (Top-K, nine features)0.92970.868255.28
Spectral indices only (nine indices)0.92140.857156.97
PCA components (three components from nine features)0.92800.865743.27
Table 5. Experiment results of different models.
ModelPrecisionRecallF1 ScoreIoU
MAA-BCNet0.90770.94920.92800.8657
DeeplabV3_plus0.87890.94630.91140.8371
PSPnet0.86690.90160.88390.7920
Link_net0.84130.88020.86030.7549
FCN_resnet1010.76170.84760.80240.6699
U_net++0.84640.88290.86430.7610
Disclaimer/Publisher’s Note: The statements, opinions and data contained in all publications are solely those of the individual author(s) and contributor(s) and not of MDPI and/or the editor(s). MDPI and/or the editor(s) disclaim responsibility for any injury to people or property resulting from any ideas, methods, instructions or products referred to in the content.