Article

Impacts of Land Use Change on Carbon Storage and Future Projections in the Yangtze River Delta Urban Agglomeration Under SSP-RCP Scenarios


1
School of Geomatics, Zhejiang University of Water Resources and Electric Power, Hangzhou 310018, China
2
Institute of Watershed Remote Sensing and Sustainable Development, Zhejiang University of Water Resources and Electric Power, Hangzhou 310018, China
*
Author to whom correspondence should be addressed.
Land 2026, 15(2), 297; https://doi.org/10.3390/land15020297
Submission received: 23 December 2025 / Revised: 3 February 2026 / Accepted: 7 February 2026 / Published: 11 February 2026
(This article belongs to the Special Issue Carbon Cycling and Carbon Sequestration in Wetlands)

Abstract

Carbon storage (CS) is a critical ecosystem service for climate mitigation. CS in urbanizing areas is being squeezed by climate-driven capacity decline and human-induced stock loss. Focusing on the Yangtze River Delta Urban Agglomeration (YRDUA), we integrated the InVEST CS module with climate projections under SSP-RCP scenarios to quantify CS dynamics during 2000–2020 and project trajectories for 2030–2070, while attributing CS changes to land use change (LUC). The findings indicated that: (1) From 2000 to 2020, the share of cropland decreased from 54.72% to 49.60%, while the share of construction land increased from 6.05% to 12.55%. (2) Regional CS ranged from 2829.46 to 2941.96 Tg C and exhibited a persistent spatial gradient, decreasing from south to north. (3) CS is projected to increase under SSP5-8.5, to rise and then decline under SSP1-1.9, and to decrease overall under SSP2-4.5. (4) From 2000 to 2010, the conversion of cropland to forest made the largest positive contribution to CS changes, while the conversion of water to cropland dominated from 2010 to 2020. Conversely, cropland expansion into construction land was the primary driver of negative CS changes throughout the 2000–2020 period. For the future period (2030–2070), under all scenarios, the conversion of grassland to forest is expected to be the dominant driver of positive CS gains, whereas the conversion of grassland to cropland will consistently lead to the largest CS losses. These findings highlight the need for scenario-specific and spatially differentiated land-management strategies to sustain regional carbon sinks and enhance long-term climate resilience in agglomerations.

1. Introduction

As global urbanization accelerates, rising atmospheric CO2 concentrations have intensified climate warming, undermining ecosystem services and biodiversity and posing severe challenges to sustainable development [1,2,3]. Terrestrial ecosystems mitigate climate change (CC) by sequestering CO2 through photosynthesis, and their carbon storage (CS) acts as a central role in regulating the global carbon balance [4]. Among the driving factors of CS, land use change (LUC) is one of the most direct and profound forms of human disturbance to natural ecosystems [5]. It significantly affects vegetation and soil carbon stocks by altering ecosystem structure and function [6,7]. According to the IPCC Sixth Assessment Report (AR6), LUC has contributed approximately one-third of cumulative carbon emissions over the past 150 years, ranking as the second-largest source after fossil fuel [8,9]. This challenge is especially pronounced in fast-growing regions. As a rapidly industrializing country with substantial energy demand, China faces immense pressure on its terrestrial ecosystem carbon stocks due to rapid urbanization and economic expansion. Consequently, existing studies indicate that CS across most regions of China is exhibiting a significant downward trend [10,11]. Therefore, assessing historical and future LUC and CS dynamics and quantifying the contribution of LUC to CS changes are critical for maintaining regional carbon balance and mitigating climate warming.
Accurate estimation of CS is fundamental for understanding terrestrial carbon cycle processes. Traditional field-based surveys provide precise measurements but are costly and spatially limited [12,13], whereas remote-sensing inversion improves spatial coverage but often lacks temporal continuity and model generalizability [14]. In recent years, simulation-based frameworks have gained prominence for their ability to integrate multi-source data and support multi-scenario assessments [15]. Among these, the InVEST model is extensively applied because of its simple structure, computational efficiency, and interpretability; its carbon module estimates CS based on land use types and carbon density values for different carbon pools [16]. To improve accuracy, carbon-density parameters derived from literature or open databases are often adjusted according to local precipitation and temperature conditions [17,18]. However, most existing studies still rely on static carbon-density assumptions and focus on single-year projections, thereby neglecting long-term cumulative effects and climate-driven variability in carbon density. This limitation may hinder accurate assessment of ecosystem responses to future CC.
Beyond analyzing the spatiotemporal distribution of CS, research attention has increasingly shifted toward its driving factors. It is widely recognized that LUC is the primary driver of CS [5,19,20,21]. LUC, characterized by urban expansion, deforestation, and cropland expansion, directly alters vegetation biomass and soil carbon stocks [17,22,23]. However, existing studies typically analyze the impact of LUC on CS by quantifying changes resulting from land-use transitions, often relying on CS calculations based on static carbon density parameters calibrated from historical data [24,25]. To some extent, this overlooks climate-induced dynamic variations in carbon density within the same land-use types, thereby introducing bias into estimates of LUC contributions. Furthermore, this method is limited to describing CS changes associated with land conversion, making it difficult to isolate and rigorously quantify the independent contribution of LUC. Particularly in rapidly urbanizing regions, the large-scale conversion of ecological land to construction land has resulted in significant CS losses [26], making it urgent to accurately quantify the contribution of LUC.
Territorial spatial planning provides a critical pathway for enhancing terrestrial CS, increasing land use carbon sinks, and synergistically promoting the sustainable development of both natural ecosystems and socio-economic systems [27]. Consequently, multi-scenario forecasting of land use patterns and CS has become a research hotspot. However, most existing studies have primarily focused on single policy orientations, such as prioritizing economic development, ecological protection, or cultivated land conservation [28,29,30], while neglecting pathways to carbon neutrality under coupled scenarios of CC and socioeconomic development. Existing research indicates that the historical trajectories of global terrestrial CS and land use are co-driven by CC and socioeconomic development patterns [31]. The Shared Socioeconomic Pathways (SSPs) and Representative Concentration Pathways (RCPs) proposed by the IPCC provide a range of potential future scenarios for analyzing the interaction between CC and human activities [32]. Although SSP-RCP scenarios are increasingly applied to future CS projections [21,33,34], most scenario-based assessments still rely on carbon-density parameters calibrated from recent historical periods, without accounting for future climate-driven adjustments. This may lead to substantial misestimation of long-term CS responses to LUC and CC, underscoring the need for integrated frameworks that incorporate climate-responsive and temporally dynamic carbon density into multi-scenario CS simulations.
Although the InVEST model has been widely used to assess CS, existing studies still suffer from three major limitations, which hinder a comprehensive understanding and robust prediction of regional CS dynamics. In terms of assessment approaches, most studies rely on static carbon density parameters and therefore fail to capture the dynamic responses of vegetation and soil carbon densities to CC. Consequently, estimates of ecosystem CS potential may be biased, particularly when projecting responses under future CC. Regarding driver attribution, although LUC is widely recognized as a key driver of CS dynamics, most studies merely calculate carbon gains or losses associated with land use conversions. Few isolate the independent contribution of LUC, which limits the scientific basis for targeted spatial governance and ecological conservation policies aimed at achieving carbon neutrality. In scenario-based projections, many simulations aimed at carbon neutrality rely on static parameters calibrated under historical climate conditions. They fail to explicitly integrate the feedback of future climate forcing on carbon density, thereby compromising the accuracy of long term projections. These deficiencies are particularly acute in urban agglomerations facing the dual stresses of rapid urbanization and CC. Consequently, it is imperative to conduct analyses in typical urban agglomerations that integrate dynamic parameters, quantify the contribution of LUC, and utilize coupled climate-social scenarios, which holds significant scientific and practical value.
The Yangtze River Delta Urban Agglomeration (YRDUA) is one of the six world-class urban clusters, offering insights that are broadly applicable to other rapidly urbanizing regions worldwide. To address the aforementioned gaps, we take the YRDUA as a case study and propose an integrated framework that couples dynamic carbon-density parameters, isolates the contributions of LUC, and incorporates climate–society scenarios. This study aims to: (1) characterize the spatiotemporal dynamics of LUC and CS over the historical period (2000–2020) and under future SSP-RCP scenarios (SSP1-1.9, SSP2-4.5, and SSP5-8.5); (2) quantify the contribution of historical and future land use transitions to CS dynamics through contribution analysis.

2. Materials and Methods

2.1. Study Area

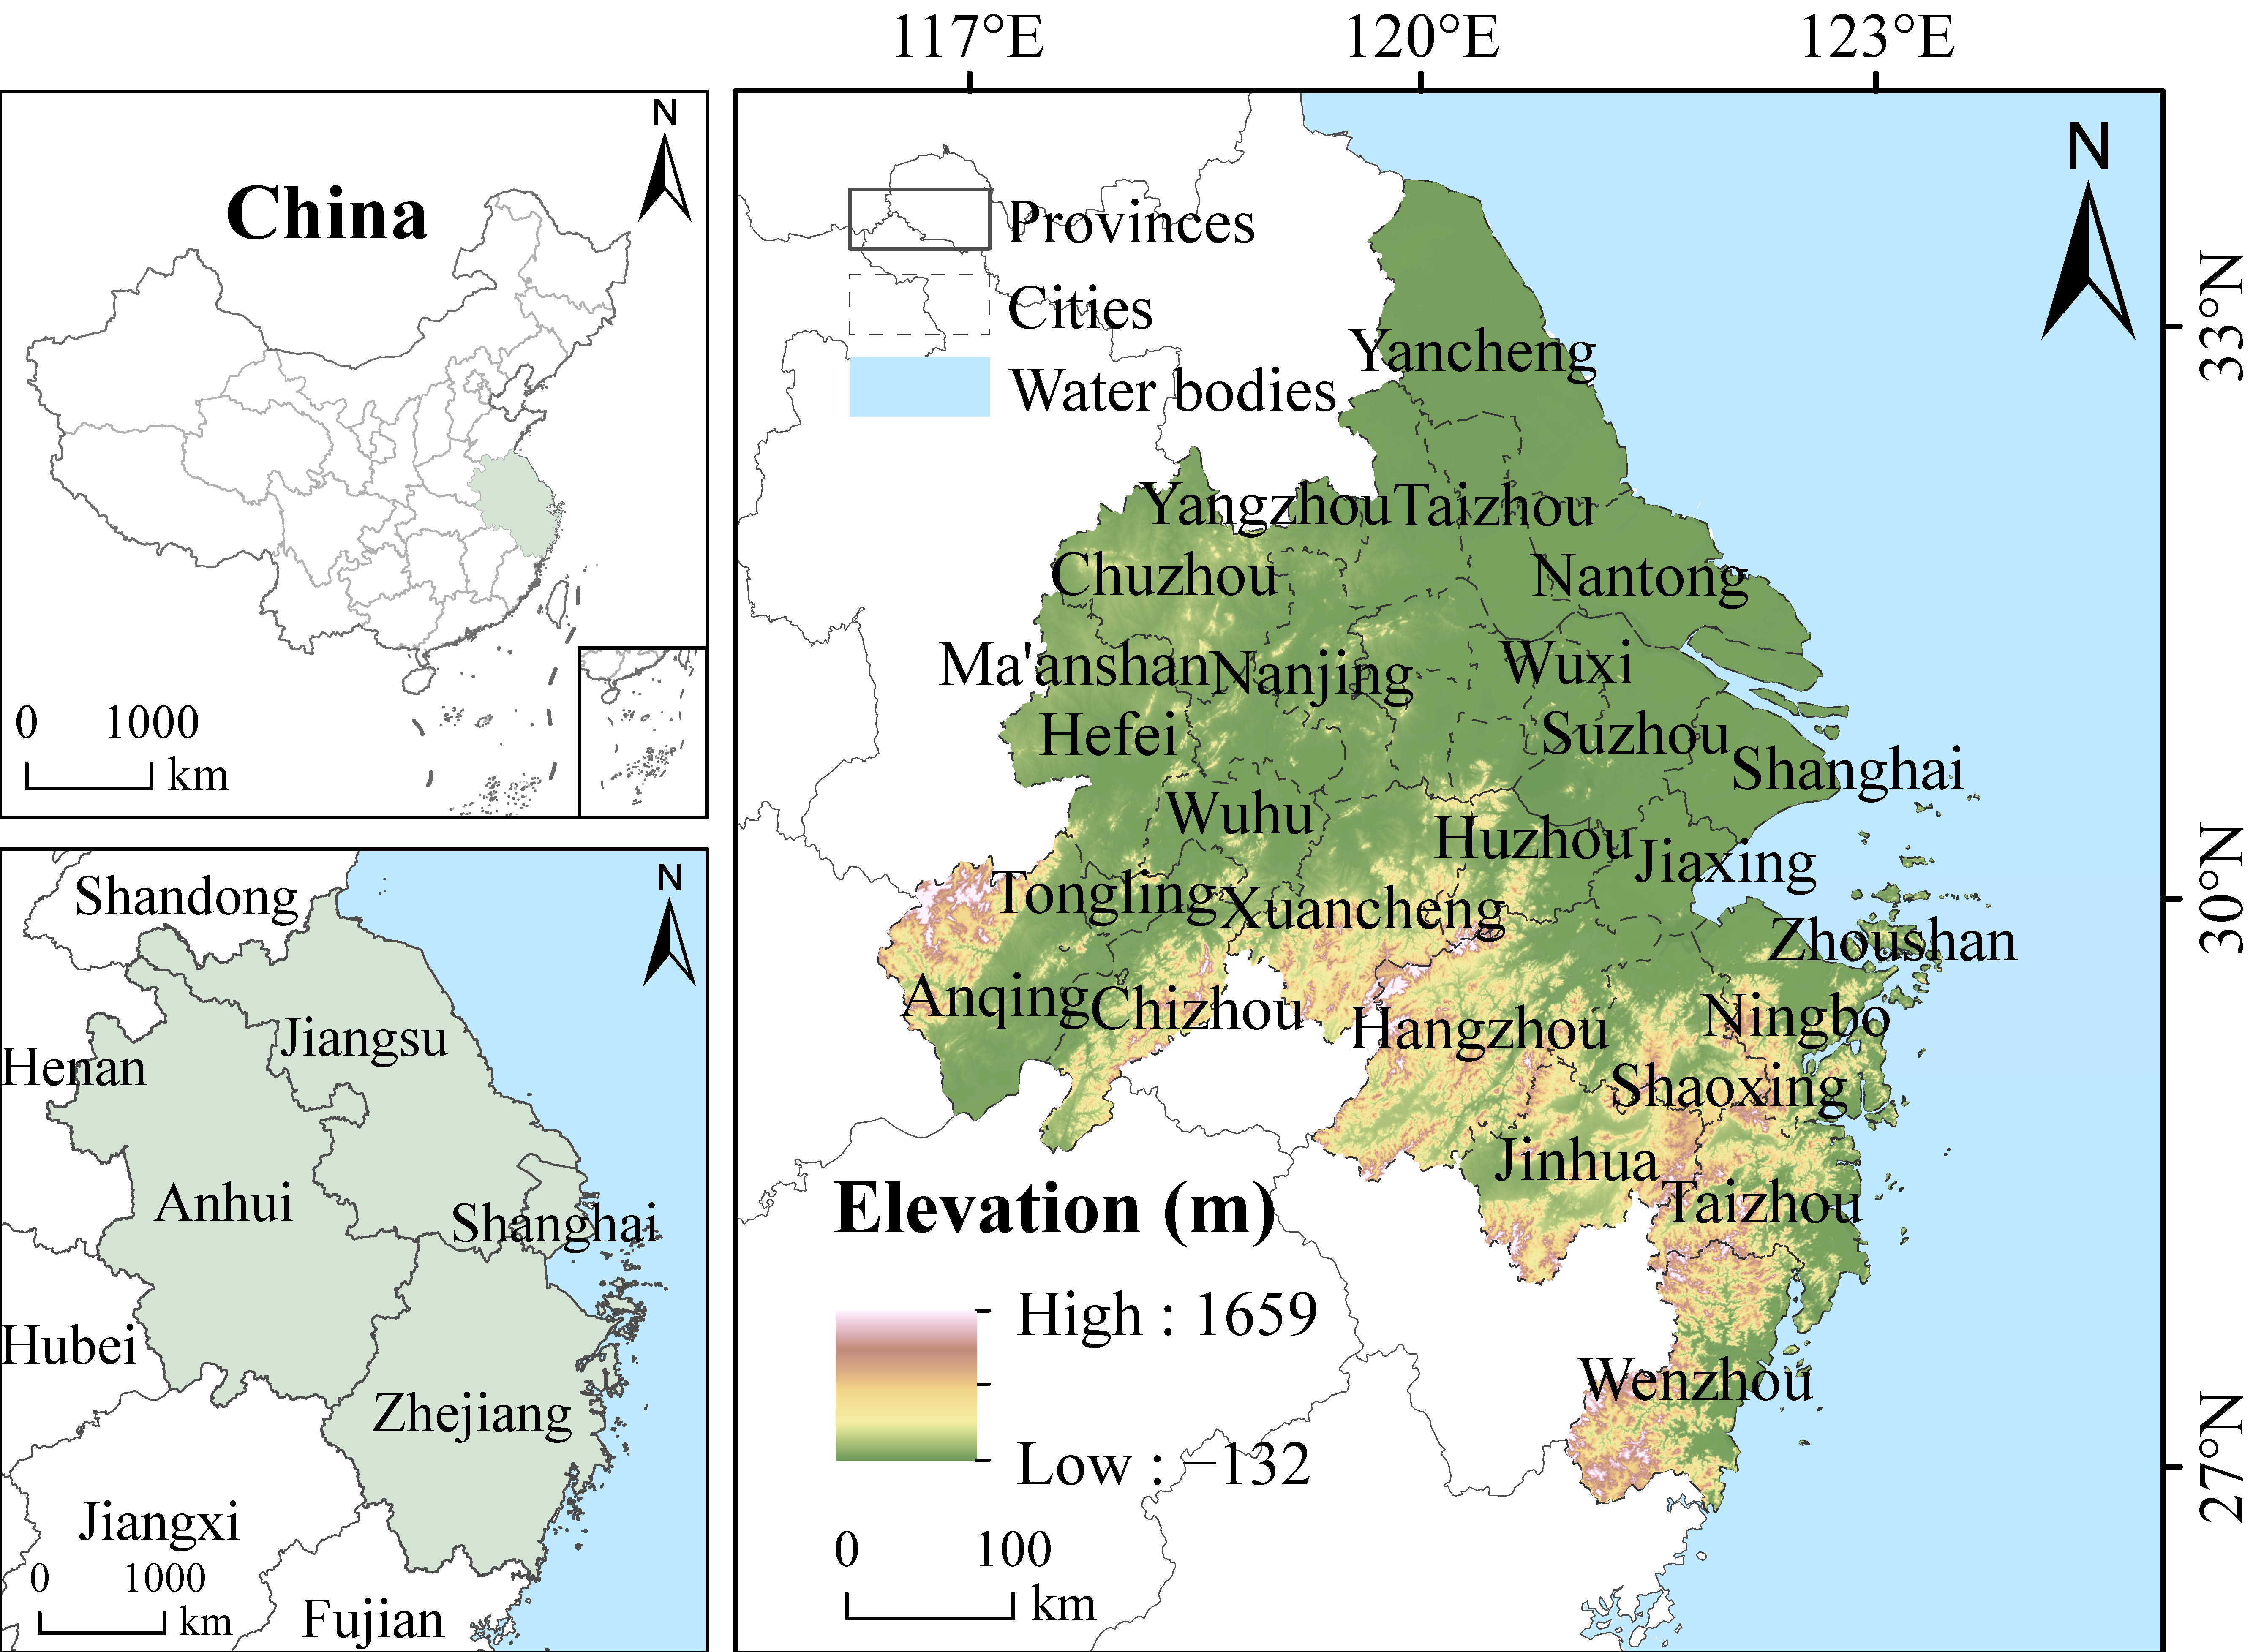
Located in the downstream section of the Yangtze River in eastern China (Figure 1), the YRDUA encompasses approximately 211,700 km2. The region is characterized by a subtropical monsoon climate, with mean annual temperatures ranging from 14 to 18 °C and annual precipitation between 1000 and 1600 mm [35]. Its topography consists mainly of extensive plains interspersed with low hills. The YRDUA comprises 27 prefecture-level cities spanning Jiangsu, Zhejiang, Shanghai, and Anhui. Between 2000 and 2020, its population expanded from 126 million to 235 million, and the region contributed nearly 24% of China’s GDP, reflecting its rapid urban and industrial development. Nevertheless, such extensive urban growth has resulted in substantial losses of green space and wetlands, significantly diminishing the region’s carbon sink capacity [36].

2.2. Data Sources

This study utilizes several datasets, including land use records from 2000 to 2020, land use projections for 2030, 2050, and 2070 under the SSP-RCP scenarios, and raster data for annual mean temperature and precipitation. The land use datasets were reclassified into six categories: cropland, forest, grassland, water bodies, construction land, and unused land. Specifically, historical data (2000–2020) were derived from the annual China Land Cover Dataset with 30 m resolution and an overall accuracy of 80% [37]. Future land use data under SSP-RCP scenarios were obtained from the 1 km resolution LUCC simulation product by Liao et al. [38], which has been widely applied in LUC and scenario prediction studies [39,40,41]. This dataset was generated using the Future Land Use Simulation model based on the Land Use Harmonization datasets, with a mean Figure of Merit of 12.14%, indicating a satisfactory simulation accuracy. Temperature and precipitation series for both the historical baseline and the SSP-RCP scenarios were obtained from the CMIP6 EC-Earth3 model, reported at native resolutions of 0.1 °C and 0.1 mm, respectively. To ensure spatial comparability, all datasets were transformed to a consistent coordinate reference system and resampled to a 1 km grid. Dataset descriptions and source information are summarized in Table 1.

2.3. Research Framework and Methodology

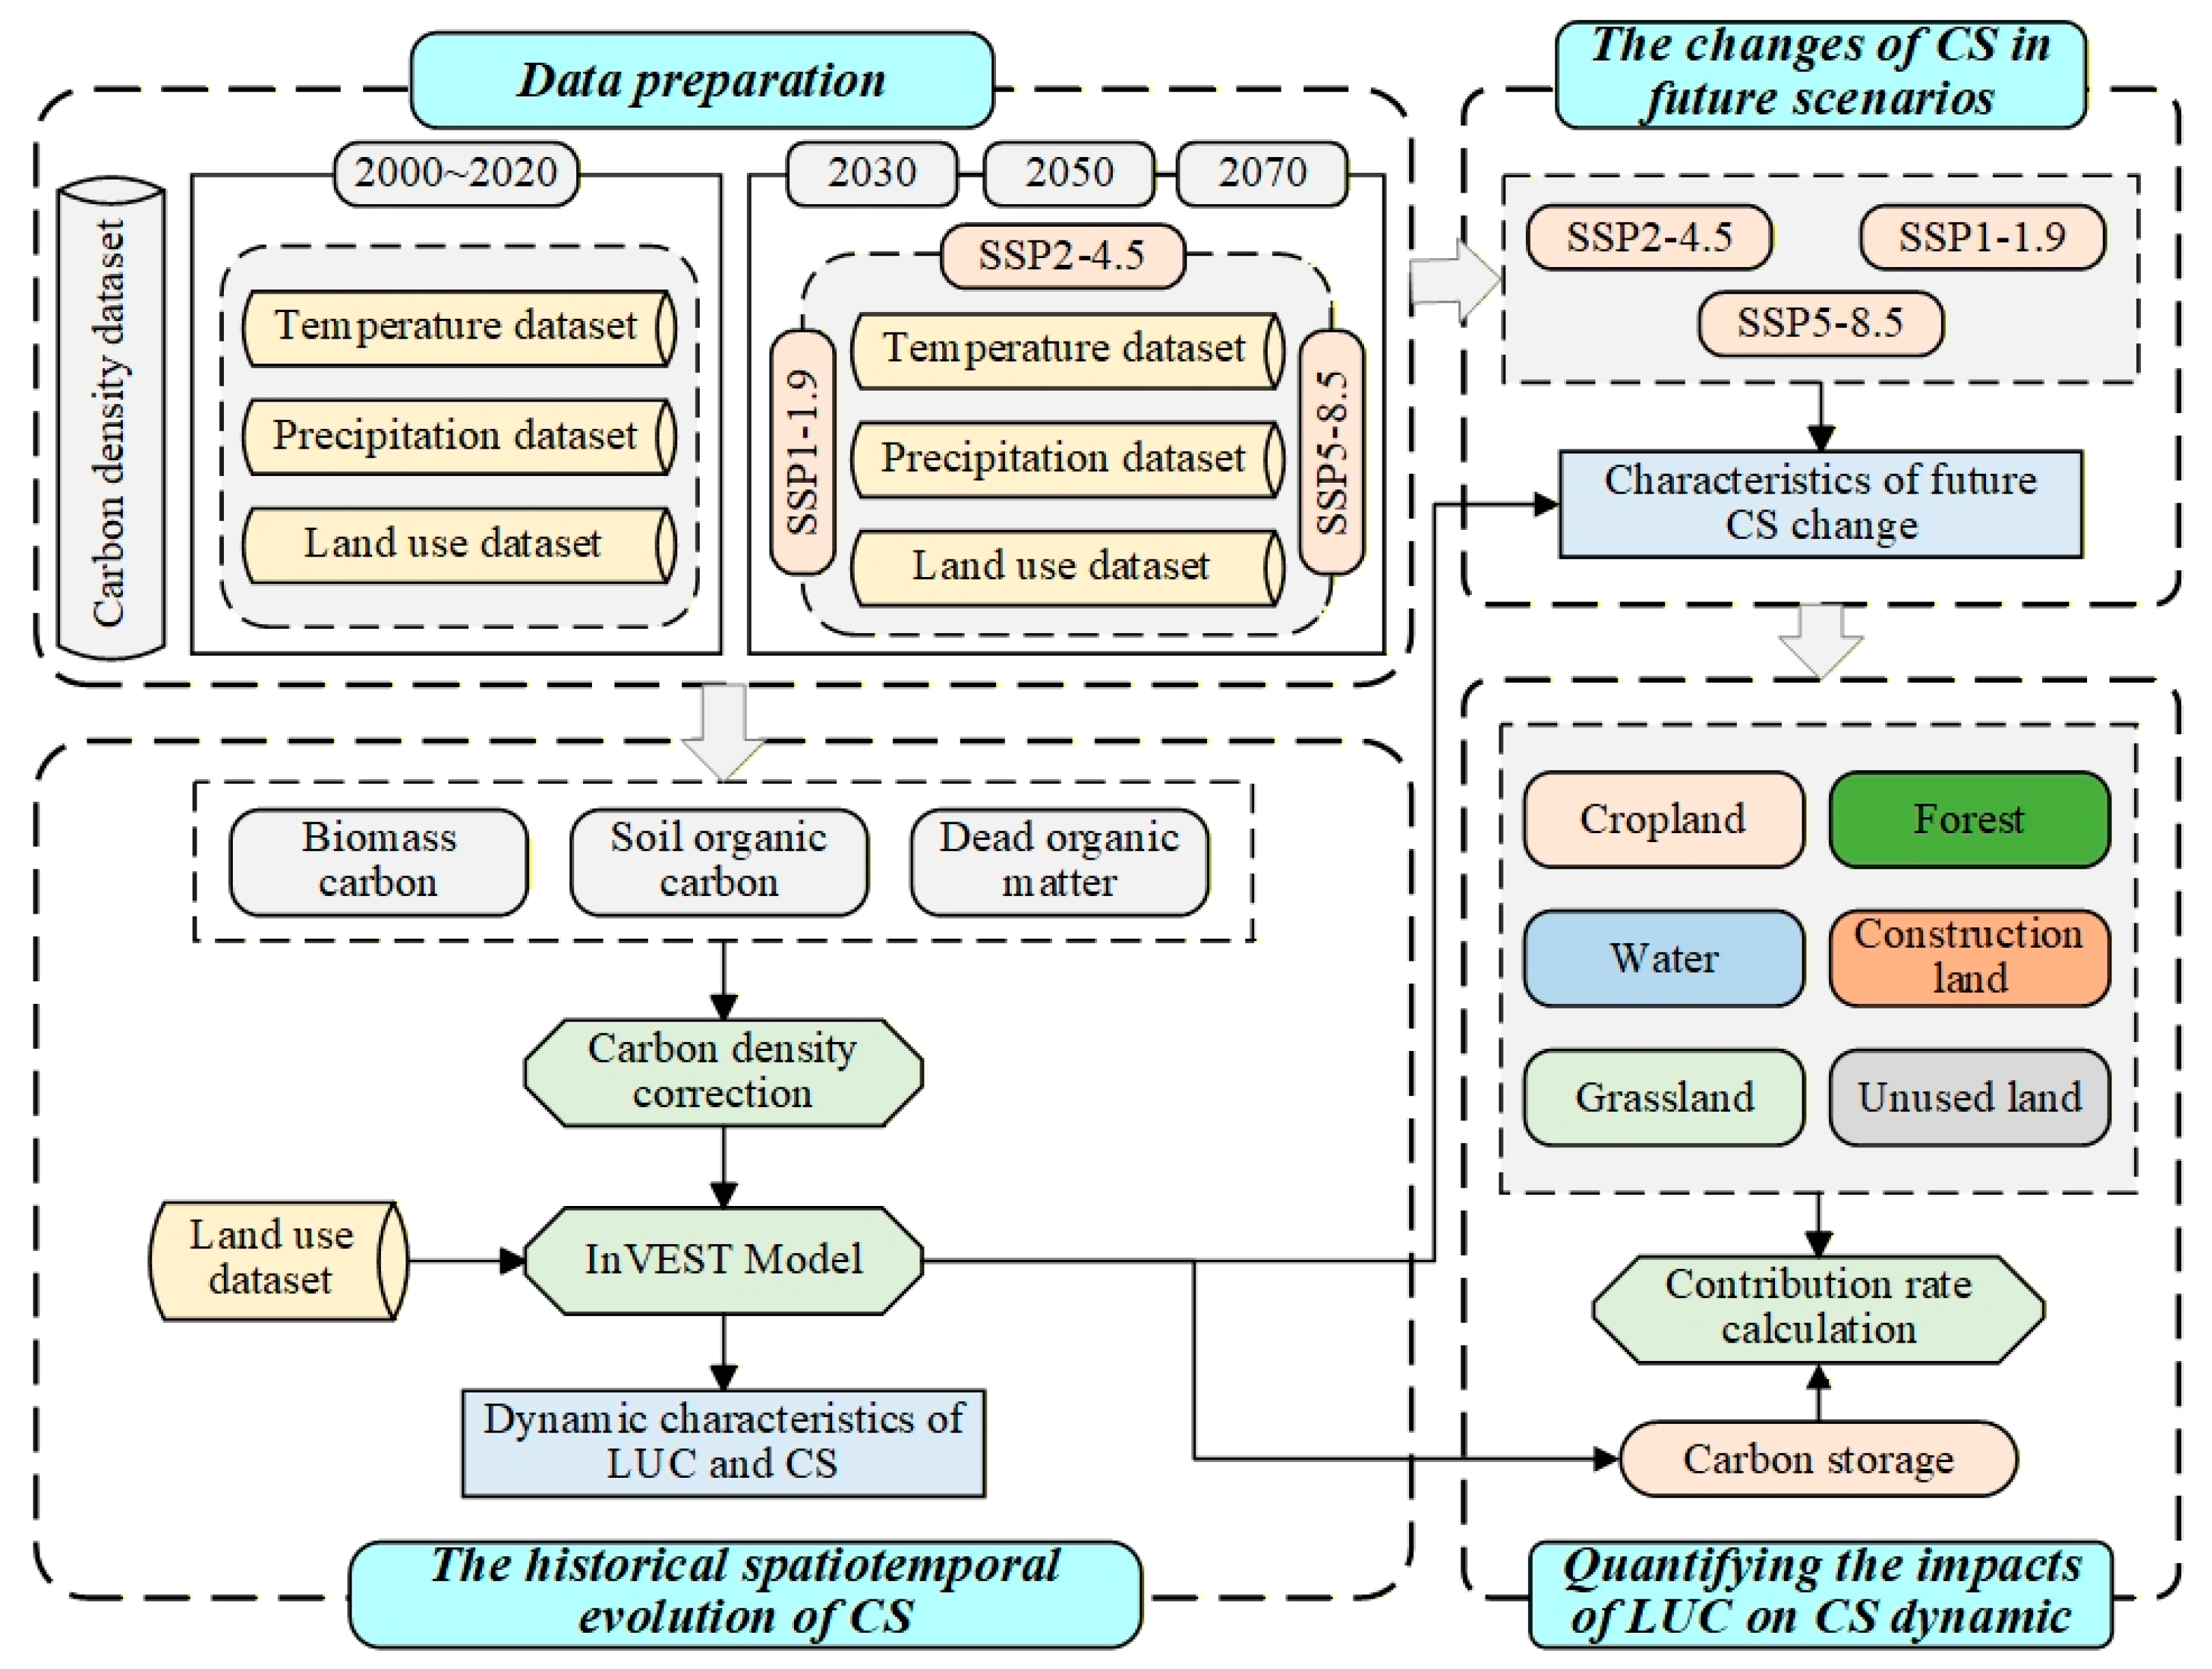
This study quantifies the impact of LUC on CS in the YRDUA and projects CS dynamics for 2030, 2050, and 2070 based on SSP-RCP scenarios (Figure 2). Initially, we collected raster datasets for mean annual precipitation, temperature, and land use, alongside reference carbon density data for the historical period (2000–2020) and future scenarios (SSP1-1.9, SSP2-4.5, and SSP5-8.5). Carbon density values were corrected using the climatic data. Subsequently, the InVEST model was employed to calculate historical and future CS. We then analyzed the spatiotemporal characteristics of historical LUC and CS, as well as CS trends under the SSP-RCP scenarios. Furthermore, the impact of LUC on CS was quantified using contribution rate analysis. Finally, this study proposes spatially differentiated strategies to enhance carbon uptake in the YRDUA.

2.3.1. CS Estimation

The InVEST model is extensively employed to evaluate ecosystem CS and its asso-ciated sequestration services. In this module, terrestrial CS is represented by four dis-tinct pools: aboveground biomass, belowground biomass, soil organic carbon, and dead organic matter [42]. For each land use category, CS is obtained by multiplying the area of that category by the carbon density values corresponding to each pool. The total CS of the region is then derived by summing the CS of all land use categories, as formu-lated in Equations (1) and (2):
C i = C i a b o v e + C i b e l o w + C i s o i l + C i d e a d
C S = i = 1 n C i × A i
where i refers to a specific land use class (i = 1, 2, …, n). The terms Ci-above, Ci-below, Ci-soil, Ci-dead denote the carbon densities of various carbon pools for class i (kg C m−2), respectively. Ci represents the total carbon density associated with land use class i (kg C m−2), Ai is the area occupied by class i (km2), and CS indicates the total terrestrial carbon stock (t).

2.3.2. Carbon Density Correction

CC plays a critical role in shaping carbon density, and extensive research has shown that carbon density is closely linked to long-term averages of temperature and precipitation [28,43]. In this study, the carbon densities for each land use in the YRDUA were calibrated using reference values from the climatically similar Hangzhou Bay area [44]. Annual mean precipitation and temperature for the YRDUA and Hangzhou Bay from 2000 to 2020, as well as projected values for 2030, 2050, and 2070 under the SSP-RCP scenarios, were incorporated into the correction equation to derive the climate-based adjustment coefficients. The climate-adjusted carbon density for each land use in the study area was derived by scaling the reference carbon density with the corresponding adjustment coefficient. The adjustment coefficient is expressed as follows [43,45]:
K B = 1 2 × 0.03 × P + 14.4 0.03 × P + 14.4 + 0.4 × T + 43.0 0.4 × T + 43.0
K S = 1 2 × 0.07 × P + 79.1 0.07 × P + 79.1 + 3.4 × T + 157.7 3.4 × T + 157.7
K D = 1 2 × 0.001 × P + 0.58 0.001 × P + 0.58 + 0.03 × T + 2.03 0.03 × T + 2.03
where KB, KS, and KD denote the climate-based adjustment coefficients for biomass carbon, soil organic carbon, and dead organic matter, respectively. P′ and P″ represent the annual mean precipitation of the YRDUA and Hangzhou Bay, respectively, while T′ and T″ correspond to their annual mean temperatures.

2.3.3. SSP-RCP Scenarios

The CMIP6 framework employs a unified scenario system in which SSPs are paired with RCPs to explore CC impacts and assess the performance of mitigation and adaptation strategies under varying socioeconomic futures [24,46]. Based on projected development patterns and to capture a representative range of future conditions, we selected the SSP1-1.9, SSP2-4.5, and SSP5-8.5 scenarios. These scenarios span low-carbon sustainable development, intermediate stabilization, and high-emission rapid growth futures, respectively [47].
The SSP1-1.9 scenario depicts a sustainability-oriented development pathway marked by inclusive socioeconomic transitions, enhanced environmental stewardship, and greenhouse gas emissions approaching net-zero levels. The SSP2-4.5 scenario represents a moderate development pathway grounded in current socioeconomic structures, balancing economic development with ecological protection and aligning with moderate stabilization pathways. In contrast, the SSP5-8.5 scenario depicts a resource-intensive, fossil-fuel-dependent development pattern marked by rapid industrial expansion and sharply increasing greenhouse gas emissions. As a high-end forcing scenario, it is commonly employed to evaluate the magnitude of LUC and to identify potential threats to carbon dynamics under conditions of rapid economic expansion.

2.3.4. Contribution of LUC to CS

LUC is one of the primary determinants of the spatiotemporal variation in regional CS [48]. Quantifying the contribution of LUC to CS change is crucial for improving land use configuration and strengthening the region’s capacity for carbon sequestration. To this end, this study applies the contribution rate calculation formula developed by Zhang et al. [49] to quantify the effects of different LUCs on CS variation in the YRDUA. Since increased CS actively mitigates the greenhouse effect, this study defines CS gains induced by LUC as a positive impact, while CS losses are considered a negative impact.
C R = C 1 C 0 × L A T A
where CR denotes the contribution rate of LUC to CS; C0 and C1 represent the CS before and after LUC (107 t in this study); LA is the LUC area; and TA refers to the entire area covered by the study region.

3. Results

3.1. Dynamic Characteristics of LUC and CS

3.1.1. Characteristics of Historical LUC

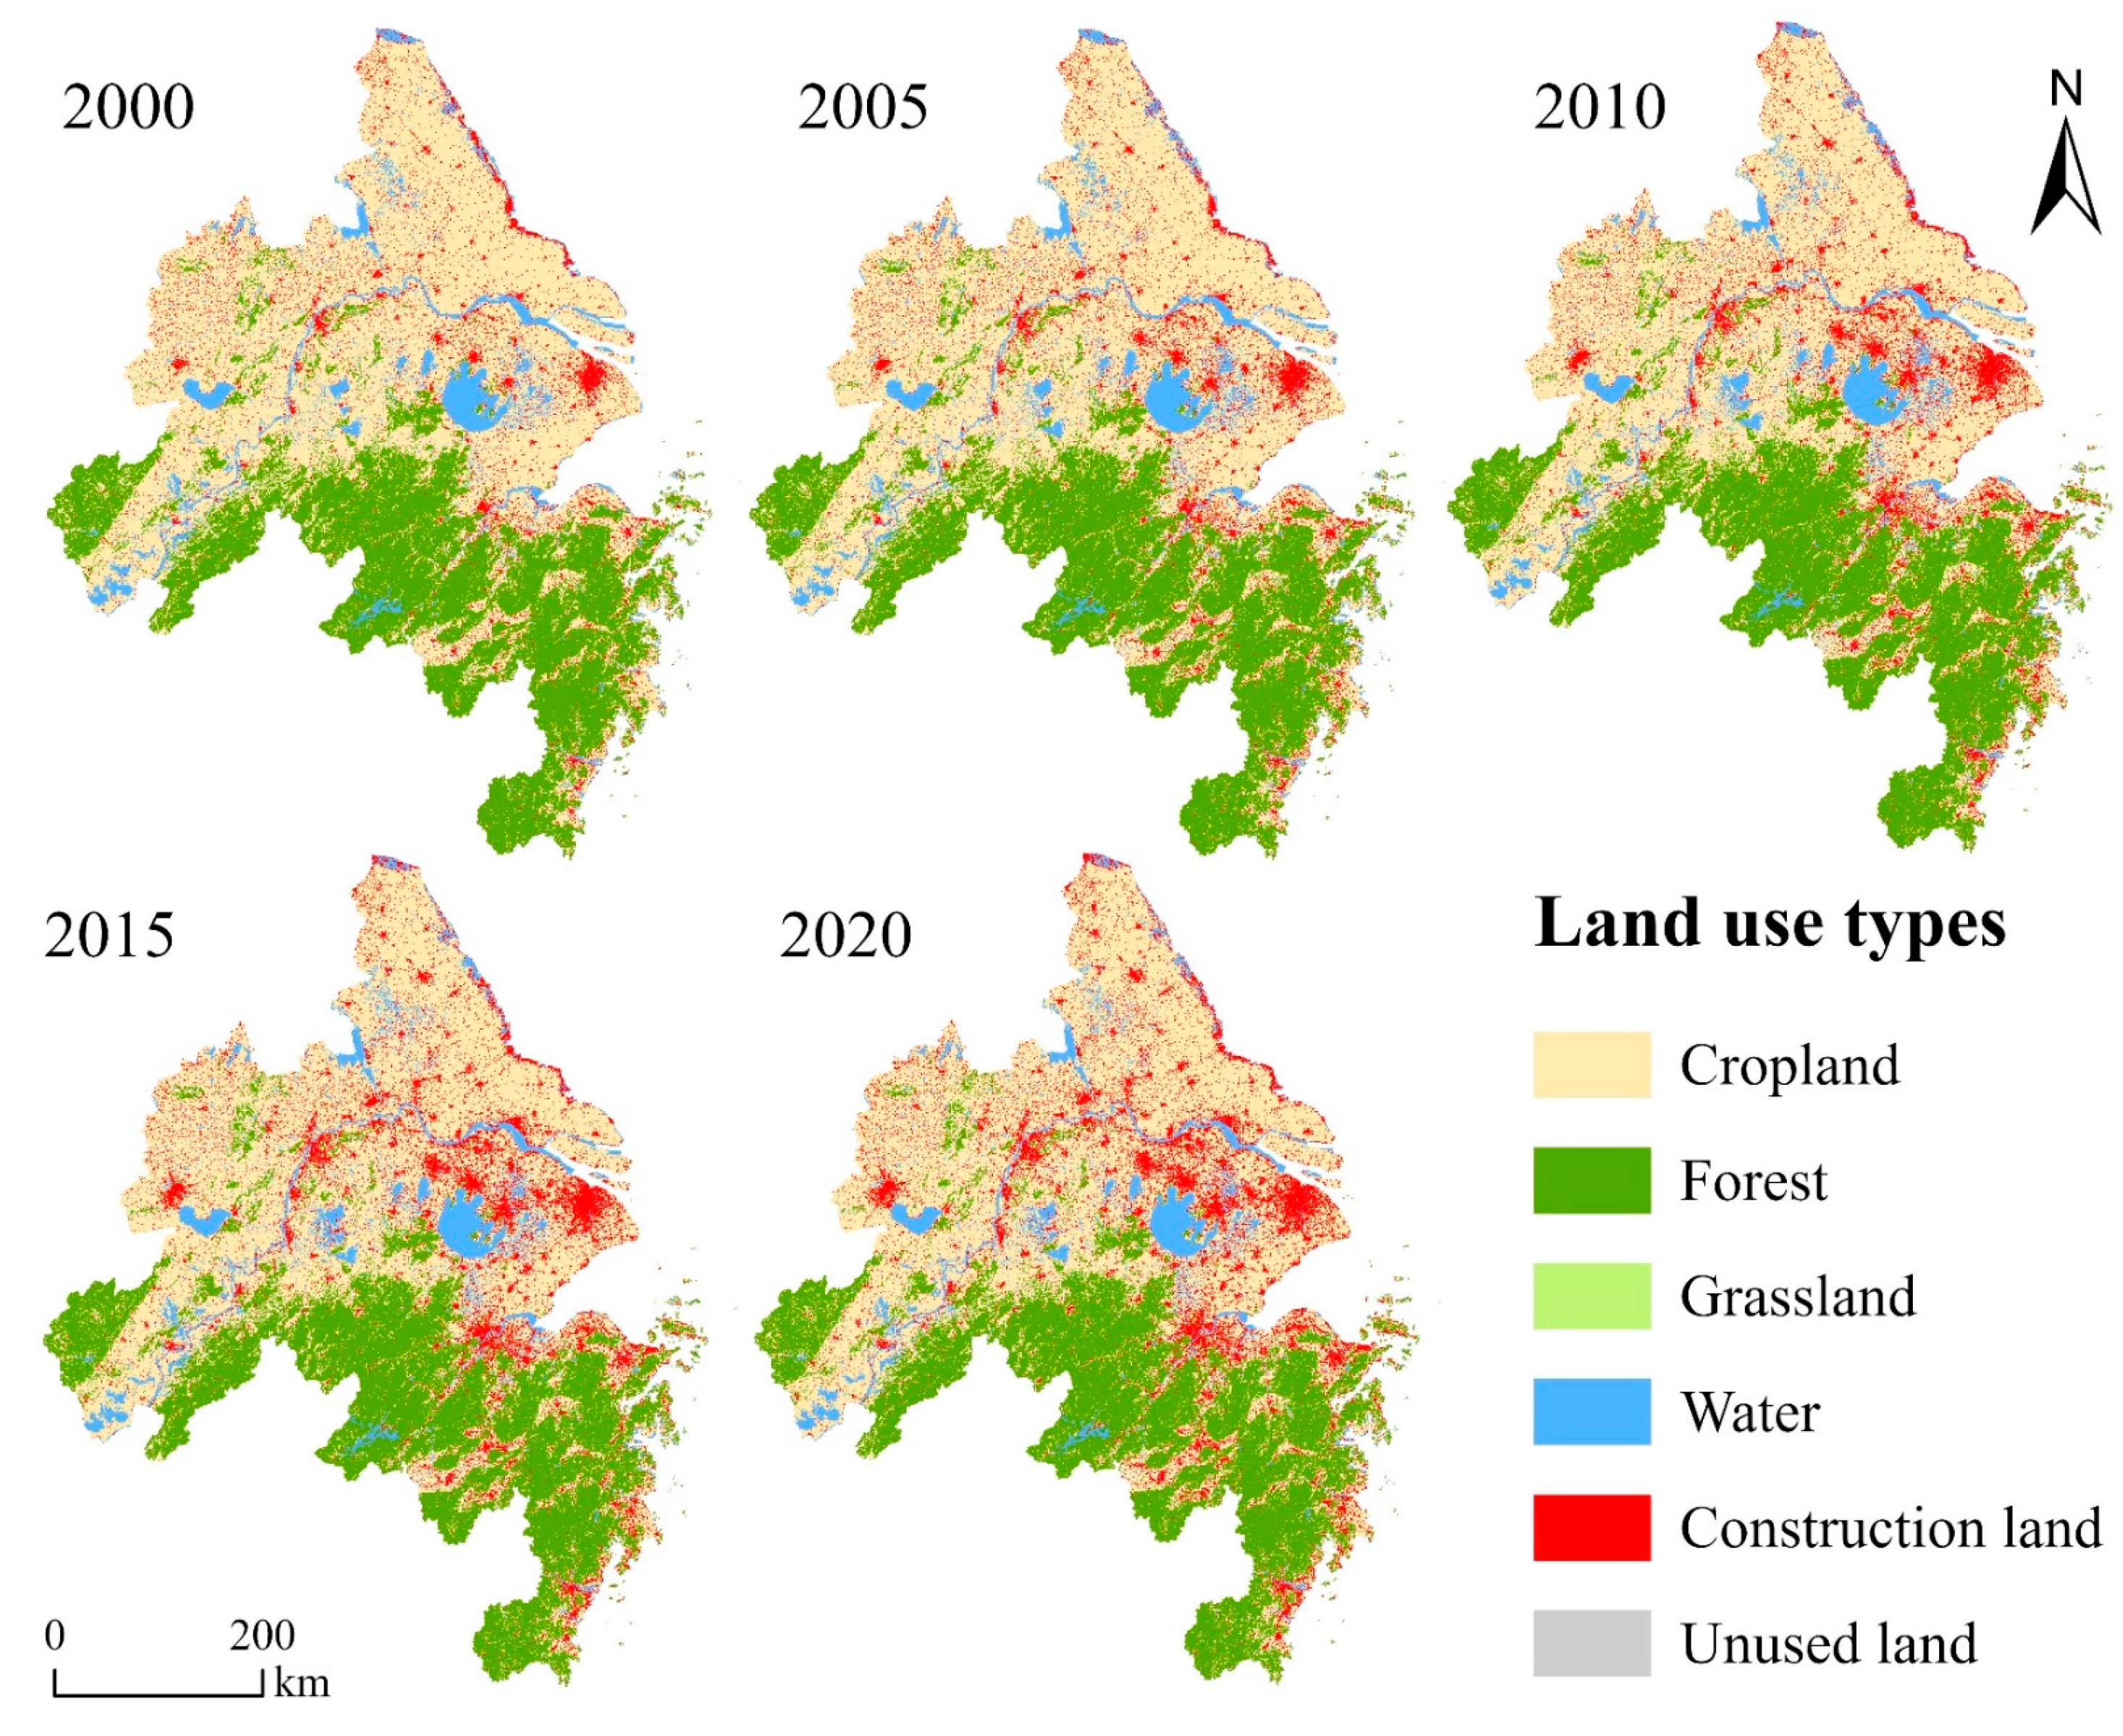
As shown in Figure 3, the land use structure of the YRDUA was stable from 2000 to 2020. Cropland and forest were the two dominant land use categories, with cropland clustered in the north and forest in the south. Water bodies, including Lake Taihu, the Yangtze River, and their tributaries, were mainly located in the central area, exhibiting linear or patch-like patterns. Construction land displayed distinct blocky agglomeration and satellite-like expansion patterns, extending inland from the eastern coastal cities. In contrast, grassland and unused land occupied a small portion of the total area, scattered thinly across the region.
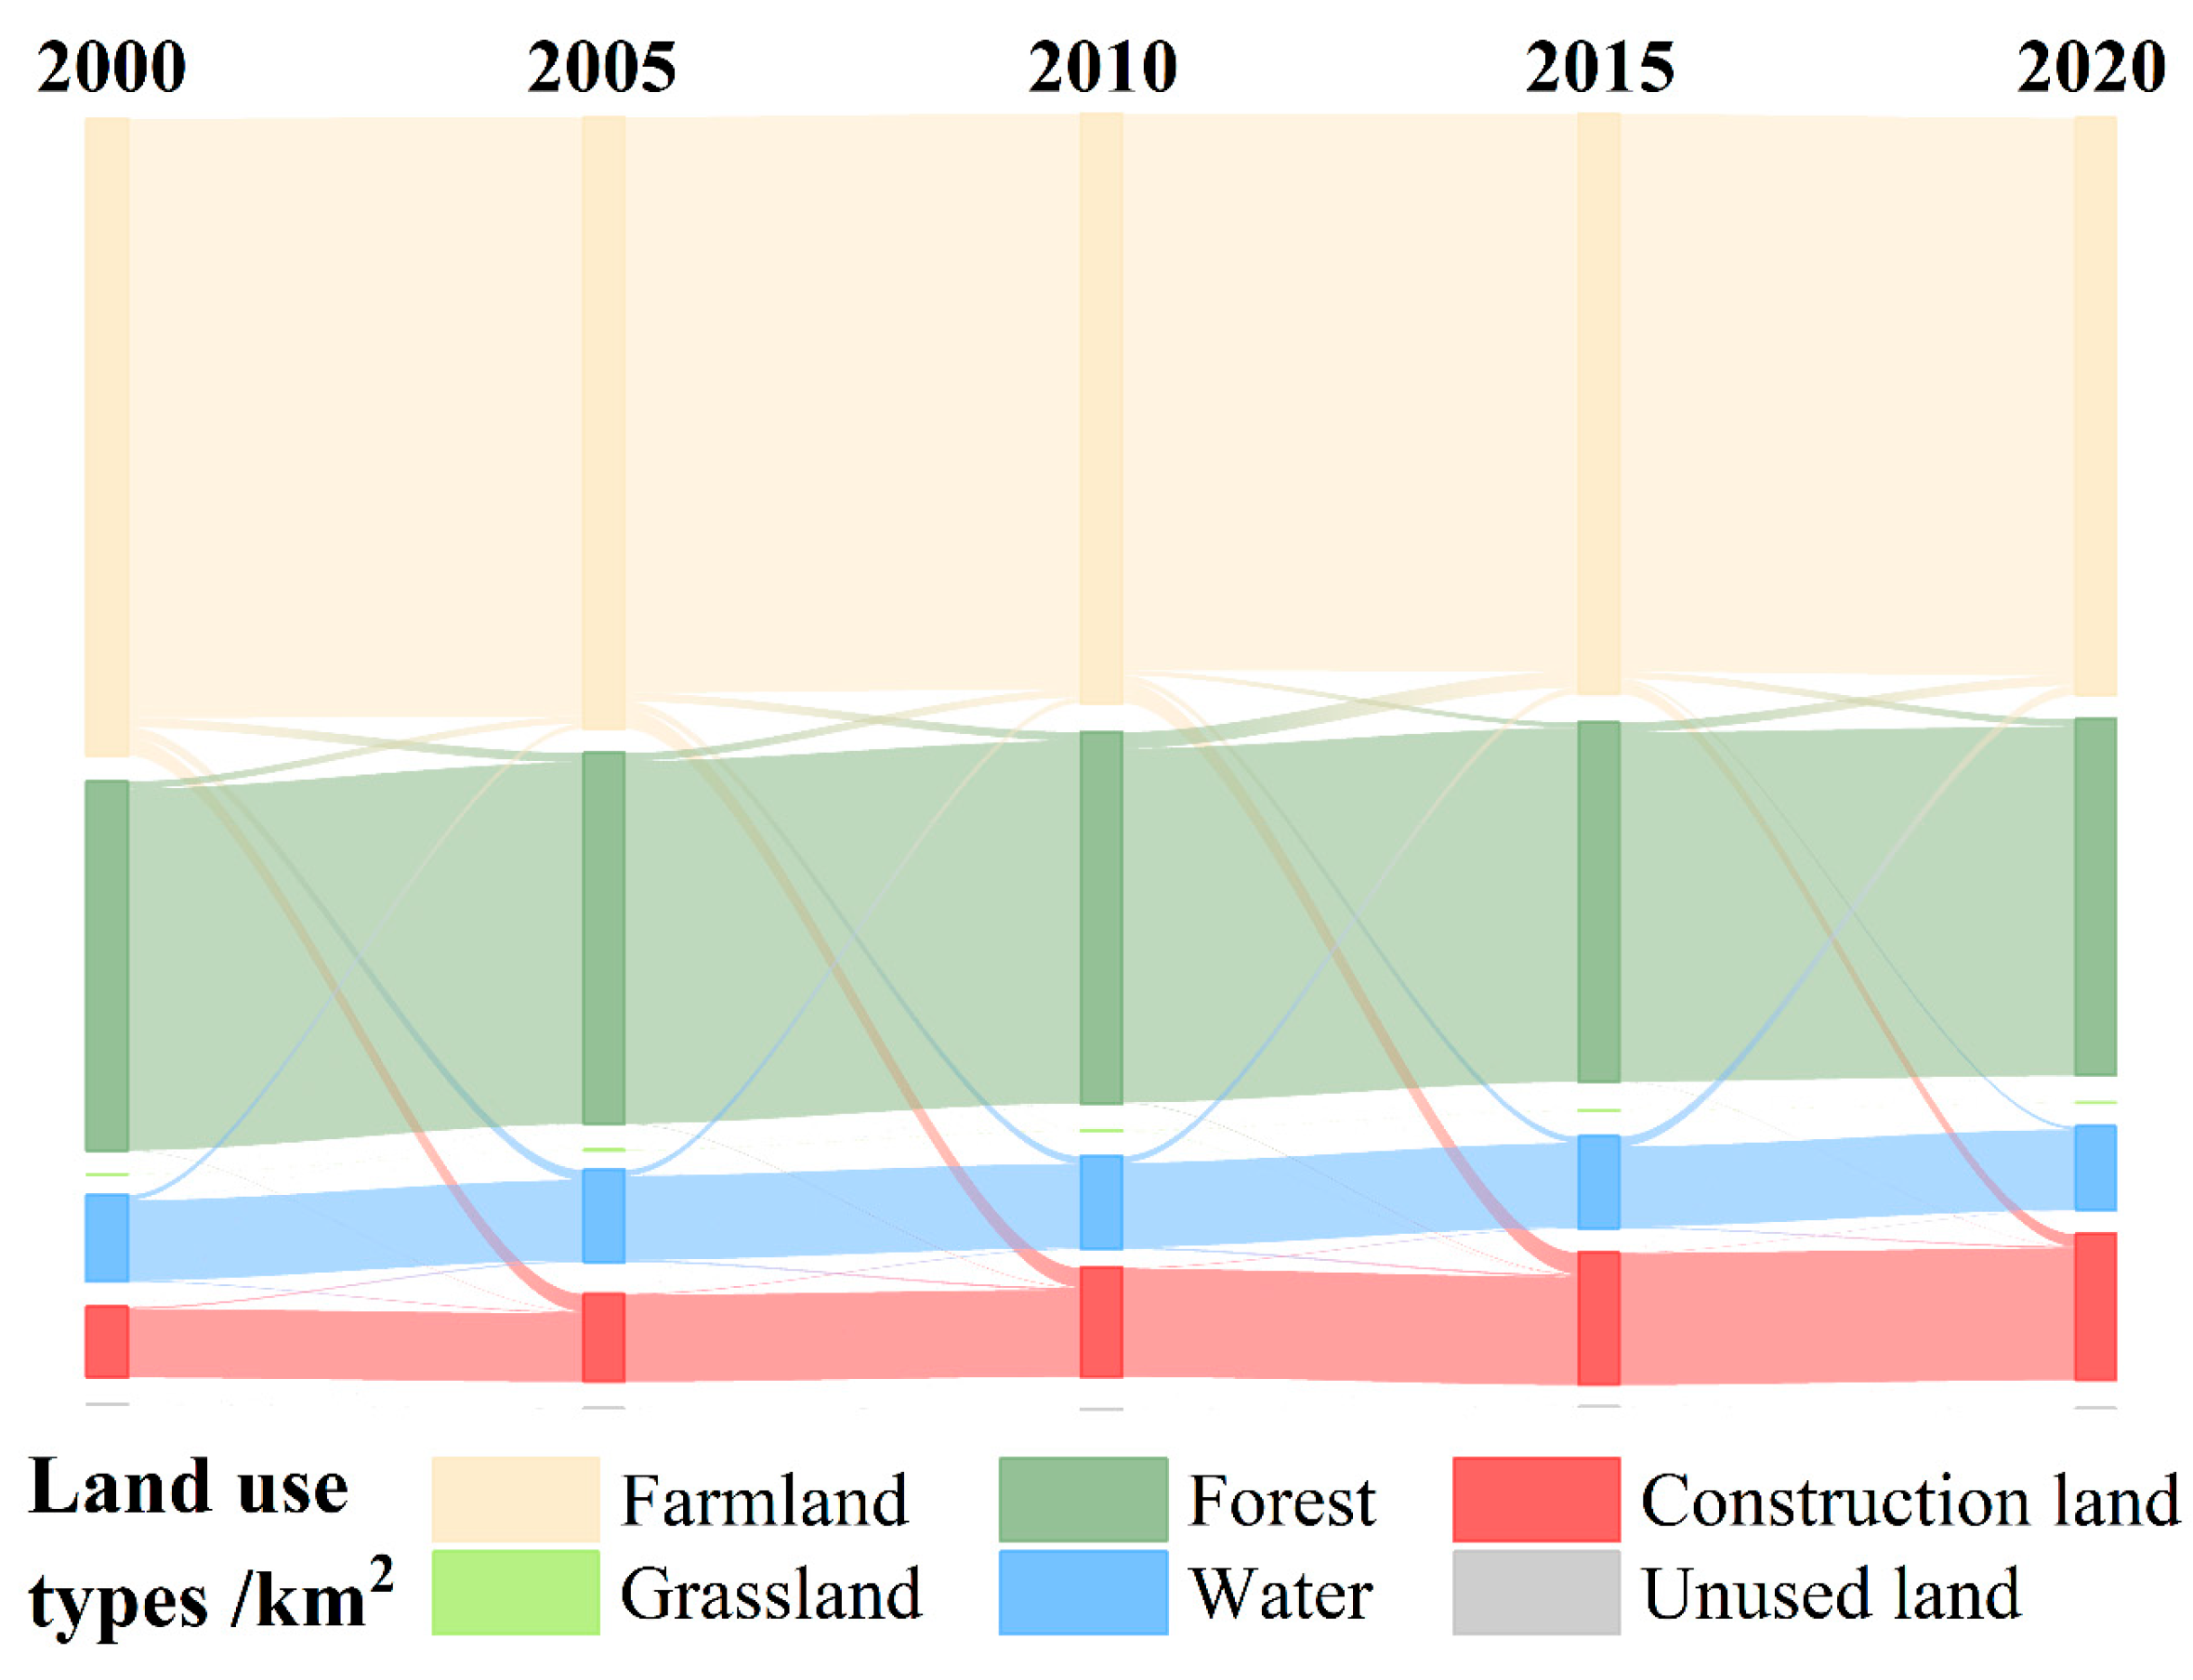
As illustrated in Figure 4, the total land conversion areas in the YRDUA across the four periods were 10,163 km2, 10,239 km2, 11,388 km2, and 8446 km2, respectively. The land use structure exhibited a similar trend from 2000 to 2020, characterized primarily by the continuous conversion of cropland to construction land. Both cropland and forest land declined from 2000 to 2020, with cropland decreasing from 54.72% to 49.60% and forest land decreasing from 31.74% to 30.63%. The proportion of water bodies fluctuated throughout the study period, peaking at 17,672 km2 in 2010 and dropping to 15,919 km2 in 2020. Construction land expanded rapidly, increasing from 6.05% to 12.55%, representing a growth of 14,350 km2. In contrast, grassland and unused land exhibited negligible changes due to their minimal proportions. Regarding land use transitions, Changes were mainly observed in the eastern, central, and northern sectors of the YRDUA. The main land use shifts were water-to-cropland and forest-to-cropland conversions in the north, and forest-to-cropland conversion. In contrast, the southwestern region, particularly southern Zhejiang, saw a substantial shift from cropland to forest. The northwestern area experienced few land use transitions, maintaining a stable spatial structure.

3.1.2. Characteristics of CS Change

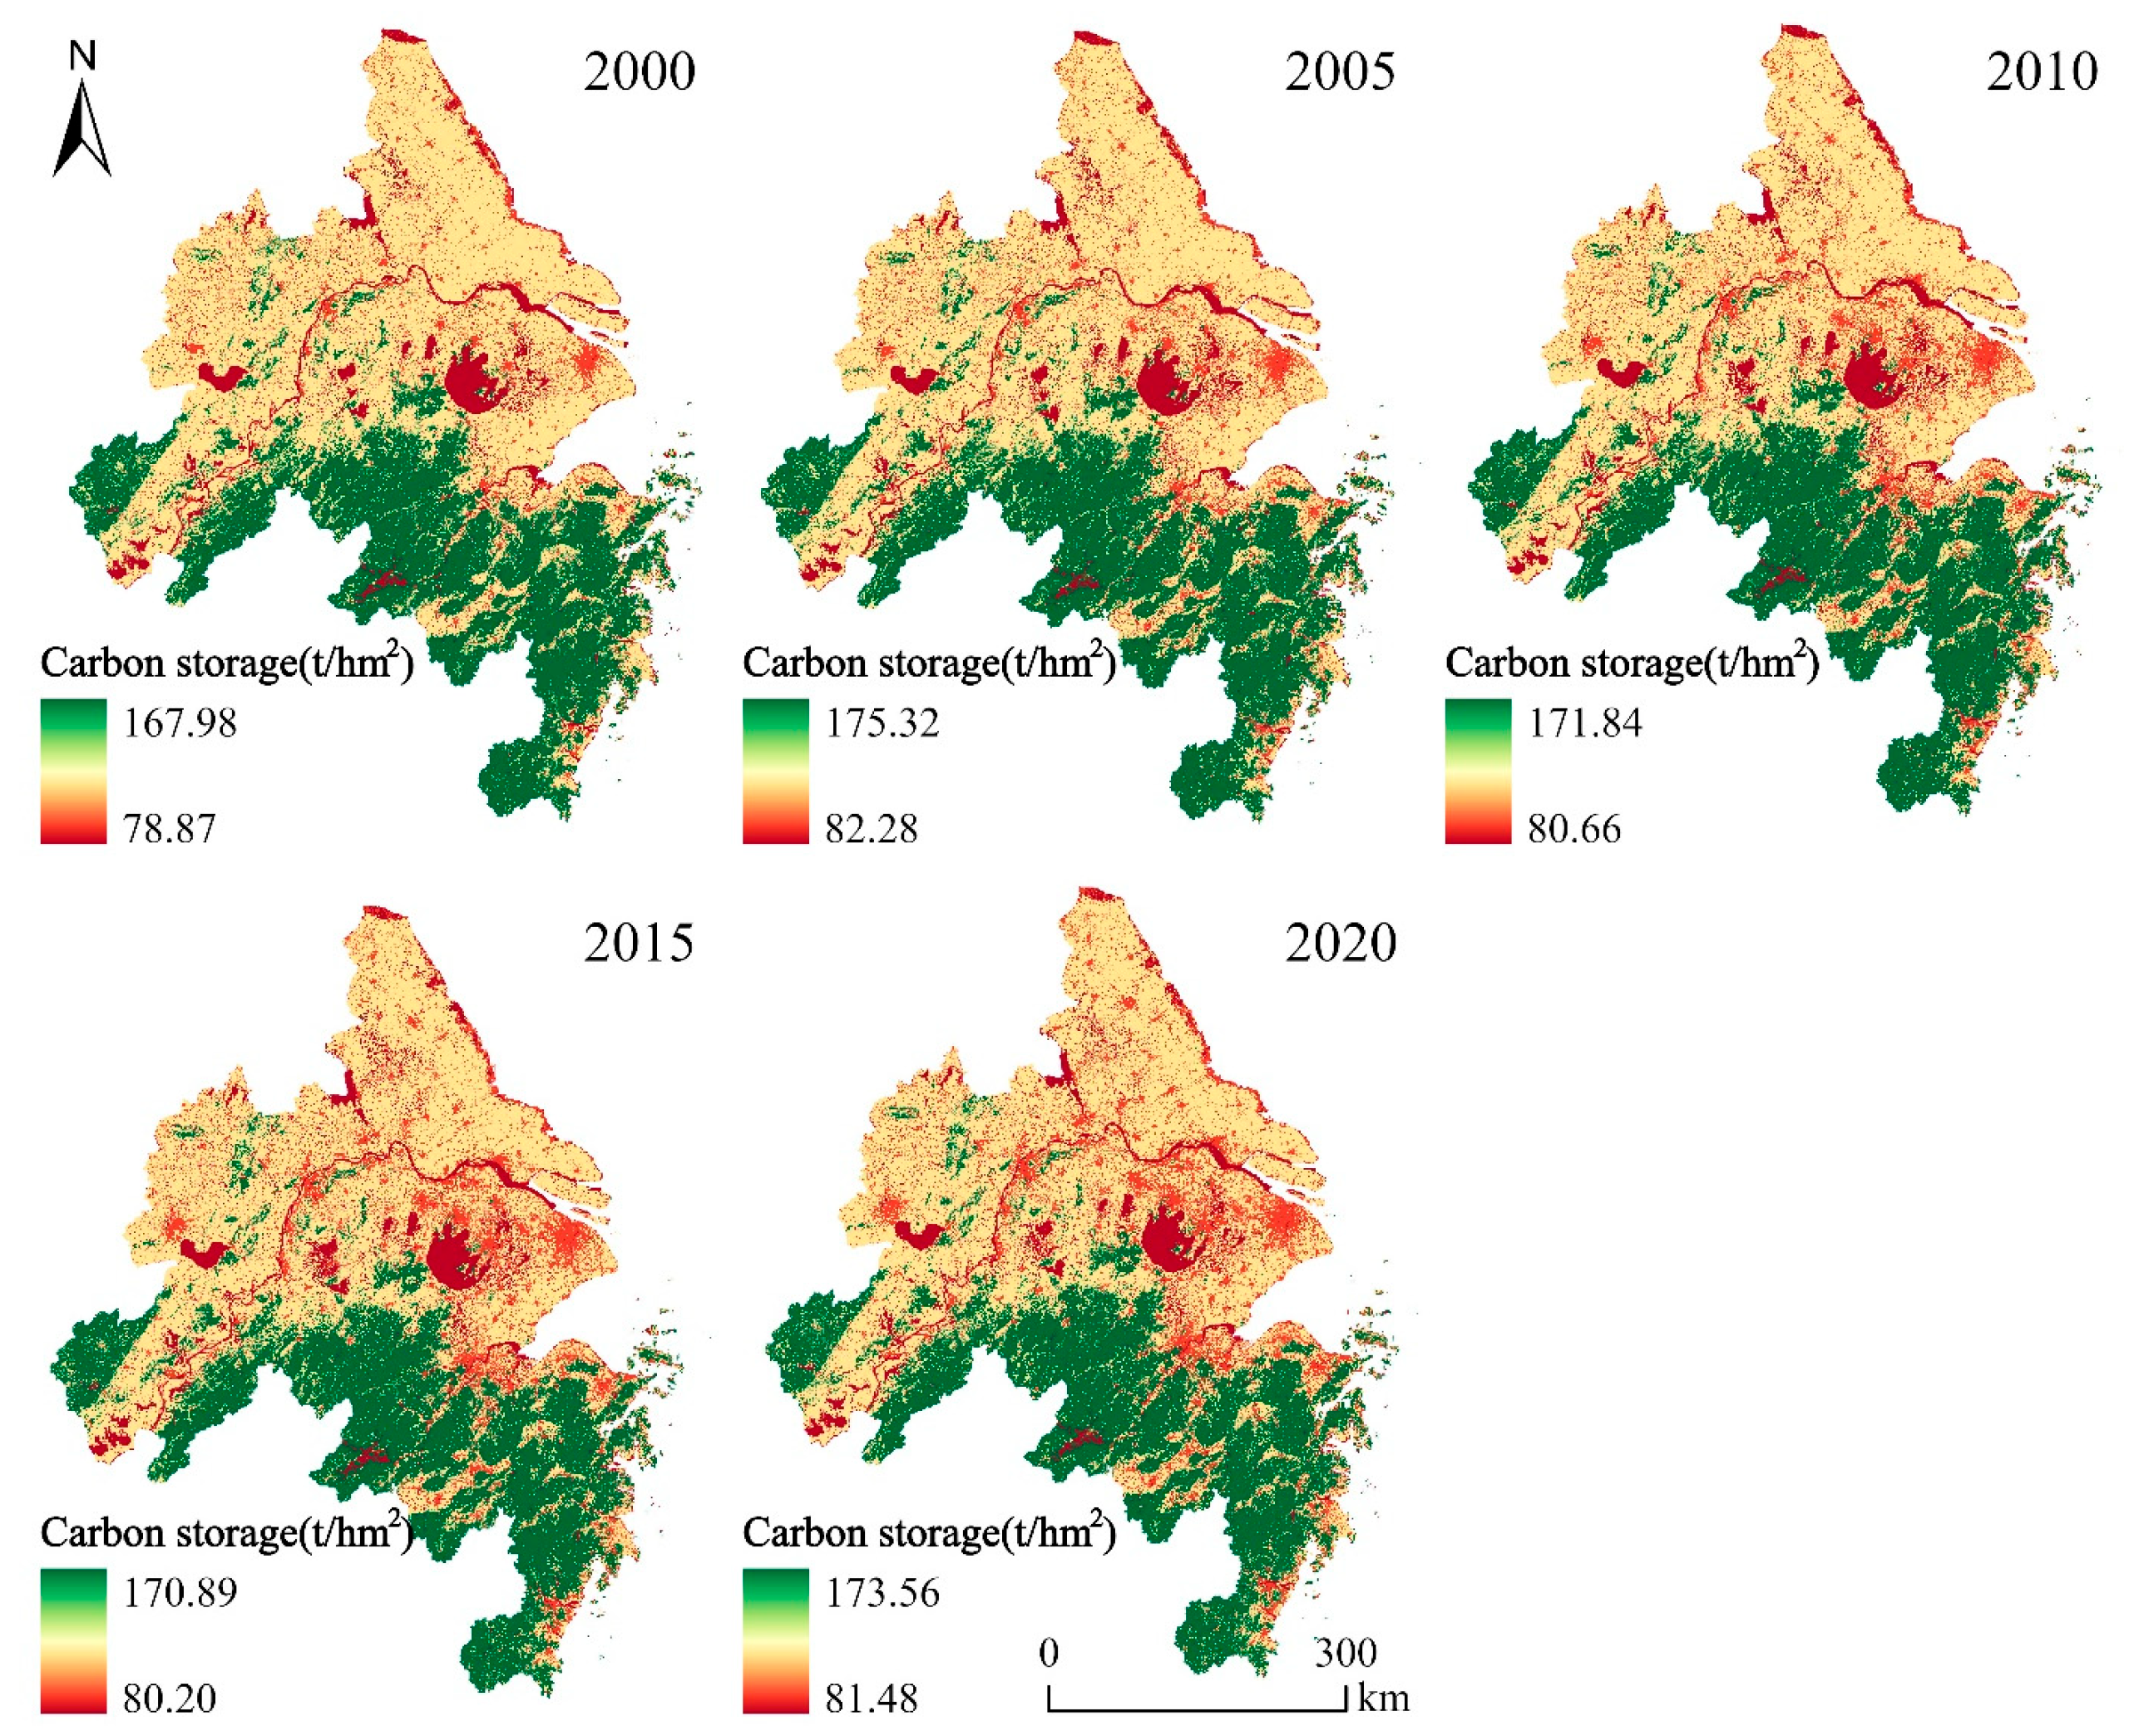
From 2000 to 2020, the CS of the YRDUA fluctuated but generally increased, with values of 2829.46, 2941.96, 2872.35, 2834.00, and 2873.72 Tg C in 2000, 2005, 2010, 2015, and 2020, respectively. Between 2000 and 2005, CS increased by 112.50 Tg C, followed by a continuous decline totaling 107.96 Tg C from 2005 to 2015. A slight rebound of 39.72 Tg C was observed from 2015 to 2020. Spatially, the CS distribution remained relatively stable throughout the study period, displaying a pronounced south–north gradient (Figure 5). High-value zones consistently clustered in the southern part of the region, where peak CS density approached approximately 170 t per unit area. In contrast, low-value areas were primarily found in the northern YRDUA, where minimum CS per unit area were around 80 t.
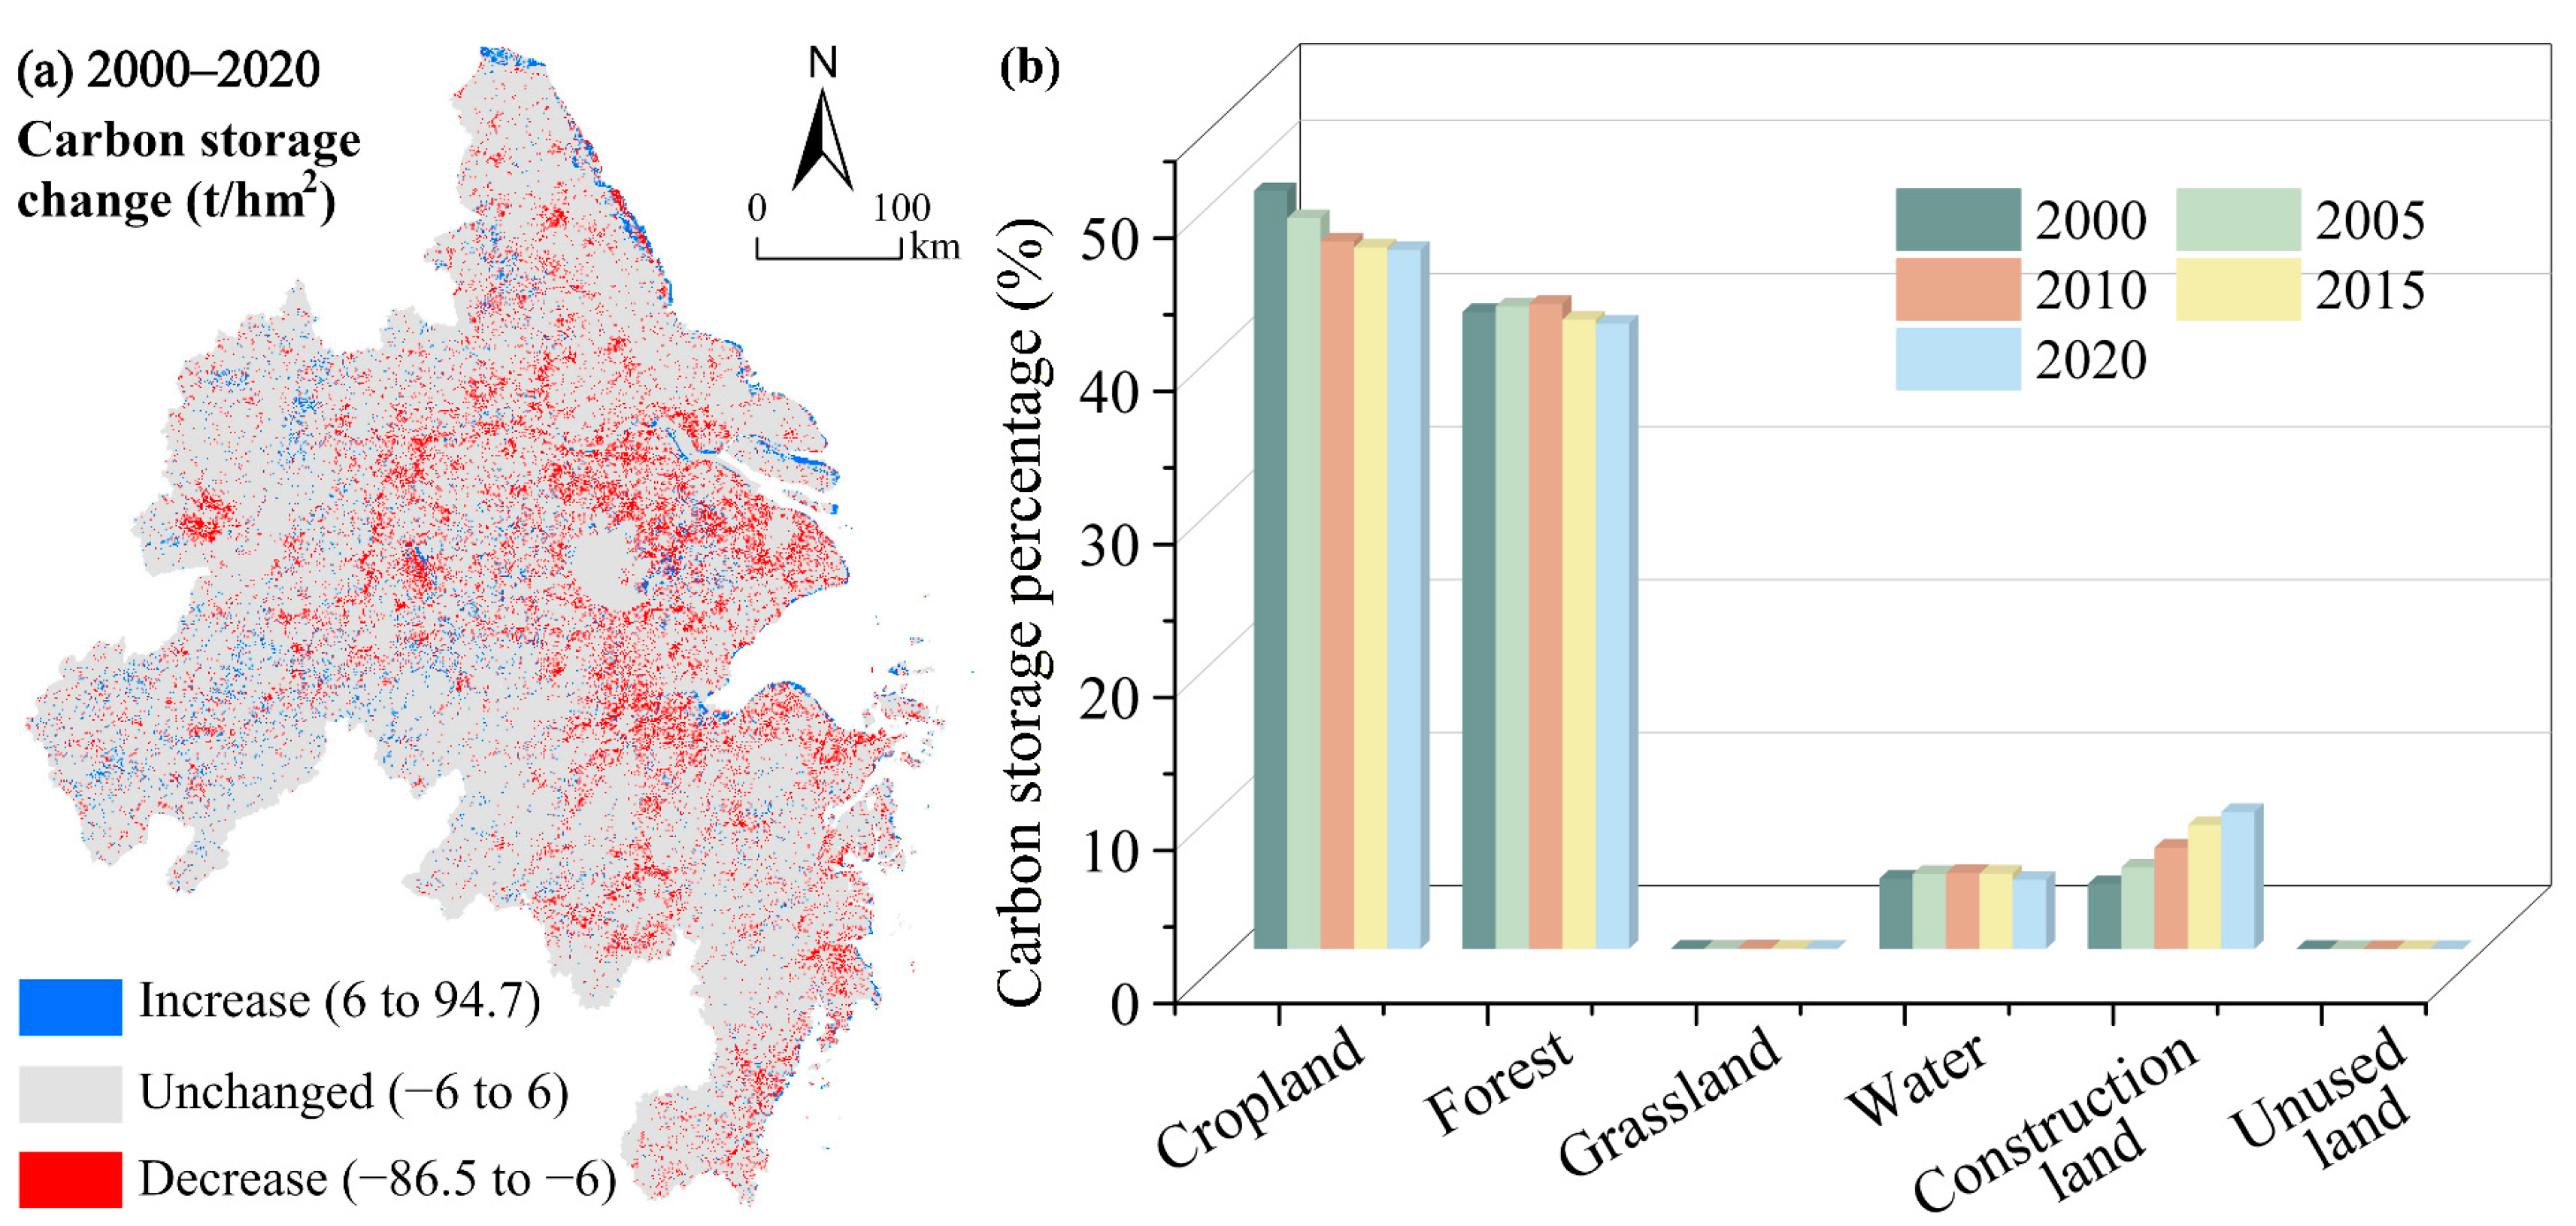
From 2000 to 2020, the CS in the western YRDUA remained stable (Figure 6a), whereas a noticeable decline occurred near the Taihu Lake region. In contrast, several localized areas exhibited increases in CS, primarily driven by the conversion of cropland and grassland into forest and by land reclamation activities along the coast. Overall, CS changes in the YRDUA showed a fragmented and spatially scattered. Regarding CS changes across different land use types (Figure 6b), cropland experienced a continuous decline, with the most pronounced reduction occurring between 2000 and 2010, resulting in a 3.30% decrease in its CS proportion. Conversely, construction land showed a persistent increase, with its CS proportion rising by 4.70%. Forest and water bodies displayed a “increase–decrease” trajectory over time, ultimately leading to net reductions of 0.75% and 0.08% in their CS proportions, respectively.

3.2. The Changes in CS in Future Scenarios

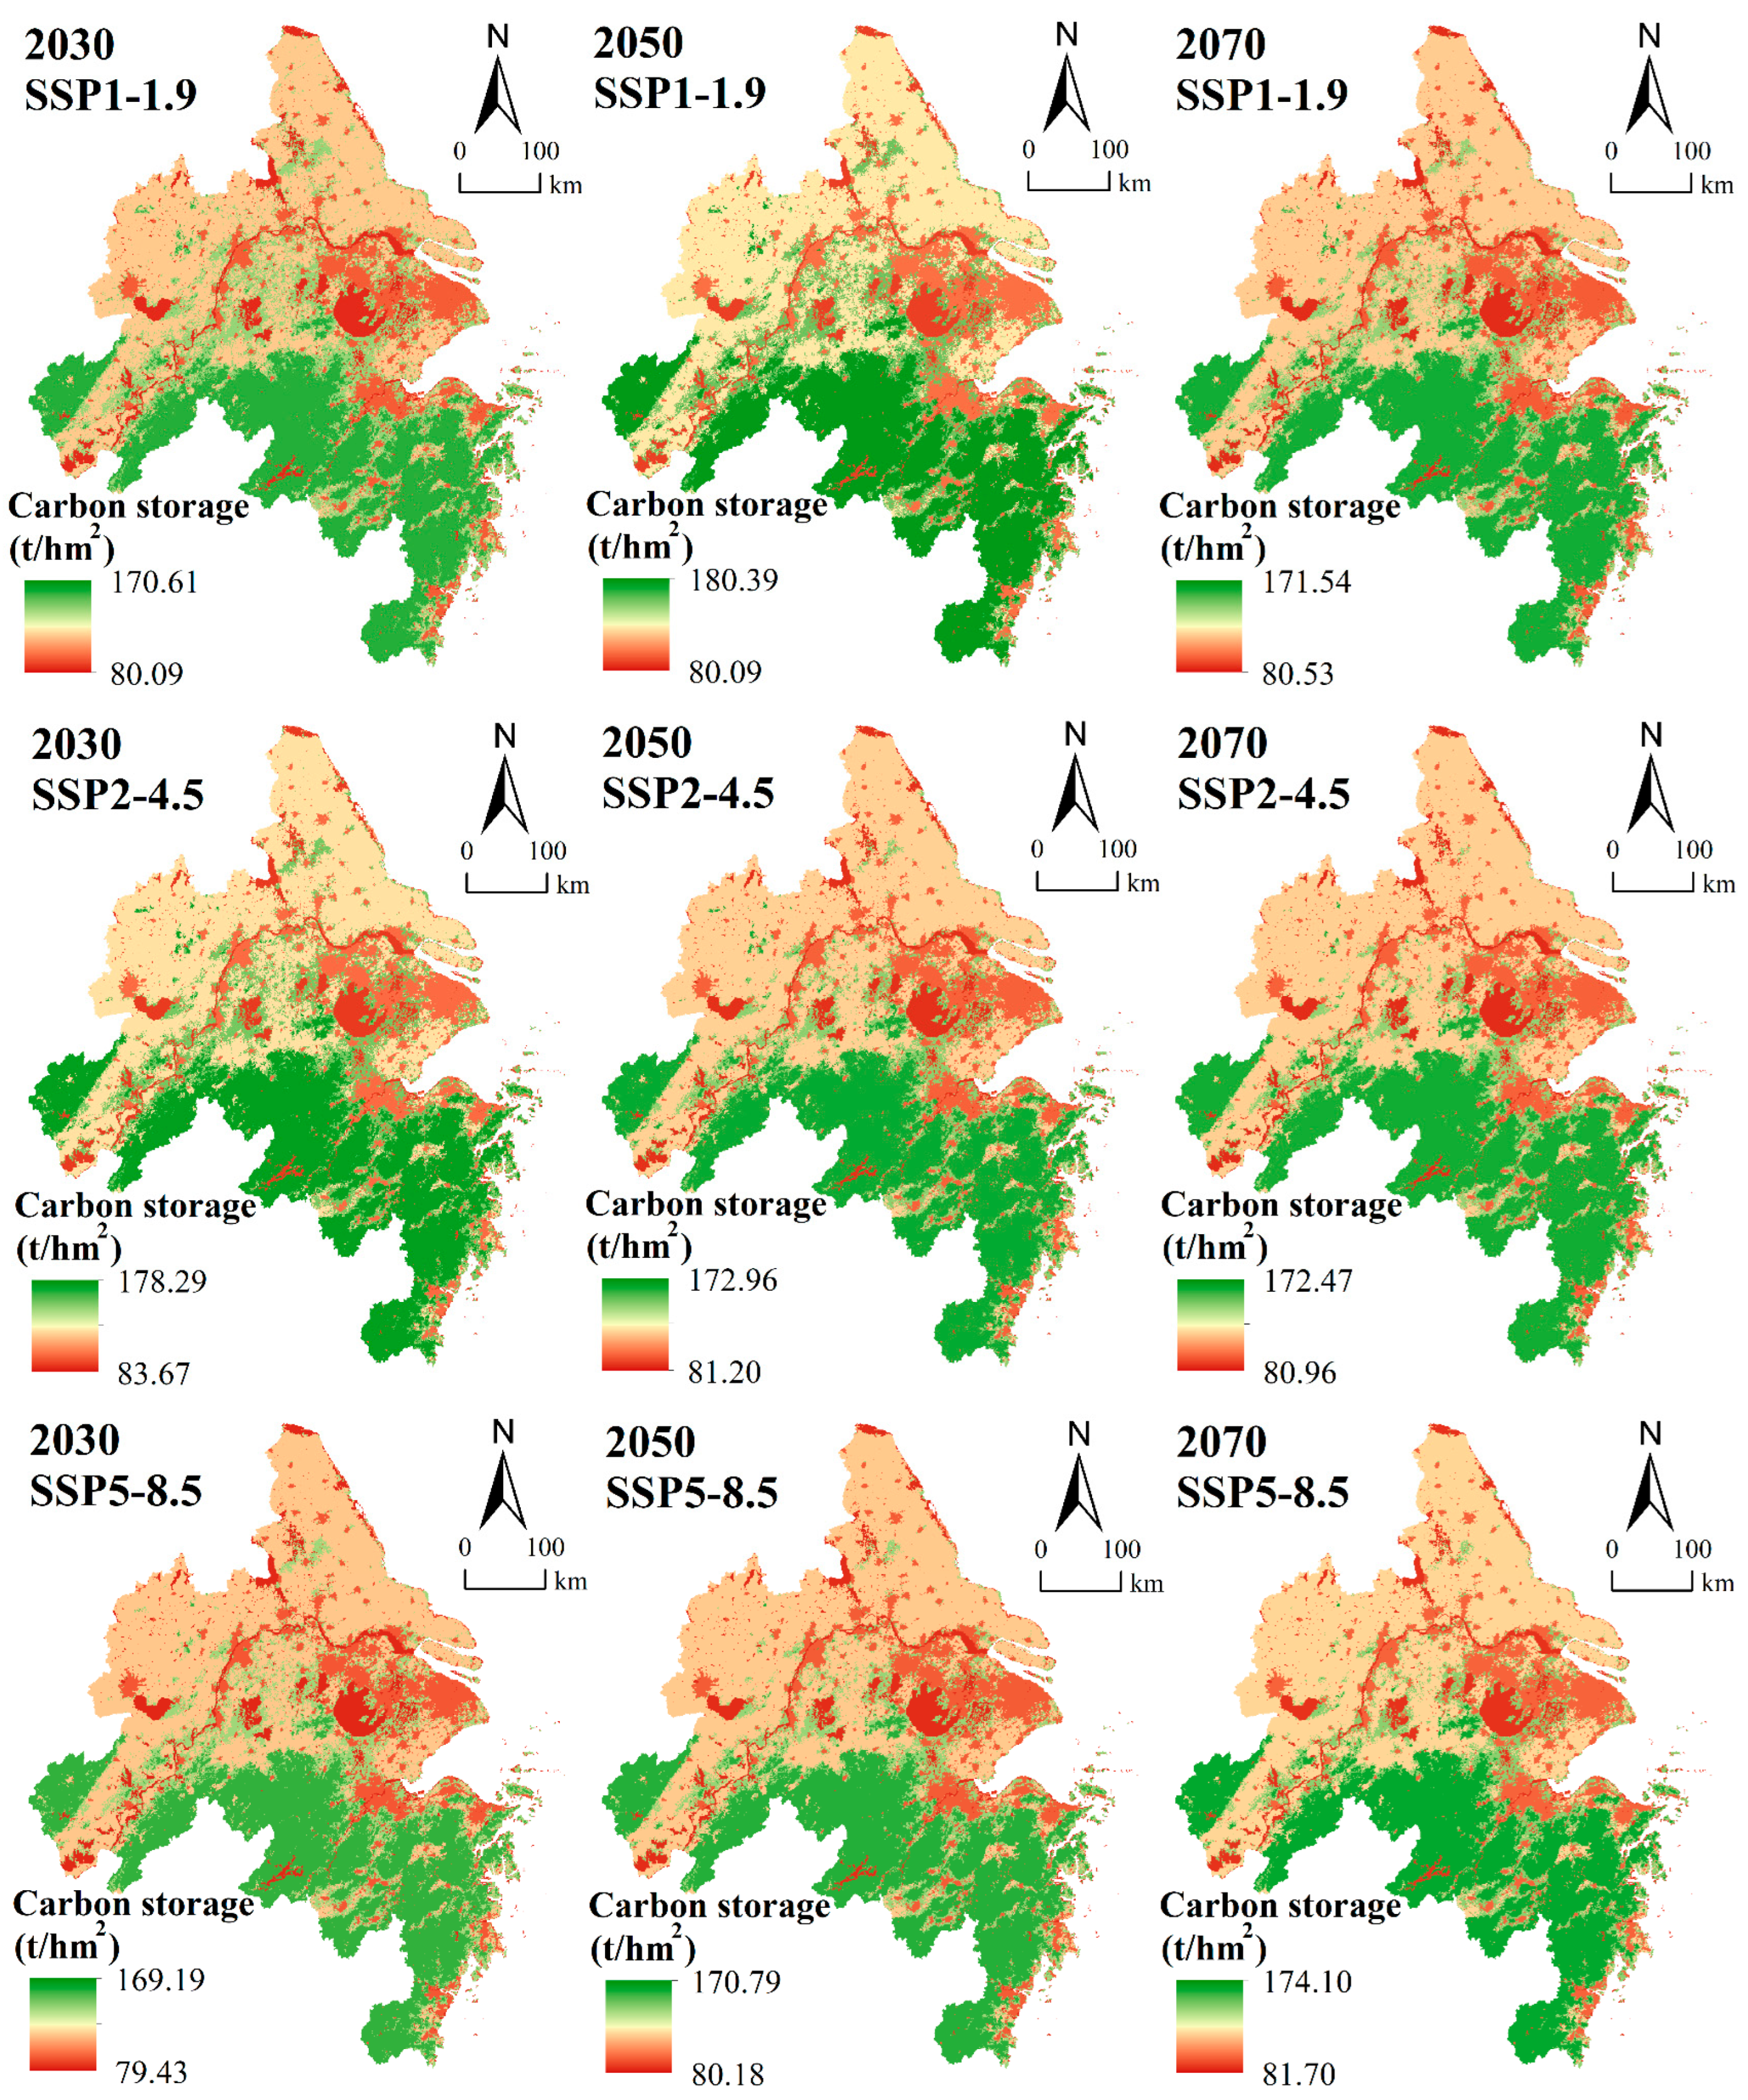
Across the YRDUA, the spatial patterns of CS under the SSP1-1.9, SSP2-4.5, and SSP5-8.5 scenarios for 2030, 2050, and 2070 show strong similarity, displaying a pronounced south–north gradient with higher levels in the south and lower levels toward the north (Figure 7). Over 2030–2070, CS increases consistently under SSP5-8.5, while under SSP1-1.9 it rises early on and then reverses into a decline. In contrast, the SSP2-4.5 scenario demonstrates a continuous downward trend. Areas with high CS values are predominantly located in the southern YRDUA, where forest dominates, and carbon density is relatively high. Low-value areas form fragmented clusters in the central region, particularly around Lake Taihu, the Yangtze River, and their tributaries. Medium-value areas are primarily distributed in the northern YRDUA, characterized by extensive cropland and grassland with moderate carbon density.
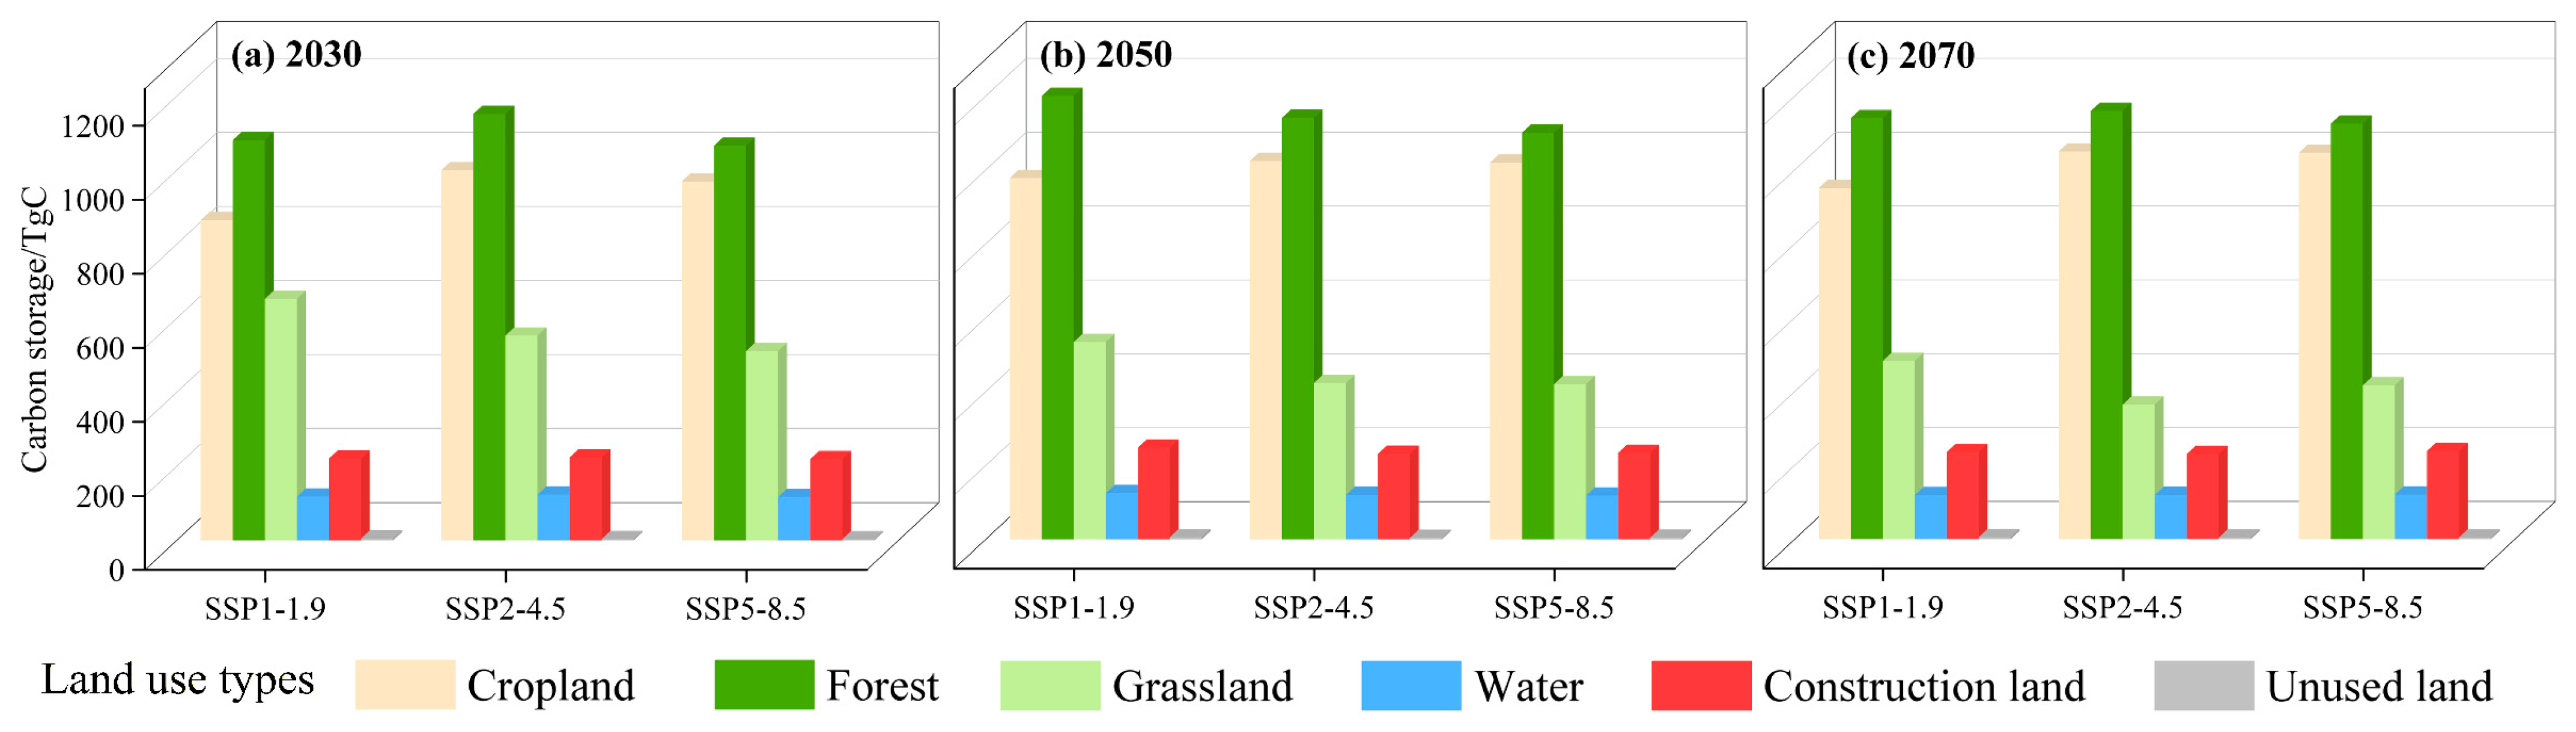
As shown in Figure 8, CS increases under all three scenarios from 2020 to 2030. Specifically, total CS in 2030 reaches 2944.74 Tg C, 3057.81 Tg C, and 2888.47 Tg C under SSP1-1.9, SSP2-4.5, and SSP5-8.5, respectively, all exceeding the 2020 baseline of 2873.72 Tg C. Among these scenarios, SSP2-4.5 exhibits the largest increase (184.09 Tg C), resulting in the highest total CS in 2030. Under this scenario, cropland and forest contribute more substantially to CS than in the other scenarios, whereas grassland CS is highest under SSP1-1.9. By 2050, the highest total CS occurs under SSP1-1.9, reaching 3092.39 Tg C, primarily driven by a substantial rise in forest CS. In contrast, by 2070, the largest CS is observed under the SSP5-8.5 scenario, where total CS reaches 2952.87 Tg C, reflecting divergent long-term land use trajectories among the scenarios. Across the entire 40-year period, forest consistently remains the dominant contributor to total CS, followed by cropland and grassland. Meanwhile, CS associated with water bodies and construction land displays minimal variation and remains relatively stable, and CS in unused land is negligible. Overall, these temporal and scenario-specific patterns demonstrate that long-term CS dynamics are strongly shaped by changes in forest and cropland distributions, underscoring their central role in determining future carbon sequestration potential.

3.3. Quantification of Impacts of LUC on CS

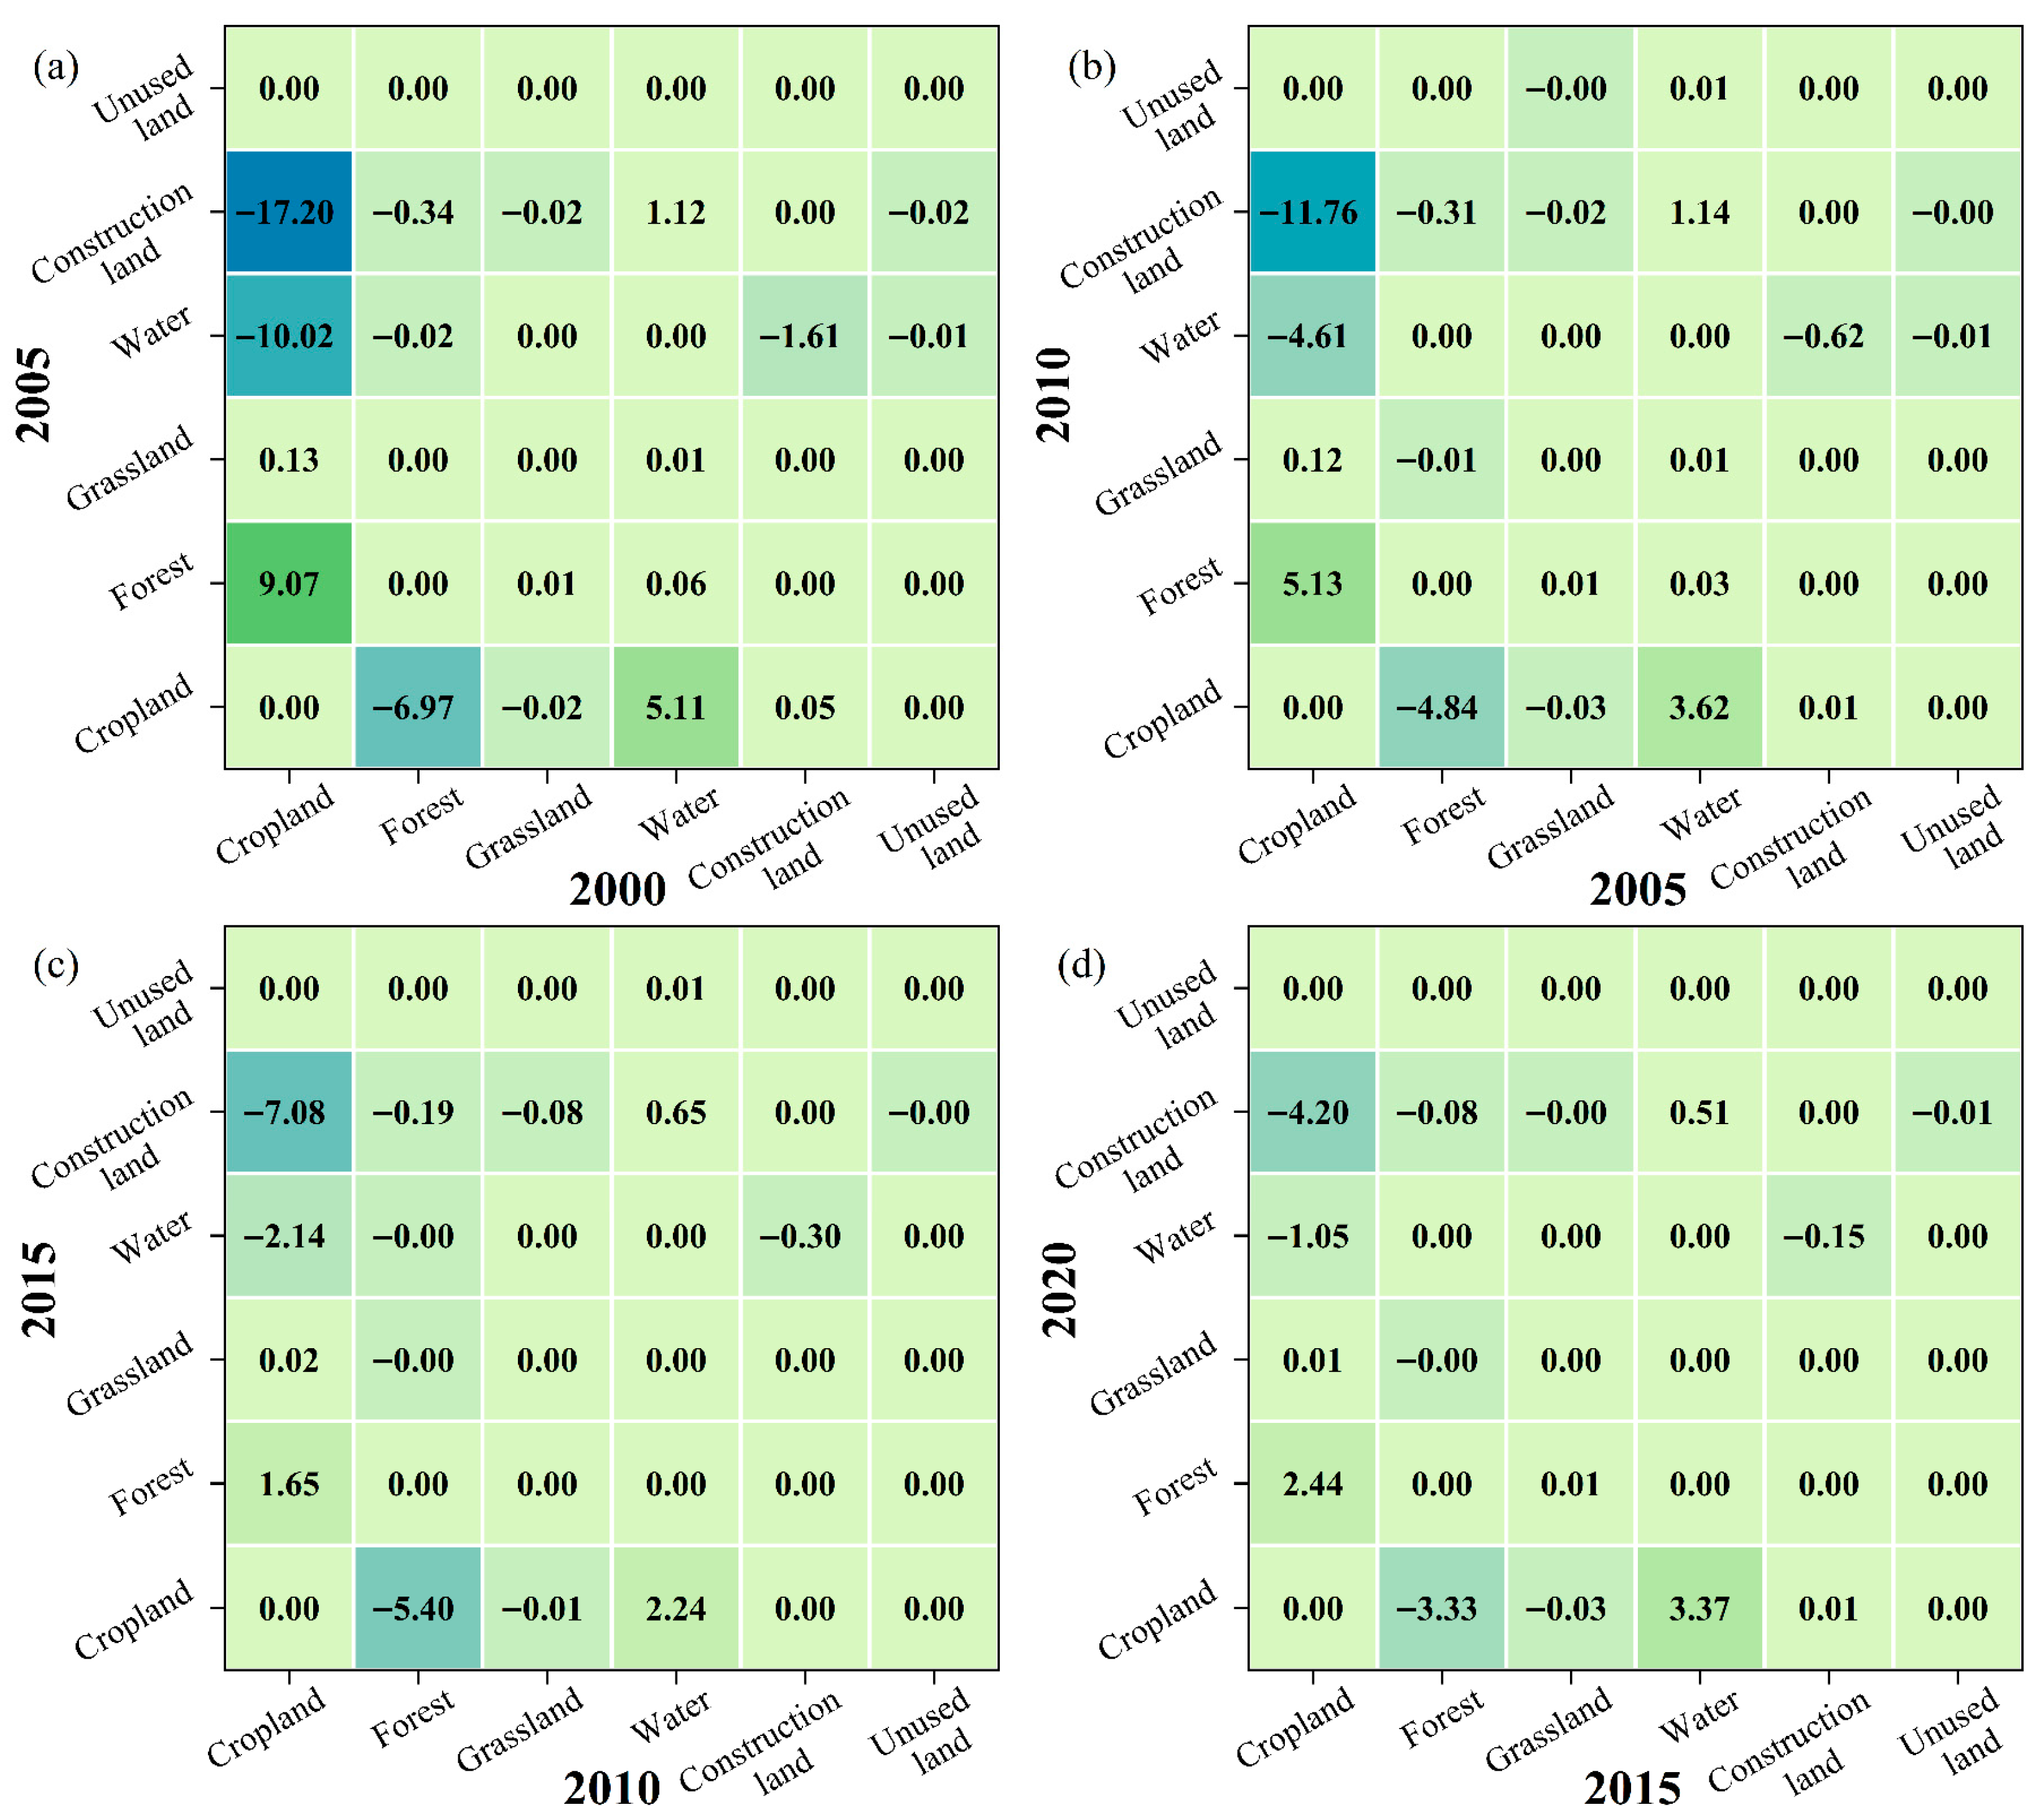
LUC exerted heterogeneous impacts on CS across the four study periods. During 2000–2005 (Figure 9a), the conversion of cropland to forest produced the greatest carbon gains (9.07%), followed closely by the transition of water bodies to cropland (5.11%) and construction land (1.12%). These transitions generally enhanced vegetation cover and increased soil organic carbon inputs, reflecting the recovery of biomass and soil carbon pools following agricultural reclamation. Additional carbon gains also resulted from conversions of cropland to grassland, water bodies to forest, and construction land to cropland. In contrast, substantial carbon losses were associated with the outflow of cropland and forest, particularly through the conversion of cropland to water bodies (−10.02%) and to construction land (−17.20%), likely driven by hydrological modifications and carbon-emitting processes linked to urban expansion. From 2005 to 2010 (Figure 9b), the overall pattern remained similar. Cropland-to-forest conversion continued to contribute the most to carbon gains (5.13%), followed by the conversion of water to cropland (3.62%) and construction land (1.14%). Cropland loss again served as the primary source of carbon decline, especially through conversions to construction land (−11.76%) and water bodies (−4.61%), reflecting ongoing urban intensification and land restructuring. The impact of LUC on CS generally decreased during 2010–2015 and 2015–2020 (Figure 9c,d). Water-to-cropland transitions yielded the highest carbon gains (2.24% and 3.37%), supplemented by conversions from cropland to forest and water to construction land. Carbon losses continued to be dominated by cropland conversion, particularly toward water bodies and construction land, likely associated with sustained urban expansion and adjustments to regional water system configurations. Transitions involving grassland and unused land had minimal impacts on CS due to their limited spatial extent. Overall, LUC in the YRDUA had a predominantly negative impact on CS across the four periods, although the intensity of this impact gradually diminished. The conversion of cropland to water bodies and construction land was the primary driver of the decline in regional CS.
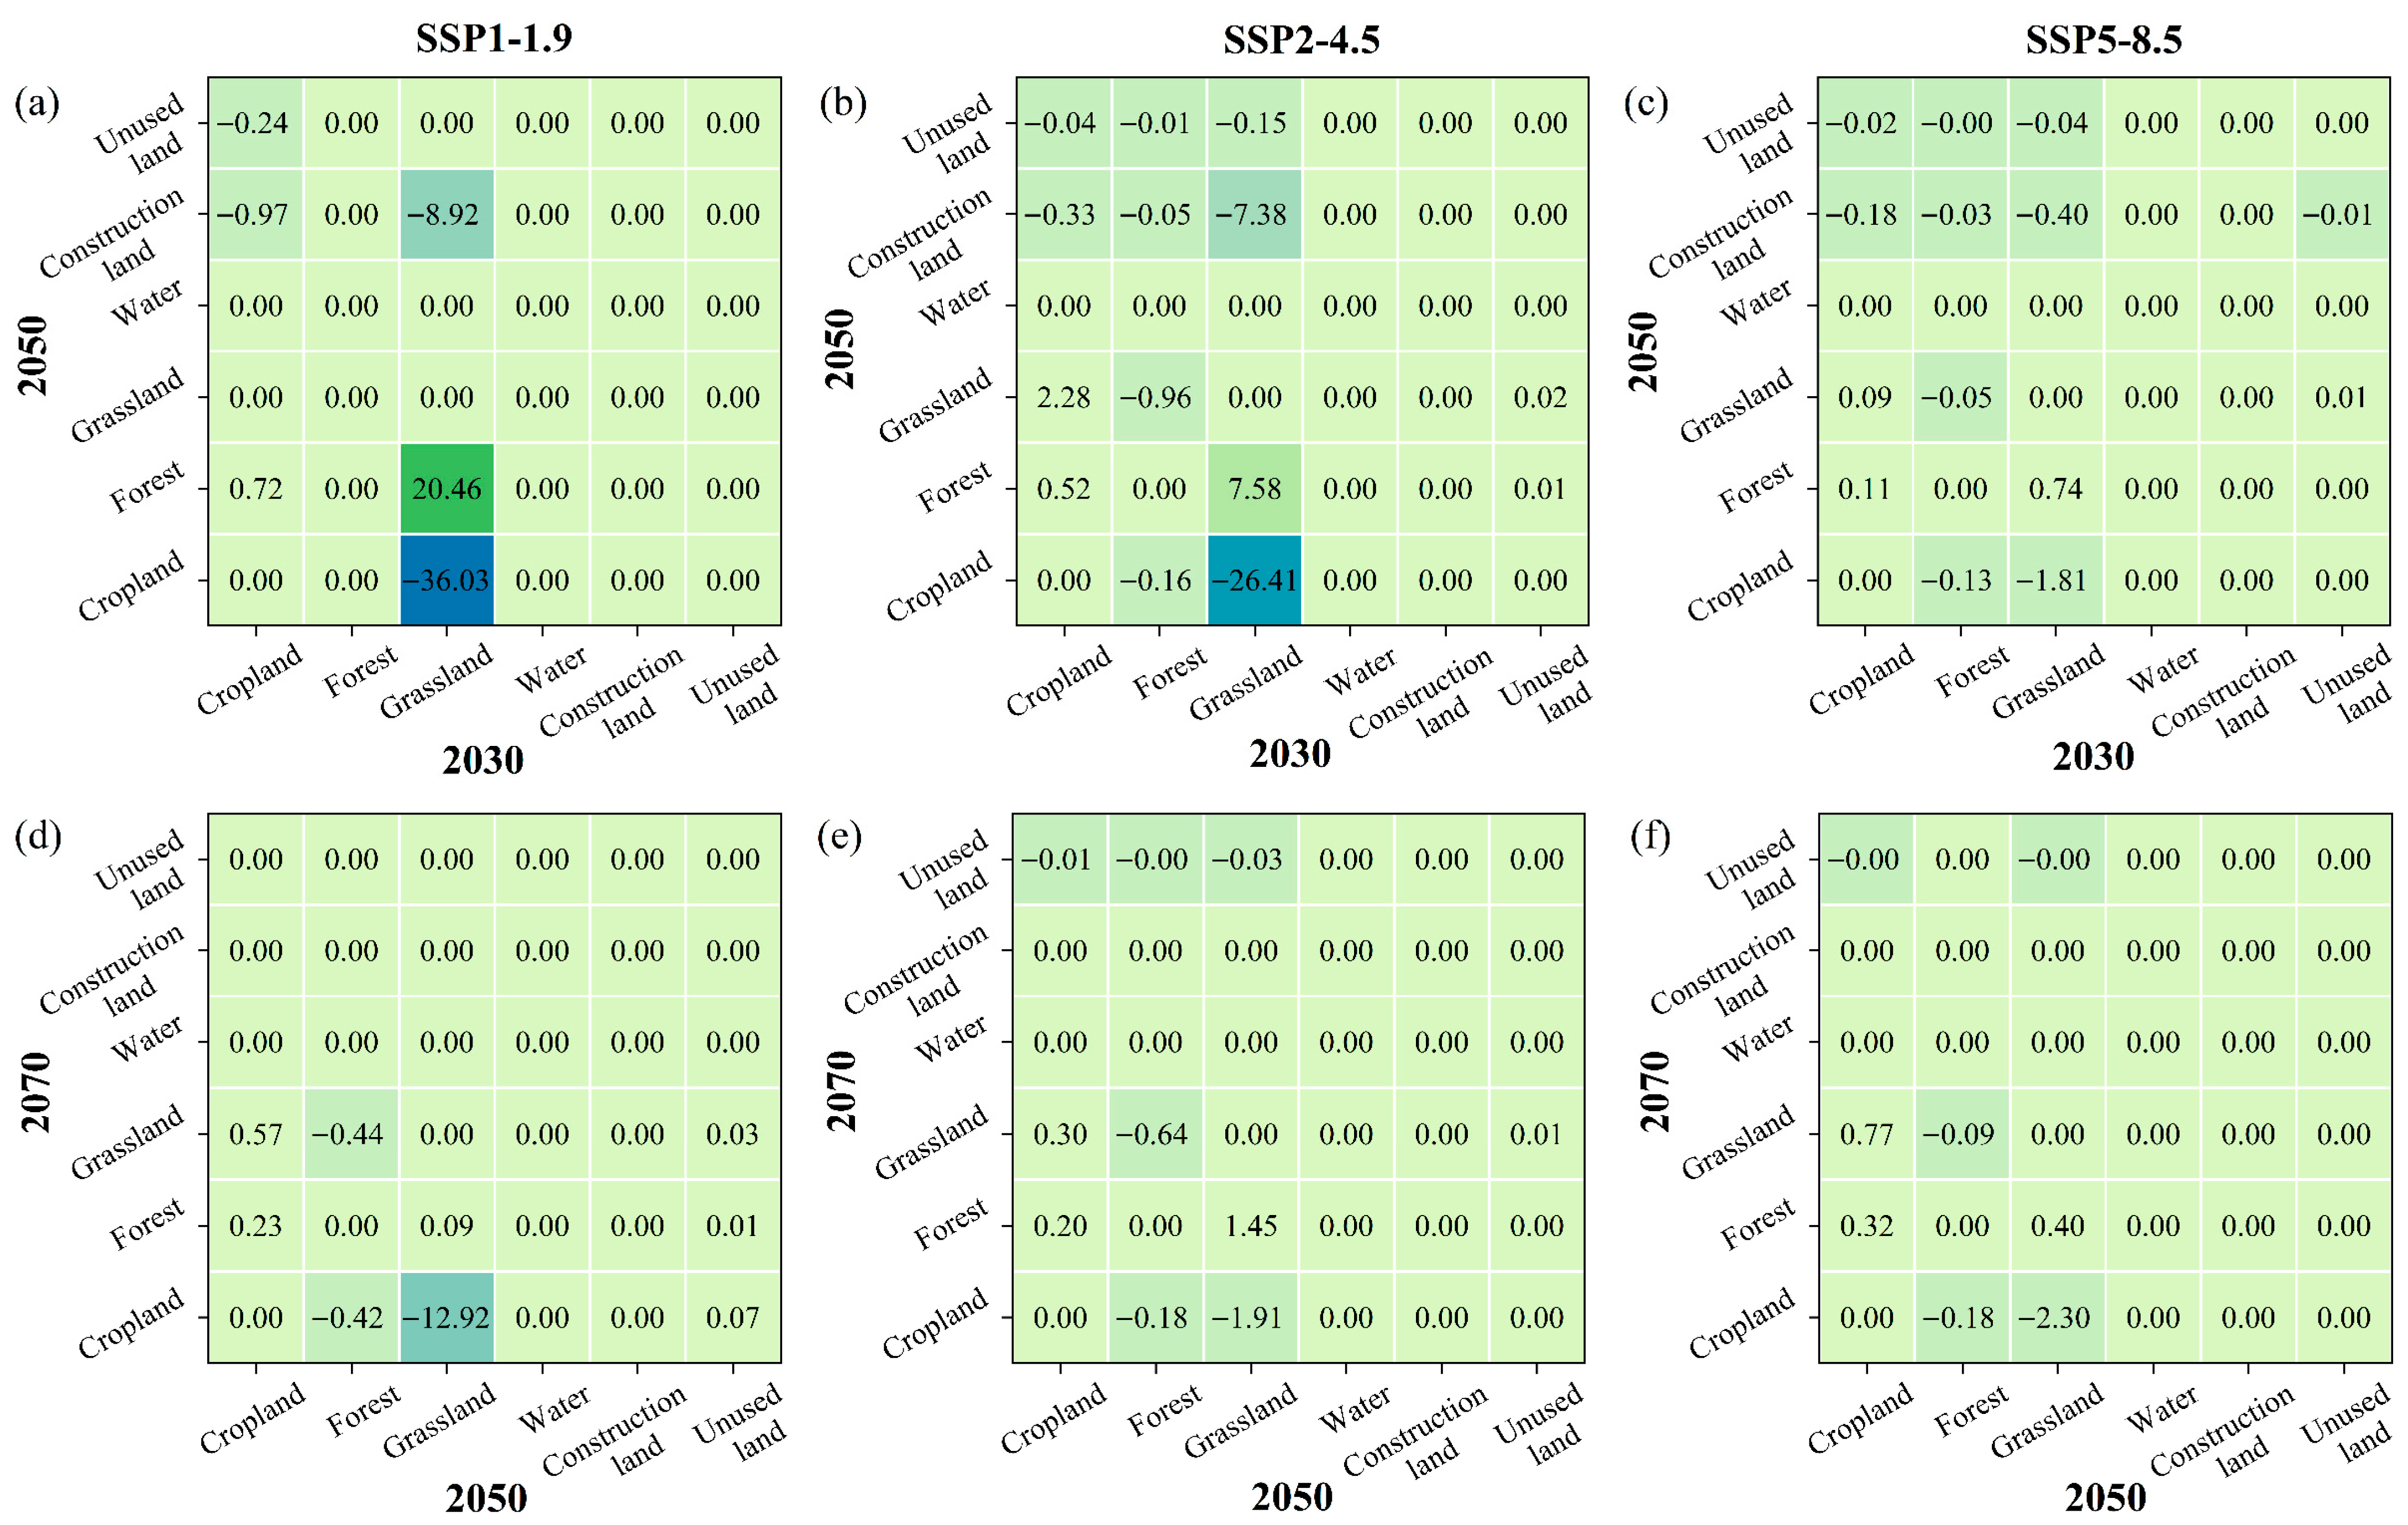
From 2030 to 2050, across the three scenarios (Figure 10a–c), the conversion of grassland to forest made the largest positive contribution to CS changes (0.74–20.46%), followed by cropland to forest (0.11–0.72%). In contrast, the conversion of grassland to cropland exerted the most significant negative impact (−36.03% to −1.81%), followed by grassland to construction land (−8.92% to 0.40%). The magnitude of contribution rates decreased progressively from the SSP1-1.9 scenario to SSP2-4.5 and then to SSP5-8.5. This trend suggests that under the more sustainable SSP1-1.9 pathway, active land-use management strategies—such as ecological restoration—exert a more pronounced effect on enhancing carbon stocks, yet the negative impact of grassland-to-cropland conversion is also maximized. In contrast, under the high-development SSP5-8.5 pathway, the diminished absolute contribution of LUC implies that carbon dynamics are likely driven by a more complex interplay of other pressures, such as intensive development or CC itself.
During the period 2050–2070 (Figure 10d–f), the impact of LUC on CS diminished significantly across all three scenarios, with positive contributions consistently falling below 1%. This suggests that ecosystems gradually stabilized over time, and adjustments in land use policies led to a reduction in large-scale land conversions. Nevertheless, the conversion of grassland to cropland remained the dominant driver of carbon loss across all scenarios, with negative contribution rates ranging from −12.92% to −1.91%. This was followed by forest-to-grassland conversion under the SSP1-1.9 and SSP2-4.5 scenarios, and forest-to-cropland conversion under the SSP5-8.5 scenario. The heterogeneity in secondary negative contributors objectively reflects the divergent focus of land-use regulation strategies in the later stages of different scenarios. Conversely, the consistency of the primary negative contributor underscores the universality and persistence of the impact of grassland-to-cropland conversion on CS dynamics.

4. Discussion

4.1. The Impact of Historical LUC on CS

From 2000 to 2020, CS in the YRDUA ranged from 2829.46 to 2941.96 Tg C (Figure 5), which aligns closely with the estimates of Wang et al. [18] and Zhou et al. [50], with minor discrepancies primarily attributed to differences in carbon density correction and land use datasets. During this period, a substantial conversion of cropland to construction land occurred within the YRDUA (Figure 4). Consequently, total CS in cropland exhibited a continuous decline, while that of construction land increased steadily (Figure 6), a trend consistent with the findings of Wang et al. [18].
The contribution of LUC to CS exhibited phasic differences. During 2000–2005, CS increased by 112.5 Tg C, which was primarily driven by carbon gains from the conversion of cropland to forest (+9.07%) and water bodies to cropland (+5.11%), reflecting enhanced vegetation recovery and soil carbon sequestration. However, significant carbon losses were simultaneously incurred due to the conversion of cropland to water bodies (−10.02%) and cropland to construction land (−17.20%). This pattern aligns with the findings of Zhu et al. [51] regarding the direction and ranking of land use conversion contributions to CS in Hangzhou City. The net increase in CS during this phase was also associated with the orderly expansion of construction land and the controlled occupation of ecological land [18,52].
However, from 2005 to 2015, CS experienced a sustained decline, resulting in a net loss of 107.96 Tg C [17,53]. During this period, substantial areas of cropland were converted to construction land and water bodies, while portions of forestland were cleared for agriculture, resulting in sustained CS losses. Consistently, Gai et al. [54] reported for the Sanjiang Plain (a black-soil region) that LUC driven by socioeconomic and policy factors—such as construction-land expansion, encroachment on cropland and forestland, and increased land use intensity—can cause a pronounced decline in CS. In addition, agricultural restructuring policies encouraged the conversion of low-lying or low-yield cropland into aquaculture ponds, further reducing CS [55,56].
After 2015, with the elevation of “ecological civilization construction” to a national strategic priority and the implementation of the strictest farmland protection policies and ecological conservation redlines, regional ecological protection efforts were significantly reinforced. As a result, CS rebounded modestly by 2020, increasing by 39.72 Tg C, indicating the effectiveness of strengthened ecological governance.

4.2. The Impacts of LUC in Future Scenarios on CS

Under future multi-scenario projections, the spatiotemporal evolution of CS in the YRDUA profoundly reveals how divergent development pathways regulate regional carbon sink functions through LUC. Although the SSP1-1.9, SSP2-4.5, and SSP5-8.5 scenarios all exhibit a spatial pattern of ‘high in the south and low in the north,’ their long-term CS dynamics differ distinctly. These differences represent the concrete manifestation of varying socioeconomic-climate coupling relationships within the land system.
Under the sustainable pathway (SSP1-1.9), active land-use management drives substantial gains in carbon sinks. This scenario achieves the largest increase in CS between 2030 and 2050, primarily benefiting from the conversion of grassland to forest, which constitutes the largest source of carbon gain (contributing 20.46% to the total change). This finding intuitively reflects the priority given to ecological restoration policies. However, the concurrent conversion of grassland to cropland causes the most significant carbon loss during the same period, revealing a direct conflict and trade-off between agricultural expansion demands and ecological conservation goals. The scenario is projected to reach a CS peak in 2050, demonstrating the effectiveness of systemic ecological policies. Nevertheless, a risk of decline emerges from 2050 to 2070, where the negative contribution of grassland-to-cropland conversion far outweighs that of other land transitions. Therefore, if the YRDUA follows the SSP1-1.9 sustainable development pathway, particular attention must be paid to strictly monitoring and controlling the conversion of grassland to cropland.
Compared to the other two scenarios, the SSP2-4.5 scenario exhibits a relatively higher CS level in 2030, driven by carbon gains from cultivated land and forest conservation. However, this is followed by a continuous decline. This downward trend is similarly dominated by the conversion of grassland to cropland, with the conversion of grassland to construction land also contributing a substantial proportion to carbon loss between 2030 and 2050. This pattern suggests that under the ‘middle-of-the-road’ pathway—which lacks fundamental transformation—early policy dividends are difficult to sustain. Furthermore, the intensity of later-stage policies is insufficient to offset the carbon losses caused by urban expansion and land development.
In contrast, under the high-energy-consumption and high-emission SSP5-8.5 scenario, although the absolute contribution rate of land-use conversion to CS is the lowest, the total CS in this scenario surpasses that of the other scenarios by 2070. Compared to the other two pathways, the sum of CS in cropland and grassland is highest under SSP5-8.5. While Li et al. [57] reported a continuous declining trend in CS for China under SSP5-8.5, this decline is not uniform across all regions. For instance, Chang et al. [58] found that CS in the Yellow River Basin increased slightly under the SSP5-8.5 scenario. This increase was primarily attributed to the expansion of grassland and cropland, which collectively constitute the dominant land classes in that region.

4.3. Recommendations for Increasing CS Under Different Scenarios

The YRDUA, as a core region for advancing Chinese-style modernization, holds substantial strategic importance under the dual context of the national “dual-carbon” goals and high-quality regional integration [35]. However, rapid economic expansion and intensified land development have altered ecosystem structures and weakened terrestrial carbon sequestration capacity. To promote sustainable regional development and achieve the “dual-carbon” targets, several policy priorities are recommended:
(1)
As vegetation and soils constitute the primary terrestrial carbon pools, ecological restoration efforts—such as converting cropland to forest—should be further strengthened, with emphasis on conserving and rehabilitating forest ecosystems. Establishing nature reserves and ecological corridors can safeguard key carbon sink areas. Expanding carbon-sink forests, advancing urban greening, and implementing restorative vegetation planting, coupled with scientific tree-species selection, will enhance forest growth and carbon accumulation.
(2)
Given the high CS potential of cropland and forest, governments should formulate and strictly enforce evidence-based land use plans. Clearly delineating and maintaining spatial boundaries for cropland, forest, and grassland is essential to prevent overdevelopment. Cropland protection must be reinforced through strict controls on its conversion to construction land to ensure compliance with the cropland protection redline.
(3)
Adaptive land-use planning is crucial to address the divergent CS trajectories predicted under different SSP-RCP scenarios. Under the SSP5-8.5 scenario, where an increase in CS is projected, priority should be given to enhancing carbon sinks through intensified forest management, ecological agriculture, urban greening, and wetland conservation. Conversely, to mitigate the anticipated decline under the SSP2-4.5 scenario, interventions must focus on strict cropland protection, land consolidation, and the restoration of degraded ecosystems.
(4)
Strengthening cropland protection policies, optimizing agricultural structures, and improving land use efficiency are critical to reducing cropland conversion and mitigating its adverse impacts on regional CS. Greater emphasis should be placed on advancing ecological civilization and upholding the “Two Mountains” principle. Promoting ecological industries will help achieve the “dual-carbon” goals while maintaining stable and sustainable CS.

4.4. Strengths and Limitations

This study is distinguished by the calibration of future carbon densities based on climate projections. By integrating climate–socioeconomic scenarios, it provides a novel assessment of the contribution of LUC to carbon stock dynamics across both historical and future periods.
However, carbon density calculations primarily rely on climate factors for adjustment, neglecting the impact of LUC and vegetation dynamics on it. This limitation may lead to an underestimation or overestimation of the contributions of specific LUCs to CS. Future studies should incorporate additional factors, such as root-to-shoot ratios, stand age structure, and soil bulk density, into carbon density corrections to enhance the accuracy of CS estimates. Furthermore, while this paper analyzed the direct impact of LUC on CS, future research should utilize models such as the Geodetector to investigate indirect drivers. This will provide a scientific basis for decision-making to enhance regional carbon sink capacity. Furthermore, carbon stocks are influenced by the complex interplay of land use, CC, and human activities. Future research should aim to develop a framework to disentangle and quantify their independent contributions.

5. Conclusions

This study calculated the CS of the YRDUA based on carbon densities corrected by temperature and precipitation. We analyzed the dynamic characteristics of historical LUC and CS and quantified the contribution of LUC to CS variations. Finally, strategies to enhance the region’s carbon sink capacity are proposed, providing theoretical support for urban carbon management. The principal conclusions drawn from this study are as follows:
(1)
From 2000 to 2020, the YRDUA experienced pronounced LUC, characterized by continuous cropland loss (from 54.72% to 49.60%) and rapid expansion of construction land (from 6.05% to 12.55%), reflecting intensified urbanization and growing development pressure on cultivated land resources.
(2)
CS exhibited a net increasing trend despite fluctuations, rising from 2829.46 Tg C in 2000 to 2873.72 Tg C in 2020. The spatial pattern remained stable, with higher CS in southern areas and lower ones in northern areas.
(3)
Under SSP-RCP scenarios, forestland consistently remains the dominant carbon sink, followed by cropland. CS is projected to increase under SSP5-8.5, to fluctuate under SSP1-1.9, and to decline under SSP2-4.5, highlighting strong scenario-dependent variability in future CS trajectories.
(4)
Historically, the conversion of cropland to forest during 2000–2010 and water to cropland during 2010–2020 were the primary contributors to carbon stock increases. In contrast, the conversion of cropland to impervious land made the largest negative contribution to carbon stocks from 2000 to 2020. For the future period (2030–2070), while the dominant land-use transitions driving positive carbon stock changes varied by year and scenario, the conversion of grassland to forest remained the most significant. Conversely, the conversion of grassland to cropland was consistently identified as the dominant driver of negative CS changes across all future scenarios.

Author Contributions

Conceptualization, H.Z.; methodology, Y.W. and H.Z.; software, Y.W. and C.C.; investigation, C.C.; data curation, C.C. and Y.W.; writing—original draft preparation, Y.W.; writing—review and editing, H.Z. and Y.W.; visualization, Y.W. and C.C.; funding acquisition, Y.W. and H.Z. All authors have read and agreed to the published version of the manuscript.

Funding

This research was funded by the Student Innovation and Entrepreneurship Training Program at Zhejiang University of Water Resources and Electric Power (Grant No. 202511481028), the Zhejiang Provincial University Student Science and Technology Innovation Activity Plan (Xinmiao Talent Plan) (Grant No. 2025R422A005), and the Joint Funds of the Zhejiang Provincial Natural Science Foundation of China (Grant No. LZJWY23E090004).

Data Availability Statement

The datasets used and analyzed during the current study are available from the corresponding author on reasonable request.

Conflicts of Interest

The authors declare no conflicts of interest.

Abbreviations

The following abbreviations are used in this manuscript:
CSCarbon Storage
YRDUAYangtze River Delta Urban Agglomeration
LUCLand Use Change
CCClimate Change
IPCCIntergovernmental Panel on Climate Change
SSPsShared Socio-economic Pathways
RCPsRepresentative Concentration Pathways

References

  1. Li, G.; Fang, C.; Li, Y.; Wang, Z.; Sun, S.; He, S.; Qi, W.; Bao, C.; Ma, H.; Fan, Y.; et al. Global impacts of future urban expansion on terrestrial vertebrate diversity. Nat. Commun. 2022, 13, 1628. [Google Scholar] [CrossRef]
  2. Bellard, C.; Marino, C.; Courchamp, F. Ranking threats to biodiversity and why it doesn’t matter. Nat. Commun. 2022, 13, 2616. [Google Scholar] [CrossRef]
  3. Wang, Y.; Liang, D.; Wang, J.; Zhang, Y.; Chen, F.; Ma, X. An analysis of regional carbon stock response under land use structure change and multi-scenario prediction, a case study of Hefei, China. Ecol. Indic. 2023, 151, 110293. [Google Scholar] [CrossRef]
  4. Liang, Y.; Hashimoto, S.; Liu, L. Integrated assessment of land-use/land-cover dynamics on carbon storage services in the Loess Plateau of China from 1995 to 2050. Ecol. Indic. 2021, 120, 106939. [Google Scholar] [CrossRef]
  5. Wang, S.; Zhou, S.; Fang, C. Spatial-temporal patterns and evolution of carbon storage in China’s terrestrial ecosystems from 1980 to 2020. Sci. China Earth Sci. 2024, 54, 3323–3339. (In Chinese) [Google Scholar] [CrossRef]
  6. Li, J.; Guo, X.; Chuai, X.; Xie, F.; Yang, F.; Gao, R.; Ji, X. Reexamine China’s terrestrial ecosystem carbon balance under land use-type and climate change. Land Use Policy 2021, 102, 105275. [Google Scholar] [CrossRef]
  7. Chang, X.; Xing, Y.; Wang, J.; Yang, H.; Gong, W. Effects of land use and cover change (LUCC) on terrestrial carbon stocks in China between 2000 and 2018. Resour. Conserv. Recycl. 2022, 182, 106333. [Google Scholar] [CrossRef]
  8. Li, X.; Jin, X.; Zhang, X.; Jin, Y.; Feng, H. Dynamic Evolution and Prediction of Land Use and Carbon Storage in Gansu ProvinceBased on SSP-RCP Scenario. Environ. Sci. 2025, 46, 7058–7069. (In Chinese) [Google Scholar] [CrossRef]
  9. Li, D.; Ning, Z.; Chen, G.; Li, Y.; Cui, B.; Wang, Q.; Xie, T. The effect of land use and land cover on soil carbon storage in the Yellow River Delta, China: Implications for wetland restoration and adaptive management. J. Environ. Manag. 2024, 367, 122097. [Google Scholar] [CrossRef] [PubMed]
  10. Liu, X.; Wang, S.; Wu, P.; Feng, K.; Hubacek, K.; Li, X.; Sun, L. Impacts of Urban Expansion on Terrestrial Carbon Storage in China. Environ. Sci. Technol. 2019, 53, 6834–6844. [Google Scholar] [CrossRef] [PubMed]
  11. Wang, Z.; Xu, L.; Shi, Y.; Ma, Q.; Wu, Y.; Lu, Z.; Mao, L.; Pang, E.; Zhang, Q. Impact of Land Use Change on Vegetation Carbon Storage During Rapid Urbanization: A Case Study of Hangzhou, China. Chin. Geogr. Sci. 2021, 31, 209–222. [Google Scholar] [CrossRef]
  12. Wu, S.; Li, J.; Zhou, W.; Lewis, B.J.; Yu, D.; Zhou, L.; Jiang, L.; Dai, L. A statistical analysis of spatiotemporal variations and determinant factors of forest carbon storage under China’s Natural Forest Protection Program. J. For. Res. 2018, 29, 415–424. [Google Scholar] [CrossRef]
  13. Huang, Q.; Robinson, D.T.; Parker, D.C. Quantifying spatial–temporal change in land-cover and carbon storage among exurban residential parcels. Landsc. Ecol. 2014, 29, 275–291. [Google Scholar] [CrossRef]
  14. Chu, X.; Zhan, J.; Li, Z.; Zhang, F.; Qi, W. Assessment on forest carbon sequestration in the Three-North Shelterbelt Program region, China. J. Clean. Prod. 2019, 215, 382–389. [Google Scholar] [CrossRef]
  15. Li, K.; Cao, J.; Adamowski, J.F.; Biswas, A.; Zhou, J.; Liu, Y.; Zhang, Y.; Liu, C.; Dong, X.; Qin, Y. Assessing the effects of ecological engineering on spatiotemporal dynamics of carbon storage from 2000 to 2016 in the Loess Plateau area using the InVEST model: A case study in Huining County, China. Environ. Dev. 2021, 39, 100641. [Google Scholar] [CrossRef]
  16. Yang, D.; Liu, W.; Tang, L.; Chen, L.; Li, X.; Xu, X. Estimation of water provision service for monsoon catchments of South China: Applicability of the InVEST model. Landsc. Urban Plan. 2019, 182, 133–143. [Google Scholar] [CrossRef]
  17. Yu, T.; Yang, M.; Li, X.; Zhu, X.; Wang, M.; Niu, J. Land Use Simulation and Carbon Storage Driving Mechanisms in Resource-Based Regions Under SSP-RCP Scenarios: An Integrated PLUS-InVEST and GWR-SEM Modeling Approach. Land 2025, 14, 2280. [Google Scholar] [CrossRef]
  18. Wang, W.; Fu, T.; Chen, H. Spatio-temporal Evolution and Prediction of Carbon Storage in the Yangtze River DeltaUrban Agglomeration Based on PLUS-InVEST Model. Environ. Sci. 2025, 46, 1937–1950. [Google Scholar] [CrossRef]
  19. Wang, H.; Wu, L.; Yue, Y.; Jin, Y.; Zhang, B. Impacts of climate and land use change on terrestrial carbon storage: A multi-scenario case study in the Yellow River Basin (1992–2050). Sci. Total Environ. 2024, 930, 172557. [Google Scholar] [CrossRef]
  20. Deng, X.; Sun, T.; Zhou, D.; Li, Y.; Zhang, C.; Li, Y.; Yang, J.; Wang, A.; Yu, J.; Wu, H. Significant negative impact of human activities on carbon storage in the Yellow River Delta over the past three decades. Sci. Total Environ. 2024, 956, 177257. [Google Scholar] [CrossRef]
  21. Liu, K.; Wu, B.; Gao, F.; Chen, Y.; He, B.; Waheed, A.; Aili, A.; Xu, Z.; Han, F.; Xu, H. Dynamic simulation and key influencing factors of carbon storage in the water-depleted zones of an arid Inland River Basin: Insights from the Tarim River mainstream. Ecol. Inform. 2025, 90, 103286. [Google Scholar] [CrossRef]
  22. Feng, Y.; Chen, S.; Tong, X.; Lei, Z.; Gao, C.; Wang, J. Modeling changes in China’s 2000–2030 carbon stock caused by land use change. J. Clean. Prod. 2020, 252, 119659. [Google Scholar] [CrossRef]
  23. Ma, J.; Hao, Z.; Shen, Y.; Zhen, Z. Spatial-temporal evolution of carbon storage and its driving factors in the Shanxi section of the Yellow River Basin, China. Ecol. Model. 2025, 502, 111039. [Google Scholar] [CrossRef]
  24. Liu, J.; Yang, K.; Zhang, S.; Zeng, W.; Yang, X.; Rao, Y.; Ma, Y.; Bi, C. Carbon Storage Response to Land Use/Land Cover Changes and SSP-RCP Scenarios Simulation: A Case Study in Yunnan Province, China. Ecol. Evol. 2025, 15, e70780. [Google Scholar] [CrossRef] [PubMed]
  25. Sun, B.; Wang, H.; Wu, X.; Bi, N.; Wang, G.; Wang, M.; Wang, B. Dual impacts of human activities on land cover and carbon storage in the Yellow River Delta (1986–2023). Ocean Coast. Manag. 2025, 267, 107655. [Google Scholar] [CrossRef]
  26. Li, Y.; Tu, Y.; Sun, T.; Duan, Y.; Kou, J.; Li, W.; Gao, J. Source apportionment of organic carbon and nitrogen in sediments from river and lake in the highly urbanized Changjiang Delta. J. Hazard. Mater. 2024, 478, 135590. [Google Scholar] [CrossRef]
  27. Li, L.; Huang, X.; Yang, H. Optimizing land use patterns to improve the contribution of land use planning to carbon neutrality target. Land Use Policy 2023, 135, 106959. [Google Scholar] [CrossRef]
  28. Fan, L.; Cai, T.; Wen, Q.; Han, J.; Wang, S.; Wang, J.; Yin, C. Scenario simulation of land use change and carbon storage response in Henan Province, China: 1990–2050. Ecol. Indic. 2023, 154, 110660. [Google Scholar] [CrossRef]
  29. Zhang, Z.; Li, X.; Du, S.; Shi, C.; Shi, Z.; Sun, Y. Land use and carbon stock changes in China: Spatiotemporal evolution and forecasting analysis. Gondwana Res. 2025, 152, 195–211. [Google Scholar] [CrossRef]
  30. Chen, Z.; Wei, K.; Hu, L.; Yi, C.; Liu, S. Spatiotemporal variation and driving forces of carbon storage in the Fuhe river basin, China. Sci. Rep. 2025, 15, 30224. [Google Scholar] [CrossRef]
  31. Mottl, O.; Flantua, S.G.A.; Bhatta, K.P.; Felde, V.A.; Giesecke, T.; Goring, S.; Grimm, E.C.; Haberle, S.; Hooghiemstra, H.; Ivory, S.; et al. Global acceleration in rates of vegetation change over the past 18,000 years. Science 2021, 372, 860–864. [Google Scholar] [CrossRef] [PubMed]
  32. Cook, B.I.; Mankin, J.S.; Marvel, K.; Williams, A.P.; Smerdon, J.E.; Anchukaitis, K.J. Twenty-First Century Drought Projections in the CMIP6 Forcing Scenarios. Earth’s Future 2020, 8, e2019EF001461. [Google Scholar] [CrossRef]
  33. Eyring, V.; Bony, S.; Meehl, G.A.; Senior, C.A.; Stevens, B.; Stouffer, R.J.; Taylor, K.E. Overview of the Coupled Model Intercomparison Project Phase 6 (CMIP6) experimental design and organization. Geosci. Model Dev. 2016, 9, 1937–1958. [Google Scholar] [CrossRef]
  34. Deng, L.; Liu, G.-b.; Shangguan, Z.-p. Land-use conversion and changing soil carbon stocks in China’s ‘Grain-for-Green’ Program: A synthesis. Glob. Change Biol. 2014, 20, 3544–3556. [Google Scholar] [CrossRef]
  35. Liang, M.S.; Huang, G.H.; Chen, J.P.; Li, Y.P. Energy-water-carbon nexus system planning: A case study of Yangtze River Delta urban agglomeration, China. Appl. Energy 2022, 308, 118144. [Google Scholar] [CrossRef]
  36. Li, H.; Hu, Y.; Li, H.; Ren, J.; Shao, R.; Liu, Z. Assessing the Impact of Spatiotemporal Evolution of Urbanization on Carbon Storage in the Mega-Urban Agglomeration Area: Case Study of Yangtze River Delta Urban Agglomeration, China. Sustainability 2023, 15, 14548. [Google Scholar] [CrossRef]
  37. Yang, J.; Huang, X. The 30 m annual land cover dataset and its dynamics in China from 1990 to 2019. Earth Syst. Sci. Data 2021, 13, 3907–3925. [Google Scholar] [CrossRef]
  38. Liao, W.; Liu, X.; Xu, X.; Chen, G.; Liang, X.; Zhang, H.; Li, X. Projections of land use changes under the plant functional type classification in different SSP-RCP scenarios in China. Sci. Bull. 2020, 65, 1935–1947. [Google Scholar] [CrossRef]
  39. Zhou, J.; Jiang, S.; Mondal, S.K.; Huang, J.; Su, B.; Kundzewicz, Z.W.; Chen, Z.; Xu, R.; Jiang, T. China’s Socioeconomic and CO2 Status Concerning Future Land-Use Change under the Shared Socioeconomic Pathways. Sustainability 2022, 14, 3065. [Google Scholar] [CrossRef]
  40. Chen, G.; Li, X.; Liu, X. Global land projection based on plant functional types with a 1-km resolution under socio-climatic scenarios. Sci. Data 2022, 9, 125. [Google Scholar] [CrossRef]
  41. Jin, X.; Chang, B.; Huang, Y.; Lin, X. Assessment of Climate Change and Land Use/Land Cover Effects on Aralia elata Habitat Suitability in Northeastern China. Forests 2024, 15, 153. [Google Scholar] [CrossRef]
  42. Zafar, Z.; Zubair, M.; Zha, Y.; Mehmood, M.S.; Rehman, A.; Fahd, S.; Nadeem, A.A. Predictive modeling of regional carbon storage dynamics in response to land use/land cover changes: An InVEST-based analysis. Ecol. Inform. 2024, 82, 102701. [Google Scholar] [CrossRef]
  43. Xu, C.; Zhang, Q.; Yu, Q.; Wang, J.; Wang, F.; Qiu, S.; Ai, M.; Zhao, J. Effects of land use/cover change on carbon storage between 2000 and 2040 in the Yellow River Basin, China. Ecol. Indic. 2023, 151, 110345. [Google Scholar] [CrossRef]
  44. Ding, Y.; Wang, L.; Gui, F.; Zhao, S.; Zhu, W. Ecosystem Carbon Storage in Hangzhou Bay Area Based on InVEST and PLUS. Environ. Sci. 2023, 44, 3343–3352. [Google Scholar] [CrossRef]
  45. Liu, Y.; Zhang, J.; Zhou, D.; Ma, J.; Dang, R.; Ma, J.; Zhu, X. Temporal and spatial variation of carbon storage in the Shule River Basin based on InVEST model. Acta Ecol. Sin. 2021, 41, 4052–4065. (In Chinese) [Google Scholar] [CrossRef]
  46. Ai, X.; Zheng, X.; Zhang, Y.; Liu, Y.; Ou, X.; Xia, C.; Liu, L. Climate and land use changes impact the trajectories of ecosystem service bundles in an urban agglomeration: Intricate interaction trends and driver identification under SSP-RCP scenarios. Sci. Total Environ. 2024, 944, 173828. [Google Scholar] [CrossRef]
  47. Li, G.; Wang, W.; Li, B.; Duan, Z.; Hu, L.; Liu, J. Spatiotemporal simulation of blue-green space pattern evolution and carbon storage under different SSP-RCP scenarios in Wuhan. Sci. Rep. 2025, 15, 4017. [Google Scholar] [CrossRef]
  48. Zhang, J.; Yang, J.; Liu, P.; Liu, Y.; Zheng, Y.; Shen, X.; Li, B.; Song, H.; Liang, Z. Effects of Land Use/Cover Change on Terrestrial Carbon Stocks in the Yellow River Basin of China from 2000 to 2030. Remote Sens. 2024, 16, 1810. [Google Scholar] [CrossRef]
  49. Zhang, H.; He, Z.; Xu, J.; Mu, W.; Chen, Y.; Wang, G. Analysis of Spatial and Temporal Changes in Vegetation Cover and Driving Forces in the Wuding River Basin, Loess Plateau. Forests 2024, 15, 82. [Google Scholar] [CrossRef]
  50. Zhou, J.; Johnson, V.C.; Shi, J.; Tan, M.L.; Zhang, F. Multi-scenario land use change simulation and spatial-temporal evolution of carbon storage in the Yangtze River Delta region based on the PLUS-InVEST model. PLoS ONE 2025, 20, e0316255. [Google Scholar] [CrossRef]
  51. Zhu, H.; Pan, Y.; Chen, Y. Impact of LUCC on Carbon Storage and Its Components in Hangzhou from 2000 to 2030. Environ. Sci. Technol. 2024, 47, 22–34. (In Chinese) [Google Scholar] [CrossRef]
  52. Li, X.; Jia, B.; Li, F.; Ma, J.; Liu, X.; Feng, F.; Liu, H. Effects of multi-scale structure of blue-green space on urban forest carbon density: Beijing, China case study. Sci. Total Environ. 2023, 883, 163682. [Google Scholar] [CrossRef]
  53. Wang, P.; Li, H.; Huang, Z. The inter-provincial trade inequality in China: An assessment of the impact of changes in built-up land and carbon storage. Ecol. Econ. 2023, 206, 107749. [Google Scholar] [CrossRef]
  54. Gai, Z.; Zheng, W.; Faye, B.; Wang, H.; Du, G. Temporal and Spatial Characteristics and Influencing Factors of Carbon Storage in Black Soil Area Under Topographic Gradient. Land 2025, 14, 16. [Google Scholar] [CrossRef]
  55. Cui, Y.Y.; Wu, C.B.; Niu, G.; Huang, G.H. Water yield service flow assessment under future SSP-RCP scenarios in the Yellow River Basin: Coupled effect of climate and land use change. J. Hydrol. 2025, 662, 133852. [Google Scholar] [CrossRef]
  56. Zhu, L.; Song, R.; Sun, S.; Li, Y.; Hu, K. Land use/land cover change and its impact on ecosystem carbon storage in coastal areas of China from 1980 to 2050. Ecol. Indic. 2022, 142, 109178. [Google Scholar] [CrossRef]
  57. Li, H.; Zhang, K.; Liu, Y.; Qin, Y.; Wang, W.; Wang, M.; Liu, Y.; Li, Y. Spatiotemporal evolution of land use and carbon storage in China: Multi-Scenario simulation and driving factor analysis based on the PLUS-InVEST model and SHAP. Environ. Res. 2025, 279, 121860. [Google Scholar] [CrossRef] [PubMed]
  58. Chang, Z.; Wang, J.; Xiong, X.; Jiang, J.; Wu, J.; Chen, S.; Li, J.; Zhang, S.; Ji, G.; Qian, B. Integrating PLUS and InVEST model to project carbon dynamics in China’s yellow river basin under multi-scenarios (1980–2100). Front. Earth Sci. 2025, 13, 1684333. [Google Scholar] [CrossRef]
Figure 1. Location of the study area. The green areas in the two figures on the left represent the Yangtze River Delta region, which covers a greater geographical area than the YRDUA.
Land 15 00297 g001
Figure 2. Research framework.
Land 15 00297 g002
Figure 3. States of land use in the YRDUA from 2000 to 2020.
Land 15 00297 g003
Figure 4. LUC of YRDUA from 2000 to 2020.
Land 15 00297 g004
Figure 5. Spatial distribution of CS in the YRDUA from 2000 to 2020.
Land 15 00297 g005
Figure 6. Spatial distribution of CS change (a) and proportion of CS across different land uses (b) in the YRDUA from 2000 to 2020.
Land 15 00297 g006
Figure 7. The spatiotemporal dynamics of CS under different scenarios in 2030, 2050, and 2070.
Land 15 00297 g007
Figure 8. CS of different land use types under multiple scenarios in the YRDUA for 2030, 2050, and 2070.
Land 15 00297 g008
Figure 9. Contribution rate of LUC to CS change from 2000 to 2020. (a) Contribution of LUC to CS in the 2000–2005 period; (b) Contribution of LUC to CS in the 2005–2010 period; (c) Contribution of LUC to CS in the 2010–2015 period; (d) Contribution of LUC to CS in the 2015–2020 period.
Land 15 00297 g009
Figure 10. Contribution rate of LUC to CS change from 2030 to 2070. (a) Contribution of LUC to CS in the 2030–2050 period under SSP1-1.9 scenarios (%); (b) Contribution of LUC to CS in the 2030–2050 period under SSP2-4.5 scenarios (%); (c) Contribution of LUC to CS in the 2030–2050 period under SSP5-8.5 scenarios (%); (d) Contribution of LUC to CS in the 2050–2070 period under SSP1-1.9 scenarios (%); (e) Contribution of LUC to CS in the 2050–2070 period under SSP2-4.5 scenarios (%); (f) Contribution of LUC to CS in the 2050–2070 period under SSP5-8.5 scenarios (%).
Land 15 00297 g010
Table 1. Data sources.
Data TypesYearsData Sources
Land use2000~2020Zenodo platform (https://zenodo.org/records/18180184 (accessed on 2 February 2026))
annual mean temperatureScientific Information Center for Resources and Environment, Chinese Academy of Sciences (https://www.resdc.cn (accessed on 2 February 2026))
annual mean precipitation
land use under
SSP-RCP Scenarios
2030, 2050, 2070Geographic Simulation & Optimization System (http://geosimulation.cn (accessed on 2 February 2026))
mean temperature under
SSP-RCP Scenarios
National Tibetan Plateau/Third Pole Environment Data Center (http://data.tpdc.ac.cn (accessed on 2 February 2026))
mean precipitation under
SSP-RCP Scenarios
Disclaimer/Publisher’s Note: The statements, opinions and data contained in all publications are solely those of the individual author(s) and contributor(s) and not of MDPI and/or the editor(s). MDPI and/or the editor(s) disclaim responsibility for any injury to people or property resulting from any ideas, methods, instructions or products referred to in the content.