Article

A Seasonal Study of the Spatial Quality of Cold Streets Based on Activity Portrait Indexes (APIs): The Example of Harbin City Streets

1
School of Architecture and Design, Harbin Institute of Technology, Harbin 150001, China
2
Key Laboratory of Cold Region Urban and Rural Human Settlement Environment Science and Technology, Ministry of Industry and Information Technology, Harbin 150001, China
*
Author to whom correspondence should be addressed.
Land 2026, 15(2), 295; https://doi.org/10.3390/land15020295
Submission received: 28 December 2025 / Revised: 3 February 2026 / Accepted: 4 February 2026 / Published: 10 February 2026
(This article belongs to the Special Issue Smart Urban Planning: Digital Technologies for Spatial Design)

Abstract

China’s cities are shifting from expansion to renewal. In cold-climate cities, street use often drops in winter, so human-centred street quality matters. However, few studies measure behavioural activity using the same indicators for winter and non-winter periods. We propose an “activity portraits” framework and an Activity Portrait Index (API) that combines activity density, activity-type propensity, and age-group diversity. We used street-view images and field surveys from 37 street segments in Harbin, covering commercial, living, and landscape streets. Streetscape elements were extracted, and separate regression models were built for winter and non-winter conditions. In winter, seven streetscape factors were significant and were entered into the regression as four PCA components. In non-winter conditions, the model retained four predictors: street width-to-height (W/H) ratio, road clutter, greenery visibility, and signage density (R2 = 0.802). The models show season-specific links between activity and street space and support a seasonal API measurement system for cold-region streets. The results inform targeted design and renewal principles to improve street usability and vitality year-round.

1. Introduction

Streets are a fundamental public sphere for residents [1] and key spaces for conveying urban history and culture [2]. Enhancing street vitality and supporting diverse behavioural activities has long been a major concern [3]. However, during rapid urbanisation in China, street construction is often neglected, which contributes to many built environment problems, including so-called “urban diseases”. As a result, public space quality often fails to meet people’s needs and can directly affect daily life and health [4,5]. In cold-climate cities, extending outdoor activities and improving winter vitality are especially important [6]. This challenge is most evident in cold streets, where vitality is difficult to sustain in winter [7]. In this study, we propose an “Activity Portrait–Spatial Characteristics” framework based on prior research. Field surveys and multi-source data techniques were used to obtain activity portraits and street spatial environment data. We then conducted an empirical study in Harbin, China, to develop a mathematical model linking the Activity Portrait Index (API) with street spatial characteristics. We also compared winter and summer conditions and three street types to examine how climate and street function shape the results. This analysis helps identify key factors affecting street spatial quality and informs design strategies for cold-climate streets.

2. Literature Review

2.1. Literature Review on Street Space and Behavioural Activities

Michael Southworth argues that well-designed street space should meet the needs of all user groups and function as shared urban public space [8]. Zarin S. Z. et al. suggest that accessibility, public facilities, landscape features, and sanitation are key factors affecting street quality [9]. Allan B. Jacobs [10] notes that street quality can be assessed by how well its spatial environmental elements—such as pavement, street furniture, and landscaping—are designed. Following Long Ying’s definition of street space quality [11], this study focuses on whether street environmental elements can support and satisfy users’ behavioural activity needs. We use the API to reflect the applicability and vitality of different street spaces. Behavioural place theory, proposed by Barker, R.G, states that the closer the relationship between behavioural activities and the environment, the more the environment can support and satisfy human activity needs [12]. Gibson introduced the concept of environmental support, arguing that the physical environment can promote or inhibit behavioural activities and that these effects vary across contexts [13]. Samavati, S. et al. also emphasised that streets, as key carriers of urban life, should meet diverse public needs [14] (see Table 1).
Recent research has shifted from physical beautification to examining links between physical space and behavioural activities. In this study, we investigate the relationships between street spatial environmental elements and activity portraits, and identify key factors that influence behavioural activities.

2.2. Methods for Measuring and Evaluating the Spatial Environment of Streets

William H. Whyte used behavioural observation to count people’s activities and advanced research on links between physical space and behaviour [20]. Gehl Architects developed the Public Space Public Life (PSPL) method to assess street façade quality, pedestrian flow, and dwell time, and examined how building façades relate to behavioural activities [21]. Elizabeth Burton explored residents’ perceptions of the built environment through questionnaires and interviews and proposed six design principles for “living streets” [22]. Biddulph used all-weather time-lapse photography to record the type and duration of pedestrians’ social activities and applied these measures to evaluate street vitality [23]. Ewing R. assessed street space using expert scoring [24], whereas Harvey C. W. used GIS and 3D streetscape regression models to examine how building façades, buildings, and trees affect the street environment and behavioural activities [25]. Sarkar C. used NDVI-based greening metrics, combined with pedestrian interviews, to analyse how greening density and street trees influence walking distances [26] (see Table 2).
In recent years, the “new data environment” has enabled more precise analysis of street space and human mobility patterns, including routes and density. For example, Long Ying and Gao Bingxu examined the feasibility of using big data for street research [27,28]. Big data can help address the limits of traditional methods. However, inconsistent data quality and over-reliance on data may lead to biased conclusions and reduced human-centred insights [29]. In this study, we conduct a large-scale assessment of the spatial quality of multiple street types in China by combining online data with field surveys.

3. Data and Methods

3.1. Research Framework and Technical Approach

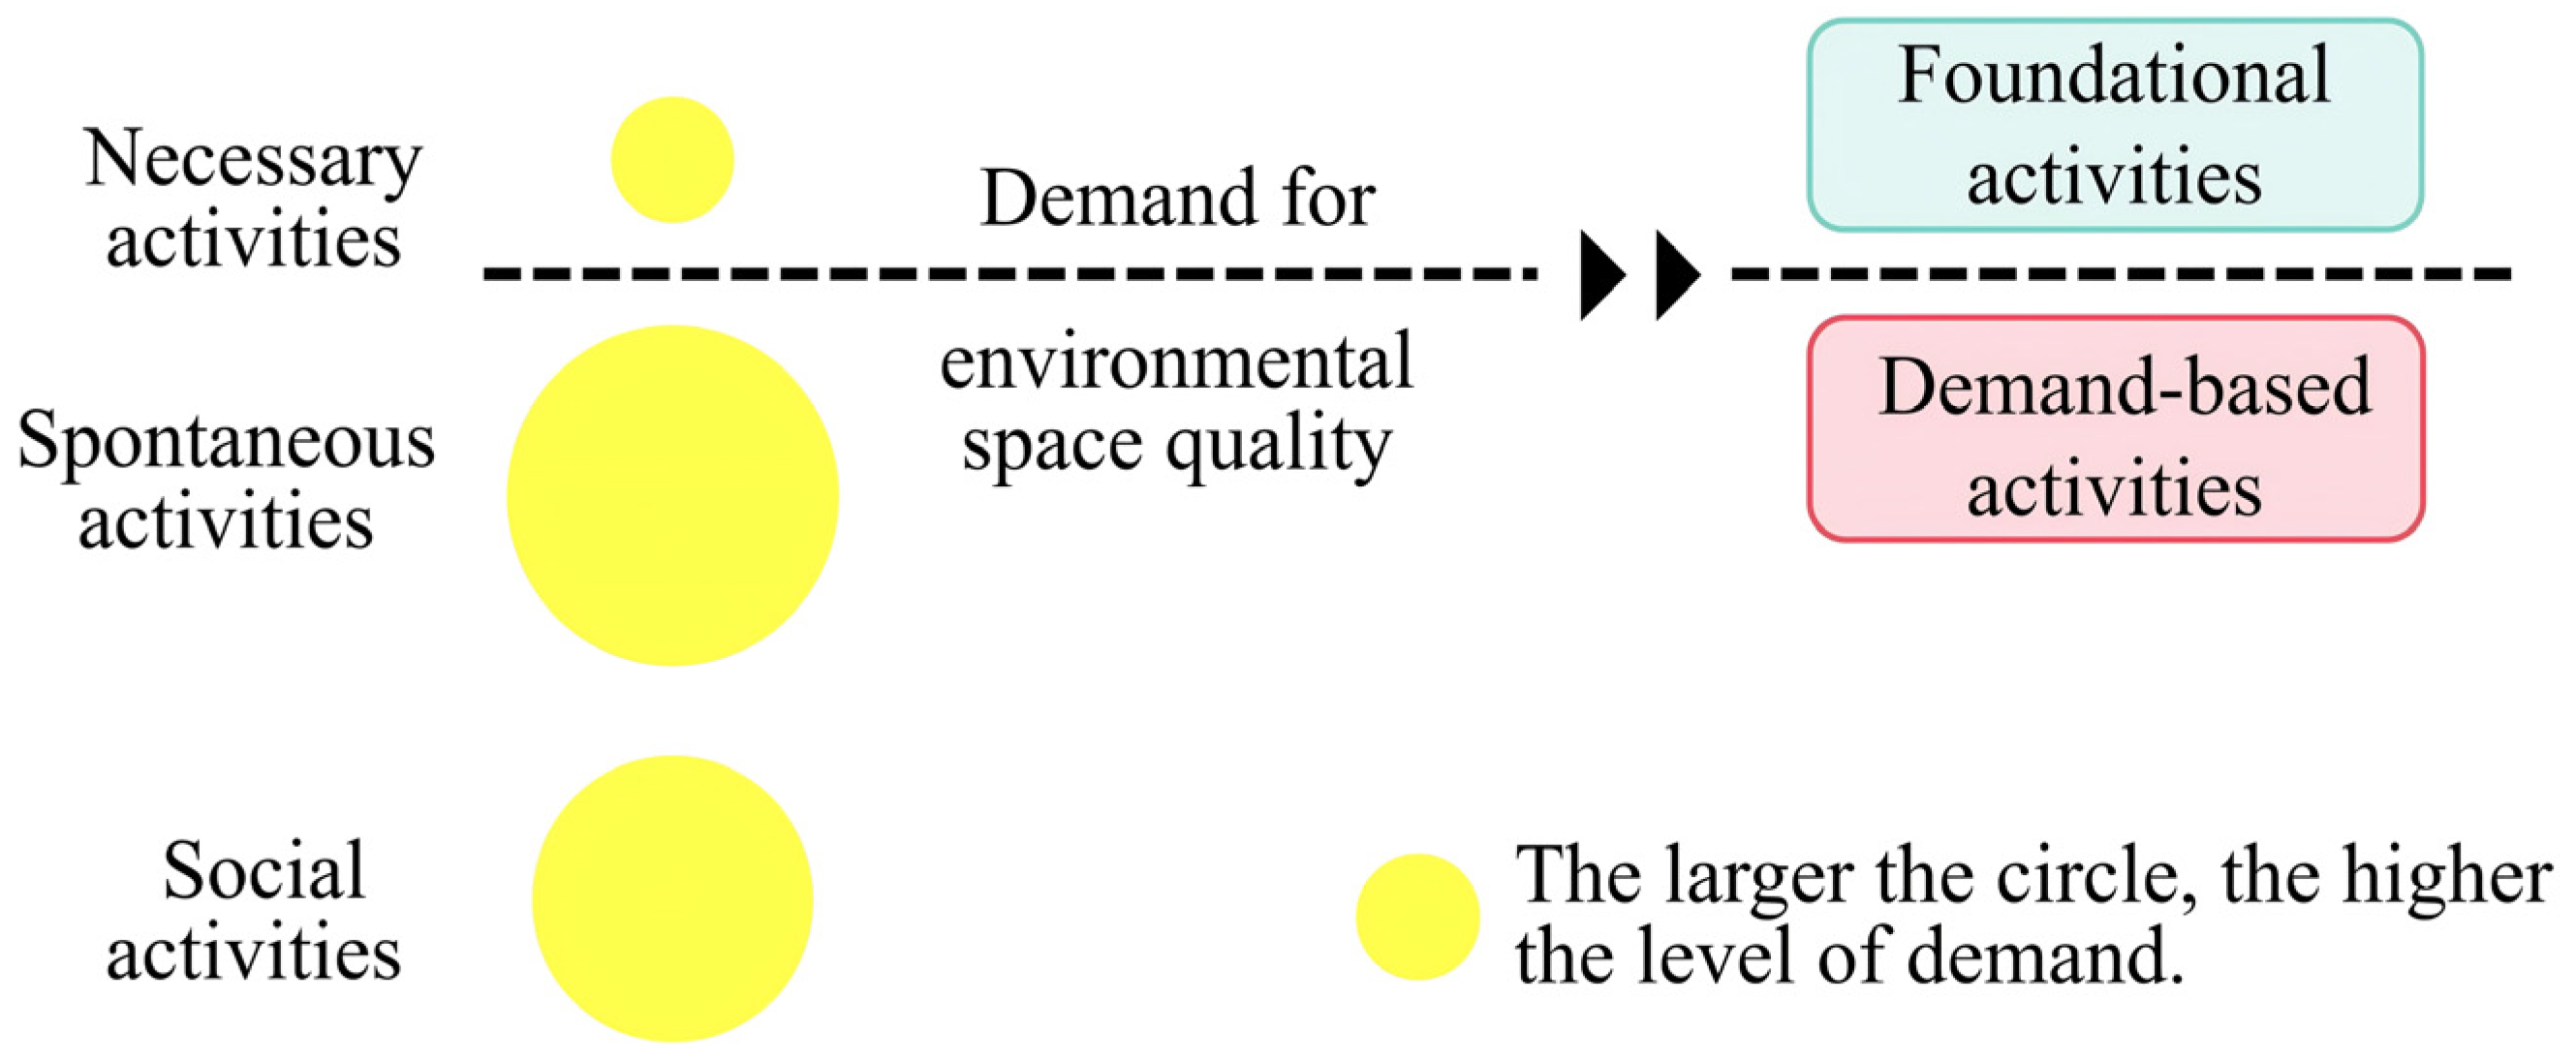
In Public Space–Public Life, Jan Gehl classifies outdoor activities into necessary, spontaneous, and social activities, and argues that these categories reflect increasing demands for environmental quality [17]. In this study, we classify behavioural activities into two types—basic activities and demand-oriented activities—based on the level of environmental quality required in street space [30]. This classification also considers the behavioural characteristics of residents in Harbin in winter and summer, as well as their willingness to participate (see Figure 1).
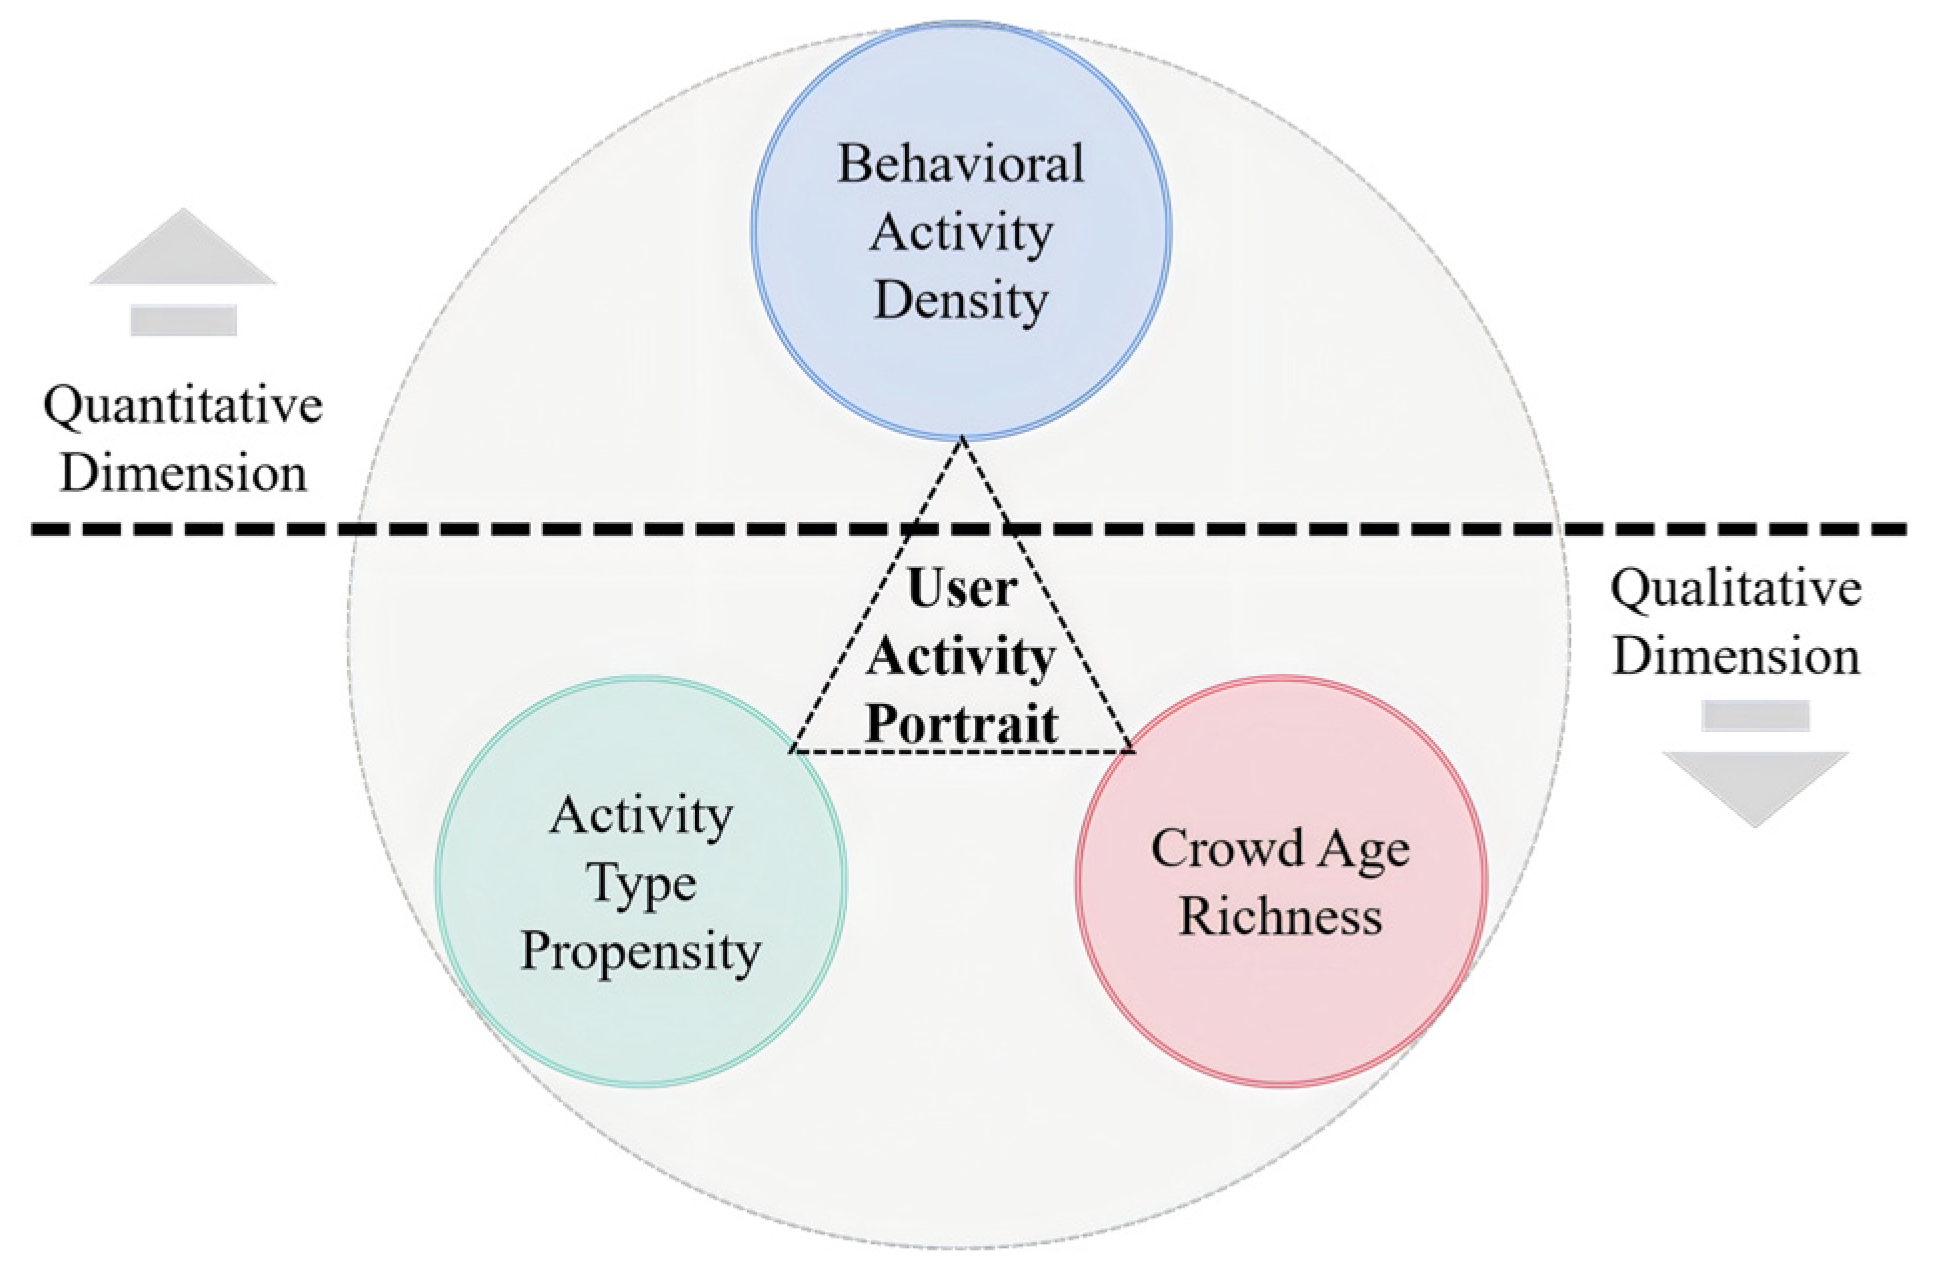
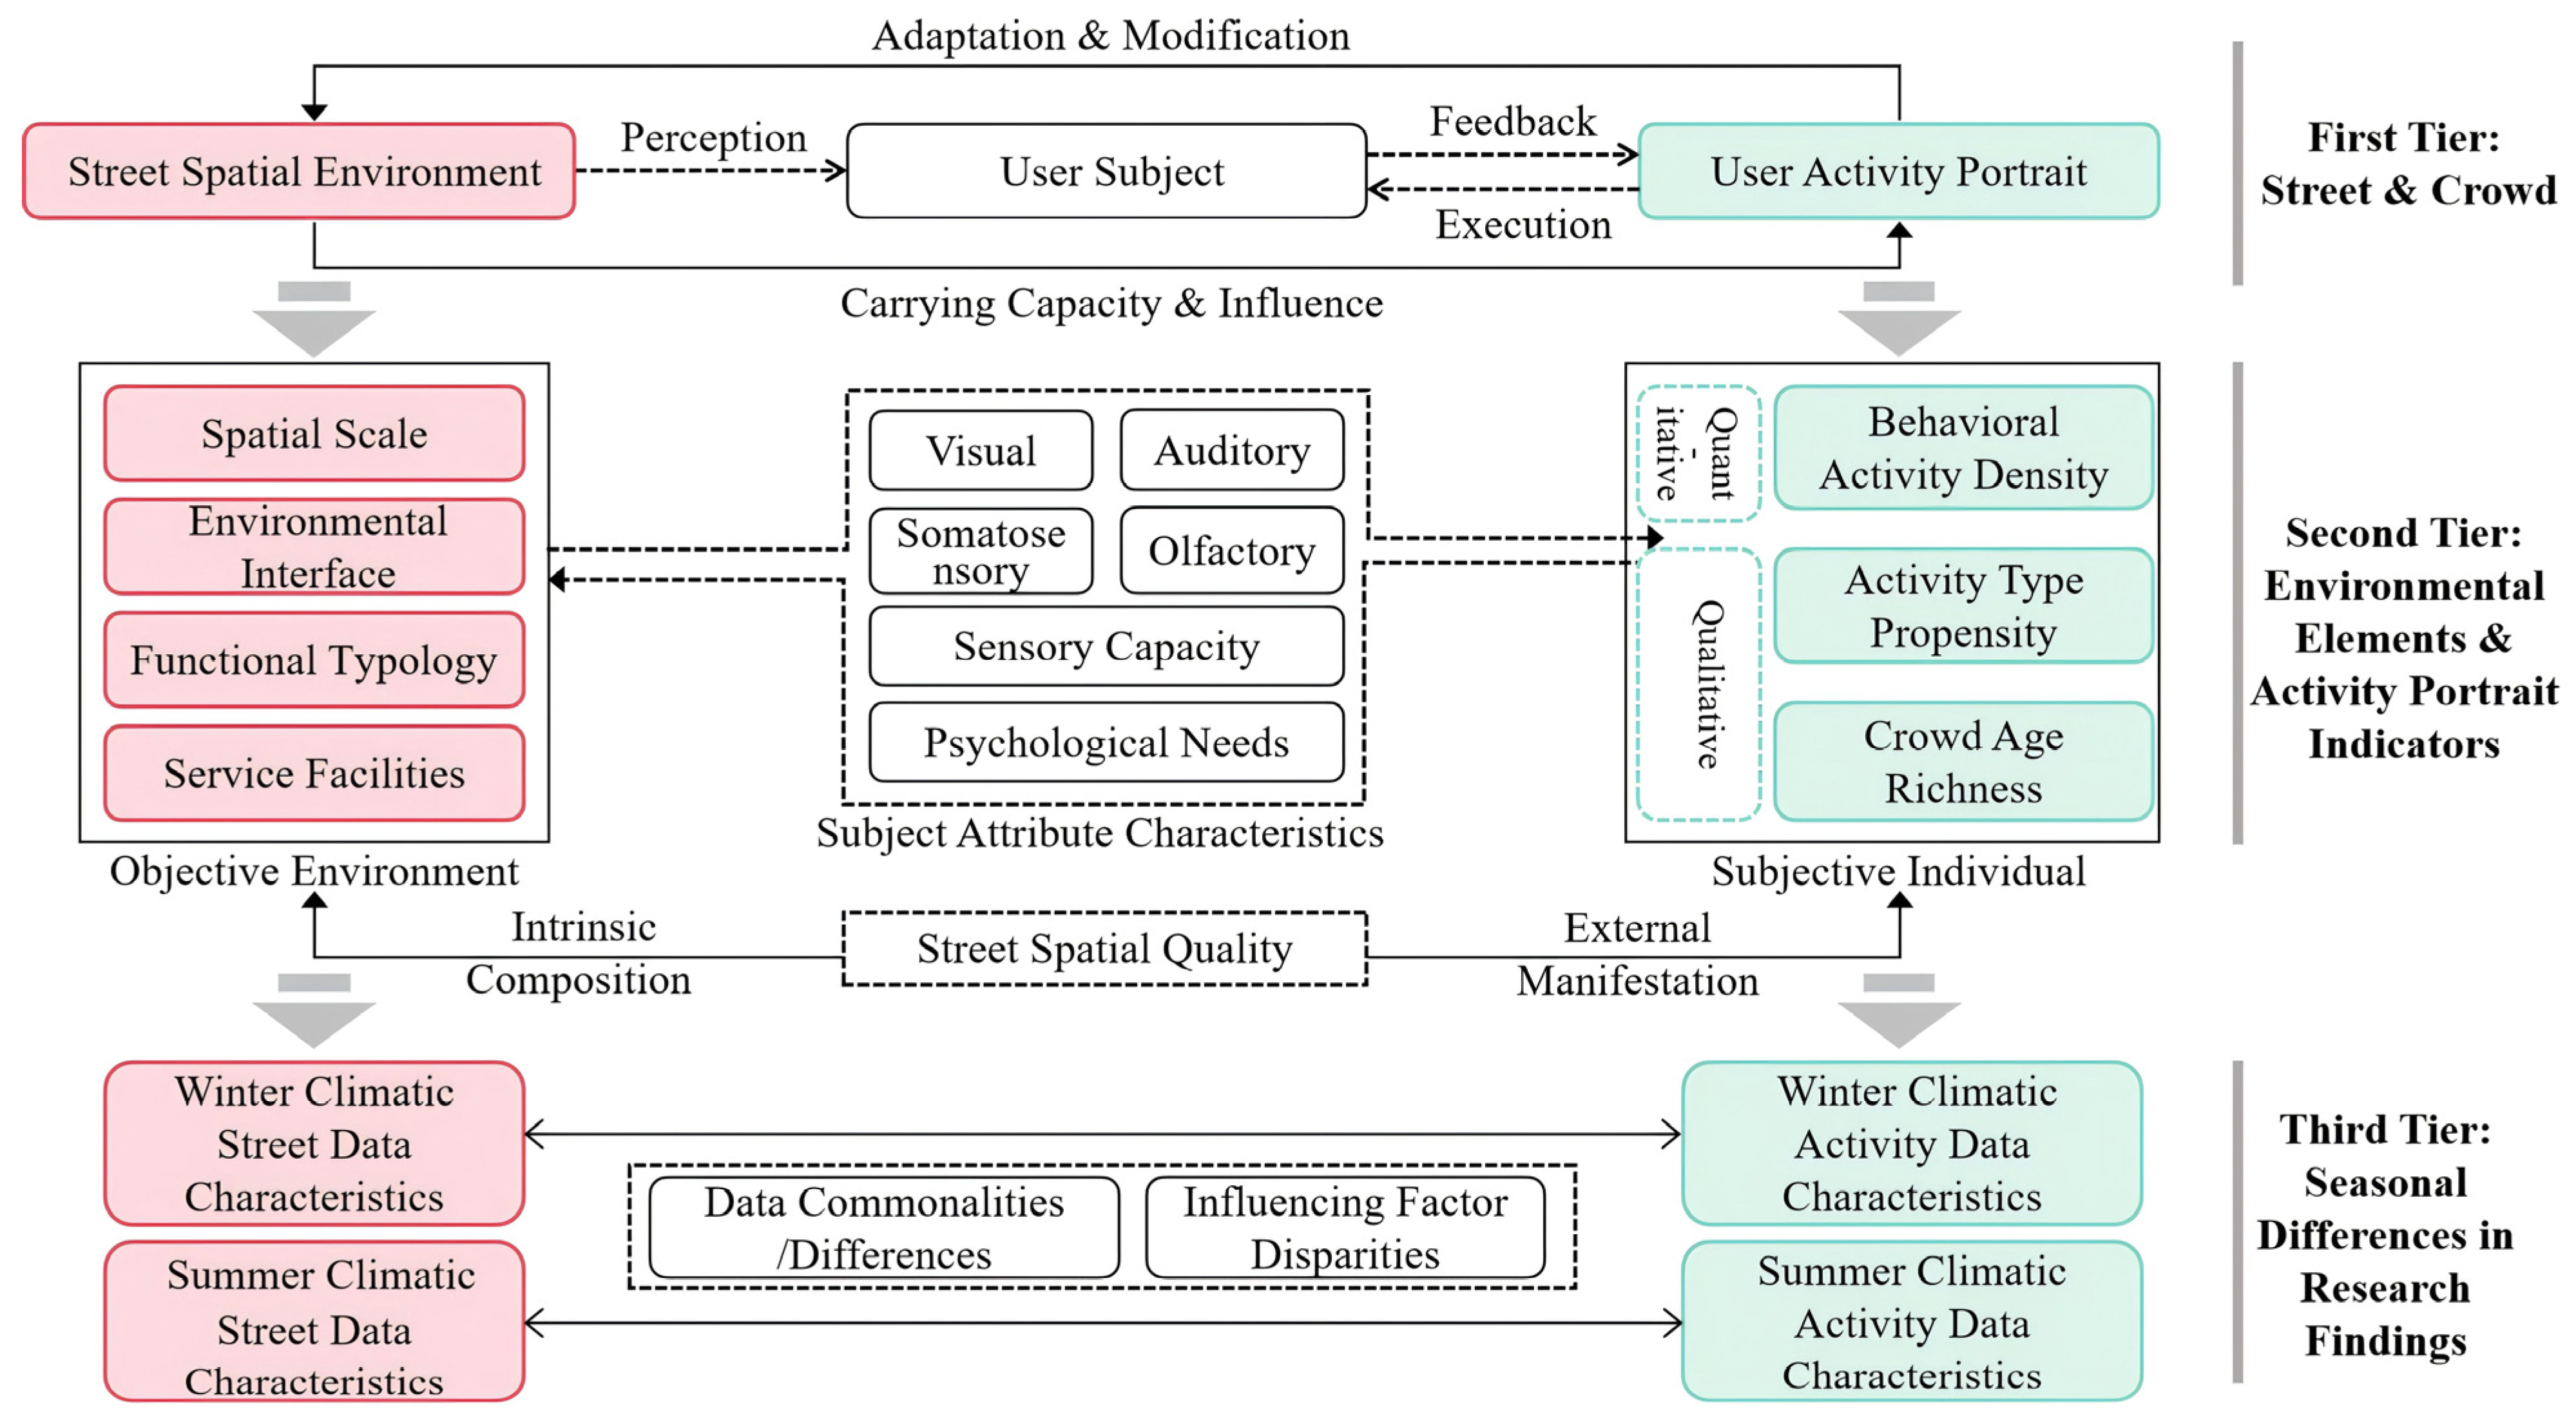
A user portrait is a virtual representation of real-world demographic data. It relates to concepts such as user roles and user profiles, and summarises integrated information extracted from users’ multidimensional data. Ma Shuhong et al. developed behavioural portraits of users in public activity centres [31]. Yang Linchuan summarised behavioural portraits of users in ageing communities and proposed renewal strategies for local public spaces [32]. Cao Jinzhou introduced the concept of an urban population portrait and applied it to planning optimisation strategies [33]. An activity portrait is a methodological approach that integrates behavioural activity indicators to describe complex activity characteristics, as shown in prior studies [31,32]. Its purpose is to build a comprehensive data-based description of users’ behavioural activity characteristics. Existing studies mainly focus on behavioural activity density, activity-type propensity, participants’ age, and dwell time, with the first three used most often. Dwell time is more commonly used to study individuals than groups. Many studies use the number of behavioural activities as the main evaluation measure. However, this single indicator is limited and can be strongly affected by individual factors. For example, Vikas (2016) suggested that street vitality is influenced by the number of participants and dwell time and proposed a vitality index [34]. In this study, three indicators—behavioural activity density, activity-type propensity, and age-group diversity—are treated as quantitative and qualitative dimensions and combined into the API (see Figure 2). We aim to explain the relationships between urban space and human activity, and to compare how winter and summer climates shape the results (see Figure 3).
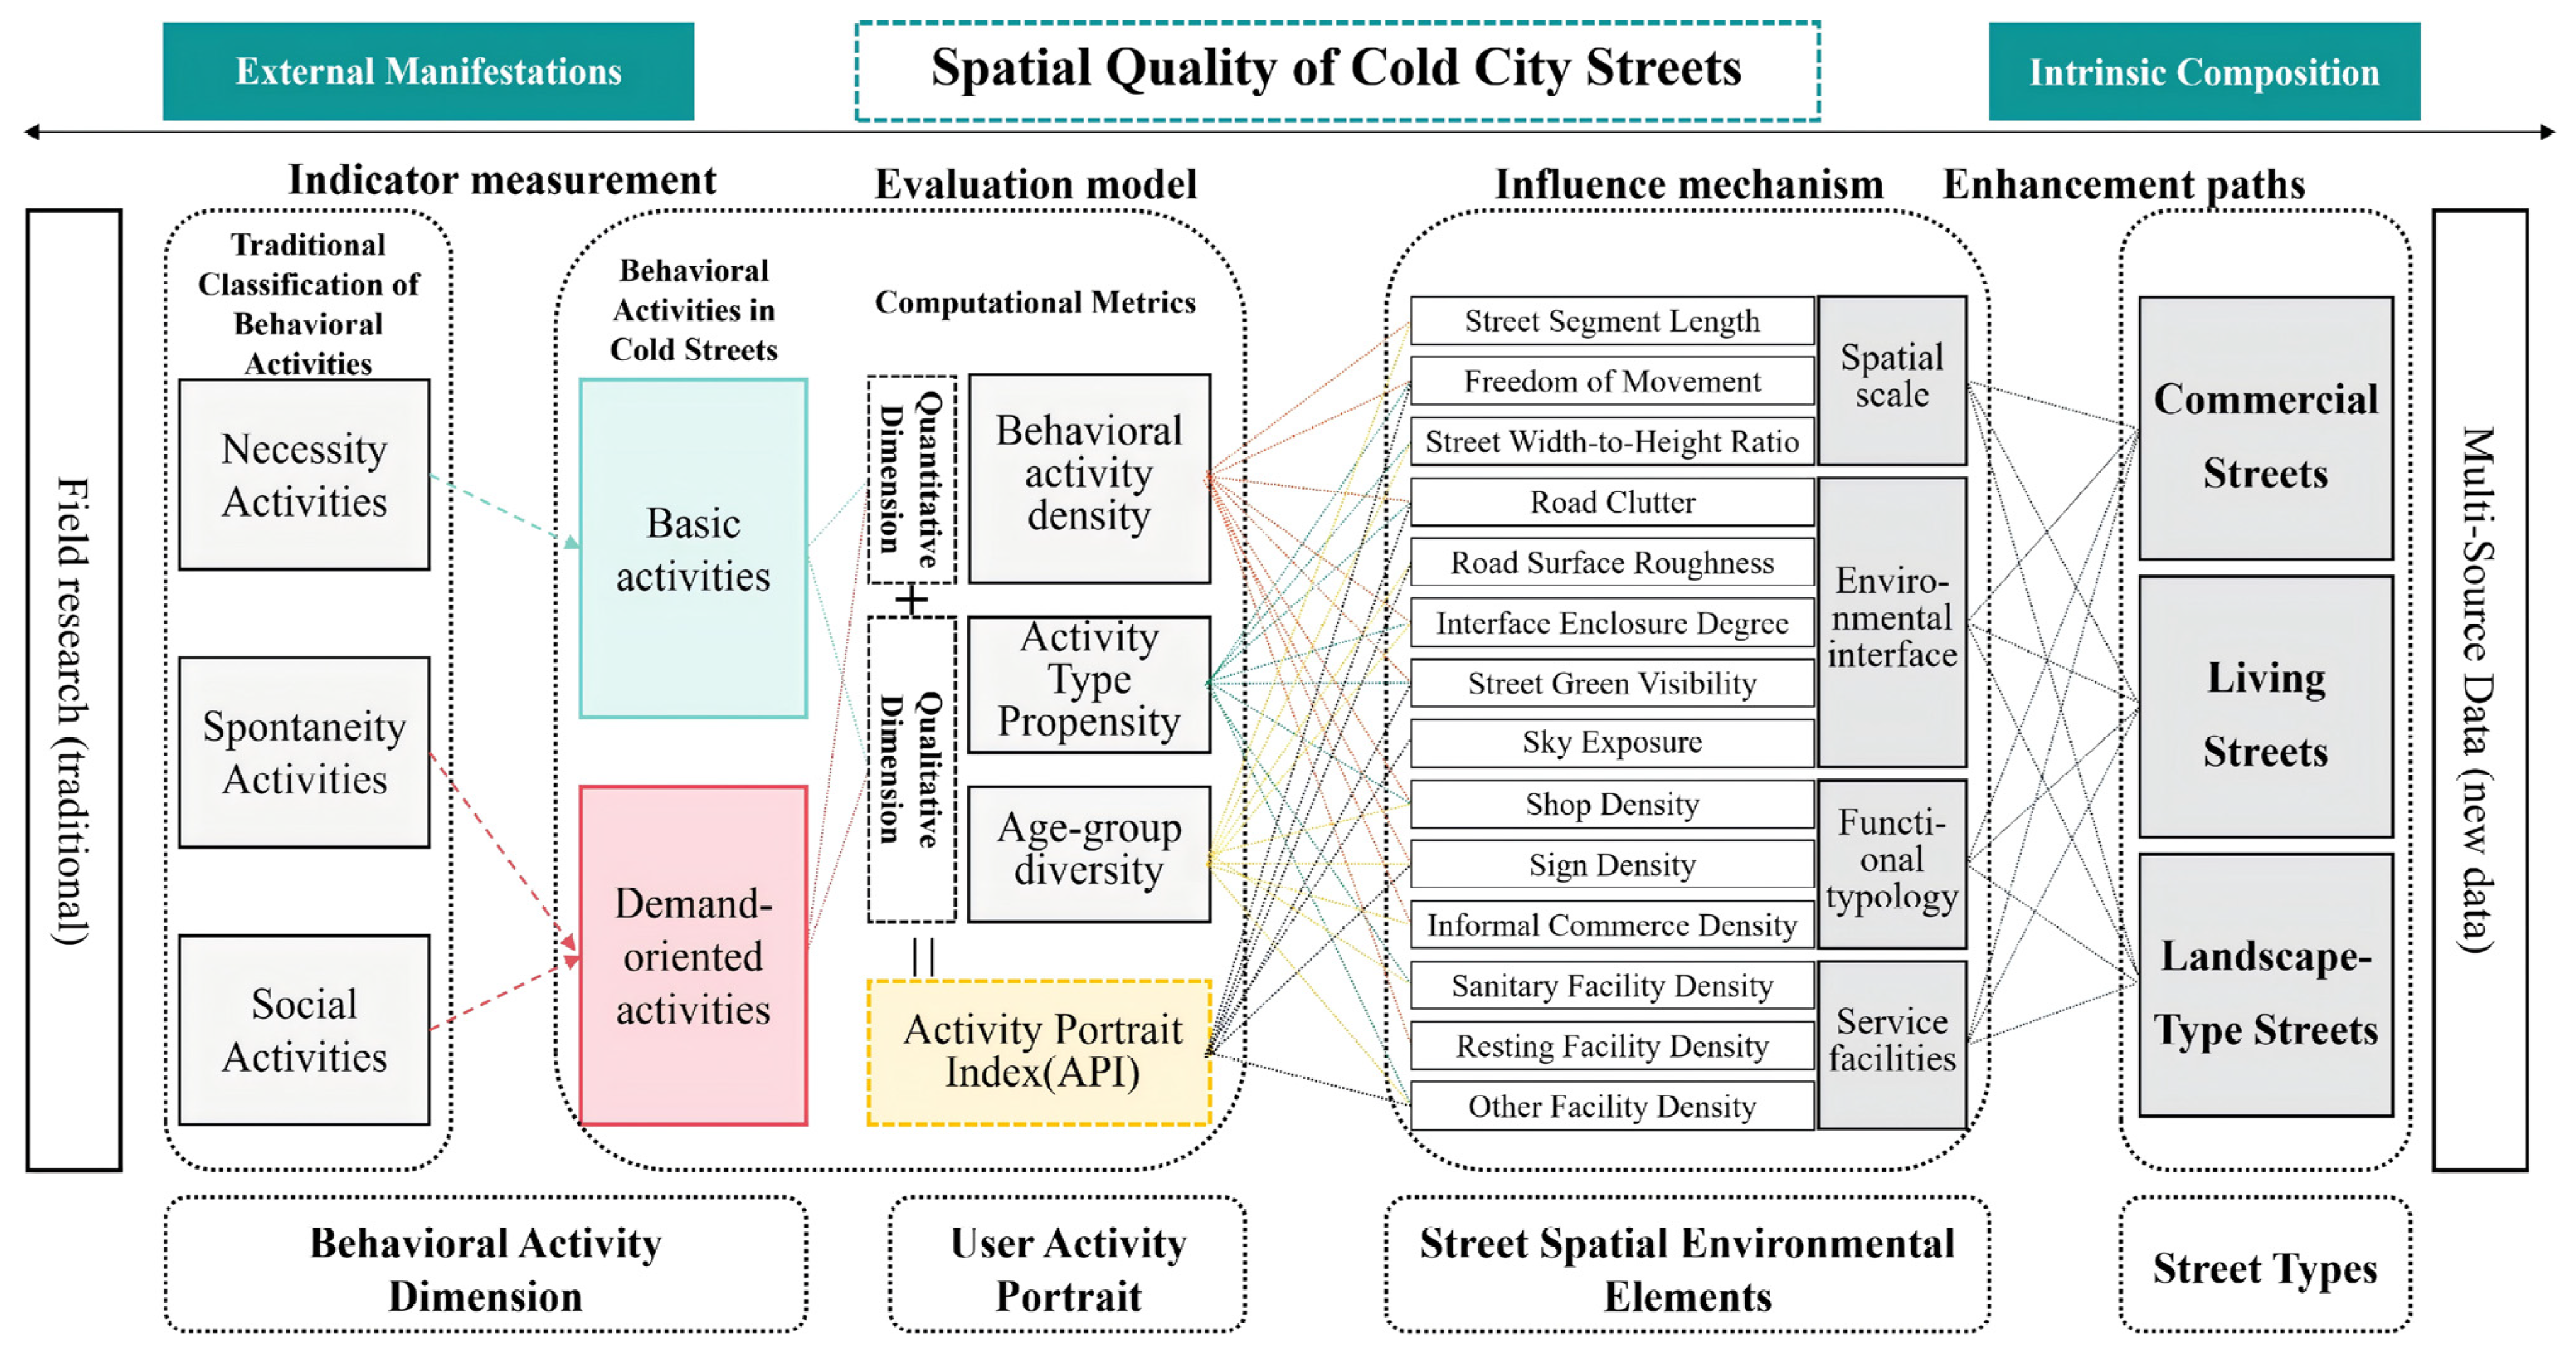
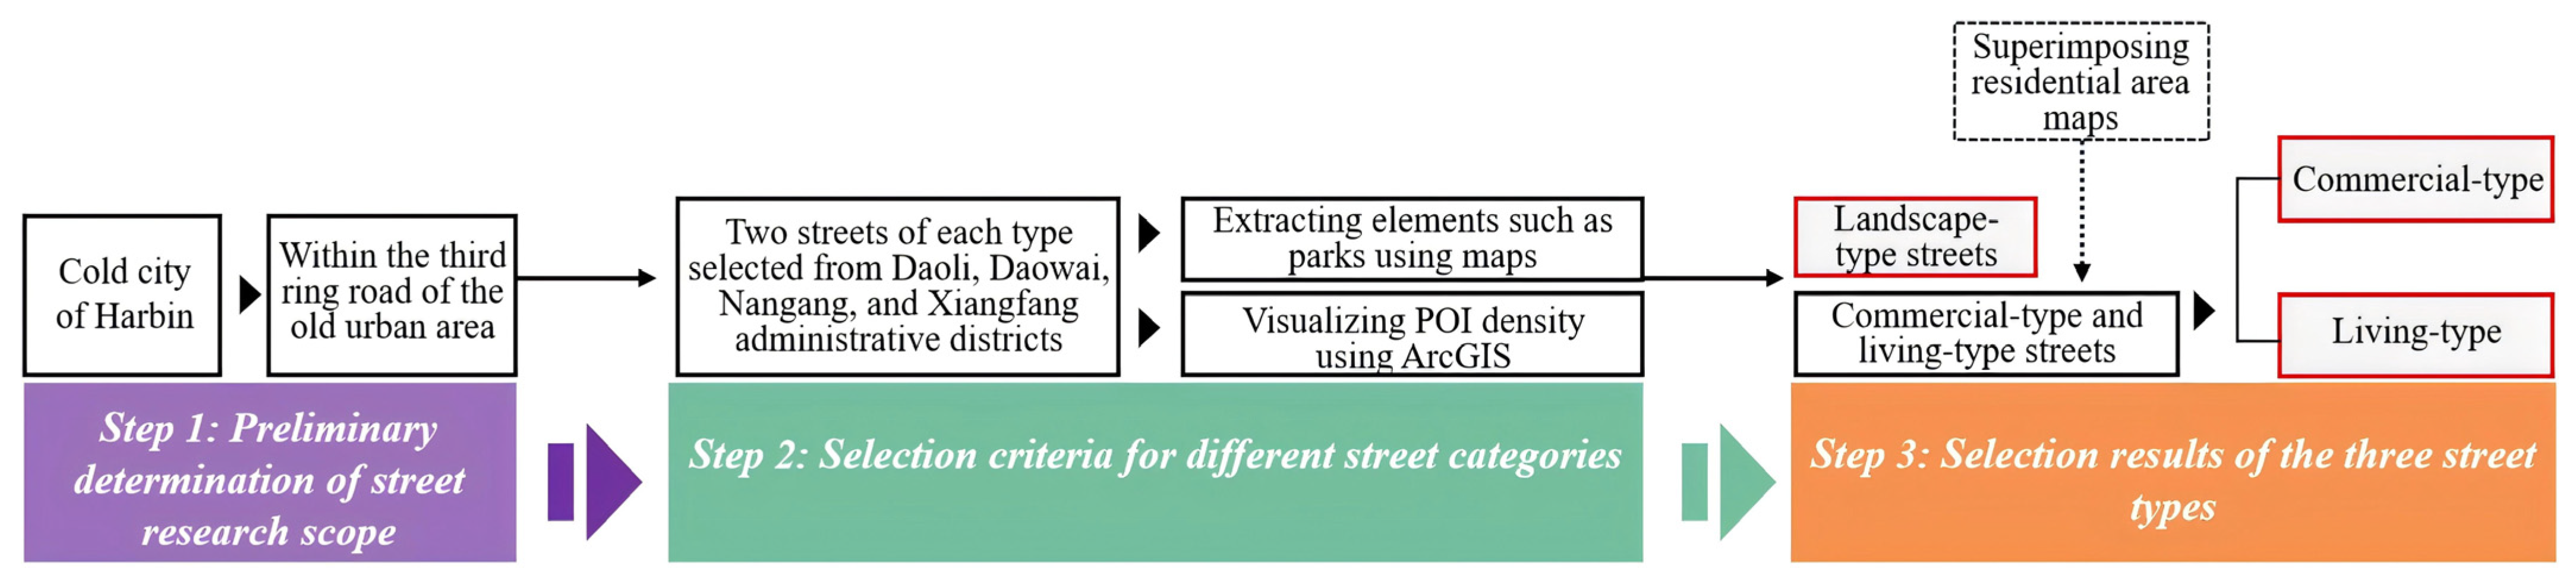
In this study, we developed a mathematical model linking the API with street spatial characteristics. We analysed correlations using both traditional data and new data to improve the accuracy and level of detail of the study. The technical route is shown in Figure 4.

3.2. Selection of Research Subjects

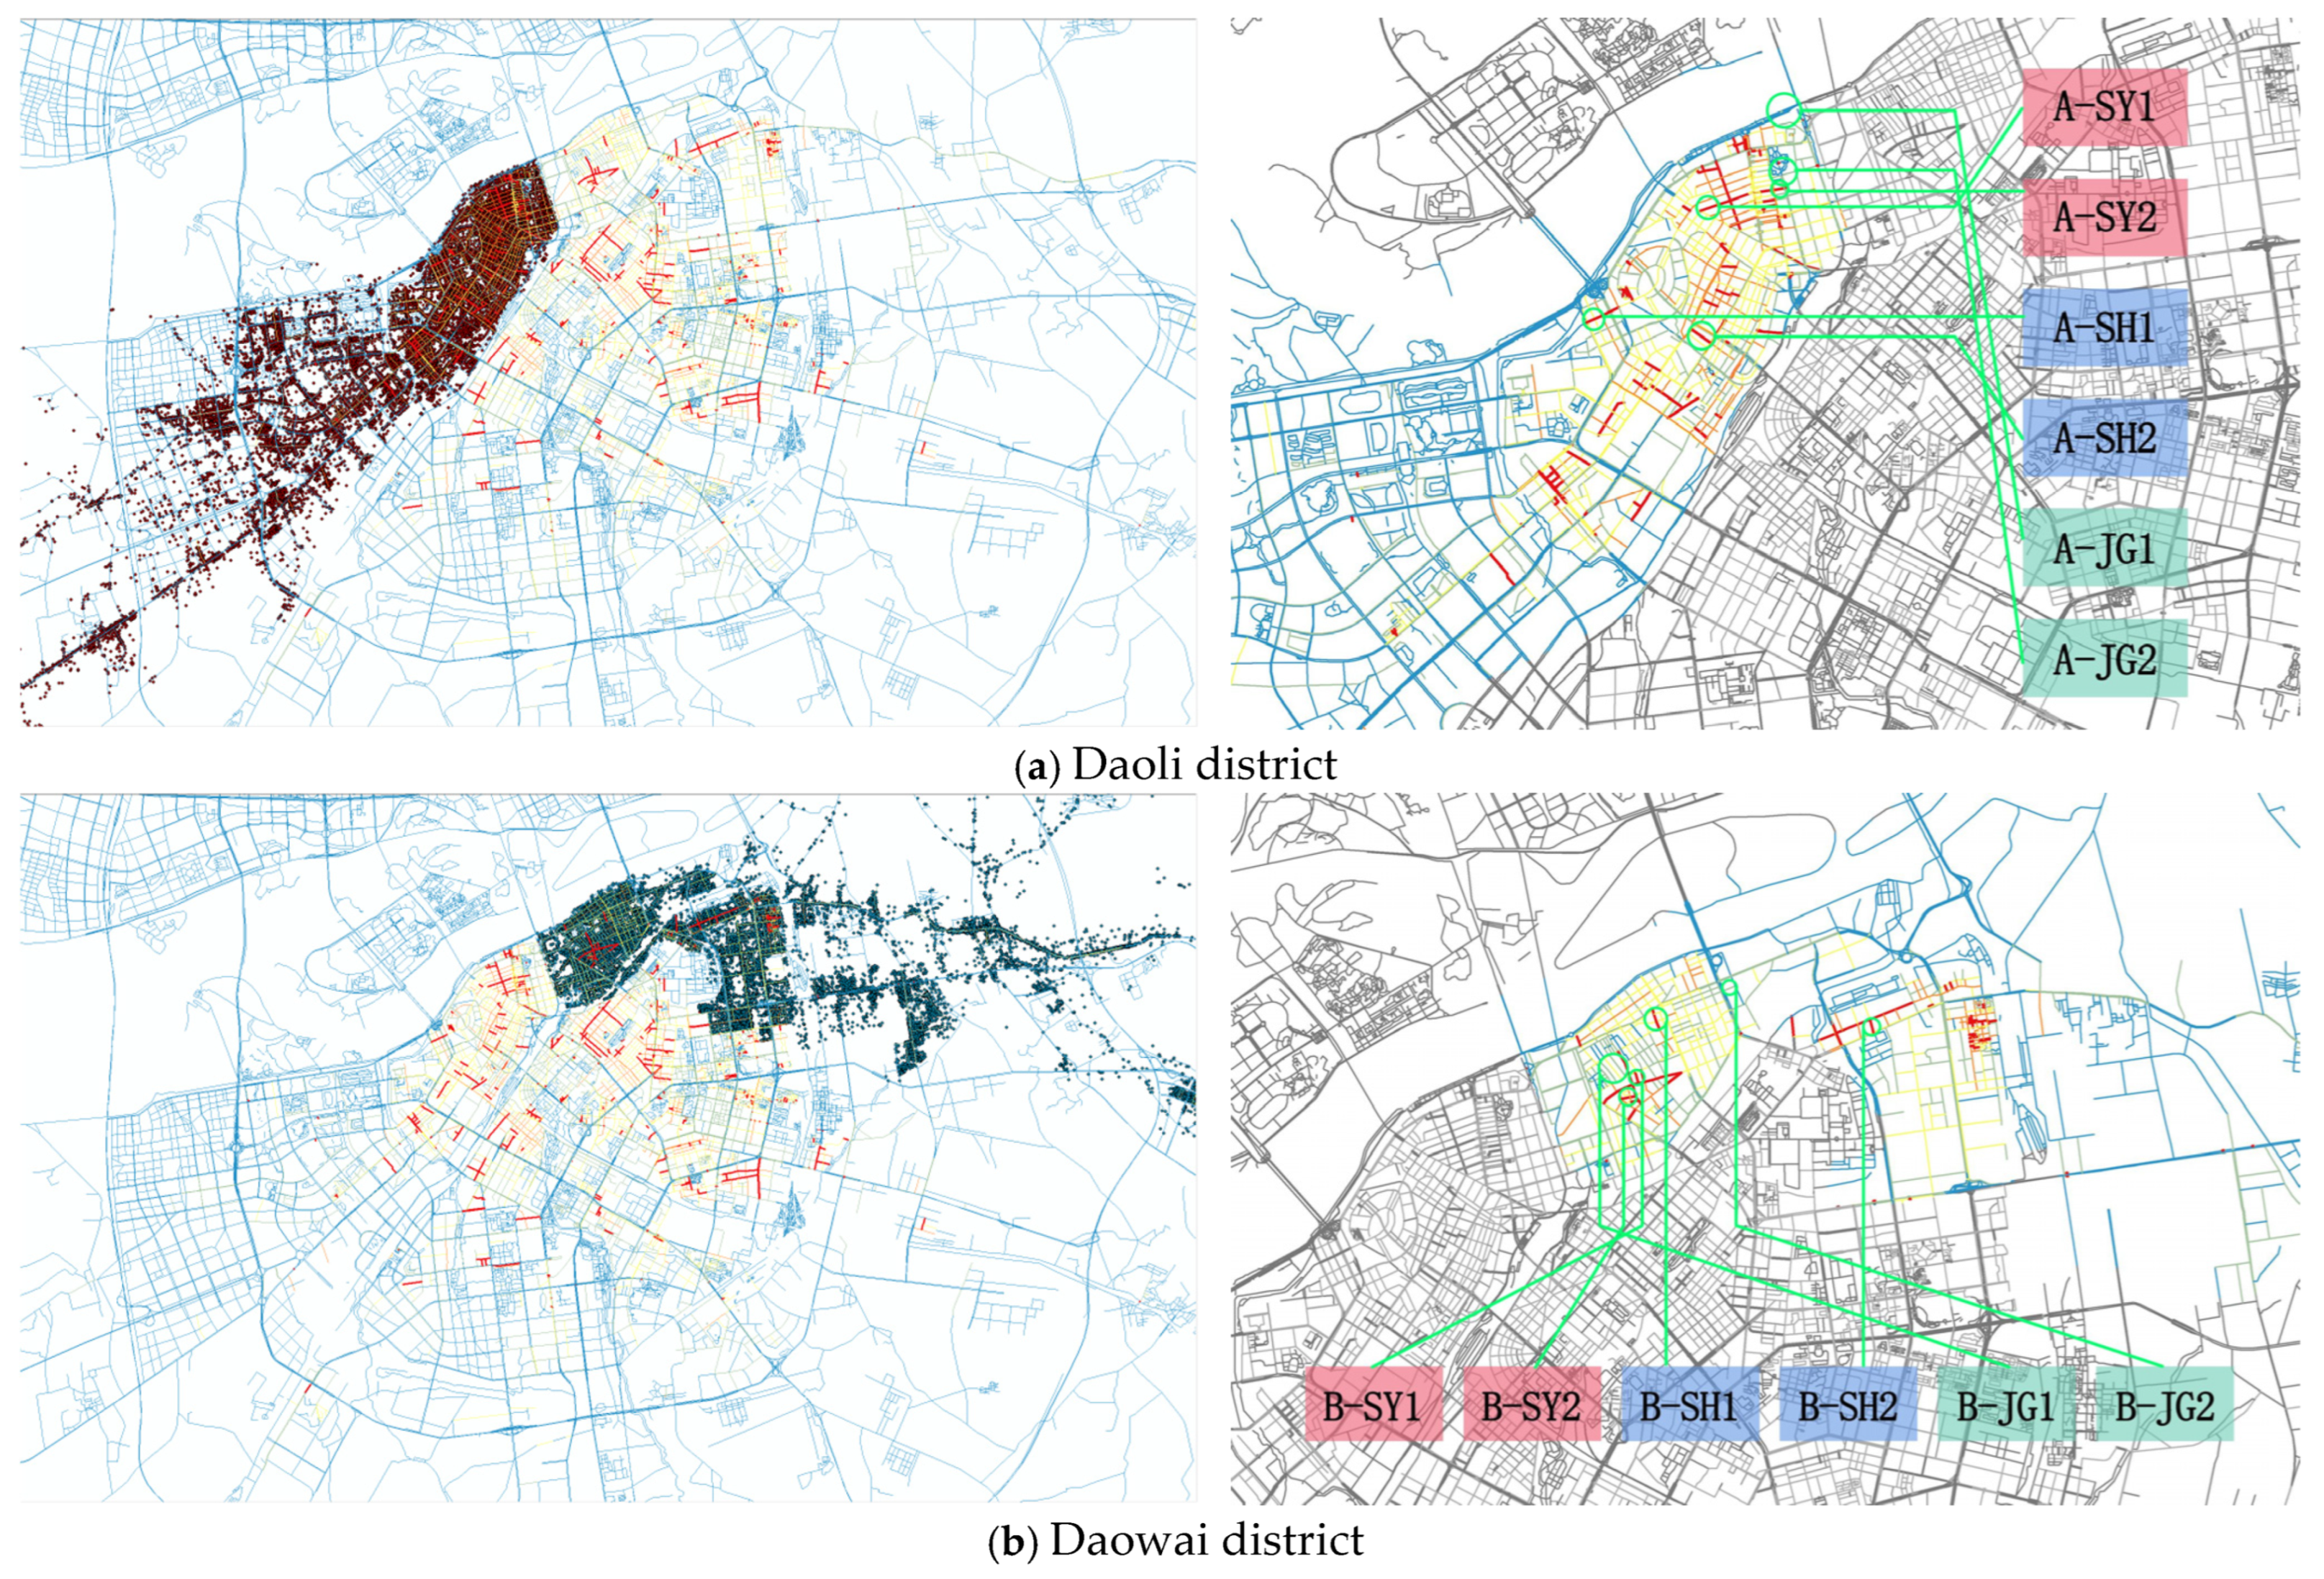
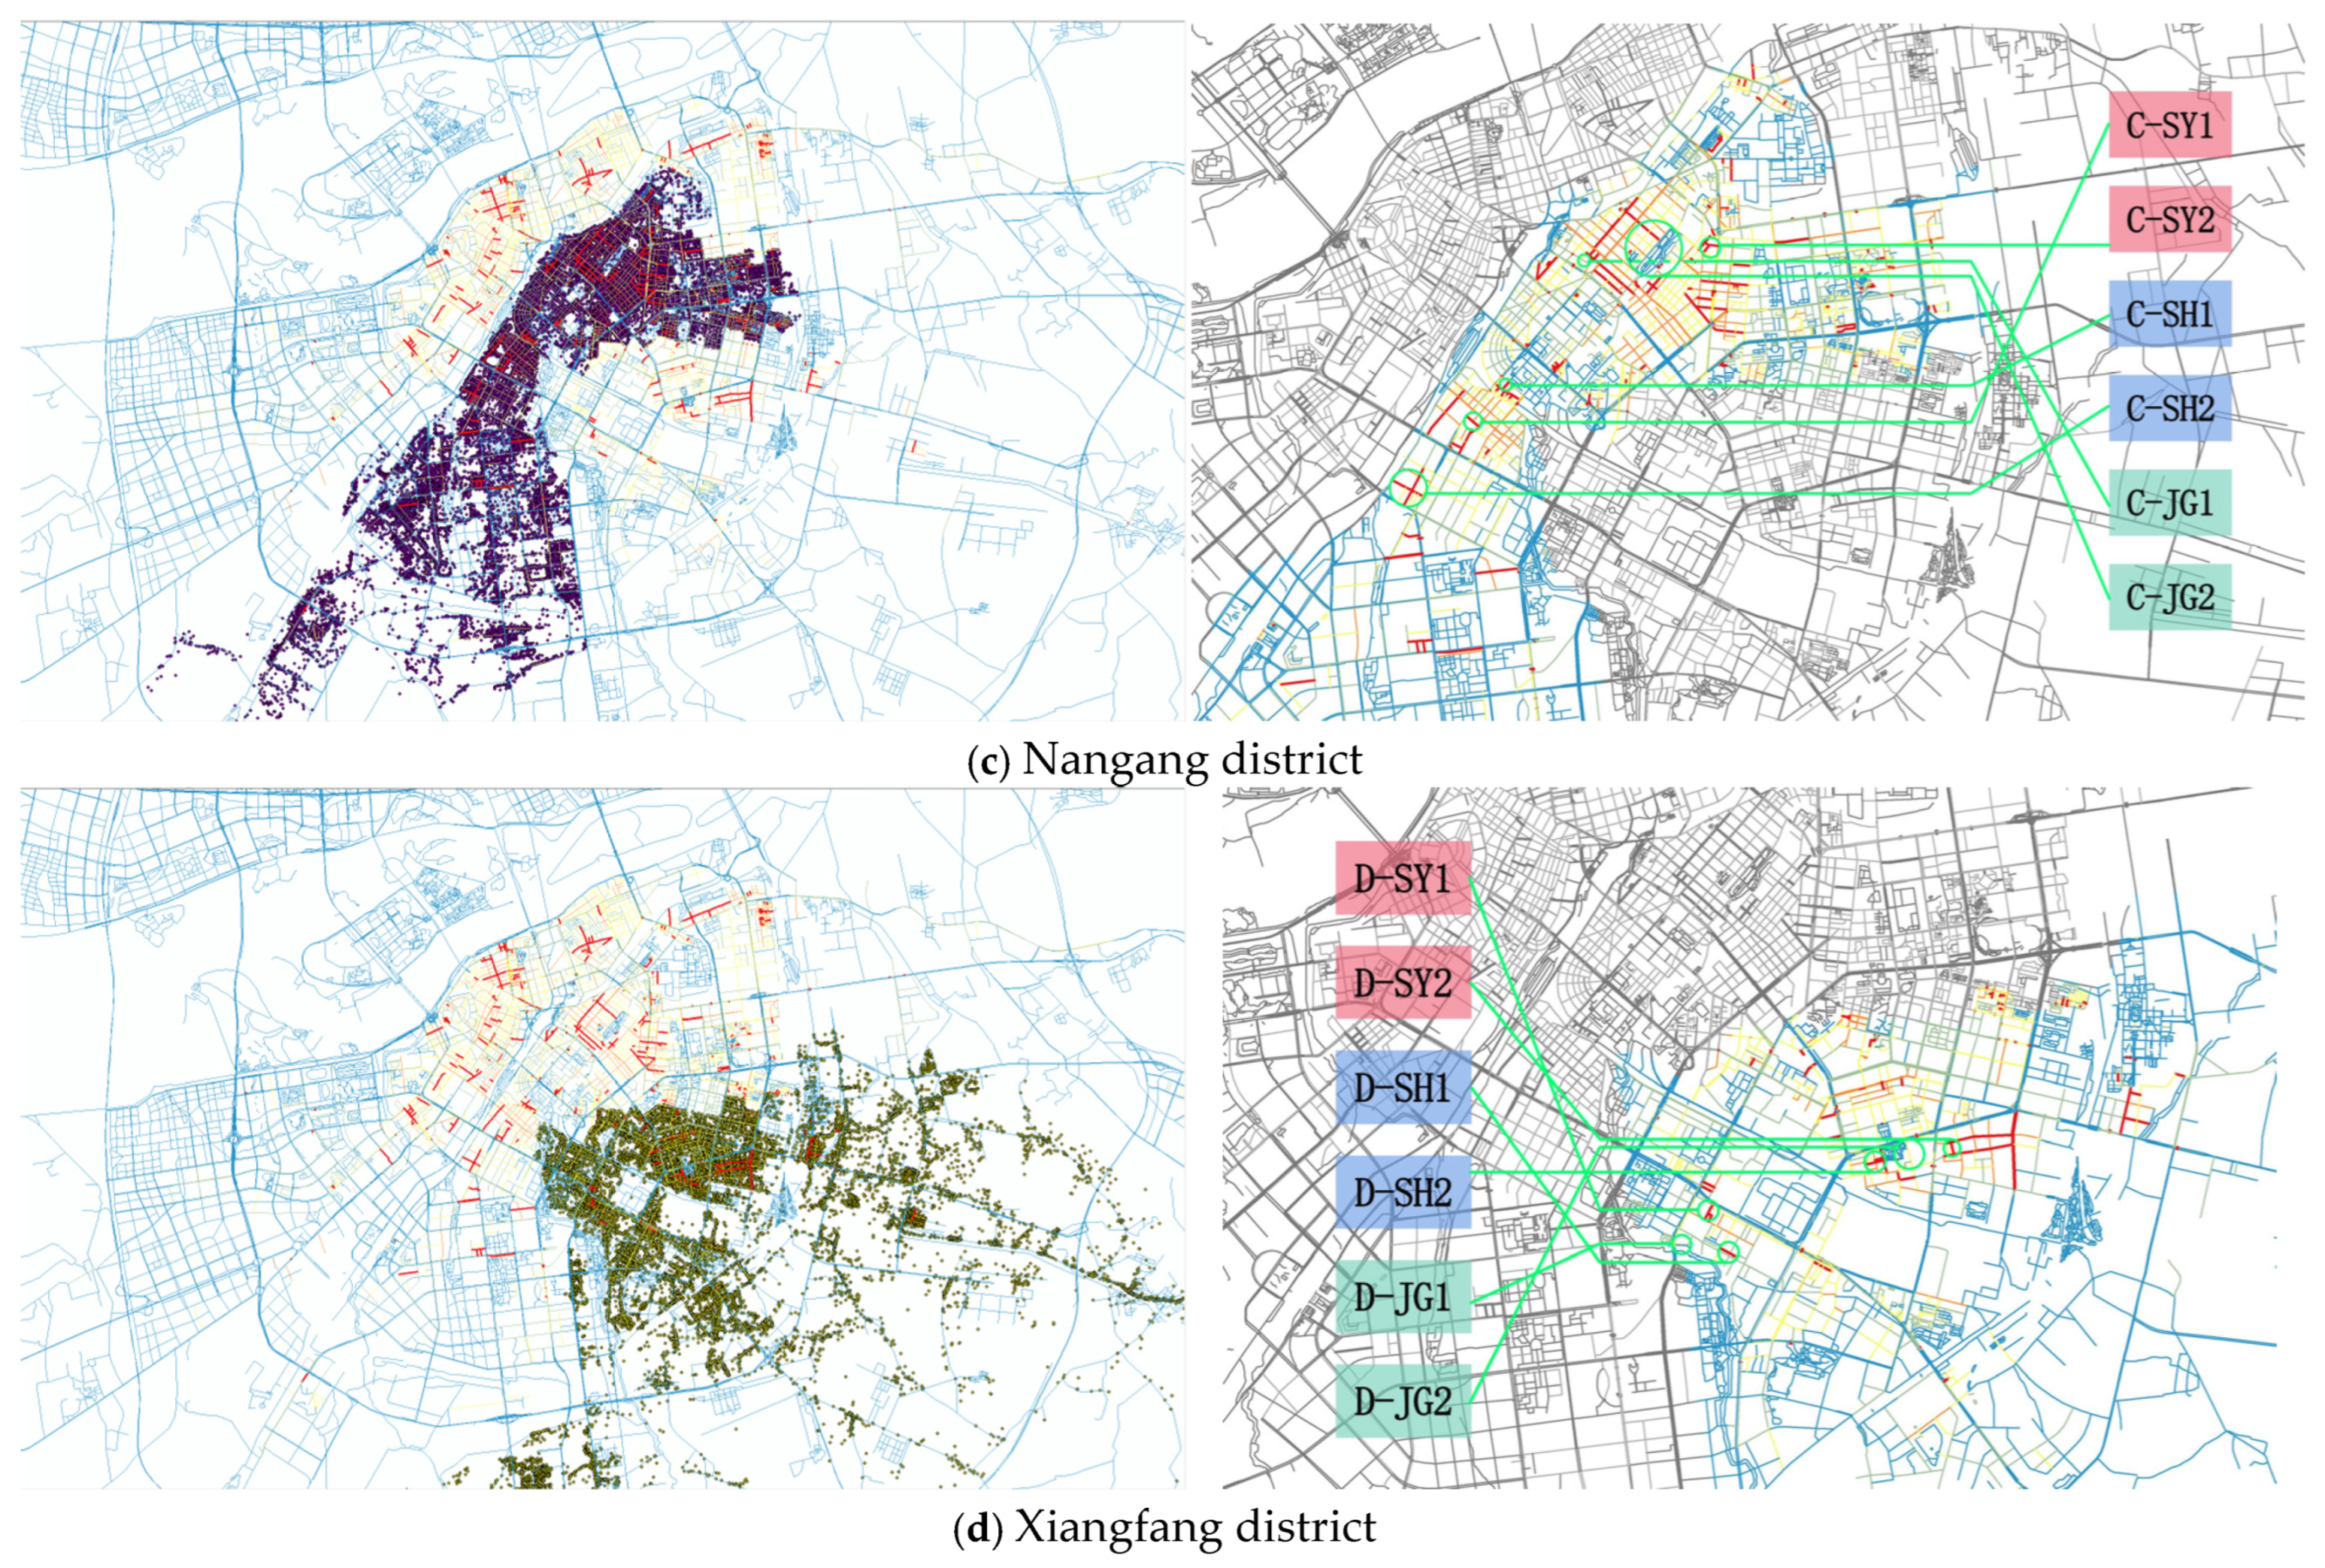
The study area includes four administrative districts within Harbin’s Third Ring Road. To identify different street types, ArcGIS 10.8 was first used to classify commercial and living streets based on Point of Interest (POI) density [35]. A residential area map was then overlaid to distinguish between these two types. Finally, landscape streets were identified by extracting and interpreting relevant map elements (see Figure 5).
Within each administrative district, we selected three street types, with two streets for each type, yielding a total of 24 streets. For commercial and living streets, the street definition and surrounding land use were considered. Streets with a higher concentration of service and functional stores were more likely to be selected. We then used Gaode Map POI data (18 categories; April–June 2022) to calculate POI counts for all streets in Harbin’s urban districts and to identify a POI-based gradient. The urban residential area map was then overlaid to screen living streets. For landscape streets, we prioritised streets with prominent map elements, such as historical buildings, waterfronts, and urban parks. As shown in Figure 6, these streets have a higher presence of leisure facilities.

3.3. Statistics and Calculation of Research Indicators

For activity portrait data collection, each street segment was limited to within 200 m, and the left and right sides of the street were combined in the calculations. Observations were conducted during periods with suitable weather conditions for travel, with one investigator assigned to each target street. In total, seven investigators participated and received pre-survey training (see Table 3).
One key metric is behavioural activity density, defined as the number of people engaged in behavioural activities within a designated street space during a specified period. It is calculated as the number of active subjects per 100 m for each street segment. The formulas are given in Equations (1) and (2).
D i n = N i n L i × 100
D i = D i 1 + D i 2 + D i 3 3
where D i n is the density of behavioural activity at the n-th time period of the i-th street segment (persons/100 m); D i is the averaged behavioural activity density on the i-th street segment (persons/100 m); N i n is the number of behavioural activities (i.e., the number of people) at the n-th time period of the i -th street segment; and L i is the centreline length of the i -th street segment (metres).
Activity-type propensity is measured as the ratio of subjects engaged in demand-oriented activities to all behavioural activities. It is calculated using Equations (3) and (4).
C i n = N i n b ( N i n a + N i n b )
C i = C i 1 + C i 2 + C i 3 3  
where C i n is the activity-type propensity at the n-th time period of the i -th street segment; C i is the homogenised activity-type propensity for the i -th street segment; N i n a is the number of foundational activities at the n-th time period of the i -th street segment; and N i n b is the number of demand-based activities at the n -th time period of the i-th street segment.
Age-group diversity reflects the diversity of age groups among people engaged in behavioural activities. In this study, participants are classified into three groups: children, young and middle-aged adults, and older adults. This indicator is calculated using the Shannon index, as shown in Equations (5) and (6).
H i n = β = 1 3 P i n β · ln ( P i n β )
H i = H i 1 + H i 2 + H i 3 3
where H i n is the age-group diversity at the n-th time period of the i-th street segment; H i is the averaged age-group diversity for the i-th street segment; P i n β is the proportion of the β -th age group at the n-th time period of the i -th street segment; and ln ( ) denotes the natural logarithm.
The selection of indicators for street spatial environmental elements is closely related to street-type classification. To examine how these elements influence users’ behavioural activities, and to ensure scientific rigour, validity, and operability, the same set of environmental elements should be used across different street types. This consistency allows objective comparisons of how environmental elements affect behavioural activities across street types. Based on a review of street types in the existing literature, in this study, we classify and synthesise the street spatial environmental elements used in prior studies. The resulting categories are shown in Table 4.
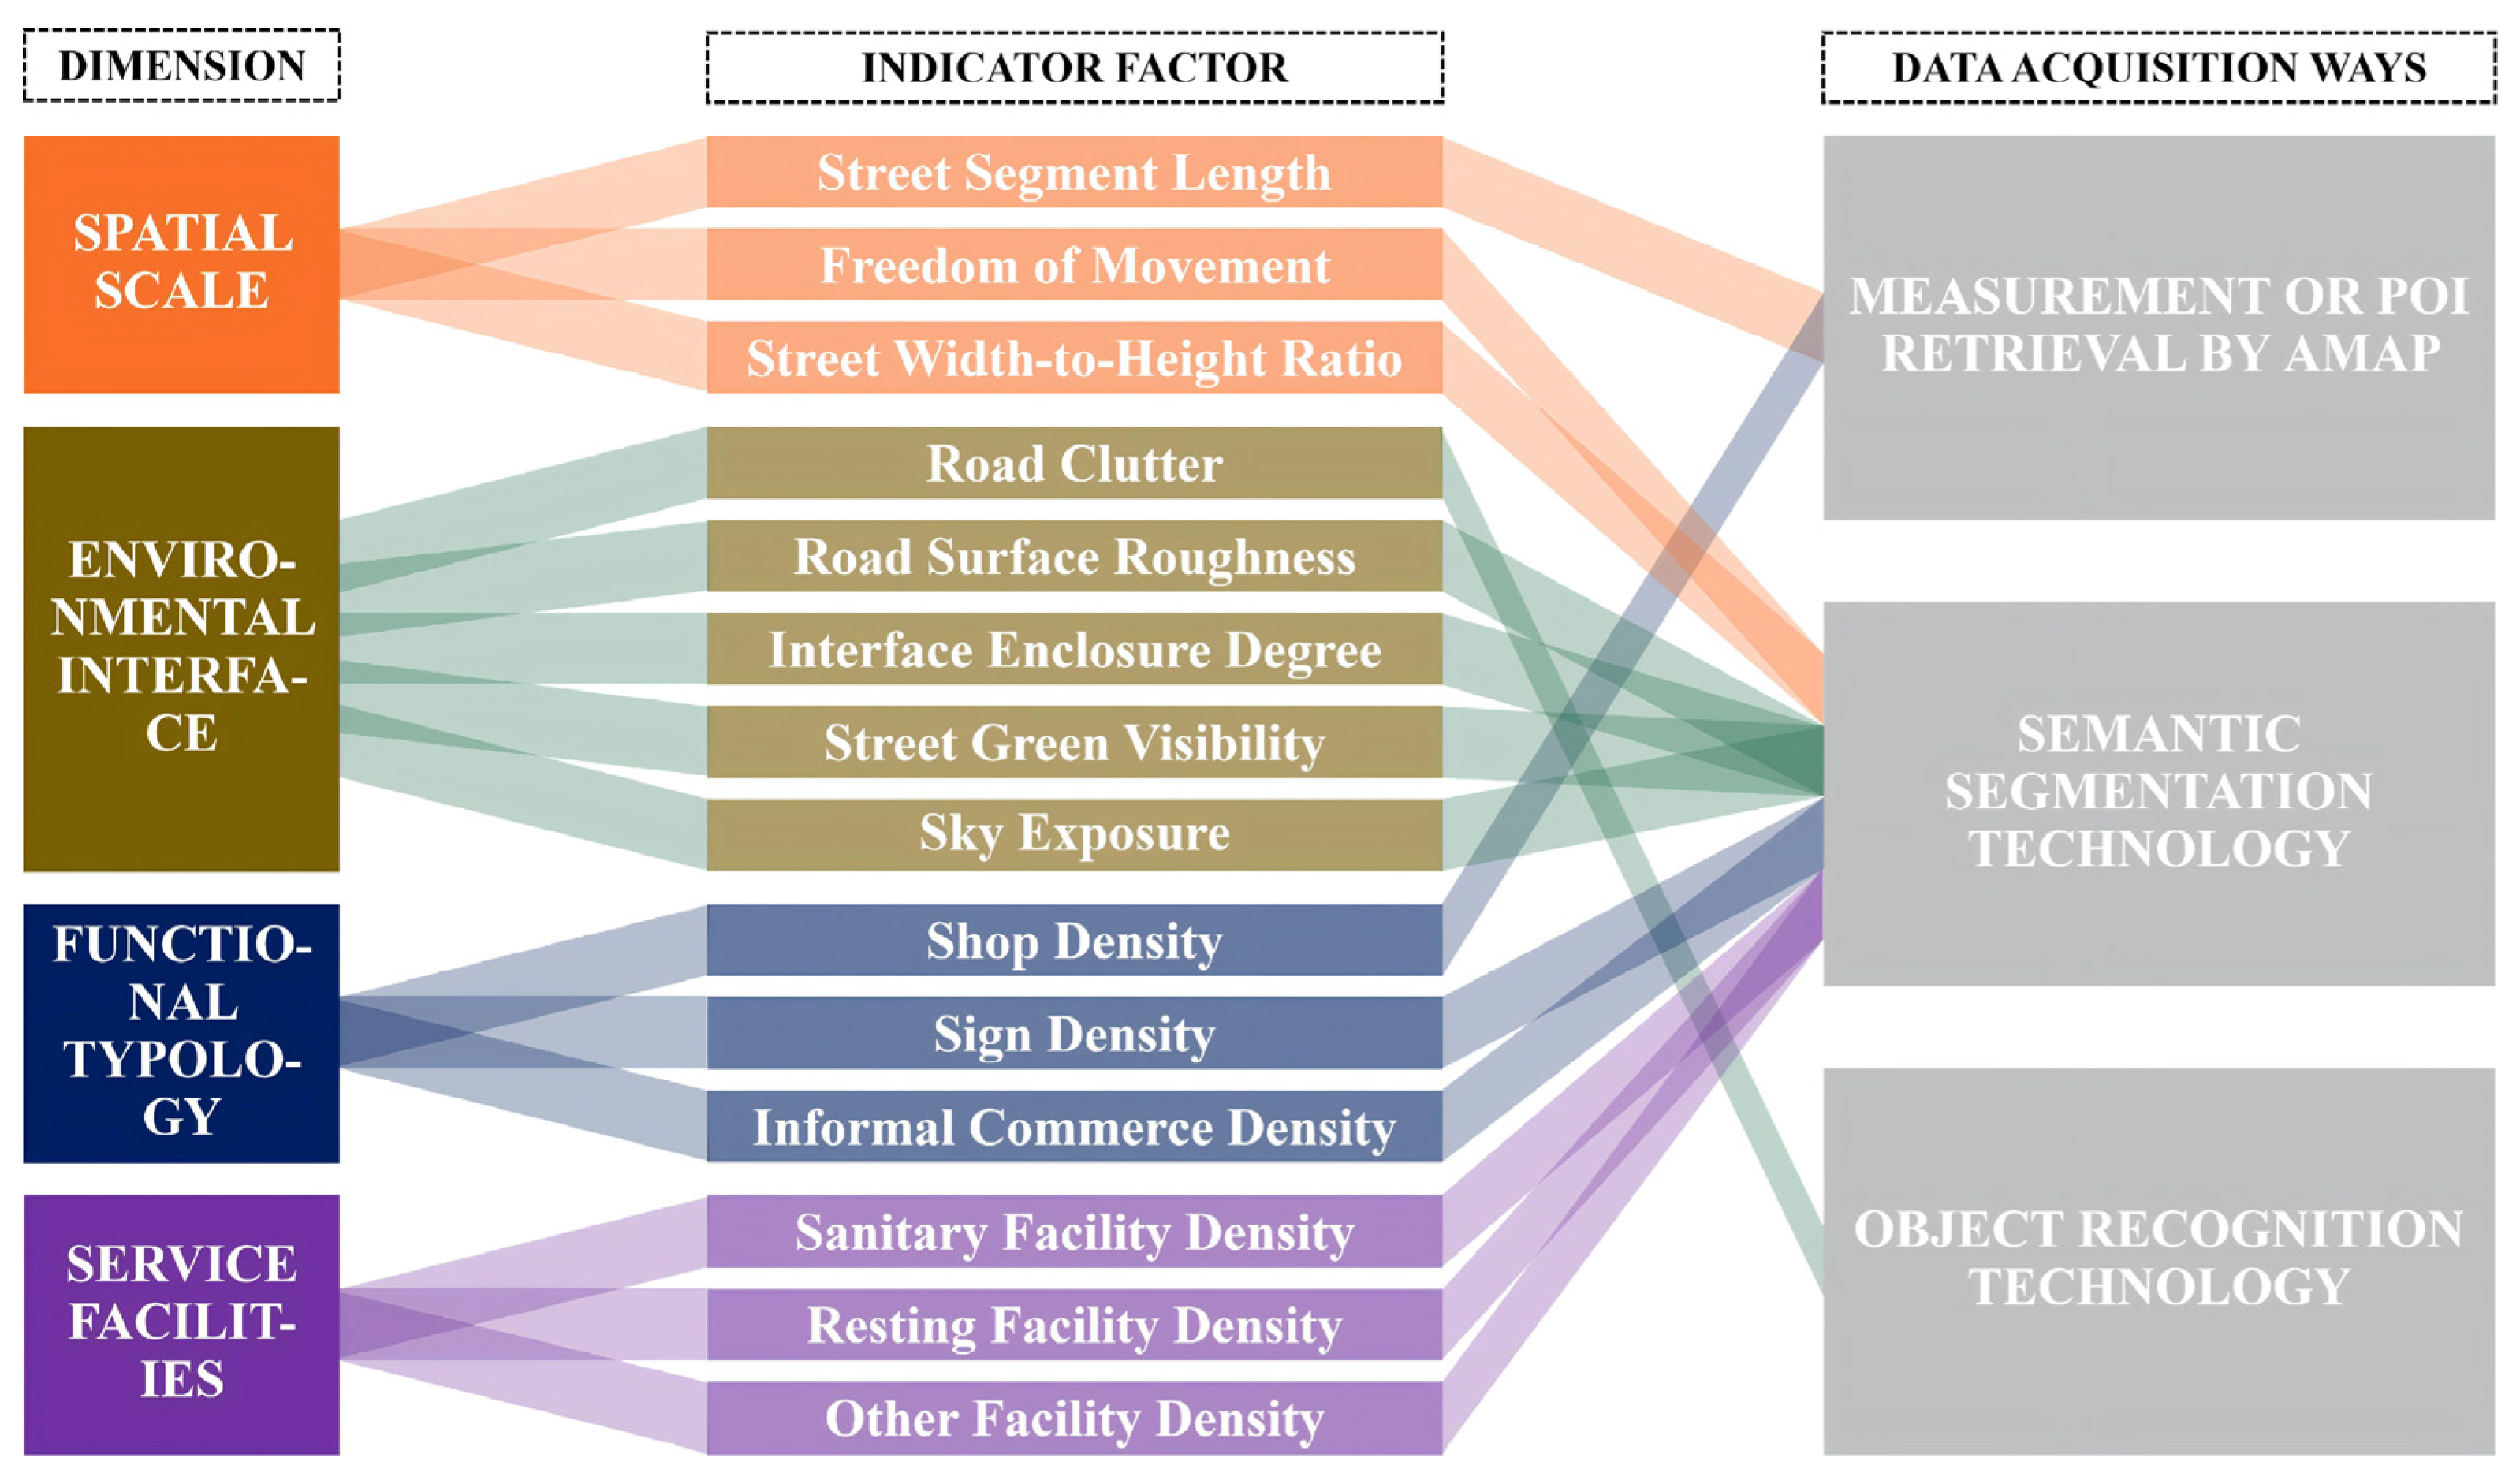
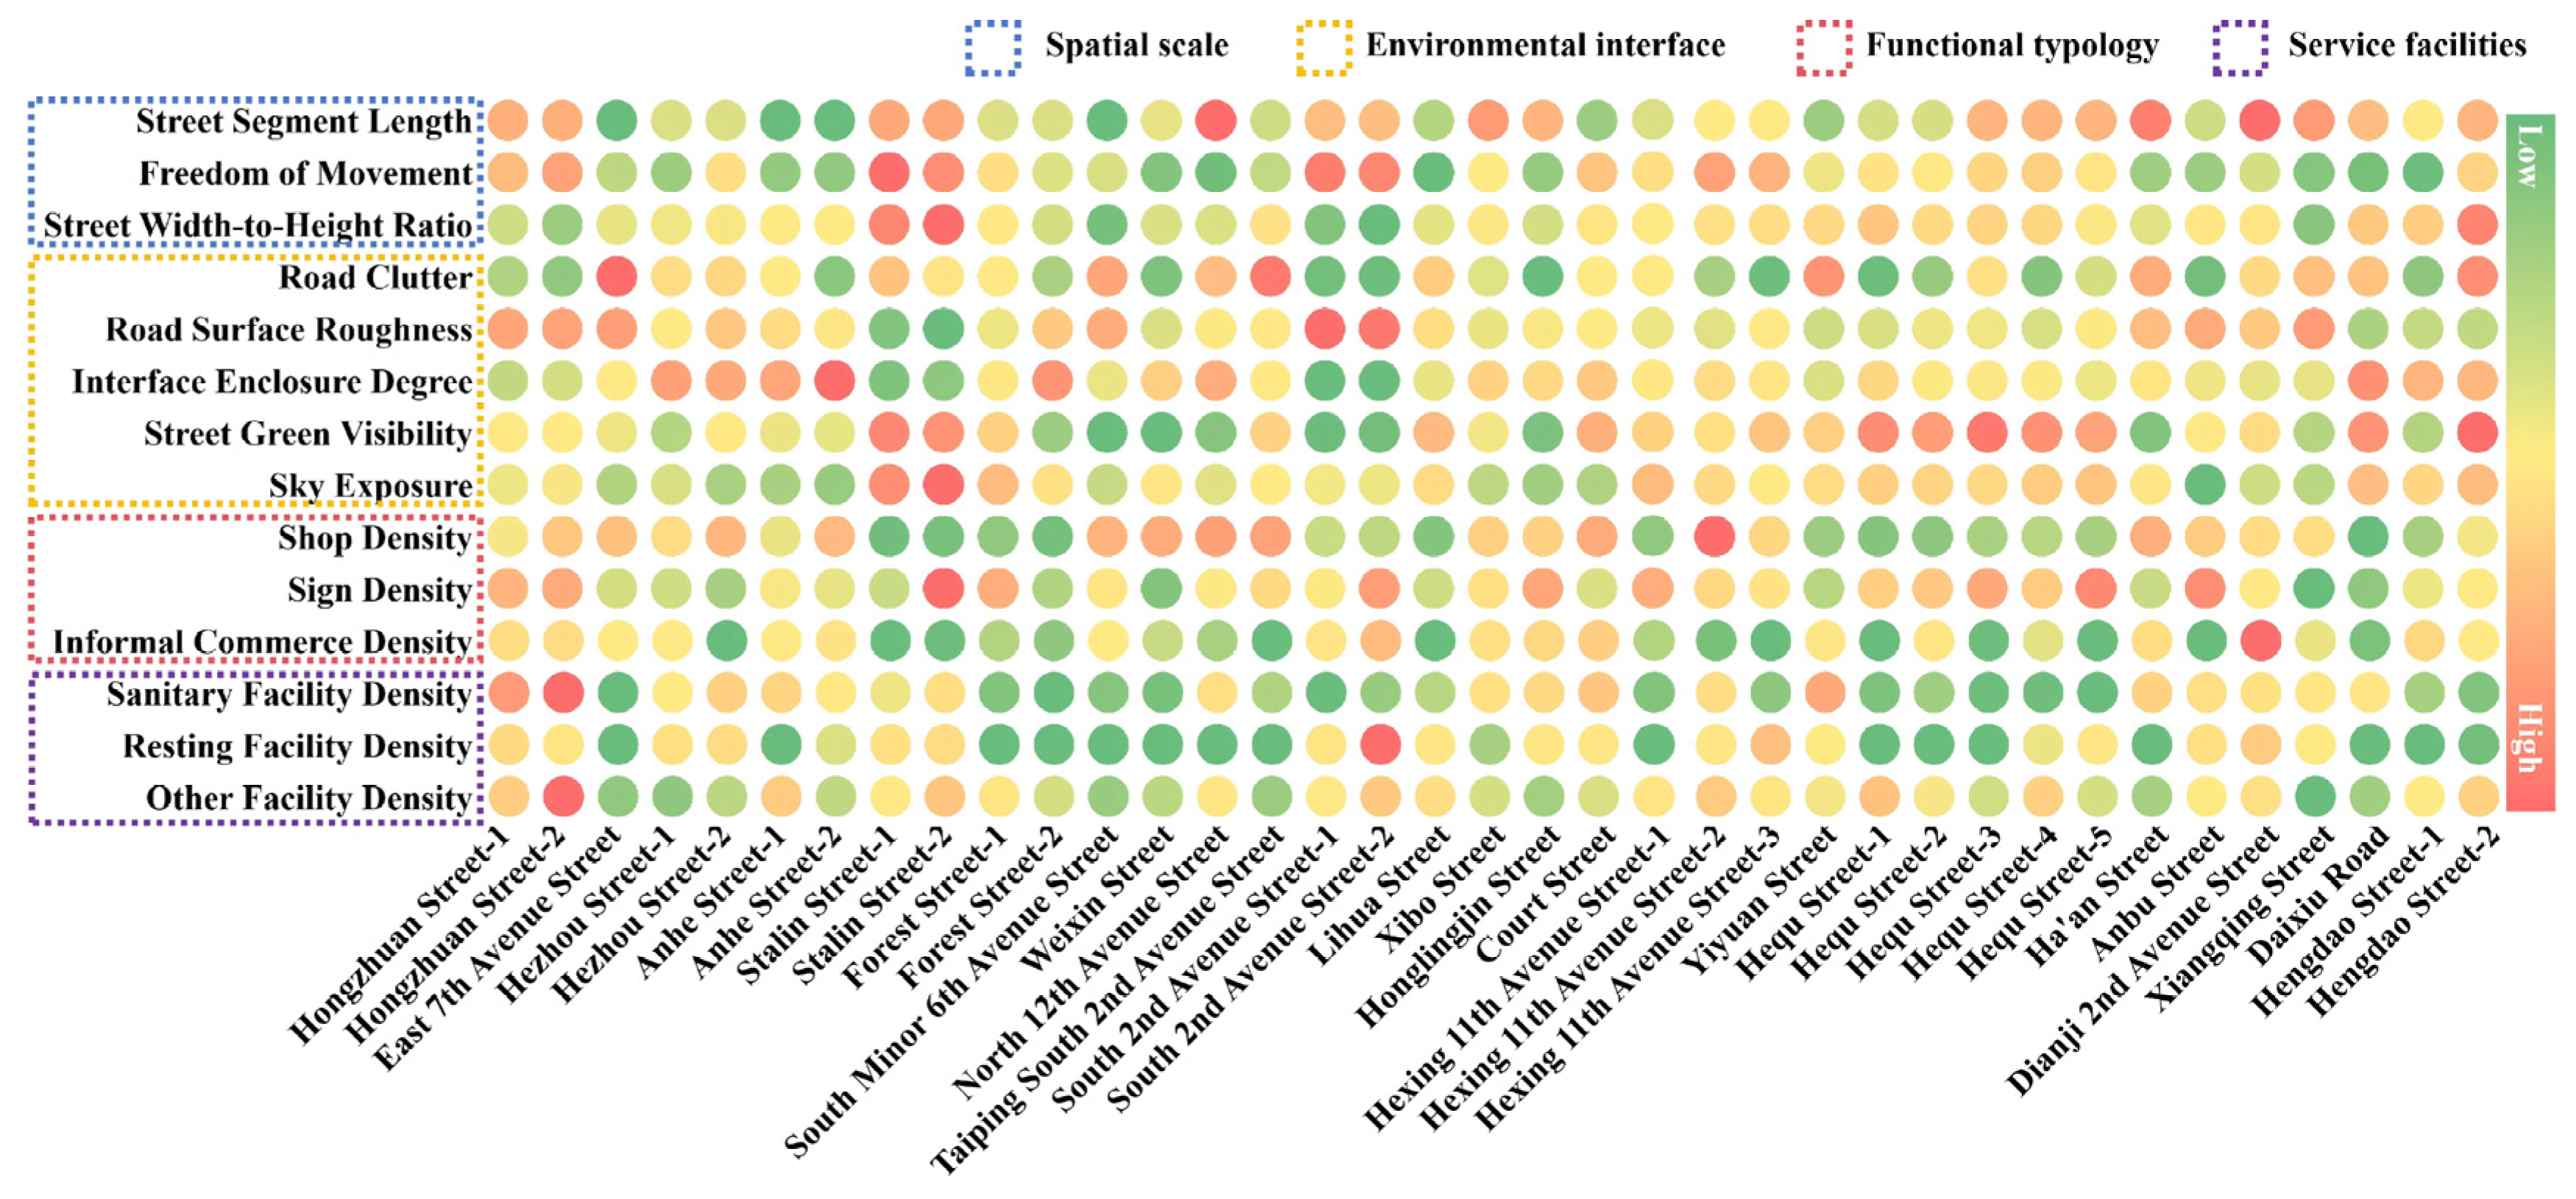
For the collection of street spatial environment data, indicator data were obtained from online sources. Based on four characteristic dimensions, a street spatial quality indicator system for Harbin was established, comprising a total of 14 indicators (see Figure 7).

4. Results

4.1. Characterisation of Street Spatial Environmental Elements

Streets were segmented at 25 m intervals in ArcGIS. Summer street-view images were collected using Python 3.6.6 scripts and the Baidu Maps Open API. At each sampling node, four horizontal street-view images were captured at headings of 0°, 90°, 180°, and 270°. In winter, streetscape images were collected for semantic segmentation and object detection. We obtained and visualised data for 14 environmental element indicators across 37 street segments. As shown in Figure 8, street spatial environmental elements differ clearly by street type. Commercial streets are characterised by high shop density and high sign density. Landscape streets perform best in street green visibility and sky openness. Living streets show a more balanced pattern in sanitary facility density and freedom of movement. In winter, streets generally show higher road surface roughness and lower informal commercial density.

4.2. Characterisation of Street Space Activity Portraits

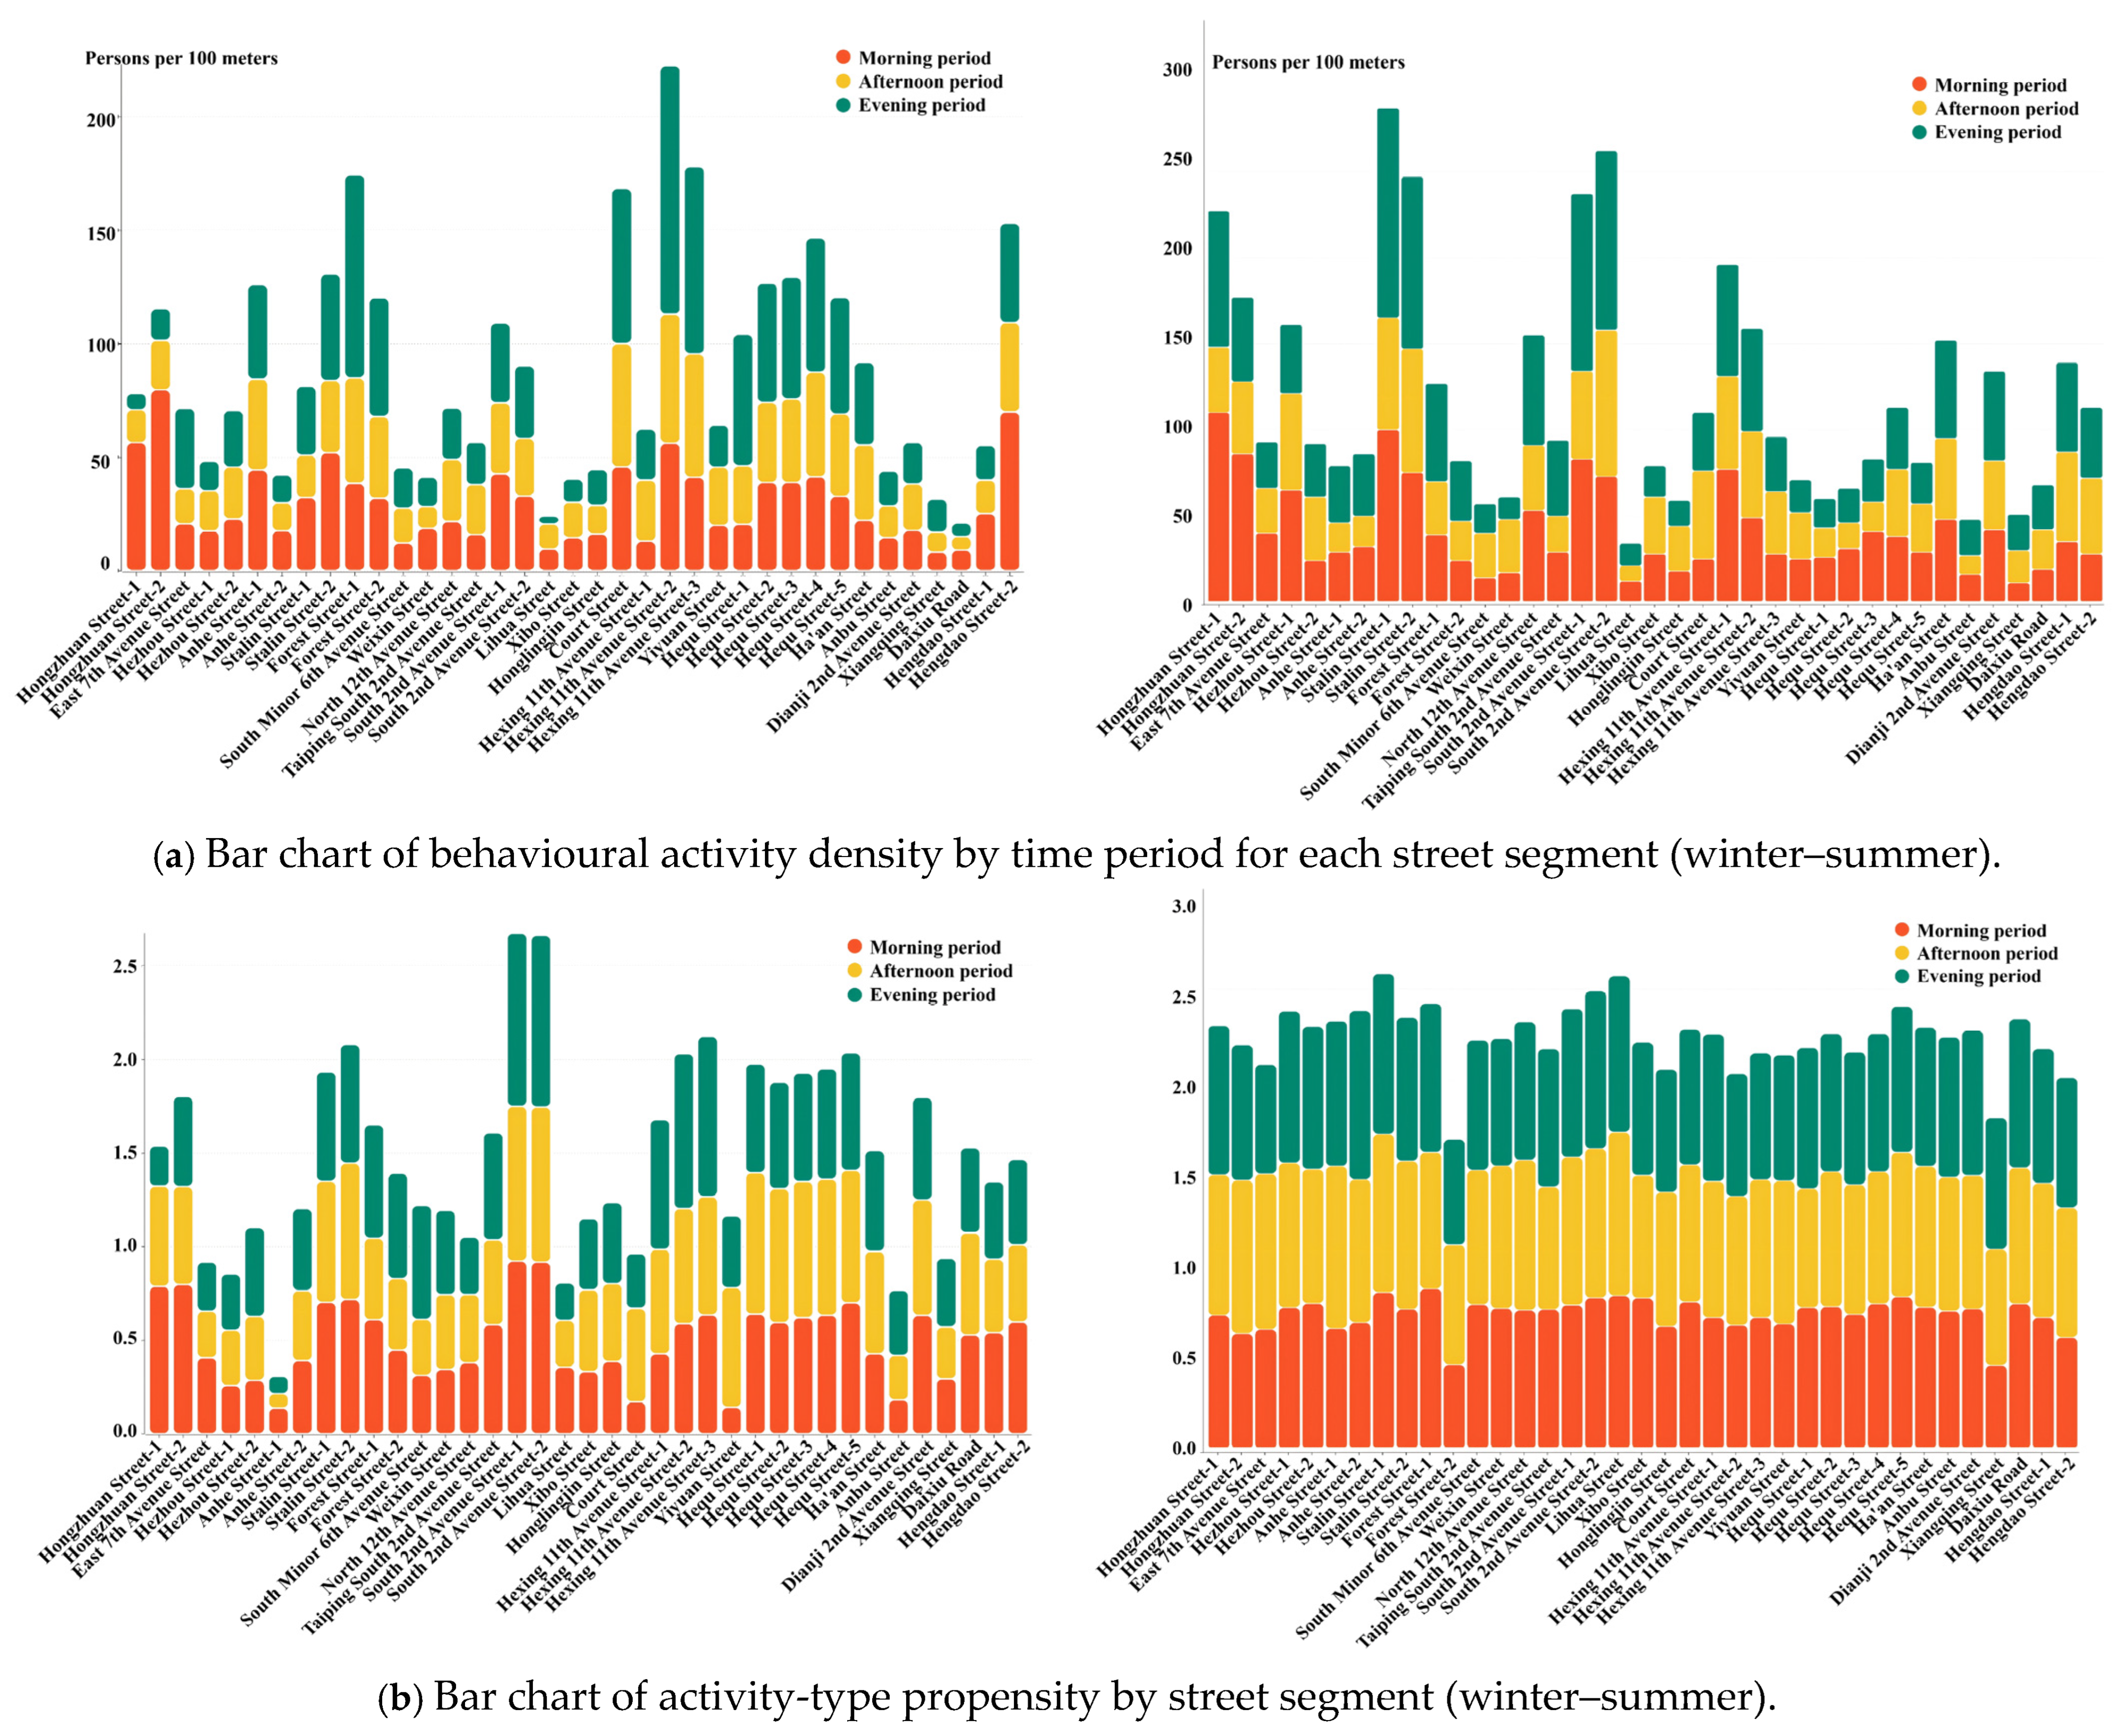
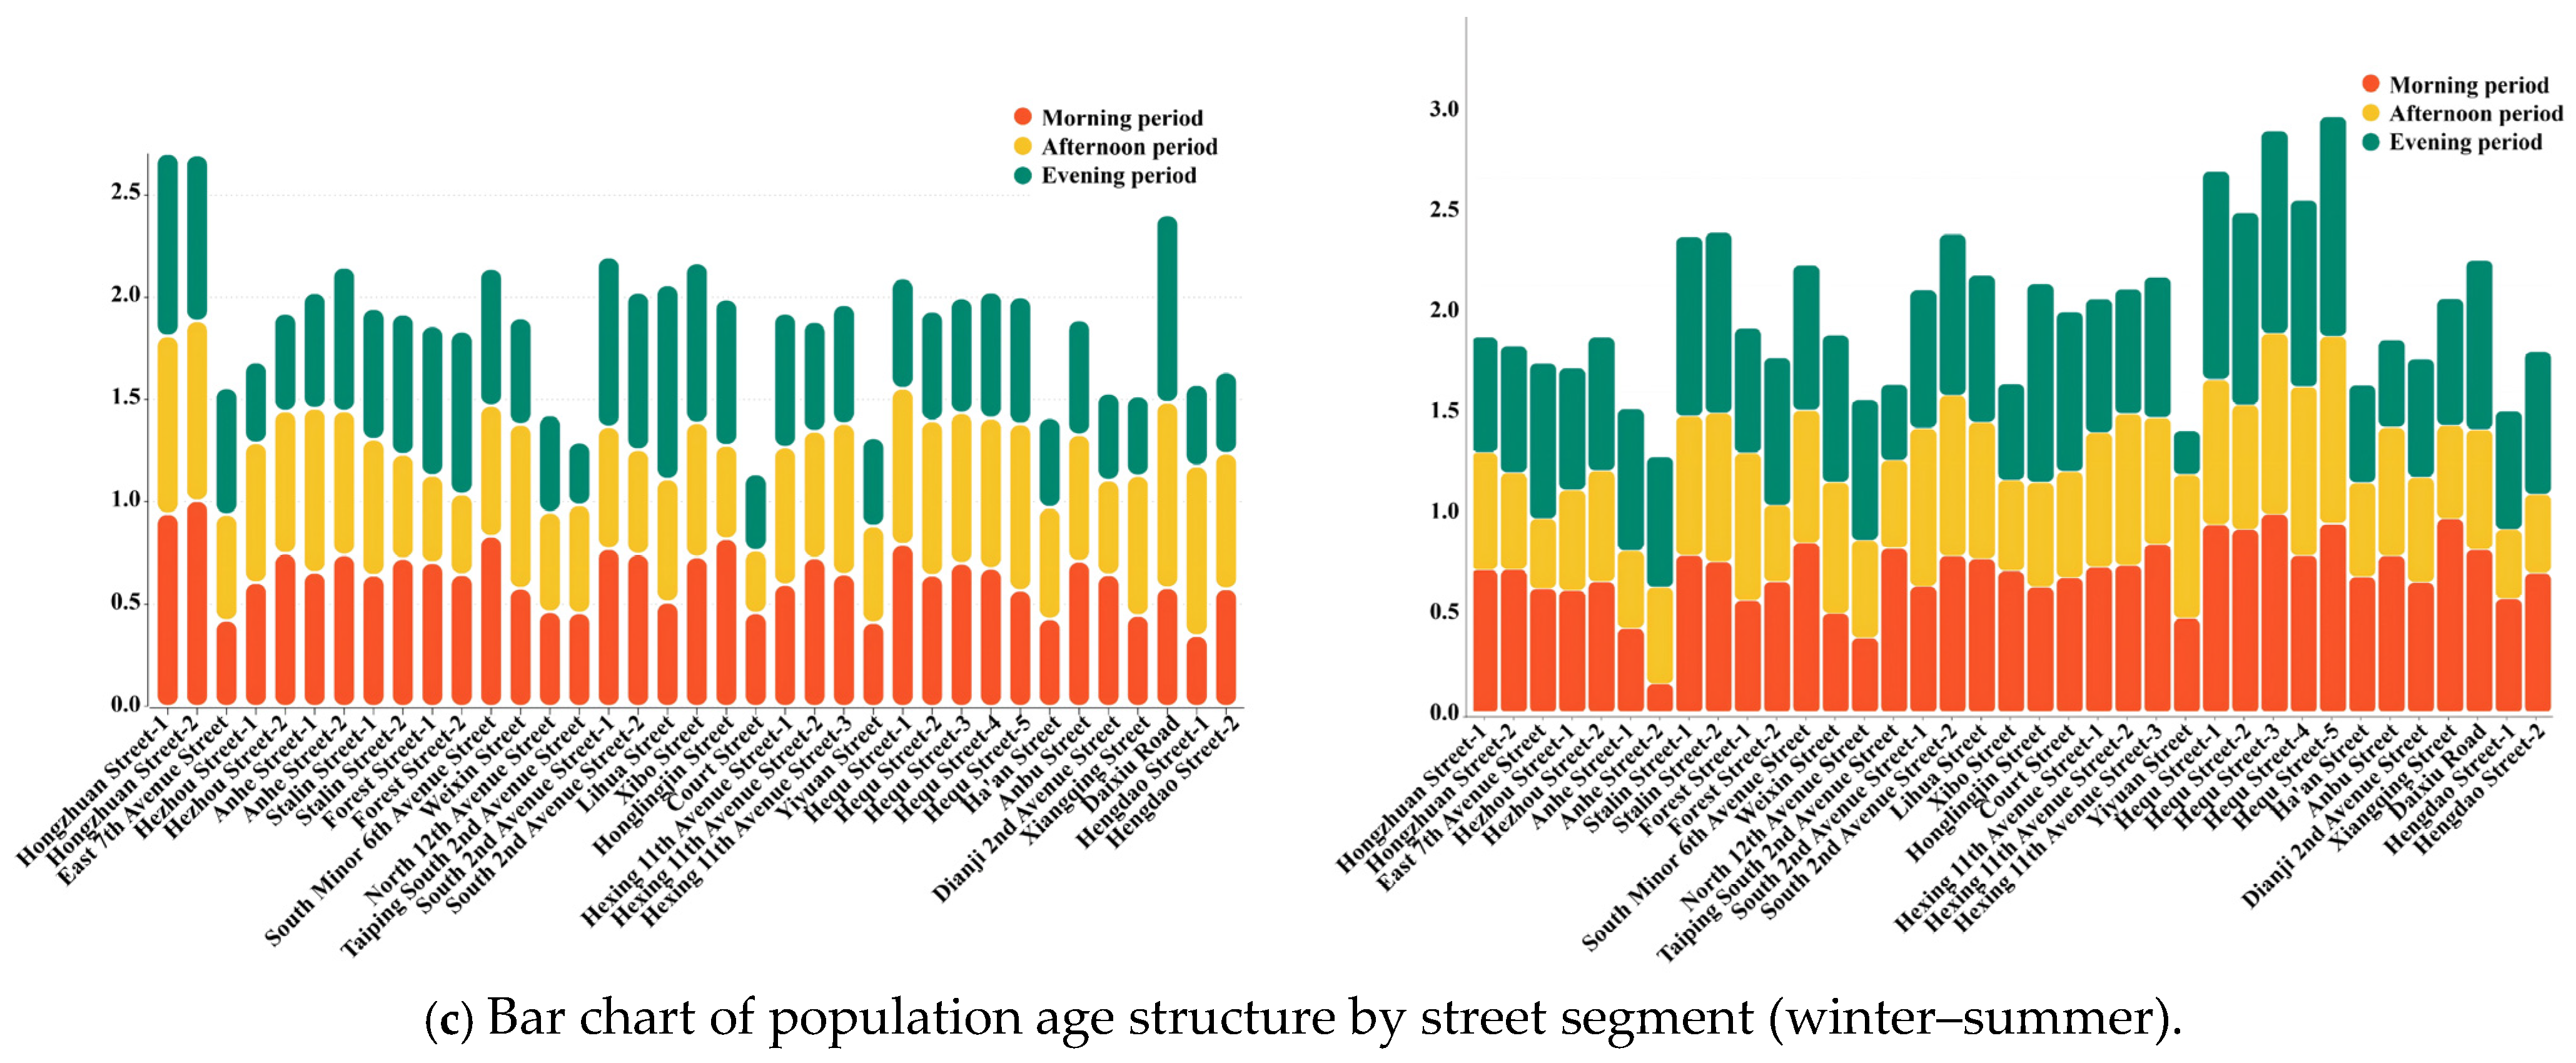
Seasonal differences between winter and summer strongly shape street activity characteristics. In winter, overall behavioural activity density is low. However, some segments, such as Forest Street-1 and Court Street, show a relatively even distribution across morning, afternoon, and evening periods because their functions match users’ needs. Activity types are mainly necessary activities (e.g., commuting and short shopping trips). The age structure is dominated by young and middle-aged adults, while participation by children and older adults is much lower. In contrast, on commercial streets such as Hongzhuan Street-1 and Stalin Street-1/2, behavioural activity density increases sharply in summer and exceeds 200 persons/100 m on some segments (Figure 9a). Activity types become more diverse, including leisure socialising and outdoor experiences. The age structure is also more mixed, with children, young and middle-aged adults, and older adults present at the same time. Evening becomes the main activity peak (Figure 9b,c).
When we clustered the 37 street segments in winter, clear differences appeared across street types. Peak behavioural activity density occurred at different times of day: commercial streets peaked in the morning, while living and landscape streets peaked in the evening. Landscape streets also showed higher densities of both basic activities and demand-oriented activities than the other two street types. In contrast, demand-oriented activity density was generally higher on commercial and living streets. Street types also differed in how well they met the activity needs of different age groups. Children showed the lowest activity demand, while young and middle-aged adults showed the highest; overall, demand-oriented activity density was relatively high. However, street types showed only small differences in their capacity to accommodate activities across age groups. Children consistently had the lowest activity density, and young and middle-aged adults the highest. Landscape streets had higher activity densities for all three age groups than the other two street types. Living streets accommodated young and middle-aged adults better than commercial streets, while activity densities for children and older adults were broadly similar between these two street types (see Supplementary Figure S1).

4.3. Characterisation of Correlations Between Street Environmental Elements and Activity Portraits

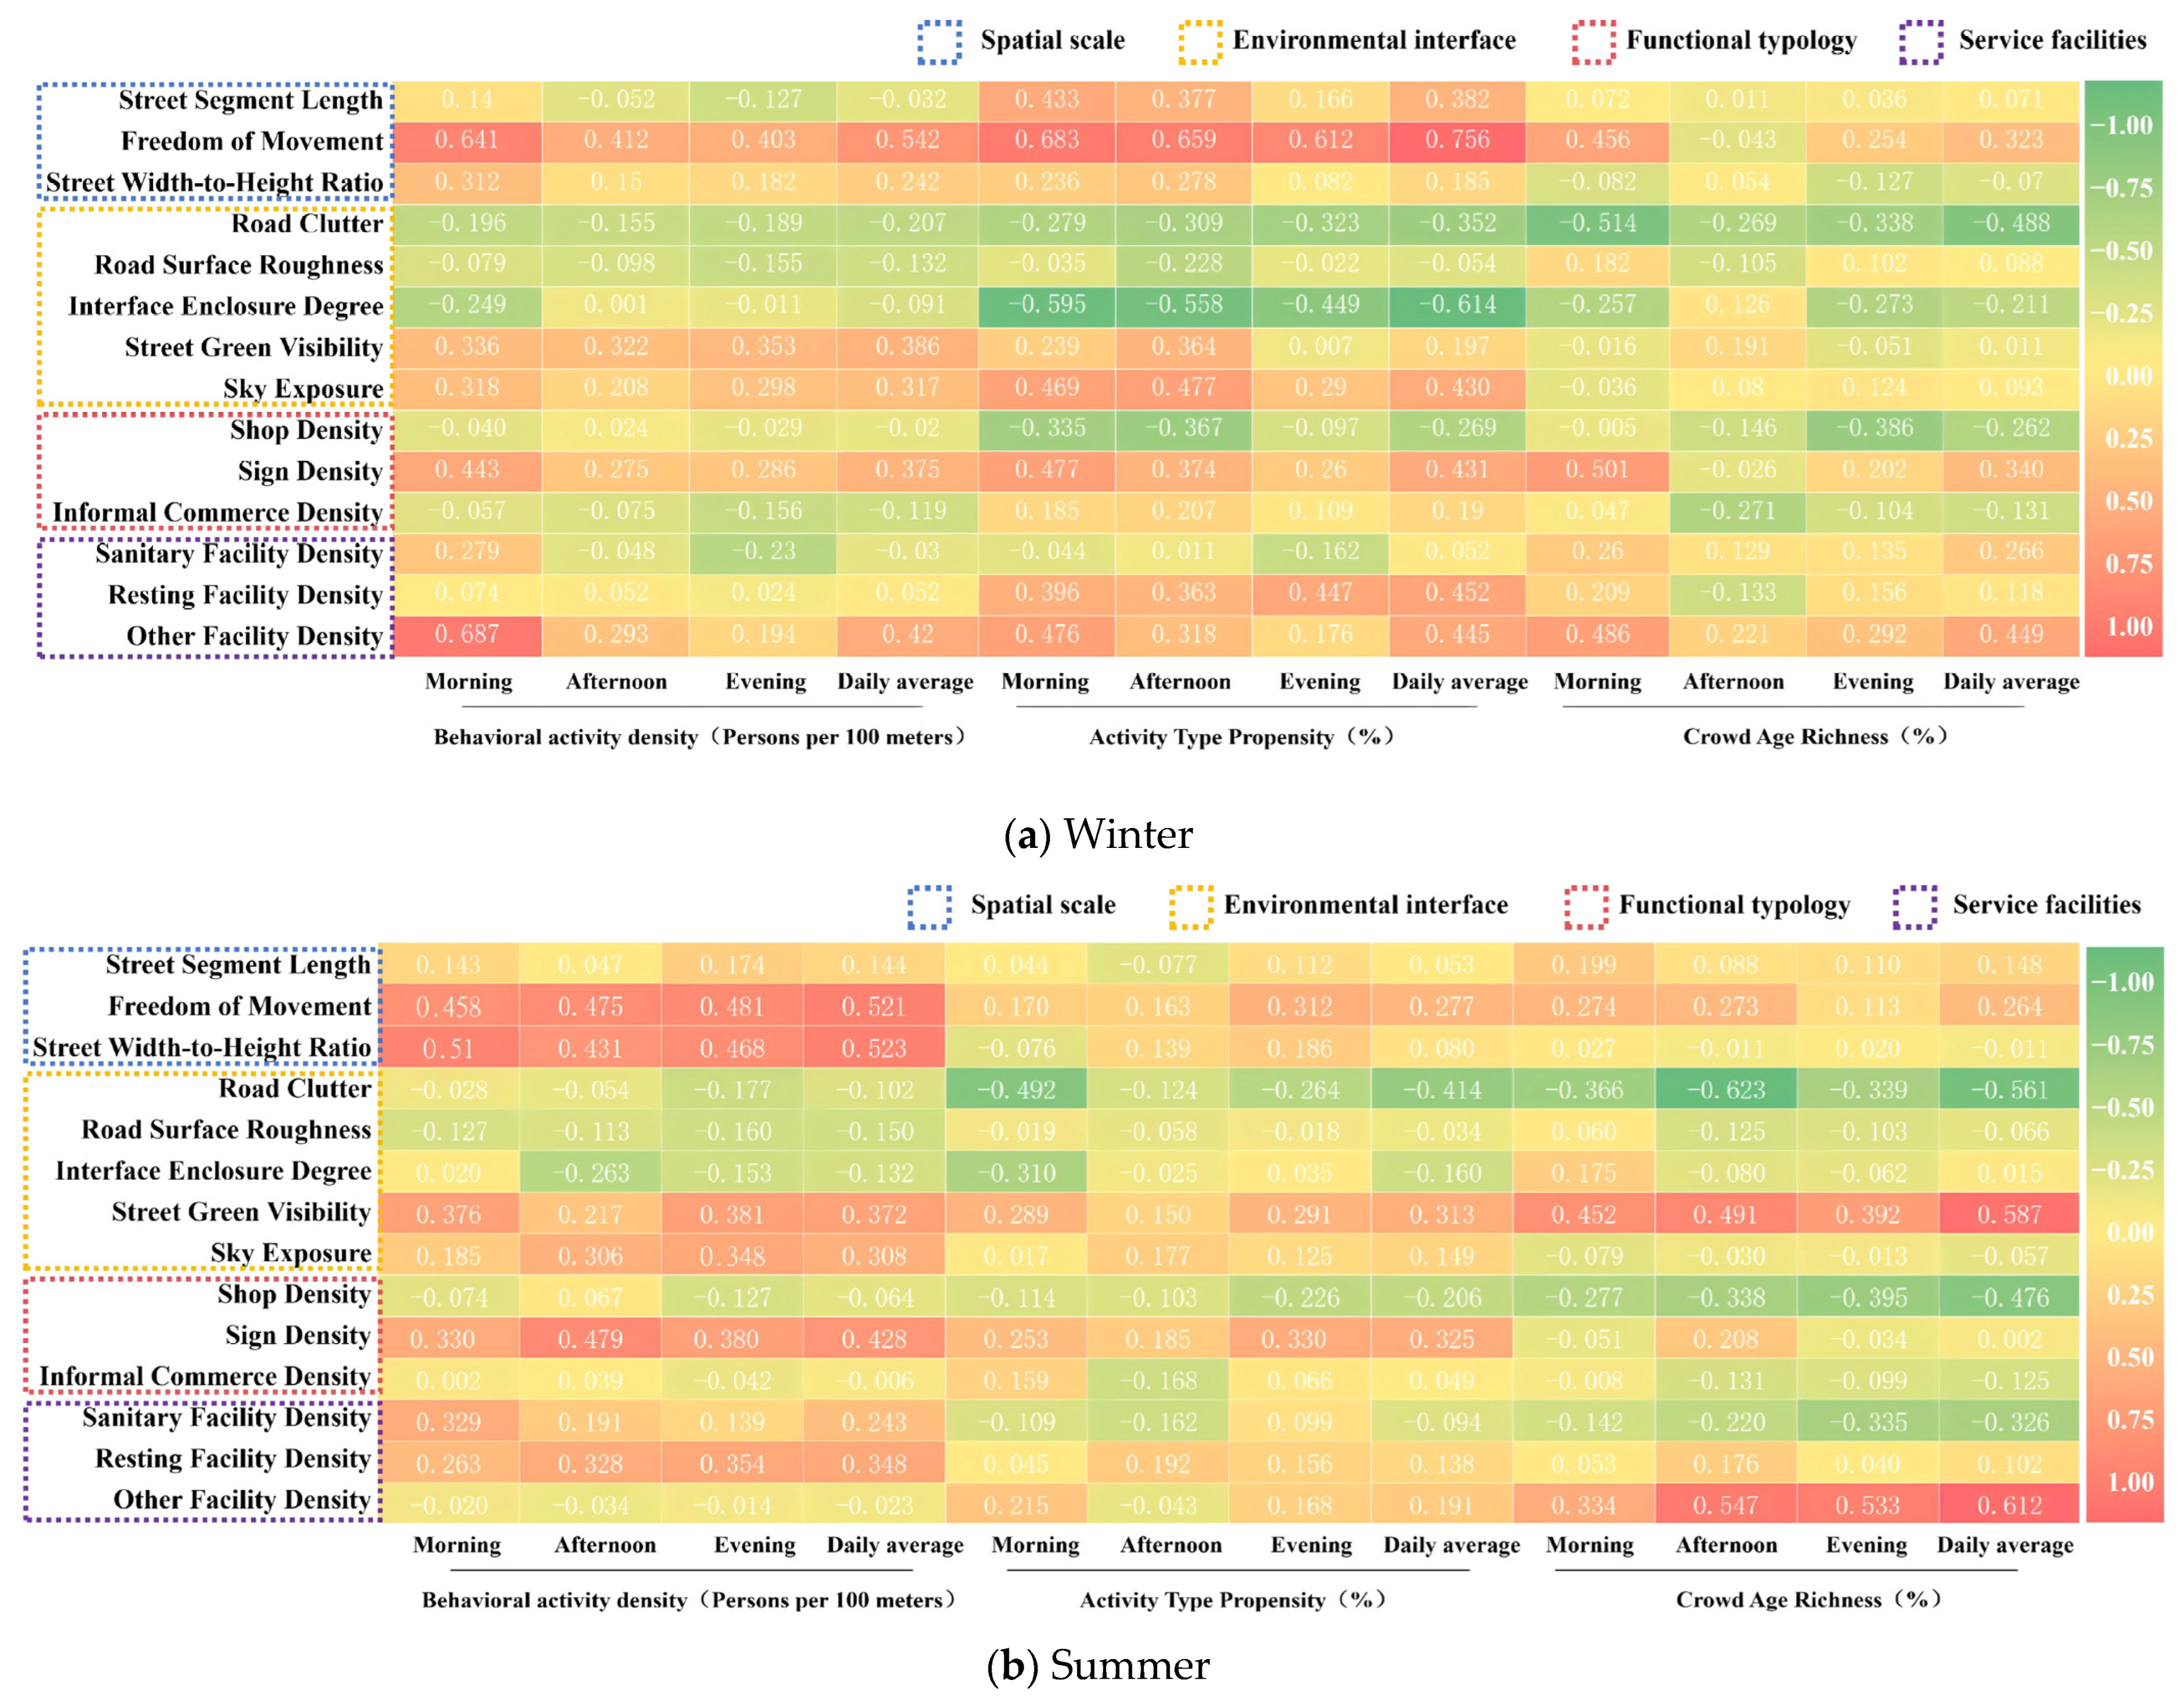
In winter, the correlations between activity portrait indicators and environmental factors are broadly consistent. The time-of-day analysis shows three main patterns. First, behavioural activity density is more strongly related to environmental factors in the morning, with a stronger positive correlation with other-facility density. Second, activity-type propensity is strongly influenced by environmental factors across all four time periods, with a stronger positive correlation with freedom of movement. Third, crowd age-group diversity is more strongly related to environmental factors in the morning and shows a stronger negative correlation with pavement ruggedness (Figure 10a).
In summer, the relationships between activity portrait indicators and environmental factors vary more across indicators. Behavioural activity density is more strongly associated with the street width-to-height (W/H) ratio, greenery visibility, and the density of surrounding facilities. In contrast, it shows weaker associations with other factors such as road ruggedness. Overall, behavioural activity density and activity-type propensity are negatively correlated with road ruggedness. Across time periods, behavioural activity density shows relatively stable and stronger associations with environmental factors throughout the day. Activity-type propensity is less affected by environmental factors at midday. Age-group diversity is consistently associated with environmental factors across all time periods (Figure 10b).
Correlation patterns differ across street types and reflect functional differences. On commercial streets, freedom of movement and the densities of sanitary facilities and other supporting facilities are significantly and positively correlated with all-day average activity portrait indicators in winter. In summer, correlations involving behavioural activity density become stronger, and positive and negative correlations are more clustered. On living streets, activity-type propensity is positively correlated with all spatial environmental elements in winter. In summer, correlations between behavioural activity density and environmental elements strengthen, and negative correlations become stronger. Correlations for age-group diversity also increase slightly. On landscape streets, activity-type propensity shows the strongest correlations in winter and remains highly associated across all time periods. In summer, correlations between activity-type propensity and street elements weaken, while correlations between behavioural activity density and age-group diversity increase substantially (see Supplementary Figures S2–S4).

4.4. Mathematical Model: Activity Portrait Index and Street Spatial Characteristics

4.4.1. Quantification of the Activity Portrait Index

In this study, we used the Shannon diversity index [44], indicator normalisation [45], and the coefficient of variation weighting method [38] to quantify indicators and assign weights. Regression analysis was then applied to develop the mathematical model. Using the coefficient of variation method, weights were calculated for three API indicators: behavioural activity density, activity-type propensity, and age-group diversity (Table 5).
The API for each street segment and season was calculated by summing the assigned scores of the three index factors. Detailed results are provided in Supplementary Table S1. The winter and summer formulas are shown in Equations (7) and (8), respectively:
V i = 0.447 × a i + 0.277 × b i + 0.276 × c i
V i = 0.445 × a i + 0.191 × b i + 0.464 × c i
where V i is the API of the i -th street segment; a i is the behavioural activity density on the i -th street segment; b i is the activity-type propensity for the i -th street segment; and c i is the age-group diversity on the i -th street segment.

4.4.2. Mathematical Model of the Winter–Summer Relationship Between API and Street Spatial Characteristics

Based on the quantified API results (see Supplementary Table S1), and considering winter–summer climate differences and street spatial environmental characteristics, we developed separate models for winter and summer. The modelling process followed three steps: correlation screening, dimensionality reduction and variable optimisation, and regression modelling. This approach was used to ensure scientific rigour and practical applicability.
(1)
Winter model
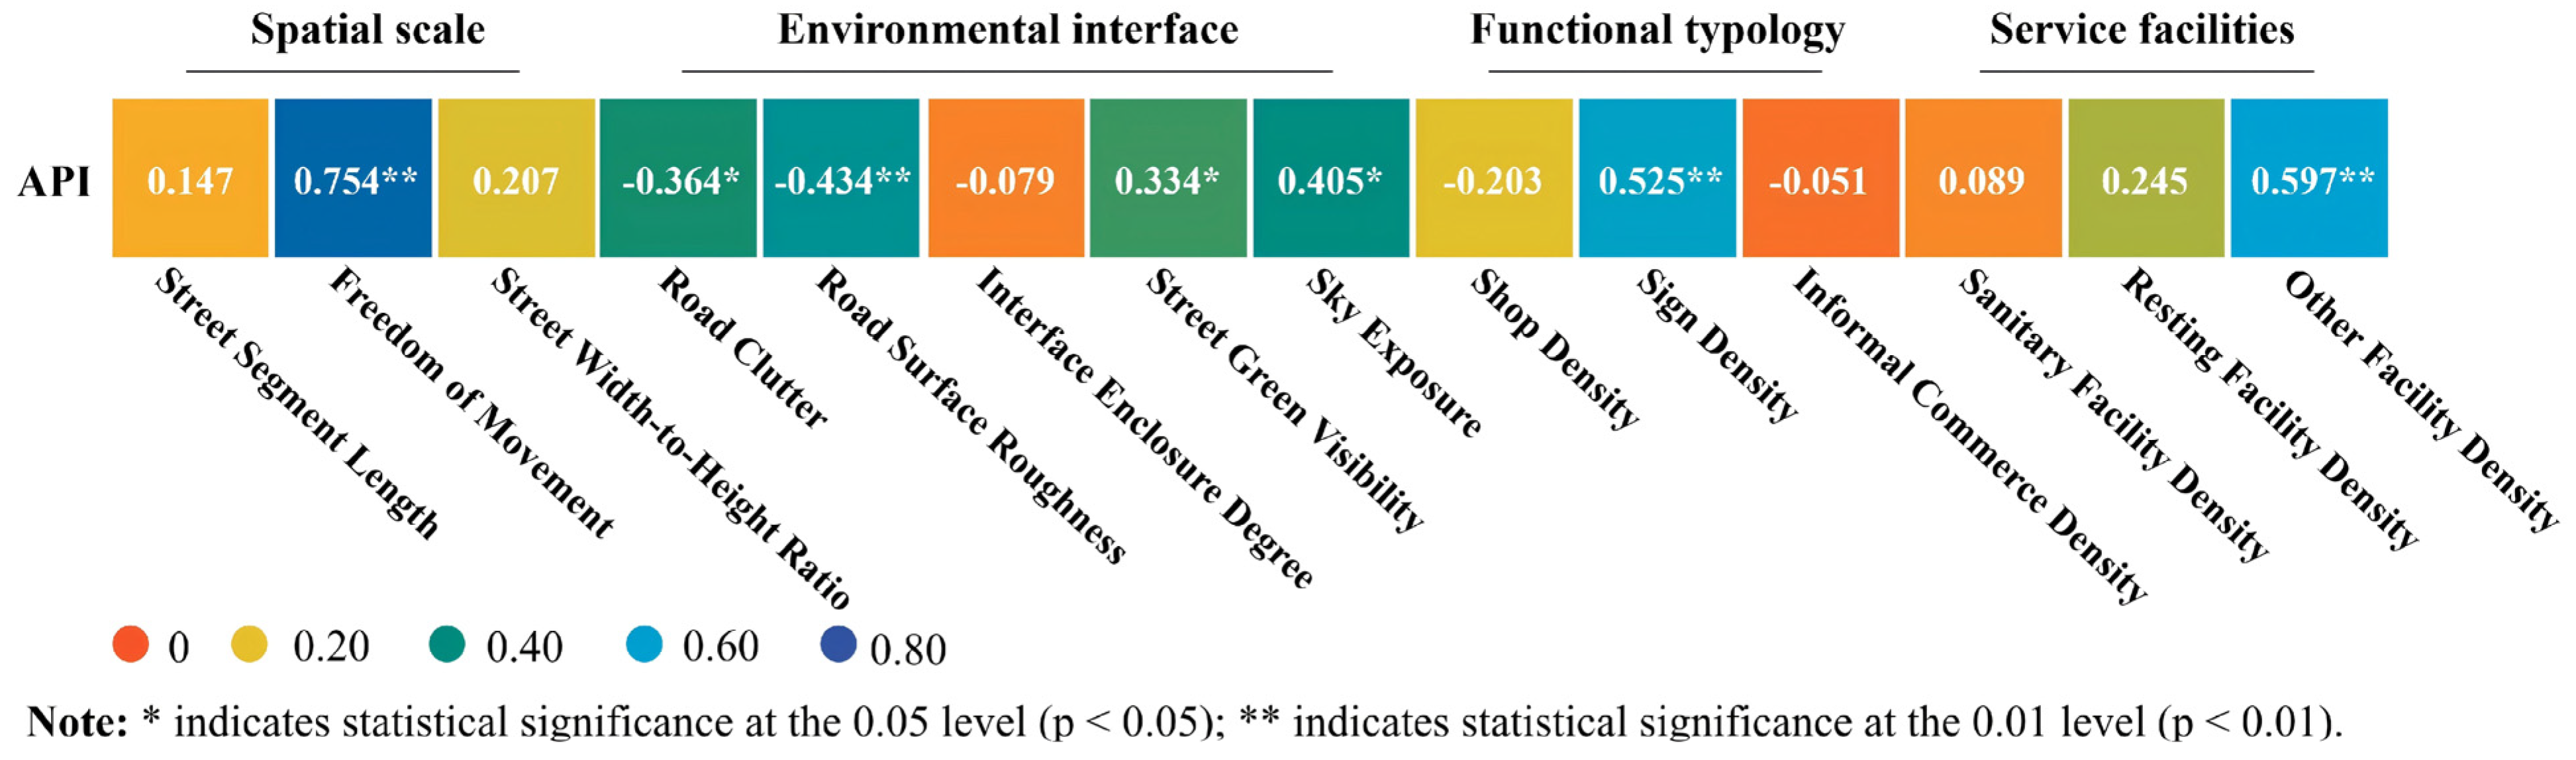
For the winter model, we first tested correlations between the 14 environmental elements and the API. Seven elements showed significant associations with the API, including freedom of movement, road surface roughness, and street green visibility (Figure 11).
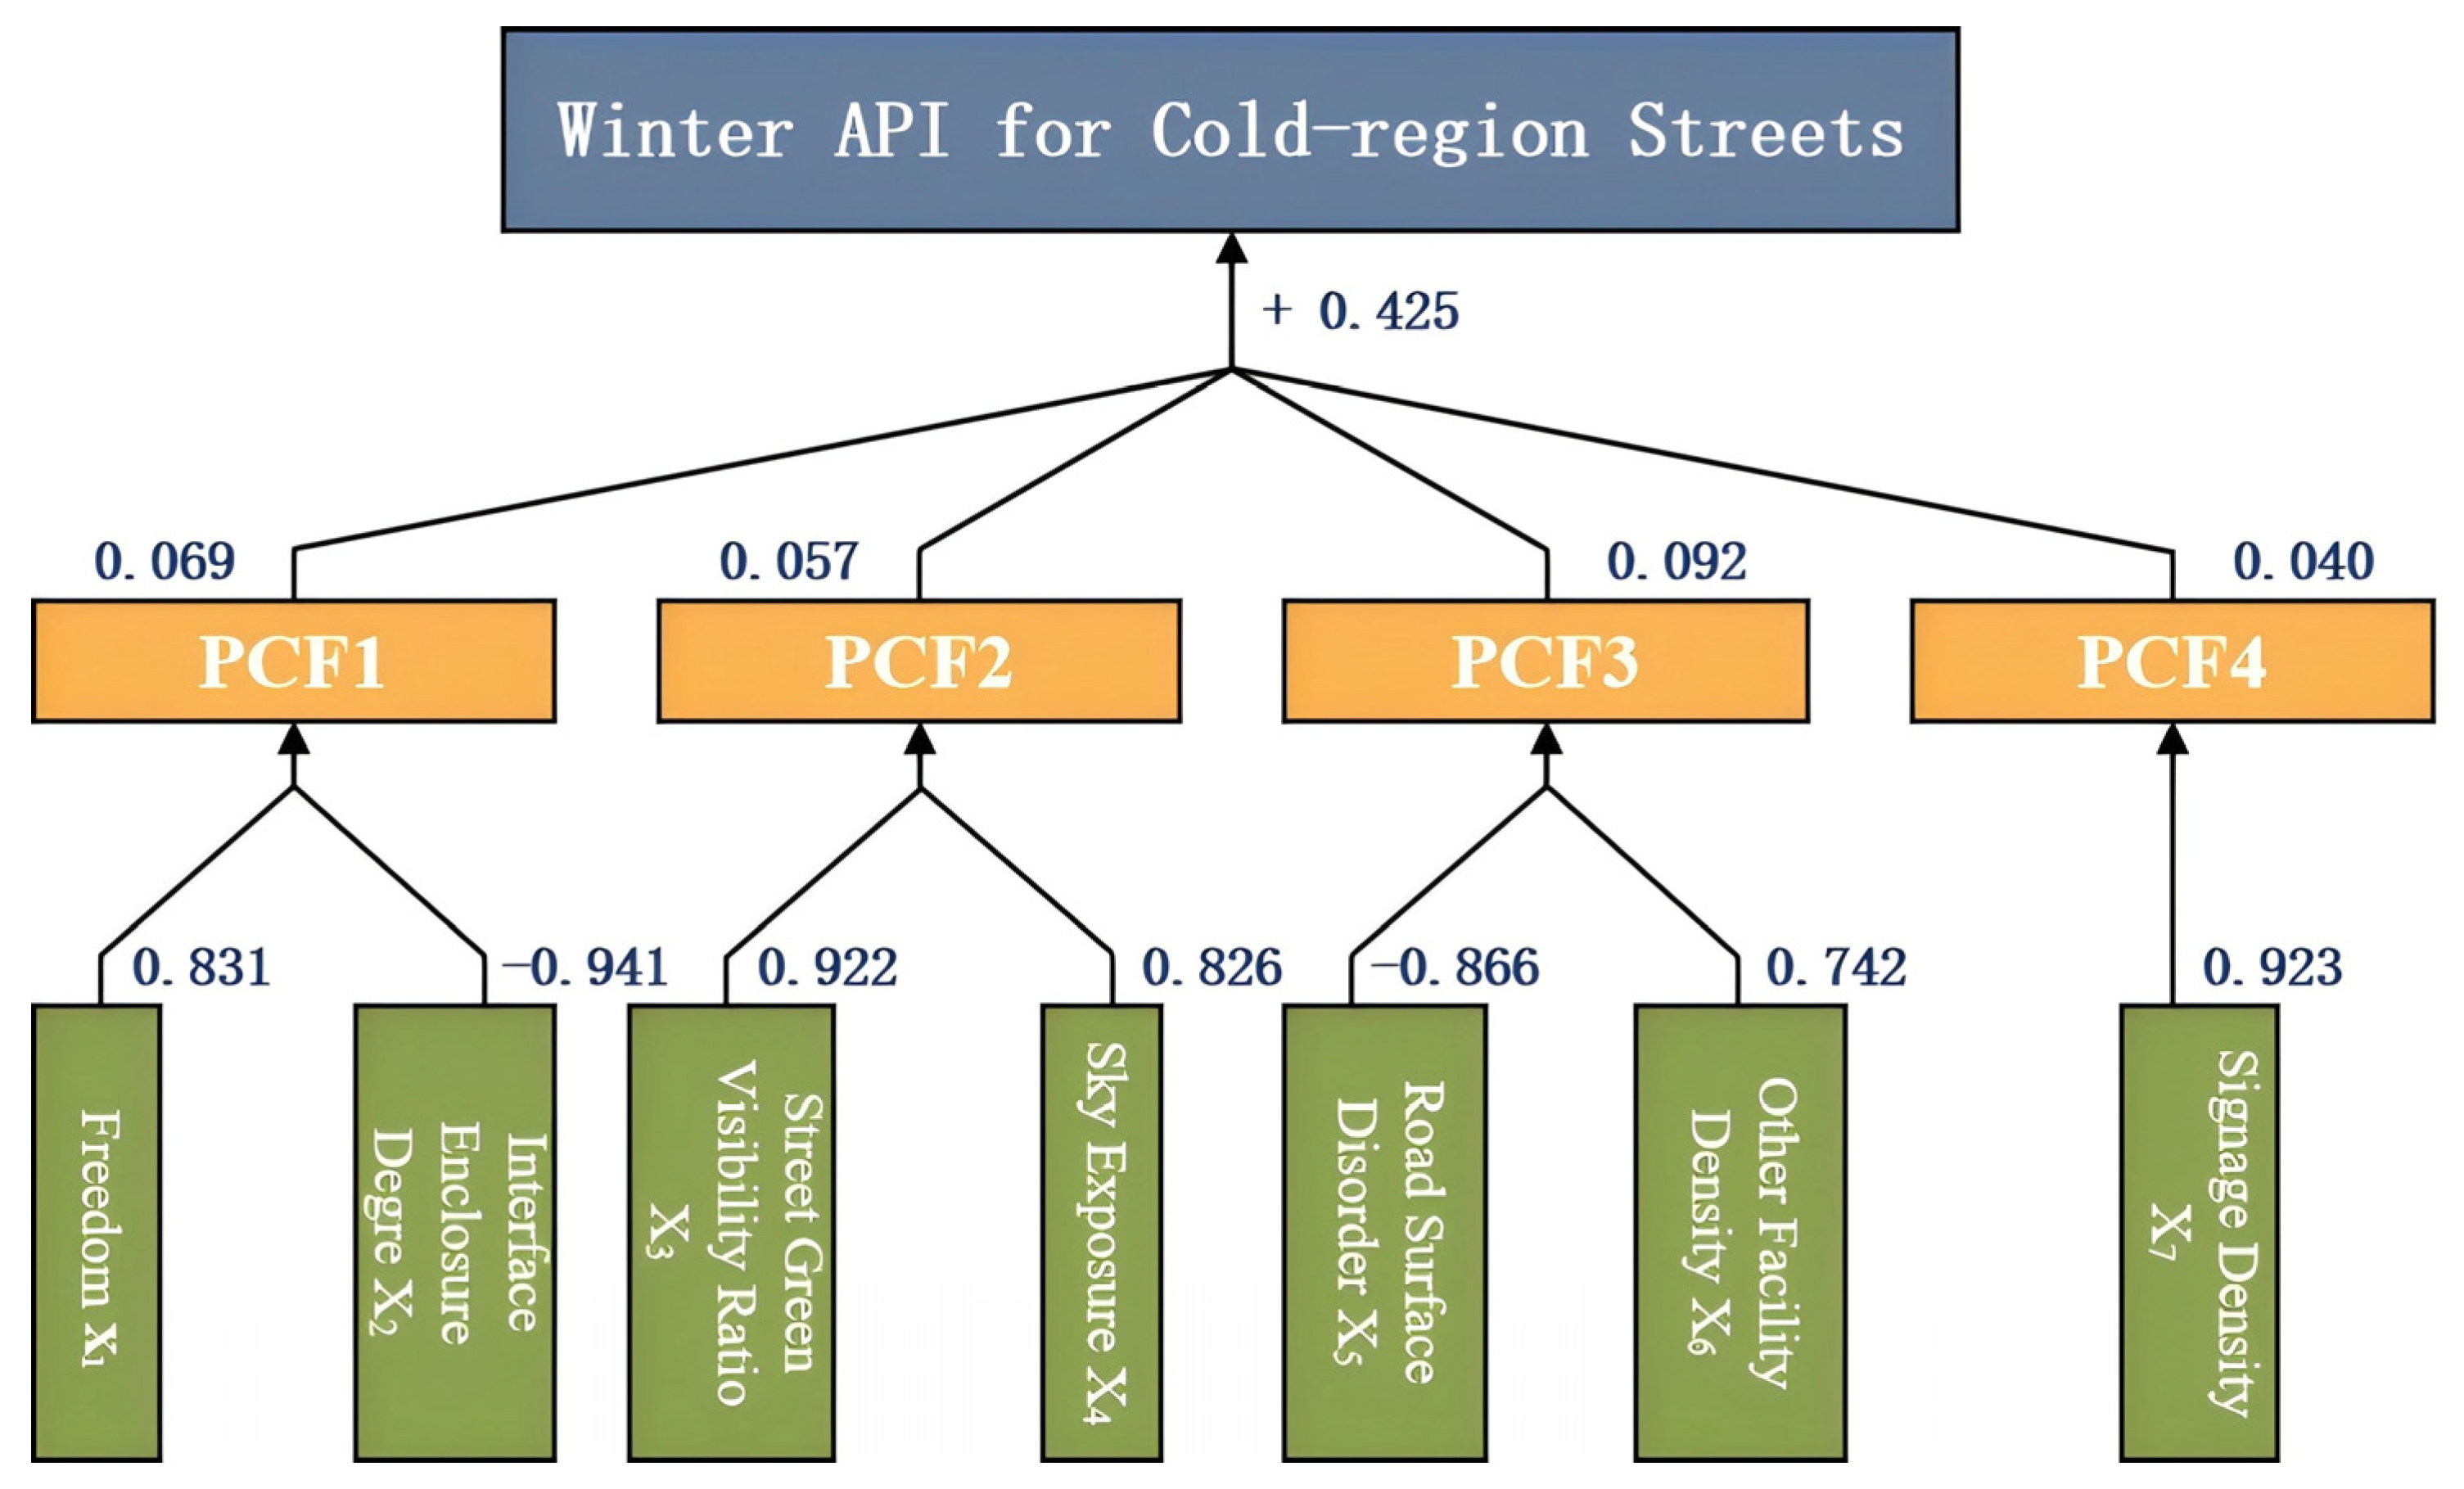
Because some independent variables were correlated, Principal Component Analysis (PCA) [46] was used for dimensionality reduction. The KMO value was 0.67 (p = 0.000 < 0.05), indicating that the data were suitable for PCA. The extracted components explained 86.240% of the total variance. Component 1 included freedom of movement and road clutter. Component 2 included street green visibility and sky openness. Component 3 included road surface roughness and other-facility density. Component 4 included only sign density (see Supplementary Table S2 and Figure S5). The formula for calculating the principal component eigenvalues is given in Equation (9):
M i = A i X 2 + B i X 4 + C i X 6 + D i X 7 + E i X 8 + F i X 10 + G i X 14
where M i is the i-th principal component eigenvalue and X 2 , X 4 X 14 represent the values of street spatial environmental elements.
The four principal components were then entered into a multiple regression model (see Supplementary Table S3). All VIFs were 1.000 [47], indicating no multicollinearity. All four components had p-values < 0.05, indicating significant associations with the API. The final winter model is shown in Equation (10):
V = 0.425 + 0.069 M 1 + 0.057 M 2 + 0.092 M 3 + 0.040 M 4
where V denotes the street API and M 1 ,   M 2 ,   M 3 ,   M 4 , respectively, represent principal component features 1, 2, 3, and 4.
Based on this model, we established a measurement system for the winter API for streets in cold-climate cities (see Figure 12).
(2)
Summer model
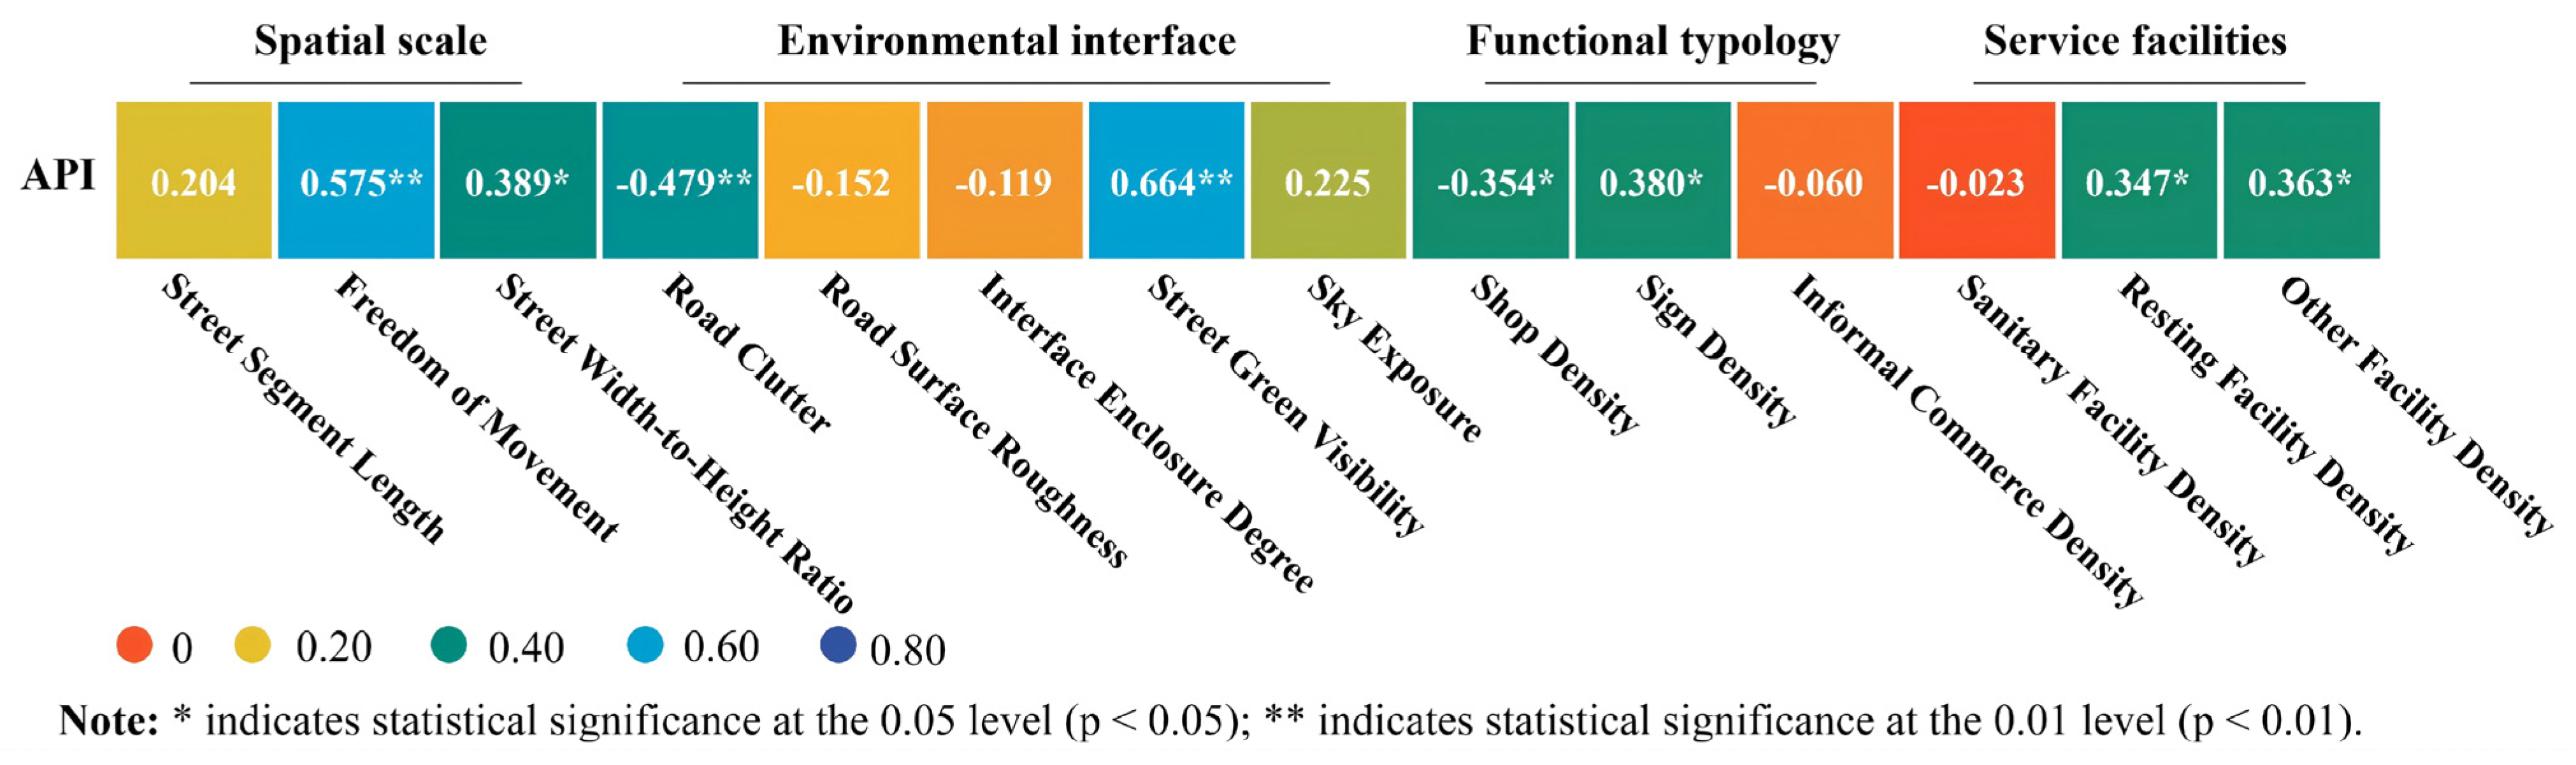
For the summer model, we first used correlation tests to screen variables. The results show that the street W/H ratio, road clutter, street green visibility, and sign density are significantly associated with the API (Figure 13). The model showed a good fit (R = 0.895; R2 = 0.802; p = 0.000 < 0.05). The Durbin–Watson statistic was 1.484, indicating no significant autocorrelation (see Supplementary Tables S4–S6).
After preliminary screening, variables without statistically significant associations (e.g., freedom of movement and shop density, p > 0.05) were removed. Four core explanatory variables were retained: the street W/H ratio, road clutter, street green visibility, and sign density. These variables were entered into a multiple regression model to derive the summer equation (Equation (11)):
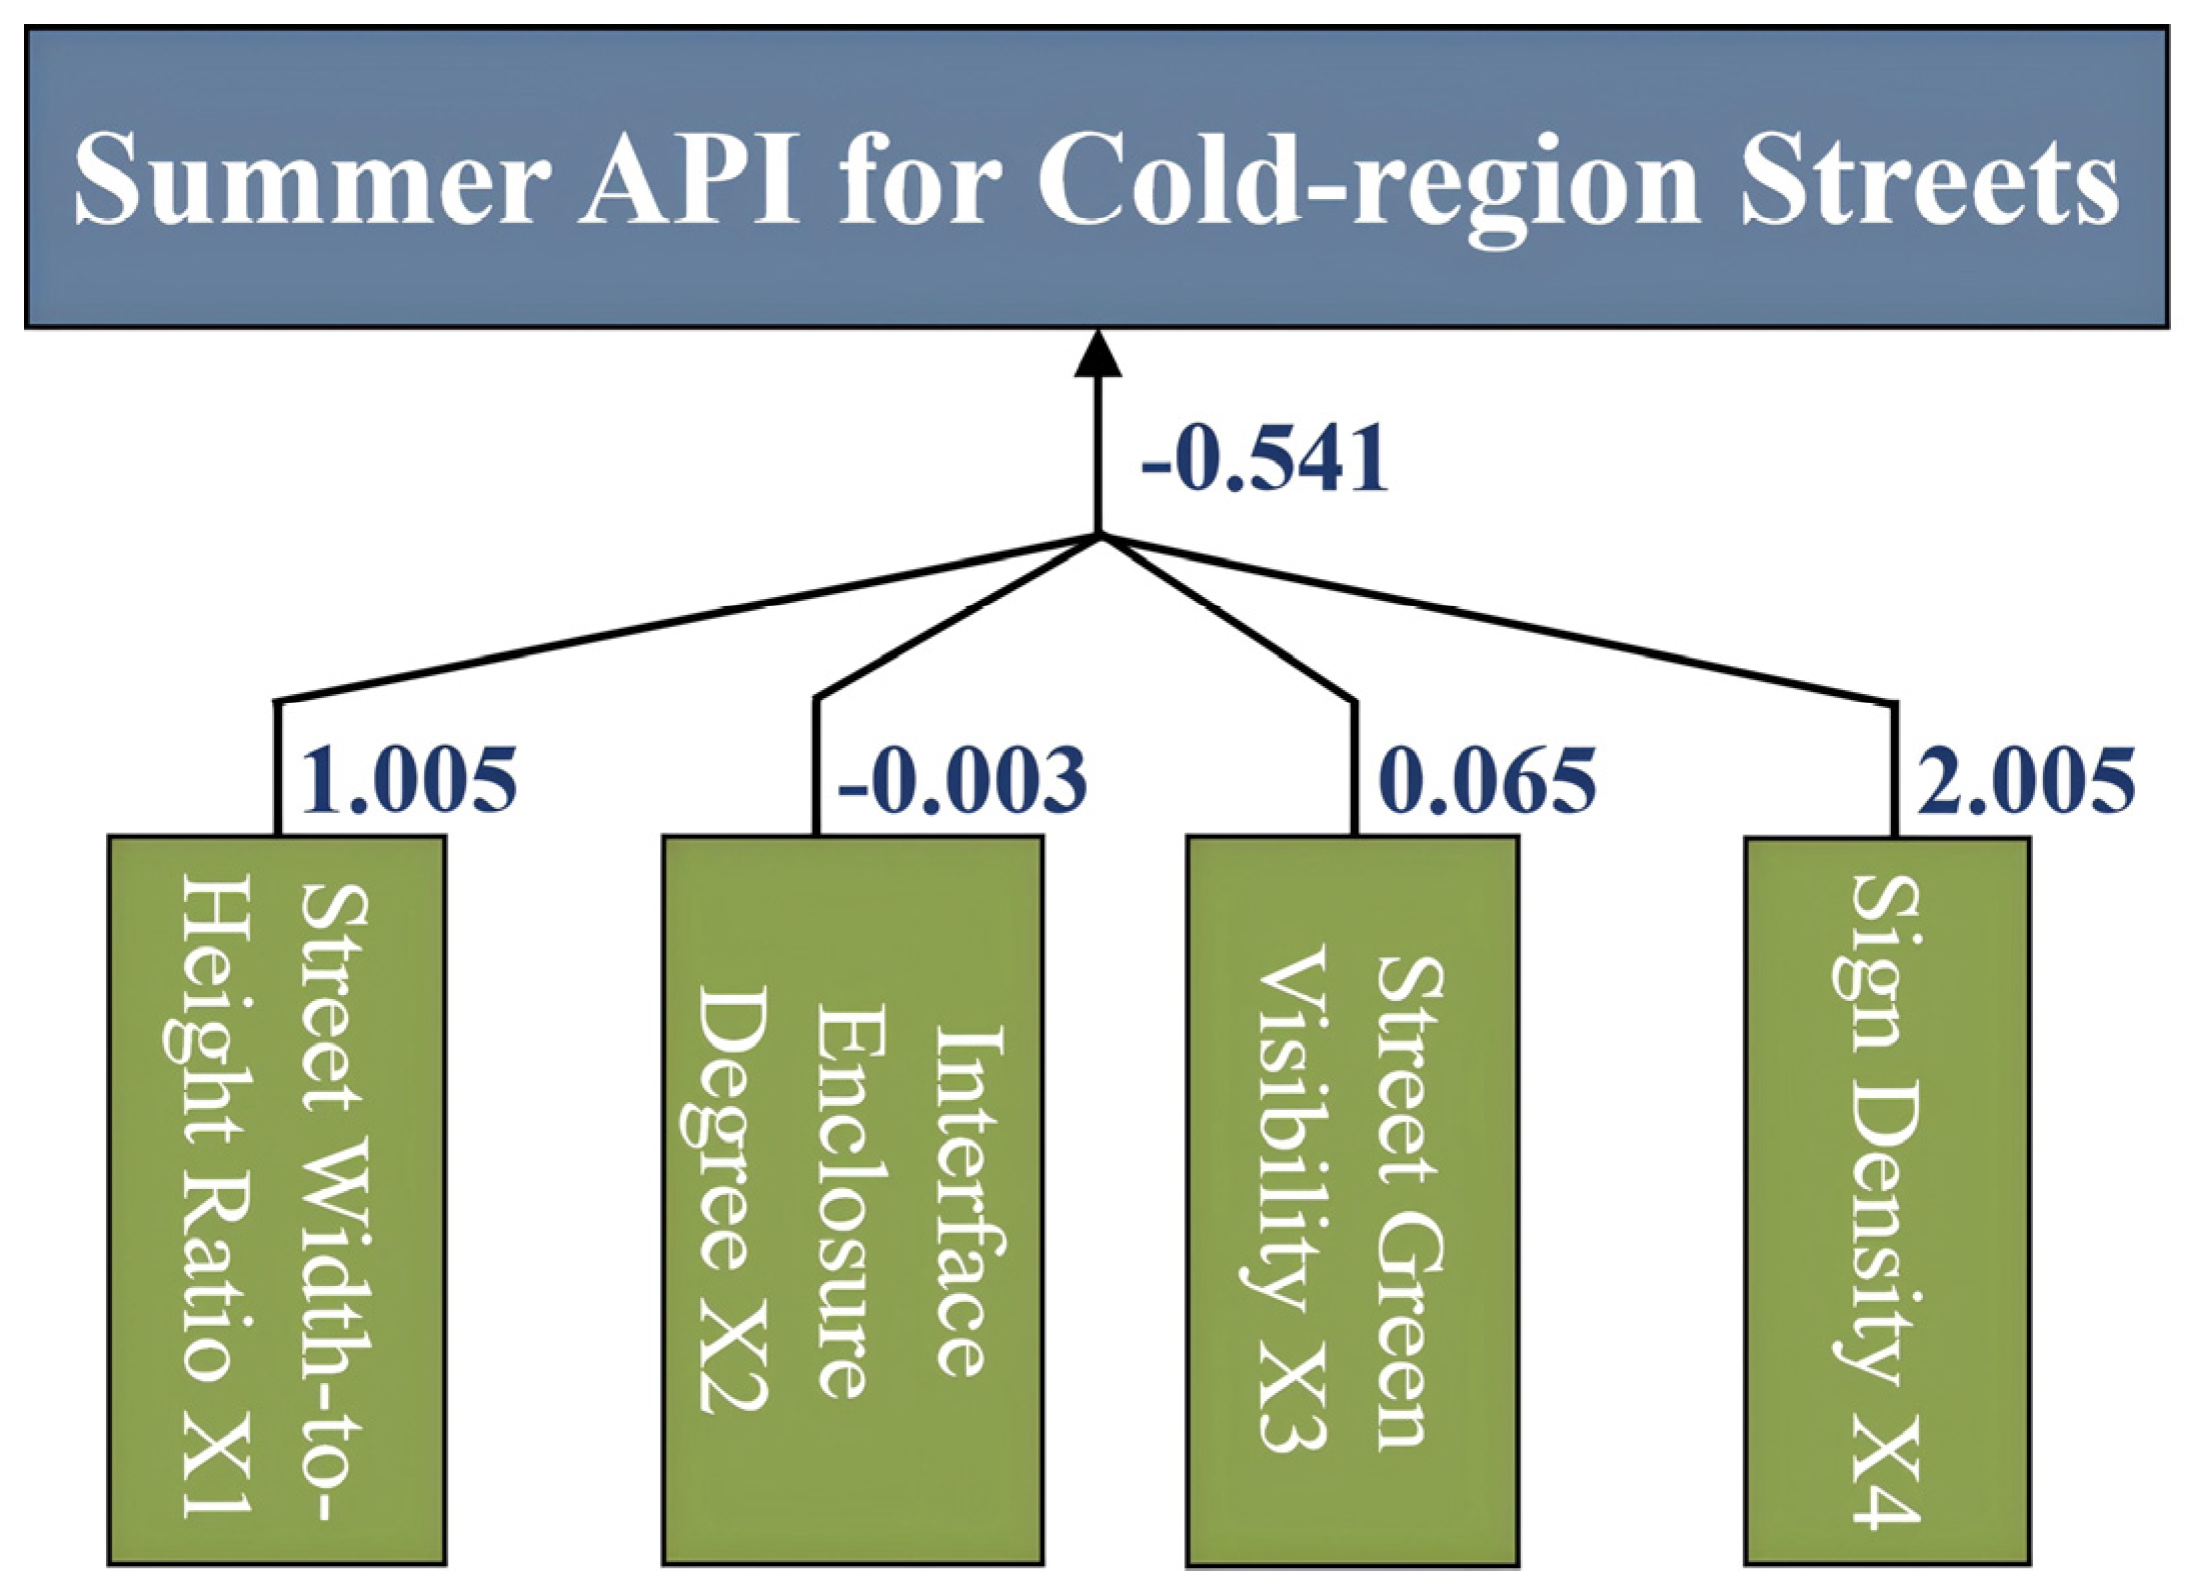
V = 0.541 + 1.005 X 1 0.003 X 2 + 0.065 X 3 + 2.005 X 4
where V denotes the street API; X 1 is the street W/H ratio; X 2 is the road confusion; X 3 is the street green visibility; and X 4 is the sign density.
A multiple regression model was used to estimate the coefficients of these four independent variables and to establish a measurement system for the summer street API in cold-climate cities (see Figure 14).

5. Discussion

5.1. Differences in Behavioural Activity Characteristics of Street Users in Winter and Summer

The intensity and duration of behavioural activities vary throughout the year. During winter, activity intensity is reduced and duration is decreased. The harsh environment of “short days, long nights, and low temperatures” causes a decrease in people’s willingness to stay outdoors, resulting in a focus on necessity activities such as fast commuting and short-term purchasing. This significantly increases the demand for street space, passage, and safety, while recreational and social activities are suppressed due to the cold. Conversely, activity intensity is higher in the summer and lasts for a longer period of time. The increased willingness to engage in a variety of activities, owing to more favourable temperatures and extended periods of sunlight, results in a higher demand for elements such as street green visibility and rest seats. Furthermore, if the street infrastructure is well-maintained, activities such as the night-time economy and cultural performances may also be facilitated, thereby extending the duration of user presence on the street.
The variation in activity types and propensity is a key consideration in understanding these dynamics. (1) Winter is characterised by necessity activities and a decline in demand activities. In order to cope with the cold and snow, people focus on basic activities such as commuting or going to and from school, and minimise open-air exposure; most of the necessity activities such as recreation and socialising move indoors (e.g., shopping malls and cafés). (2) Summer, conversely, is characterised by more diversified types of activities and a significant increase in necessity activities. Individuals are more inclined to participate in activities such as street performances, roadside cafés, night market economies, and temporary bazaars, especially during nocturnal hours, when recreational spending tends to reach a high point, thereby infusing significant vitality into urban streets.
The age structure of the population and the time of day have been identified as significant factors in this phenomenon. (1) The proportion of young and middle-aged commuters is higher in winter, and travel time is more concentrated. This is due to the colder weather and relatively dangerous road conditions, which result in children and the elderly being less willing to stay outdoors. Consequently, their travel times are more dependent on unavoidable needs (medical care, picking up and dropping off children, etc.). In contrast, young and middle-aged people are more concentrated in the street space during the morning and evening peak periods due to work and commuting needs, with the number of street users decreasing significantly in off-peak hours. (2) In summer, there is a mix of ages and more flexibility in travel times. During the summer months, the temperate climate and the wide range of activities available contribute to an increased probability of children, the elderly, and young and middle-aged adults being present in public spaces concurrently. This phenomenon is particularly evident during the cooler evening and night-time periods, when these spaces experience a notable increase in activity.
There are also differences in spatial distribution and preferences for behavioural activities. (1) In winter, the focus is more on wind-sheltered places and indoor–outdoor boundaries. Semi-indoorised boundary spaces such as store entrances, warm corridors, and enclosed bus shelters can effectively reduce the inhibition of activities caused by cold weather. (2) In summer, people tend to gather in open spaces and landscape nodes. People prefer public spaces with high green visibility, good ventilation, and facilities such as sitting seats and umbrellas, for example, corner parks and waterfront walkways. At the same time, landscape vignettes and roadside stalls can also form short-term gathering points for socialising and consuming, which can further enhance the overall vitality and attractiveness of street space.

5.2. Differences in Influenceability of Street and Activity Portraits in Winter and Summer

The relationships between street spatial environmental elements and activity portrait indicators in cold-climate streets differ between winter and summer. They show both shared patterns and clear seasonal differences. These differences are mainly driven by climate-related, demand-oriented changes in residents’ needs. Necessary travel (e.g., commuting and shopping) occurs in all seasons. Seasonal differences are mainly reflected in the scale and frequency of these activities. In contrast, demand-oriented activities (e.g., leisure and recreation, or sightseeing and tourism) depend more on street environmental quality and are less tolerant of cold and heat. As a result, seasonal advantages and disadvantages become more obvious. In winter, low temperatures, frequent wind and snow, and shorter daylight hours increase the need for safety and thermal comfort. Demand for road safety facilities, anti-slip measures, and wind-sheltering facilities becomes stronger, while activity-type propensity and age-group diversity tend to decrease. In summer, warmer conditions and longer daylight hours encourage more leisure, recreation, and social activities. In this season, street greenery/landscape, shading conditions, and resting facilities help increase behavioural activity density and activity-type propensity [48].
In terms of time of use and crowd composition, winter street activities are mostly concentrated in the daytime because of harsh weather, and children and older adults tend to stay indoors. Even on commercial or landscape streets, night-time pedestrian flow is relatively limited. In summer, more comfortable temperatures expand both activity types and crowd composition. Street functions also vary by season. Commercial streets should strengthen traffic safety and provide warm sheltered areas in winter. In summer, they can attract more visitors by using night markets and outdoor space. Landscape streets may experience a sharp decline in winter if festivals or ice-and-snow tourism programmes are absent. In summer, they attract visitors through high greenery visibility, waterfront landscapes, and cultural activities. Living streets mainly serve local residents. In winter, they focus on basic needs such as commuting. In summer, they support more diverse activities and a more varied crowd, and they more easily form settings for evening walks and social interaction.
These differences reflect changes in residents’ needs across winter and summer. In cold climates, harsh outdoor conditions often keep people indoors for longer periods. In warmer seasons, people are more likely to socialise and take part in recreational activities. When these seasonal needs meet street infrastructure that changes slowly, adaptive management and design are needed. Seasonal patterns also interact with street function. Festivals, cultural events, and seasonal economic activities (e.g., night markets and tourism) can strengthen or weaken the performance of activity portraits on different street types. Therefore, urban planning and street renewal should explicitly address seasonal differences and functional needs. This helps deliver high-quality public spaces with lasting vitality across seasons and for diverse user groups.
The core findings of this study align with and complement international research on streets in cold-climate cities. Zhao et al. (2025) noted that seasonal bias in street-view images in cold regions can affect the assessment of environmental indicators [49]. Our two measurement systems for winter and summer respond to this issue. We also extend the discussion from environmental indicators to crowd activity characteristics. Wang et al. (2025) examined seasonal thermal environments across functional zones in Harbin and found seasonal differences in the effects of 2D morphology and cultural vitality [50]. This supports our result that winter safety-oriented elements and summer leisure-oriented elements play different roles in street vitality, and it highlights seasonal adaptation in street functions in cold cities. Sun et al. (2022) emphasised the importance of the street W/H ratio and orientation for thermal comfort in Harbin [51]. Our results further suggest that these geometric elements can shape activity convenience and, in turn, relate to street vitality, which helps clarify the “morphology–comfort–vitality” pathway. Li et al. (2022) reported positive effects of street width and transparency on vitality [52]. With a cold-climate focus, our study further highlights winter-adaptive elements, including facility density and freedom of movement, which reflect the specific needs of cold-region streets.

5.3. Differences in Impact of Different Types of Street and Activity Portraits

Across street types, environmental factors such as freedom of movement, pavement condition, and public-facility density are associated with key activity portrait indicators. However, the three street types differ in functional roles, element configuration, and target user needs. Therefore, urban renewal and street quality improvement should adopt differentiated strategies. Commercial streets should strengthen commercial support and public facilities. Living streets should prioritise neighbourhood and community services. Landscape streets should enhance landscape resources and tourism-related support. The goal is to promote positive interactions between users’ behavioural activities and street spatial environmental elements [53]. Commercial streets often perform well on activity portrait indicators because of high commercial density and comprehensive public services. High shop density and sign density, together with well-planned supporting facilities, attract large numbers of users for shopping and entertainment. They can also improve suitability for different age groups. In addition, high accessibility and clear information cues can increase activity-type propensity. However, if resting seats or child-friendly facilities are insufficient, activities by children and older adults may still be limited.
Living streets are mainly designed to support daily commuting and community social interaction for nearby residents. Environmental elements such as road safety measures, walkability, small-scale commercial uses, and basic service facilities help support necessary activities and create some opportunities for demand-oriented activities. Because the main users are local residents, improving accessibility and adding public facilities for older adults and children can help attract a more diverse crowd. However, without recreational or sightseeing attractions, pedestrian activity often declines outside peak hours.
Relying on natural and cultural landscape resources, landscape streets often show stronger activity-type propensity. They attract tourists and other visitors for sightseeing, leisure, and socialising. Environmental elements such as high greenery visibility, distinctive landscape features, and adequate resting facilities can encourage people to stay longer and interact with the surroundings. However, activity levels on these streets are more sensitive to streetscape quality and to seasonal events and festivals. If supporting facilities are insufficient or landscape value is limited, activity levels can fluctuate greatly.

5.4. Seasonal Differences in the Mathematical Model “Activity Profile Index–Spatial Characteristics of Streets”

In cold-climate urban environments, the relationship between the API and street spatial characteristics shows clear seasonal differences. The winter model highlights safe access and thermal comfort. Variables such as road surface roughness, road clutter, and freedom of movement show stronger associations with the API. In contrast, the summer model places greater emphasis on recreation- and landscape-related elements.
In the winter model, the API shows stronger negative associations with road surface roughness and road clutter. This is likely because cold and snowy conditions reduce pedestrian safety and walking efficiency. In contrast, freedom of movement is positively associated with the API, as it can support higher use and better user experience. In the summer model, the street W/H ratio and street green visibility are positively associated with the API. This suggests that more open and greener streets are more attractive in warm, well-lit seasons and can support longer stays, socialising, and diverse activities. In addition, summer night-time economies and recreational programmes can strengthen the associations of sign density and service facility density with behavioural activity density and activity-type propensity.
Therefore, seasonal calibration of the model linking the API with street spatial characteristics is needed to describe how street environmental elements relate to users’ activities more accurately. This can support street planning and renewal that better fits seasonal needs, and can help improve street space quality and overall urban vitality.

6. Conclusions

(1)
The API can assess the spatial quality of urban streets in cold-climate cities.
Based on field surveys, data collection, and analysis, street segments with higher APIs generally show better spatial quality and physical conditions. They attract more users and support a wider range of activities. For the same street, the API differs between winter and summer because of climate conditions. However, the overall structure of users’ behavioural activities remains broadly consistent across seasons.
(2)
A refined “Activity Portrait–Spatial Characteristics” framework helps explain interactions between users and the street environment.
This framework describes user–environment relationships at three levels. First, human behaviour is shaped by the environment and can also reshape it, forming a two-way interaction. Second, previous studies often lack clear evidence for the causal links between spatial environments and behaviour (i.e., environments may promote or inhibit behaviour, while users may choose or avoid certain spaces). Third, this study clarifies the meaning of the “Activity Portrait–Street Space” interaction by focusing on (1) how behavioural activities select and modify space, and (2) how space constrains behaviour and provides carrying capacity.
(3)
Associations between activity portraits and street environmental elements differ between winter and summer.
Correlations between activity portrait indicators and street spatial environmental elements vary across seasons in cold-climate streets. Overall, environmental factors show strong associations with activity-type propensity and behavioural activity density in both winter and summer. In particular, freedom of movement and street green visibility are consistently associated with multiple activity portrait indicators, and these relationships are especially clear on commercial streets. Seasonal differences also appear in the API model structure. In winter, the API is significantly associated with seven environmental elements: freedom of movement, road surface roughness, road clutter, street green visibility, sky openness, sign density, and other-facility density. Among these, road clutter and road surface roughness show negative associations. In summer, the API is significantly associated with four elements: the street W/H ratio, road clutter, street green visibility, and sign density. Together, these results support separate winter and summer API measurement systems for cold-region streets. The main driver is climate-led, demand-oriented behaviour. In winter, low temperatures and wind–snow events increase needs for safety and thermal comfort, so a wider set of environmental elements shapes street activities (e.g., anti-slip and wind-sheltering measures). In summer, more comfortable conditions shift demand toward leisure and experience, so key adaptive elements become more important while other elements play a smaller role.
(4)
Relationships between street types and users’ behavioural activities differ.
On commercial streets, environmental indicators show the broadest and strongest associations with activity portrait indicators, and these associations persist across more time periods. On living streets, environmental indicators are more closely associated with behavioural activity density and activity-type propensity, whereas on landscape streets, they are most strongly associated with activity-type propensity, with stronger correlations in the morning and evening. This pattern may relate to the popularity of Harbin’s ice-and-snow tourism. In summer, correlations between commercial streets and behavioural activity density are strongest in the afternoon, whereas landscape streets show stronger correlations in the morning. Living streets show stronger associations with age-group diversity, which may reflect local residents’ daily life and work routines.
In this study, we used an activity–characteristics perspective that combines qualitative and quantitative dimensions and developed a refined framework linking activity characteristics with spatial characteristics. Based on the activity–characteristics framework, we established two street space measurement systems for cold regions, representing winter and non-winter conditions. These results support a deeper understanding of how street spatial environments relate to crowd behavioural activities in cold-climate settings. By analysing users’ activity characteristics, we identified key elements that shape street spatial quality, and using multi-source data techniques, we assessed street space activity and characteristics at scale. Based on these findings, we propose spatial optimisation strategies for different street types, which can guide human-oriented street renewal and retrofitting in cold-climate cities.
Several limitations should be noted. (1) To reduce error in behavioural data collection, observations were conducted in the morning, afternoon, and evening on both weekdays and weekends. However, limited staffing and resources prevented full-day coverage of all target streets, so some measurement error may remain. (2) Some street environmental indicators may be affected by data sources. The POI dataset used was from 2022. After the COVID-19 pandemic, some streets were updated, which may have created mismatches between the dataset and on-site conditions. As a result, some indicators (including sign density) may not fully match current conditions. (3) The case area included streets in four administrative districts of Harbin. The sample size is limited, and future studies should expand the sample to improve generalisability. (4) Causal interpretations were discussed based on correlation analysis. Correlation describes the strength and direction of associations, but it cannot establish causality or reveal mechanisms over time. Unobserved confounders may also bias results, and outliers may influence correlation estimates. In addition, variables may have indirect or bidirectional relationships. Future work should strengthen causal evidence by using additional empirical approaches.

Supplementary Materials

The following supporting information can be downloaded at: https://www.mdpi.com/article/10.3390/land15020295/s1, Figure S1. Pie chart of different types of street segments; Figure S2. Visualization of Pearson correlation between spatial environment elements and activity portraits of commercial-type streets for each indicator; Figure S3. Visualization of Pearson correlation between spatial environment elements of living streets and activity portraits for each indicator; Figure S4. Visualization of Pearson correlation between spatial environmental elements and activity portraits of landscape-type streets for each indicator; Figure S5. Visualisation of the Pearson correlation, Winter; Table S1. Activity portrait index(API) by Street Segment, Winter and Summer; Table S2. Factor analysis details for each feature weighting, Winter; Table S3. Table of coefficients of the regression model for the independent variables and the activity portrait index(API), Winter; Table S4. Summary of regression models and ANOVA results for principal component characteristics and activity portrait indices of street spatial environment elements, Summer; Table S5. Summary of regression models and ANOVA results for principal component characteristics and activity portrait indices of street spatial environment elements, Summer; Table S6. Table of coefficients of the regression model for the independent variables and the activity portrait index(API), Summer.

Author Contributions

Conceptualisation, Y.Y. and Y.H.; methodology, Y.Y. and Y.H.; validation, S.Y., T.L. and W.L.; formal analysis, Y.H. and X.T.; investigation, H.Y.; data curation, Y.H.; writing—original draft preparation, Y.H.; writing—review and editing, S.Y.; visualisation, Y.H. and S.Y.; supervision, Y.Y.; project administration, Y.Y.; funding acquisition, Y.Y. All authors have read and agreed to the published version of the manuscript.

Funding

This research was funded by the National Key Research and Development Project of China, grant number No. 2024YFC3807900, and Natural Science Foundation of Heilongjiang Province of China, grant number YQ2024E027.

Data Availability Statement

The data generated during the study are directly available within this article.

Conflicts of Interest

The authors declare no conflicts of interest.

References

  1. Jiang, J.; Cao, G. Multidimensional analysis of modern urban street space functions. In Public Transit Priority and Congestion Mitigation Strategies, Proceedings of the 2012 Annual Conference and 26th Academic Symposium of China Urban Transport Planning, Fuzhou, China, 7–9 November 2012; Jiangsu Institute of Urban Planning and Design: Nanjing, China, 2012. [Google Scholar]
  2. Zhao, B. Brief probe of humanized streets design. Shanghai Urban Plan. Rev. 2016, 2016, 59–63. [Google Scholar]
  3. Mei, H.Y.; Dai, Y. Climate-responsive green design for cold-region urban streets. Archit. J. 2012, 12, 104–107. [Google Scholar]
  4. Paquet, C.; Orschulok, T.P.; Coffee, N.T.; Howard, N.J.; Hugo, G.; Taylor, A.W.; Adams, R.J.; Daniel, M. Are accessibility and characteristics of public open spaces associated with a better cardiometabolic health? Landsc. Urban Plan. 2013, 118, 70–78. [Google Scholar] [CrossRef] [Scilit]
  5. Uzgoeren, G.; Erdoenmez, E. A comparative study on the relationship between quality of space and urban space activities in the public open spaces. MEGARON/Yıldız Tech. Univ. Fac. Archit. E-J. 2016, 11, 373–386. [Google Scholar] [CrossRef] [Scilit]
  6. Xuan, W.; Peng, K.; Zang, C. The correlation between street space and behaviours in the new data environment. South Archit. 2023, 2023, 49–60. [Google Scholar]
  7. Huang, J.; Hu, G. Comparison and thinking of the walkability measure methods on urban built environment. J. Hum. Settl. West China 2016, 31, 67–74. [Google Scholar]
  8. Southworth, M.; Ben-Joseph, E. Streets and the Shaping of Towns and Cities; China Architecture & Building Press: Beijing, China, 2006. [Google Scholar]
  9. Zarin, S.Z.; Niroomand, M.; Heidari, A.A. Physical and social aspects of vitality case study: Traditional street and modern street in Tehran. Procedia-Soc. Behav. Sci. 2015, 170, 659–668. [Google Scholar] [CrossRef] [Scilit]
  10. Jacobs, A.B. Great Streets; China Architecture & Building Press: Beijing, China, 2009. [Google Scholar]
  11. Long, Y.; Tang, J. Large-scale quantitative measurement of the quality of urban street space: The research progress. City Plan. Rev. 2019, 43, 107–114. [Google Scholar]
  12. Barker, R.G.; Getzels, J.W. Ecological Psychology: Concepts and Methods for Studying the Environment of Human Behavior; Stanford University Press: Redwood City, CA, USA, 1968; p. 14. [Google Scholar]
  13. Gibson, J.J. The ecological approach to visual perception. Ecol. Psychol. 1982, 42, 98–99. [Google Scholar]
  14. Samvati, S.; Nikookhooy, M.; Saiedizadi, M. The role of vitality and viability of urban streets in enhancement the quality of pedestrian-oriented urban venues (Case study: Buali Sina Street, Hamedan, Iran). J. Urban Plan. Dev. 2013, 139, 325–333. [Google Scholar]
  15. Ashihara, Y. The Aesthetics of the Street; Baihua Literature and Art Publishing House: Tianjin, China, 2006. [Google Scholar]
  16. Wicker, A.W. An Introduction to Ecological Psychology; Cambridge University Press: Cambridge, UK, 1984. [Google Scholar]
  17. Gehl, J. Life Between Buildings: Using Public Space; Van Nostrand Reinhold: New York, NY, USA, 1987. [Google Scholar]
  18. Aziz, A.A.; Ahmad, A.S.; Nordin, T.E. Vitality of flats outdoor space. Procedia-Soc. Behav. Sci. 2012, 36, 402–413. [Google Scholar] [CrossRef] [Scilit]
  19. Curl, A.; Ward Thompson, C.; Aspinall, P. The effectiveness of ‘shared space’ residential street interventions on self-reported activity levels and quality of life for older people. Landsc. Urban Plan. 2015, 139, 117–125. [Google Scholar] [CrossRef] [Scilit]
  20. Whyte, W.H. The Social Life of Small Urban Spaces; Conservation Foundation: New York, NY, USA, 1980. [Google Scholar]
  21. Architects, G. Towards a Fine City for People: Public Spaces and Public Life—London 2004; Transport for London: London, UK, 2004.
  22. Burton, E.; Mitchell, L.; Fei, T. Inclusive Urban Design; China Architecture & Building Press: Beijing, China, 2009. [Google Scholar]
  23. Biddulph, M. Radical streets? The impact of innovative street designs on liveability and activity in residential areas. Urban Des. Int. 2012, 17, 178–205. [Google Scholar] [CrossRef] [Scilit]
  24. Ewing, R.; Clemente, O. Measuring Urban Design: Metrics for Livable Places; Island Press: Washington, DC, USA, 2015; Volume 20, pp. 1–2. [Google Scholar]
  25. Harvey, C.W. Measuring Streetscape Design for Livability Using Spatial Data and Methods. Master’s Thesis, University of Vermont, Burlington, NJ, USA, 2014. [Google Scholar]
  26. Sarkar, C.; Webster, C.; Pryor, M.; Gallacher, J. Exploring associations between urban green, street design and walking: Results from the Greater London boroughs. Landsc. Urban Plan. 2015, 143, 112–125. [Google Scholar] [CrossRef] [Scilit]
  27. Long, Y.; Gao, B. Street space challenges and opportunities in “Internet+” age. Planners 2016, 32, 8. [Google Scholar]
  28. Hao, X.; Long, Y.; Shi, M.; Wang, P. Street vibrancy of Beijing: Measurement, impact factors and design implication. Shanghai Urban Plan. Rev. 2016, 2016, 37–45. [Google Scholar]
  29. Zhang, L.Y.; Pei, T.; Chen, Y.J.; Song, C.; Liu, X.Q. A review of urban environmental assessment based on street view images. J. Geo-Inf. Sci. 2019, 21, 46–58. [Google Scholar]
  30. Wang, Q. Research on the Vitality Creation of Typical Street Marginal Space Based on Interaction Theory. Ph.D. Thesis, Harbin Institute of Technology, Harbin, China, 2019. [Google Scholar]
  31. Ma, S.H.; Han, Y.H.; Yao, Z.G. Students’ travel mode choice based on parent’s travel mode. J. Transp. Syst. Eng. Inf. Technol. 2016, 16, 225–231. [Google Scholar]
  32. Yang, L.C.; Cui, X.; Yu, B.J.; Wei, Z.C.; Gao, Y.B. The effect of walking and wait time on the transit travel of residents in affordable housing. Planners 2020, 36, 50–57. [Google Scholar]
  33. Cao, J.Z. Big data-driven research on the interaction of human mobility pattern and urban spatial structure. Acta Geod. Cartogr. Sin. 2021, 50, 849. [Google Scholar]
  34. Mehta, V. Streets: A Model of Social Public Space; Electronic Industry Press: Beijing, China, 2016. [Google Scholar]
  35. Yao, G. Evaluation method of current capacity of urban bus stops based on POI data and ArcGIS spatial analysis technology: A case study of central urban area of Luoyang. Beauty Times 2018, 2018, 2. [Google Scholar]
  36. Yu, Y.; Meng, F.Y.; Guo, Q. Towards whitescape: A Study on Residents’ Winter Environmental Characteristics Preferences of Outdoor Activities in Waterfront Spaces of Small and Medium-sized Rivers in Cold Regions. Chin. Landsc. Archit. 2024, 40, 64–70. [Google Scholar]
  37. Xi, T.X.; Kuang, X.M.; Zhu, Y.Y.; Fu, X. An Exploration of the Street Renewal Design Based on Human Perception: A Case Study of the Beautiful District Renovation Program in Pengpu Town, Jing’an District, Shanghai. Urban Plan. Forum 2019, S1, 168–176. [Google Scholar]
  38. Huang, D.; Dai, D. Effect of living street’s elements on vitality: Taking typical streets in Shenzhen as an example. Chin. Landsc. Archit. 2019, 35, 89–94. [Google Scholar]
  39. Guo, R.; Wang, H.C. Influence of Landscape Composition Characteristics on Walking Activities in Life Service Streets and Its Optimization: A Case Study of Streets in Downtown Tianjin. Landsc. Archit. 2020, 27, 99–105. [Google Scholar]
  40. Lu, W.; Wang, S.Y.; Gu, Z.C. Research on Living Street in Residential Areas Based on Demand and Behavior. New Archit. 2019, 4, 18–22. [Google Scholar]
  41. Guo, R.; Yu, Z.L. Research on the Impact of Urban Street Environment on Pedestrians’ Walking Behavior: A Case Study of Harbin. In Proceedings of the 2020 Annual Conference of China Urban Planning Association (07 Urban Design): Spatial Governance for High-Quality Development; China Urban Planning Association: Harbin, China, 2021; pp. 645–662. [Google Scholar]
  42. Zhu, X.; Zhang, R.; Zhao, X.L. Blue Space Characteristics Recognition Affecting Public Emotional Preferences: A Case Study of the Songhua River Basin. Chin. Landsc. Archit. 2021, 37, 50–55. [Google Scholar]
  43. He, N.; Xu, L.Q.; Wu, X.A.; Li, N. Theoretical Model of Healing Environments in Communities: A Review of Healing Mechanisms, Types of Settings, and Environmental Characteristics. J. Hum. Settl. West China 2025, 40, 66–75. [Google Scholar]
  44. Yan, T.; Jin, J.X.; Zhu, Q.S.; Liu, Y. A dataset of land cover and Shannon’s diversity index based on plant functional types in China and its adjacent areas (1992–2018). China Sci. Data 2022, 2022, 7. [Google Scholar]
  45. Wang, R.T.; Shen, Y.; Cao, J.R.; Lin, M.W.; Wu, G.J. Comprehensive evaluation of phased carbon emissions in residential buildings based on AHP and multiple regression. Energy Conserv. 2024, 43, 91–93. [Google Scholar]
  46. Miao, Y.K.; Hu, L.L.; Yuan, P.G.; Wang, Y.; Huang, H.Y. The integrated application of principal component analysis and correlation analysis in data mining of heat pump system operation. Vac. Cryog. 2025, 31, 587–595. [Google Scholar]
  47. Lei, K.; Zhao, L.; Zhang, X.R. Research on value perception of Qingdao historical streets based on multiple regression model: A case of Tapautau cultural leisure block. Urban. Archit. 2025, 22, 58–61. [Google Scholar]
  48. Miao, J.L.; Wang, C.; Yang, M.H. Winter and summer microclimate field measurements of urban street tree canopy spaces in Shihezi City. Anhui Agric. Sci. Bull. 2019, 25, 109–113+119. [Google Scholar]
  49. Zhao, T.; Liang, X.; Biljecki, F.; Tu, W.; Cao, J.; Li, X.; Yi, S. Quantifying seasonal bias in street view imagery for urban form assessment: A global analysis of 40 cities. Comput. Environ. Urban Syst. 2025, 120, 102302. [Google Scholar] [CrossRef] [Scilit]
  50. Wang, L.; Li, R.; Jia, J.; Zhai, Y.; Tian, Y.; Xu, D.; Chen, Y.; Zhang, X.; Ren, Z.; Ye, Z.; et al. Integrating morphology and vitality to quantify seasonal contributions of urban functional zones to thermal environment. Sustain. Cities Soc. 2025, 120, 106136. [Google Scholar] [CrossRef] [Scilit]
  51. Sun, C.; Lian, W.; Liu, L.; Dong, Q.; Han, Y. The impact of street geometry on outdoor thermal comfort within three different urban forms in severe cold region of China. Build. Environ. 2022, 222, 109342. [Google Scholar] [CrossRef] [Scilit]
  52. Li, Y.; Yabuki, N.; Fukuda, T. Exploring the association between street built environment and street vitality using deep learning methods. Sustain. Cities Soc. 2022, 79, 103656. [Google Scholar] [CrossRef] [Scilit]
  53. Li, S.C.; Zhang, J.S. Exploration on the differences in quality evaluation and vitality driving factors of various types of streets. Urban. Archit. 2024, 21, 71–76. [Google Scholar]
Figure 1. Relationship between behavioural activity and spatial quality, and classification of types.
Land 15 00295 g001
Figure 2. Schematic diagram of user activity portrait.
Land 15 00295 g002
Figure 3. Research hierarchy framework.
Land 15 00295 g003
Figure 4. Technical lines of research.
Land 15 00295 g004
Figure 5. Schematic diagram of street research sample selection steps.
Land 15 00295 g005
Figure 6. Sample distribution of POI density and streets in Harbin.
Land 15 00295 g006aLand 15 00295 g006b
Figure 7. Indicators for measuring spatial environmental elements in cold streets.
Land 15 00295 g007
Figure 8. Data visualisation of spatial environmental elements in winter streets.
Land 15 00295 g008
Figure 9. Winter–summer comparative bar charts of street- space activity characteristics.
Land 15 00295 g009aLand 15 00295 g009b
Figure 10. Visualisation of Pearson correlation between street spatial environmental elements and activity portraits for each indicator.
Land 15 00295 g010
Figure 11. Visualisation of the Pearson correlation.
Land 15 00295 g011
Figure 12. Measurement system of winter API for cold city streets.
Land 15 00295 g012
Figure 13. Visualisation of Pearson correlation between street spatial environmental elements and API.
Land 15 00295 g013
Figure 14. Measurement system of summer API for cold city streets.
Land 15 00295 g014
Table 1. Factors influencing behavioural activities on the street.
YearAuthorTitleFactors Affecting Behavioural Activities
1968Gibson, J.J. [13]The ecological approach to visual perceptionBehavioural place theory: environmental quality is positively related to behavioural activities
1979Ashihara, Y. [15] The Aesthetics of StreetsPhysical components of streets
1984Wicker, A. [16]An introduction to ecological psychology“Matching staff” at event venues
1987Gehl, J. [17]Life Between Buildings: Using Public SpaceQuality of the urban spatial environment
2012Aziz, A. [18]Vitality of Flats Outdoor SpaceLow-cost use of outdoor space
2013Samavati, S. [14]The role of vitality and viability of urban streets in enhancing the quality of pedestrian-oriented urban venuesFactors such as safety and diversity of user profiles
2015Curl, A. [19]The effectiveness of ‘shared space’ residential street interventions on self-reported activity levels and quality of lifeForms of transportation and shared spaces
Table 2. Foreign methods for measuring and evaluating the spatial environment of streets.
YearAuthorTitleStreet Space Environment Measurement Methodology
1980Whyte, W. [20]The social life of small urban spacesBehavioural observation method; crowd behaviour
2004Gehl Architects [21]Towards a Fine City for People: Public Spaces and Public Life—London 2004PSPL research method: quality of façade along the street, pedestrian flow, and dwell time
2006Burton, E. [22]Inclusive urban designQuestionnaire + interview: perception evaluation
2012Biddulph, M. [23]Radical streets? The impact of innovative street designs on liveability and activity in residential areasAll-weather time-lapse photography: types and durations of social activity
2013Ewing, R. [24]Measuring urban design: Metrics for liveable placesStreet image shooting + expert observation scoring: evaluation of street quality products
2014Harvey, C.W. [25]Measuring streetscape design for liveability using spatial data and methodsGIS identification of 3D street scene + regression modelling: impact of buildings and trees on street environment
2015Sarkar, C. [26]Exploring associations between urban green, street design and walking: results from the Greater London boroughsNormalised Vegetation Index (NDVI) + interview: effect of green density and street trees on walking distance
Table 3. Street space user behavioural activity research record sheet.
Day of Observation RecordTuesday, ThursdaySaturday, Sunday
Observation Recording PeriodMorningAfternoonEvening
Season/Month
(4, 5, 6, 9, 10)
8:00–10:0012:00–14:0016:00–18:00
Cold season/Month
(1, 2, 3, 11, 12)
8:00–10:0012:00–14:0016:00–18:00
Observation Record ContentNumber of subjects of behavioural activities, age structure, types of behavioural activities, and spatial location distribution
Table 4. Classification of Street Spatial Environmental Elements.
ScholarClassification of Street Spatial Environmental Elements
Yu, Y. [36]Transportation, Building Interface, Space, Greenery, Facilities
Xi, T.X. [37]Façade, Facilities, Greenery, Ground Surface, Lighting
Huang, D. [38]Street Space, Street Facilities, Street Greenery, Frontage Functions
Guo, R. [39]Streetscape Spatial Form, Streetscape Spatial Function, Streetscape Elements
Wang, S.Y. [40]Natural Environment, Spatial Pattern, Service Facilities, Cultural Environment
Yu, Z.L. [41]Pedestrian Activity Space, Street Facilities, Street Frontage Interface
Zhao, X.L. [42]Spatial Form, Spatial Organisation, Functional Facilities
Xu, L.Q. [43]Spatial Scale, Street Building Interface, Street Furniture
Table 5. Indicator weights for the API of street space users.
Indicator FactorsCoefficient of VariationCoefficient of Variation Weighting
WinterSummerWinterSummer
Behavioural activity density0.7112382640.7325930240.4470.445
Activity-type propensity0.441141030.3141575960.2770.191
Age-group diversity0.438317550.5996412020.2760.364
Disclaimer/Publisher’s Note: The statements, opinions and data contained in all publications are solely those of the individual author(s) and contributor(s) and not of MDPI and/or the editor(s). MDPI and/or the editor(s) disclaim responsibility for any injury to people or property resulting from any ideas, methods, instructions or products referred to in the content.