1. Introduction
Soil erosion is a major global environmental challenge, impacting agricultural productivity, water quality, infrastructure, and reservoir siltation. Approximately 30% of arable land worldwide has become unproductive [
1] due to the loss of essential nutrients such as nitrogen, phosphorus, and potassium, which reduces soil fertility and crop yields [
2,
3]. Soil erosion also degrades the physical, chemical, and biological properties of soils and accelerates sedimentation in reservoirs, decreasing their capacity and water quality [
4].
Human activities, including deforestation, inappropriate agricultural practices, and population pressure, exacerbate soil loss by increasing runoff [
5,
6]. In Mediterranean and semi-arid regions, soil erosion is particularly sensitive to the irregularity and intensity of rainfall, where short but intense storms account for the majority of sediment transport [
7,
8,
9]. Soil loss rates vary globally, ranging from 10 to 20 t·ha
−1·yr
−1 in Europe and from 19 to 39 t·ha
−1·yr
−1 in Asia, Africa and South America, depending on slope, soil cover and rainfall intensity [
10,
11]. In Algeria, water erosion threatens around 20 million hectares of agricultural land and causes reservoir siltation rates exceeding 15%, particularly in the northern mountainous regions [
12,
13,
14,
15].
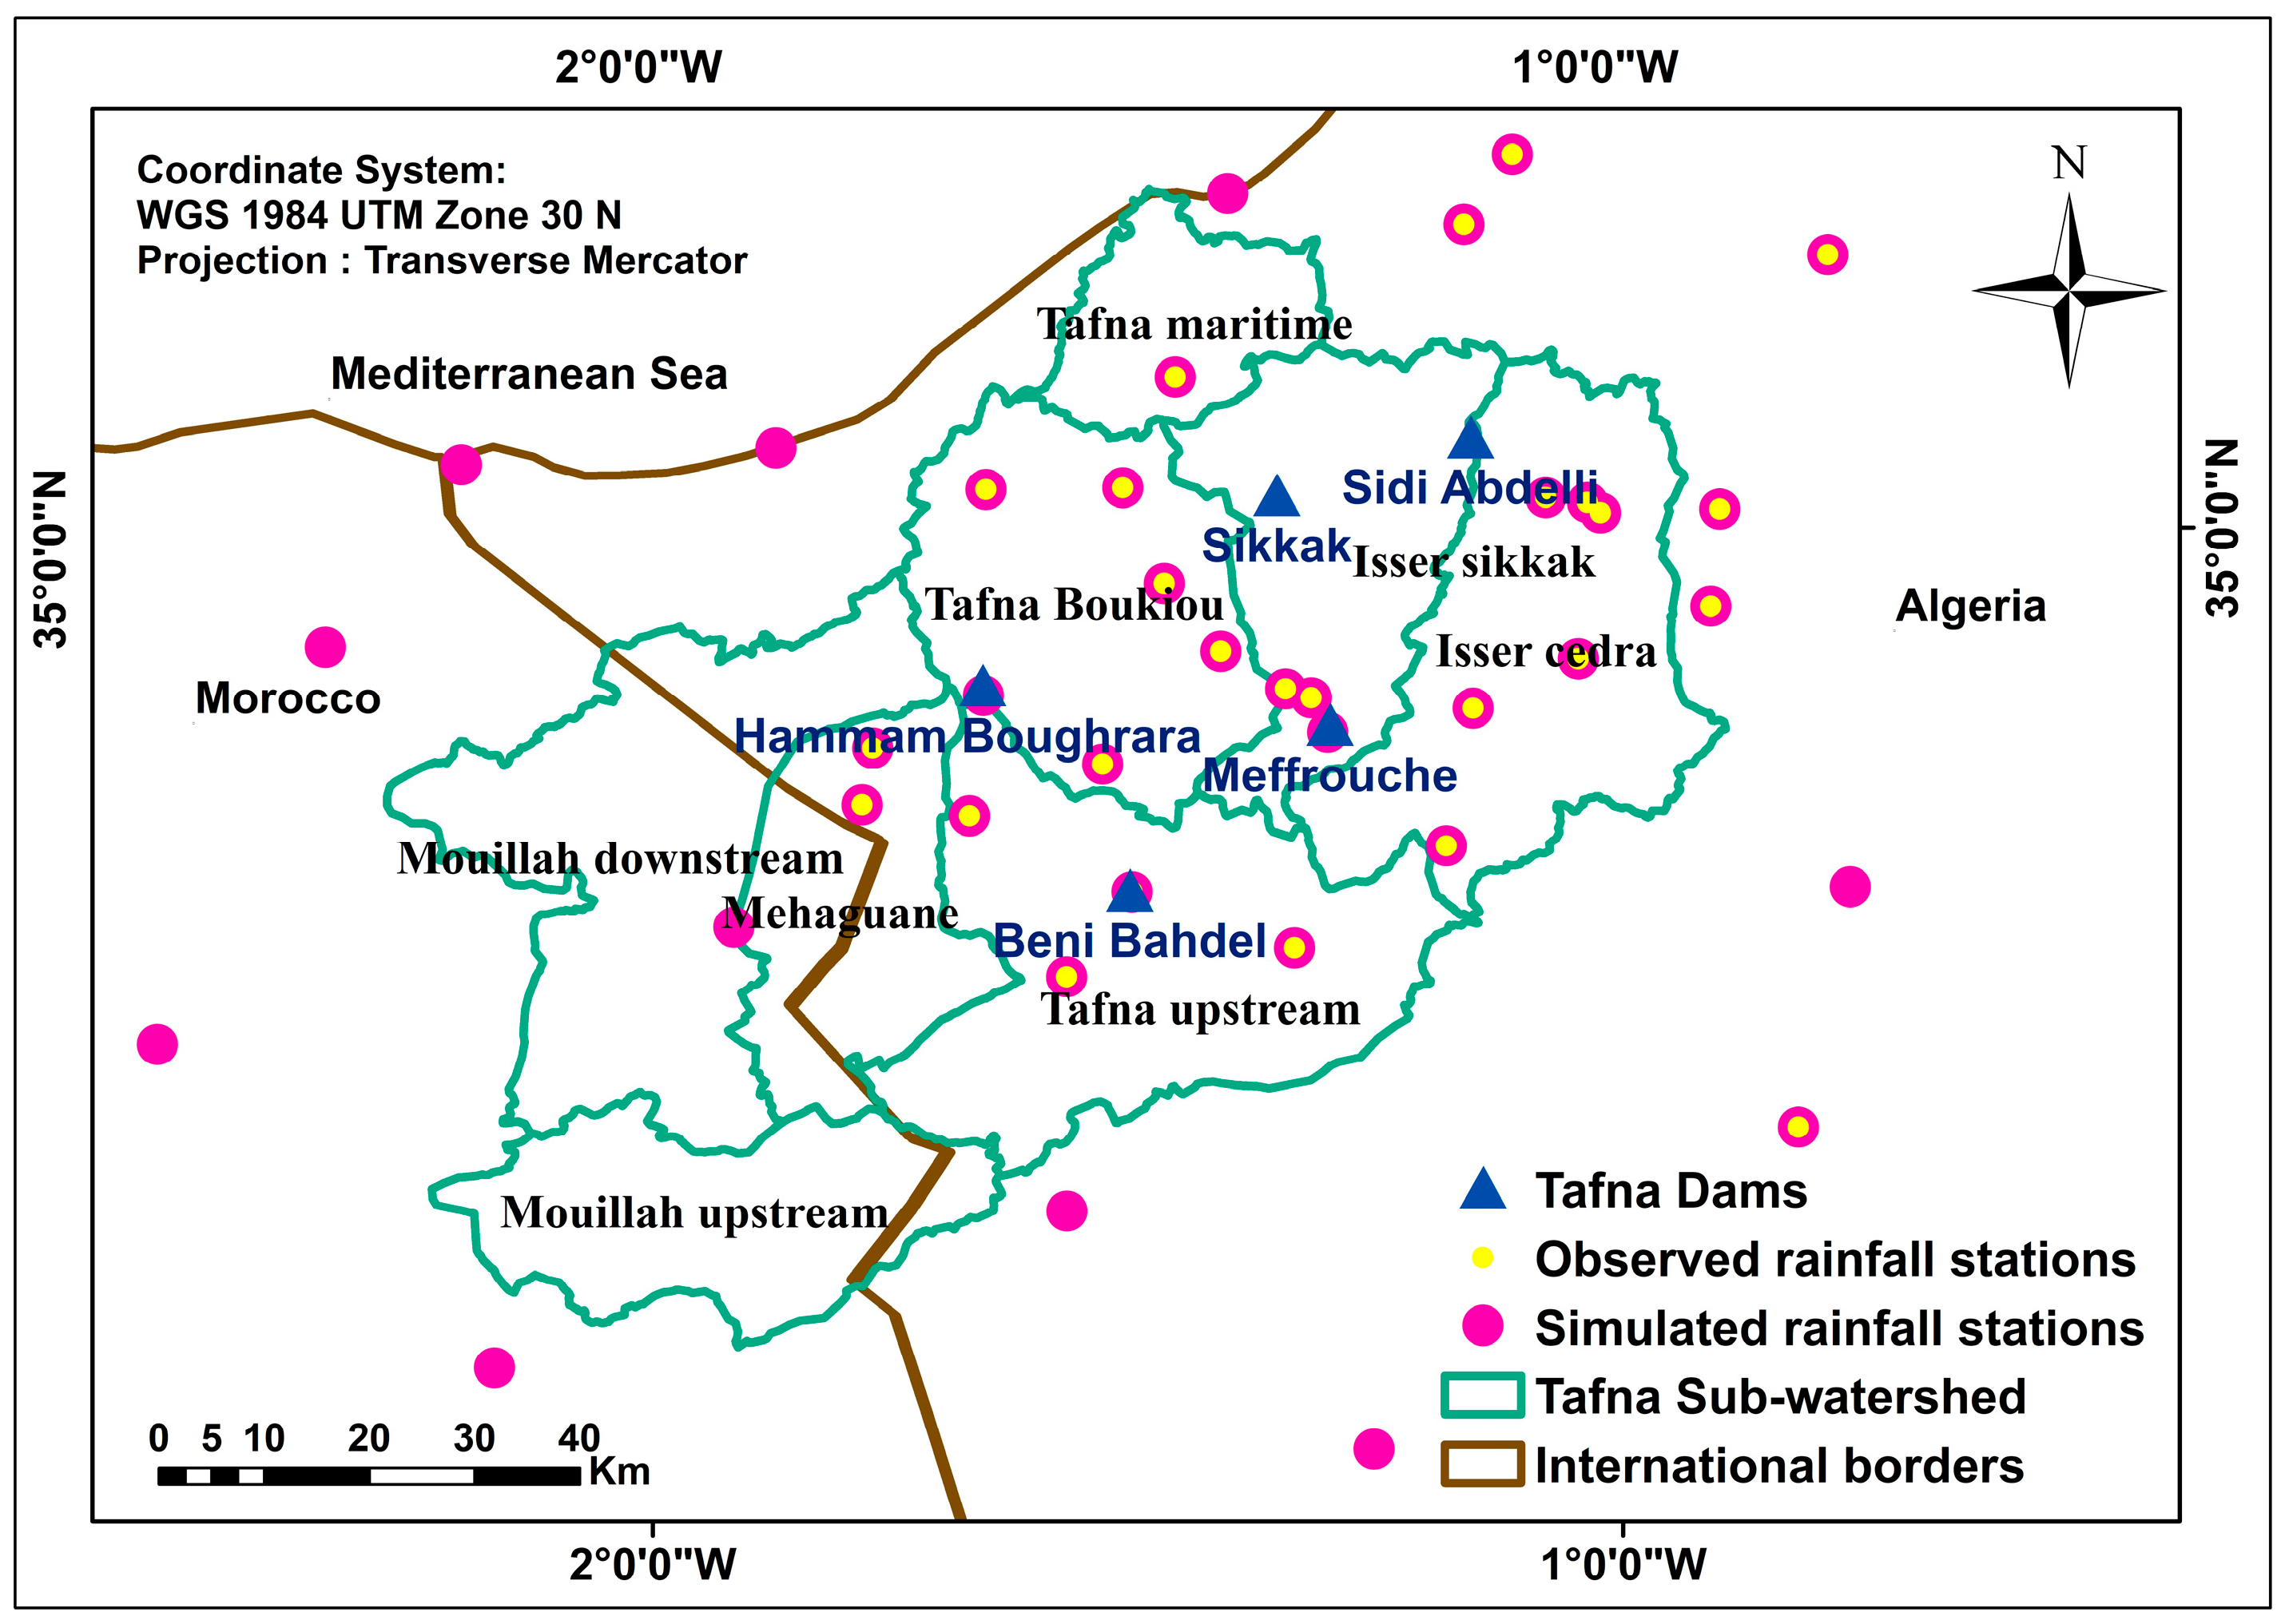
The Tafna watershed, spanning over 7200 km
2 in northwestern Algeria, represents a complex and highly vulnerable hydro-system. However, evaluating erosion in such a vast territory faces a major scientific hurdle: the severe limitation of high-resolution rainfall data and gauging infrastructure. This “data-scarcity” challenge makes it difficult to apply complex physical models, necessitating a robust methodological framework capable of integrating multi-source spatial data to capture the interplay of irregular intense rainfall, rugged topography, and fragile soils. In these semi-arid basins, frequent low-intensity rain contributes little to erosion, whereas rare intense storms are responsible for most soil loss [
16,
17], yet the spatial heterogeneity of this impact over large areas remains poorly understood.
To address this scientific gap, the use of empirical models like the Revised Universal Soil Loss Equation (RUSLE) is not merely a regional application but a strategic approach to quantify erosion dynamics in environments with limited instrumentation [
18,
19]. The RUSLE model, through its integration with Geographic Information Systems (GIS), offers the flexibility required to harmonize heterogeneous datasets and provide a spatiotemporal assessment that physical models cannot achieve in data-poor contexts [
20,
21,
22]. By linking rainfall factors, topography, and land management practices, this approach enables the identification of critical erosion hotspots across a macro-scale [
4,
20,
21].
By linking rainfall patterns to soil loss and sediment transport, this approach supports the identification of critical factors for policy and management and provides a methodology applicable to other watersheds for soil conservation planning.
This study aims to overcome the limitations of data scarcity by providing a comprehensive spatiotemporal assessment of water-induced soil erosion in the Tafna watershed. Moving beyond a simple case study, this research seeks to demonstrate how the coupling of RUSLE and GIS can serve as a reliable diagnostic tool for large, heterogeneous Mediterranean basins. The specific objectives are to (1) develop a robust spatial mapping of erosion potential by integrating multi-source data to overcome monitoring limitations, (2) evaluate the dynamic response of the 7200 km2 basin to interannual and seasonal rainfall variability, identifying the sensitivity of soil loss to climatic shifts, and (3) identify the dominant drivers of sediment yield through correlation analysis, providing a scalable methodology applicable to other data-limited semi-arid regions.
By establishing this link between rainfall patterns and macro-scale sediment transport, this study provides a methodology for regional planning and soil conservation in areas where traditional monitoring infrastructure is absent.
3. Results
3.1. Rainfall Erosivity and Spatio-Temporal Variability
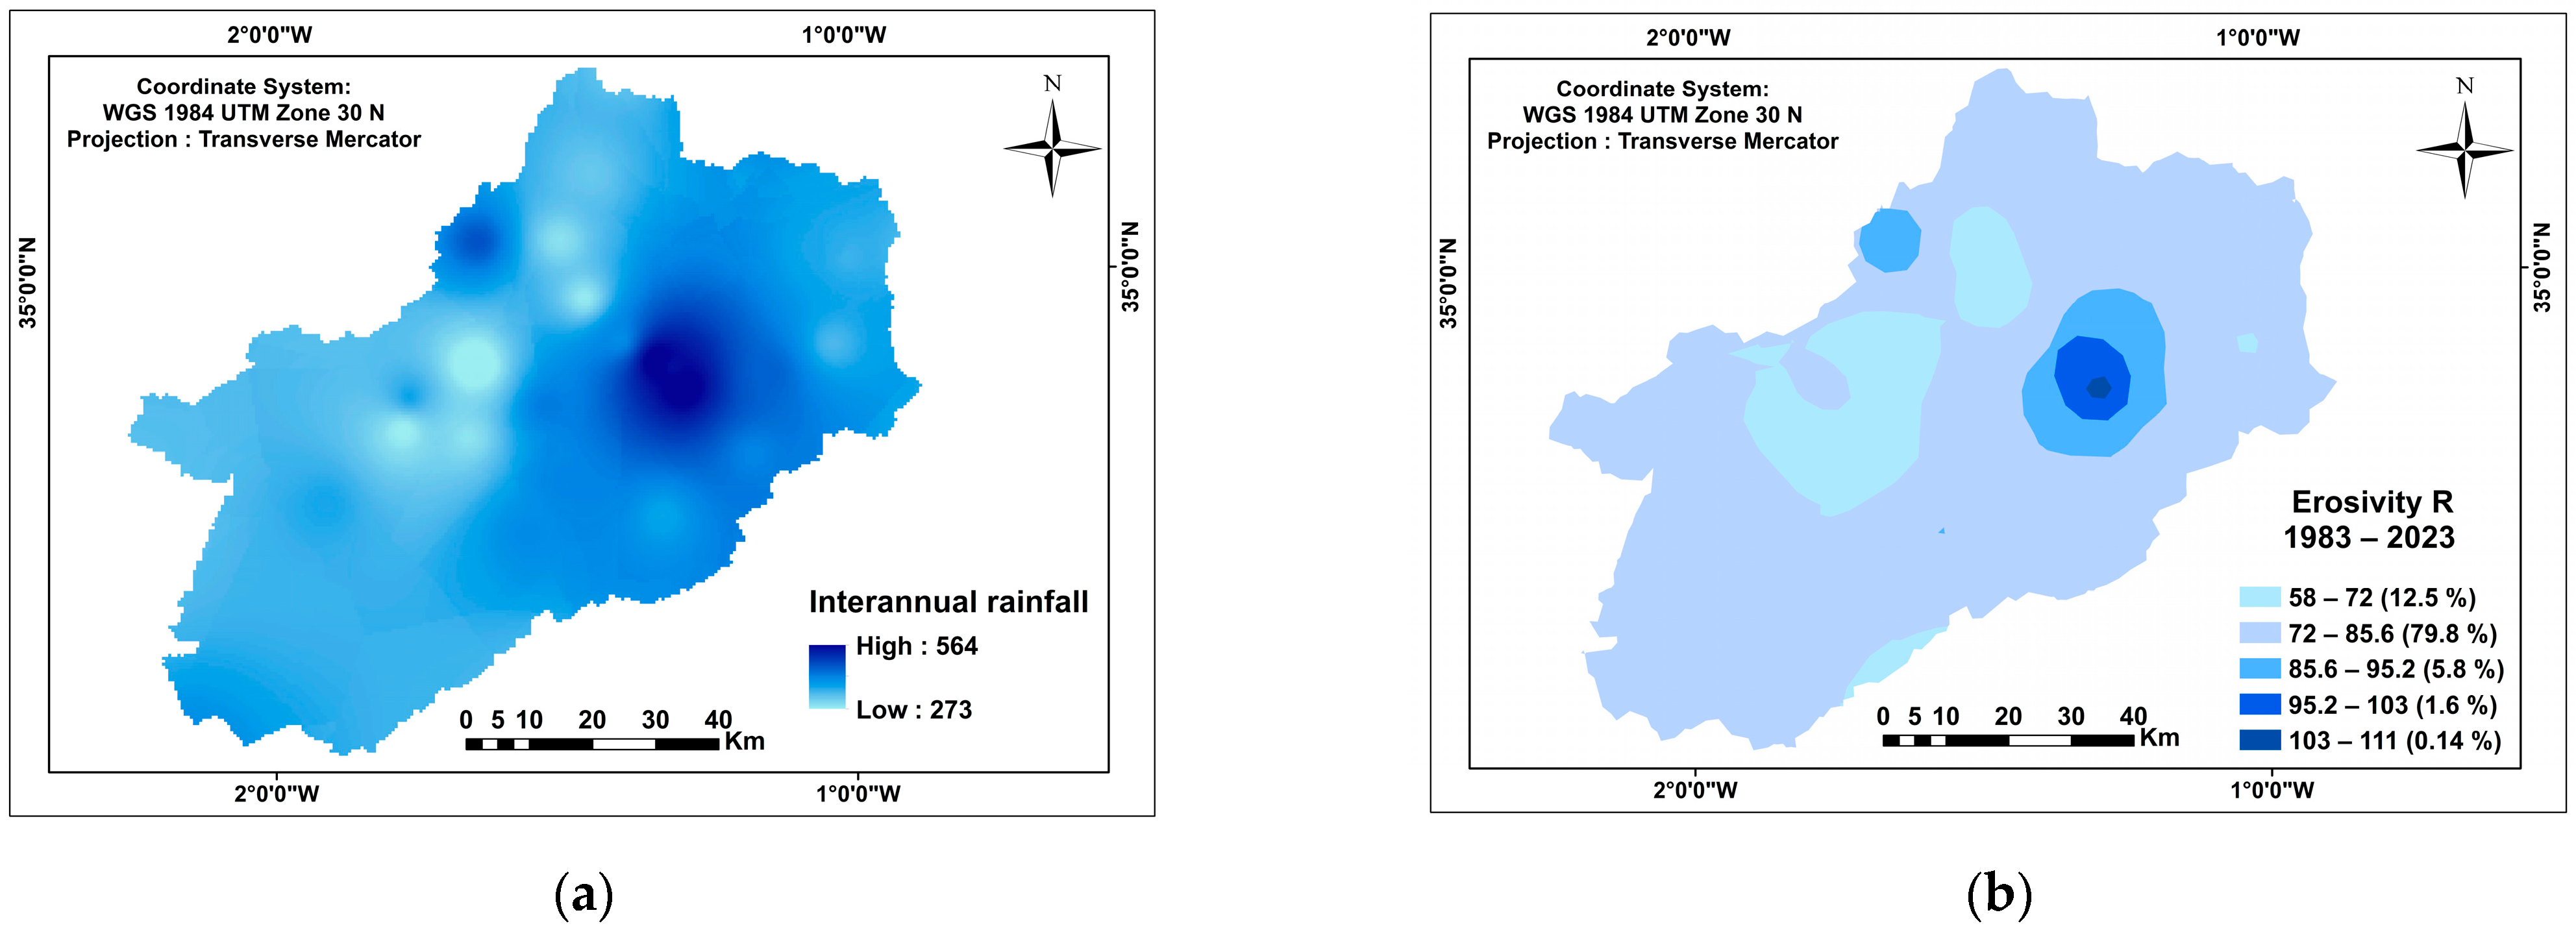
Precipitation in the Tafna watershed exhibits strong spatial heterogeneity, closely linked to orographic influences. Mean annual totals range from approximately 272 mm in the central and western plains to nearly 564 mm in mountainous areas, particularly in the Tlemcen Mountains to the southeast and the Traras Mountains to the northwest (
Figure 4).
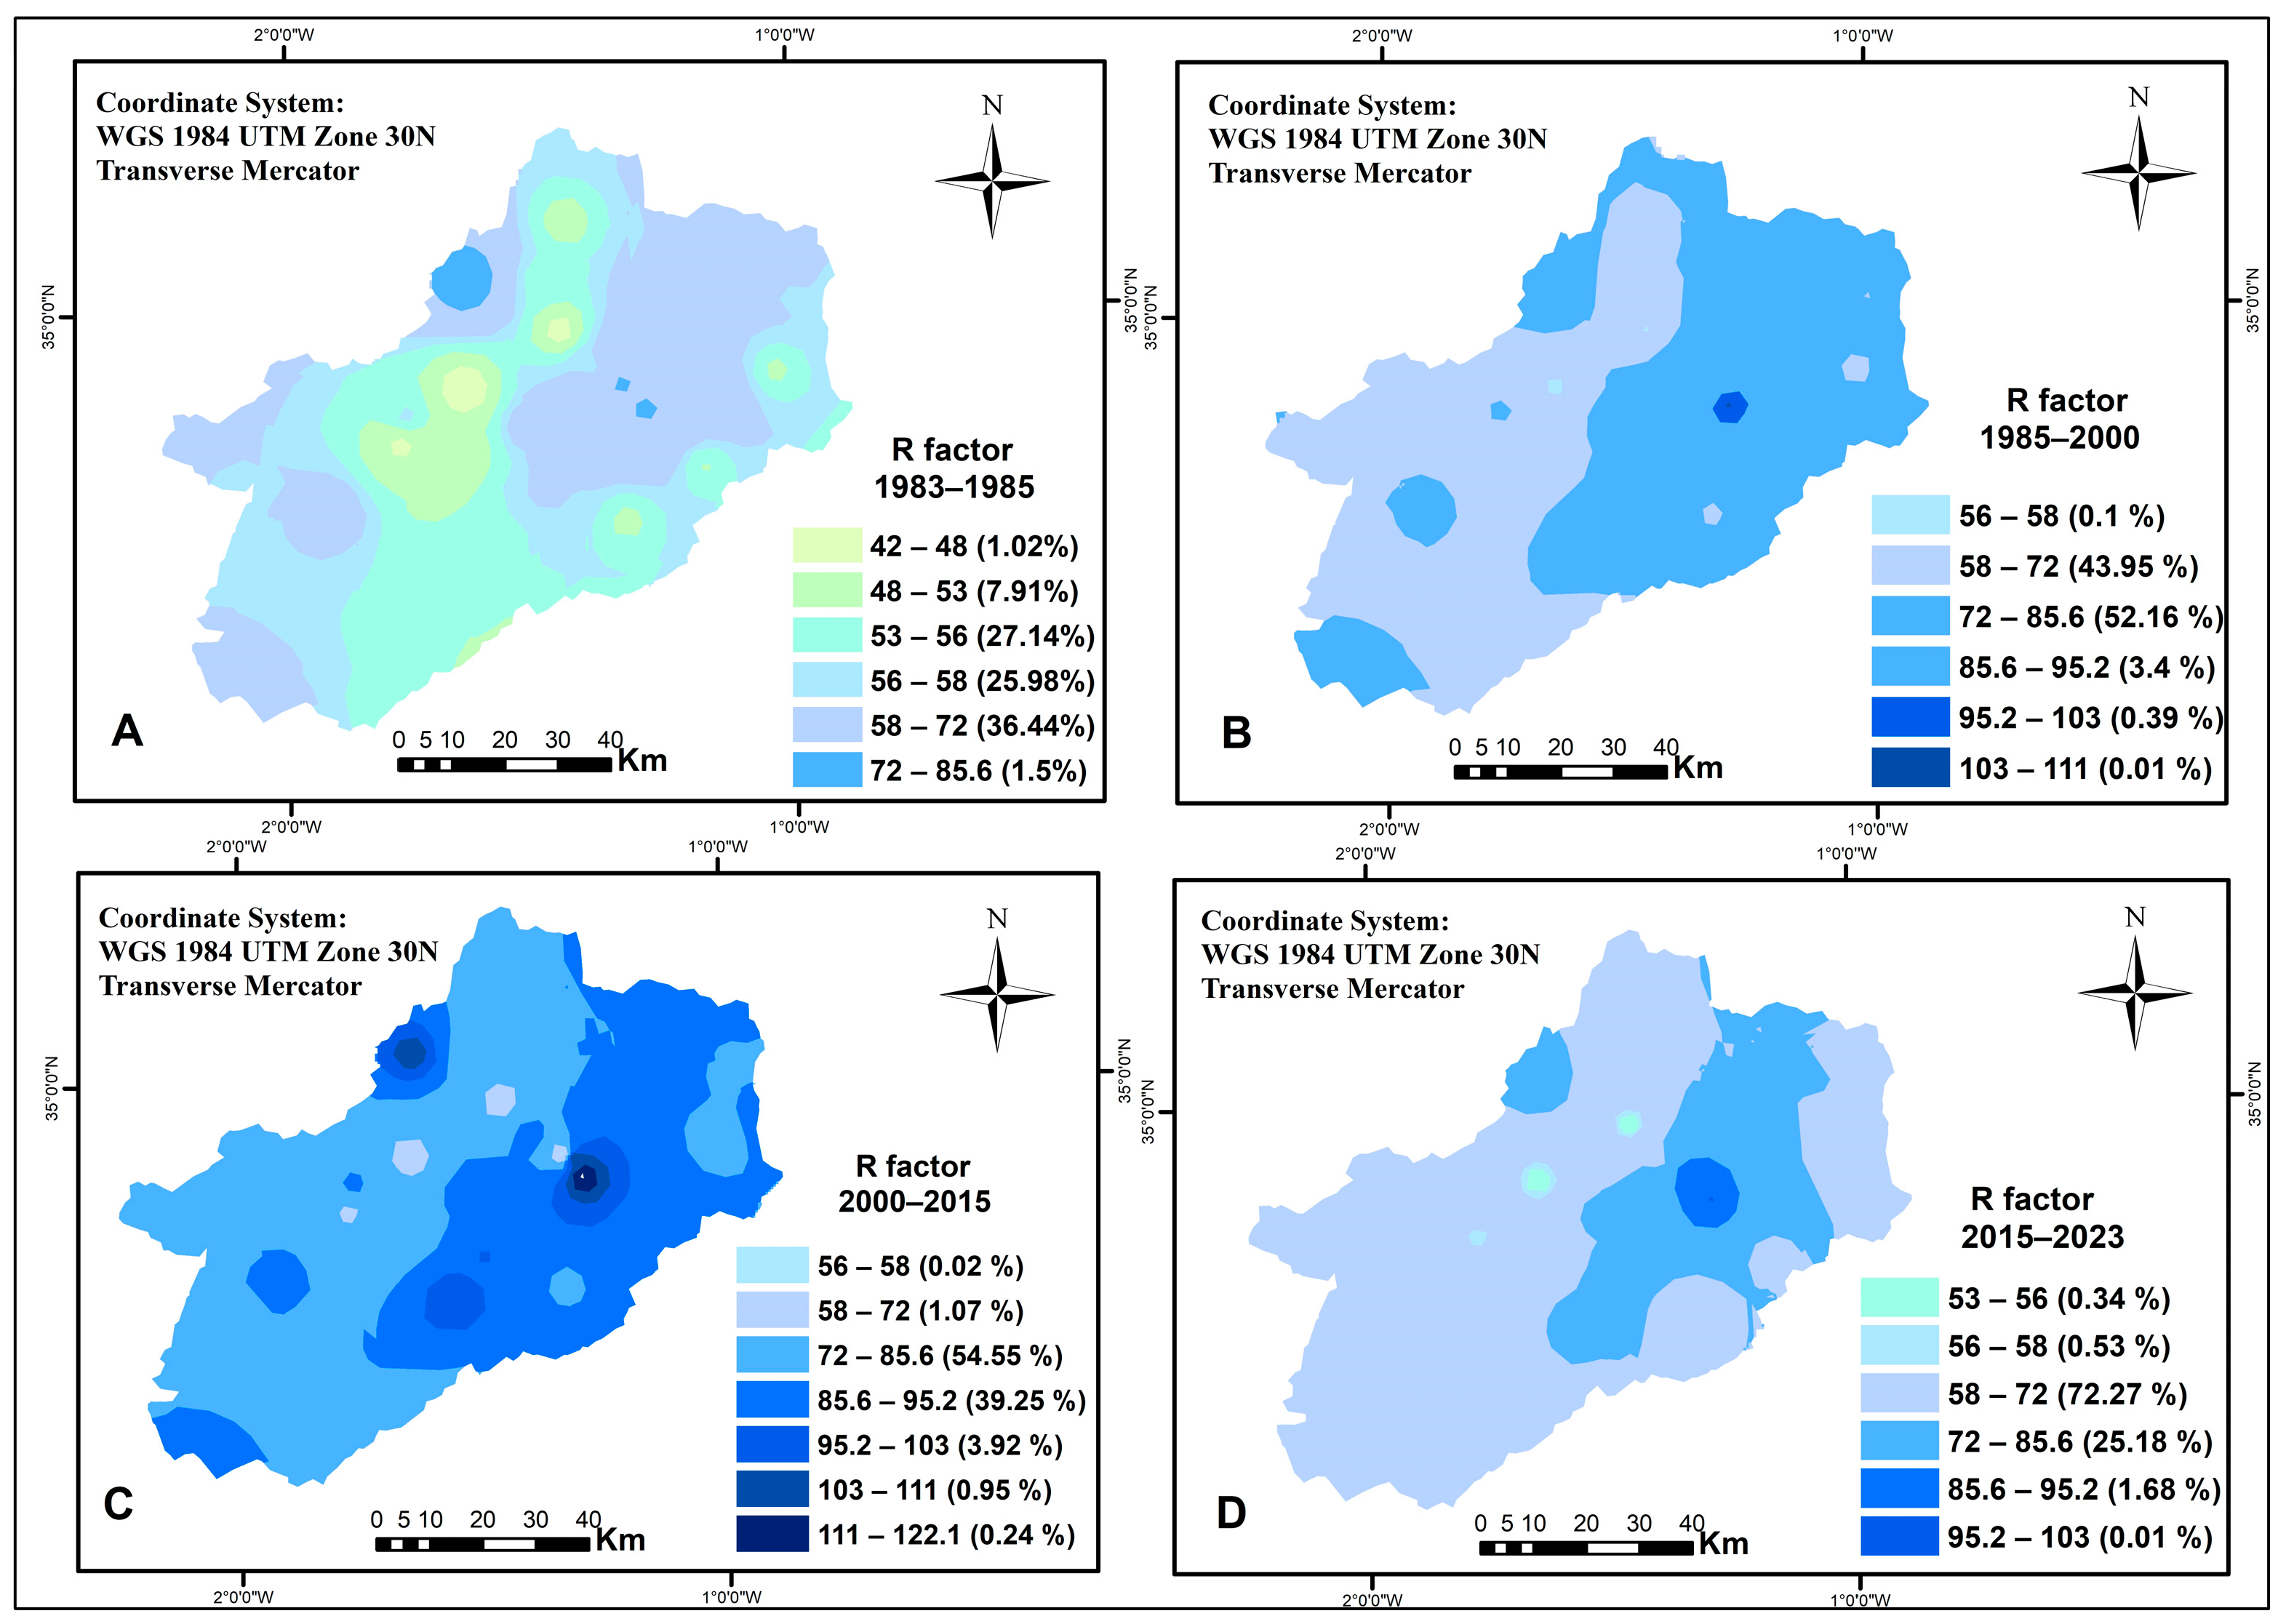
Figure 5 illustrates the spatial distribution of rainfall erosivity (R factor) across the four analyzed periods. This contrasting distribution of rainfall is directly reflected in the spatial pattern of the R factor, which ranges from 58 to 111 MJ
mm
ha
−1h
−1yr
−1. The highest values (>85 MJ
mm
ha
−1h
−1yr
−1) are concentrated in mountainous areas, while the Maghnia plains and central plateaus show the lowest values, indicating limited rainfall erosivity in these regions.
The temporal analysis of the R factor over four representative periods reveals a generally stable spatial pattern, but with notable changes in erosivity magnitude. A progressive increase in rainfall erosivity is observed between 1983 and 2015, followed by a slight decrease in the most recent period (2015–2023).
During the 1983–1985 period, rainfall erosivity was generally low to moderate, with approximately 90% of the watershed exposed to values between 48 and 72 MJmmha−1h−1yr−1, and only 1.5% exceeding 72 MJmmha−1h−1yr−1. Between 1985 and 2000, a notable increase in erosivity was observed, with nearly 56% of the watershed exceeding 72 MJmmha−1h−1yr−1. This increasing trend intensified during the 2000–2015 period, when about 98% of the watershed experienced erosivity values above 72 MJmmha−1h−1yr−1 and approximately 5% exceeded 95.2 MJmmha−1h−1yr−1, indicating a significant spatial expansion of highly erosive areas, particularly in the Tlemcen Mountains. In contrast, during the most recent period (2015–2023), a general decrease in the R factor was observed across most of the watershed, with only 27% of the area still showing values above 72 MJmmha−1h−1yr−1 and all remaining areas below 95.2 MJmmha−1h−1yr−1.
These results highlight the sensitivity of the Tafna watershed to rainfall fluctuations and underscore the critical role of topography in the spatial distribution of rainfall erosivity.
3.2. Soil Erodibility and Spatial Variability of the K Factor
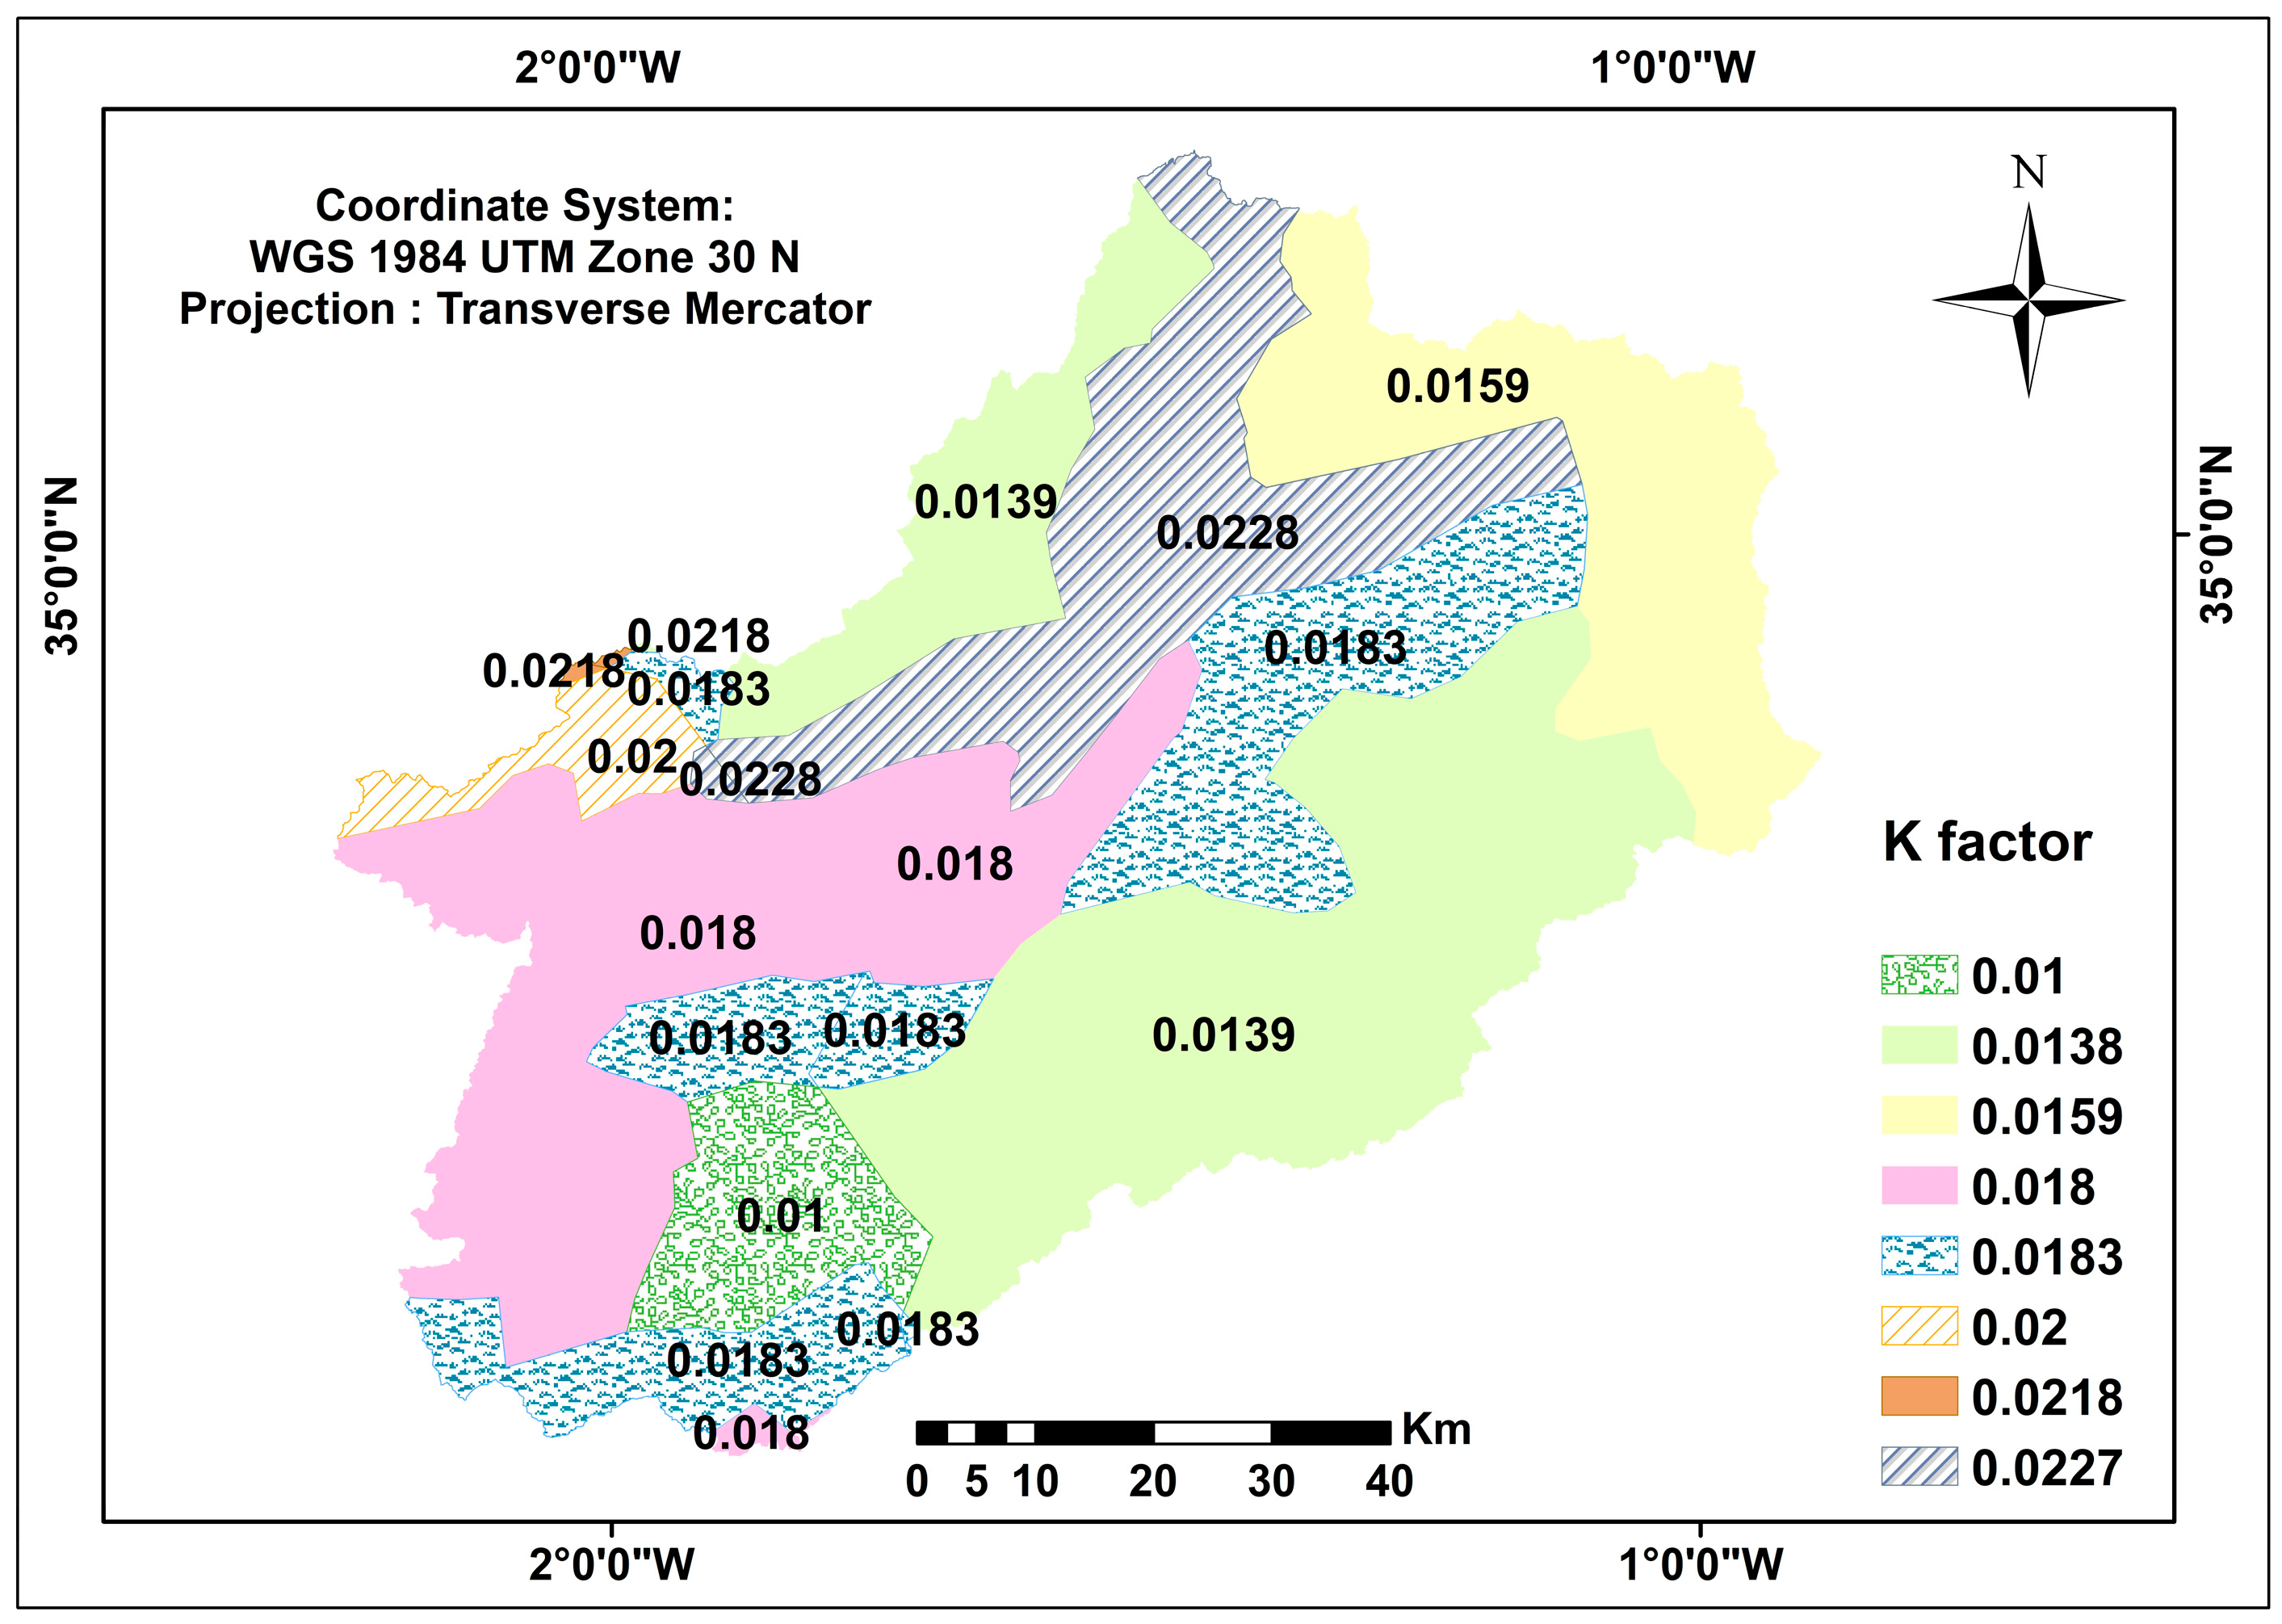
The results obtained for the K factor in the Tafna watershed highlight a notable variation in soil erodibility, with values ranging from 0.013
for the most resistant soils to 0.0228
for the most erosion-prone soils. This range reflects significant contrasts in erosive vulnerability (
Figure 6,
Table 3).
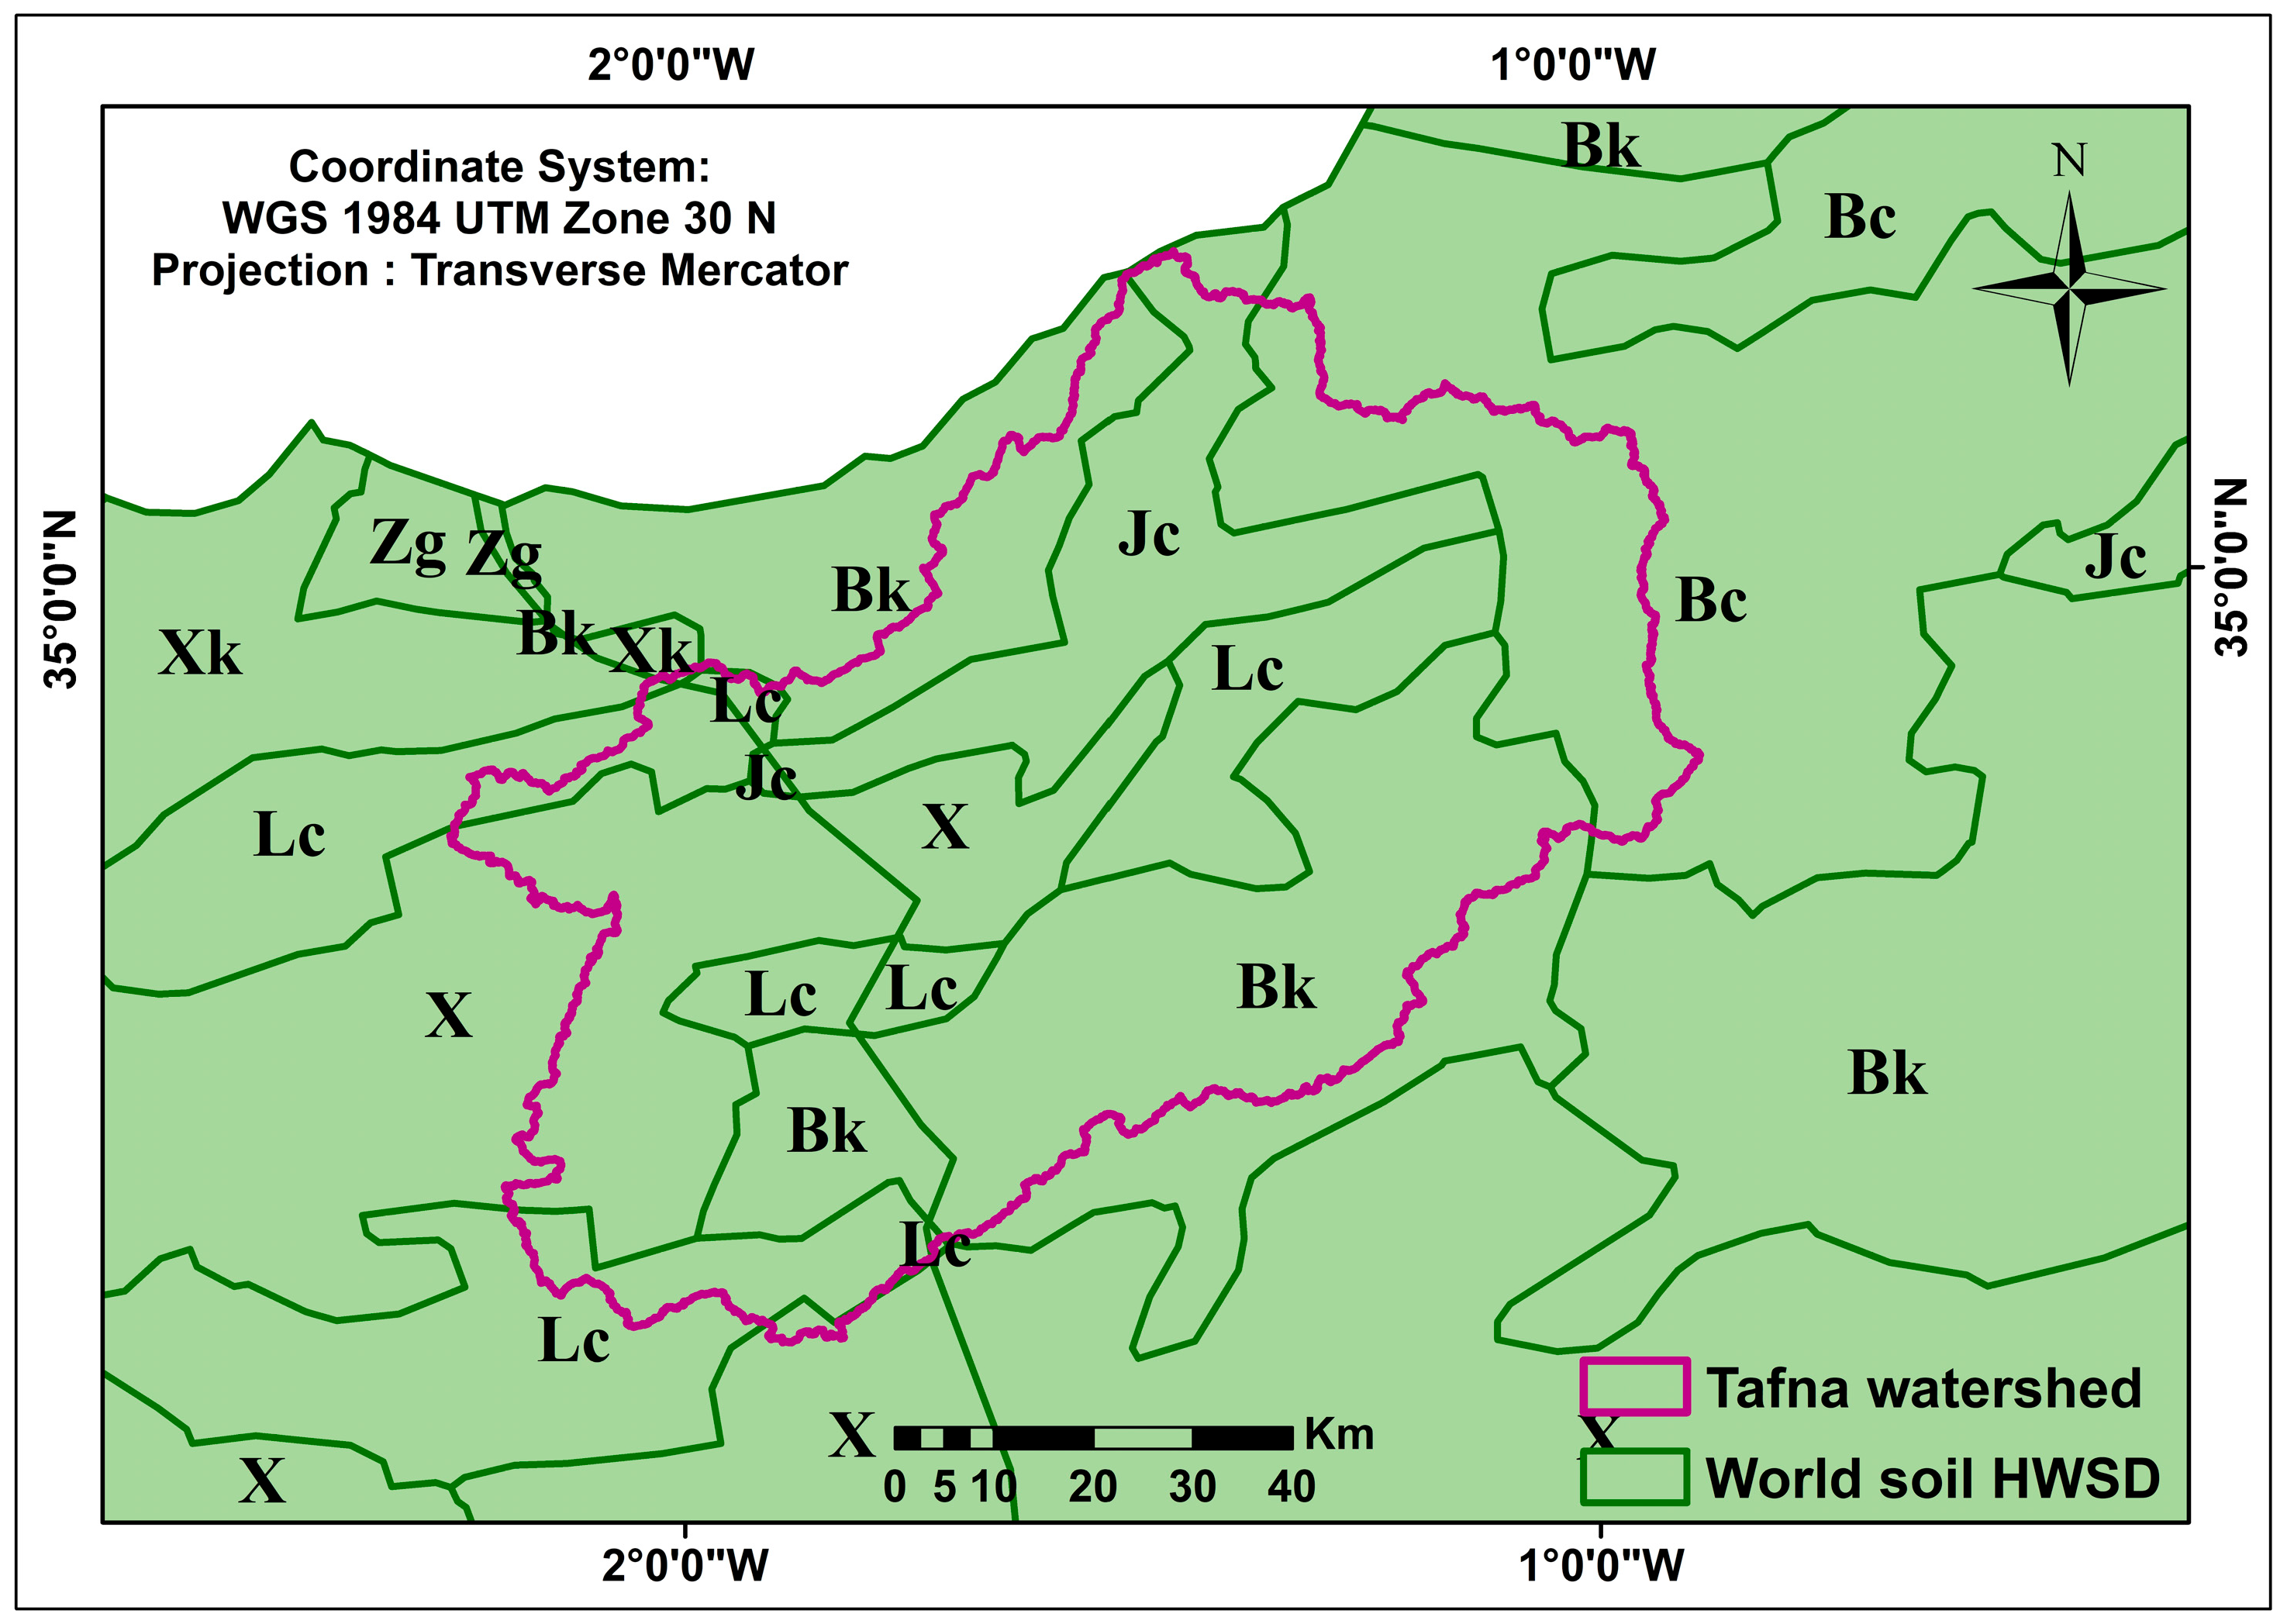
To provide an overall characterization of the watershed before examining the spatial distribution of erodibility, area-weighted averages of the soil units were calculated. The weighted mean contents are 65.5% sand, 15.0% silt, 19.5% clay, and 0.62% organic carbon, corresponding to an average K factor of 0.017. Weighted standard deviations reveal high variability in the sand fraction (±15.6%) and moderate variability for silt and clay (±7%), indicating significant textural heterogeneity across the watershed.
The spatial distribution of the K factor shows that low erodibility areas (K < 0.015) cover approximately one-third of the watershed (35%), mainly located in steep sectors where rainfall erosivity is high. About 56% of the watershed exhibits intermediate values (0.015 ≤ K < 0.020), corresponding to moderately erodible soils. Finally, nearly 14% of the watershed consists of highly erodible soils (K ≥ 0.020). These pedological units, with fine sandy to loamy-sandy textures and moderate organic carbon content, are characterized by low cohesion and reduced structural stability. These properties favor particle detachment under raindrop impact and enhanced surface runoff, reflecting moderate infiltration capacity and high susceptibility to erosion.
3.3. Topographic Factor LS and Influence of Morphology on Erosion
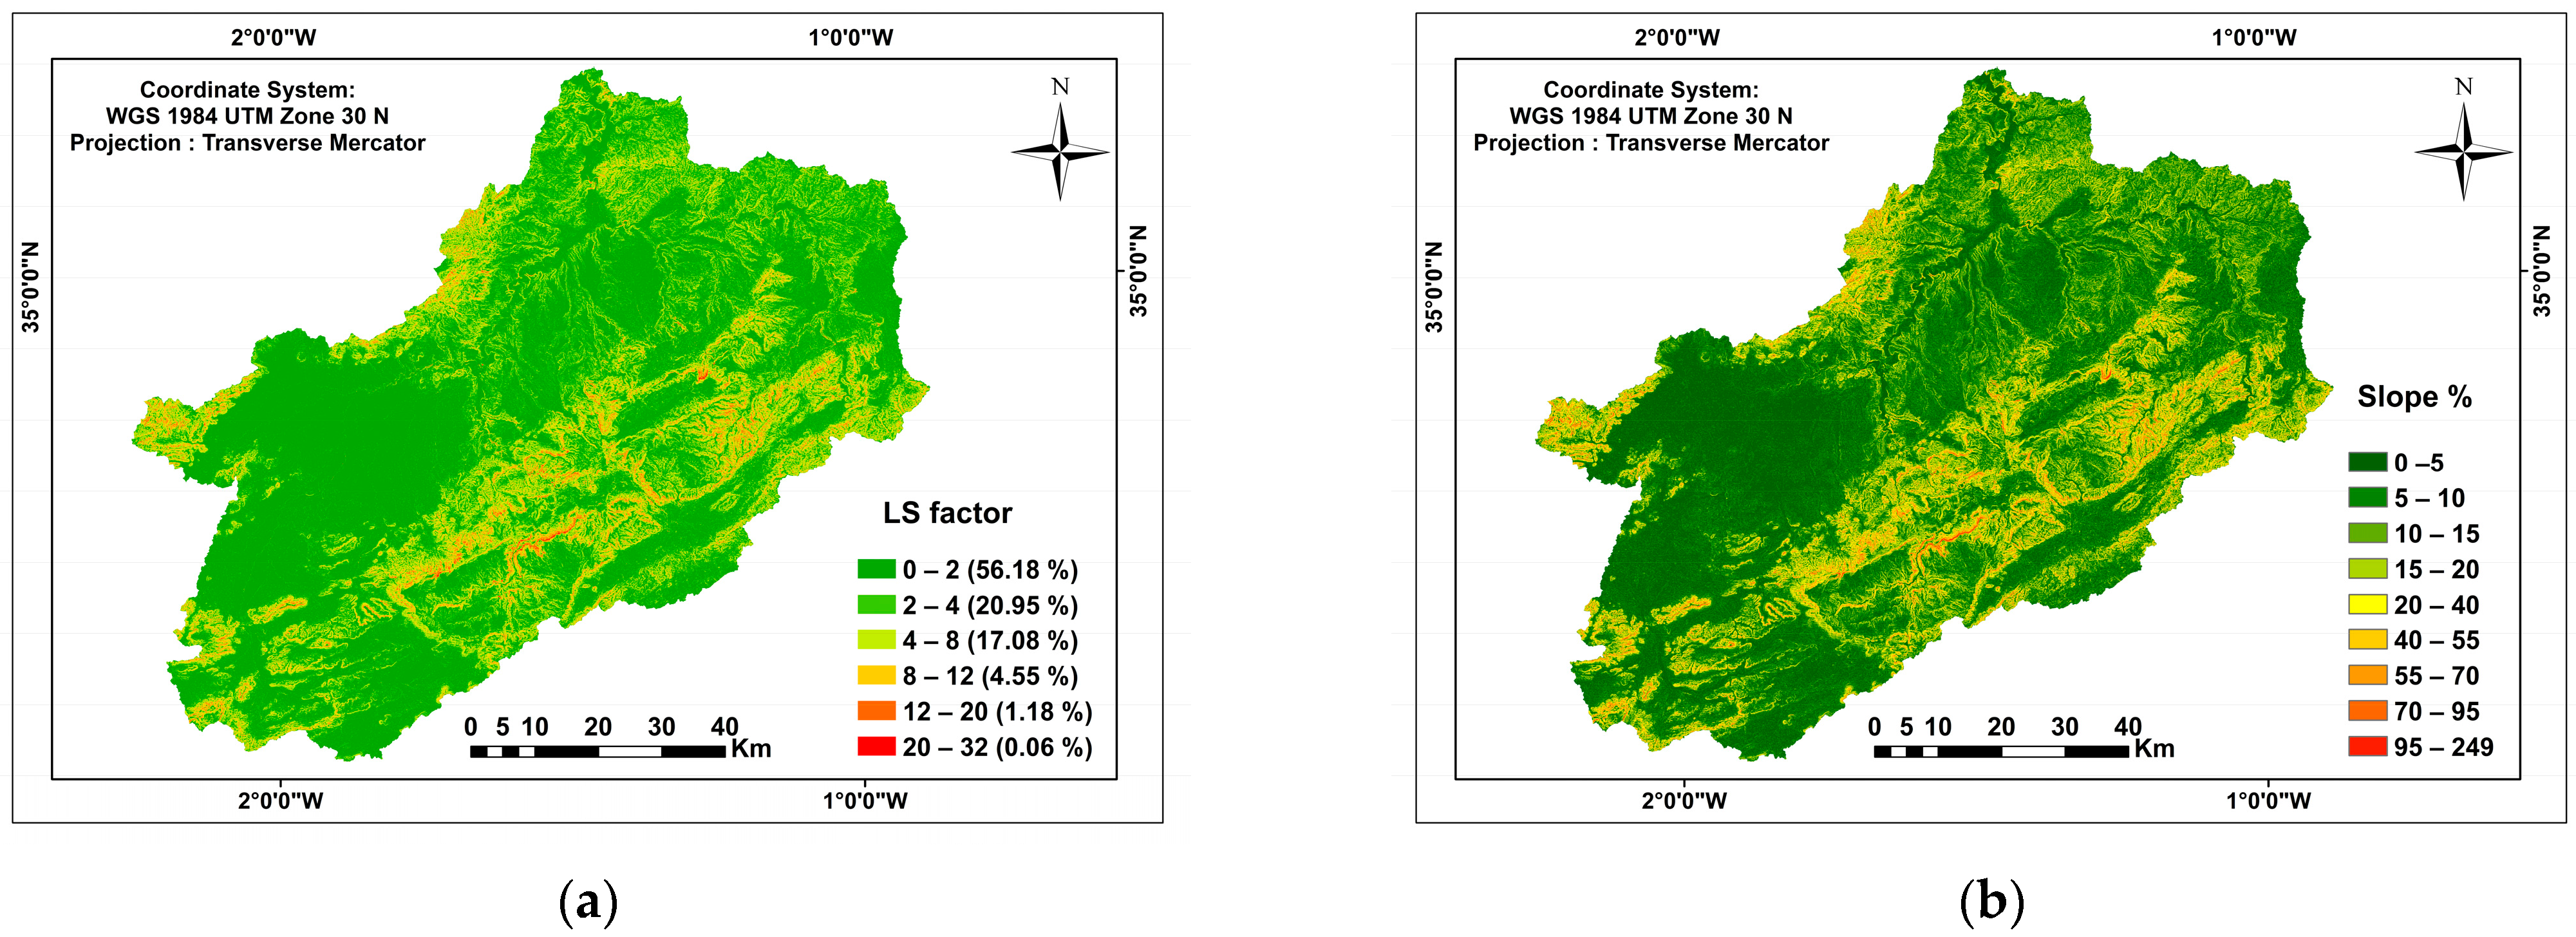
The topographic factor LS was classified into six categories ranging from 0 to 32, reflecting the strong morphological diversity of the Tafna watershed (
Figure 7a). Low-altitude areas with gentle slopes cover the majority of the basin (56.18%) and exhibit LS values between 0 and 2. These sectors correspond primarily to plains and piedmont zones, where erosive processes remain moderate.
Conversely, LS values above 4 characterize areas with more pronounced relief, while values exceeding 12 are associated with rugged terrain and steep slopes, occupying a very limited portion of the basin (less than 1.5% of the total area). These zones are mainly concentrated in the mountainous massifs of the south and southeast, particularly in the Tlemcen and Traras mountains, where topography strongly enhances runoff and flow concentration.
The slopes (
Figure 7b) also show a contrasting distribution: they often exceed 15% in the upstream mountainous areas, while the downstream zones feature gentler slopes favorable to sediment deposition. Additionally, the lithology, dominated by marly, calcareous, and clayey formations, contributes to increased structural fragility of the basin and reinforces the sensitivity of the slopes to water erosion [
74].
3.4. Vegetation Cover Factor (C)
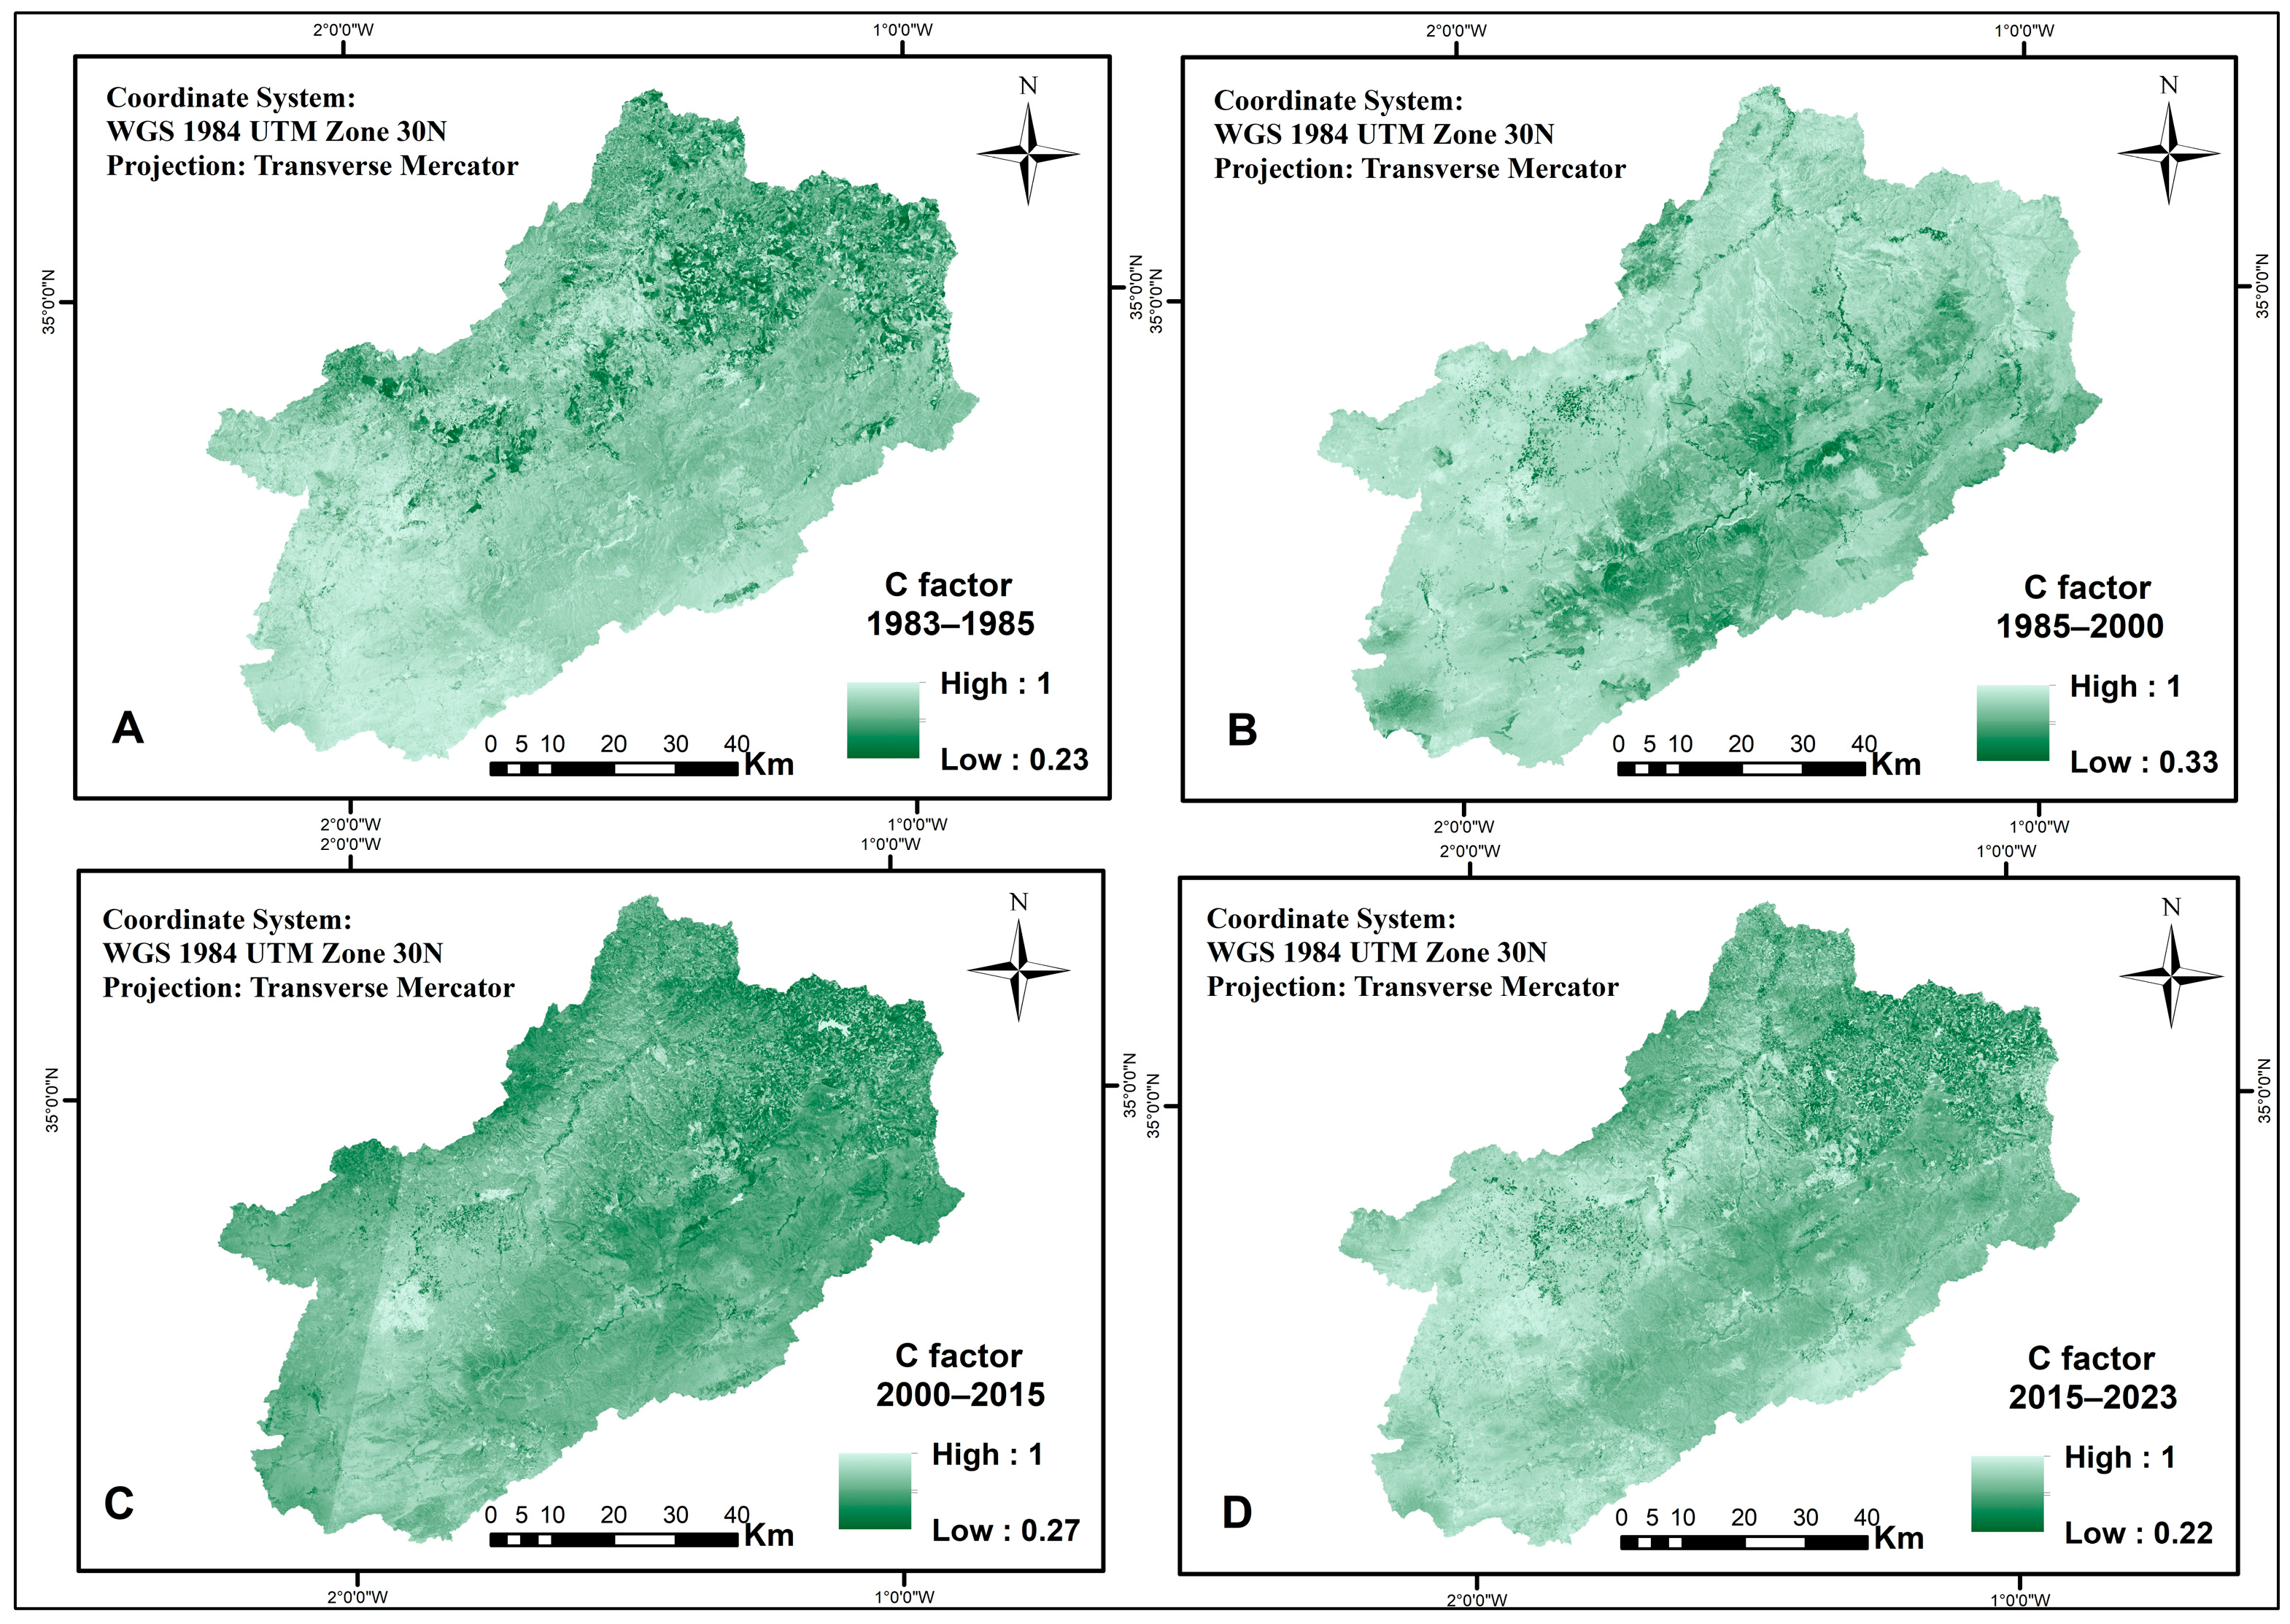
The C factor, representing vegetation cover in the Tafna watershed, exhibits a marked spatiotemporal variation (
Figure 8). C values range from 0.22 to 1, reflecting high heterogeneity in vegetation cover. Low values
correspond to areas with dense, well-developed vegetation, mainly located in the north, northeast, and near the watershed outlet. In contrast, high values
indicate bare soils, highly vulnerable to erosion, found in the western plains and in exposed mountainous areas.
Satellite imagery from 2000 showed a different pattern compared to images from 1985, 2015, and 2023. In 2000, the northern and northeastern plains displayed degraded vegetation cover, whereas the vegetation in the southern and southeastern mountainous massifs was relatively better developed.
The period 2000–2015was characterized by a notable increase in vegetation cover, particularly in the eastern and southern parts of the watershed, indicating an overall improvement in vegetation conditions. Conversely, between 2015 and 2023, a progressive degradation of vegetation cover is observed across the watershed, likely linked to anthropogenic pressure, repeated droughts, and regional climate change.
3.5. Soil Conservation Practices Factor (P)
The P factor is an important component of the RUSLE model, as it represents the influence of support (soil conservation) practices on soil erosion. Based on the slope-based classification adopted in this study,
Table 4 presents the assigned
p values for the different slope classes, along with the corresponding proportion of the watershed area. Lower
p values are associated with gently sloping areas (0–7% and 7–11.3%), which together account for nearly half of the watershed area, whereas higher
p values are assigned to steeper slopes, reflecting a reduced effectiveness of conservation practices under steep terrain conditions.
3.6. Potential Soil Erosion Risk Map Using the RUSLE Model (A)
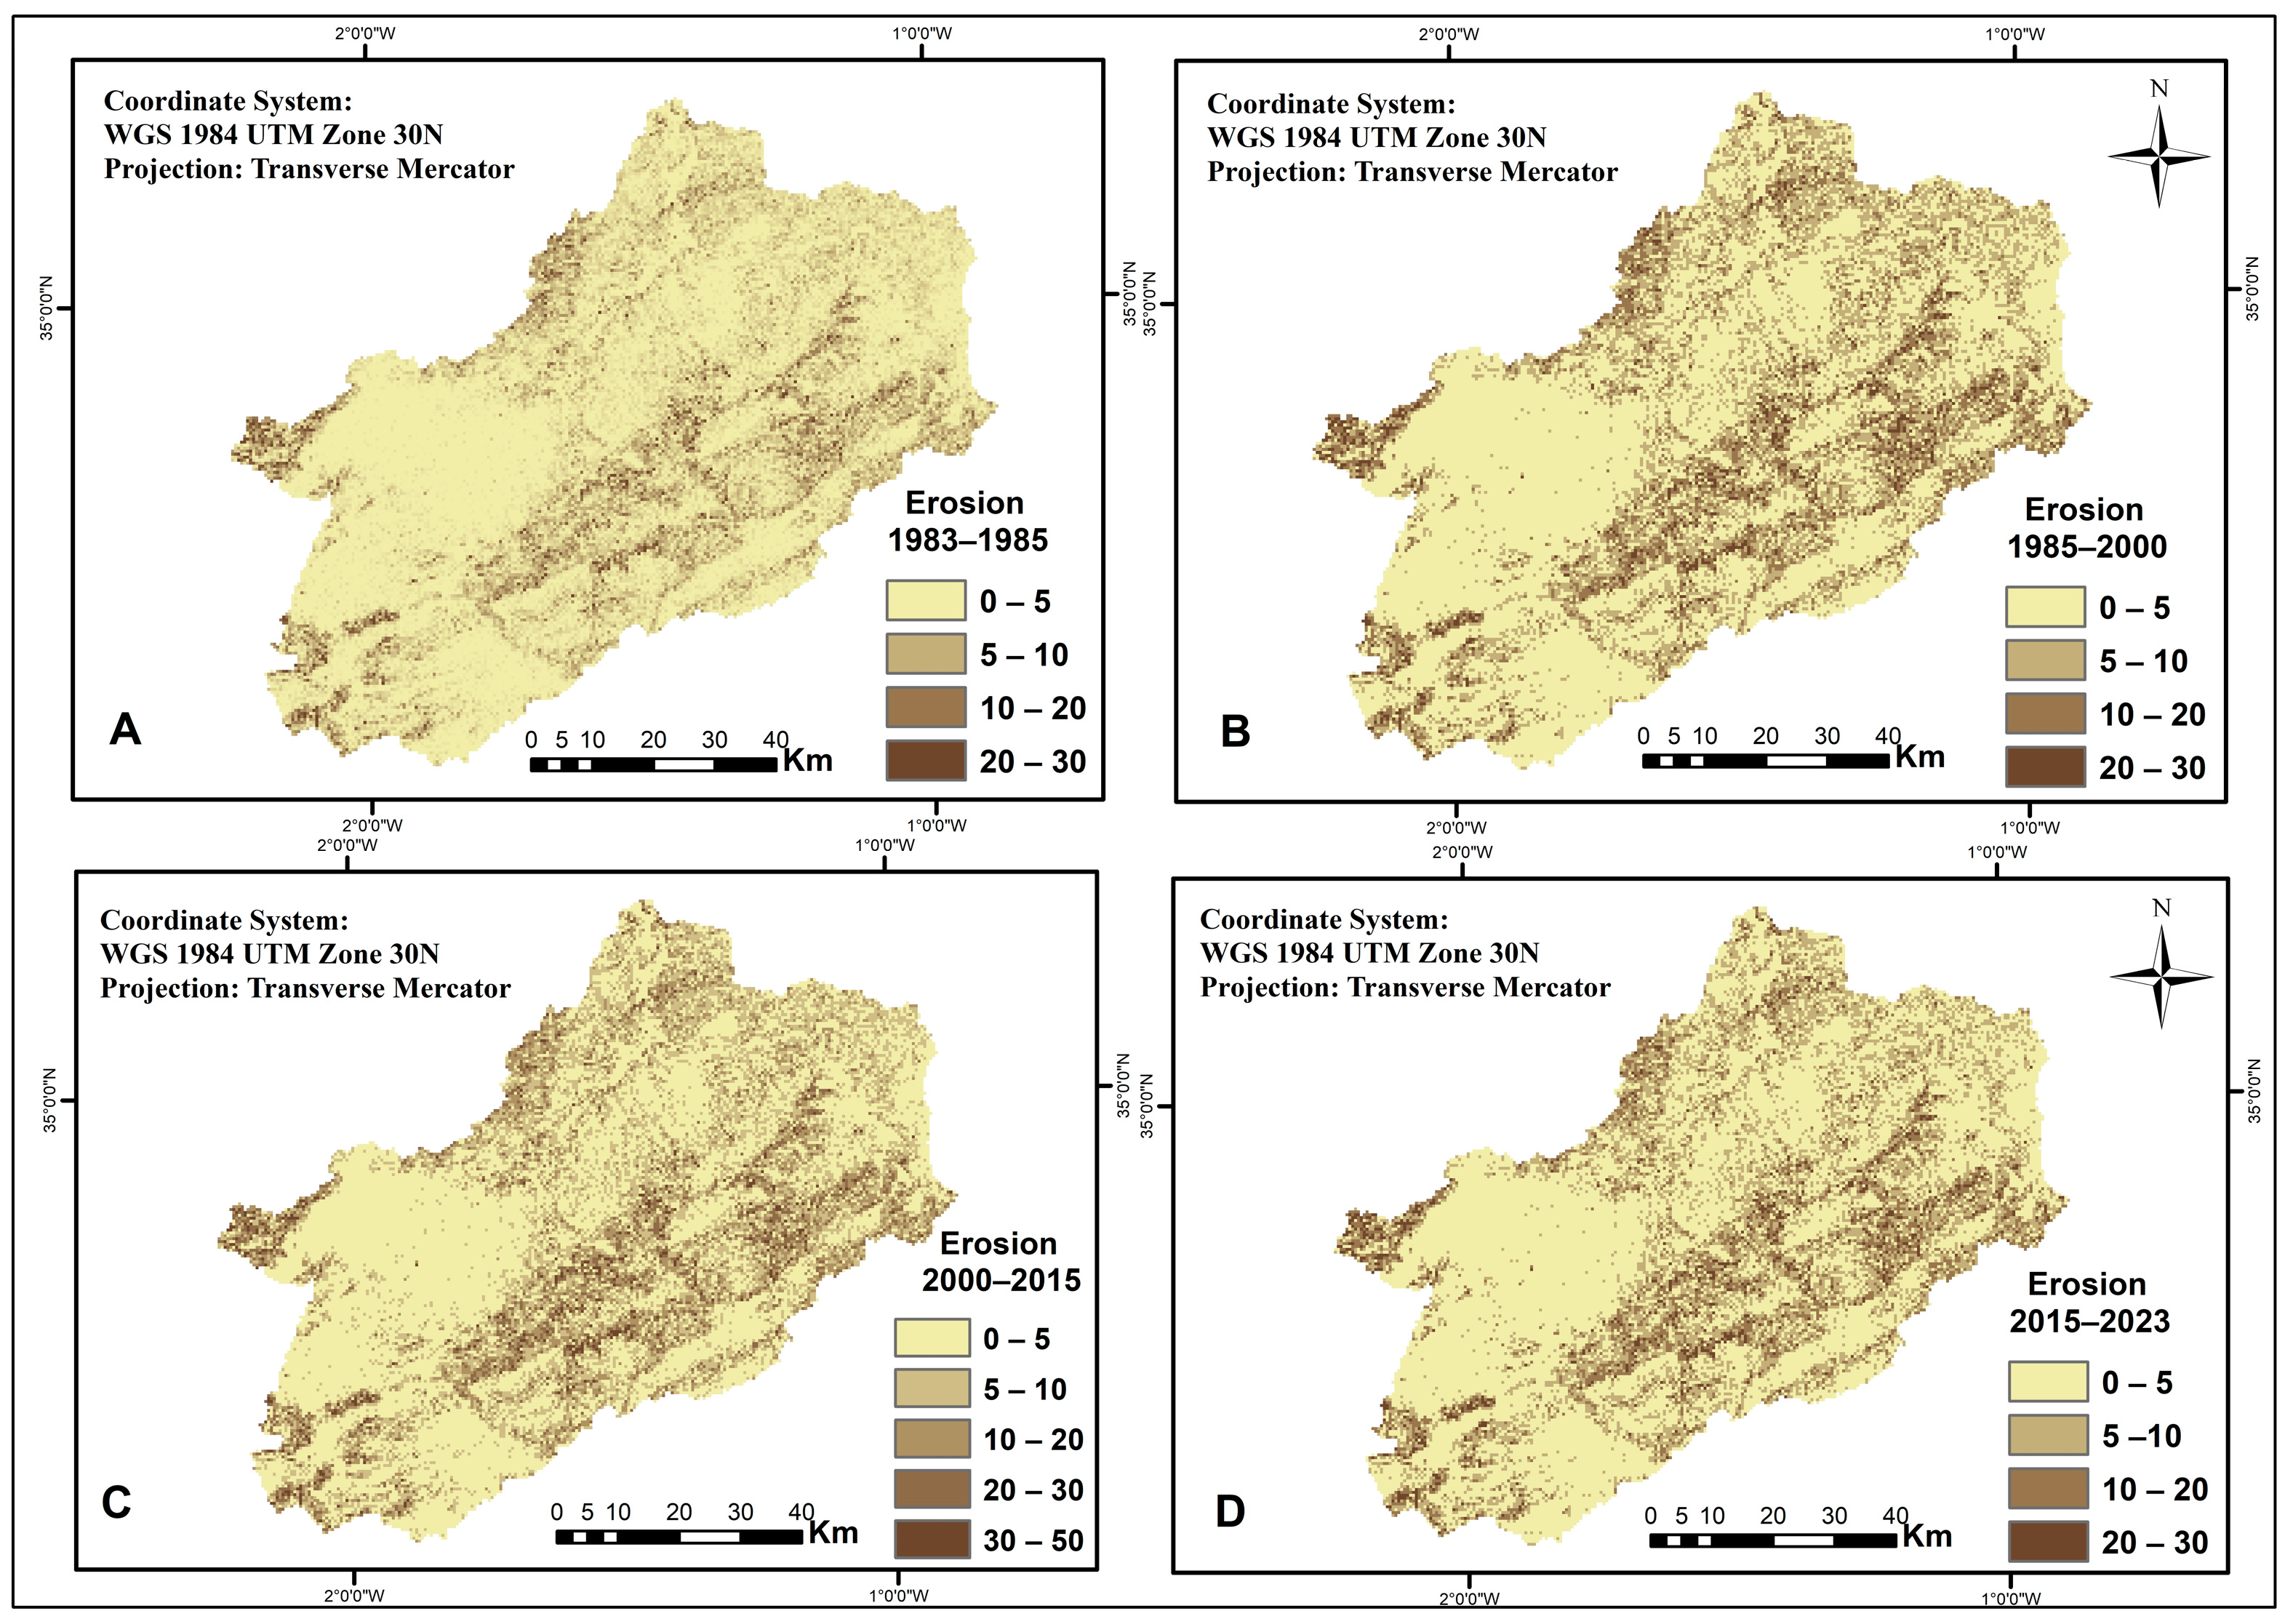
The spatiotemporal analysis of erosion in the Tafna watershed highlights strong spatial variability and a marked temporal progression, particularly in the mountainous areas (
Figure 9 and
Table 5). Over the study period
, the average annual soil loss is estimated at
, corresponding to an annual degradation of approximately 10.9 million tonnes of arable soil.
During the first interval (1983–1985), soils were comparatively better protected, with an annual erosion rate 36% lower than the long-term average . From 1985 to 2000, soil loss increased significantly, showing an excess of 19%, with a mean annual erosion of . After 2000, erosion decreased slightly (−2%) during the period, and then dropped more substantially (−23%) between 2015 and 2023.
Overall, the spatial pattern of vulnerable zones remains similar throughout the four-time intervals. The maps produced for each period display nearly identical erosion-prone areas, while the intensity of erosion varies over time. The highest erosion rates are observed between 1985 and 2000, reaching up to . During the more stable periods (1983–1985 and 2000–2015), maximum erosion values generally do not exceed .
Mountainous regions and high-elevation areas exhibit the highest erosion levels, often exceeding . In contrast, the western part of the basin—including the Maghnia plains—and the gentle-slope areas of the central and northern sectors show low erosion, with average soil losses below . These trends indicate that erosion has intensified particularly in mountainous zones, while the western plains have remained relatively stable and less affected.
The fact that the erosion maps show very sharp changes in erosion intensity over only a few pixels (
Figure 10), and that this spatial pattern remains largely stable throughout the study period, indicates that soil erosion in the Tafna watershed is predominantly controlled by local conditions rather than by global factors.
Local parameters (lithology, soil structure, microtopography, and vegetation cover) have a direct and immediate influence on erosion processes, which explains the pronounced contrasts observed at fine spatial scales.
Global drivers (regional climate, rainfall variability, and broad anthropogenic trends) tend to have a more diffuse impact and operate over longer timescales. While they modulate the overall intensity of erosion in the basin, their influence mainly results in a local amplification in areas that are already susceptible.
Therefore, erosion in the Tafna watershed appears to be a process that is highly conditioned by local terrain and environmental factors, with climatic and anthropogenic influences acting primarily as modulators of intensity rather than determinants of spatial pattern.
3.7. Skewness Coefficient: Spatio-Temporal Variability of Rainfall and Its Impact on Erosion
The skewness coefficient is a key hydrological indicator used to assess the irregularity in the distribution of precipitation within a watershed. It characterizes the relative frequency of dry periods versus heavy rainfall events, thus reflecting the degree of temporal inequality in rainfall inputs.
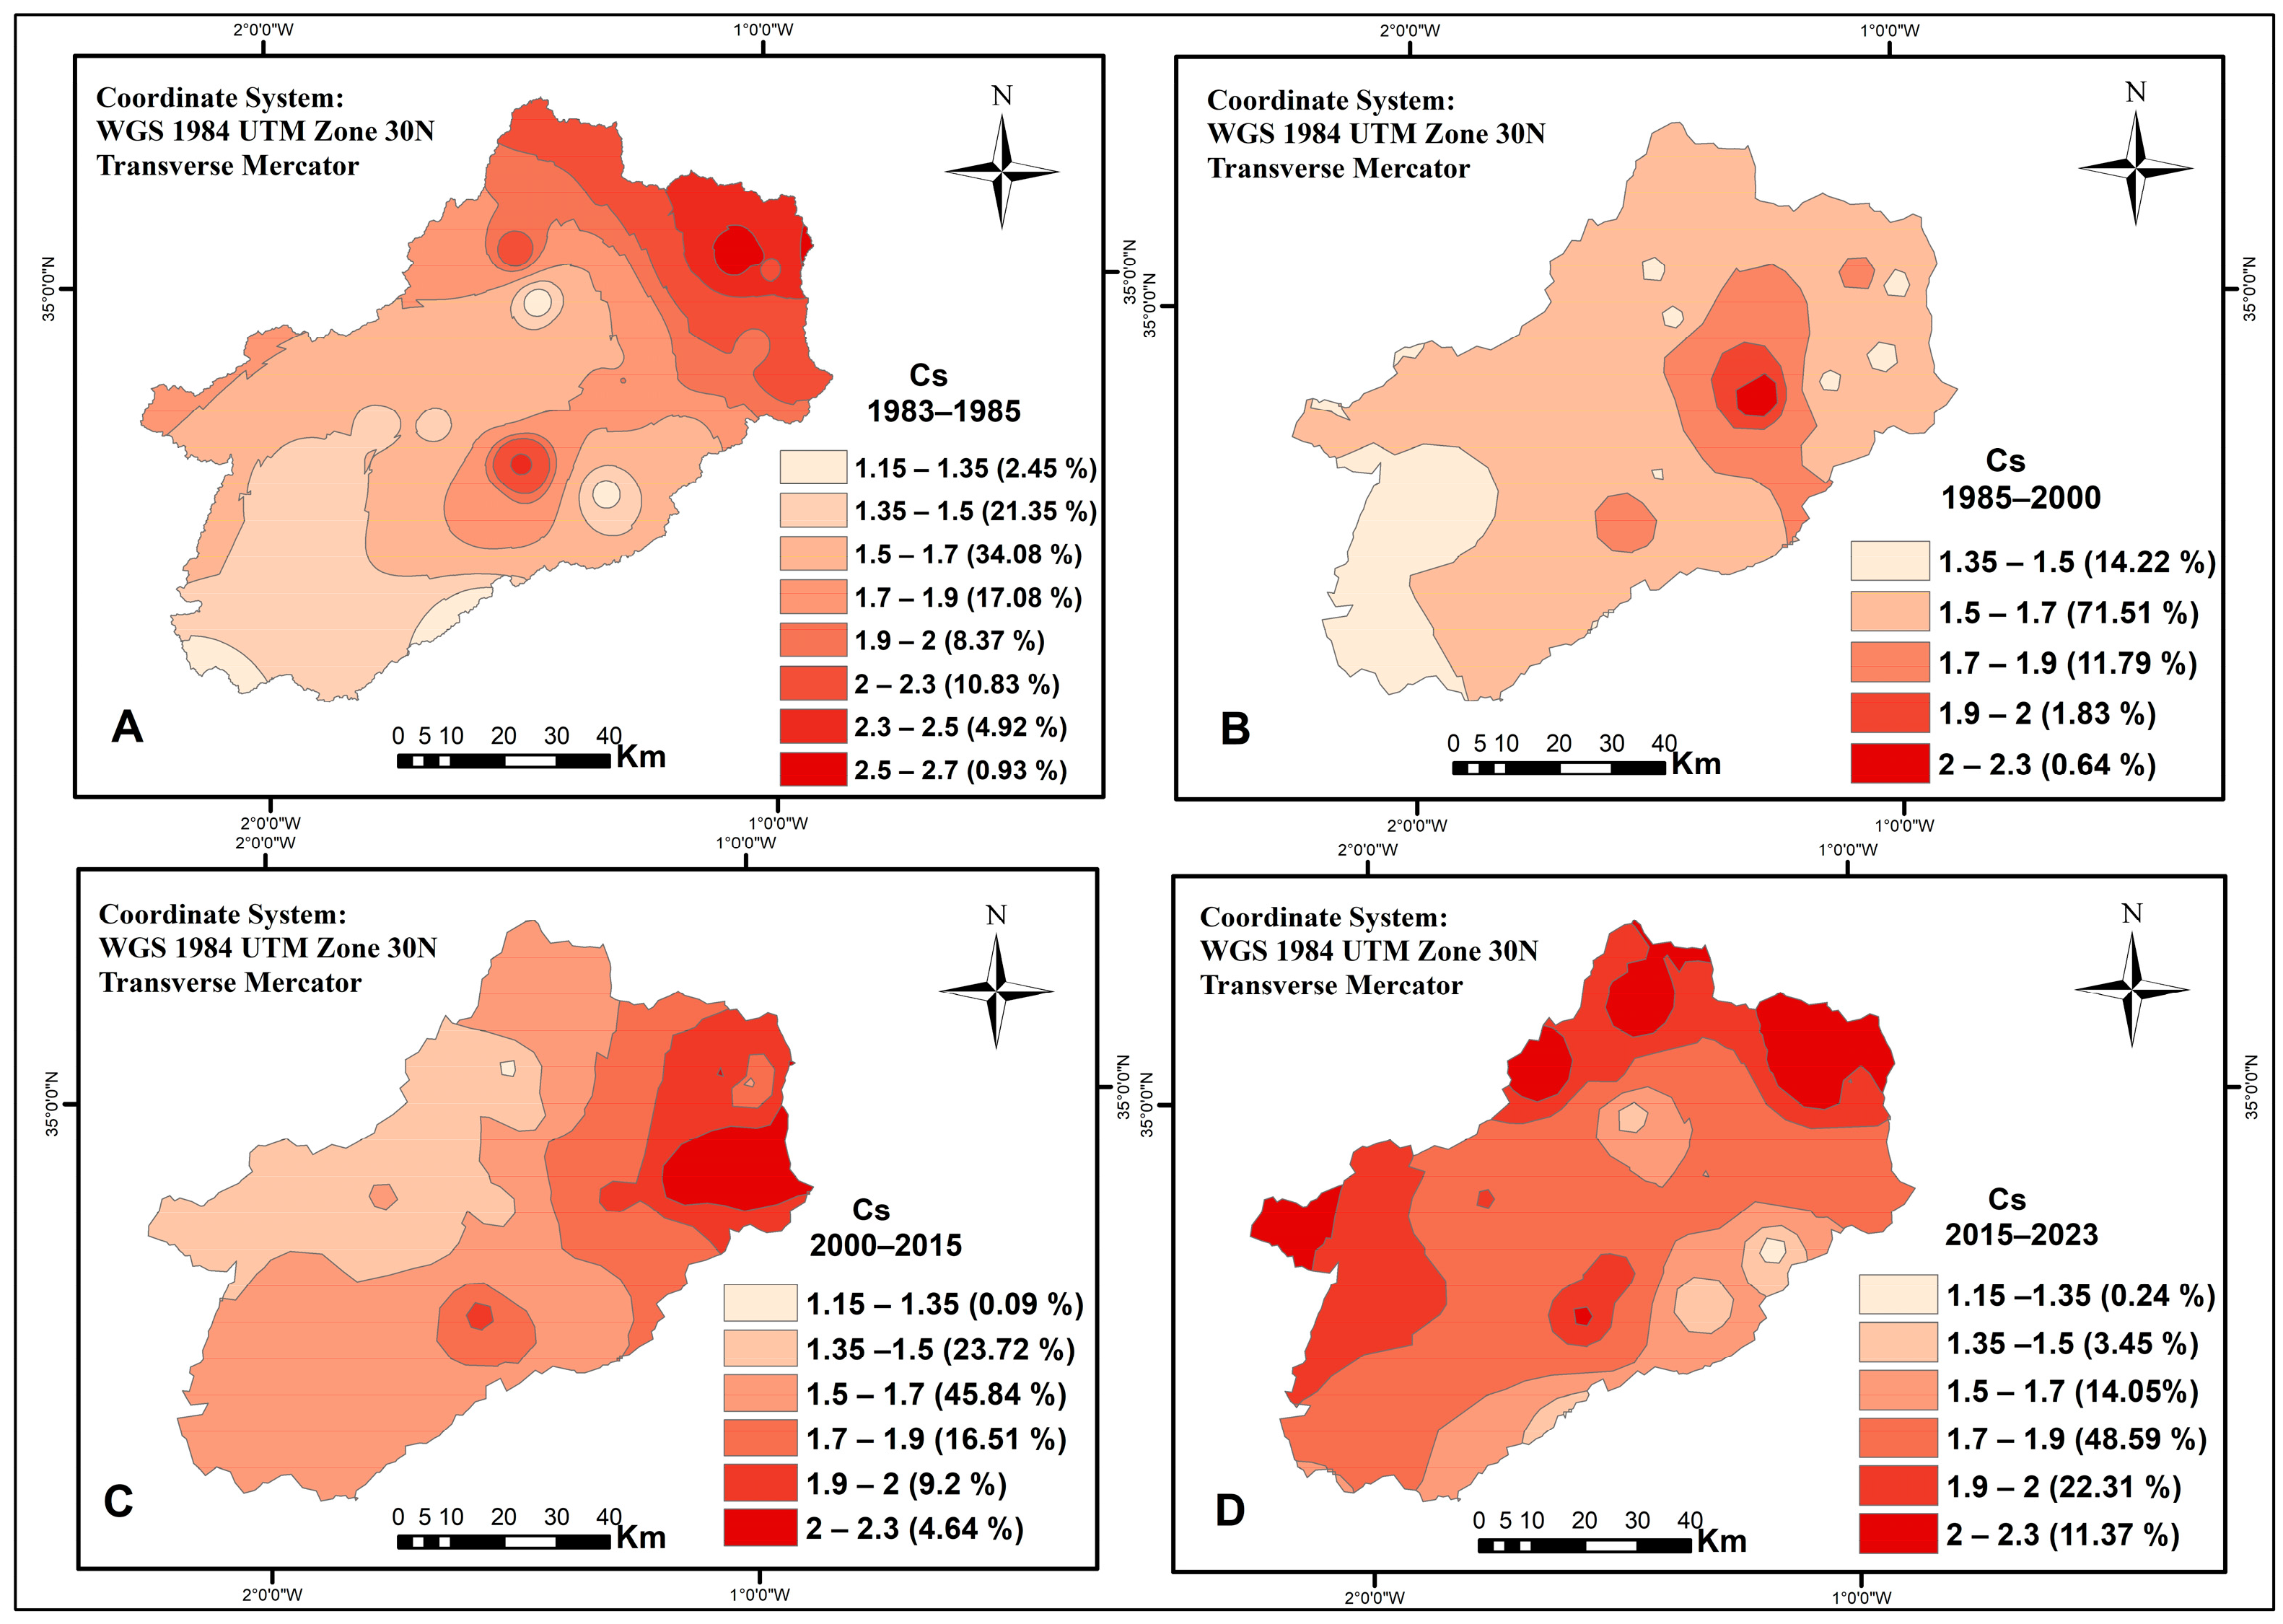
Over the period
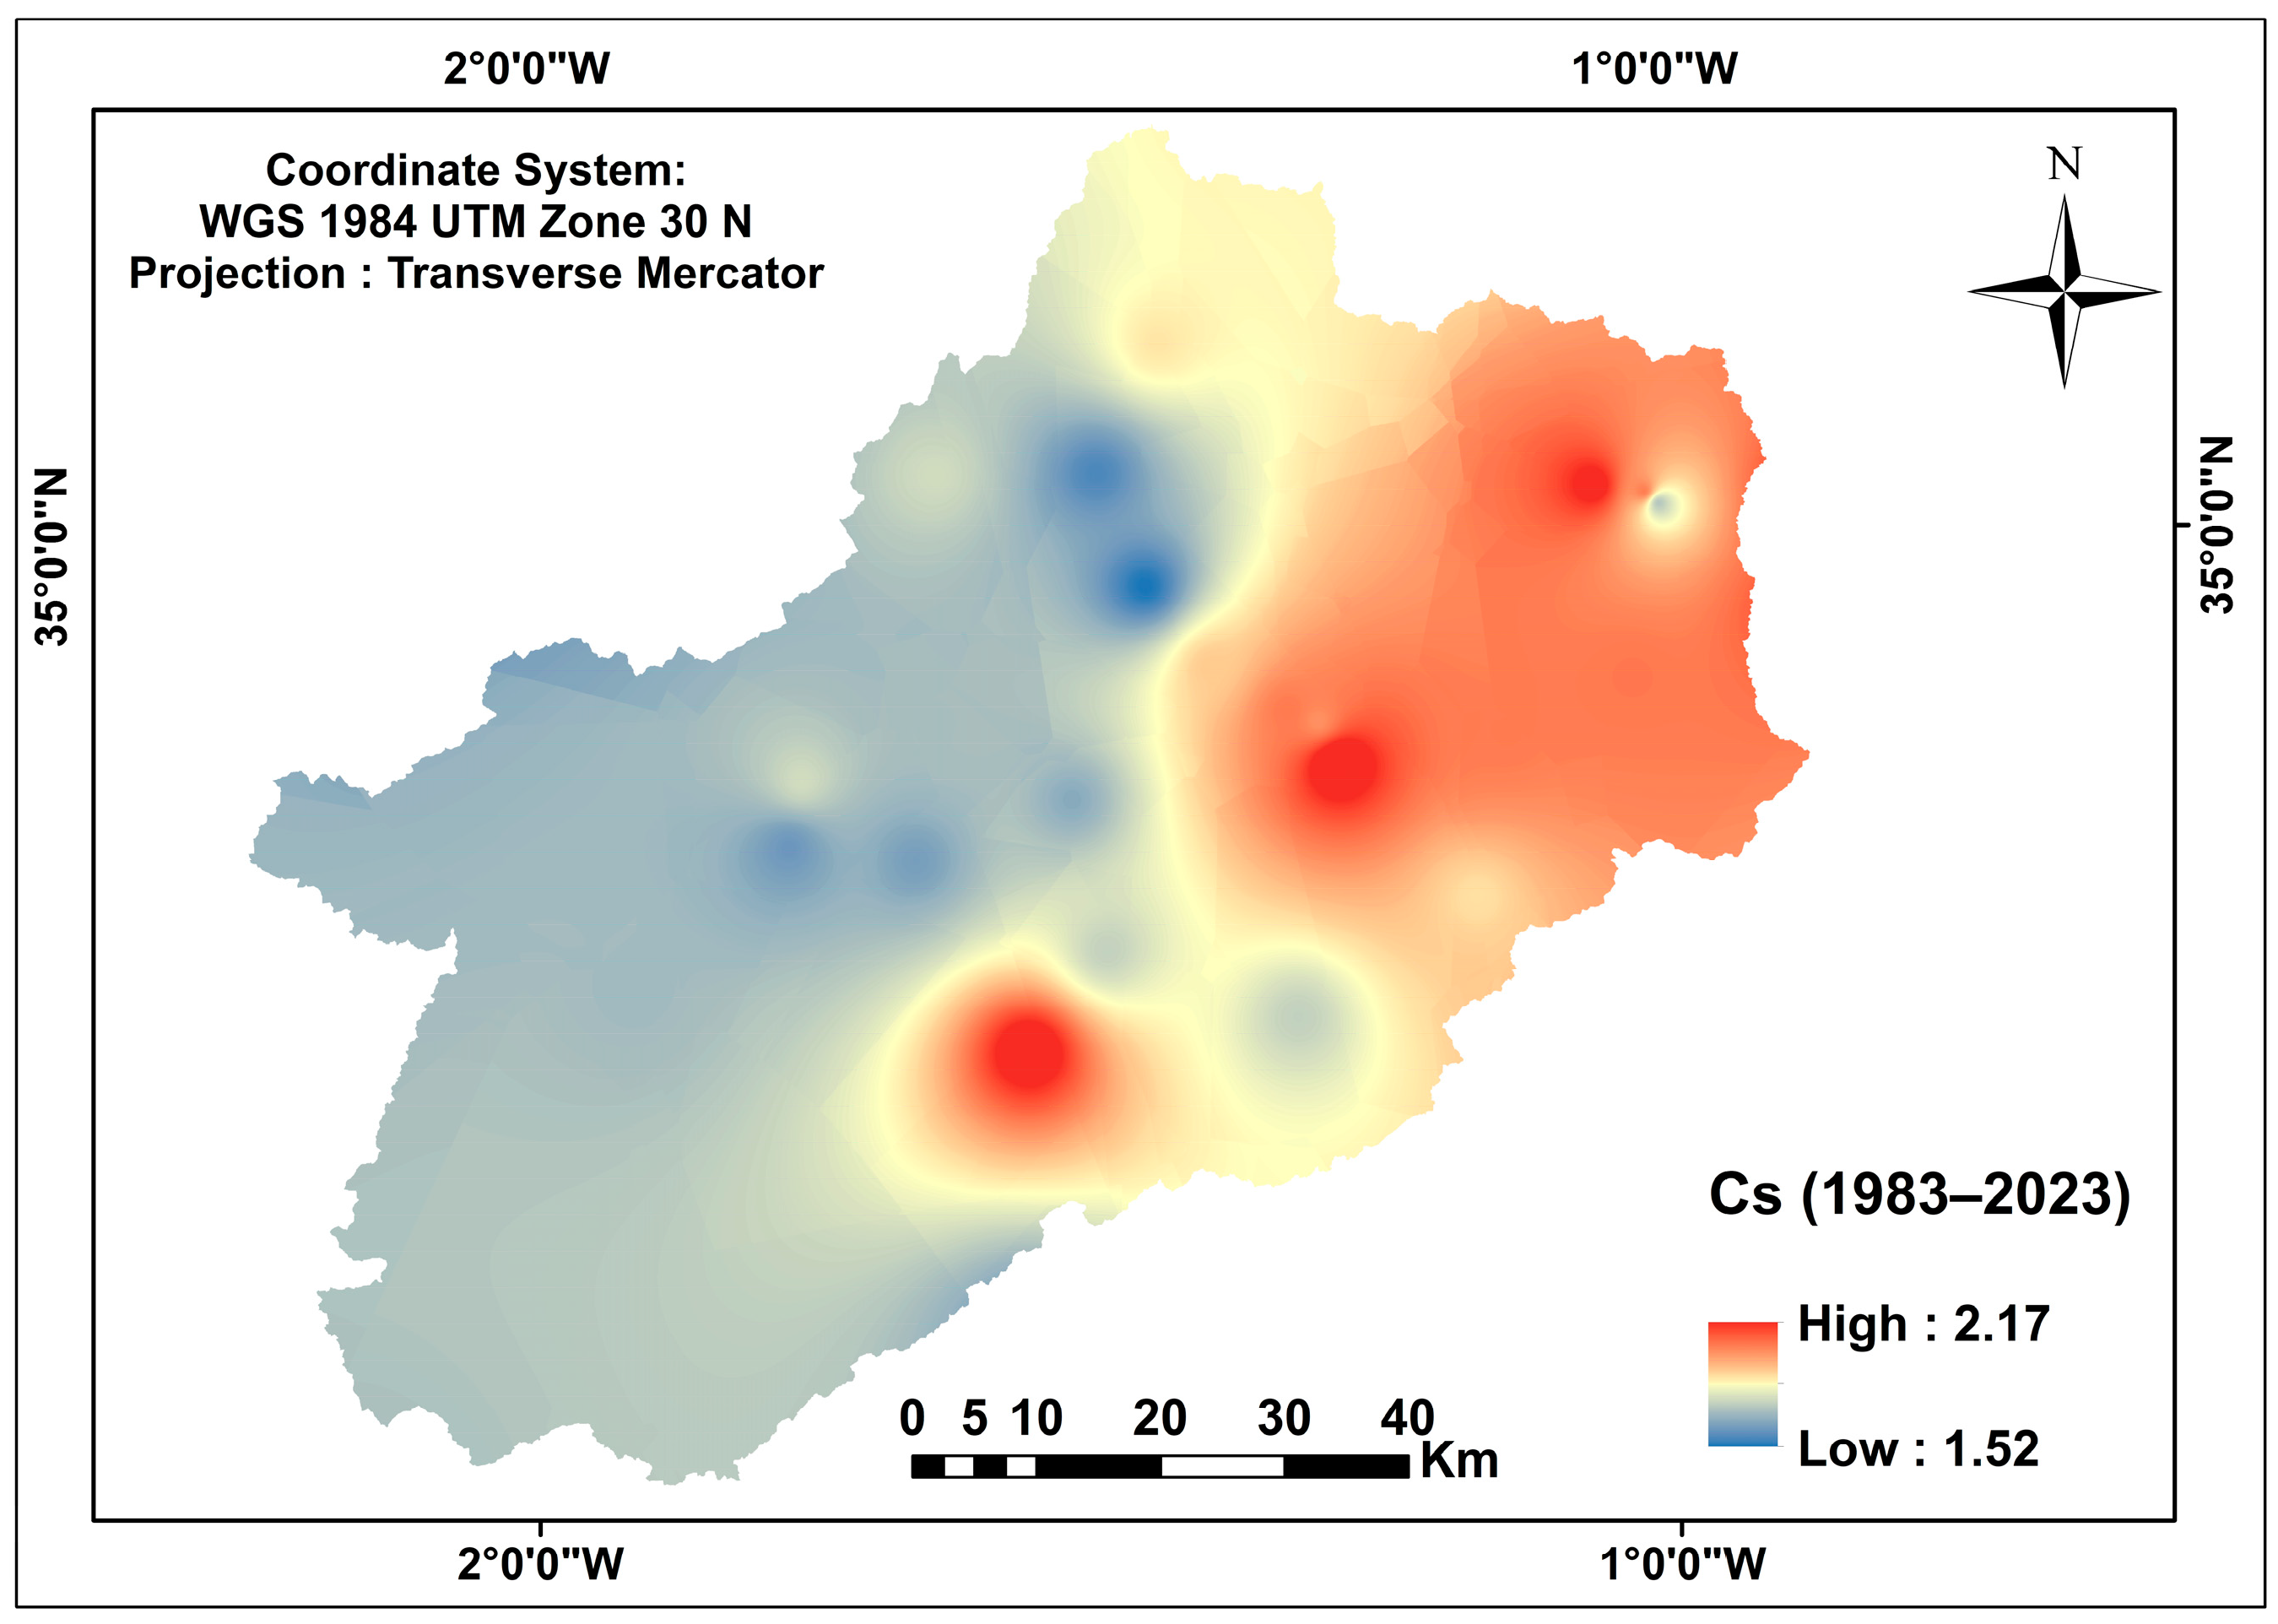
, the spatial distribution of the skewness coefficient (
Figure 10 and
Figure 11) highlights a clear gradient increasing from 1.51 in the northwest to 2.17 in the southeast of the basin. The lowest values are observed in the lower Mouillah sub-basin and the Maghnia plain, while the Tlemcen mountains and the interior plateaus exhibit the highest values.
The temporal evolution of the coefficient, analyzed over successive periods, reveals contrasting dynamics.
During the 1983–1985 period, localized areas in the northeast and central-south of the basin exhibited high skewness coefficients, indicating strong spatial irregularity in rainfall at the beginning of the study period. Between 1985 and 2000, more than 70% of the basin showed low skewness coefficients (1.35–1.50), suggesting a temporary spatial homogenization of rainfall distribution. From 2000 to 2015, areas characterized by high skewness coefficients (>1.7) gradually expanded, particularly in the northern and eastern parts of the basin. In the most recent period (2015–2023), nearly 60% of the basin exhibited elevated skewness coefficients, reflecting a significant increase in the spatio-temporal irregularity of rainfall compared to previous periods.
The relationship between rainfall skewness and erosive processes is confirmed at the spatial scale. Areas of high erosion, mainly located in mountainous regions, correspond to sectors with the highest skewness coefficients, suggesting that erosion is intensified by rare but intense rainfall events that generate concentrated and irregular runoff. Conversely, areas of low erosion, such as the Maghnia Plain, exhibit low skewness coefficients, indicating a more regular rainfall distribution associated with diffuse and less pronounced erosion.
Thus, the spatio-temporal irregularity of precipitation emerges as a key factor in shaping erosive dynamics: the higher the skewness, the more erosion tends to concentrate spatially, accentuating contrasts between highly and weakly eroded areas.
Cross-analysis of Cs and elevation (
Table 6) confirms this trend: mountainous areas (>1200 m) show the highest Cs values (up to 2.3) and intense erosion, whereas low plains (<400 m) display lower values
, corresponding to a more stable rainfall regime and sediment dynamics dominated by deposition.
These results demonstrate that the temporal variability of precipitation, combined with topography, largely controls the spatial and temporal distribution of erosion in the Tafna watershed. Integrating Cs into the analysis allows for the identification of the most vulnerable areas and helps prioritize soil management and conservation efforts.
3.8. Main Factors Influencing Soil Erosion: RUSLE Factors and Rainfall Skewness (Cs)
The correlation analysis between soil losses (A), the RUSLE factors (R, K, LS, C) and the rainfall skewness coefficient (Cs) (
Table 7) indicates that erosion in the Tafna watershed is primarily controlled by rainfall erosivity (R, r = 0.22) and topography (LS, r = 0.21). These results confirm that intense rainfall events and steep slopes amplify runoff and sediment transport. This approach helps identify the most influential variables in the watershed-scale erosion dynamics and assess the degree of interaction between natural and anthropogenic factors.
The results show that erosion is highly concentrated in the mountainous areas of the south and southeast (Tlemcen and Traras mountains), with soil losses exceeding 20 , associated with steep slopes (high LS), degraded vegetation cover (C > 0.4), and high skewness coefficients (Cs > 1.7). In contrast, the Maghnia plains exhibit lower values , with gentle slopes, stable soils, and low Cs (<1.5).
Correlation analysis (
Table 7) highlights that erosion is mainly controlled by rainfall erosivity (R, r = 0.21) and topography (LS, r = 0.27), while Cs is positively correlated with soil loss (r = 0.18) and R (r = 0.72). Pedological factors (K, r = −0.07) and vegetation cover (C, r = −0.12) exert a weaker influence at the watershed scale.
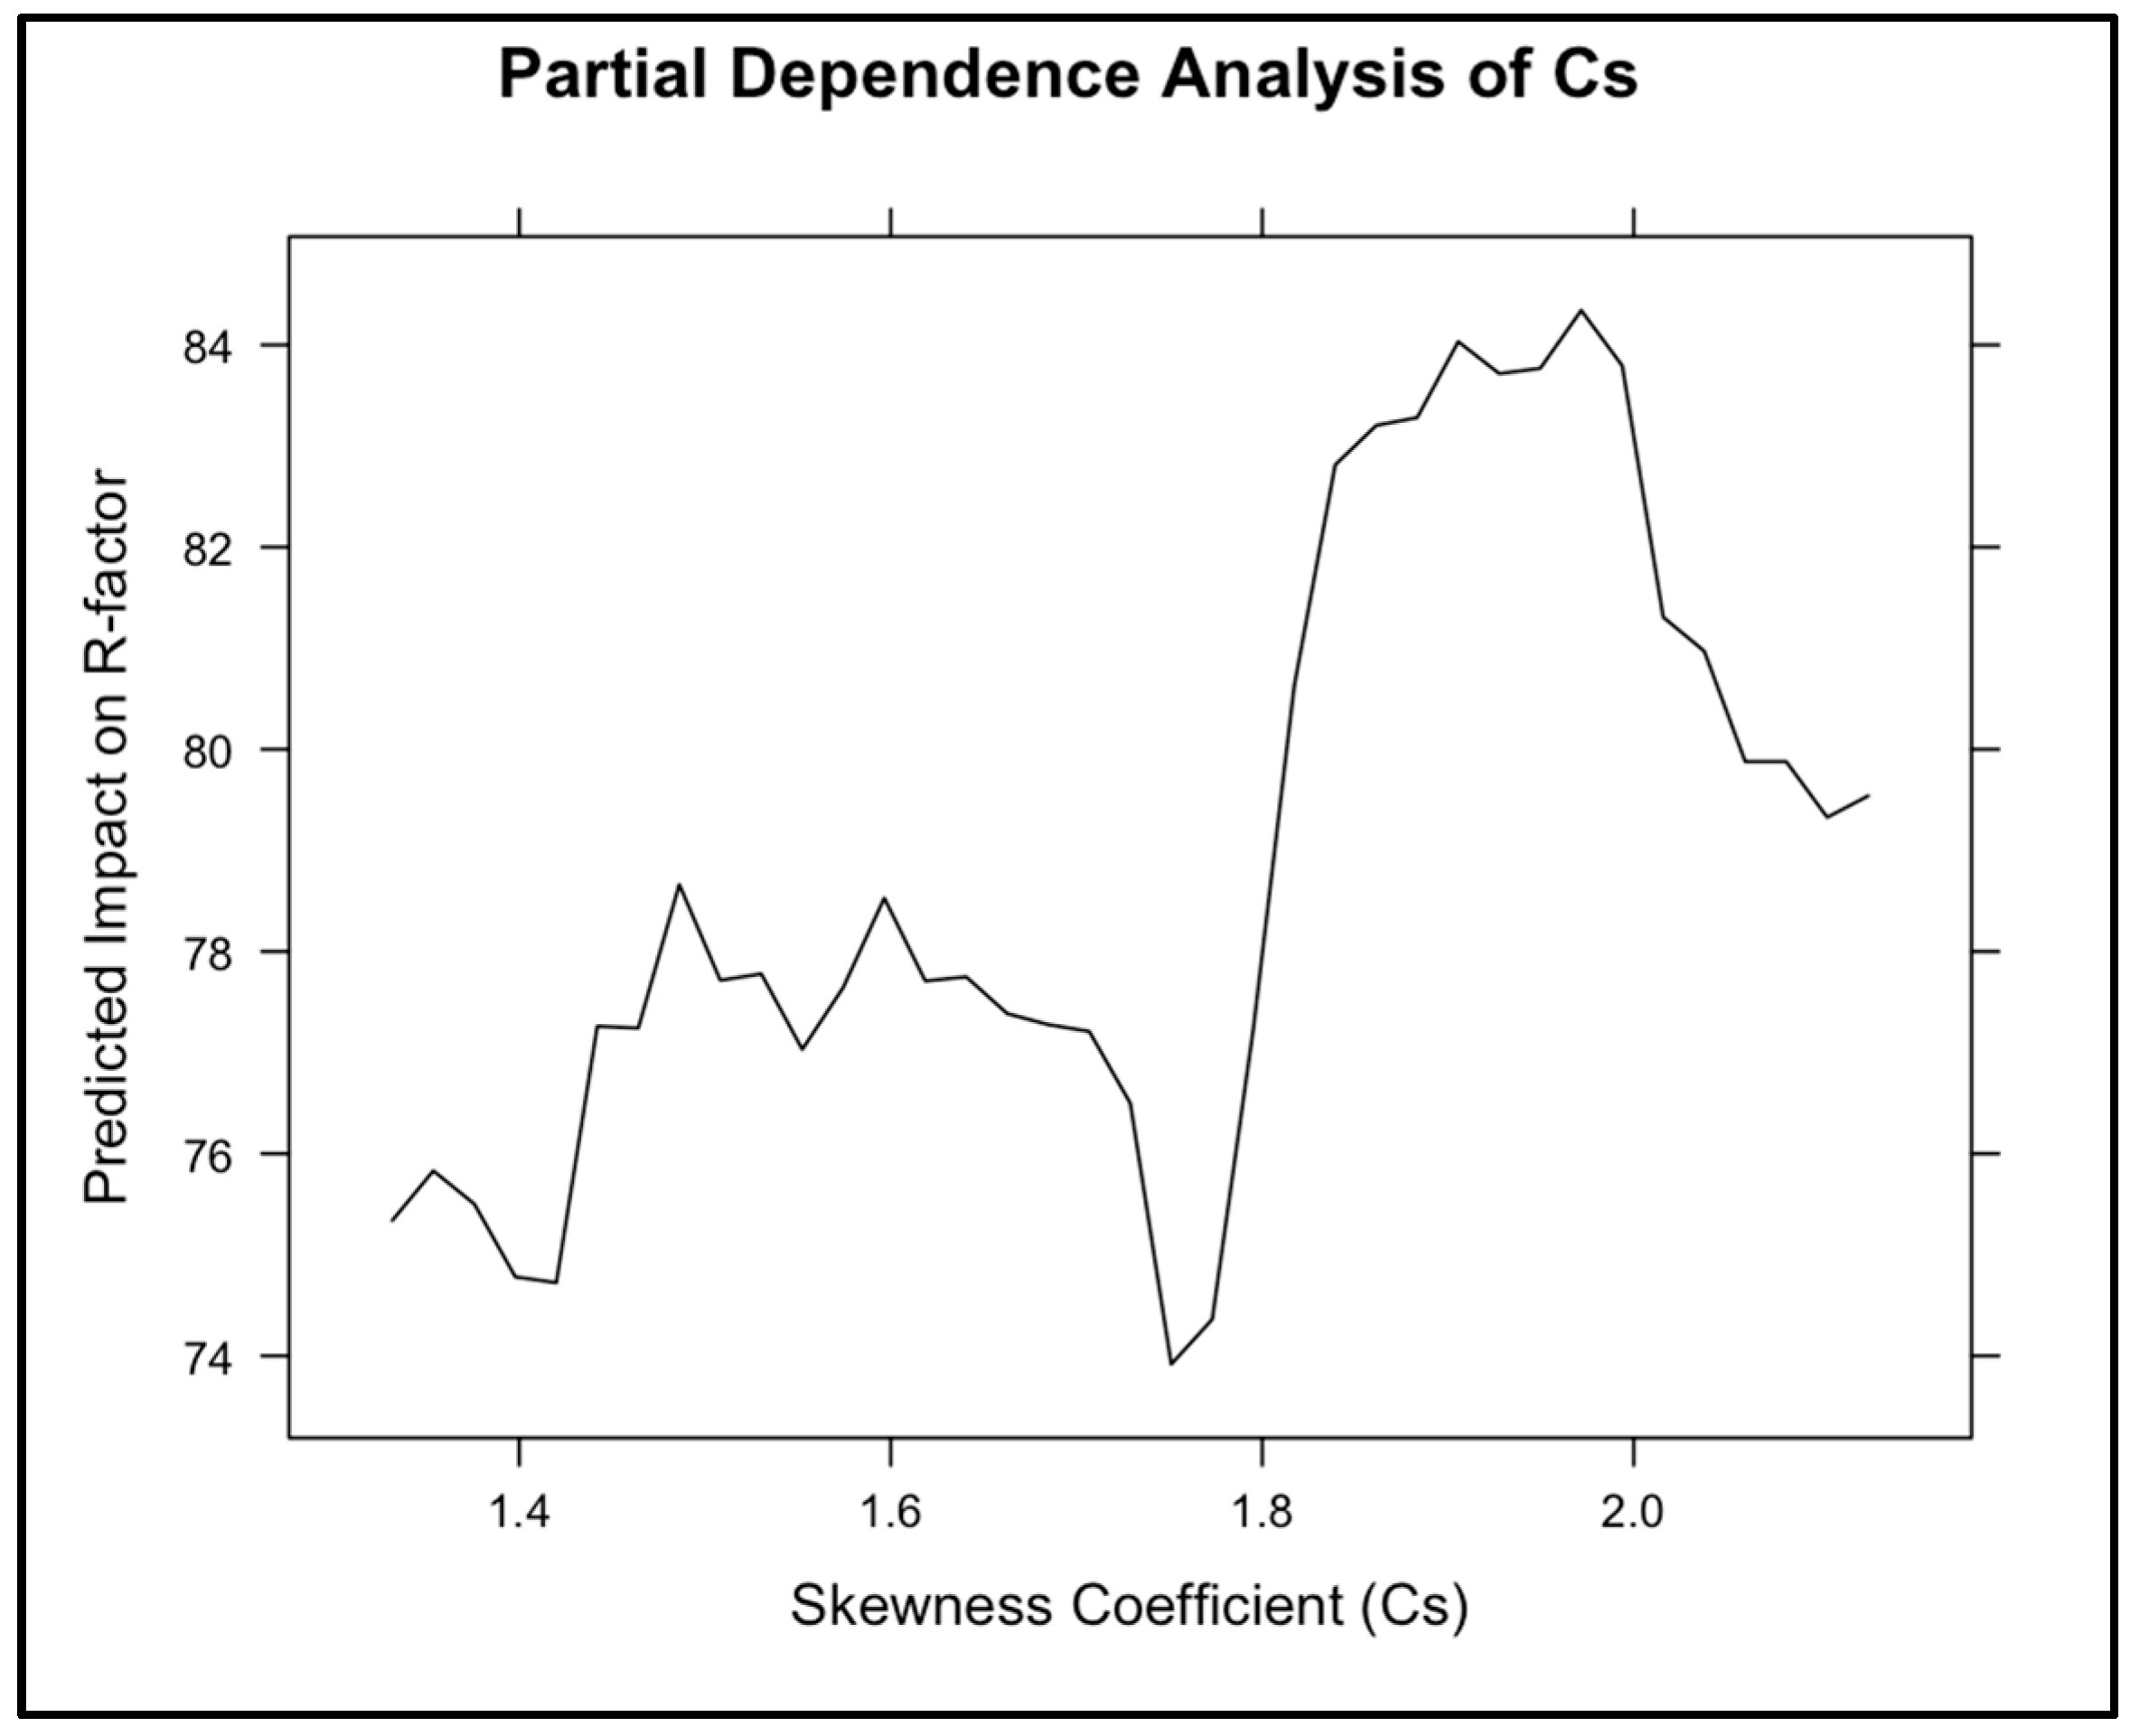
To evaluate the significance of the asymmetry coefficient (Cs) as a driver of soil erosivity beyond simple precipitation volumes, a Random Forest (RF) regression analysis was conducted across the entire study period (1983–2023). The model’s variable importance measures (
Table 8) demonstrate that Cs provides substantial explanatory power, with an Increase in Mean Squared Error (%IncMSE) of 11.5%. While annual precipitation (Pann) remains the primary predictor (37.1% IncMSE), the significant contribution of Cs confirms it is a distinct climatic driver rather than a redundant correlate. Furthermore, the Partial Dependence Plot (PDP) analysis reveals a non-linear relationship between Cs and R (
Figure 12). A critical threshold is observed at Cs ≈ 1.8, beyond which the predicted impact on erosivity increases sharply. This suggests that high rainfall asymmetry acts as an intensifier of erosive processes, justifying the inclusion of Cs as a supplementary indicator to refine RUSLE-based erosivity estimations in regions with high inter-annual variability.
4. Discussion
4.1. Interpretation of Spatiotemporal Trends and Rainfall Asymmetry
The temporal analysis of the R factor highlights a distinct bell-shaped evolution of erosivity over the last four decades. The initial period (1983–1985), although shorter, provides a crucial low-to-moderate erosivity baseline where 90% of the watershed remained below 72 . While shorter records can sometimes be skewed by isolated extreme events, our results suggest that this phase represents a relatively stable geomorphic state before the significant intensification of erosive power observed in the following decades. The subsequent periods (1985–2015) mark a clear climatic shift, with erosivity peaks reaching their maximum between 2000 and 2015, where 98% of the basin exceeded the 72 threshold.
A scientific contribution of this study is the exploration of the rainfall asymmetry coefficient in relation to the RUSLE parameters. The moderate degradation during the 1983–1985 period, despite the occurrence of some intense storms, can be explained by a lower concentration of rainfall within a few critical months compared to the 2000–2015 period. This suggests that specific sediment yield (SSY) in the Tafna basin is governed more by the “asymmetry” (temporal clustering) of rainfall than by annual cumulative totals. High asymmetry during the 2000–2015 period likely synchronized intense rainfall with periods of low vegetation cover (high C-factor), leading to the observed spatial expansion of highly erosive areas in the Tlemcen Mountains.
The integration of the rainfall asymmetry coefficient (Cs), calculated over the full 40-year period, provides further insight into these dynamics. The results reveal a strong positive correlation between Cs and the R-factor (r = 0.72), indicating that approximately 52% of the variance in rainfall erosivity is explained by the temporal asymmetry of precipitation. Spatial mapping confirms that high R and Cs values occur simultaneously, particularly in the southern mountainous regions of the watershed. This relationship suggests that the erosive power in the Tafna basin is significantly influenced by the temporal clustering of rainfall rather than by annual cumulative totals alone.
The significance of these high R and Cs values is further corroborated by bathymetric measurements from downstream reservoirs (
Table 1). Indeed, the highest sediment volumes are recorded in the three reservoirs of Hammam Boughrara, Sidi Abdelli, and Sikkak. The spatial coherence between our modeling and these physical measurements is striking: these three dams drain the exact mountainous areas where the highest R and Cs values were mapped. This convergence between climatic modeling (aggressivity and asymmetry) and actual sediment accumulation validates the reliability of our approach and highlights that erosion in the Tafna is driven by the temporal concentration of extreme events.
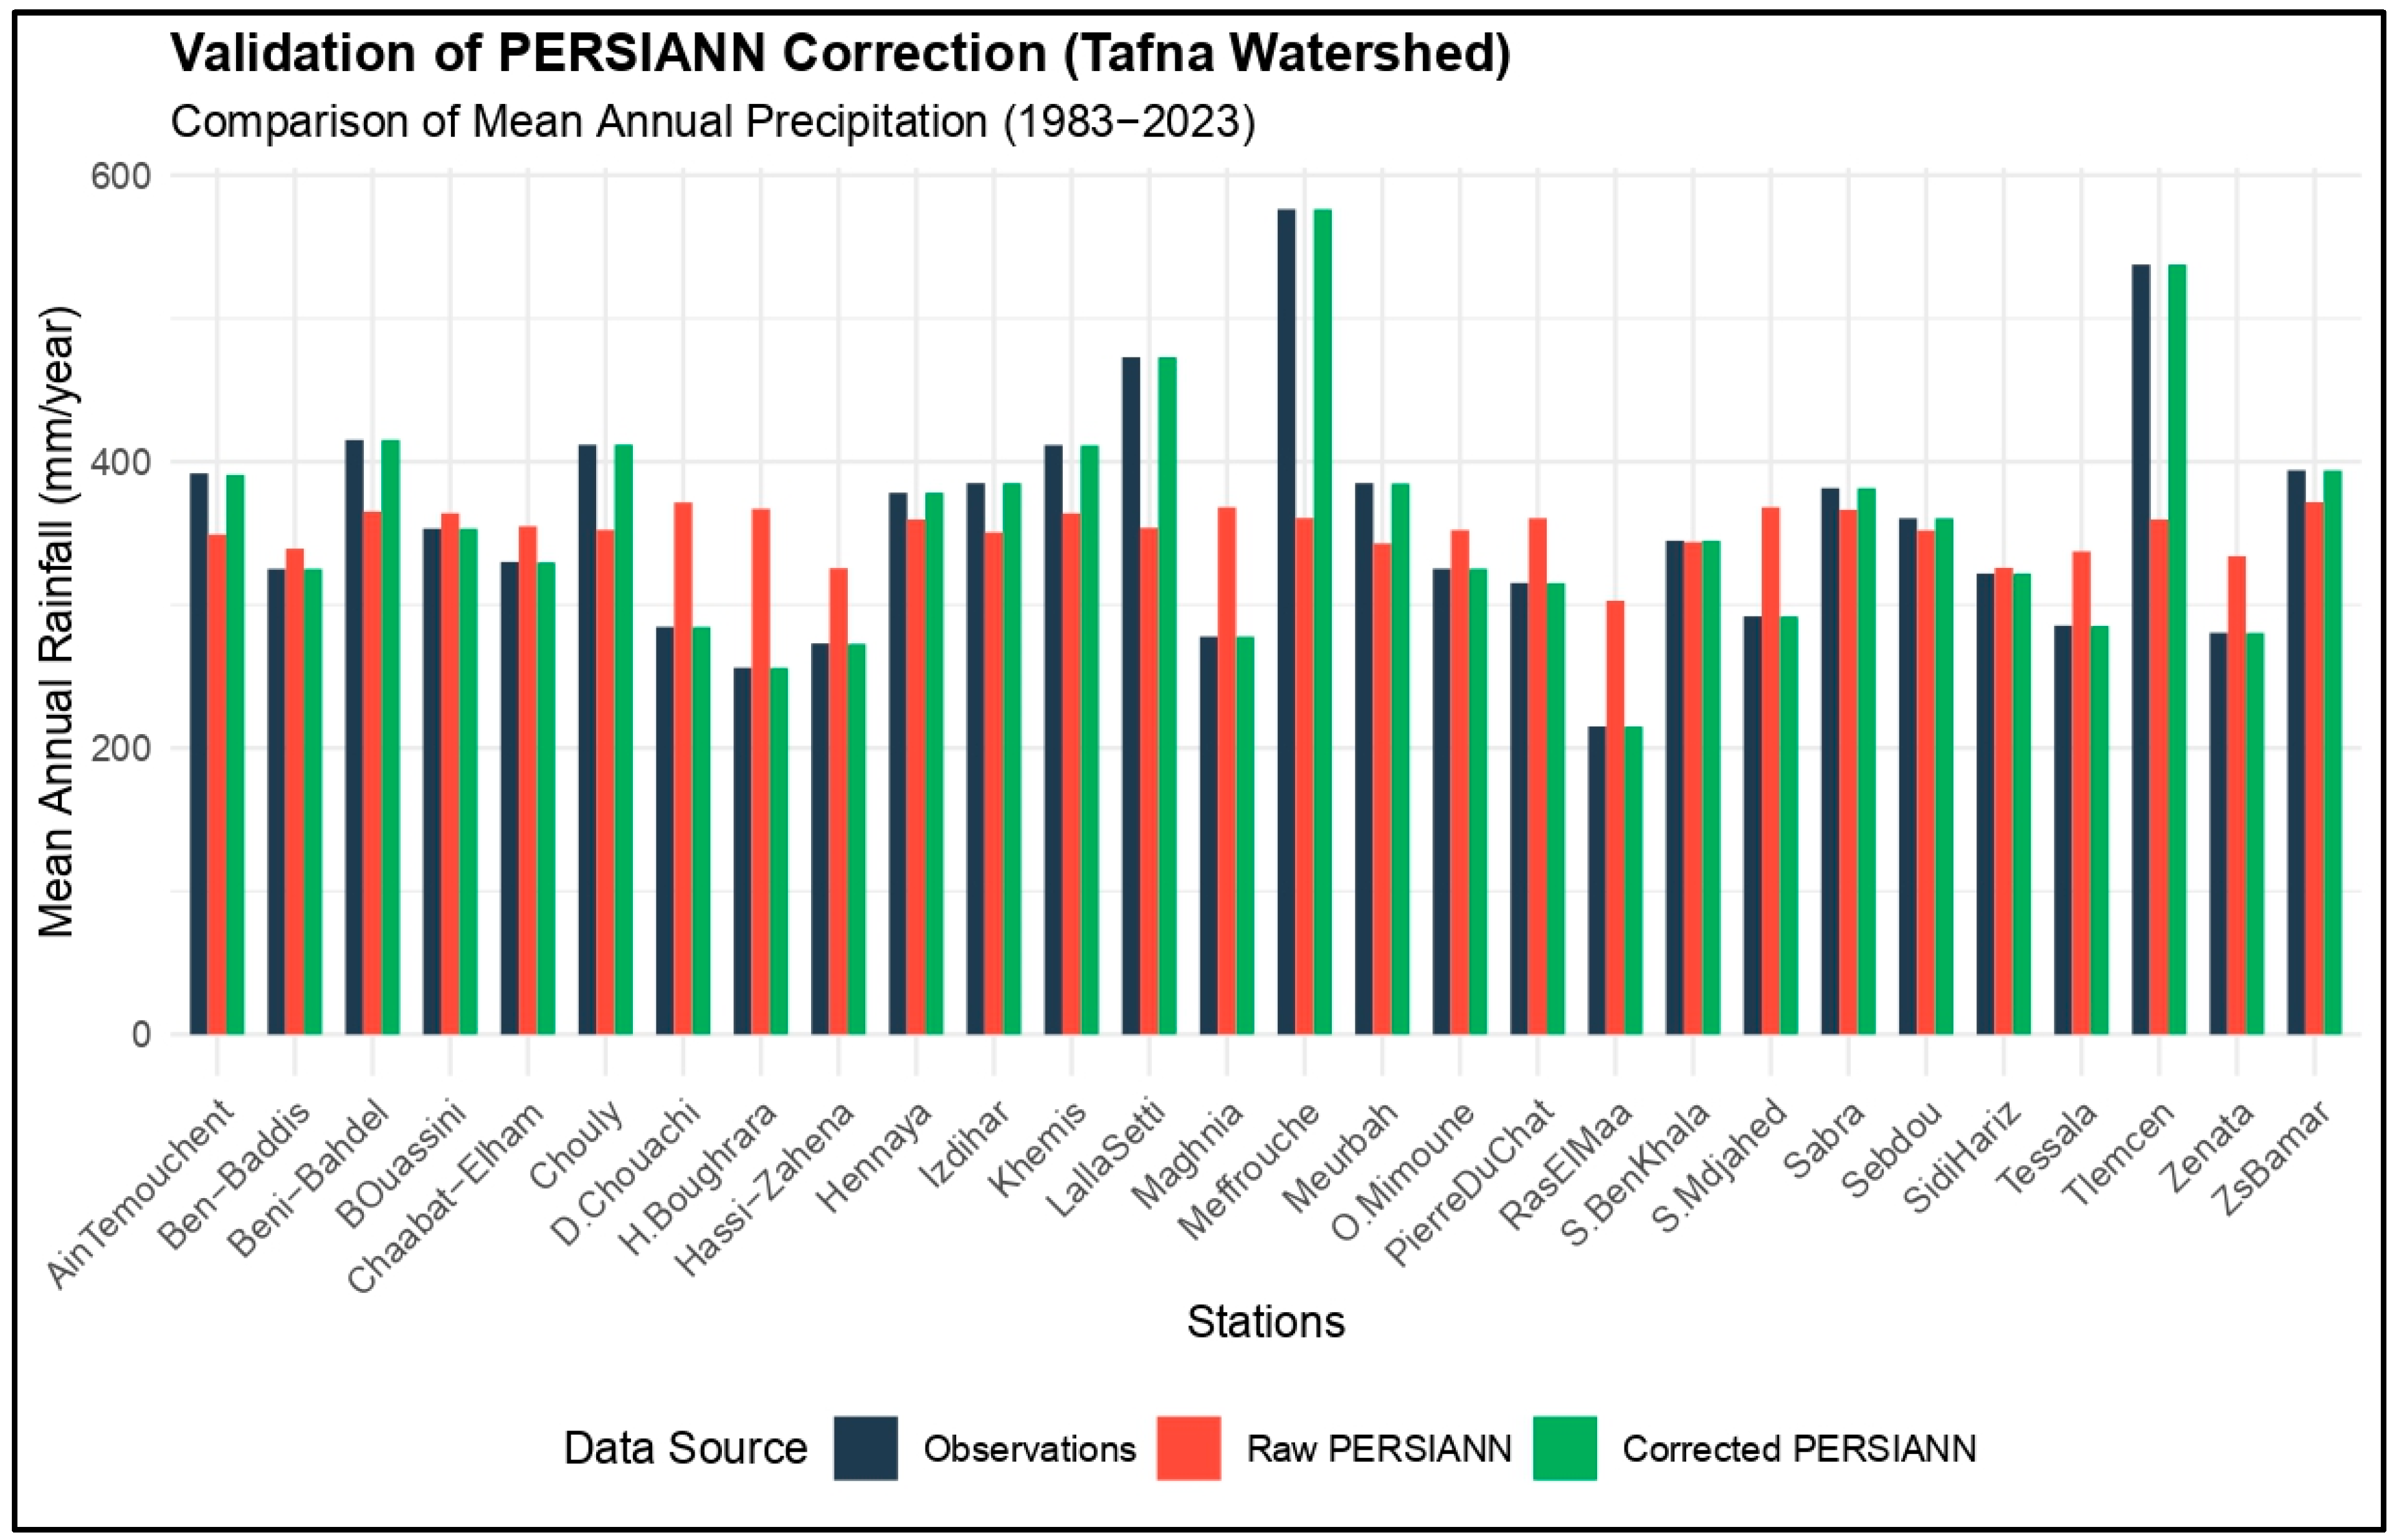
Finally, the recent decrease observed in the 2015–2023 period, where only 27% of the area remains in the high-erosivity category, indicates a potential relative easing of climatic pressure, although values remain significantly higher than the 1983 baseline. By partitioning the analysis into four periods dictated by NDVI availability, we demonstrate that soil erosion dynamics are highly sensitive to decadal climatic pulses. This underscores the necessity of using satellite-derived rainfall like PERSIANN-CDR to capture these fluctuations, providing a nuanced diagnostic for sustainable land management and the protection of hydraulic infrastructure in Mediterranean environments.
4.2. K Factor (Erodability)
The area-weighted mean K factor, representing soil erodibility in the Tafna watershed, is approximately . This value is comparable to other semi-arid and Mediterranean basins, with extremes ranging from 0.013 to 0.0228 . Locally, K values above 0.020 correspond to sandy and silty-sand soils, highlighting pockets of high vulnerability that require targeted conservation measures.
Similar ranges of soil erodibility have been reported in other Algerian and Maghrebian watersheds, confirming that the observed K values fall within expected limits for semi-arid Mediterranean environments [
15,
63]. These results suggest that soil erodibility contributes to erosion susceptibility and locally enhances soil loss, particularly when associated with steep slopes and high rainfall erosivity.
4.3. LS Factor (Topography)
Steep slopes (>20%) play a major role in controlling soil loss, confirming the dominant role of relief. High LS values in the Tlemcen and Traras mountains intensify runoff and erosion, consistent with studies in the Oued Mina, Ksob, and Isser basins [
15,
64,
70].
The decline in vegetation cover between 1985 and 2000 facilitated increased erosion, while its recovery up to 2023 contributed to soil stabilization. These observations align with regional and international studies [
7,
11,
15]. From a process-based perspective, high LS values increase flow velocity and runoff concentration, reduce infiltration, and enhance the detachment and transport capacity of surface flow. Consequently, even moderate rainfall events can generate substantial soil loss in steep and dissected terrains. The influence of topography is further enhanced when steep slopes coincide with intense and temporally irregular rainfall, suggesting strong interactions between topographic and climatic controls on erosion.
4.4. C Factor (Vegetation Cover)
Vegetation cover plays a key protective role against soil erosion. The reduction in vegetation cover between 1985 and 2000 contributed to increased soil loss, whereas its recovery by 2023 promoted soil stabilization, particularly on moderate slopes. Similar trends have been reported in the Oued Isser, Ksob, and Sahouat basins, where poorly vegetated surfaces exhibit the highest erosion rates [
15,
64,
75]. At the watershed scale, the C factor does not primarily control the spatial distribution of erosion, which is mainly governed by topography and rainfall characteristics. However, vegetation cover plays a critical role in modulating erosion intensity by reducing raindrop impact, enhancing infiltration, and limiting surface runoff, particularly in areas characterized by moderate slopes. The effectiveness of vegetation in reducing erosion depends on its interaction with local topographic and climatic conditions, suggesting that degraded vegetation cover may exacerbate soil loss when combined with steep slopes or intense rainfall.
4.5. P Factor (Soil Conservation Practices)
The slope-based spatialization of the
p factor represents a clear improvement over the assumption of a uniform P = 1 across the watershed. By accounting for topographic variability, this approach reduces the potential overestimation of erosion in gently sloping areas where conservation practices are more likely to be effective, while maintaining realistic estimates in steep and poorly protected zones. This representation is particularly suitable for large semi-arid watersheds lacking detailed inventories of conservation structures. Numerous studies have demonstrated that practices such as contour farming, terracing, and strip cropping can substantially reduce runoff and soil loss, especially on sloping land [
14,
41]. In contrast, studies conducted in the Bouregreg watershed (Morocco) report the absence of significant conservation practices (P = 1), which increases vulnerability to erosion [
76]. The P-factor values reported in
Table 4 are consistent with this interpretation, showing higher
p values in steep areas and lower values in gently sloping zones across the Tafna watershed.
4.6. General Dynamics and Drivers of Soil Loss
The spatiotemporal analysis reveals that soil loss in the Tafna watershed followed a non-linear trajectory, increasing from
in the mid-1980s to a peak of
by 2000, before receding to
in the most recent period. This evolution reflects the complex interplay between decadal climatic fluctuations, specifically the intensification of rainfall erosivity, and anthropogenic pressures on vegetation cover. Our findings align closely with regional literature in the Maghreb: the reported rates are consistent with the Oued Isser basin (avg. 7.4 with peaks of
) [
77], the Oued El Maleh (
) [
11], and the Tahaddart basin in Morocco (
) [
7]. These cross-comparisons not only validate the magnitude of our estimates but also confirm the reliability of the integrated RUSLE-GIS framework in capturing the geomorphic signatures of semi-arid Mediterranean catchments.
Correlation analysis (
Table 8) indicates that erosion is primarily governed by topography and rainfall erosivity. Furthermore, the rainfall skewness coefficient shows a strong correlation with the R-factor, suggesting that erosive power in the Tafna is dictated more by the temporal concentration of precipitation events than by annual cumulative totals.
Spatially, the highest erosion rates are concentrated in the rugged terrains of the Tlemcen and Traras Mountains. These high-elevation sectors act as primary sediment source areas (hotspots), characterized by steep slopes, degraded vegetation (C > 0.4), and high skewness coefficients (Cs . In contrast, the Maghnia plains exhibit relative stability due to gentle slopes and lower rainfall asymmetry (Cs < 1.5), which naturally attenuate erosive energy.
The geomorphic connectivity between these upstream hotspots and downstream infrastructure is confirmed by bathymetric surveys. The highest sedimentation volumes are recorded in the Beni Bahdel, Boughrara, Sidi Abdelli, and Sikkak reservoirs, which drain the exact mountainous sectors identified as highly erosive. This spatial coherence between modeled soil loss and independent sediment accumulation data provides a robust qualitative validation of the study’s results.
The sustained erosion levels between 1985 and 2015 highlight the extreme vulnerability of the basin to vegetation degradation. This diagnostic provides a strategic baseline for prioritizing conservation efforts, such as reforestation and terracing in the southern mountains, to prolong the operational lifespan of vital water storage infrastructure in the region.
Finally, this study provides essential qualitative validation through the alignment of model results with field observations. The concentration of erosion in the southern and southeastern mountainous areas perfectly matches the high sedimentation volumes recorded in the Beni Bahdel, Boughrara, and Sidi Abdelli reservoirs. These infrastructures, located downstream of the primary erosive sectors, confirm through bathymetric data the reliability of the RUSLE model coupled with GIS. This integrated approach, utilizing corrected satellite data to overcome the scarcity of ground measurements, proves to be a robust diagnostic tool for soil conservation planning in large, heterogeneous Mediterranean basins.
4.7. Integrated Effects and Correlation Analysis
The integrated analysis highlights the combined influence of rainfall characteristics, topography, soil properties, vegetation cover, and conservation practices on soil erosion in the Tafna watershed. Rather than being controlled by a single factor, soil erosion results from the interaction of multiple drivers acting across contrasting physiographic units. Correlation analysis reveals weak to moderate linear relationships between soil loss and individual RUSLE factors, including rainfall intensity and topography. These relatively low Pearson correlation values reflect the multiplicative and non-linear nature of the RUSLE model, as well as the strong interactions between controlling factors across heterogeneous landscapes. In particular, the combined effect of rainfall intensity, temporal irregularity of precipitation (represented by the skewness coefficient, Cs), and slope conditions plays a key role in shaping erosion-prone environments. High erosivity areas coincide with mountainous regions where steep slopes enhance flow velocity and concentrate rainfall, intensifying erosion [
77,
78]. In contrast, soil erodibility (K), vegetation cover (C), and conservation practices (P) exhibit weaker linear relationships with total soil loss at the basin scale. These factors do not primarily determine the spatial distribution of erosion but instead modulate erosion intensity at the local scale, either amplifying soil loss under unfavorable climatic and topographic conditions or mitigating erosion through improved vegetation cover and conservation measures. Overall, the integrated interpretation confirms that soil erosion in the Tafna watershed is structured by the interaction between rainfall intensity, rainfall temporal irregularity, and topography, while soil properties, vegetation cover, and conservation practices regulate erosion intensity at finer spatial scales.
Beyond linear correlation analysis, the Random Forest results provide robust evidence that rainfall asymmetry plays an independent and non-linear role in controlling rainfall erosivity. While annual precipitation controls the overall magnitude of erosivity, high values of the asymmetry coefficient act as an intensifier by concentrating rainfall into fewer, more extreme events. The identified threshold around Cs ≈ 1.8 highlights a transition toward highly erosive rainfall regimes, particularly relevant in semi-arid Mediterranean environments. These findings support the use of Cs as a supplementary climatic indicator to refine RUSLE-based erosion assessments in regions characterized by strong inter-annual rainfall variability.
4.8. Management Implications & Limitations
From a watershed management perspective, the results identify priority sub-basins for soil conservation, particularly the mountainous areas of the Tlemcen and Traras ranges. These sectors combine steep slopes, high rainfall intensity and irregularity, and locally degraded vegetation cover, making them the main contributors to soil loss and reservoir siltation. Targeted measures such as reforestation, agricultural terracing, slope stabilization, and improved agricultural practices can effectively reduce erosion. Some limitations of the adopted approach should be acknowledged. Despite the improved slope-based representation of the p factor, uncertainties remain due to limited information on conservation structures, the spatial resolution of soil and land-cover data, and the long-term average nature of the RUSLE model. These limitations do not affect the robustness of the identified spatial patterns but should be considered when interpreting the results and guiding future research.
5. Conclusions
This study assessed soil water erosion in the Tafna watershed (north-western Algeria) using the RUSLE model integrated with GIS over multiple periods between 1985 and 2023 to analyze spatio-temporal erosion dynamics in a semi-arid environment. The results reveal marked spatial and temporal variability in soil loss, primarily structured by the interaction between rainfall intensity and temporal irregularity, topography, and, to a lesser extent, soil properties, vegetation cover, and conservation practices. The most erosion-prone areas are located in the mountainous sectors of the Tlemcen and Traras ranges, where steep slopes, irregular and intense rainfall, and locally degraded vegetation combine to intensify erosion, while plains with reduced vegetation cover also exhibit notable soil loss. The inclusion of rainfall temporal irregularity highlights the key role of extreme precipitation events in accelerating erosion processes, particularly in relief areas. Overall, the study confirms the suitability of the RUSLE–GIS approach for identifying erosion hotspots and priority zones for soil conservation, providing a robust scientific basis to support targeted watershed management measures such as vegetation restoration, slope stabilization, and improved agricultural practices. These findings contribute to a better understanding of erosion processes in semi-arid Mediterranean basins and offer valuable insights for sustainable soil and water resource management under increasing climatic variability.