1. Introduction
As a vital component of the ecosystem service classification framework, cultural ecosystem services (CESs) are explicitly defined as “non-material benefits that humans obtain from ecosystems”, encompassing cultural diversity, spiritual beliefs, aesthetic values, and other related aspects [
1]. Compared to provisioning, regulating, and supporting services, CESs place greater emphasis on the spiritual and cultural value derived from ecosystems. Their intangible nature makes them difficult to measure directly using traditional economic indicators, making them both a focal point and a challenge in ecosystem service assessment [
2]. Against the backdrop of accelerating global urbanization, the contradiction between the ecological fragmentation caused by high-density development and the growing spiritual and cultural needs of residents is becoming increasingly prominent [
3]. Within rapidly expanding metropolitan areas, the fragmentation of natural landscapes and the compression of cultural heritage spaces not only diminish the capacity to provide ecosystem services [
4] but also exacerbate spatial imbalances in the supply–demand relationship of CESs [
5]. Therefore, accurately identifying the supply–demand matching patterns of CESs and revealing their formation mechanisms has become a core scientific issue that urgently needs to be addressed in national spatial planning and regional ecological governance [
6]. Recent urban ecosystem service research further argues that the relevance of CESs for planning is heightened in metropolitan settings, where cultural meanings, access opportunities, and landscape qualities are jointly shaped by multi-level governance and uneven spatial development, rather than by site conditions alone [
7].
With the integration of multi-source data and diverse methodologies, CES assessment research has shifted its focus from primarily examining supply in economic and environmental dimensions to exploring the interplay between supply and demand across social and cultural dimensions. For instance, Dang et al. combined questionnaire surveys with social media comments to construct supply–demand ratios and spatial correlation indicators. Their analysis identified relatively high educational service matching rates, while most regions exhibited a significant supply–demand imbalance [
8]. Furthermore, in their study of the Beijing–Tianjin–Hebei region, Sun et al. incorporated urban–rural gradients and socioeconomic attributes into the recreational service supply–demand model. They identified differences in recreational service preferences and accessibility among various groups, providing quantitative evidence for integrated urban–rural planning [
9]. Currently, assessments of CESs primarily focus on individual objects at the administrative regional scale, encompassing studies ranging from regional to global scales, watershed research, urban regional studies, and metropolitan area research. Alternatively, evaluations may be conducted at smaller scales, such as assessing the CES value of individual parks or scenic areas [
10]. While some studies examine ecosystem services in urban agglomerations [
11], systematic research on the distribution and evolution of CESs in metropolitan areas remains limited. A key reason is that metropolitan CESs are often “reorganized” across jurisdictions through mobility, accessibility, and spatial flows of benefits. As a result, supply–demand relationships cannot always be interpreted within a single administrative unit or at the site scale but increasingly require a metropolitan-system perspective that considers how CES opportunities and beneficiaries are connected across space [
12].
To quantify the supply of CESs, researchers initially adopted methods including resource inventories and surveys, satellite remote sensing and geographic information systems, and economic assessments [
13,
14,
15]. In recent years, more mechanistically complex models have been developed and applied in practice. For instance, the SolVES model integrates social value questionnaire survey data with environmental data to directly quantify and spatially visualize the perceived social value of CESs [
16]. The MaxEnt model is essentially a machine-learning-based species distribution model that predicts the potential spatial distribution probability of CESs by leveraging relationships between known CES occurrence points and environmental variables [
17]. The model excels due to its low sample-size requirements, accurate predictive performance, and capacity to output environmental-variable contribution rates. These strengths make it suitable for extrapolating point-based survey data to county- and regional-level scales, revealing hotspots in CES supply and elucidating underlying mechanisms. For CES demand quantification, mainstream approaches now include structured questionnaires, interviews, focus group discussions, and Public Participation Geographic Information Systems (PPGIS) [
18,
19]. However, these methods are often limited by respondents’ subjective biases [
20]. They are mainly suitable for small-scale study areas and are difficult to use at the metropolitan scale.
In addition, the interrelationships among CESs are often overlooked. Accurately identifying trade-offs and synergies between CESs is crucial for optimizing ecological spatial layouts, avoiding management conflicts, and maximizing cultural service benefits—a core element in building sustainable socio-ecological systems. Although some scholars, through analyzing crowdsourced reviews of urban green spaces in Florida, USA, found widespread synergies among CESs and identified six key CES bundles [
21], other scholars have also noted, through reviews, that biodiversity and CESs are not always positively correlated, with their relationship significantly influenced by spatial scale and the degree of human intervention [
22]. Notably, clustering methods have demonstrated potential for analyzing supply–demand matching relationships in integrated ecosystem services research [
23], including K-means, hierarchical, and self-organizing map (SOM) clustering. Among these, SOM, an unsupervised neural network method, offers advantages over traditional clustering algorithms, such as K-means, for handling nonlinear, high-dimensional data. It effectively preserves the topological structure of data, thereby revealing the complex relationships between CES supply and demand patterns with greater precision. However, overall, the application of clustering analysis methods in the CES field remains in its infancy, particularly in the quantitative analysis of trade-offs and synergies among services within clusters [
24]. In the complex spatial context of metropolitan areas, the driving factors influencing CES supply and demand are not well understood. Furthermore, insufficient identification and classification of intra-CES cluster variations hinder the development of regionally differentiated governance strategies. Therefore, there is an urgent need to introduce models such as the Optimal Parameters-based Geographical Detector (OPGD) to precisely quantify the explanatory power and interactions among various drivers of CES supply–demand patterns, thereby providing a scientific basis for targeted zoning management.
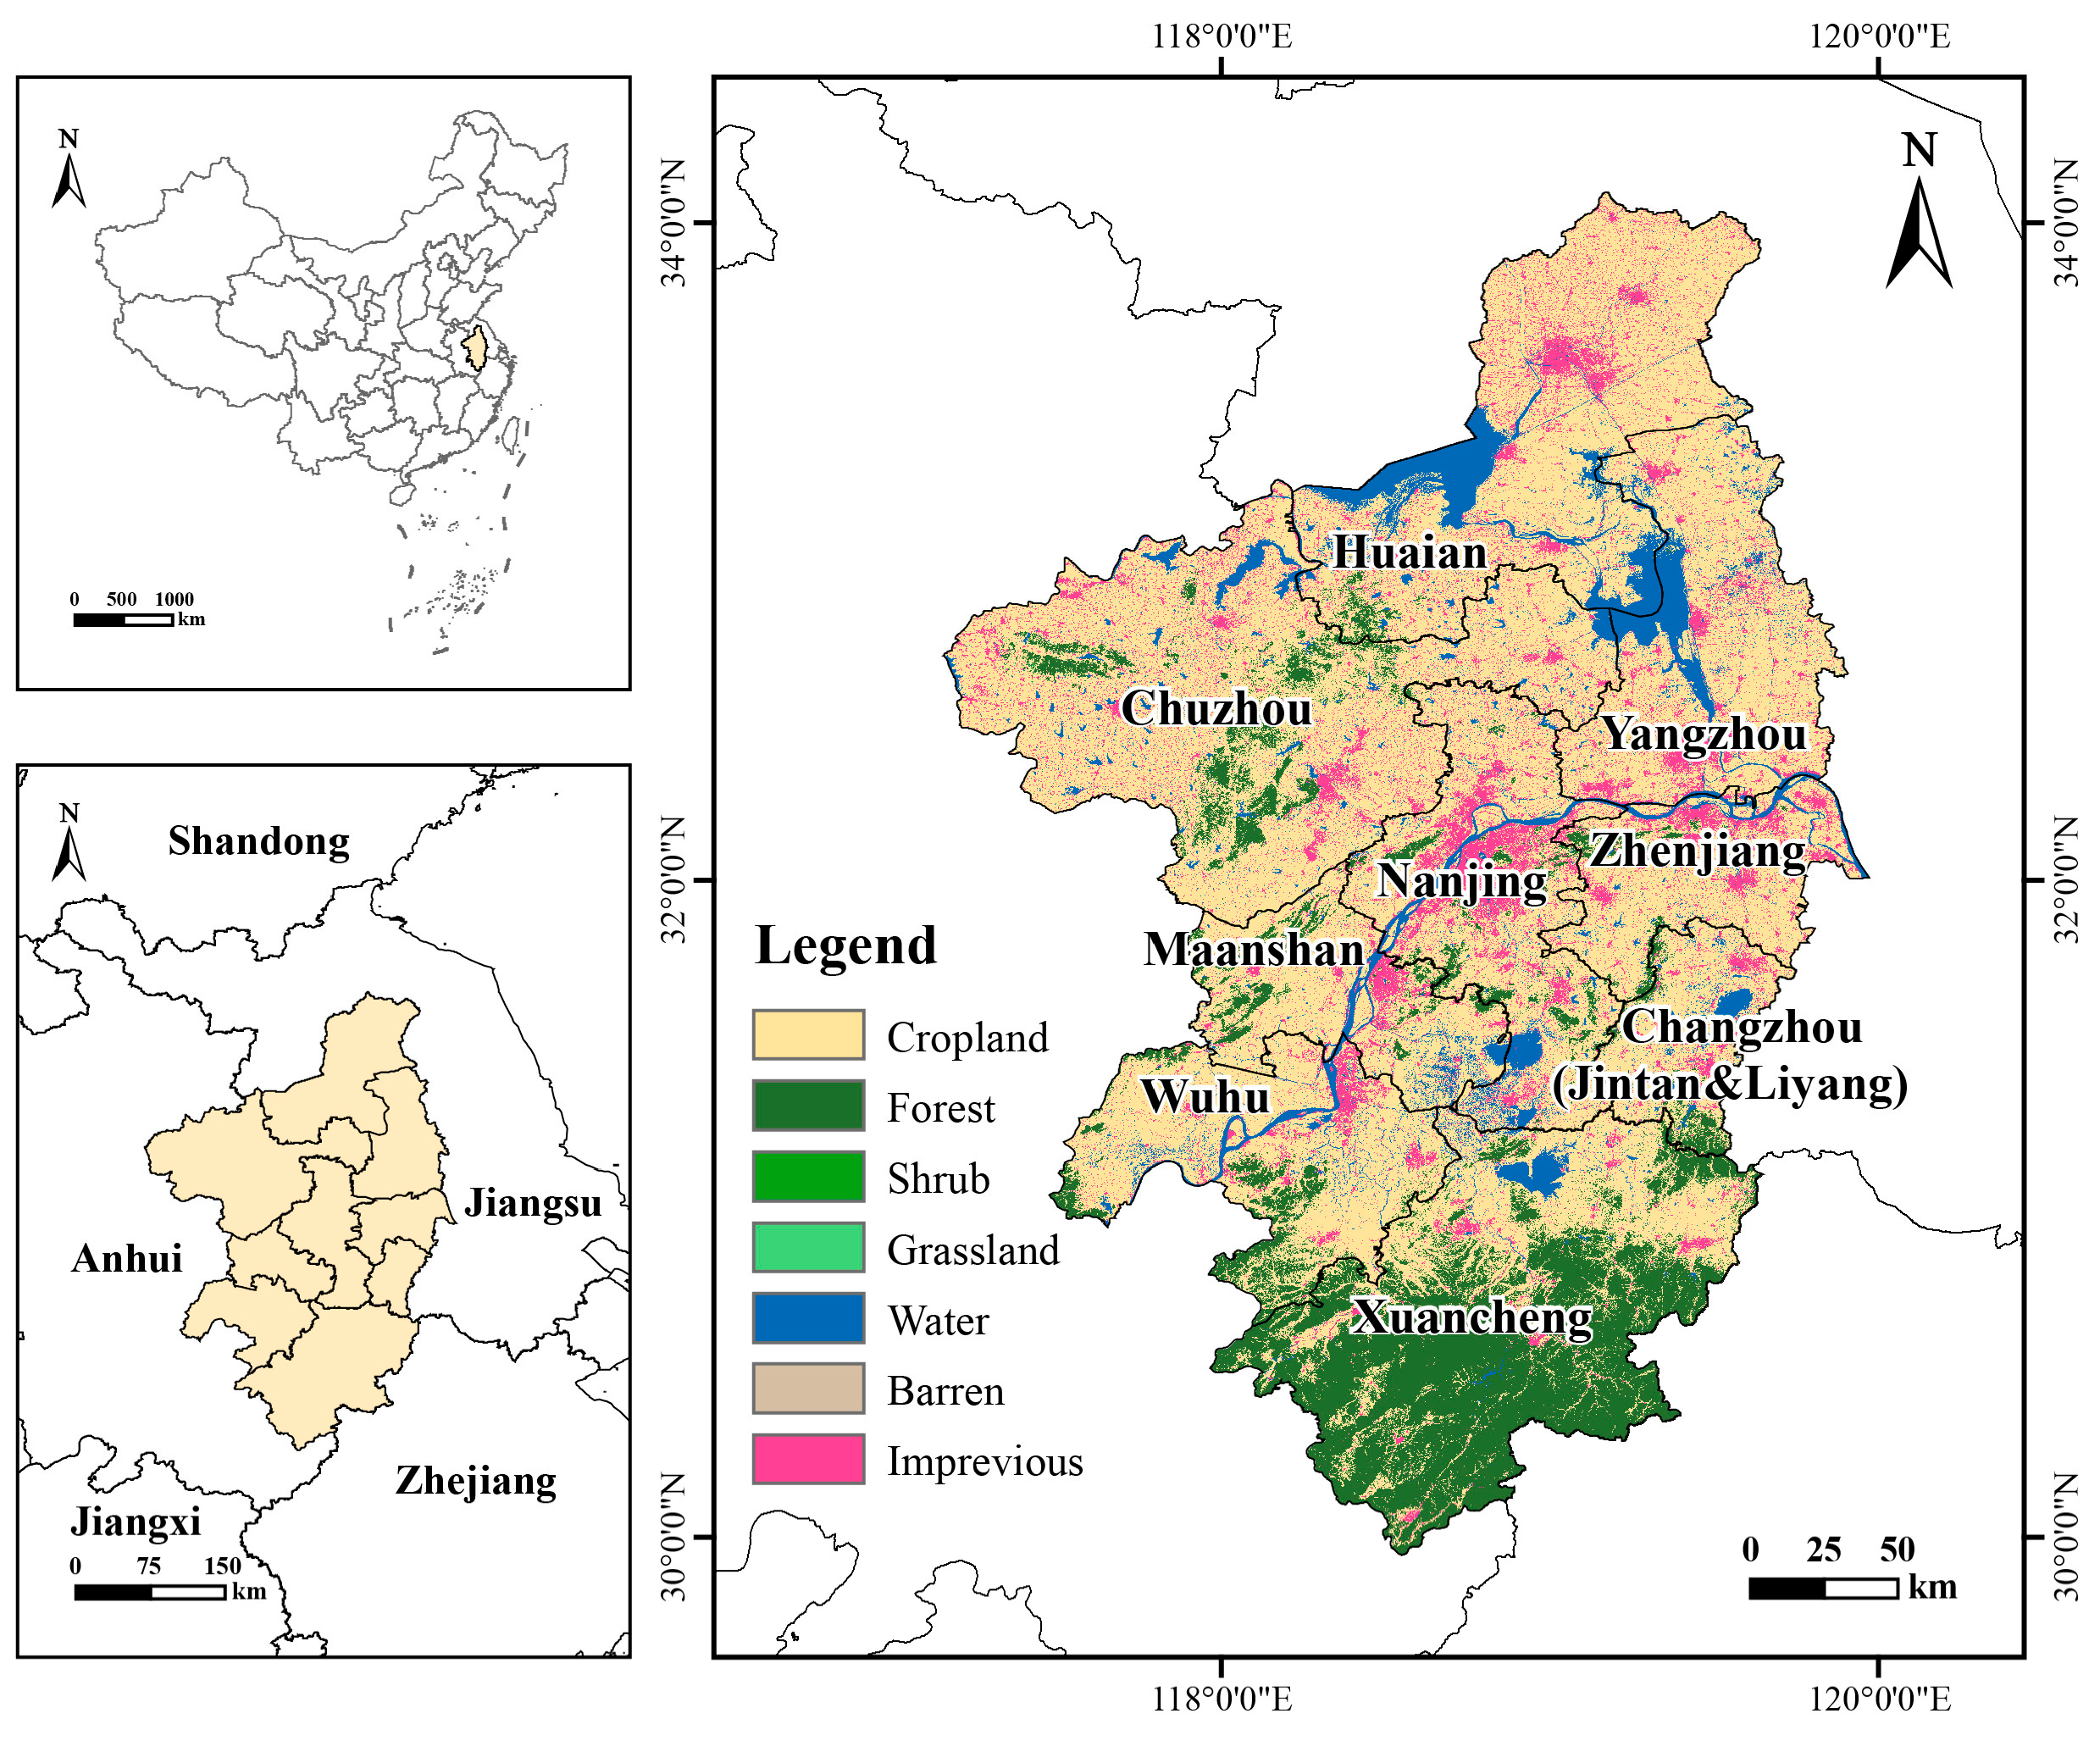
As a vital component of the Yangtze River Delta’s world-class urban cluster, the Nanjing Metropolitan Area possesses both exceptional ecological resources and profound cultural heritage, making it an ideal case study for examining the evolution of the CES relationship during urbanization. This region boasts natural landscapes, such as Purple Mountain and Xuanwu Lake, while also preserving historical and cultural legacies, including the Confucius Temple and Nanjing City Walls, forming a rich and diverse CES baseline [
25]. The Nanjing Metropolitan Area has made considerable progress in promoting integrated development between its central city and surrounding cities. However, the urbanization process has been marred by an excessive focus on economic gains and the indiscriminate expansion of urban land use, resulting in significant damage to the region’s ecological environment [
26]. Existing research on this region has primarily focused on individual cities [
27] or on ecosystem services as a whole [
28], lacking an analysis of the supply–demand relationship and driving mechanisms of CESs from a metropolitan perspective. This makes it difficult to support the coordinated optimization of regional ecological and cultural resources [
29]. Importantly, the Nanjing Metropolitan Area offers a context that is widely discussed in metropolitan planning and international urban research, namely, functional differentiation across the metropolitan system and the co-location of heritage assets with urban green–blue infrastructure. This territorial setting is therefore well-suited for engaging with the broader international debate on how CES supply and demand are reorganized across metropolitan hierarchies, beyond single administrative units or site-scale assessments [
30].
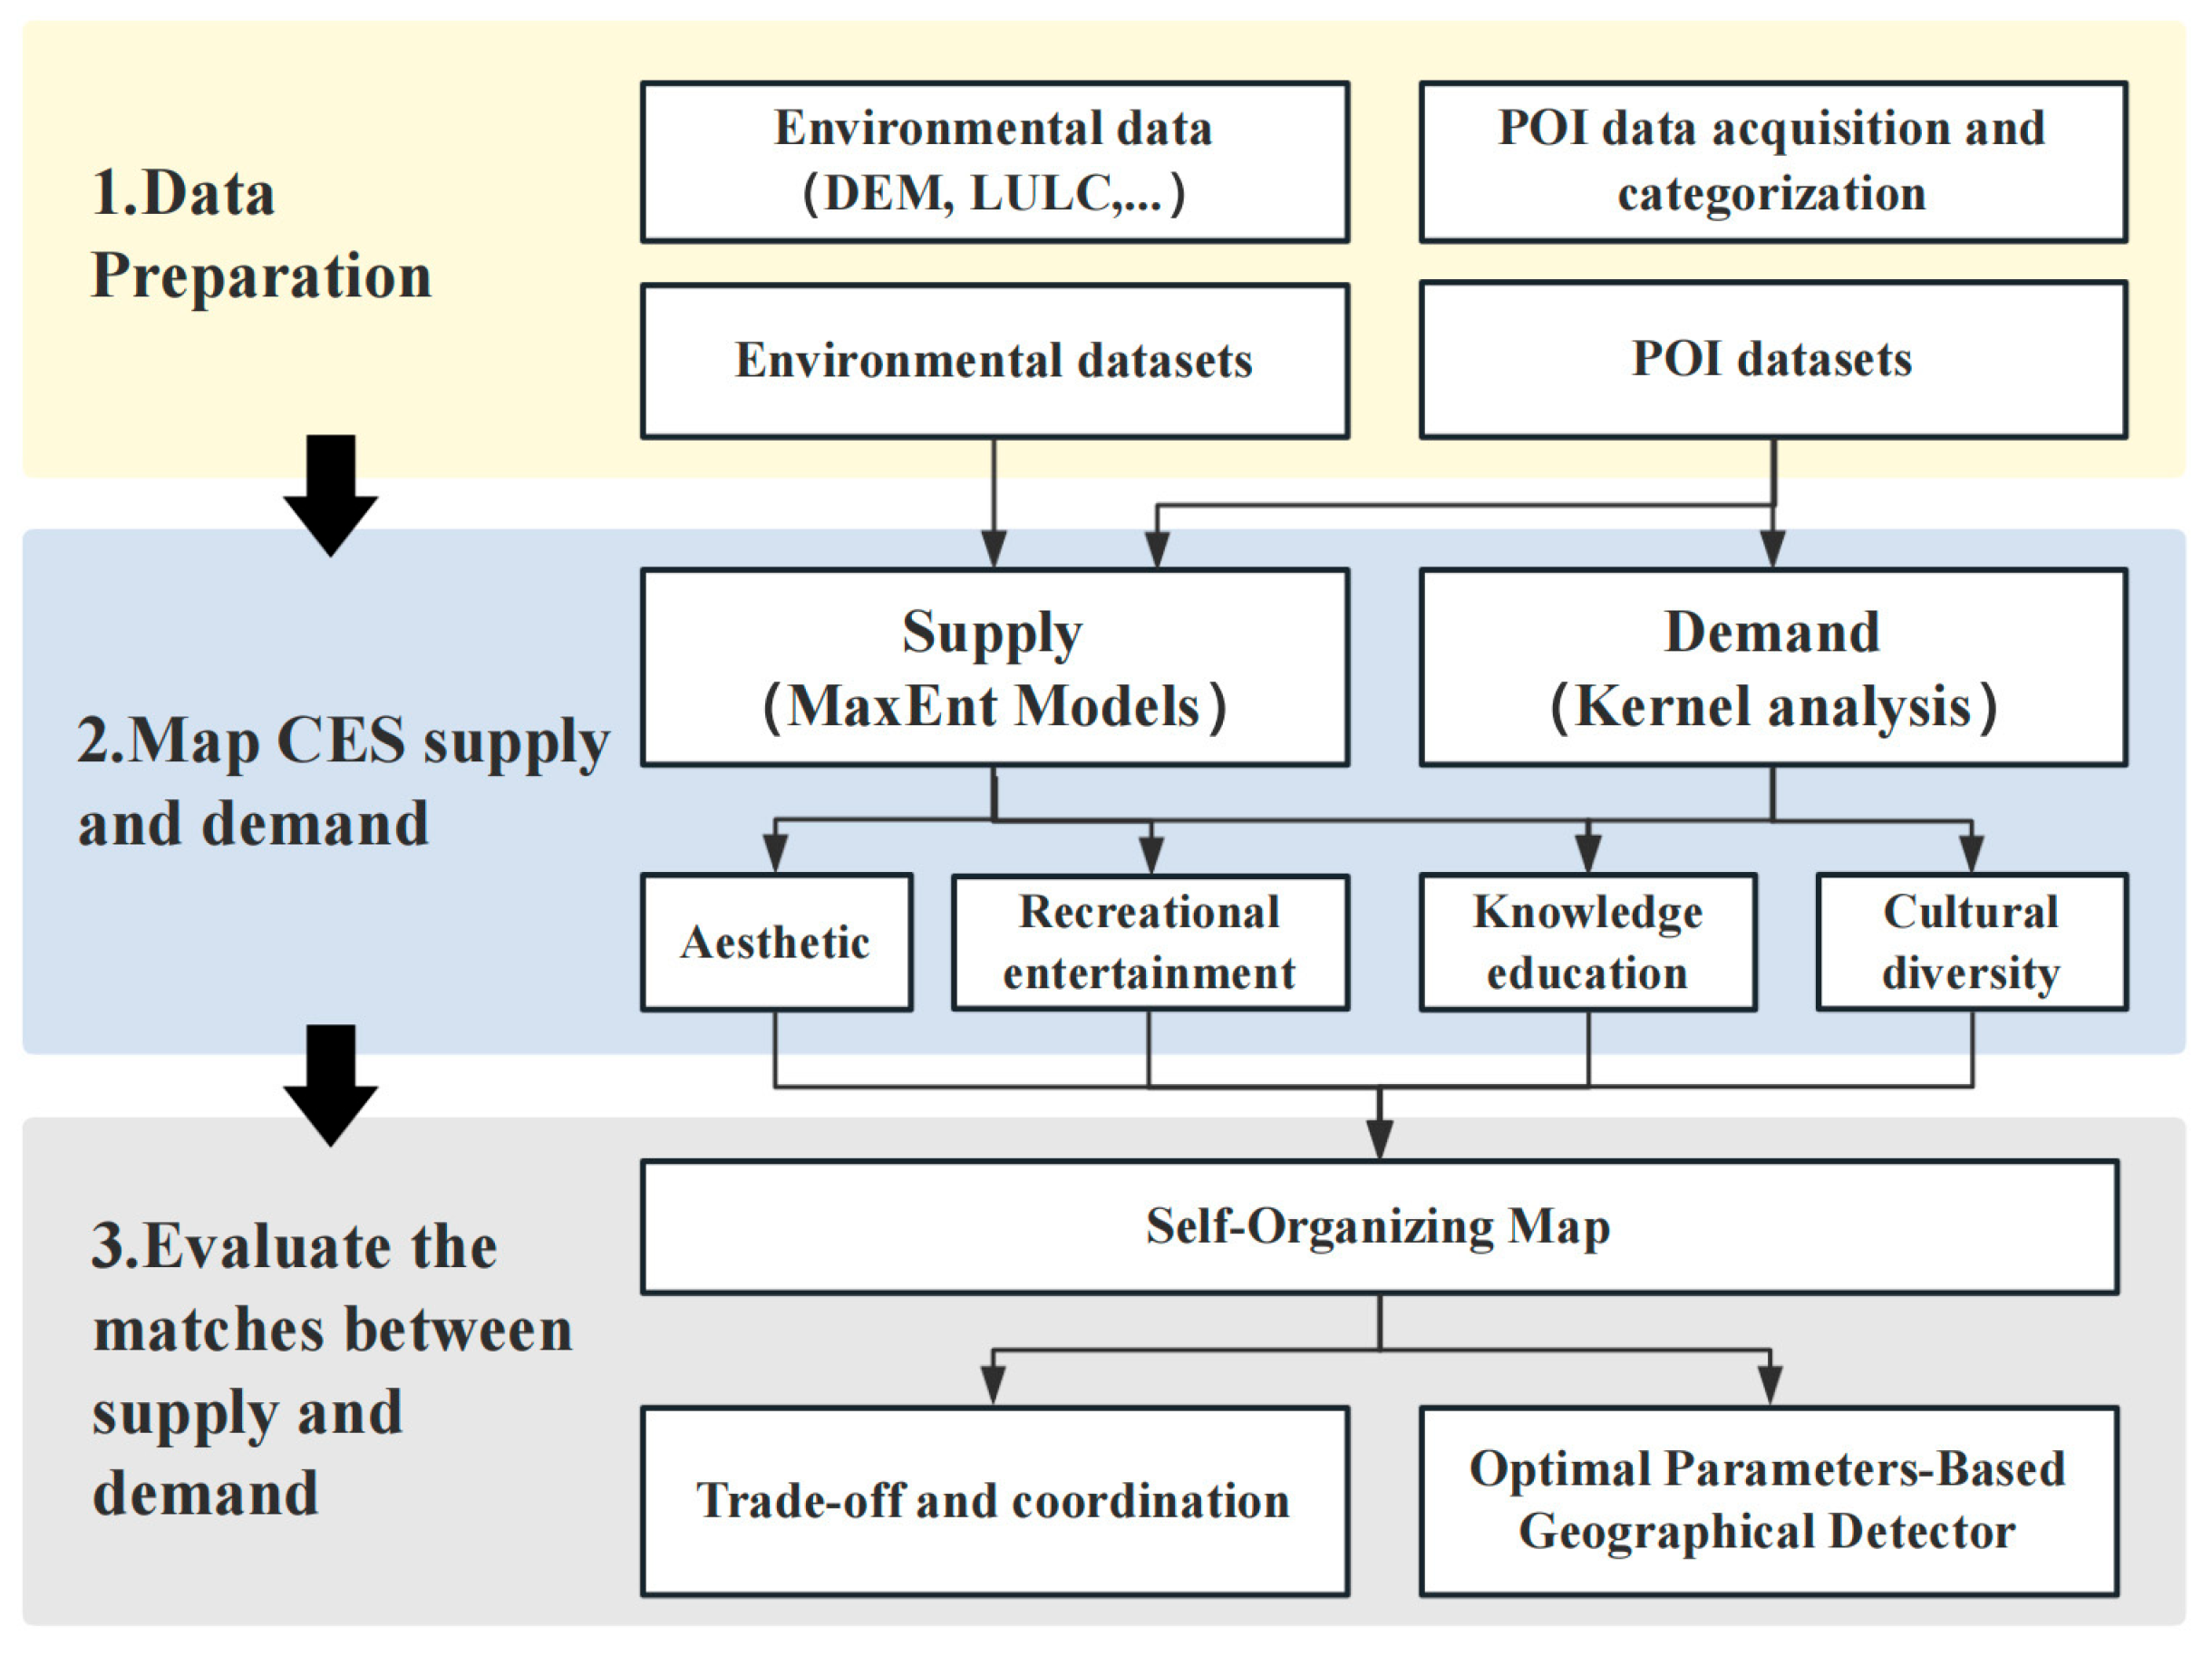
Therefore, building on the gaps and practical needs identified above, this study selects the Nanjing Metropolitan Area to examine an integrated “pattern–process–mechanism” framework for metropolitan CES assessment. By integrating multi-source geospatial and socioeconomic data and combining MaxEnt, SOM, and OPGD, we aim to explore (1) how CES supply and demand are spatially organized and mismatched across a metropolitan system; (2) how such mismatches can be structured into interpretable supply–demand bundles; and (3) whether, and how, the drivers and their interactions differ across bundles along a core–secondary center–periphery gradient. To achieve this, we first map CES supply and demand using MaxEnt, and then construct a normalized CESDR to characterize relative surplus or deficit. We subsequently apply SOM to identify metropolitan-scale bundles, quantify within-bundle trade-offs and synergies through correlation analysis, and finally use the OPGD to test bundle-specific drivers and interaction effects. In doing so, the study moves beyond pattern description toward a mechanism-oriented understanding that supports zone- and type-specific implications for planning and governance.
3. Results
3.1. Spatial Patterns of Supply and Demand for CESs
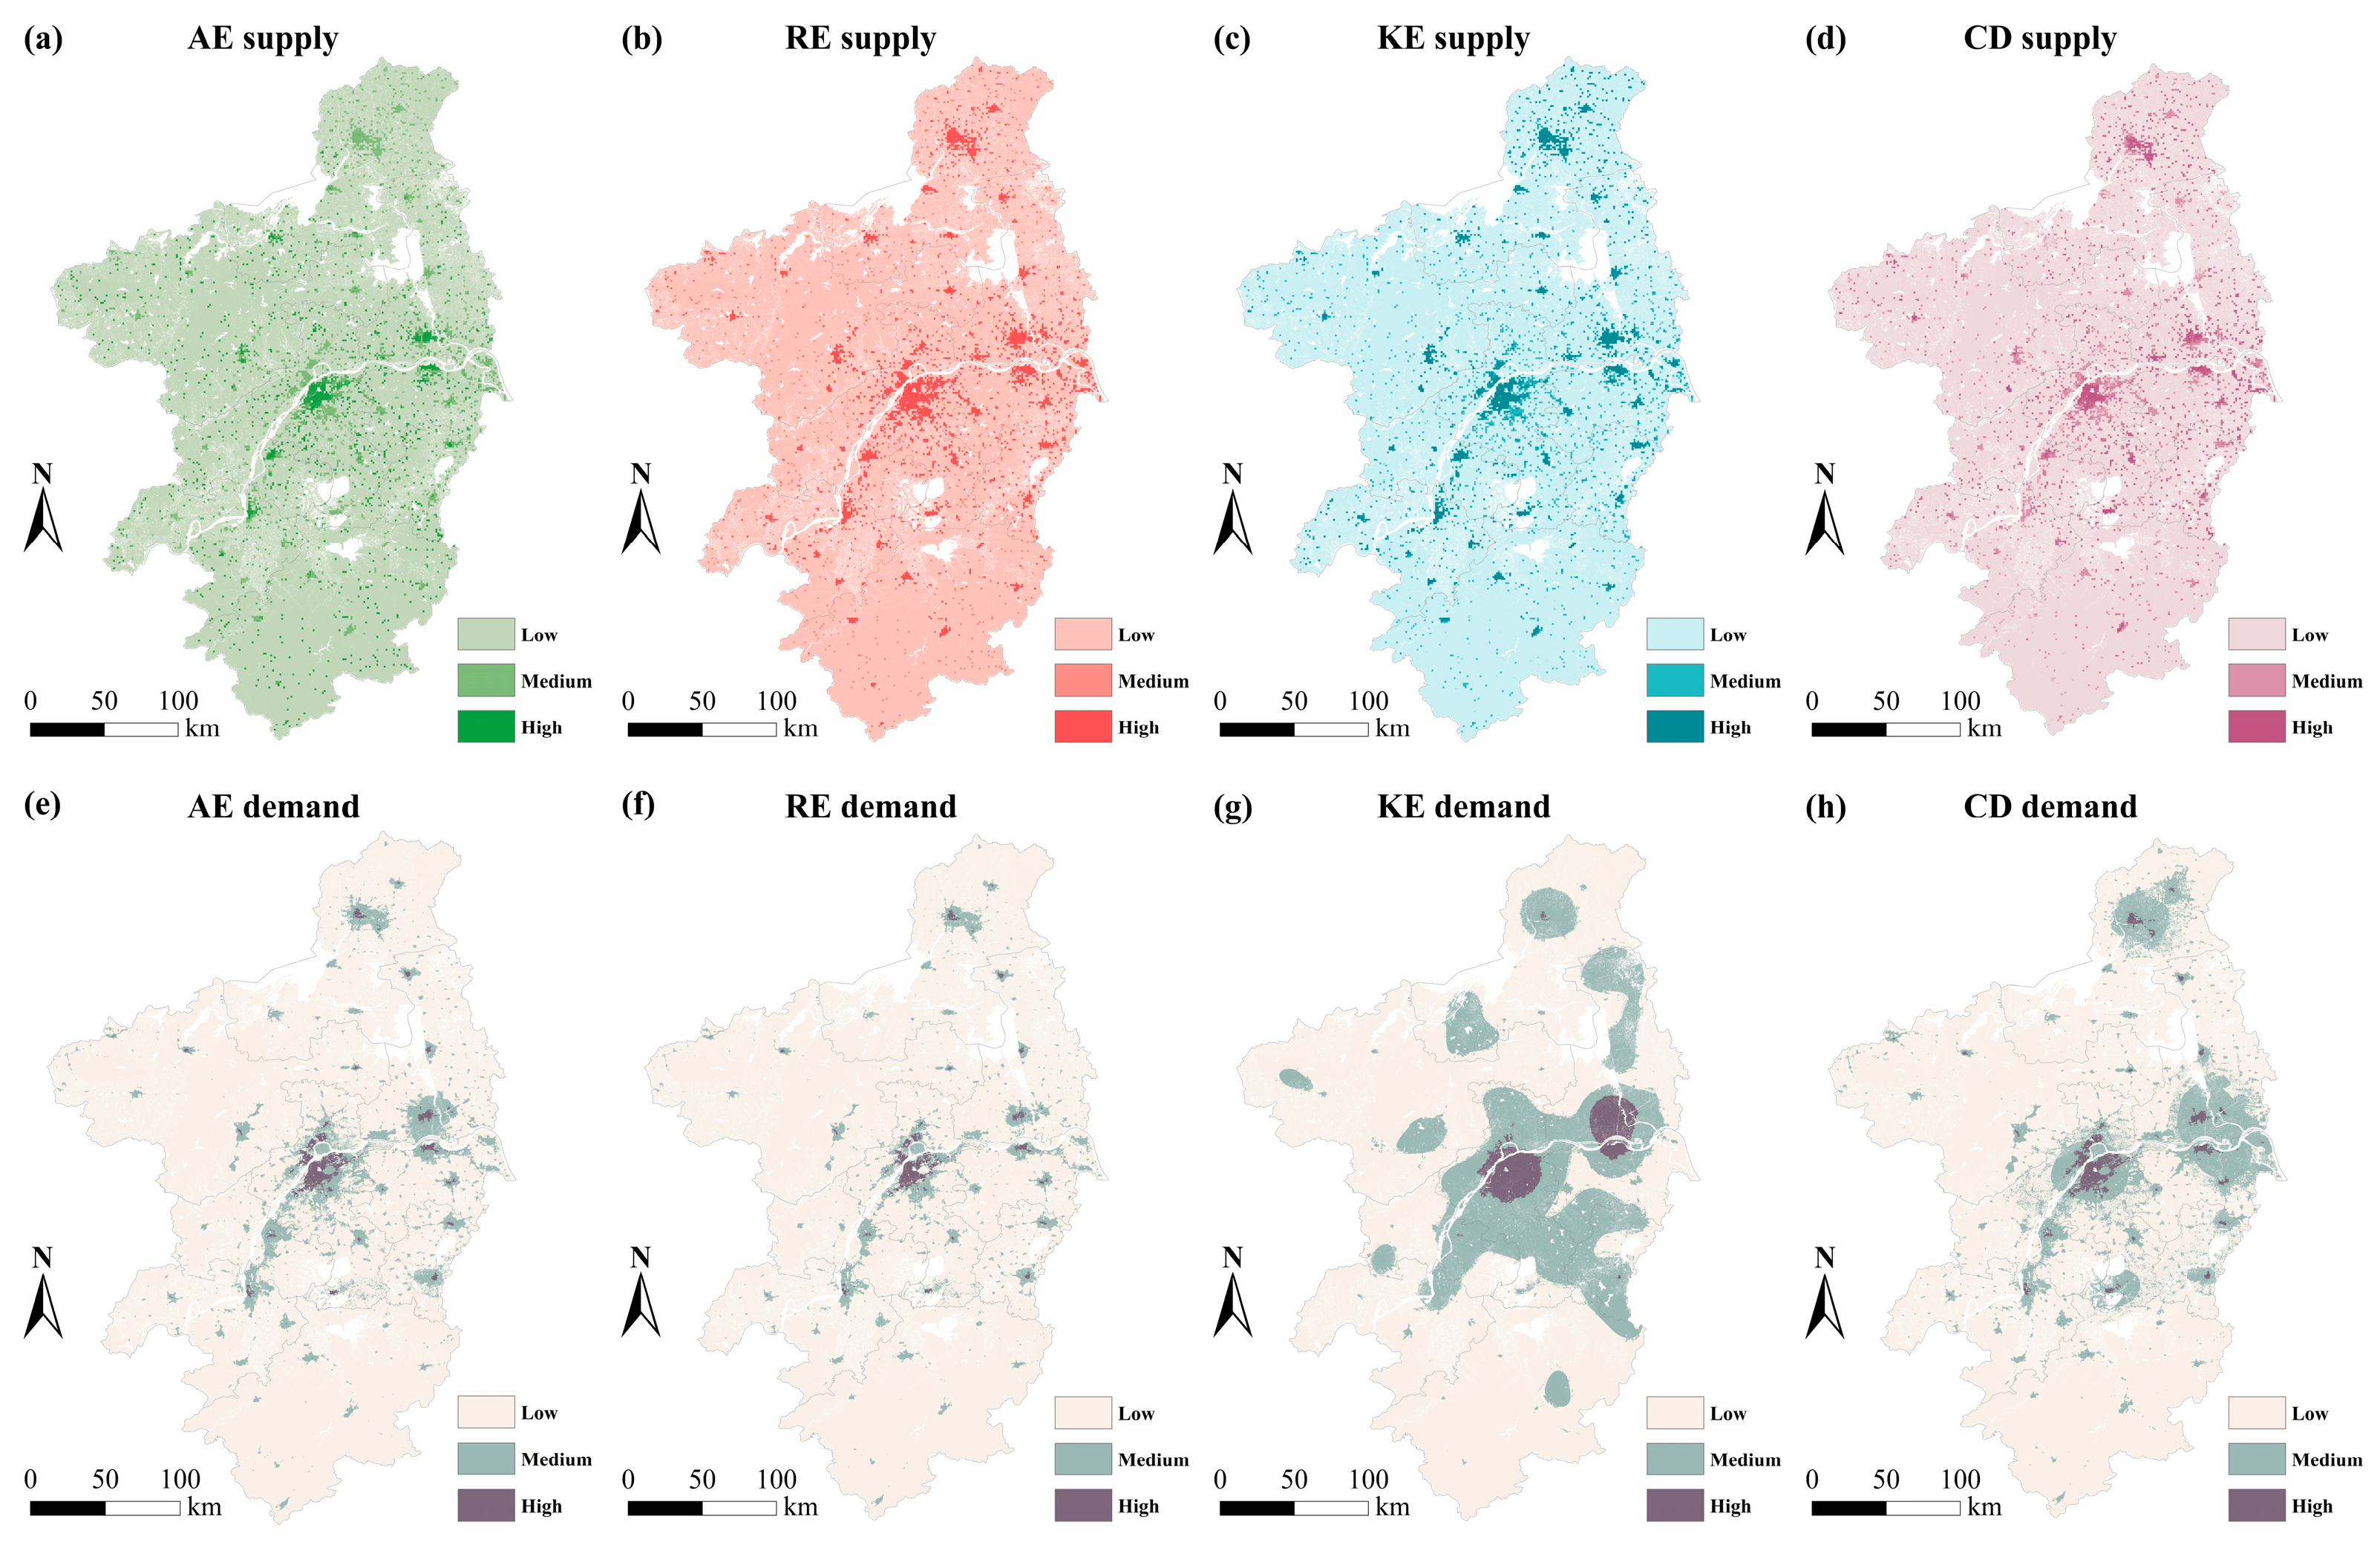
The MaxEnt models exhibited strong predictive performance, with test AUC values ranging from 0.817 to 0.981 (AE: 0.949; RE: 0.817; KE: 0.929; CD: 0.981). These results support the reliability of the generated supply maps and provide a basis for the spatial pattern analysis (
Figure 3). From a supply perspective, the medium- and high-supply zones for AE, RE, KE, and CD account for 8.42%, 8.53%, 8.31%, and 7.82% of the area, respectively, with significant overlap, especially at the metropolitan scale. In the Nanjing Metropolitan Area, the central urban area forms the main cluster of high supply, while cities like Huai’an, Chuzhou, and Xuancheng have more scattered high-supply zones. Northeastern cities (Huaian, Yangzhou) hold moderately higher supply concentrations than southwestern cities (Wuhu, Xuancheng). At the prefecture level, high supply is concentrated in urban cores, while peripheral areas mostly have low supply, with only scattered high-supply pockets. These patterns highlight considerable overlap and regional differences at multiple scales.
From the demand perspective, the proportions of areas classified as medium-demand and high-demand zones for AE, RE, KE, and CD accounted for 10.02%, 6.98%, 28.18%, and 17.64% of the total, respectively. High demand for KE is concentrated in Nanjing and Yangzhou’s central urban areas. These areas show a clear tendency to expand outward into adjacent regions. In contrast, the distribution patterns for the other three CES categories show significant overlap. High-demand areas also include central urban areas of Nanjing and northeastern cities such as Huai’an, Yangzhou, Zhenjiang, Liyang, and Jintan District in Changzhou. The outward expansion and contiguous growth of high-demand values for AE and CD are especially notable. Overall, CES supply hotspots are more spatially concentrated than demand hotspots, indicating a spatial mismatch between potential service provision and the distribution of beneficiary pressure across the metropolitan area. This contrast provides the basis for the subsequent CESDR assessment and SOM-based bundle identification.
3.2. Spatial Patterns of CESDR
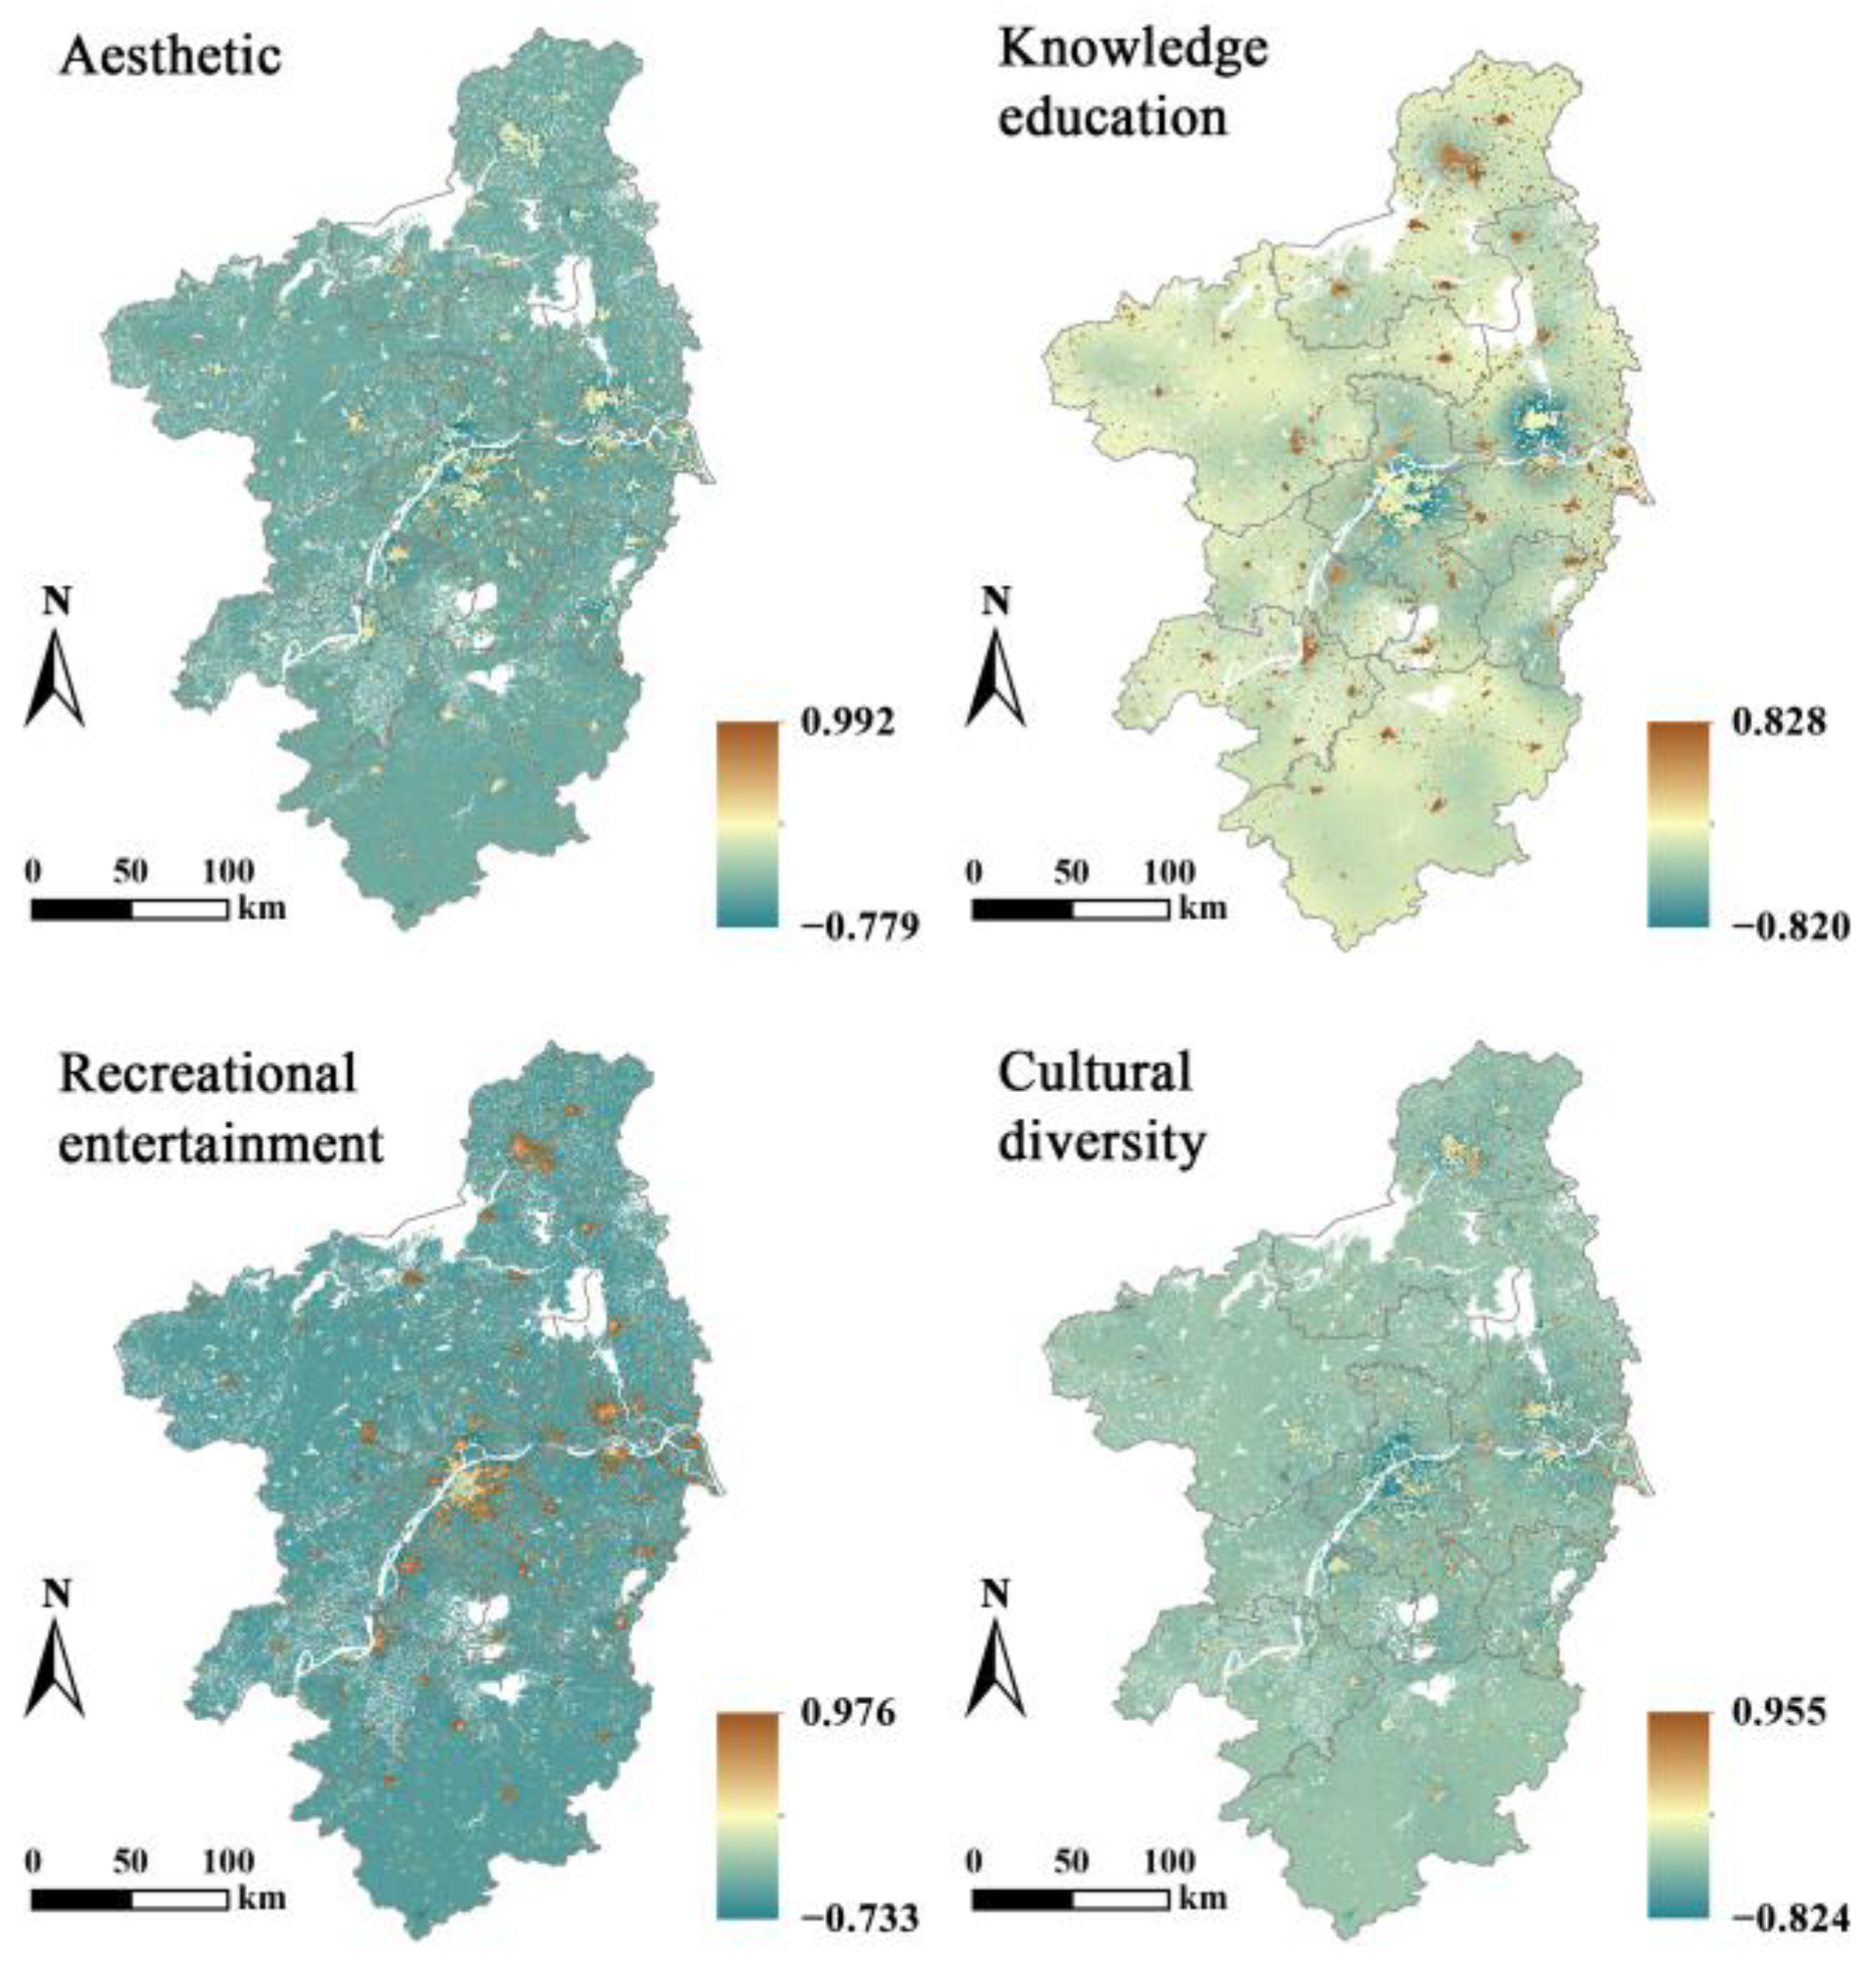
Marked by significant spatial variation (
Figure 4), the four types of CESDR categories across the Nanjing Metropolitan Area exhibit distinct numerical ranges: AE (−0.779 to 0.992), KE (−0.820 to 0.828), RE (−0.733 to 0.976), and CD (−0.824 to 0.955). Notably, the CESDR is a normalized, relative indicator; thus, widespread negative values primarily indicate that normalized local supply is lower than normalized local demand within the metropolitan context, rather than implying an absolute absence of CESs.
Statistically, only RE shows a slight mean surplus (0.05), whereas the others average near or below zero. This is reflected spatially: supply deficits are ubiquitous in KE (91.82% of the area), AE (78.63%), and CD (85.36%); RE deficits are less common but still cover 69.03% of the area. Consequently, the CES supply deficiency is widespread, with pronounced surpluses occurring only in limited areas, such as Maoshan (Zhenjiang) for AE, Slender West Lake (Yangzhou) for RE, and the Southern Old Quarter of Nanjing for CD. Taken together, these CESDR patterns indicate a metropolitan-scale imbalance in supply–demand matching, with surpluses concentrated in a limited number of high-value locations. This pattern provides the basis for the subsequent SOM-based classification of dominant supply–demand bundle types.
3.3. Patterns of Distribution of Supply–Demand Bundles for CES
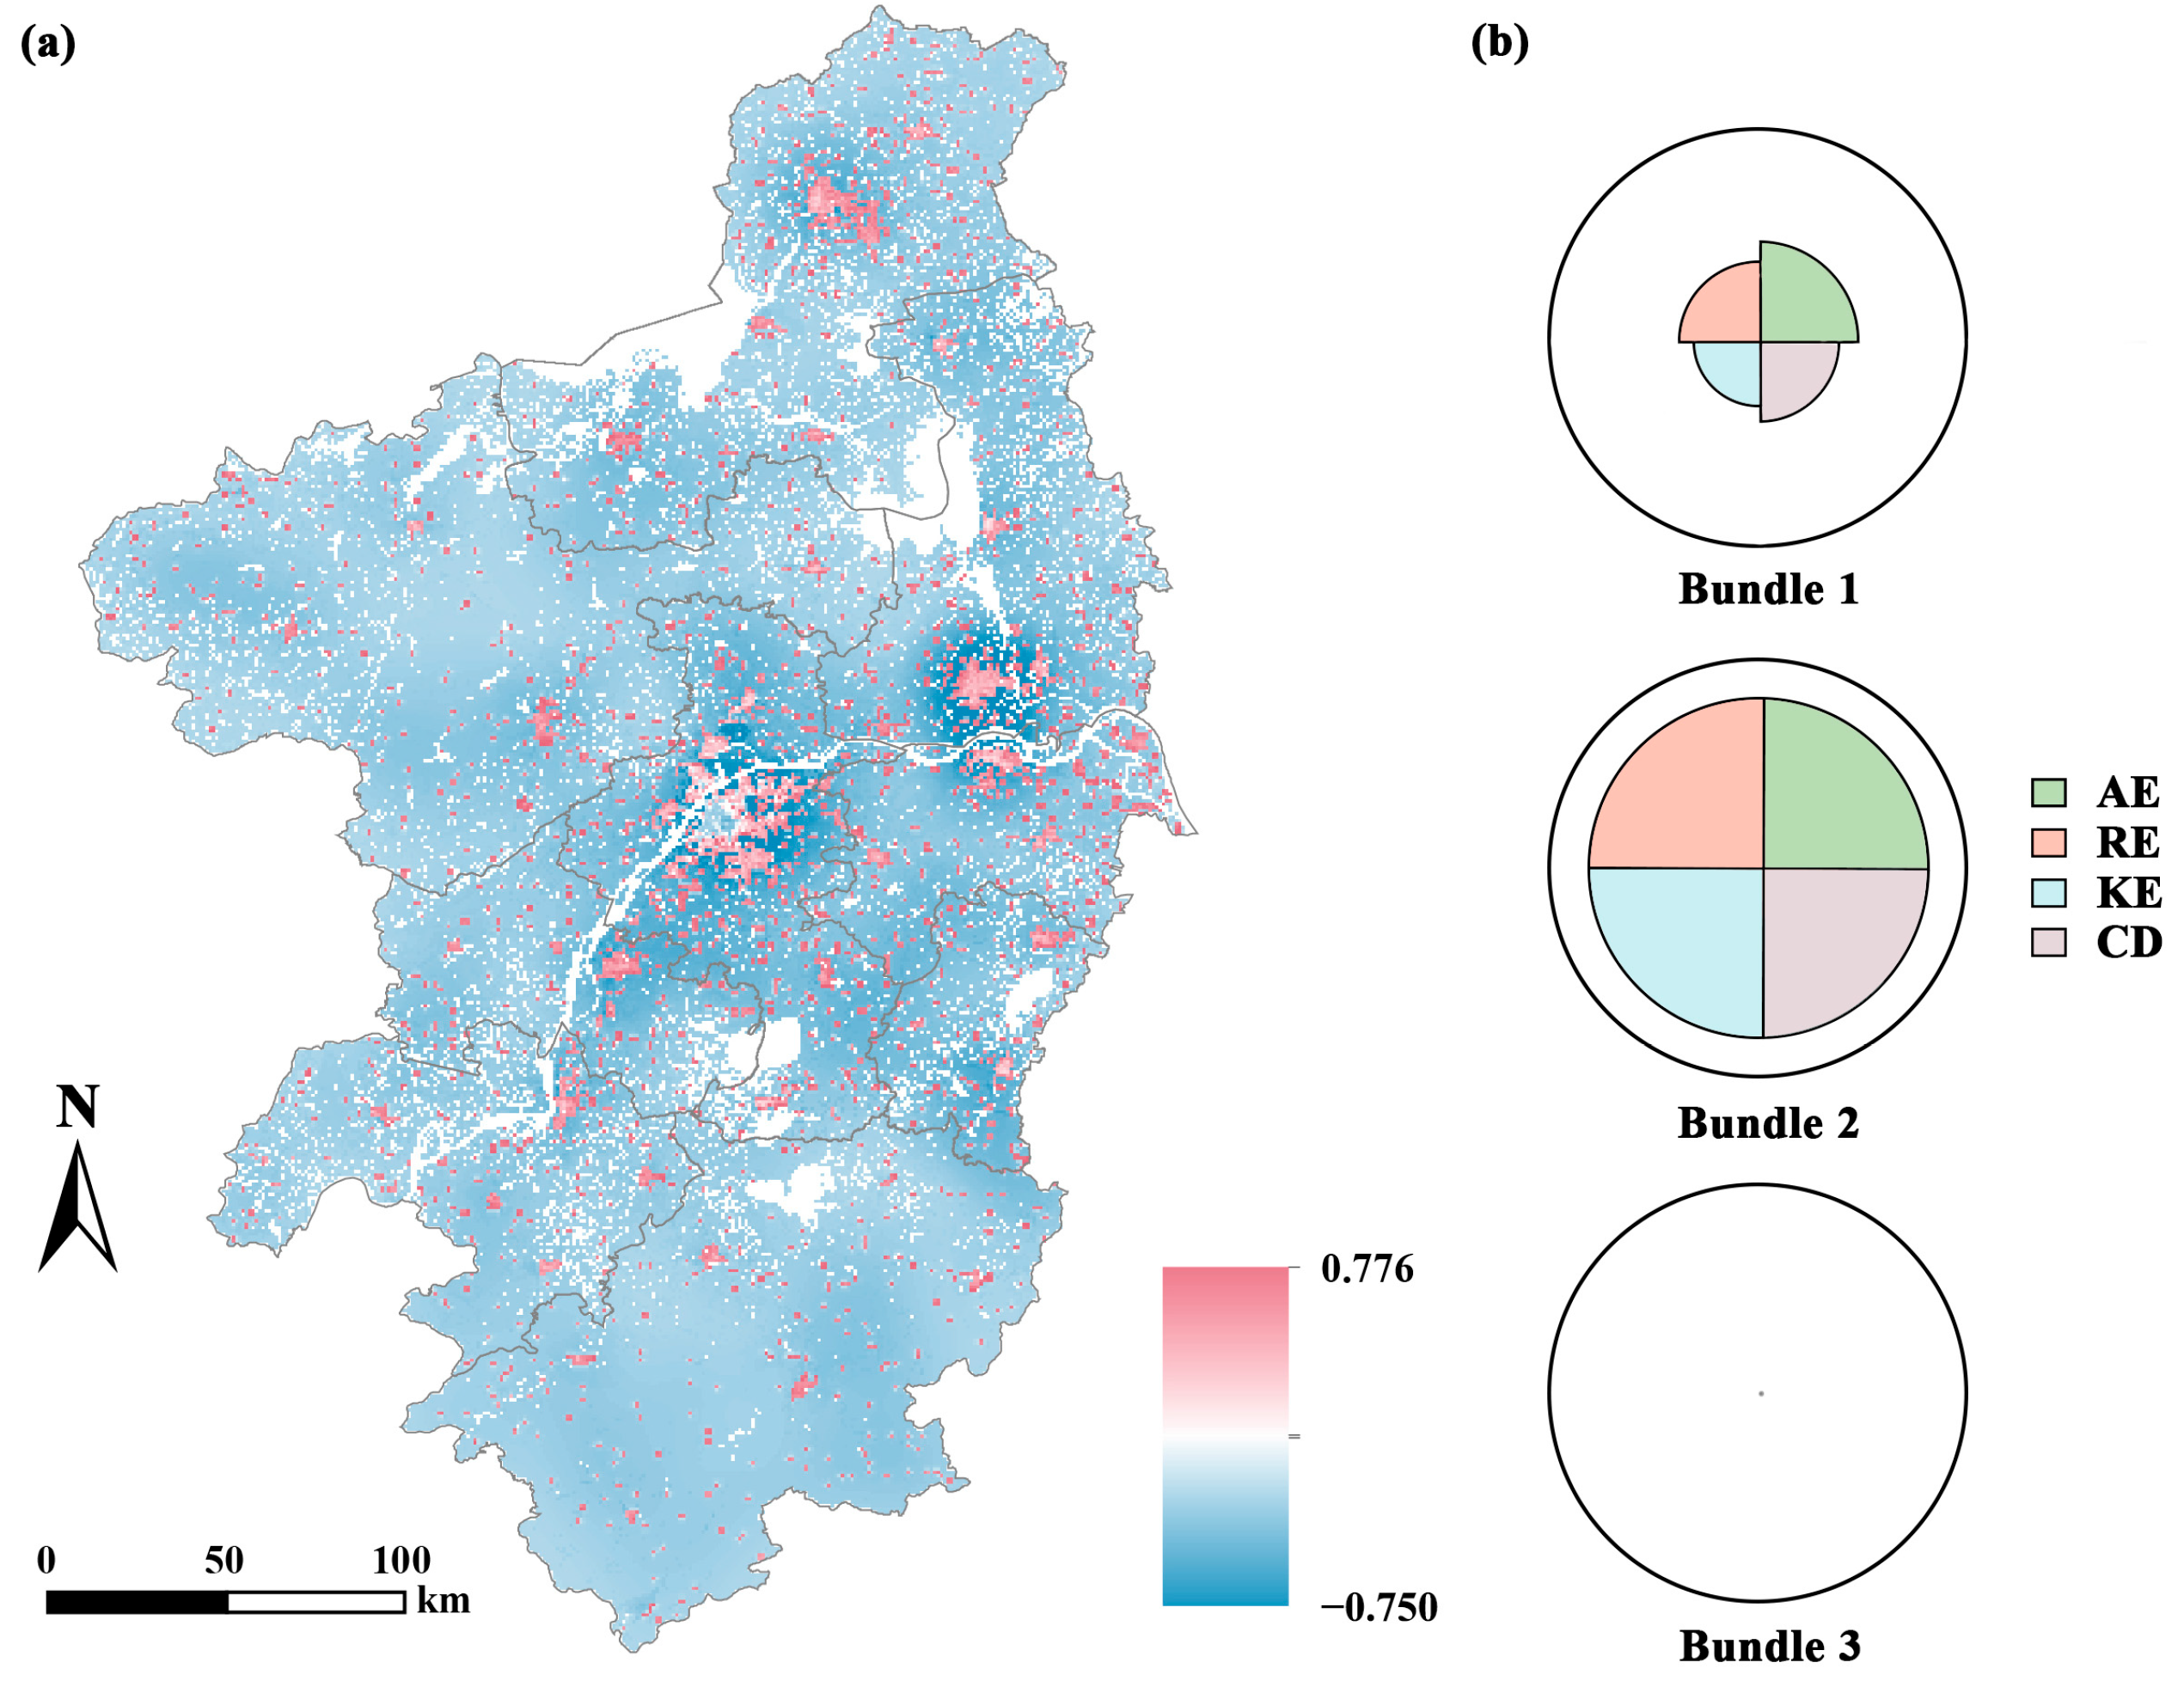
The SOM results classify CESDR spatial patterns in the Nanjing Metropolitan Area into three distinct supply–demand bundles, forming a “core–secondary center–periphery” configuration (
Figure 5 and
Table 4): Bundle 1 (core area), Bundle 2 (secondary center), and Bundle 3 (periphery).
Bundle 1 covers 6.44% (4059.49 km2) of the study area. It is concentrated in core urban districts such as Nanjing and Yangzhou. It is marked by CESDR values consistently above 0.5, indicating a substantial supply surplus. This bundle is dominated by AE and CD, which collectively account for over 50% of the total. The core zone capitalizes on high-quality natural and cultural resources (e.g., Purple Mountain, Confucius Temple). This results in significant surpluses in CESs. For instance, AE supply is 1.8 to 2.3 times the demand. Nevertheless, spillover effects of services such as RE remain underutilized. This reveals a core-radiating supply–demand dynamic.
Bundle 2 occupies 5.08% (3199.09 km2) of the area. It is mainly distributed around secondary urban centers, including Danyang, Yizheng, and Lishui. It exhibits CESDR values ranging from −0.3 to 0.3. This reflects a relative balance between supply and demand. The four types of CESs each contribute approximately 25%. This indicates a pattern of diversified equilibrium.
Bundle 3, which covers the vast majority of the area (88.48%, 55,733.01 km2), predominantly consists of counties and rural areas on the metropolitan periphery. This bundle is characterized by CESDR values ≤ 0, with all four types of CESs contributing minimally, demonstrating a homogeneous pattern of weak supply and demand.
In summary, these three bundles capture a clear metropolitan hierarchy of CES supply–demand matching, characterized by a surplus in the core, near-equilibrium in secondary centers, and weakness in peripheral areas. This bundle typology provides a structured basis for the subsequent analyses of intra-bundle trade-offs/synergies and their differentiated driving mechanisms.
3.4. Trade-Offs and Synergies of CESs Within the Supply–Demand Bundles of CESs
The Spearman correlation coefficient matrix for the four types of CESs (AE, RE, KE, CD) within the three supply–demand bundles in the Nanjing Metropolitan Area, across the supply–demand bundles (Bundles 1–3), and across the total area reveals differentiated synergistic characteristics (
Figure 6).
In Bundle 1, the strongest finding is the significant positive correlation between AE and CD (r = 0.596, p < 0.001). AE also shows weak positive correlations with RE (r = 0.229, p < 0.001) and KE (r = 0.189, p < 0.001). Additionally, KE and CD are weakly correlated (r = 0.286, p < 0.001). All other service pairs show either insignificant or very weak associations.
All service pairs within Bundle 2 have absolute correlation coefficients below 0.05, indicating minimal relationships between services. Specifically, AE has extremely weak negative correlations with KE (r = −0.041, p < 0.001), RE (r = −0.021, p < 0.001), and CD (r = −0.042, p < 0.001). KE and CD have a very weak positive correlation (r = 0.040, p < 0.01).
Bundle 3 forms a collaborative network centered on AE. Notably, AE has strong positive correlations with RE (r = 0.717, p < 0.001), KE (r = 0.531, p < 0.001), and CD (r = 0.592, p < 0.001), highlighting AE’s central role. The correlations between RE and CD (r = 0.348, p < 0.001) and KE and CD (r = 0.437, p < 0.001) are weak to moderate, while the correlation between RE and KE (r = 0.057, p < 0.001) is extremely weak, indicating minimal connection between these two components.
Over the total area, AE shows a strong positive correlation with RE (r = 0.802, p < 0.001), a moderate positive correlation with KE (r = 0.651, p < 0.001), and a moderate positive correlation with CD (r = 0.692, p < 0.001). RE has a moderate positive correlation with CD (r = 0.517, p < 0.001) and KE (r = 0.563, p < 0.001), and a weak positive correlation with KE (r = 0.319, p < 0.001).
Overall, interaction structures differ markedly across bundles, indicating that CES relationships vary systematically along the metropolitan gradient. This pattern provides a clear basis for the subsequent analysis of whether dominant drivers and their interactions also differ among bundles.
3.5. Drivers of the CESDRs of CESs Within the Supply–Demand Bundles of CESs
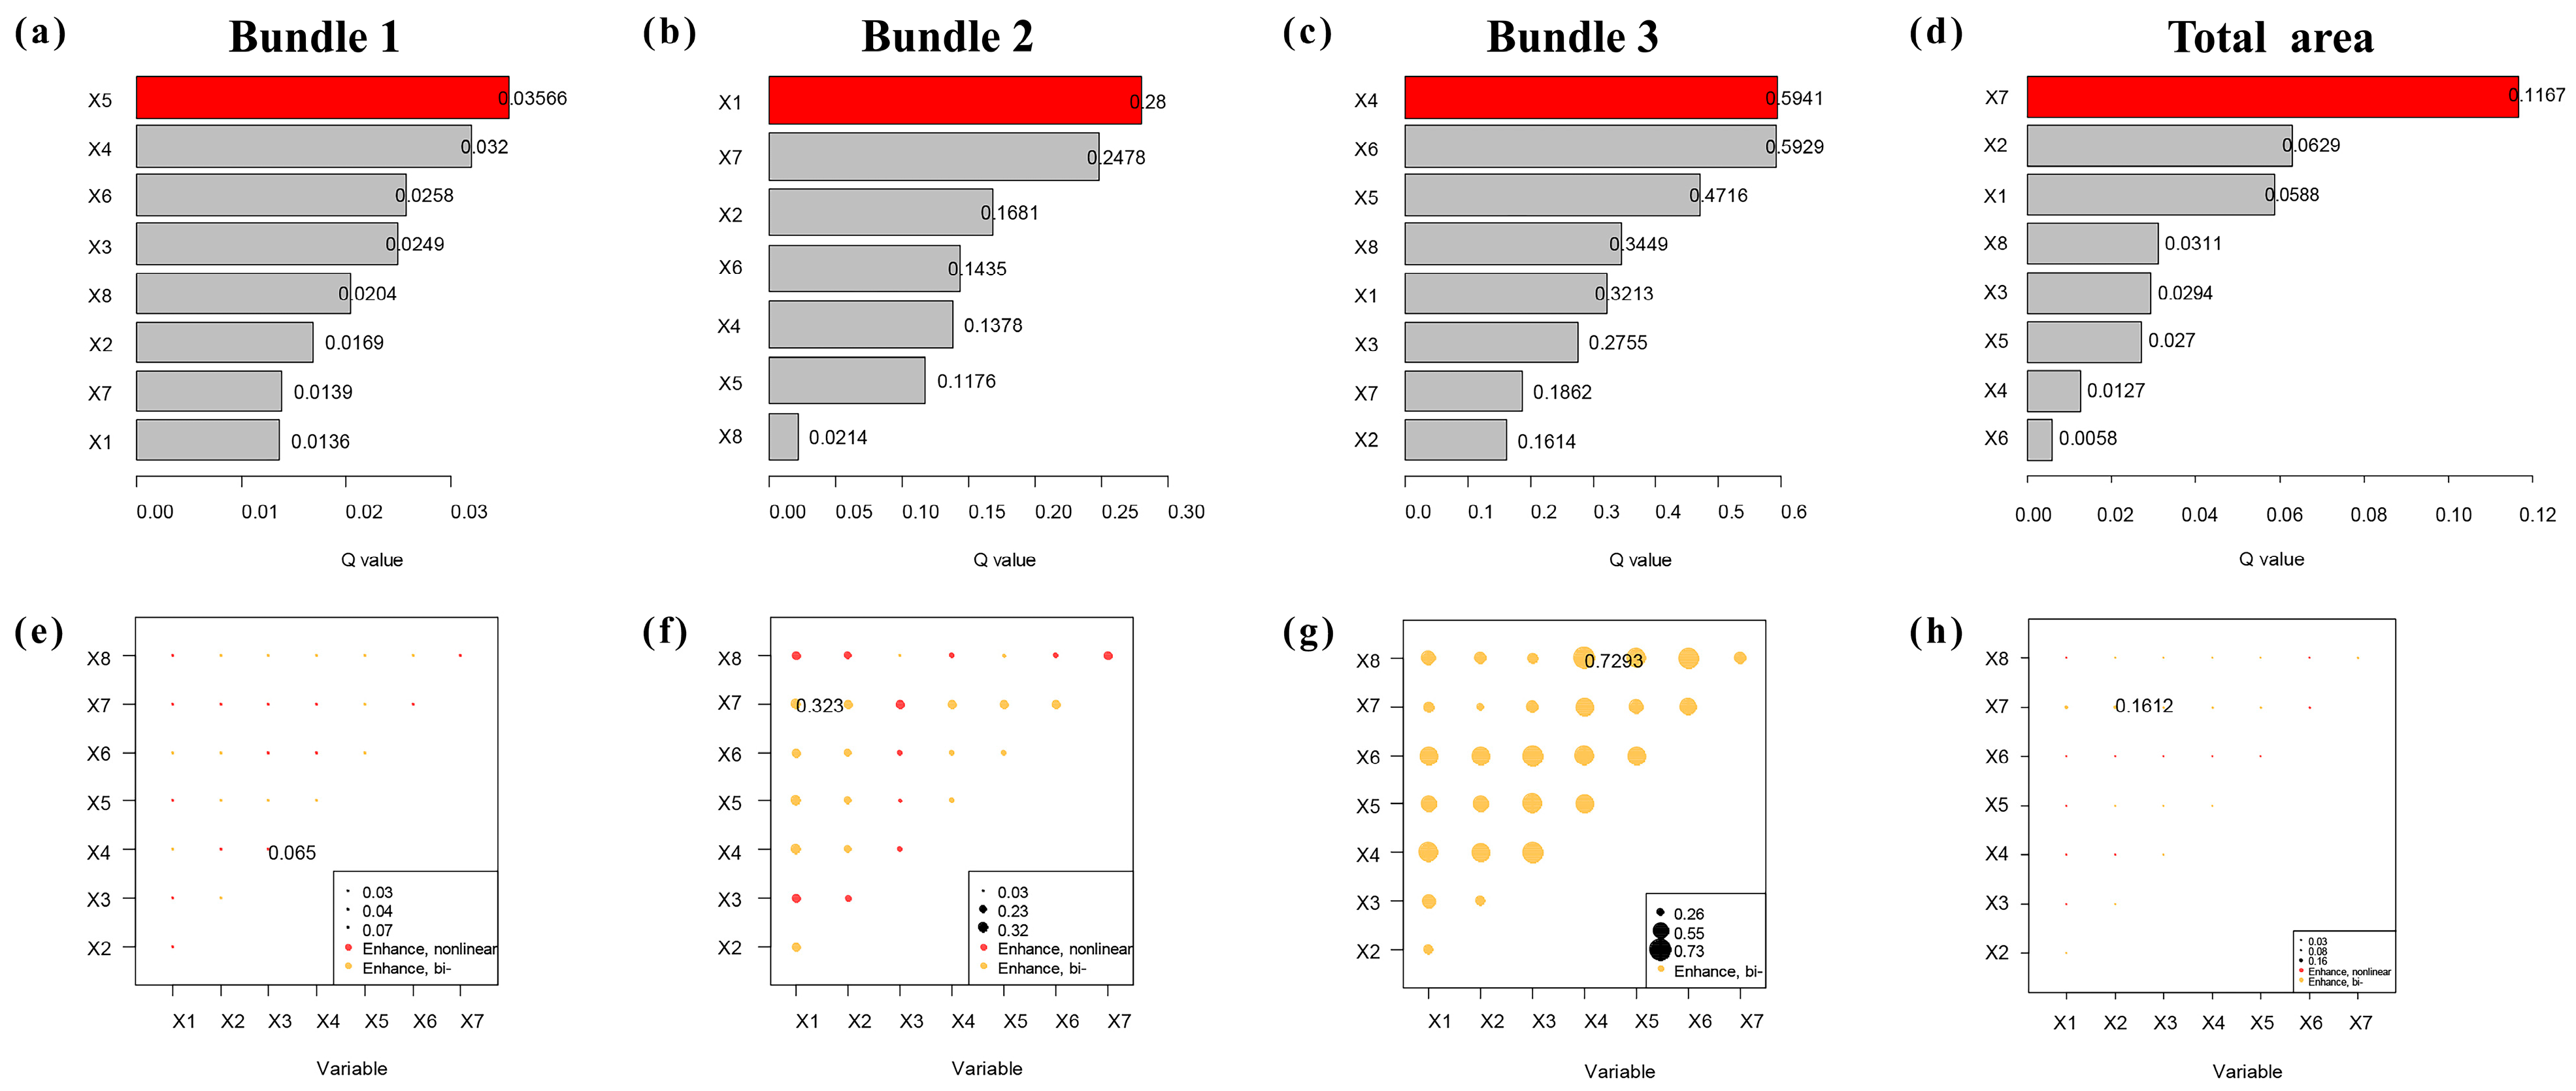
Analysis based on the OPGD reveals that the driving mechanisms of the CESDR differ significantly across distinct demand–supply bundles within the Nanjing Metropolitan Area (
Figure 7).
Within Bundle 1, most driving factors exhibited very low explanatory power, as measured by the q-value (which quantifies the proportion of variance explained). Among them, the kernel density of educational facilities (X5, q = 0.036) and that of cultural facilities (X4, q = 0.032) were relatively strong drivers, but neither reached statistical significance (p > 0.05). Among interactions, the interaction between X4 and per capita green space in parks (X3) exhibited the highest explanatory power (q = 0.065).
Bundle 2 was primarily driven by population density (X1, q = 0.280, p < 0.05) and the density of road network (X7, q = 0.248, p < 0.05), with their interaction further enhancing explanatory power (q = 0.323, p < 0.05). The influence of per capita GDP (X8, q = 0.021) was marginal.
Bundle 3 exhibited the strongest driving effect, with X4 (q = 0.594) and the kernel density of physical education facilities (X6, q = 0.593) as decisive factors. The interaction between X8 and X4 accounted for 0.729 of the variance. In contrast, the driving effect of fractional vegetation cover (X2, q = 0.161) was relatively weak.
Over the total area, the explanatory power for all factors was generally low (q < 0.15). X7 (q = 0.117) and X2 (q = 0.063) were relatively significant factors, but their interaction (X7∩X2, q = 0.161) was not statistically significant.
Overall, dominant drivers and interaction effects vary markedly across the three bundles, indicating that the mechanisms shaping the CESDR are spatially heterogeneous within the metropolitan region. This heterogeneity provides a basis for the subsequent discussion of differentiated governance implications across the core–secondary center–periphery structure.
4. Discussion
4.1. Supply and Demand for CESs
The supply–demand relationship of CESs within the Nanjing Metropolitan Area exhibits a typical “core–secondary center–periphery” spatial differentiation pattern, shaped by the combined influence of uneven socioeconomic development and the distribution of ecological and cultural resources. On the supply side, high-value areas are highly concentrated within Nanjing’s urban area. This is primarily due to the clustering of large natural ecological patches, such as Purple Mountain and Xuanwu Lake, alongside high-grade cultural heritage sites, such as the Confucius Temple and Sun Yat-sen Mausoleum. In contrast, surrounding cities lack comparable core resources, resulting in relatively dispersed and limited supply capacity. Such core-concentrated CES supply is consistent with a broader body of urban ecosystem service evidence showing that high-value cultural and regulating services often cluster where significant, high-quality green/blue assets and symbolic cultural amenities co-occur, rather than being evenly distributed across metropolitan space [
54]. On the demand side, its hierarchical and polycentric structure reflects spatial heterogeneity in the population, the economy, and public facilities. Hotspots are concentrated in Nanjing’s central urban areas and in some northeastern cities. These regions, characterized by higher population density, economic development, and infrastructure sophistication, generate a stronger demand for CESs. In our proxy-based mapping, this “stronger demand” should be read as stronger potential beneficiary pressure and opportunity accessibility, rather than directly observed cultural preferences or cultural-capital differences across social groups. Notably, KE forms a dual-core structure in Nanjing and Yangzhou, likely due to a cross-regional influence from densely concentrated educational and cultural facilities, such as universities, research institutions, and museums, in both cities. Meanwhile, AE and CD exhibit contiguous diffusion patterns in core urban areas, potentially linked to convenient transportation networks and daily population flows driven by commercial activities. This demand-side concentration also aligns with supply–demand research emphasizing that “demand” surfaces in metropolitan studies often reflect population-based potential beneficiaries and opportunity accessibility, and therefore tend to be spatially extensive along urban corridors, even when supply remains more centralized [
55].
The supply–demand relationship is further validated through three typical bundles. Bundle 1 (core area) exhibits a significant supply surplus (CESDR > 0.5), Bundle 2 (secondary centers) maintains near-equilibrium (CESDR between −0.3 and 0.3), and Bundle 3 (periphery) shows dual weakness in both supply and demand (CESDR ≤ 0). Together, they form a zoned spatial structure of “core concentration—secondary equilibrium—peripheral homogeneity.” Notably, the observed deficits for KE and CD reflect a tension between potential demand pressure and centralized supply. We acknowledge that our static proxies may inflate local deficits by overlooking the compensatory effect of cross-boundary travel. Moreover, because the demand surface does not explicitly incorporate education-, identity-, or preference-based heterogeneity, the mapped deficits should be treated as a comparable metropolitan baseline for zoning and accessibility diagnosis, while socially enriched or behavior-based datasets can be used in future work to refine local demand estimates and validate potential biases. However, this very discrepancy underscores a fundamental accessibility gap: high-quality resources remain clustered in core cities despite spatially extensive demand. Therefore, these deficits are best characterized as relative structural mismatches within the metropolitan service hierarchy, highlighting inequalities in local access. Further validation using dynamic mobility or preference data remains a key priority for future research. This spatial differentiation pattern aligns with findings by Emily Rall et al., both of which demonstrate the pronounced spatial clustering of ecosystem services in urban cores [
56]. However, within the metropolitan context, this differentiation is more profoundly influenced by the urbanization gradient. From a formation mechanism perspective, this pattern essentially results from the combined effects of natural baseline conditions and urbanization processes. Natural factors, such as vegetation coverage, and socioeconomic factors, such as cultural facilities and population density, exhibit distinct driving effects across regions. This research not only reveals the spatial differentiation patterns of CESs at the metropolitan scale but also provides a scientific basis for the precise regulation of regional ecological services and spatial planning.
4.2. Synergies Between Trade-Offs Between Different Supply and Demand for CESs
Interaction patterns among CESs differ markedly across the three supply–demand bundles, indicating that CES relationships are context-dependent within the metropolitan gradient. In the core urban area (Bundle 1), AE and CD show a strong synergy, forming the dominant “AE–CD” association. This pattern is consistent with evidence from Shenzhen, where CES supply in urban centers tends to concentrate on aesthetic and cultural values, forming high-value clusters [
8]. In contrast, RE and KE are only weakly connected to the core service network, suggesting limited coupling with the AE–CD structure under highly urbanized conditions. Rather than implying a lack of RE or KE, this weak connectivity indicates that their co-occurrence with other CESs is less spatially aligned in the core bundle. Possible explanations include the fragmented configuration of urban green spaces and the functional specialization of recreational areas, which may constrain spatial linkages between RE/KE and the broader ecological–cultural system; however, this interpretation remains tentative and should be read as a plausible mechanism rather than a direct causal conclusion from correlation alone. Related observations have been reported in urban renewal studies in the core area of Beijing [
57].
The interaction structure in secondary centers (Bundle 2) is comparatively weak. The identified trade-off signal is statistically limited, and the absolute correlation coefficients are small, indicating that CES relationships are not strongly expressed within this bundle. This pattern suggests that secondary centers may represent an intermediate stage in which land-use competition and conservation pressures coexist, but the present results do not allow a strong mechanistic attribution. Similar mismatches in rapidly urbanizing transition zones have been observed in the Guanting Reservoir Basin, particularly where low CES supply coincides with high CES demand [
5].
In peripheral counties (Bundle 3), correlations indicate a stronger synergistic network centered on AE, with positive associations among AE, RE, KE, and CD. This pattern suggests that rural landscapes may act as shared carriers for multiple CESs, supporting recreational experiences, ecological education, and cultural engagement in a more integrated manner. Evidence from rural landscape preference studies likewise indicates that natural landscape characteristics are closely related to experiential and knowledge-oriented CESs [
9]. At the same time, these correlations should be interpreted as co-variation in spatial patterns within Bundle 3, rather than direct evidence of functional substitution or causal reinforcement among services.
Across bundles, the contrast between a core AE–CD-dominant synergy, weak and limited correlations in secondary centers, and a more integrated peripheral synergy network highlights that CES interaction structures vary systematically along the metropolitan gradient. This heterogeneity motivates further examination of whether the drivers and interaction effects underpinning the CESDR also differ across bundles.
Finally, we note that the observed interaction patterns are scale-sensitive. At broader spatial extents, the co-occurrence among services becomes more apparent as landscape functions integrate across larger units. This is consistent with findings from the Beijing–Tianjin–Hebei region, where supply patterns stabilize as the scale expands from urban to regional levels [
58]. Scale sensitivity is also a recurrent theme in urban ES syntheses, which caution that drivers and correlations observed at metropolitan scales may mask sub-regional mechanisms and therefore benefit from stratified or typology-based interpretation [
59].
Beyond statistical clustering, we interpret the bundles as socio-spatial configurations associated with different positions along the urbanization gradient. Here, “state” is used as an analytical label for a recurring configuration of CES supply–demand relationships under shared socio-ecological conditions, rather than as evidence of a temporal evolutionary sequence. Specifically, the metropolitan core corresponds to a configuration characterized by strong cultural–aesthetic coupling under land-scarcity constraints; secondary centers reflect a configuration with weak and limited interaction signals under development pressures; and the periphery corresponds to a configuration with broader multi-service synergies associated with rural landscapes and accessibility constraints. This interpretation aims to contextualize the bundle patterns within metropolitan processes, while acknowledging that the current evidence is cross-sectional and correlation-based.
4.3. Impact of Drivers on Supply and Demand for CESs
The OPGD results reveal pronounced spatial heterogeneity in dominant drivers and interaction effects across the three supply–demand bundles, indicating that the CESDR is associated with different mechanism patterns along the metropolitan urbanization gradient. Rather than implying a single metropolitan-wide process, the bundle-specific results suggest that the strength and composition of driver signals differ by zone, which supports a zone-sensitive interpretation of planning priorities. Accordingly, we translate these bundle-specific driver regimes into differentiated planning implications that are consistent with association-based evidence and can be operationalized within territorial spatial planning, ecological conservation redline governance, and public facility allocation frameworks. This “heterogeneous driver regime” reading is consistent with supply–demand studies that treat metropolitan regions as internally differentiated systems, where drivers of mismatches differ across core and non-core zones rather than following one uniform process [
60].
In the core urban area (Bundle 1), the explanatory power of all quantified drivers is extremely low (q < 0.04), and none reach statistical significance. This pattern should not be read as evidence that the core is “driver-free”; instead, it indicates that the drivers represented by the current indicator set explain little of the within-bundle variation in the CESDR. A plausible interpretation is that the CESDR in the core is more strongly shaped by sociocultural and institutional factors that are not well represented by available spatial indicators, such as cultural policies, heritage conservation regimes, place identity, and historically accumulated cultural capital; however, this remains an inference rather than a direct causal conclusion from OPGD outputs. This interpretation is consistent with the results of Cao et al., who found that sociocultural factors can dominate CES perceptions in high-density urban contexts [
21]. From a governance perspective, the weak signals of conventional facility- and economy-related variables suggest that core-area interventions should not rely solely on increasing facility counts or broad economic inputs; instead, priorities may lie in heritage-sensitive design, cultural programming, and fine-grained public-space management that improves experiential quality and cultural meaning. In practice, this supports core-area measures that can be embedded in statutory planning and heritage/eco-conservation instruments, including safeguarding heritage-linked green–blue networks, strengthening cultural programming and fine-scale public-space management, and improving access to key hotspots.
In secondary centers (Bundle 2), population density (X1, q = 0.280,
p < 0.05) and road-network density (X7, q = 0.248,
p < 0.05) emerge as the dominant drivers, and their interaction further strengthens explanatory power (q = 0.323,
p < 0.05). This indicates that, within this bundle, CESDR variations are most closely associated with the joint configuration of demand pressure (population agglomeration) and accessibility structure (transportation connectivity). In this context, mismatch is more likely to intensify where the population concentration increases faster than locally accessible supply, particularly when mobility networks redistribute demand without a corresponding expansion of service opportunities. This accords with evidence that transport accessibility mediates CES-related flows and use [
9] and that population concentration can intensify mismatches when supply does not scale accordingly [
41]. Accordingly, governance in secondary centers should emphasize transport-connected service provision, coordinated facility planning across jurisdictions, and land-use management that safeguards ecological–cultural spaces under rapid expansion, thereby stabilizing supply–demand coupling in this intermediate zone. Operationally, the X1–X7 signal supports accessibility-oriented provisioning in secondary centers, including coordinating facility siting with transport corridors, embedding CES safeguards into zoning and development control, and strengthening cross-jurisdictional service planning within the territorial spatial planning system.
In the periphery (Bundle 3), cultural facilities (X4, q = 0.594) and physical education facilities (X6, q = 0.593) become decisive factors, while the interaction between per capita GDP (X8) and cultural facilities (X4) exhibits very strong explanatory power (q = 0.729). This pattern suggests that the peripheral CESDR is most strongly associated with an “investment–infrastructure” configuration, where economic capacity conditions whether facility provision translates into locally accessible cultural and educational opportunities. Such joint effects are broadly consistent with prior evidence that socioeconomic investment and facility conditions can work together to influence CES demand and related outcomes [
61]. In planning terms, peripheral strategies should focus on improving the coverage, connectivity, and usability of facility networks, and on ensuring that investments translate into accessible, well-linked services rather than isolated projects, thereby narrowing local opportunity gaps in KE and CD experiences. For peripheral counties, the facility signals and the GDP–facility interaction support shifting facility allocation schemes toward network performance, prioritizing coverage, connectivity, and accessibility outcomes so that investment translates into usable KE and CD opportunities rather than isolated projects.
Finally, at the metropolitan scale, the explanatory power of individual drivers remains generally weak (q < 0.15), likely because strong within-region heterogeneity dilutes global signals and masks bundle-specific processes. This reinforces the need to interpret mechanisms through a bundle-based perspective and cautions against metropolitan-wide “one-size-fits-all” prescriptions that ignore localized driver regimes. Consistent with evidence that CES relationships and drivers can be context-dependent and scale-sensitive [
62], the results support aligning governance interventions with the dominant driver configurations identified for each zone along the core–secondary center–periphery structure. Taken together, the evidence supports a zone-sensitive planning logic along the metropolitan hierarchy: institution- and quality-focused governance in the core, accessibility-centered growth–service coupling in secondary centers, and investment-to-access conversion through network-based facility planning in the periphery.
4.4. Limitations and Prospects
This study reveals the supply–demand patterns, interaction structures, and driving correlates of CESs within the Nanjing Metropolitan Area. However, several methodological and theoretical limitations should be acknowledged, which also delimit the scope of inference. Importantly, the current framework is best suited to diagnosing relative spatial mismatches and comparing bundle-level differences; it does not provide definitive causal attribution of mechanisms, nor does it quantify absolute CES levels or realized welfare outcomes. The bundles and CESDR maps are derived from multi-source spatial proxies, and no independent field survey or questionnaire dataset was used to cross-check the resultant clusters or supply–demand ratios; therefore, the credibility of these patterns depends on the quality and appropriateness of the input datasets and indicators, and the results should be read as diagnostic evidence of relative mismatches rather than validated measures of realized CES use.
First, the analysis does not fully capture qualitative social mechanisms, including cultural policies, institutional arrangements for heritage protection, and place-based community identity, which may be particularly influential in core areas. As a result, the explanatory power of quantified drivers may underestimate these latent sociocultural processes, constraining the interpretability of the inferred mechanisms. Accordingly, the identified “drivers” should be interpreted as spatial associations and interaction signals rather than causal determinants, especially in settings where relevant governance and cultural variables are not directly observed.
Second, the CESDR is a normalized, relative indicator and therefore cannot directly reflect absolute supply or demand magnitudes. In addition, demand quantification based on population density and CES-related POI kernel density mainly represents potential demand pressure and local accessibility proxies, rather than realized consumption, perceived preferences, or cross-boundary service flows. Consequently, CESDR deficits may be overestimated in peripheral areas where residents obtain KE and CD benefits through commuting or regional travel.
Third, our bundle identification and interaction diagnosis are association-based rather than causal. SOM provides an effective typology of co-occurring supply–demand states, and correlation analysis summarizes co-variation among CES components; however, these tools do not reveal nonlinear dependencies, feedbacks, or directional effects among services. Likewise, the explanatory depth of the subsequent driver analysis depends on the availability and quality of candidate drivers. The consistently low q-values observed in the core bundle likely indicate that key sociocultural or institutional influences are not well captured by the current quantitative proxies. Future work could therefore incorporate richer indicators (e.g., governance capacity, cultural programming intensity) and qualitative evidence to better represent these less-quantifiable drivers.
More broadly, the “state” interpretation used in this study is analytical rather than evolutionary: it denotes recurring supply–demand configurations associated with different metropolitan contexts along the urbanization gradient, rather than a validated temporal sequence. Future research should incorporate longitudinal time-series monitoring and cross-metropolitan comparisons to test whether and how these socio-spatial configurations persist, transition, or reorganize over time.
Given these limitations, future work can advance in several directions. First, establishing a mixed-methods framework that integrates quantitative mapping with qualitative evidence (e.g., policy review, interviews, surveys, and social-media-based preference signals) would improve representation of sociocultural mechanisms and heterogeneous perceptions across social groups. Importantly, because the present study relies on spatial proxies without independent field validation, such mixed-methods approaches (including targeted questionnaires, PPGIS mapping, and interviews) provide a practical route to cross-check the resultant clusters and supply–demand ratios. In addition, integrating mobility or travel-flow data could help capture cross-boundary CES use when refining the demand representation and interpreting “deficit” areas. Second, incorporating structural equation modeling (SEM) and interpretable machine learning could strengthen mechanism-based explanations. SEM can help evaluate hypothesized causal pathways and mediation among latent constructs [
63], while interpretable machine learning can capture nonlinear relationships and threshold effects transparently [
64]. Together, these extensions would move the current approach from descriptive diagnosis toward more rigorous testing and simulation of CES formation mechanisms in metropolitan social–ecological systems.
5. Conclusions
This study reveals the spatial patterns of CES supply and demand in the Nanjing Metropolitan Area, the trade-offs and synergies within supply–demand bundles, and the driving factors behind them. The findings indicate that CES supply and demand exhibit distinct “core–secondary center–periphery” zoned spatial differentiation: the core zone shows a significant supply surplus; secondary centers maintain relative equilibrium; and peripheral areas demonstrate dual weakness in both supply and demand. Within different supply–demand bundles, CES trade-offs and synergies exhibit distinct regional stratification. Bundle 1 (core area) demonstrates strong synergy between AE and CD (r = 0.596), while RE and KE remain relatively isolated. Bundle 2 (secondary centers) shows weak trade-offs, and Bundle 3 (peripheral areas) forms a multi-service synergy network centered on AE. Driving factor analysis further reveals differing dominant factors across urbanization stages: secondary centers exhibit dual synergistic drivers of population and transportation (X1, q = 0.280; X7, q = 0.248), while peripheral zones reveal a synergistic effect between cultural facilities (X4, q = 0.594) and per capita GDP (X6, q = 0.593). In contrast, the explanatory power of quantitative factors in core zones is generally weak.
Conceptually, these findings indicate that metropolitan CES supply–demand bundles can be read as socio-spatial states distributed along a core–secondary center–periphery gradient, rather than solely as algorithmic combinations. The observed states range from a peripheral low-activation configuration to a secondary-center trade-off configuration and a core synergy configuration, suggesting a phased socio-spatial organization of CES supply–demand relationships at the metropolitan scale. By linking bundle typologies to interaction structures and to zone-differentiated driver signals, the study clarifies how metropolitan CES mismatches are organized within an internally differentiated system, rather than being explainable by a single “metropolitan-wide” driver regime.
Based on these empirical results, we derive bundle-specific planning implications that can be operationalized within territorial spatial planning, ecological redline implementation, and cultural-facility allocation schemes. In core areas, where a stable AE–CD synergy is observed and quantified drivers explain little within-bundle variation, priorities should focus on safeguarding continuous heritage and green/blue networks through zoning-based protection and buffer control and on improving the accessibility and experiential quality of identified hotspots, rather than relying mainly on expanding facility counts. In secondary centers, where the CESDR co-varies most strongly with population pressure and transport connectivity (X1, X7, and their interaction), planning should integrate accessibility-based service standards into land-use regulation and facility siting, align cultural and green infrastructure provision with major transport corridors, and strengthen cross-jurisdictional coordination to stabilize local supply–demand coupling during rapid expansion. In peripheral areas, where the CESDR is most strongly associated with facility provision and the GDP–facility interaction, cultural-facility allocation should shift toward network performance criteria by prioritizing coverage, connectivity, and travel-time accessibility, so that investment translates into locally reachable KE and CD opportunities rather than isolated projects. Overall, this study provides an empirical basis for targeted, zone-sensitive CES planning and governance in rapidly urbanizing metropolitan regions.
Methodologically, the analysis follows a pattern–interaction–driver logic that links spatial mismatch patterns, bundle interaction structures, and driver or interaction signals, and this analytical logic is transferable to other metropolitan contexts, in principle. Its main strengths for wider application are that it combines a supply–demand mismatch diagnosis with a typology-based interpretation and an explicit test of driver heterogeneity across metropolitan zones, which helps avoid one-size-fits-all explanations in internally differentiated regions. At the same time, its performance and the meaning of “deficit” patterns depend on locally available proxies and how demand and accessibility are represented, and cross-context credibility would benefit from external validation using survey or PPGIS evidence and mobility or travel-flow information, where feasible. Future research incorporating longitudinal observations and complementary preference- or mobility-based evidence would help test the stability of these socio-spatial states and further refine policy design.